Abstract
Superplasticizers (SPs), also known as naturally high-water reducers, are substances used to create high-strength concrete. Due to the system’s complexity, predicting concrete’s compressive strength can be difficult. In this study, a prediction model for the compressive strength with SP was developed to handle the high-dimensional complex non-linear relationship between the mixing design of SP and the compressive strength of concrete. After performing a statistical analysis of the dataset, a correlation analysis was performed and then 16 supervised machine learning regression techniques were used. Finally, by using the Extra Trees method and creating the SP variable values, it was shown that the compressive strength values of concrete increased with the addition of SP in the optimal dose. The results indicate that superplasticizers can often reduce the water content of concrete by 25 to 35 per cent and consequently resistivity increased by 50 to 75 per cent and the optimum amount of superplasticizers was up to 12 kg per cubic meter as well. From one point, the increase in superplasticizers does not lead to a rise in the concrete compressive strength, and it remains constant. According to the findings, SP additive has the most impact on concrete’s compressive strength after cement. Given the scant information now available on concrete-including superplasticizer, it is prudent to design a concrete mixing plan for future studies. It is also conceivable to investigate how concrete’s compressive strength is impacted by water reduction.
1. Introduction
The main component of concrete, a material widely used in buildings, is cement. Concrete is the most widely used building material in the world due to its many advantages over other materials [1]. Concrete consists of various ingredients, including cement, aggregates (fine and coarse), water, and some additives, and it is widely used as a building material in civil engineering applications such as dams, bridges, and roads [2]. Compressive strength is the most fundamental of the different indices of concrete qualities since it is directly related to structural safety and is essential in the performance measurement of structures throughout their entire life cycle. Concrete, on the other hand, is made up of several components that are randomly distributed throughout the concrete matrix, as everyone knows. Because of the complexity of the system, predicting the compressive strength of concrete is extremely difficult [3]. Superplasticizers (SPs), commonly referred to as naturally high-water reducers, are compounds used in the production of high-strength concrete [4]. Plasticizers include chemical substances that allow for the manufacturing of concrete with 15% less water content [5,6]. Water content can be reduced by up to 30% with superplasticizers. These additives are used in small amounts, only a few per cent of the total weight of the product. Concrete curing is slowed by plasticizers and superplasticizers [7,8]. Purified lignosulfonates, carboxylate synthetic polymers, sulfonated synthetic polymers, and synthetic polymers with mixed functionality cementitious materials are all examples of superplasticizers [9,10].
Researchers, engineers, and concrete practitioners working in this field are assisted by machine learning technologies, which also promote the dissemination of knowledge about their subject matter [11,12]. In the current work, artificial intelligence and machine learning have been used to evaluate how the use of different dosages of superplasticizer admixtures affects the compressive strength of concrete. As of writing this paper, there has not been any research conducted on predicting how superplasticizers will affect concrete’s compressive strength using artificial intelligence. Given the importance of concrete additives and their effect on the material’s compressive strength, this topic requires extensive research. So, this study looks into how superplasticizers might impact the compressive strength of concrete. Adding superplasticizer boosts concrete’s compressive strength at all ages, according to Salahaldein Alsadey et al. [13]. The hypothesis is that since the inclusion of a superplasticizer provides more water to mix concrete, the hydration process is not only not interrupted but significantly sped up by the extra water formed by the deflection of the cement particles. So, increasing the superplasticizer dosage could trap more water and enhance cement hydration. The aim of this study is to find the relationship between the mixing design of a superplasticizer and the compressive strength of concrete and prediction a model for the compressive strength of a superplasticizer by utilizing 16 supervised learning techniques from machine learning. This investigation based on machine learning would be the first and there is no one else who has explored this topic.
The most desirable attribute of concrete is typically its compressive strength; although, in many real-world situations, other qualities such as durability and impermeability may be more crucial. However, because compressive strength is directly related to the structure of hardened cement paste, it typically provides an overall picture of the quality of concrete [14]. Several publications on the subject of foretelling the compressive strength of concrete (CCS) have been written in recent years, which have used 1030 datasets from the University of California, Irvine’s data repository [15,16]. Considering that no research has been conducted in the past directly in the field of compressive strength of concrete with super-lubricant additives, a paper [17] has been written in the area of concrete with extra materials. In this regard, a method based on MARS was published in an article to forecast the compressive strength of fly ash-slag concrete, and the model analysis procedure was established by examining the algorithm’s basic workings. Finally, the MARS compressive strength model was introduced, which offered a practical way to forecast the compressive strength of fly ash concrete. Another article [18] investigated the intelligent prediction of compressive strength of concretes using fly ash and furnace slag as a partial replacement for cement. The findings showed that a Genetic Algorithm-Artificial Neural Network (GA-ANN) model cannot only be created and used to forecast the CCS but that it can also produce better outcomes than a Backpropagation—Artificial Neural Network (BP-ANN) model [19]. In another study [20], researchers indicated that, according to the SHAP-based research, W/B and age are the two input factors that most significantly impact the concrete Cs among the five considered. Age and superplasticizer positively impact the output, and the Cs rises as a result. On the other hand, a rise in W/B, GGBFS%, and RA% causes the Cs to fall. Additionally, there are other articles that have been written regarding the compressive strength of concrete with marble waste powder and concrete with waste glass fibres [21,22,23], in which the practical empirical equations have been developed to determine the compressive strength of concrete with different amounts of waste glass. Instead of conducting an experiment, these strength values of the concrete produced with glass powder can be easily estimated at the design stage with the help of proposed expressions.
Finally, no study was discovered that investigated the prediction of the impact of superplasticizers on the compressive strength of concrete using artificial intelligence. This subject requires much investigation, given the significance of additives in concrete and their impact on the material’s compressive strength. Therefore, this study investigates how superplasticizers would affect concrete’s compressive strength.
2. Material and Method
2.1. Dataset Description
Ordinary Portland cement, water, coarse aggregate, fine aggregate, superplasticizer, blast furnace slag, and fly ash are the seven elements in the tested concrete specimens, which were cured under laboratory conditions. The specimens indicated in the below table did not contain any superplasticizers, blast furnace slag or fly ash. The concrete’s compressive strength was then determined using a standard compressive test procedure on cylinder specimens with a height of 300 mm and diameter of 150 mm (ASTM C470/AASHTO M 205). The experimental data sets contain a total of 9 parameters. Table 1 shows the name, unit, min/max values, mean value, and standard deviation (SD) of the experimental parameters. Furthermore, the statistical distribution of the concerned values is given in Figure 1, which allows us to observe the parameters directly.

Table 1.
Statistical input variables of the datasets. These information is used to train the proposed regression methods and predict the concrete compressive strength.
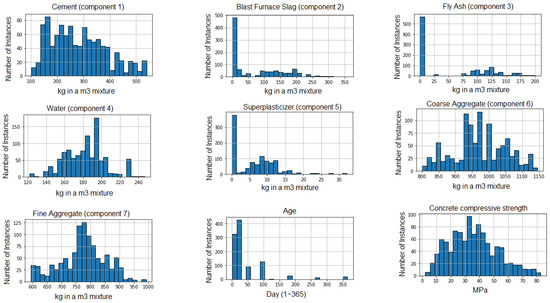
Figure 1.
Statistical distributions of the dataset features.
2.2. Methodology
Different dimensions can be used to classify machine learning problems. Unsupervised learning and supervised learning are two of these dimensions. In supervised learning, labels—which may be discrete or continuous—are assigned to samples [24]. One of the most used supervised machine learning techniques in several disciplines is regression. Regression problems have been solved using several different algorithms and techniques. These techniques span widely, ranging from statistical techniques to cutting-edge techniques such as neural networks [25]. Regression is one of the supervised machine learning techniques to establish the relationship between variables, as previously indicated. In actuality, the association between a collection of independent factors and a dependent variable is investigated [26]. Based on the connections between the independent variables, a regression can be used to forecast the output of the dependent variable. The impact of one or more independent factors on the dependent variable can also be examined. As a result, the relationships between dependent and independent variables, estimation, and prediction can be described using regression applications [27].
The following models were utilised in this paper:
- ₋
- Partial least squares (PLS) regression: a subset of the linear regression family of models where the set of variables is shifted to a smaller space that best describes the variance of the data using knowledge of the correlation of the variables.
- ₋
- Linear regression: The goal of the linear regression approach is to minimise the MSE based on the variables by optimising the production of the variables in the pertinent parameters.
- ₋
- Kernel ridge: a member of the linear regression family of models where the variables are relocated to a different location using the Kernel Trick, enabling the model to access non-linear data.
- ₋
- Support vector regression (SVR): a technique built on the Kernel Trick and the idea of a support vector, in which the line with the most training data is found by looking for support vectors.
- ₋
- K-nearest neighbors regression: a regression technique based on the K-Nearest Neighbors method, in which the K-nearest training data are used to estimate the model’s output value for a given input.
- ₋
- Gaussian Process: This technique, which is based on Kernel Trick, specifies the model’s output value using a Gaussian distribution.
- ₋
- Decision Tree: a process that bases discrete choices on the magnitude of input variables.
- ₋
- Multi-layer Perceptron: a neural network-based model with a single hidden layer and ReLU activation function.
- ₋
- Gradient boosting: Gradient descent is used to maximise the coefficient of an ensemble model, where new models are iteratively integrated with their output to enhance the performance of older models.
- ₋
- Bagging: by using sampling to split up the training data set into smaller chunks, the ensemble technique avoids.
- ₋
- AdaBoost: a group of learning models that are combined with new models that concentrate on data with significant prediction error.
- ₋
- Random Forest: a decision tree ensemble model in which many different decision trees are trained, with the average output of these models serving as the model’s final output.
- ₋
- Extra trees: a group of decision tree models that are trained on a random sampling of data, much like a Random Forest.
2.3. Matérn Kernel
The following function is used to alter the input in the Matérn kernel:
where is the gamma function (continuous type of factorial function), and the value of is the Bessel function of the second type. The different types of Matérn kernel are defined based on ν, the Matérn12 type is for , and the Matérn32 and Matérn52 types are defined with in the same way. In the limit , there will also be an RBF core, which is shown below:
Regression analysis was employed in this study to look at the impact of the superplasticizer variable. Since there are different approaches, a regression method should be chosen first. First, different regression techniques were looked at using data that were available. Algorithms were then adapted to the data to estimate the cement’s strength. The ExtraTreesRegressor method with the lowest error was then chosen to determine the influence of the superplasticizer variable after comparing the costs of each method. The average of the remaining variables was taken into consideration to be constant to examine the impact of the superplasticizer variable, which varied from 0 to 32 to represent the strength of the cement. In the phase of evaluating the approach and examining the impact of the superplasticizer variable, the K-fold cross-validation method with a value of 10 was employed. The chosen model’s hyperparameters were also chosen using the grid search method. This study made use of the Python programming language and data science packages including scikit-learn, pandas, NumPy, and matplotlib.
2.4. Evaluation Metrics
A measure of mistakes between paired observations describing the same phenomenon is called the Mean Absolute Error (MAE). Comparisons of expected against observed data, subsequent time against initial time, and one measuring technique against an alternate measurement technique are a few examples of Y vs. X. The MAE is calculated by dividing the total absolute errors by the sample size (Willmott and Matsuura, 2005):
Consequently, it is an arithmetic average of the absolute errors . In this equation, are the prediction and is called the true value.
A common metric for comparing values predicted by a model or estimator with the values seen is the root-mean-square error (RMSE). The RMSD is the quadratic mean of the square root of the second sample moment of the discrepancies between expected values and observed values [28]. The square root of the mean of the squares of the deviations is used to determine the RMSD of projected values Y for times t of a regression’s dependent variable Z using variables observed across T periods.
2.5. Heatmap
A two-dimensional diagram known as a heatmap was used to colour-code data. To demonstrate that this colour difference was brought on by the numerical values of the variables, the further information might be shown using various colours. We used the heatmap to replace numbers with colours so that humans could more easily understand data via heatmap display, since the brain is better able to interpret visuals than numbers, text, and written data.
By utilising the link between variables, a heatmap can be used to depict patterns, variance, and anomalies as well as the density or intensity of various variables. These variables were plotted over the graph’s two dimensions. Figure 2 shows that the relationship between the variables cement and strength had the highest value, while the relationship between the two variables water and superplastic had the most negative value, meaning that it had the opposite relationship and weakened with an increase in the value of one of the other variables. Since they were both direct variables, one grew at the same time as the other variable’s growth.
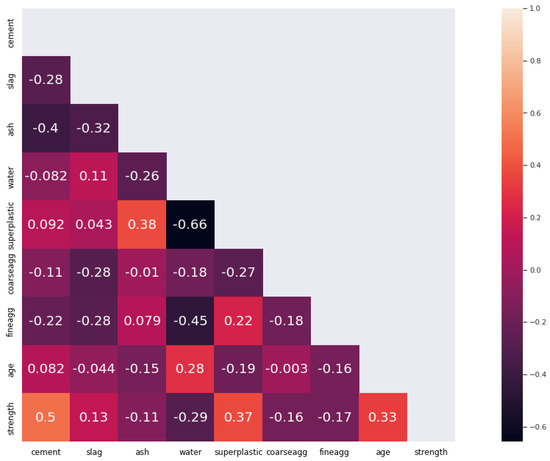
Figure 2.
Heat map of correlation matrix of the input variables.
3. Results
A correlation heatmap is a useful tool for illustrating the relationship between variables. The estimated heat graph demonstrating the relationship between the variables in this investigation is shown in Figure 2. The correlation value varied from +1 to −1. When this value was closer to one, the link between the variables was greater in that direction; conversely, when this value was closer to a negative one, the opposite was true.
As explained, the best regression approach should be selected. First, the approach with the lowest cost was chosen by calculating the Mean Absolute Error (MAE) and Root Mean Squared Error (RMSE). In tests relating to the performance outcomes of the models, the K-Fold approach was employed to lessen the impact of statistics linked to learning and measurement data. K was set at 5, and the separation was carried out at random. As a result, the findings were an average of the models’ performance across 5 experiments, which corresponded to 5 randomly chosen subsets of the data. Table 2 displays MAE and RMSE values, and Figure 3 and Figure 4 display its histogram.

Table 2.
Mean Absolute Error (MAE) and Root Mean Squared Error (RMSE).
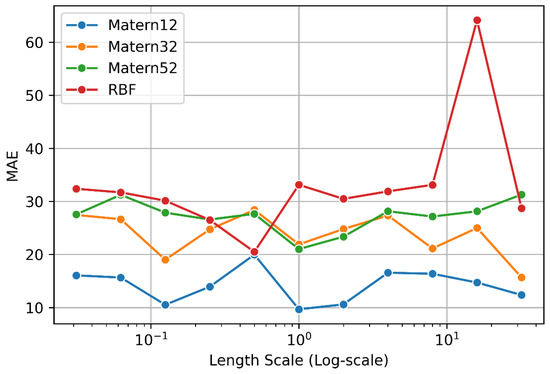
Figure 3.
Selected kernel and related hyperparameter.
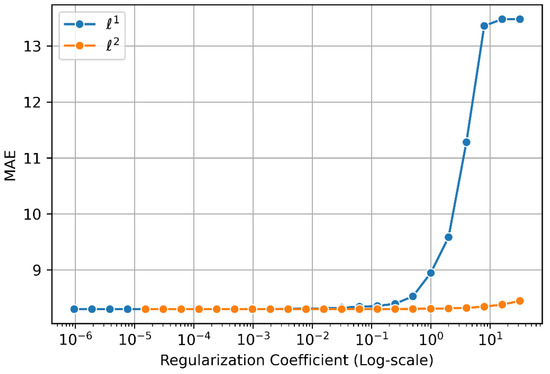
Figure 4.
The effect of lasso and ridge regularization on linear regression performance.
Table 2 shows the outcomes of the models’ performance, so they can be seen separately. It can be seen that the best performance was related to models that could simulate non-linear relationships. The performance of kernel-based approaches was significantly better than the linear regression method, indicating the presence of non-linear correlations between input factors and output variables. Additionally, the Gaussian process model, which appeared to be the primary cause of the low complexity of the kernel utilised in this method, was associated with the worst performance. In addition, a distinction is observed between the highest performance in terms of mean squared error and the best model in terms of Mean Absolute Error. The linear regression model with kernel exhibited the best performance in terms of average absolute error, but the neural network model exhibited the best performance in terms of average square error. From this observation, it can be deduced that the neural network model contained more errors, but they were of a smaller magnitude than the linear regression model with the kernel.
The outcomes pertaining to the application of ensemble methods are shown in Table 3. The Decision Tree model was the fundamental model used out of all these techniques. As can be seen, the boosting-based model performed the best. This finding can be connected to the boosting model’s lack of vulnerability to the overfitting issue. Additionally, the Extra Trees model had the best performance following the boosting model, which is explained by the impact of the separation point’s random selection.

Table 3.
Mean Absolute Error (MAE) and Root Mean Squared Error (RMSE).
Figure 3 shows how the chosen kernel and its associated hyperparameter affected the performance of the Gaussian process model. It is evident that the Matérn kernel provided the best performance, which is in line with earlier findings. Additionally, based on the data, it appeared that the function associated with the issue was very non-linear and non-smooth because non-smooth Matérn kernels exhibited greater performance.
The impact of lasso and ridge regularization on the effectiveness of linear regression is depicted in Figure 4. As can be seen, regularization in linear models did not appear to be advantageous to the model. The limited number of input variables and the small size of the observations can be cited for this issue. The outcomes seen in Figure 3 are reproduced similarly when analysing the model’s performance in the presence of a greater value of lasso regularization. The two factors fine aggregate and course aggregate were least affected by an increase in the lasso. The factors of cement and blast furnace slag, on the other hand, had the most effects. Figure 3 shows that these two variables had the biggest influence on the model’s performance and the least linear reliance on other variables.
Figure 5 illustrates how the performance of the regression kernel model was impacted by the kernel type and its associated parameters. As can be observed, the models with the highest level of non-linear correlations consistently performed the best. For instance, the performance of the model was enhanced by raising the degree of the polynomial kernel. However, this improvement took place because there were more parameters in the locations where the regularization-related coefficient was higher. Therefore, in this case, it is important to take into account the impact of overfitting.
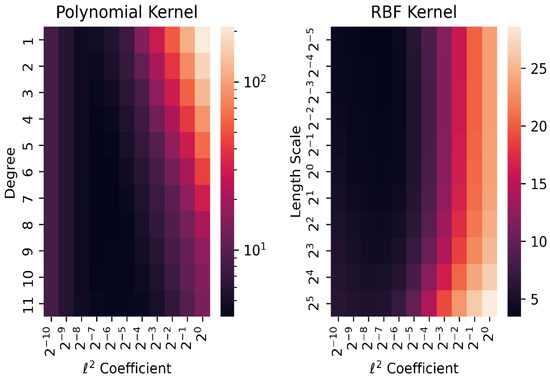
Figure 5.
The effect of kernel type and its related parameters on kernel model performance.
Table 4 shows the findings of the sensitivity analysis for the input variables of the Kernel Regression model. These outcomes were achieved by deleting the pertinent variable from the model’s input variables.

Table 4.
Results of Sensitivity Analysis related to Kernel Regression model.
The age variable had the most effect on performance, as is well established. Figure 2 shows that this variable had the lowest correlation with the other factors, which highlights the significance of this variable in determining the strength of concrete. The concrete variable is likewise very significant, and it is expected that its removal would have a significant negative impact on the model’s performance. The good effect of eliminating superplasticizers from variables is an intriguing matter since it can be explained by the information contained in this variable in other variables. This data can be evaluated and processed since kernel-based models take non-linear relationships into account. Reducing overfitting may also have another consequence.
Three of the methods have combined elements of previous techniques. The first stacking regression used the SVR and ridge methods in combination, the second used the ridge, lasso, and neighbors regression methods in combination, and the final stacking regression used the second method’s algorithms as well as the last layer of Random Forest and Gradient Boosting. Finally, by selecting the ExtraTreesRegressor method and generating the superplasticizer variable values, the concrete strength values were approximated according to the diagram in Figure 6. Regression models were evaluated on a different sample using resampling techniques (Bootstrapping and Jackknife resampling) to investigate them with more data in order to prevent overfitting. The hyperparameters for this method were as follows: bootstrap = False, criterion = ‘absolute_error’, max_depth = 20, max_features = ‘auto’, min_impurity_decrease = 0, min_samples_split = 2.
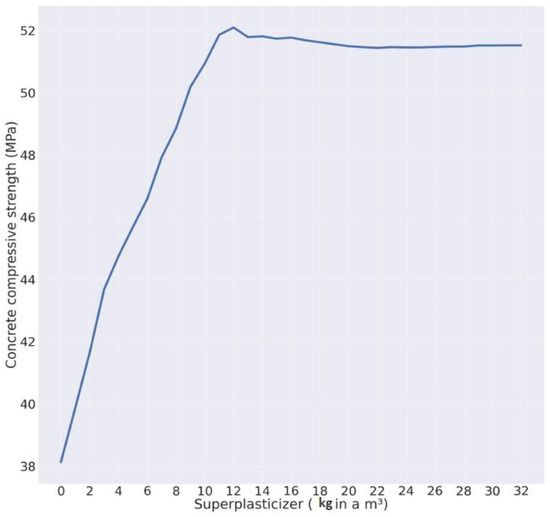
Figure 6.
Illustration of regression for prediction of concrete strength based on superplasticizer values (Final Model). Only the model with the lowest error was chosen, as previously specified.
Regression techniques were employed in this study to estimate the strength value based on the superplasticizer variable. Based on changes in the superplasticizer variable, Figure 6’s Strength variable value was calculated. It is clear that the superplasticizer with the value of 12 MPa had the highest value of Strength, 52 MPa, and that, following a decline, the variations in the Strength value were mathematically practically constant.
4. Discussion
In this study, a prediction model for the compressive strength of superplasticizers was developed using 16 supervised learning methods from machine learning to address the high-dimensional complex non-linear relationship between the superplasticizer mixing design and the compressive strength of concrete. Using Yeh’s concrete study [15,16] dataset, the prediction of concrete’s compressive strength was carried out with great accuracy. After conducting a statistical analysis of the dataset, a correlation analysis was performed. According to the findings, cement was the biggest influence on concrete’s compressive strength, followed by the superplasticizer additive, as seen in Figure 2. This supports the finding from Salahaldein Alsadey et al. [13], i.e., that adding superplasticizer boosts concrete’s compressive strength at all ages. The hydration process is not only not interrupted but also greatly sped up by the excess water created by the deflection of the cement particles, since the addition of a superplasticizer offers more water to mix concrete. Consequently, increasing the superplasticizer dosage will cause the cement to become more hydrated by trapping more water. The suggested usage of a superplasticizer has a limit, despite the fact that it boosts compressive strength. Superplasticizers will only reduce compressive strength if used in excess of what is recommended. The extra superplasticizer is the root reason because it separates the grain from the concrete, reducing the homogeneity of the concrete. As a result, the compressive strength of concrete diminishes if the dose utilised exceeds the ideal dose [29].
This study demonstrates a relationship between the superplasticizer, also known as a potent water reduction, and the compressive strength of concrete. This investigation supports the notion that the use of superplasticizers produces concrete with average performance but extraordinarily high strength (due to a significant reduction in the ratio of water to cement) [30]. For a given efficiency, superplasticizers can frequently reduce the water content of concrete by 25 to 35 per cent. Additionally, they can raise the 24 h resistivity of concrete by 50 to 75 per cent. A higher resistance may be the result of processing in steam or steam under high pressure. Figure 5’s compressive strength prediction experiment findings demonstrate that superplasticizer addition and continued mixing both boost concrete’s compressive strength. However, compressive strength rises more quickly at ages below 28 days than at ages above 28 days.
Based on the results of the prediction of compressive strength using the provided data, it is obvious how the superplasticizer addition affects the compressive strength of concrete. The performance requirements of superplasticizers for the manufacture of high-strength concrete are laid out in ASTM C 494-92 and Part III of BS 5075:1985. Interestingly, the commercially available superplasticizers struggle to adhere to norms that increase resistance [31]. Superplasticizers primarily improve cement particle distribution, which leads to increased hydration but does not fundamentally alter the structure of hydrated cement paste. This explains why, in some circumstances, adding superplasticizers to concrete at a set water-to-cement ratio makes it stronger [31].
Surprisingly, no long-term decline in resistance has ever been observed. In actuality, the compressive strength of the concrete sample improves with age and increases with the length of time it has been in existence [32]. In this investigation, there was no proof that older concrete containing superplasticizers lost any strength. The results, which are depicted in Figure 5, indicated that the amount of superplasticizer additive that improves concrete’s compressive strength causes an increase of up to 12 kg for the concrete samples taken into account for this study. From this point onward, the compressive strength of concrete decreases slightly (by about 1 MPa). However, even when the superplasticizer content is increased to 32 kg per cubic meter of concrete, the concrete’s 52 MPa compressive strength stays constant. Because the concrete samples used in the dataset under study were taken at a young age, such as three days, and the concrete had not yet reached a high resistance, the concrete sets and reaches its ultimate strength later, when the amount of superplasticizer consumption exceeds the optimal amount. As a result, the chart started to trend downward in some areas. Superplasticizers reacted with C3A, one of the primary components of Portland cement, whose hydration was inhibited, despite the lack of a precise explanation for how they work [33]. Ettringite crystals begin to develop as small, roughly cubical particles rather than needles as a physical result of this. The mobility of the cement paste is enhanced by the cubic form of the particles [34].
It should be highlighted that the use of superplasticizers would increase concrete’s compressive strength to the proper level while simultaneously reducing water use and saving water in large construction projects.
5. Conclusions
The appropriate application of superplasticizers, particularly as a building material, has had a favourable impact on compressive strength, one of the most important characteristics of concrete. In this work, the compressive strength of concrete built with a superplasticizer as a partial replacement for water was predicted. The following conclusions could be drawn from this study:
- Superplasticizers would save water usage while boosting concrete’s compressive strength to the appropriate level.
- The strongest factor affecting concrete’s compressive strength is cement.
- Only if superplasticizer is used in excess of what is advised will compressive strength be reduced; the dose will not be increased.
- The high-dimensional complex non-linear relationship between the superplasticizer mixing design and the compressive strength of concrete was addressed, and the prediction of the compressive strength of concrete was carried out with great accuracy using different supervised learning methods from machine learning.
Given the scant information now available on concrete including superplasticizers, it is prudent to design a concrete mixing plan for future studies. It is also conceivable to investigate how concrete’s compressive strength is impacted by water reduction.
Author Contributions
Conceptualization, S.-A.S.-Z., A.D. and S.M.; Methodology, S.-A.S.-Z., A.D., L.M.K. and A.N.; Software, S.-A.S.-Z., S.M. and A.N.; Validation, S.-A.S.-Z. and L.M.K.; Formal analysis, S.-A.S.-Z., A.D. and L.M.K.; Investigation, S.-A.S.-Z.; Resources, S.-A.S.-Z.; Data curation, S.-A.S.-Z. and S.M.; Writing – original draft, S.-A.S.-Z., A.D. and L.M.K.; Writing—review & editing, S.-A.S.-Z., A.D., L.M.K., S.S.G. and M.S.; Visualization, S.-A.S.-Z., S.M. and A.N.; Supervision, S.-A.S.-Z.; Project administration, S.-A.S.-Z.; Funding acquisition, S.-A.S.-Z. All authors have read and agreed to the published version of the manuscript.
Funding
This research received no external funding.
Data Availability Statement
Not applicable.
Conflicts of Interest
The authors declare no conflict of interest.
References
- Ahmed, H.U.; Mahmood, L.J.; Muhammad, M.A.; Faraj, R.H.; Qaidi, S.M.; Sor, N.H.; Mohammed, A.S.; Mohammed, A.A. Geopolymer concrete as a cleaner construction material: An overview on materials and structural performances. Clean. Mater. 2022, 5, 100111. [Google Scholar] [CrossRef]
- Zeybek, Ö.; Özkılıç, Y.O.; Çelik A, İ.; Deifalla, A.F.; Ahmad, M.; Sabri Sabri, M.M. Performance evaluation of fiber-reinforced concrete produced with steel fibers extracted from waste tire. Front. Mater. 2022, 9, 692. [Google Scholar] [CrossRef]
- Ahmad, A.; Ahmad, W.; Aslam, F.; Joyklad, P. Compressive strength prediction of fly ash-based geopolymer concrete via advanced machine learning techniques. Case Stud. Constr. Mater. 2022, 16, e00840. [Google Scholar] [CrossRef]
- Ibrahim, S.; Meawad, A. Towards green concrete: Study the role of waste glass powder on cement/superplasticizer compatibility. J. Build. Eng. 2022, 47, 103751. [Google Scholar] [CrossRef]
- Ahmad, J.; Tufail, R.; Aslam, F.; Mosavi, A.; Alyousef, R.; Javed, M.F.; Zaid, O.; Niazi, M.K. A step towards sustainable self-compacting concrete by using partial substitution of wheat straw ash and bentonite clay instead of cement. Sustainability 2021, 13, 824. [Google Scholar] [CrossRef]
- Arend, J.; Wetzel, A.; Middendorf, B. In situ investigation of superplasticizers: From fluorescence microscopy to concrete rheology. Cem. Concr. Res. 2018, 113, 178–185. [Google Scholar] [CrossRef]
- Dheepak, S.; Deepak, P.; Pradeep, S. Experimental Investigation on Lightweight Concrete with Kegrete Bowling Ball. In Sustainable Construction Materials; Springer: Berlin/Heidelberg, Germany, 2022; pp. 269–276. [Google Scholar]
- Dey, S.; Kumar, V.V.P.; Goud, K.R.; Basha, S.K.J. State of art review on self compacting concrete using mineral admixtures. J. Build. Pathol. Rehabil. 2021, 6, 18. [Google Scholar] [CrossRef]
- Berodier, E.; Ii, L.R.G.; Burns, E.; Roberts, L.; Cheung, J. Robust production of sustainable concrete through the use of admixtures and in-transit concrete management systems. Cem. Concr. Compos. 2019, 101, 52–66. [Google Scholar] [CrossRef]
- Lu, B.; Weng, Y.; Li, M.; Qian, Y.; Leong, K.F.; Tan, M.J.; Qian, S. A systematical review of 3D printable cementitious materials. Constr. Build. Mater. 2019, 207, 477–490. [Google Scholar] [CrossRef]
- Bademosi, F.M.; Issa, R.R.A. Automation and Robotics Technologies Deployment Trends in Construction. In Automation and Robotics in the Architecture, Engineering, and Construction Industry; Springer: Berlin/Heidelberg, Germany, 2022; pp. 1–30. [Google Scholar]
- Taerwe, L.R. Resilience. In Structural Concrete; Wiley Online Library: Hoboken, NJ, USA, 2021; Volume 22, pp. 588–589. [Google Scholar]
- Alsadey, S. Effect of superplasticizer on fresh and hardened properties of concrete. J. Agric. Sci. Eng. 2015, 1, 70–74. [Google Scholar]
- Yang, Z.; Xie, Y.; He, J.; Zeng, X.; Ma, K.; Long, G. Experimental investigation on mechanical strength and microstructure of cement paste by electric curing with different voltage and frequency. Constr. Build. Mater. 2021, 299, 123615. [Google Scholar] [CrossRef]
- Yeh, I.-C. Modeling of strength of high-performance concrete using artificial neural networks. Cem. Concr. Res. 1998, 28, 1797–1808. [Google Scholar] [CrossRef]
- Yeh, I.-C. Modeling slump of concrete with fly ash and superplasticizer. Comput. Concr. An Int. J. 2008, 5, 559–572. [Google Scholar] [CrossRef]
- Dong, J.; Xie, H.; Dai, Y.; Deng, Y. Prediction Model of Compressive Strength of Fly Ash-Slag Concrete Based on Multiple Adaptive Regression Splines. Open J. Appl. Sci. 2022, 12, 284–300. [Google Scholar] [CrossRef]
- Shariati, M.; Mafipour, M.S.; Mehrabi, P.; Ahmadi, M.; Wakil, K.; Trung, N.T.; Toghroli, A. Prediction of concrete strength in presence of furnace slag and fly ash using Hybrid ANN-GA (Artificial Neural Network-Genetic Algorithm). Smart Struct. Syst. An Int. J. 2020, 25, 183–195. [Google Scholar]
- Madenci, E.; Özkılıç, Y.O. Free vibration analysis of open-cell FG porous beams: Analytical, numerical and ANN approaches. Steel Compos. Struct. Int. J. 2021, 40, 157–173. [Google Scholar]
- Sarkhani Benemaran, R.; Esmaeili-Falak, M.; Javadi, A. Predicting resilient modulus of flexible pavement foundation using extreme gradient boosting based optimised models. Int. J. Pavement Eng. 2022, 1–20. [Google Scholar] [CrossRef]
- Basaran, B.; Kalkan, I.; Aksoylu, C.; Özkılıç, Y.O.; Sabri, M.M.S. Effects of Waste Powder, Fine and Coarse Marble Aggregates on Concrete Compressive Strength. Sustainability 2022, 14, 14388. [Google Scholar] [CrossRef]
- Zeybek, Ö.; Özkılıç, Y.O.; Karalar, M.; Çelik, A.İ.; Qaidi, S.; Ahmad, J.; Burduhos-Nergis, D.D.; Imjai, T. Influence of replacing cement with waste glass on mechanical properties of concrete. Materials 2022, 15, 7513. [Google Scholar] [CrossRef]
- Çelik, A.I.; Özkılıç, Y.O.; Zeybek; Karalar, M.; Qaidi, S.; Ahmad, J.; Burduhos-Nergis, D.D.; Bejinariu, C. Mechanical Behavior of Crushed Waste Glass as Replacement of Aggregates. Materials 2022, 15, 8093. [Google Scholar] [CrossRef]
- Song, Z.; Yang, X.; Xu, Z.; King, I. Graph-based semi-supervised learning: A comprehensive review. IEEE Trans. Neural Netw. Learn. Syst. 2022, 1–21. [Google Scholar] [CrossRef] [PubMed]
- Sathiyamoorthi, V.; Ilavarasi, A.; Murugeswari, K.; Ahmed, S.T.; Devi, B.A.; Kalipindi, M. A deep convolutional neural network based computer aided diagnosis system for the prediction of Alzheimer’s disease in MRI images. Measurement 2021, 171, 108838. [Google Scholar] [CrossRef]
- Cvitić, I.; Peraković, D.; Periša, M.; Gupta, B. Ensemble machine learning approach for classification of IoT devices in smart home. Int. J. Mach. Learn. Cybern. 2021, 12, 3179–3202. [Google Scholar] [CrossRef]
- Sánchez, A.R.; Gómez, R.S.; García, C. The coefficient of determination in the ridge regression. Commun. Stat. Comput. 2022, 51, 201–219. [Google Scholar] [CrossRef]
- Karunasingha, D.S.K. Root mean square error or mean absolute error? Use their ratio as well. Inf. Sci. 2022, 585, 609–629. [Google Scholar] [CrossRef]
- Salem, M.; Alsadey, S.; Johari, M. Effect of superplasticizer dosage on workability and strength characteristics of concrete. IOSR J. Mech. Civ. Eng. 2016, 13, 153–158. [Google Scholar] [CrossRef]
- Guo, Z.; Sun, X.; Zhang, X.; Qiu, J.; Jiang, H.; Zhao, Y.; Wu, P.; Zhang, Q. Effect of superplasticizer on rheology and thixotropy of superfine-tailings cemented paste backfill: Experiment and modelling. Constr. Build. Mater. 2022, 316, 125693. [Google Scholar] [CrossRef]
- Patowary, F. Effect of Superplasticizer on Mechanical and Durability Properties of Recycled Aggregate Concrete. Master’s Thesis, Bangladesh University of Engineering and Technology, Dhaka, Bangladesh, 30 June 2021. [Google Scholar]
- Sharma, R. Mechanical properties, permeability and microstructure of concrete using construction and industrial waste. Int. J. Struct. Integr. 2022, 13, 1013–1040. [Google Scholar] [CrossRef]
- Zhao, H.; Yang, Y.; Shu, X.; Wang, T.; Ran, Q. Comparison of Adsorption Conformation of Comb-Shaped Polycarboxylate on Tricalcium Aluminate (100) and Ettringite (100) Surfaces: A Molecular Dynamics Study. Adv. Theory Simul. 2021, 4, 2100079. [Google Scholar] [CrossRef]
- Choi, S.I.; Kil Park, J.; Han, T.H.; Pae, J.; Moon, J.; Kim, M.O. Early-age mechanical properties and microstructures of Portland cement mortars containing different admixtures exposed to seawater. Case Stud. Constr. Mater. 2022, 16, e01041. [Google Scholar] [CrossRef]
Disclaimer/Publisher’s Note: The statements, opinions and data contained in all publications are solely those of the individual author(s) and contributor(s) and not of MDPI and/or the editor(s). MDPI and/or the editor(s) disclaim responsibility for any injury to people or property resulting from any ideas, methods, instructions or products referred to in the content. |
© 2023 by the authors. Licensee MDPI, Basel, Switzerland. This article is an open access article distributed under the terms and conditions of the Creative Commons Attribution (CC BY) license (https://creativecommons.org/licenses/by/4.0/).