1. Introduction
The high safety requirements for the existing railway infrastructure are a basic demand that the railway user places on the railway operator. The assessment of the current condition and the expected service life of existing railway infrastructure is becoming more and more important due to the increasingly high age of the existing structures and the resulting potentially increasing costs for maintenance and reinvestment. Due to the increased age and the increased load effects caused by faster trains as well as a higher train number, premature fatigue damage to the existing railway infrastructure components can occur.
Noise barriers (NBs) are an integral part of the railway infrastructure, and their actual condition and level of safety must be maintained throughout their entire lifetime. NBs are erected alongside railway lines, and they are exposed to high aerodynamic loading by passing trains. Due to the current increasing number of trains and train speeds, material fatigue becomes important for all construction parts of NB, like steel posts, fastening elements, and foundations. The assessment of existing NB structures is nowadays often based on the subjective visual evaluation of the examiner or the responsible consulting engineer. However, designing new NB structures and evaluating existing NB structures as conducted with common engineering methods, does not yet include all the relevant information needed to predict the structural behaviour over its lifetime [
1,
2,
3,
4,
5]. The inclusion of information from visual inspections as well as information, which, due to the technical progress of monitoring systems, is feasible but is not yet performed regularly, has great potential to improve the accuracy of condition assessments and the prediction of the remaining service life for NB constructions.
To plan the necessary maintenance measures for NB constructions in a resource-efficient way, concepts based on building and component conditions and minimum threshold values for maintenance are used in many European countries [
6,
7,
8]. Increasing experience in the use of up-to-date measurement and monitoring technologies and rapid developments in computer processing power and storage capacity have caused a trend towards data-driven approaches for condition monitoring. The data-driven determination of the structural condition via the application of monitoring systems has a very long history, and it is also applied to the predictive maintenance of engineering structures [
9,
10,
11,
12,
13,
14,
15,
16,
17,
18]. Identifying and implementing key performance indicators play major roles here [
8,
19].
The objective of this paper is to develop an efficient combination of visual inspection with data-based methods of monitoring and modelling in order to perform a reliability-based remaining service life assessment of fatigue-prone elements and from NBs.
Furthermore, the objective is also to show how, on the basis of the analyses carried out in this research project, it becomes practically evident that an immediate evaluation of the loss of remaining service life can be derived from the visually detectable inaccuracies of the installation conditions of the bolt-post system.
Finally, it will also be shown how the combination of data-based information and visual inspections can or should be combined in the form of a Bayesian information update approach to make the visual inspection with a higher level of appraisal in terms of service life and reliability determination.
This article is organised as follows: In the second chapter, an overview of the aerodynamic problem description and the associated calculation techniques is provided. This is the basis for the third chapter, which covers the holistic assessment concept for NBs and the model stages for condition assessment and lifetime prediction. As a result, this allows us to delve into variation studies conducted within selected model stages in chapter four. Chapter five details the analysis of the installation conditions for Model Stage III and their impact on performance assessment. This includes a discussion of FEM-Digital Twin studies related to installation conditions. Finally, in Chapter six, a concise explanation of data-based condition assessment, emphasising the Bayesian updating processes, is outlined.
The numerical and analytical analyses developed in this article are based on experiments and detailed developments carried out in previous projects [
20]. With the collaboration of an expert team consisting of scientists and structural experts from the Austrian Federal Railways, after three years of intensive analysis and data collection, factors related to geometry and mechanical performance were characterised. These factors were responsible for replicating the initially unexplained large variations in the lifetimes determined via experimental testing.
The analyses and investigations were carried out by a team of eight scientists and experts. Ultimately, the manifold causes were identified, and literature research and discussions with experts confirmed that this approach had not been realised in this form before. Furthermore, these analyses and solutions were found to lead to very realistic results, and this approach, based on the COST TU1406 framework, has not been replicated in this way by any other research group.
2. Aerodynamic Loading Acting on Railway Noise Barriers and Structural Interaction
Air pressure waves caused by trains create a sinusoidal dynamic loading at the train head, train tail, and train coupling points, resulting in pressure and a suction load acting on NBs, as shown with red colour in
Figure 1. The size of dynamic loading depends on the aerodynamic shape of the train
k1, the speed of the train
vtrain, the wall height
h, and the eigenfrequency
fNB of the NB construction as well as on the distance of the track axis to the surface of the noise barrier denoted as
ag. Because of the impulsive sinusoidal shape of the air pressure and suction wave, a dynamic amplification of the NB deflection occurs [
21], and its size is defined using the shock factor
φdyn given in EN 16727-2-2 [
22]. The dynamic amplification can become a factor of up to
φdyn = 3.25 in the most unfavourable case. Until 2005, train-induced aerodynamic loading has not been adequately considered in the design of NB as well as in the applied calculation methods (pure static analysis with proof of load capacity) and in the relevant normative specifications given in Eurocode EN 1991-2 [
23]. Causes for the resulting fatigue damage of NB components (aluminium panels) have been investigated in [
24,
25].
Each train passage induces shock-like sinusoidal pressure and suction waves into the NB construction that represent a fatigue-relevant loading for the different NB components, e.g., panels, steel posts, and fastening elements. In [
22,
26], the following Equations (1) and (2) are given, and they define the equivalent rectangular aerodynamic loading ±
qDS based on the insufficient loading ±
q1,k given in EN 1991-2 [
23] as follows:
In Equation (2),
φL and
φH define the length and height factors (see [
22] for details). According to RVE 04.01.01 [
27], a minimum of three fatigue-relevant load cycles must be considered for a single train passage, i.e., in the case of 100 trains per day, a total of 5.475 Mio. load cycles occur within 50 years of the NB’s lifetime. Hence, in the design of NB constructions, a fatigue limit state analysis must be conducted according to EN 1993-1-9 [
28], and the fatigue strength must be proofed for all fatigue-critical components of the NB (panels, steel posts, and fastening elements).
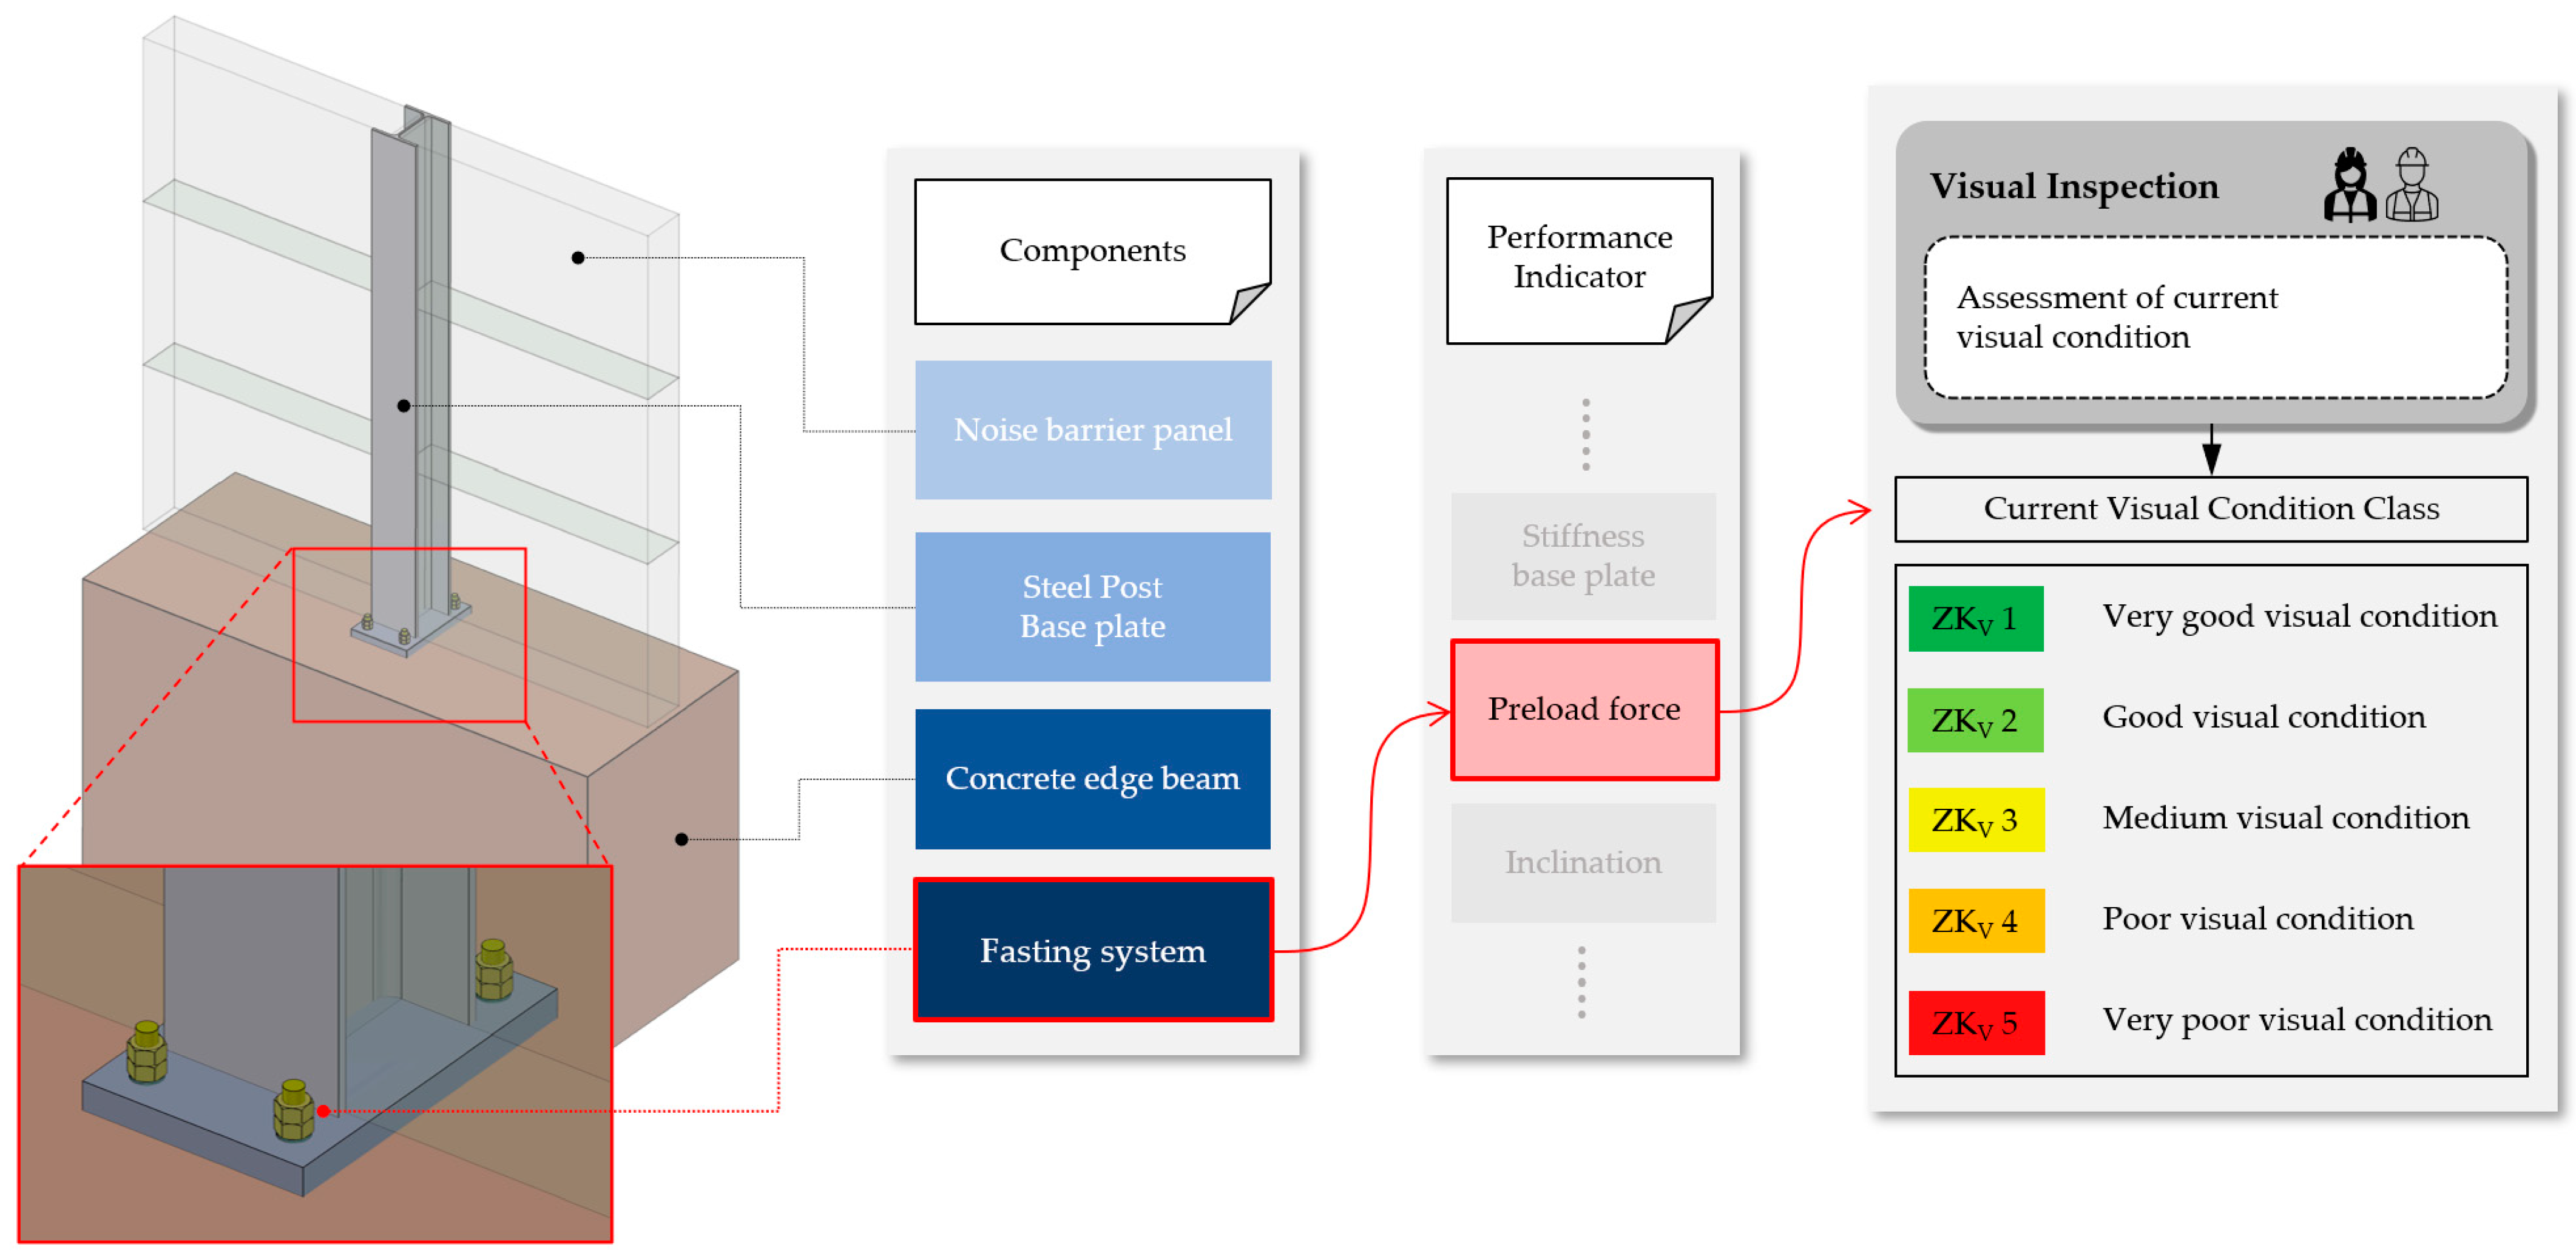
Figure 2 presents the main components of a NB structure: first, the noise barrier panels (e.g., made of aluminium or concrete), which protect the surrounding areas from excessive noise pollution; second, the steel posts (typically an I-beam HE-A, HE-B, or HE-M), which are fastened to the concrete edge beam and are thus the most important part for the aerodynamic load transfer to the third part, the concrete edge beam; the fourth and most important component of the NB structure is the fastening system, as it is responsible for the overall safety and stability of the NB. A steel baseplate is welded to the lower end of the steel post, and four threaded bolts, which are concreted into the concrete edge beam, are used to anchor the NB system to the concrete edge beam. Due to the aerodynamic load, material fatigue can occur in principle in many different construction details of the NB.
In order to investigate the fatigue behaviour and identify the fatigue critical components of NB structures, as shown in
Figure 2, fatigue tests were carried out in [
29]. It was shown that the NBs exhibit increased material fatigue, especially at the welded joints between the steel post and the steel baseplate and even more crucially at the threaded connection bolts between the concrete edge beam and the NB steel post.
Hence, different installation conditions of the steel post with different design deficiencies, as shown in
Figure 3, i.e., variation (reduction) in the preload force, were investigated in these fatigue tests. The goal of these tests was to investigate the influence of design deficiencies on the remaining service life of NB structures. The obtained test results are employed in stage 2 of the proposed data-driven condition assessment of this research in
Section 3 and
Figure 4.
The combination of the various levels outlined above is based on the classic performance and key indicator concept as described in [
8]. An important performance indicator, which can only be partially assessed via visual inspection, is the stress variation range in the cross-section of the threaded bolts. It can be used to determine the degradation process of the fastening system anchored in the concrete edge beam. In particular, the installation conditions, such as the preload force of the threaded bolts, but also unavoidable inclinations, flaws, displacements, and surface conditions of the individual components of the fastening system can be mapped in this indicator.
For example, a fastening system with completely lost or very little preload force has the negative consequence that the train-induced stress variation range becomes very large, and high fatigue damages result. In contrast, a fastening system with a high preload force has a positive consequence in which the stress variation range becomes very small, i.e., fatigue is not relevant in this case. The defective installation conditions of the NB steel posts might also lead to the eccentric loading of the threaded bolts, which means that in addition to the normal force, a bending moment acts on the threaded bolts, which also leads to accelerated fatigue damages. One of the most important execution deficiencies is the fastening of the NB steel posts to the concrete edge beam with an Insufficient preload force.
3. Data-Driven Condition Assessment and Life Cycle Analysis Framework
3.1. General Details
When developing the holistic framework models for condition assessment and service life prognosis of railway structures, attention was paid to the best possible integration into the proposed assessment concepts of the infrastructure company. The presented condition prediction models provide the expected service life of the NB construction and take the corresponding damage consequence classes into account.
3.2. Established Visual Inspection Approach
To assess the current condition of NB constructions, the current executed approach conducts visual inspections only. Therefore, the engineer assigns a visual condition class (ZKV) in a kind of school-grading system from 1 to 5, where grade 1 stands for a very good visual condition. This approach depends heavily on the experience of the inspecting engineer and, therefore, is very subjective. Since the process of fatigue in the fastening elements is progressing almost if not entirely hidden from the human eye, accessing this hidden mechanical state using new monitoring technologies and making use of the rapid development of computational power is a great advancement.
3.3. Main Considerations of the Framework for Data-Driven Condition Assessment and Life Cycle Analysis
Since visual inspections provide only partial information about the actual performance condition of the bolted connection, and since it is a highly sensitive construction, efforts have been made in recent years to determine the condition assessment and the possible risk of or reduction in service life in more detail. In [
30], innovative methods for monitoring the preload condition of bolted connections have already been invented. These efforts have now been transformed in this research into a more comprehensive
data-driven condition assessment and life cycle, which has also been broadened with different levels of detailed investigations in the sense of Model Code 2020 [
31].
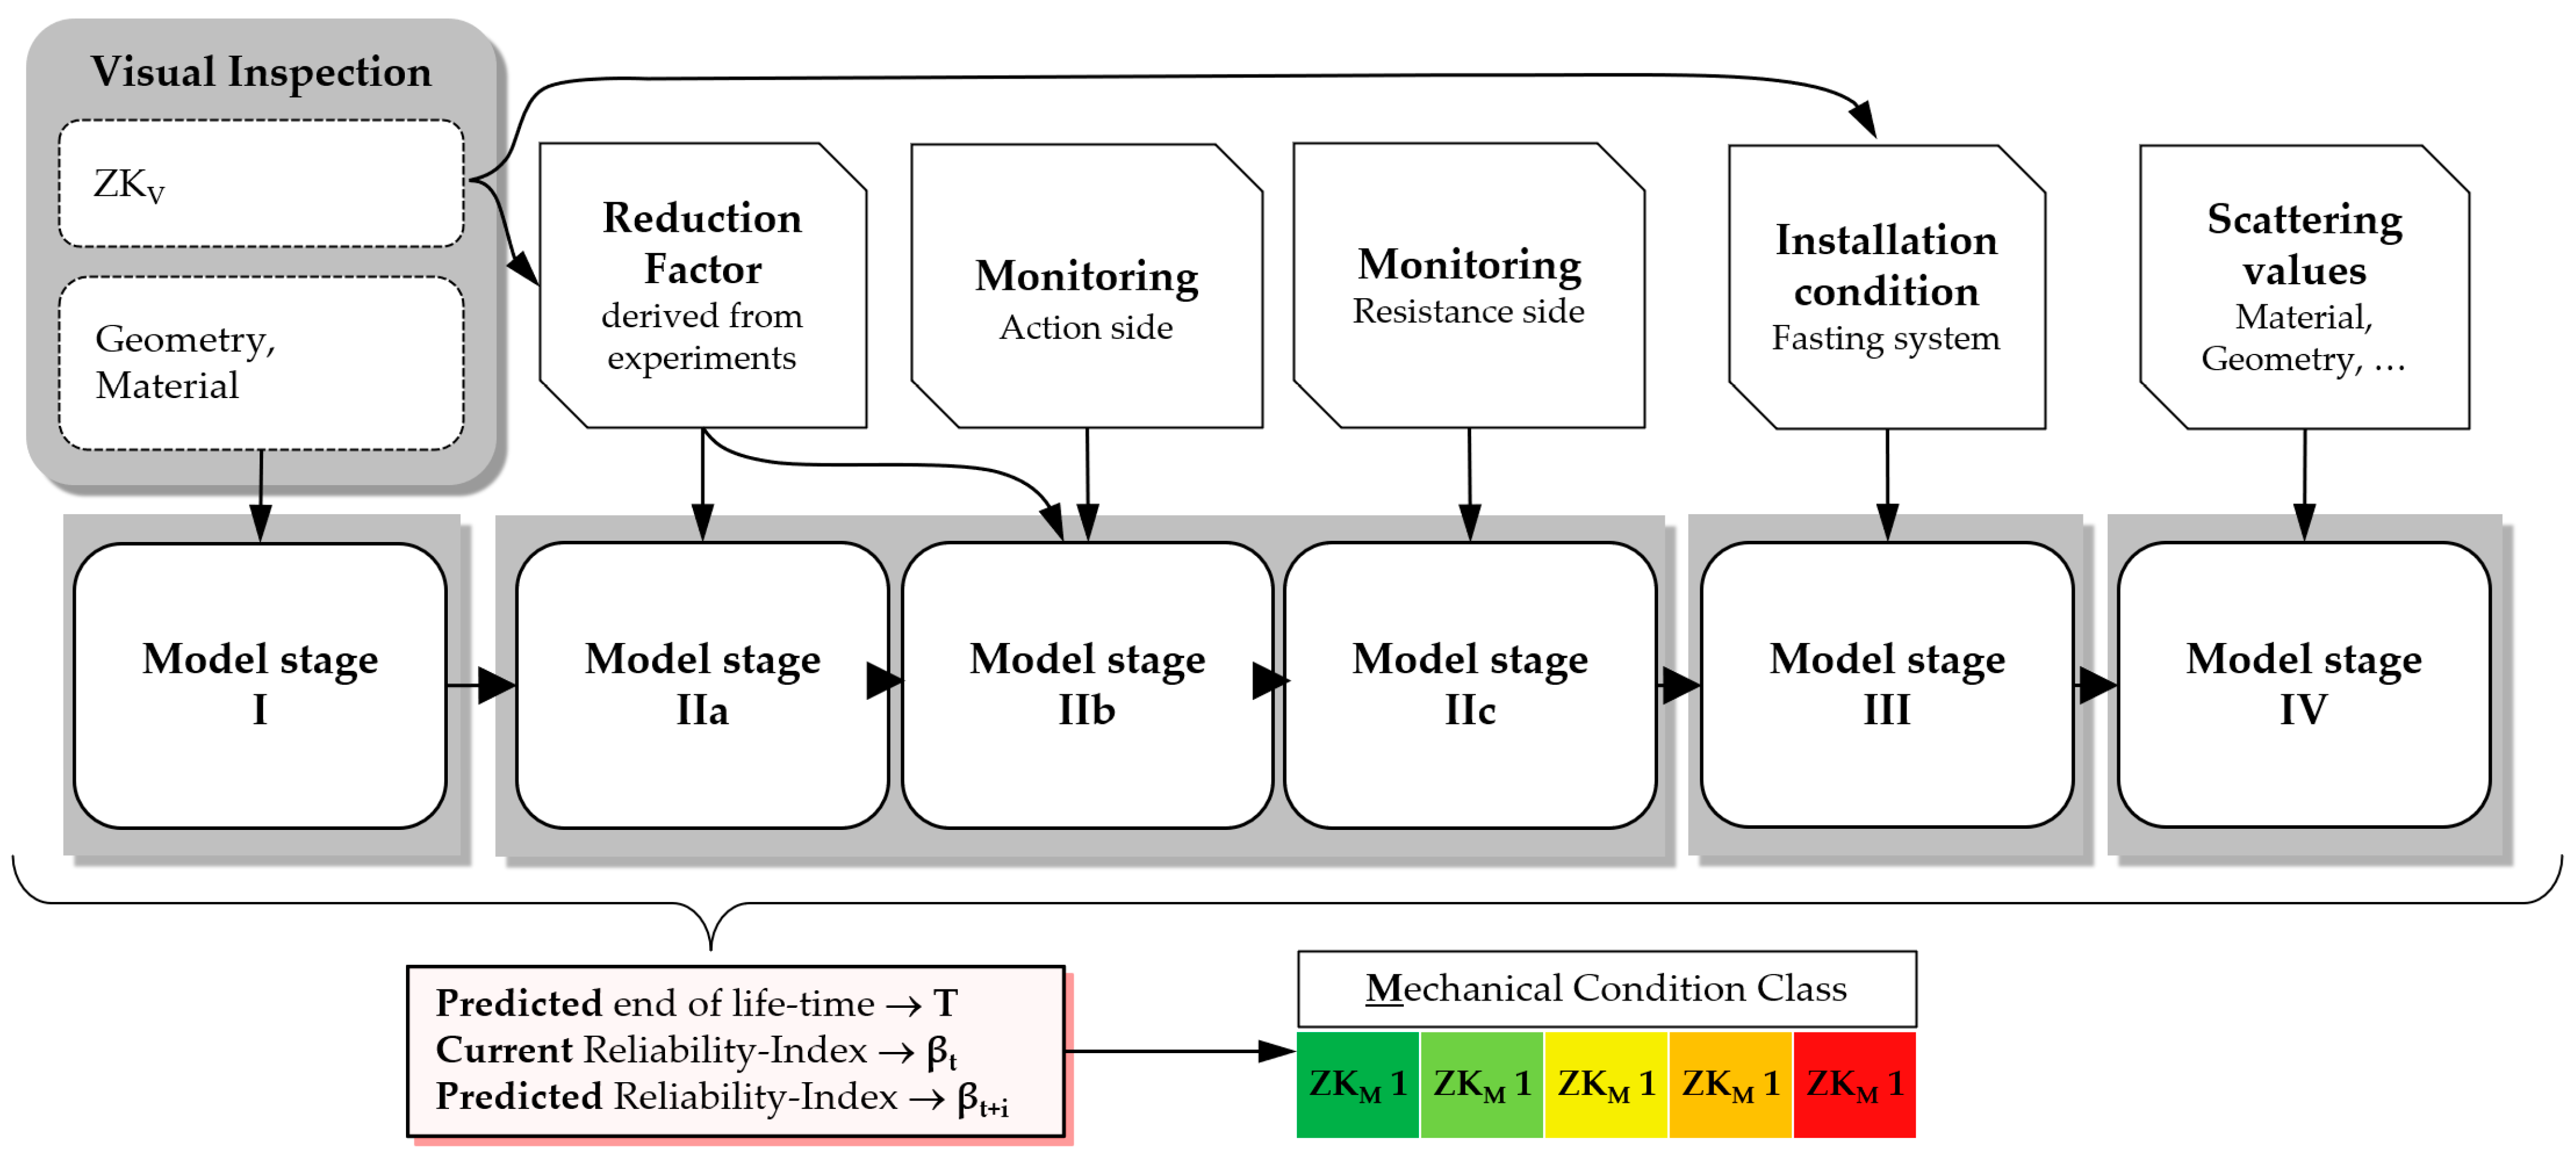
Figure 4 shows the model stages of the proposed holistic assessment framework for NB structures. There are four model stages, with Model Stage 2 divided into three sub-models: a, b, and c.
In the proposed holistic assessment framework, information from different sources, such as conventional visual inspections, monitoring systems, and numerical models, are linked together to increase the accuracy of the condition assessment and prediction of the remaining useful lifetime. The four model stages indicated in
Figure 4 are activated one after another. Each individual activation is conducted when a certain corresponding condition state threshold is reached. With each activation, a new source of information is added to the calculation, through which the precision of the condition-state determination and prognosis of the remaining useful lifetime is increased. The core elements of each model stage are the currently applied standard methods of visual inspection with its resulting condition classes (ZK
V) and fatigue calculations, according to RVE 04.01.01 [
27], currently carried out only in the design processes of new NB constructions. In a subsequent step, this calculated fatigue, or, in other words, the end of a lifetime, is put into a reliability index framework, which allows for the consideration of consequence classes. Finally, through discretisation into the mechanical condition classes ZK
M 1 to ZK
M 5, a maintenance strategy can be developed. With each model stage activation, the accuracy of the condition assessment and prediction of the remaining useful lifetime is increasing but so is the effort the infrastructure manager has to put in.
Four model stages of the framework for data-driven condition assessment visual inspection: The inspection of the NB construction, which takes the first position, is carried out by the expert/personnel of the infrastructure operator. In this step, the structural conditions are recorded, which include the geometric dimensions, type of steel post, NB panel type/material, as well as the visually recognisable and assessable condition of the construction, components, and execution details. The data recorded during the visual inspection serve as input values for the standard normative calculation of the service life according to [
27], on which the first two model stages are based, as well as the digital twin of Model Stage III.
Model Stage I—Calculation according to current standards: The first and simplest model stage is purely based on a commonly applied standard fatigue calculation. For this study, the calculations are carried out according to [
27], which refers to NB constructions executed on railway bridges according to ÖBB regulations [
32]. The input parameters are the geometric dimensions of the NB construction, type of steel post, type of NB panel, load effect, etc., which were recorded during the visual inspection. The output of the calculations is a forecast of the technical service life, which in a further step is converted into reliability index β. The visual condition classes are not yet included in the calculations of Model Stage I.
Model Stage IIa—Enhanced calculation according to standards via visual condition classes: By incorporating information from visual inspections, the next level of the four-stage model is reached. The normative fatigue calculation, on which model stage I is based, also forms the basis for this model stage. Since the standard fatigue calculations do not consider the mitigating effect of preload on the stress variation range in the cross-section of the threaded bolts, a reduction factor is introduced in this model stage to come closer to the actual effective stress variation range in the fastening elements of the NB construction.
Model Stage IIb—Enhanced calculation according to standards via the monitoring of the action side: In addition to the reduction in the train-induced stress variation range, which is carried out in Model Stage IIa by taking the visual condition classes into account, the monitoring of the action side is incorporated in Model Stage IIb. In current approaches, when calculating the remaining useful lifetime using the standard fatigue calculation, the load collective is estimated by an experienced engineer. By using a system to monitor the action side, this estimate can be improved by collecting the effectively acting load collective (number of trains); thus, the degree of accuracy of the condition determination and prognosis of RUL is further increased.
Model Stage IIc—Enhanced calculation according to standards via the monitoring of the resistance side—Contrary to Model Stage I–IIb, in Model Stage IIc, the entire calculation from the load action via the NB construction into the fastening elements is bypassed by monitoring the effective preload and stress variation range directly at the threaded bolt and thus also the associated uncertainties. Using the rainflow method, the number and amplitude of the measured stress variations can be analysed precisely, which significantly increases the accuracy of the calculation of the partial damage [
33].
Model Stage III—Digital twin: In the previous model stages, the influence of the installation condition was broken down to one factor derived from visual inspection only, and the monitoring system proposed offered only a limited possibility of recording the influence of the installation condition. This still existing discrepancy between these highly simplified models and reality is to be further reduced in Model Stage III. For this purpose, various deficient installation conditions are defined and modelled using a digital twin (DT). An ideal installation condition has a constant normal stress in the cross-section of the threaded bolt, whereas deficient installation conditions cause an additional bending moment, which results in a significant increase in the fatigue-relevant boundary stresses. By investigating the influence of deficient installation conditions on the stress variation range, the calculations can be calibrated, and thus, the influence on fatigue behaviour can be determined.
Model Stage IV—Probabilistic approach: In this stage, probabilistic approaches are employed to model the degrading process of the NB components over time. In these considerations, the observations, information, and methods of the previous stages can be included in relation to the boundary securities according to their significance. The input parameters for the numerical and analytical calculations are described using random variables to achieve the highest degree of accuracy of the actual structural component condition and RUL.
4. Discussion and Variation Studies in Selected Model Stages
By transferring/embedding the conducted calculations for the current conditions and the prediction of the remaining useful service life of NBs into the reliability index β according to EN 1990 [
34], damage consequence classes can be considered. Based on the consequence class corresponding to the structure under consideration, in the case of NB along railway lines, CC2 must be chosen, and hence, mechanical condition classes can be defined. Analogous to the visual condition classes (ZK
V), mechanical classes (ZK
M) are additionally defined in a kind of school-grading system, with class grade 1 representing a good mechanical condition and class grade 5 representing a bad mechanical condition. The mechanical condition describes the state of fatigue in a deeper level of detail, which is not or barely detectable in a purely visual inspection. To make another comparison, visual condition classes contain visually detectable information, which is strongly dependent on the inspector’s experience and knowledge. On the other hand, the mechanical condition classes combine visual and monitoring information, information from experiments, applied standard calculations, and digital twins, from which a more stable and accurate solution is expected.
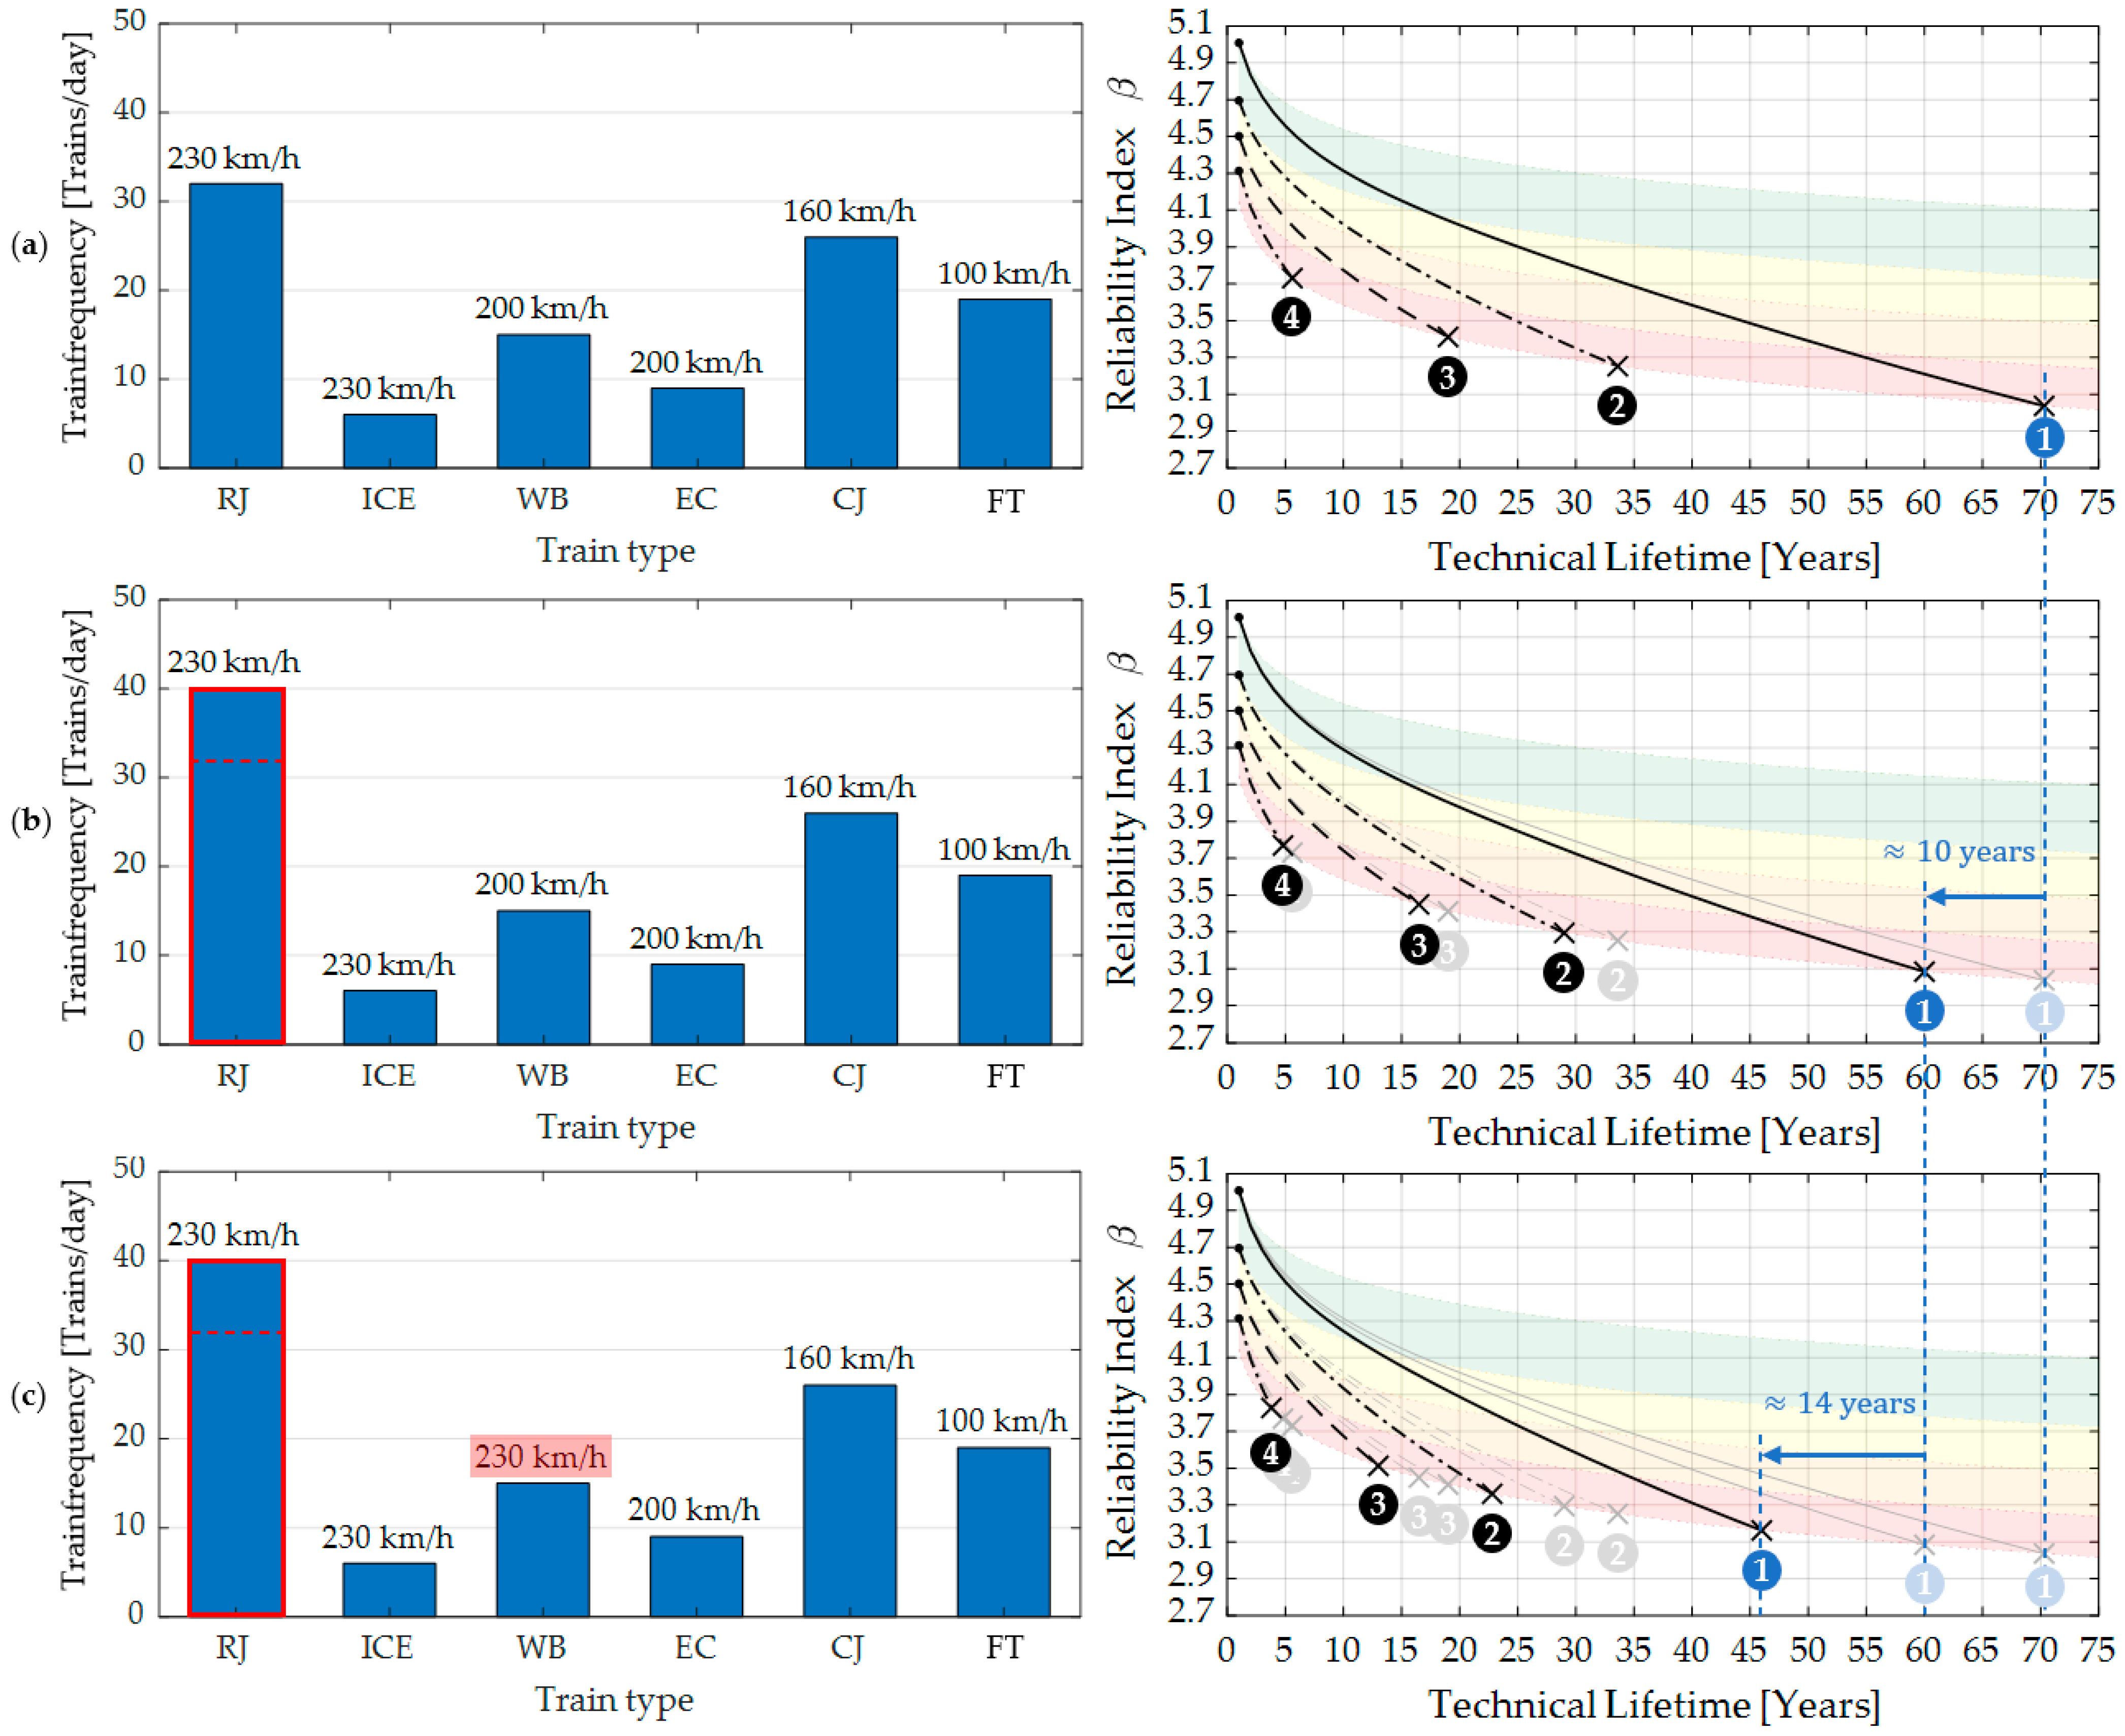
The monitoring of the action side via axle load monitoring systems can be performed at certain checkpoints along the railway network [
35]. This action-sided monitoring system collects the time series of axle loads and the speeds of passing trains. By analysing these recorded time series using machine learning algorithms, among other methods, train speeds, train types, and number of trains can be extracted, and subsequently, accurate load collectives can be grouped. The sensitivity of those action-sided parameters is shown in
Figure 5a–c, where three different cases are depicted. The three cases, (a), (b), and (c), are based on a load collective typical for the Austrian railway network. This typical load collective describes the number of trains (train passages per day) with the average train speed for six different train types. This typical load collective is composed of 32 trains per day of the type Railjet (RJ) with an average speed of 230 km/h, 6 trains per day of the type Intercity-Express (ICE) with an average speed of 230 km/h, 15 trains per day of the type Westbahn (WB) with an average speed of 200 km/h, 9 trains per day of the type Eurocity (EC) with an average speed of 200 km/h, 26 trains per day of the type Cityjet (CJ) with an average speed of 160 km/h, and 19 trains per day of the type freight train (FT) with an average speed of 100 km/h. Each train type corresponds to a specific aerodynamic shape factor
k1, where the train type ICE shows the most favourable, with
k1 = 0.6; train type RJ is medium favourable, with
k1 = 0.85; and train type FT, CJ, EC, and WB have the most unfavourable factor, with
k1 = 1.0. Starting with this typical load collective in case (a), the technical lifetime is calculated for four different scenarios numbered from 1 to 4. Scenario 1 describes a fastening system with visual condition class 1, which refers to sufficient preload force and, therefore, a maximum reduction in the stress variation range. Scenarios 2, 3, and 4 describe fastening systems with visual condition classes 2, 3, and 4, which, respectively, refer to a gradually reduced preload force to almost non-existent and, therefore, a minimum reduction in the stress variation range in the threaded bolts. The reduction factors, shown in
Table 1, were roughly derived from the experiments conducted in [
29]. Further laboratory, as well as numerical, experiments are necessary to calibrate these first approach factors.
For the sensitivity analysis, the stress range
, calculated according to [
23], is multiplied by the reduction factor
, which depends on the visual condition class (Equation (3)).
The sensitivity of the parameters number of trains and train type is shown in
Figure 5b, where the number of trains of the train type RJ increased from 32 to 40 trains per day. Looking specifically at scenario 1 of case (b), the technical lifetime reduces by around 10 years compared to the load collective in case (a). The sensitivity of the parameter train speed and train type is shown in
Figure 5c. For this load collective, which is based on case (b), the speed of the train type WB increased from 200 to 230 km/h. Looking specifically at scenario 1 of case (c), the technical lifetime reduces additionally by around 14 years compared to the load collective in case (b) and 24 years compared to case (a). In all three cases (a), (b), and (c), the load collective was assumed to be constant throughout the entire lifetime of the NB fastening elements.
5. Analysis of Installation Conditions Model Stage III on the Performance Assessment
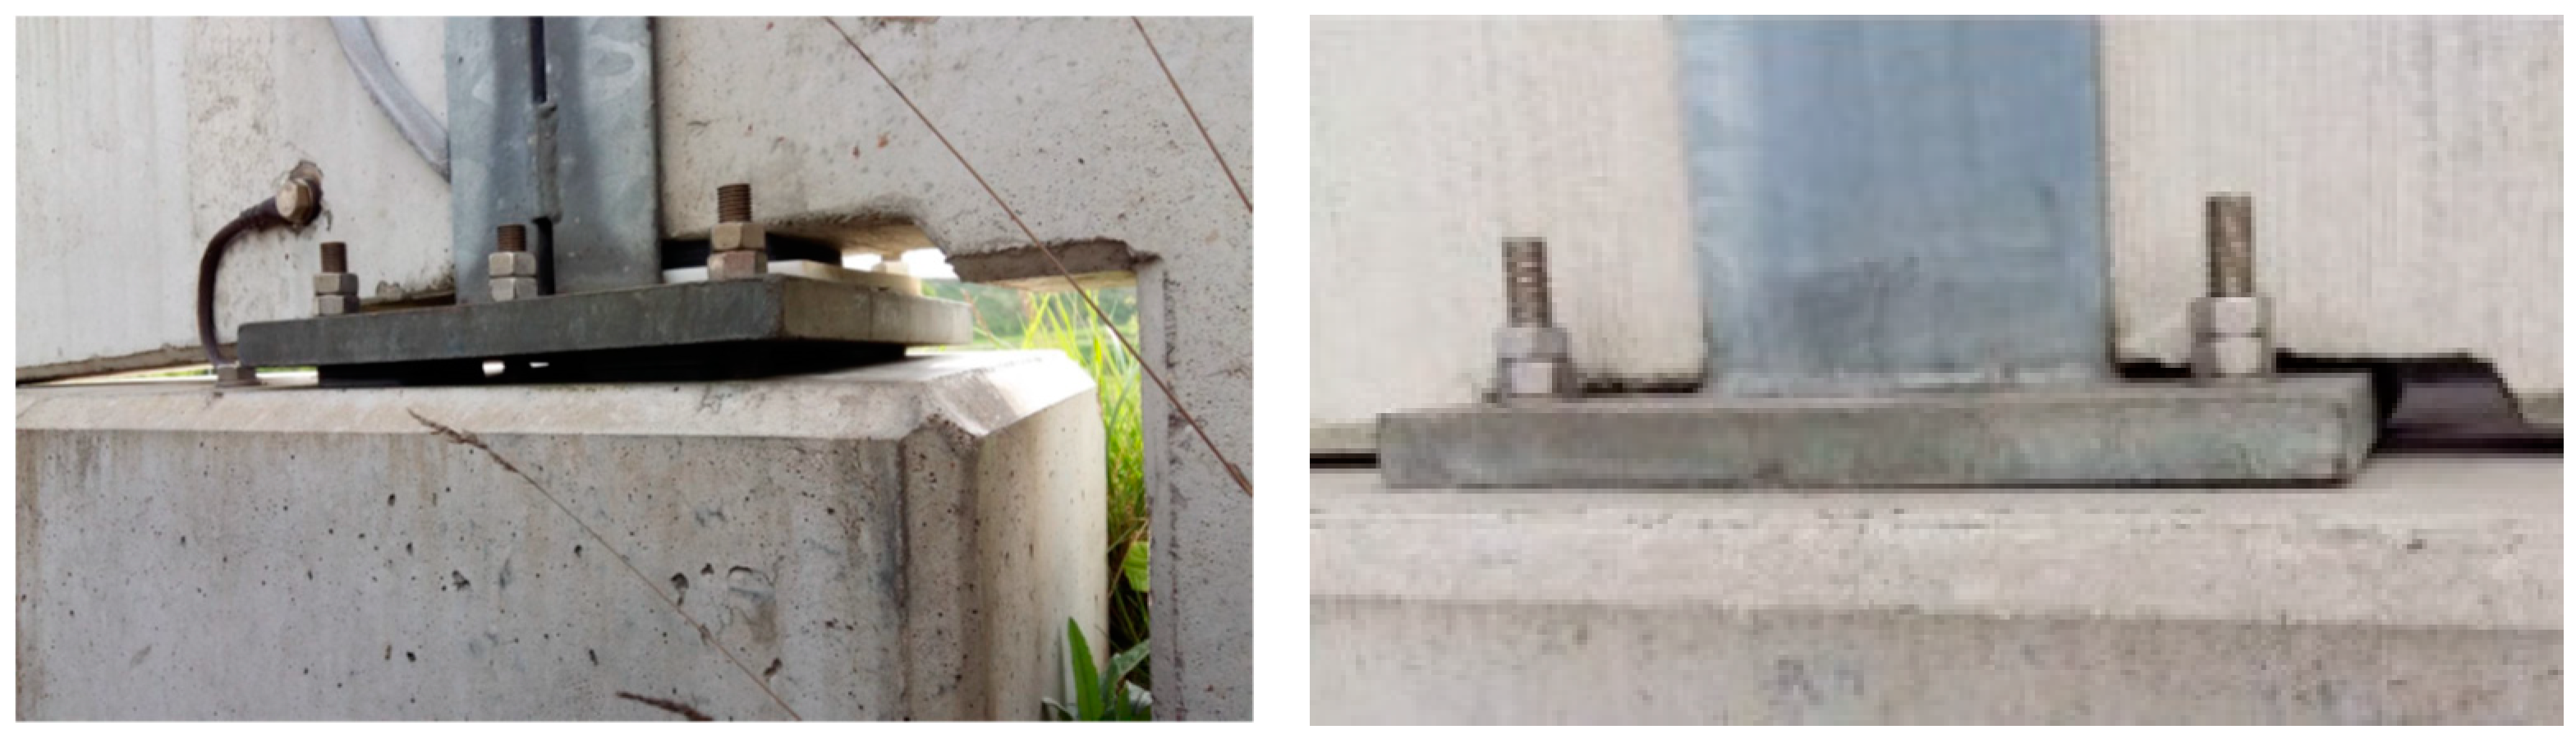
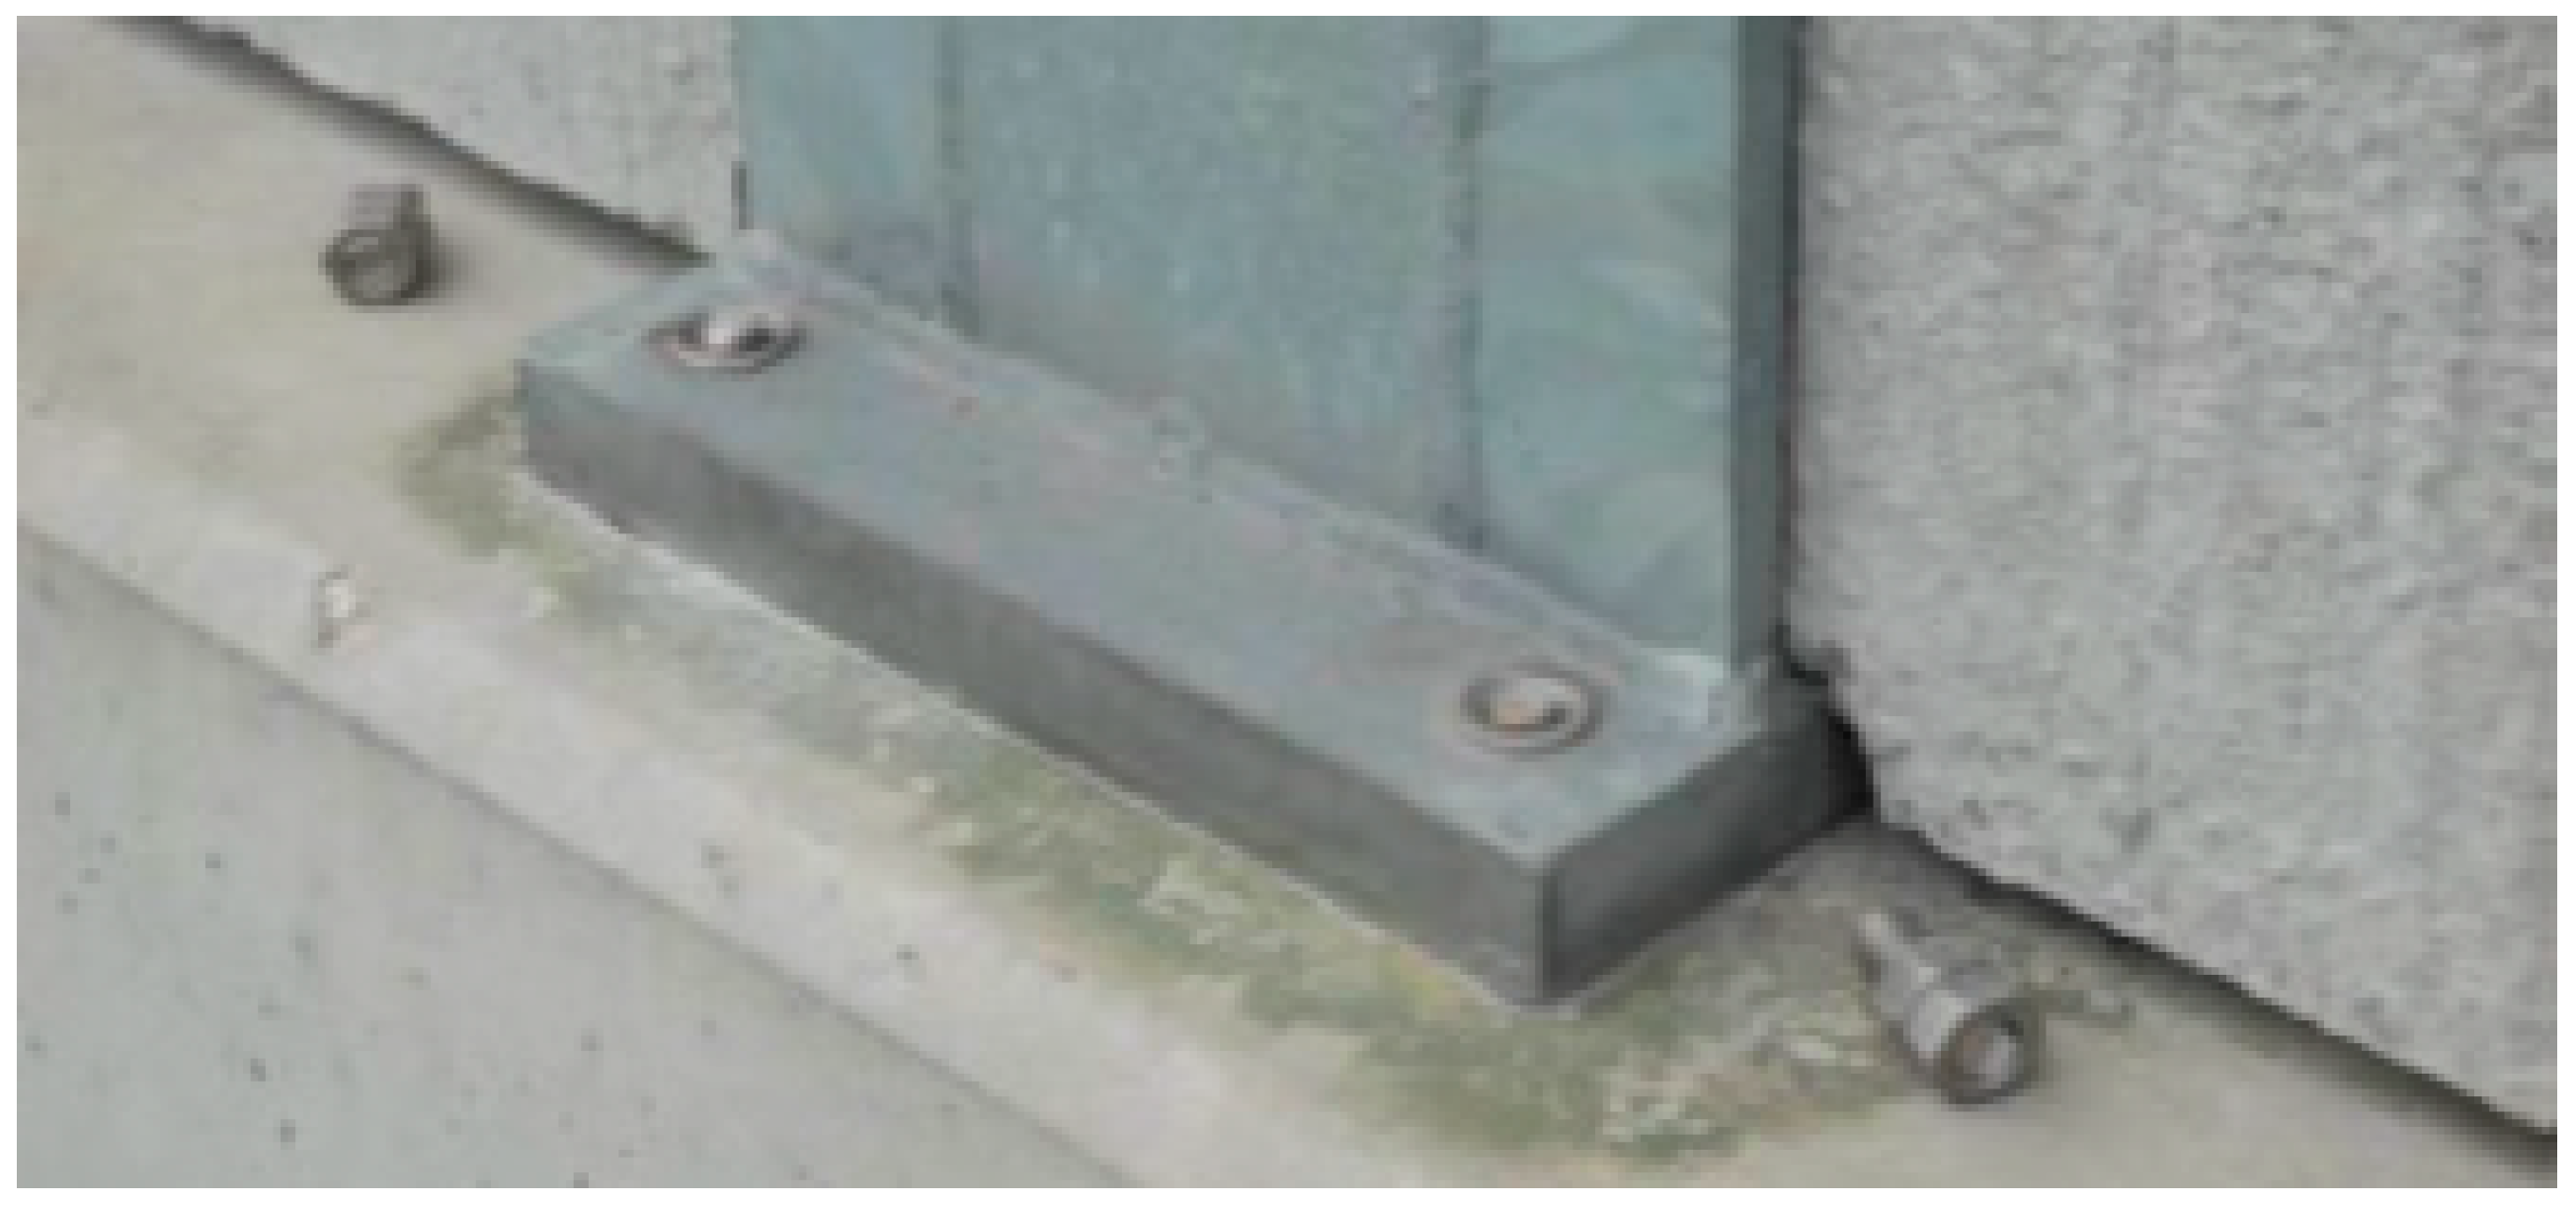
In general, bolted connections usually show a fatigue failure in the first loadbearing thread due to the contact conditions and the notch effect resulting from the geometry of the thread [
36]. Failure in bolted connections of NB steel posts behaves more or less the same way as shown in
Figure 6. In the case of ideal installation conditions, the NB fastening elements are tensile stressed and highly preloaded to avoid gaps between the steel baseplate and the surface of the concrete edge beam. In the case of NB steel posts, ideal installation means that the threaded bolts are subjected to no or negligible bending stresses and show sufficient preloading. A deficient installation condition, on the other hand, can be an insufficient preload force, missing washers, the inclination of the threaded bolt, displaced baseplate, rough or deformed concrete edge beam surface or steel baseplate surface. What all deficient installation conditions, except not necessarily insufficient preload force, have in common, is the induction of bending stresses in addition to the axial tensile stresses.
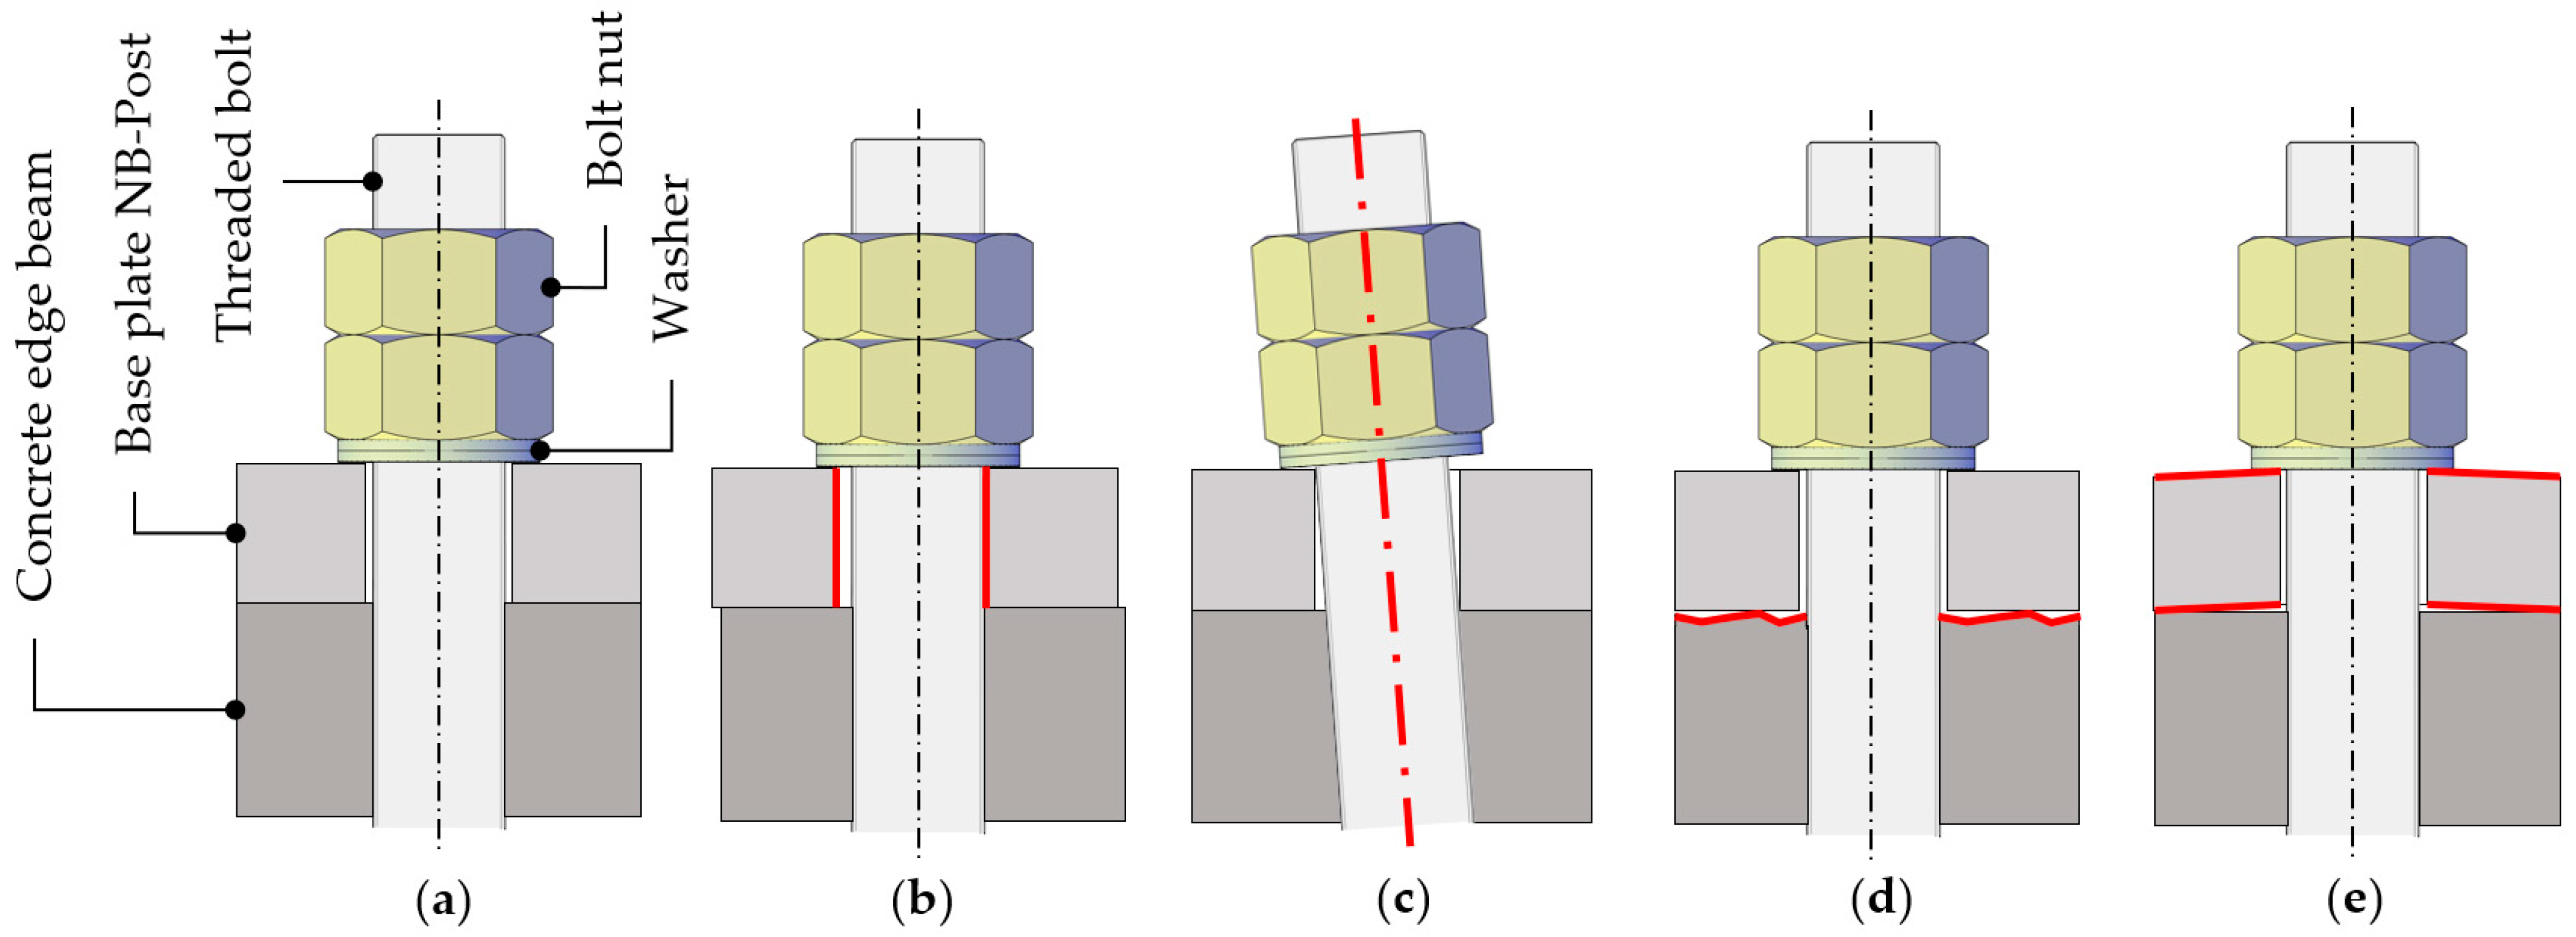
Together with experts, five different installation conditions regarding the fastening system were defined.
Figure 7a describes an ideal installation condition where all parts are in perfect placement so that no or very little eccentric loading appears.
Figure 7b describes a deficient installation condition with displaced components, such as steel baseplates or washers.
Figure 7c describes a deficient installation condition with inclined threaded bolts.
Figure 7d describes a deficient installation condition with unfavourable surface conditions of the concrete edge beam.
Figure 7e describes a deficient installation condition with deformations of the steel baseplate or surface conditions of the steel baseplate. The preload force, which is applied to the fastening system regardless of its geometrical installation condition, as shown in
Figure 7a–e, might be seen as part of the definition of the installation conditions, but for the sake of simplicity, is handled separately. For the analyses of the installation conditions, or, in other words, the resistance side, the ideal installation condition (
Figure 7a) and the two deficient installation conditions of
Figure 7b,c were compared.
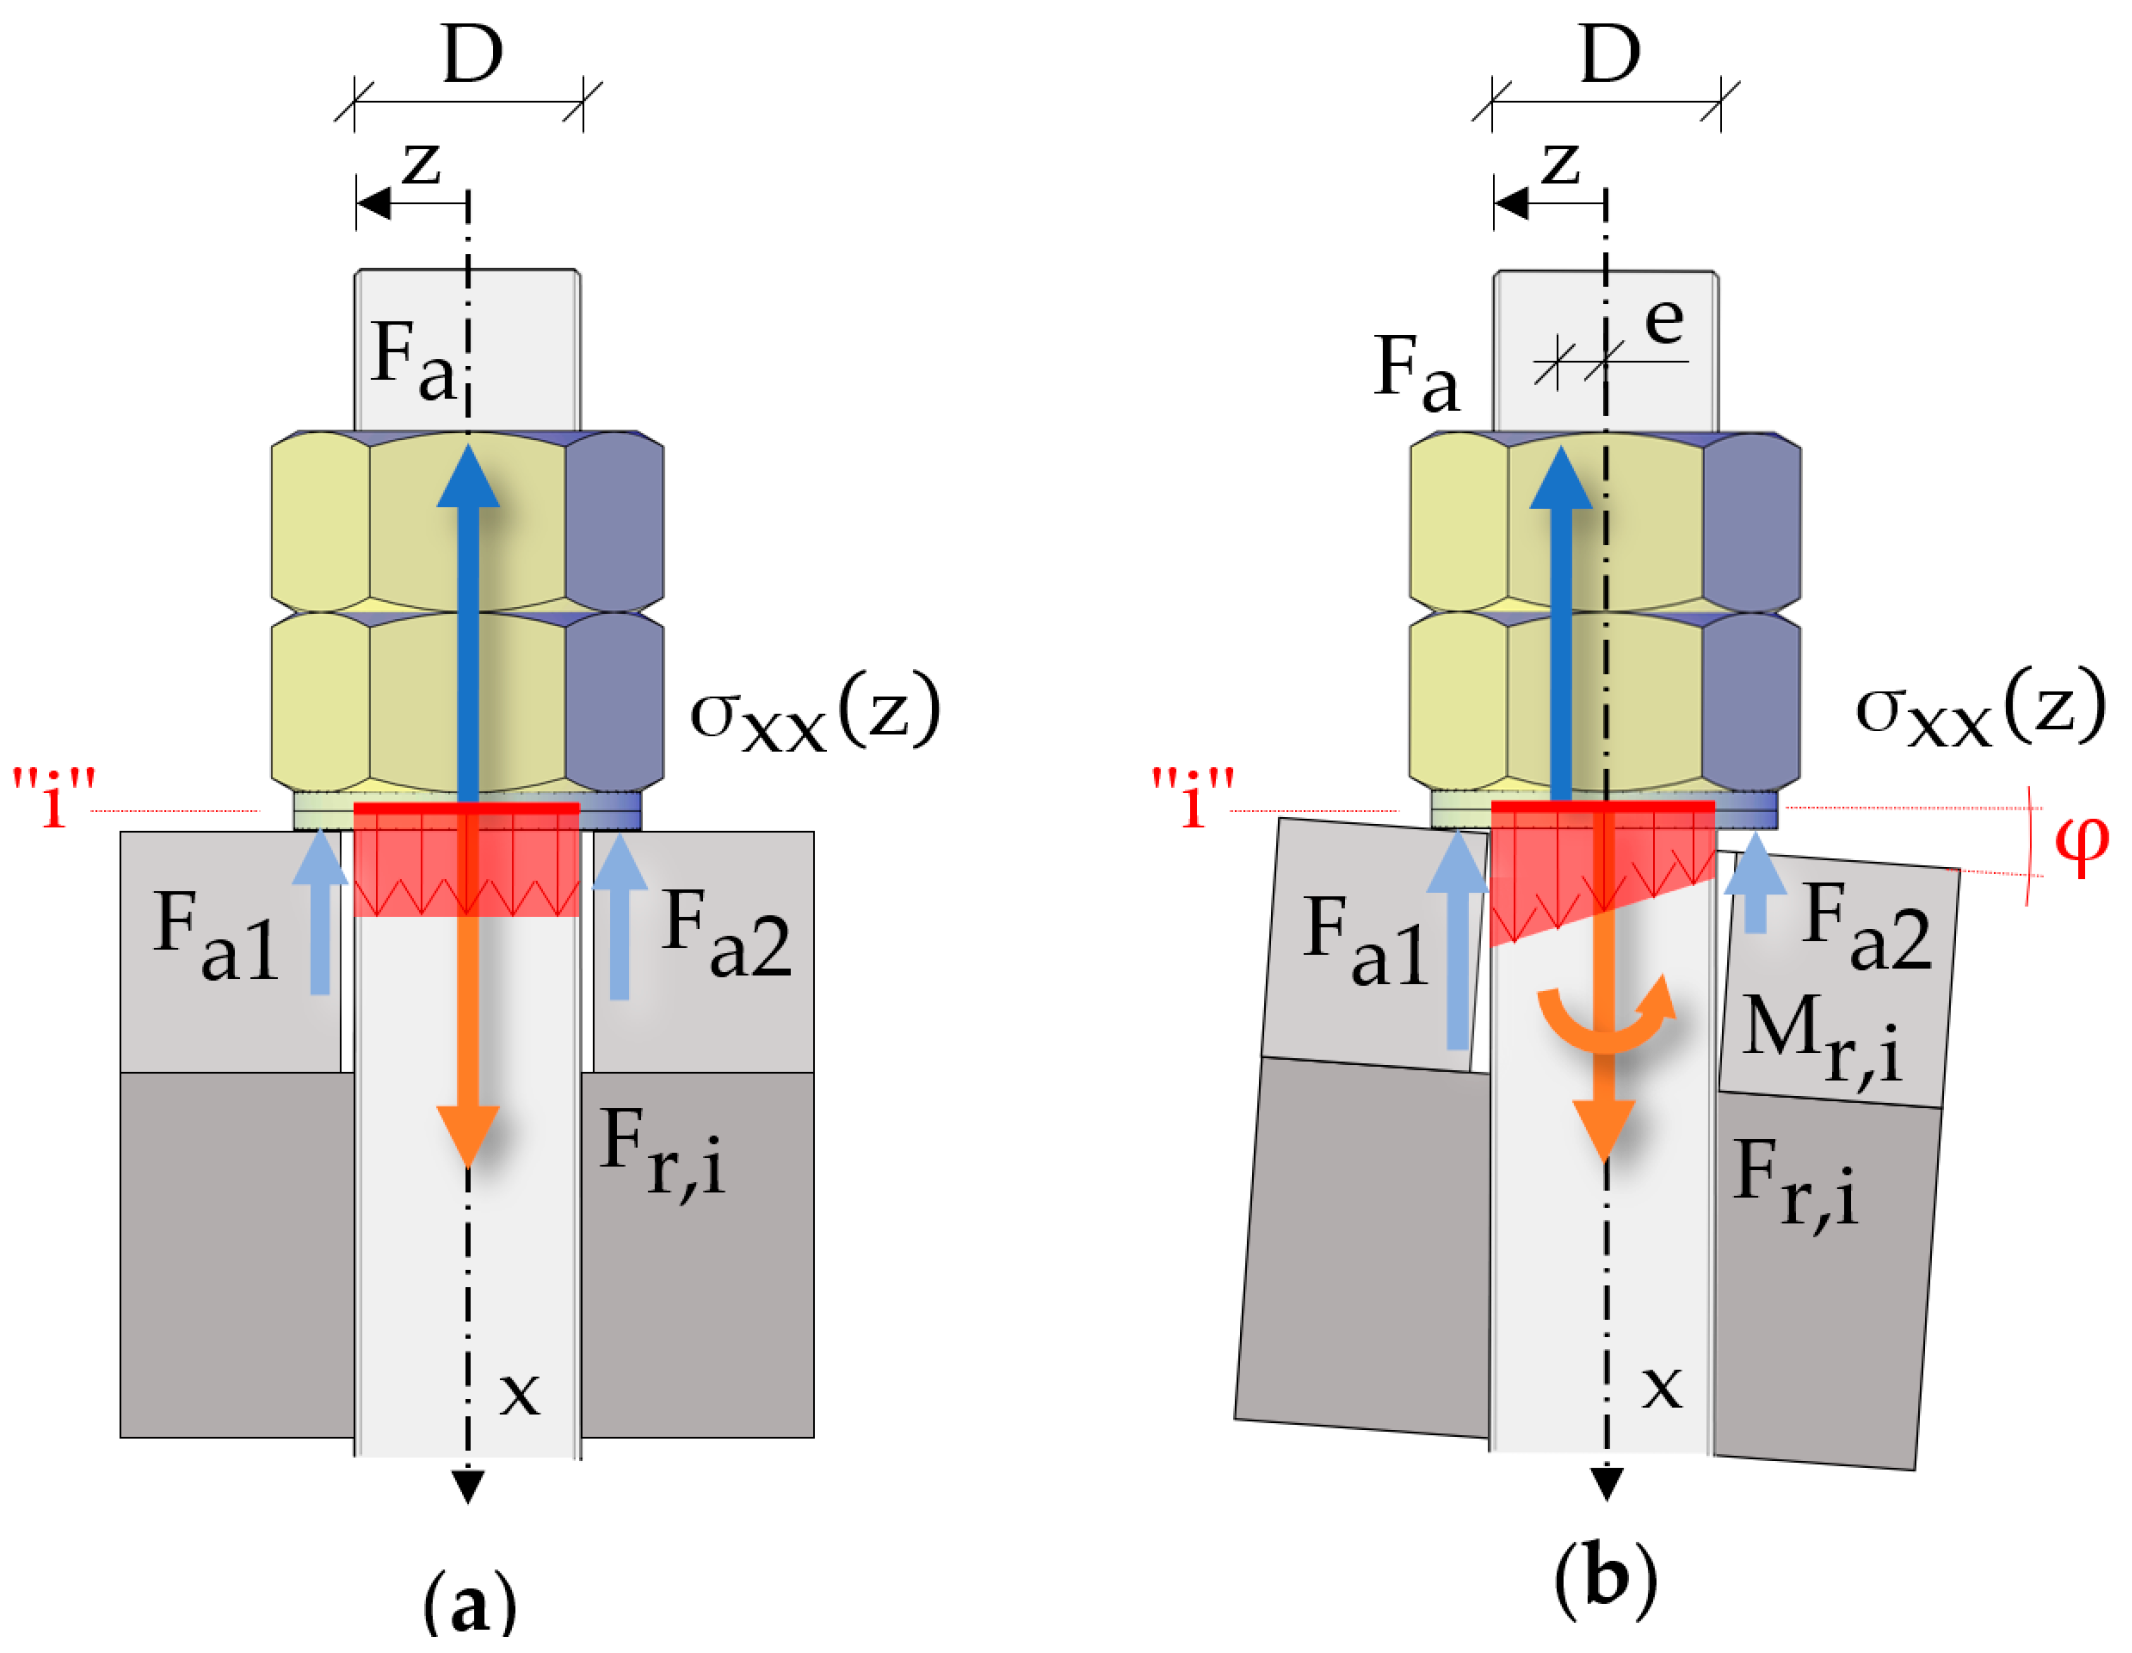
The effect of the eccentric load resulting from each deficient installation condition is shown in
Figure 8a,b in an analytical way, where (a) is an ideal installation condition, and (b) is a deficient installation condition with an inclination of
between the threaded bolt and the baseplate. When applying the preload force in an ideal installation condition of the steel post, the resulting action force is centred; thus, the fastening system is just reacting with a normal (axial) force but not with a bending moment. This means the preload force can be seen as a uniformly distributed stress on the lower side of the screw nut where the first loadbearing thread engages (
Figure 8a). In this idealised two-dimensional static system, this load is simplified via the two forces,
Fa1 and
Fa2, with equal magnitude and equidistant from the bolt axis. Since the cross-section of interest “
” is engaging at the first loadbearing thread, the calculations of the internal forces are conducted at exactly that point. The action force
, which is centred in the case of ideal installation condition, results from the sum of
Fa1 and
Fa2 and equals the resistance force at the cross-section of interest
via the equilibrium of forces. When the internal forces have been calculated, finally, the preload stress
is calculated with Equation (5), where
is the area of the cross-section of interest. Since the forces act centrically, the bending stress term is omitted in Equation (5), leaving only the stress term of the normal force.
When applying the preload force in a deficient fastening condition, the resulting action force is not centred, thus the fastening system is reacting with an additional bending moment to the normal (axial) force (
Figure 8b). This means the preload force can be seen as a non-uniformly distributed stress on the lower side of the screw nut where the first loadbearing thread engages. In the idealised two-dimensional static system, this load is simplified using the two forces,
and
, with unequal magnitude and equidistant from the bolt axis. Since the cross-section of interest “
” is at the first loadbearing thread, the calculation of the internal forces is conducted at exactly that point. The action force
, which is eccentric in the case of deficient installation condition, results from the sum of
and
and equals the resistance force at the cross-section of interest
via the equilibrium of forces. Because of the eccentricity of the action force, a bending moment is introduced into the threaded bolt. Through the equilibrium condition, the bending moment
, as well as the eccentricity
, can be calculated. When the internal forces have been calculated, finally, the preload stress
is calculated with Equations (4) and (5). In addition to the stress term resulting from the normal (axial) force, the term for the bending stress is added. Since the action force
is acting eccentrically the term of the bending stress is added to the term of the normal stress.
From this simplified described problem regarding the deficient installation of NB steel posts, it can be seen that when comparing the maximum stresses of the centrically and eccentrically loaded fastening system, the eccentrically loaded fastening system is subjected to higher stress, and hence, fatigue damages are accelerated.
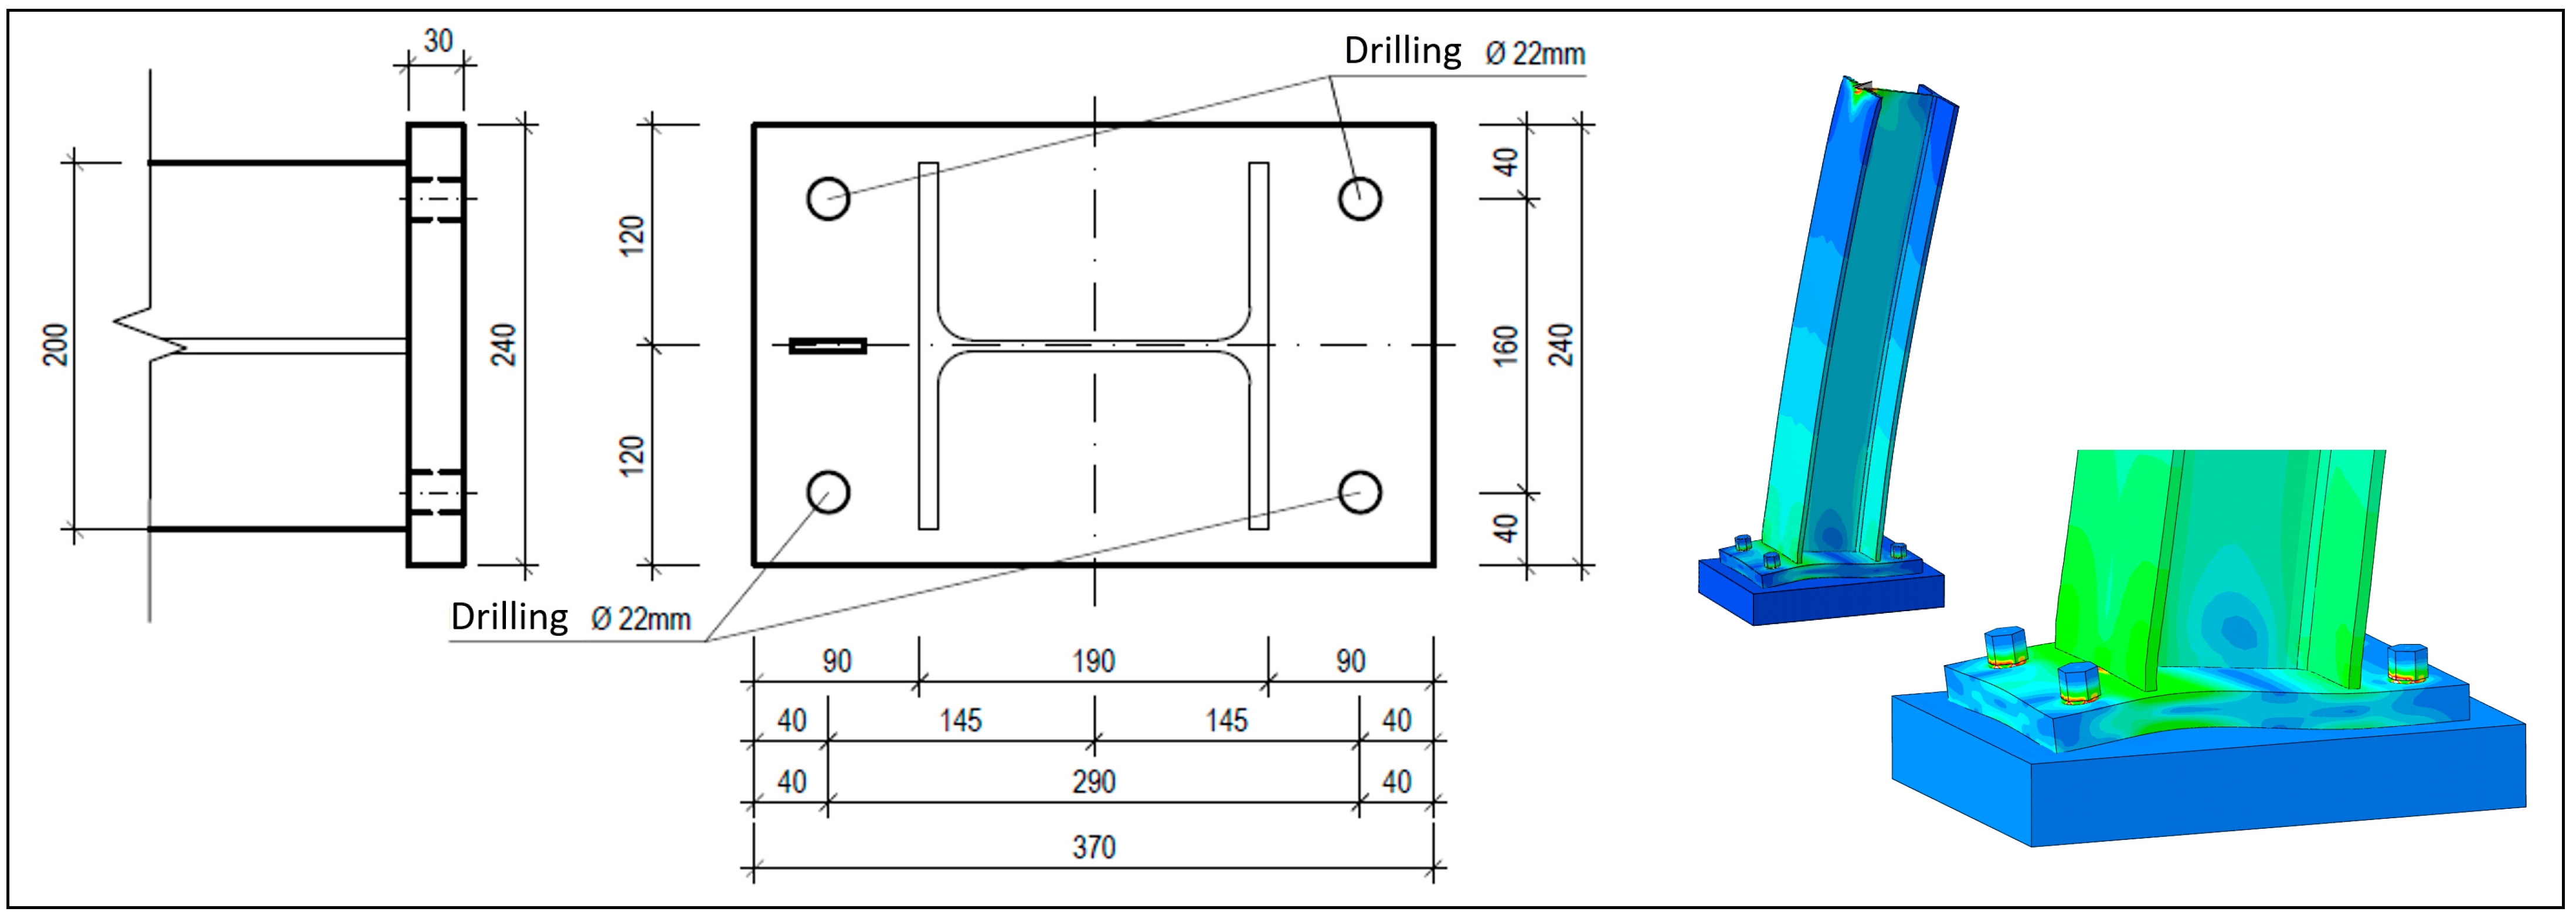
6. FEM-Digital Twin Studies of Installation Conditions “Model Stage III”
The analyses of the resistance side were carried out via the application of the finite element software Abaqus 6.23-1. The linear finite element model was built on the basis of the new noise barrier design of the Austrian federal railways (
Figure 9). The NB components modelled with Abaqus and briefly described in
Section 2 are the C 20/25 concrete edge beam, S 235 JR steel baseplate with a thickness of 30 mm, S 235 JR I-beam of type HE-A 200 with a length of 1 m, four A4-80 threaded bolts with dimension M20, and four washers in between screw nut and steel baseplate. The threaded bolts and the nuts were modelled as one part for the sake of simplicity.
The geometrical dimensions of the concrete edge beam were limited to minimise the computational costs, which was found to be in order since it did not affect the results of the notch detail of the bolted connection. The I-beam, whose main task from a structural engineering point of view is to transfer the external aerodynamic load to the concrete edge beam, was not modelled with a length of 3 to 4 m, which is typical for NB, but with a length of 1 m to simplify the load application. Omitting the I-beam and applying the external load directly to the steel baseplate would have reduced the calculation cost, but to obtain realistic stiffness conditions at the baseplate, it was left in the model. In the first load step of the finite element analysis, the preload force is applied, followed by an external quasi-cyclic load step to model the train passage. This external load is based on calculations according to [
27], for an NB which is around 4 m high and a train passage of a Railjet with 250 km/h. The result is a characteristic moment of 10 kNm on the bottom end of the I-beam. To model this load, a point force was applied at the upper end of the 1 m high I-beam, ranging between +10,000 N and −10,000 N, which is equal to +10 kNm and −10 kNm at the bottom end of the I-beam.
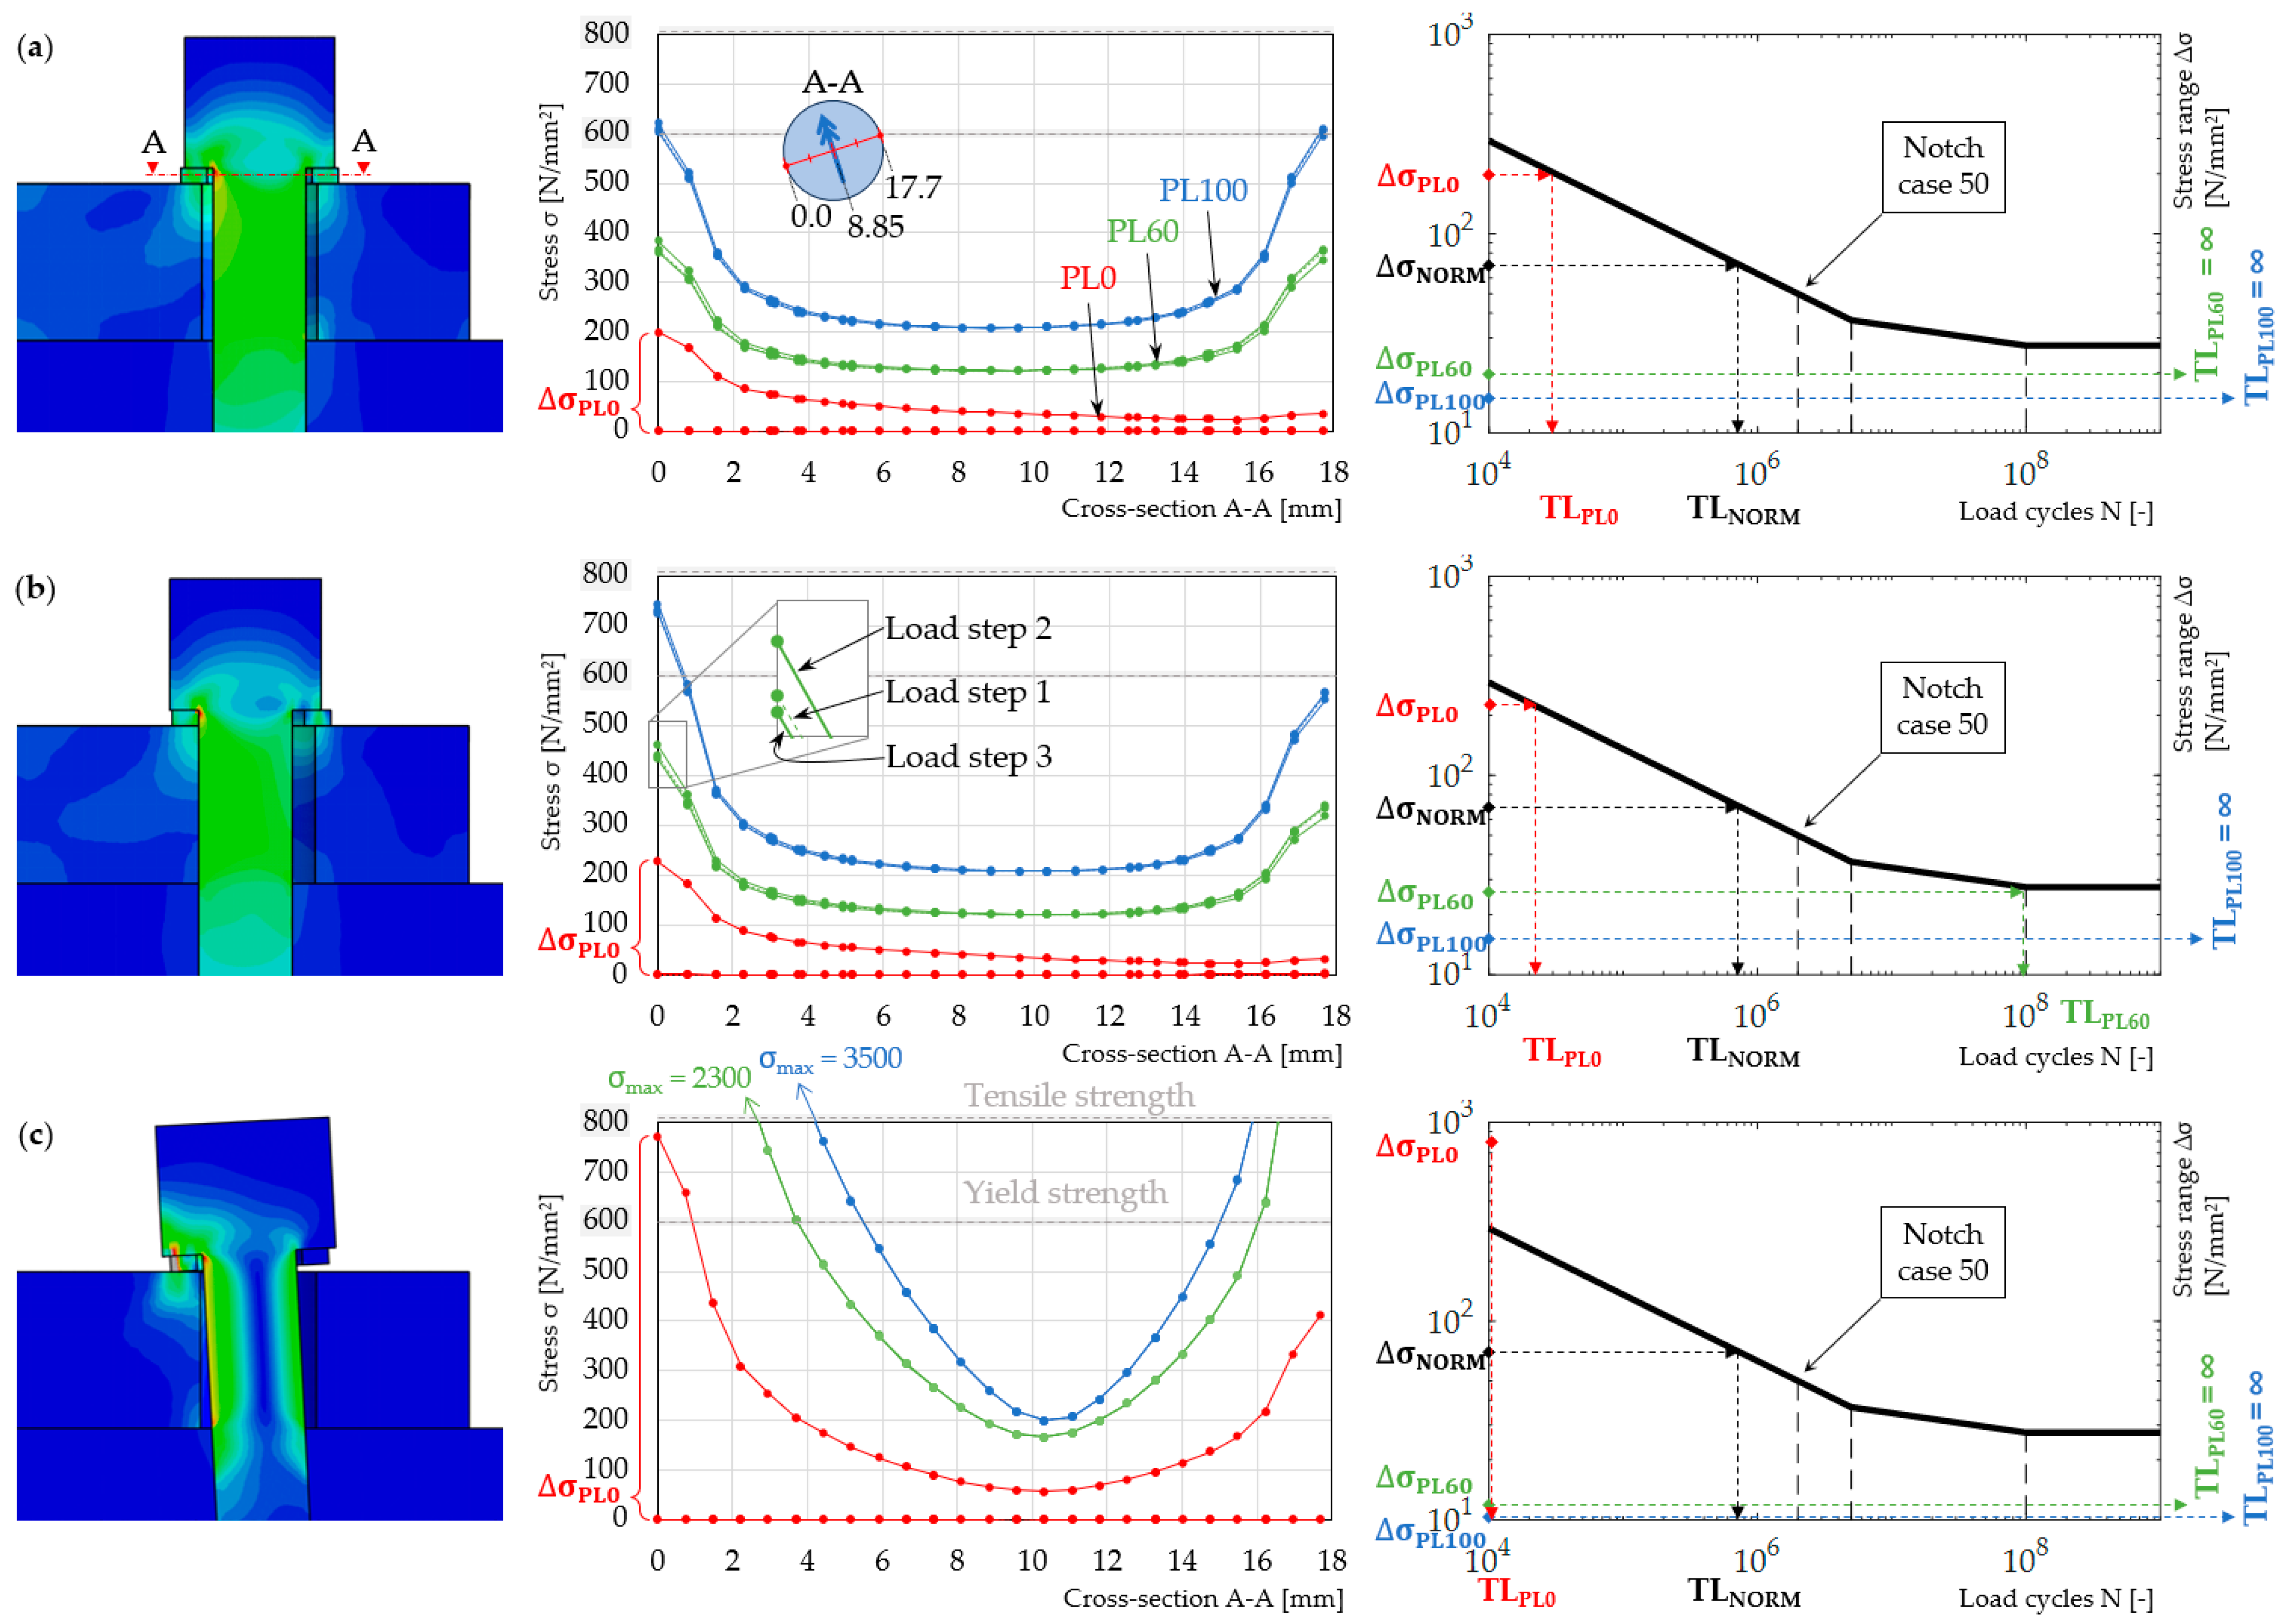
As mentioned before, the ideal installation condition, the deficient installation condition with displaced steel baseplate and displaced washers, and the deficient installation condition with inclined threaded bolts were considered for this analysis. In
Figure 10a–c on the left side, the established spatial finite element model associated with the respective installation condition is depicted together with the corresponding stress analyses in the middle of
Figure 11 and the prediction of the technical lifetime according to the stress-number (S-N) curves on the right side of
Figure 11 [
37].
Figure 10a illustrates the ideal installation condition of the NB steel post on the concrete edge beam, (b) the installation condition with the displaced steel baseplate, and (c) the installation condition with the inclined executed threaded bolt. For each installation condition, three different cases of preload force (100 kN, 60 kN, and 0 kN) were applied. The choice of preload force is based on experiments given in [
29]. As in the stress analysis, as shown in the middle graph of
Figure 10a–c, the first case with 100 kN preload force is depicted in blue, the second case with 60 kN preload force is depicted in green, and the third case with 0 kN preload force is depicted in red. The stresses that are shown correspond to the path 0.0–17.7 mm in cross-section A-A, as the graph in the middle of
Figure 10a illustrates. Note that the dimension of the threaded bolt is chosen as M20. This path is orthogonal to the main bending direction and represents the significant case. Point 0.0 mm is oriented towards the I-beam, and point 17.7 mm is oriented away from the I-beam. Every case of preload force inhabits three load steps (load step 1: applying preload force, load step 2: applying external bending moment +10 kNm, load step 3: applying external bending moment −10 kNm). Therefore, three stress curves are the result of the numerical calculation. Since the scale of the stress curves does not allow to make this clearly visible, except for the case of 0 kN preload force, a zoomed-in few of the cases with preload force 60 kN are shown in
Figure 10b in the middle graph. The case with preload force 100 kN behaves similarly only for the case with preload force 0 kN the stress curve of load steps 1 and 3 drops down to zero, which leads to the highest stress variation range out of all three installation conditions.
For the ideal installation condition in
Figure 10a, the steel baseplate and the washers are placed in such a way that the boreholes are completely concentric to the threaded bolts as well that the threaded bolts are placed orthogonal to the concrete edge beam and the baseplate. When the preload force is applied in the first load step, the stress in the cross-section under consideration shows no bending moment, which can be proven in a congruent curve when mirrored around the centre axis. When the external bending moment +10 kNm is applied in the second load step, the stress increases at point 0.0 mm of the cross-section of interest (the side facing the I-beam) above the preload stress and drops below the preload stress at point 17.7 mm of the cross-section of interest (the side facing away from the I-beam). This indicates a non-congruent curve when mirrored around the centre axis, or, in other words, a slight slope of the stress curve when the notch effect is taken out of the calculation, which means that a bending moment is active. This is the case for the different levels of applied preload PL100, PL60, and PL0, whereas for PL0, it is most significant. When the external bending moment −10 kNm is applied in the third load step the situation is inverting, the stress is slightly dropping below the preload stress at point 0.0 mm of the cross-section of interest and increases above the preload stress at point 17.7 mm. This indicates a slope into the other direction of the stress curve, which means that a bending moment is turning around. This is the case for PL100 and PL60. For PL0, the stress curve of load step three is very close to zero.
From these results, the most significant stress range, which is at point 0.0 mm of the cross-section of interest, can be calculated. The corresponding value of the stress variation range ∆
σ is obtained by subtracting the maximum stress of each preload level from the minimum stress at that particular point. Having calculated the stress variation range for PL100, PL60, and PL0, the technical lifetime is then predicted using the S-N curves (see
Figure 10a graph on the right side). The advantage of the reducing effect by increasing the preload force on the resulting stress variation range ∆
σ is shown clearly in
Figure 11. The results are compared with calculations according to standards with resulting stress variation range ∆
σNORM = 71 N/mm
2, which leads to a failure of the threaded bolts after 7 × 10
5 load cycles. PL0 shows the highest stress variation range with around 200 N/mm
2, resulting in failure after just 3 × 10
4 load cycles. The stress variation ranges of PL60 with around 23 N/mm
2 and PL100 with around 16 N/mm
2 are far below the standard calculations and result theoretically in an infinite technical lifetime since they are in the high-cycle fatigue domain.
For the deficient installation condition 1 in
Figure 10b, the steel baseplate and the washers are placed in such a way that the shell surface of the boreholes is touching the shaft of the threaded bolts, and the threaded bolts are placed orthogonal to the concrete edge beam and the baseplate. When the preload force is applied in the first load step, the stress in the cross-section under consideration shows at the beginning a slope of the stress curve, indicating an eccentrically acting normal force leading to an additional bending moment. When the external bending moment +10 kNm is applied in the second load step, the stress increases at point 0.0 mm of the cross-section of interest above the preload stress and drops below the preload stress at point 17.7 mm. This indicates a slight change in the slope of the stress curve, which means that the bending moment is increasing. This is the case for the preload levels PL100, PL60, and PL0, whereas for PL0, it is the most significant. When the external bending moment −10 kNm is applied in the third load step, the situation inverts, and the stress slightly drops below the preload stress at point 0.0 mm of the cross-section of interest and increases above the preload stress at point 17.7 mm. This indicates a slight decrease in the slope of the stress curve, which means that the bending moment is decreasing as well. This is the case for PL100 and PL60. For PL0, the stress curve of load step three is very close to zero. From these results, the most significant stress variation range, which is at point 0.0 mm of the cross-section of interest, can be calculated. The stress variation range is again obtained by subtracting the maximum stress from the minimum stress at that particular point. Having calculated the stress range for PL100, PL60, and PL0, the technical lifetime is then again predicted using the S-N curves (see
Figure 10b graph on the right side). The results are again compared with calculations according to standards with resulting stress variation range ∆
σNORM = 71 N/mm
2, which leads to a failure of the threaded bolts after 7 × 10
5 load cycles. PL0 shows that compared to the ideal installation condition with 0 kN preload force (
Figure 10a), with 225 N/mm
2, there is an even higher stress variation range, which results in failure after just 2 × 10
4 load cycles. The stress variation ranges of PL60 with around 26 N/mm
2 and a failure after 1 × 10
8 load cycles is very close to the endurance limit, which separates finite life fatigue and high cycle fatigue. The stress variation range of PL100 with around 17 N/mm
2 does not change very much compared to the ideal installation condition illustrated in
Figure 11.
For the deficient installation condition 2 in
Figure 10c, the threaded bolts are installed to the concrete edge beam with an inclination of 3° between the vertical axis and the axis of the threaded bolt. When the preload force is applied in the first load step, the stress in the cross-section under consideration shows at the beginning a significant slope of the stress curve, indicating a highly eccentrically acting normal force leading to an additional bending moment. When the external bending moment +10 kNm is applied in the second load step, the stress increases very slightly at point 0.0 mm of the cross-section of interest above the preload stress and drops very slightly below the preload stress at point 17.7 mm. This indicates a slight change in the slope of the stress curve, which means that the bending moment increases. This is the case for PL100, PL60, and PL0, whereas for PL0, it is the most significant. When the external bending moment −10 kNm is applied in the third load step, the situation inverts only for PL100, the stress slightly drops below the preload stress at point 0.0 mm of the cross-section of interest and increases above the preload stress at point 17.7 mm. This indicates a slight decrease in the slope of the stress curve, which means that a bending moment decreases as well. For PL60 and PL0, the stress curve of load step three is very close to the situation without any external loading. From these results, the most significant stress variation range, which is at point 0.0 mm of the cross-section of interest, can be calculated. The stress variation range is again obtained by subtracting the maximum stress from the minimum stress at that particular point. Having calculated the stress variation range for PL100, PL60, and PL0, the technical lifetime is then again predicted using the S-N curves (see
Figure 10c graph on the right side). The results are again compared with calculations according to standards with resulting stress variation range ∆
σNORM = 71 N/mm
2, which leads to a failure after 7 × 10
5 load cycles. PL0 shows with 772 N/mm
2 a stress variation range almost 4 times higher compared to the ideal installation condition with 0 kN preload force (
Figure 10a), which results in an immediate failure of the threaded bolts. The stress variation ranges of PL60 with around 1.5 N/mm
2 theoretically lead to an infinite lifetime for the threaded bolts. The stress variation range of PL100 with around 3.7 N/mm
2 theoretically leads to an infinite lifetime.
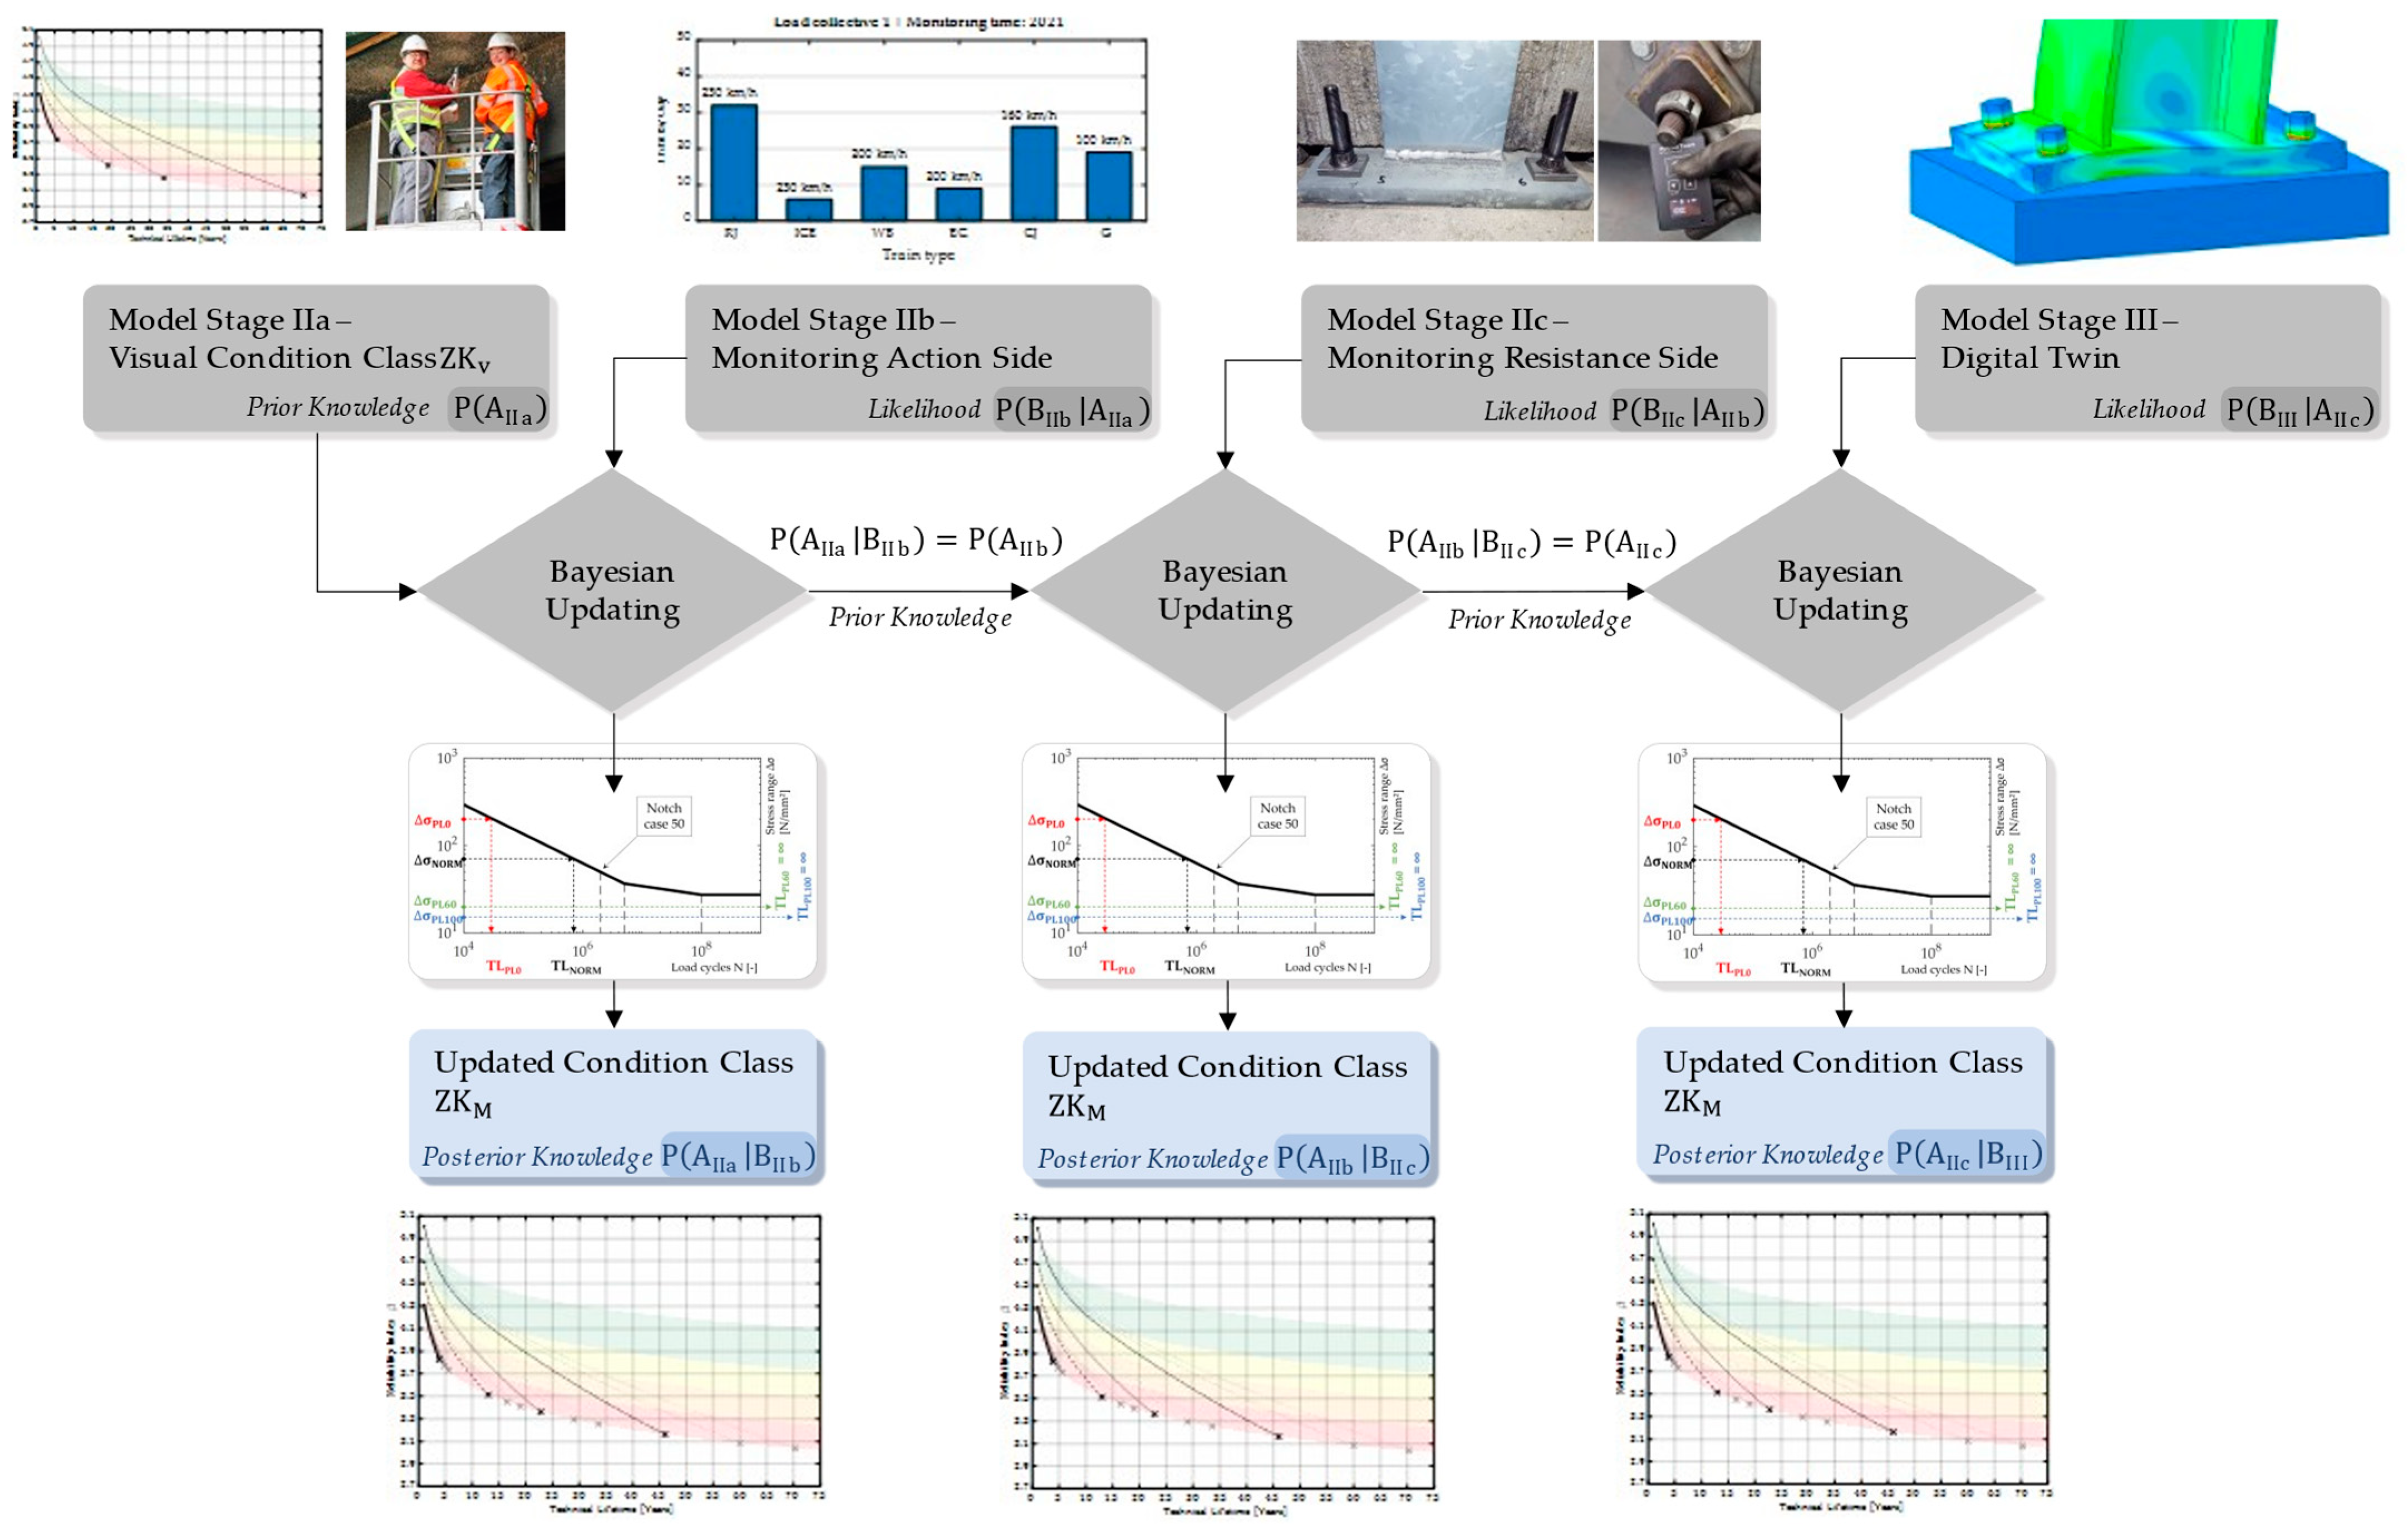
7. Data-Based Condition Assessment Using Bayesian Updating Techniques
With increasing Model Stages I to IV of the preceding holistic approach, there is a continuous increase in information, whereby this newly acquired information is also accompanied by uncertainties. It is, therefore, obvious to needle the increasing information of model levels I to IV with Bayesian updating procedures, as shown in
Figure 11. Among other things, the Bayesian updating procedure not only allows the assessment from the visual inspection to be detailed but also allows the reliability level and the remaining service life to be assigned to the visual inspection results by including digital twin approaches and Wöhlerline formats, as shown in
Figure 11 [
38,
39,
40,
41,
42].
For instance, the Bayesian interference process can be started with Model Stage IIa by including the prior information P(AIIa) of the visual condition assessment and the likelihood information P(BIIb|AIIa) of the loading from the real train traffic actions (monitoring action side and load model) in order to obtain the posterior distribution P(AIIa|BIIb) of, e.g., the stress variation ranges in the anchor bolts.
In the next step, this posterior information becomes the new prior information P(AIIb) = P(AIIa|BIIb) and can be combined with the likelihood information on the resistance side, e.g., the preload degree in the bolted joints P(BIIc|AIIb) of Model Stage IIc, which leads to the posterior P(AIIb|BIIc).
Similarly, the information gained in Model Stage III can be transferred into the posterior information P(AIIc|BIII) in the stress ranges and, subsequently, using the Wöhler diagrams, into the posterior information P(AII|BIII) of the remaining service life and the reliability level ZKM, which, in turn, can be correlated with the original ZKV. Thus, it is possible to consider a direct relation between the visual condition class ZKV and the mechanical condition class ZKM, taking into account the uncertainties of the different model stages. In this development of the correlations, it is not absolutely necessary to include all model stages in the Bayesian interference approach.


 ,
, 


