Abstract
The past decade has seen a rise in the availability of modern information and communication technologies (ICTs) for developing smart societies and communities. However, the smart divide, characterized by inequalities in ICT infrastructures, software access, and individual capabilities, remains a significant barrier for rural communities. Limited empirical studies exist that explore what and how ICT infrastructures can be developed to bridge the smart divide. The paper aimed to address rural broadband access in the context of infrastructural dimensions of smart divide (i.e., smart infrastructural divide) in the United States, focusing on the wireless network infrastructure’s role in narrowing the gap. It examined the broadband specifications needed for smart applications like smart education and telehealth, emphasizing the importance of wireless network capabilities. While fixed broadband offers higher speeds, wireless networks can support many smart applications with decent flexibility and ease of access. To further understand the implications of wireless broadband to rural communities, we conducted a case study in Carbondale and Cairo, two rural towns in Southern Illinois, using on-site user-inspired speed testing. An Android application was developed to measure download/upload speeds and Reference Signal Received Power (RSRP) for broadband quality. Results suggest both Carbondale and Cairo experienced below-average speeds with high variability among census blocks, which highlights the need for improved wireless network infrastructure. The paper culminated in the technological and policy recommendations to narrow down the smart infrastructural divide.
1. Introduction
The recent decade has witnessed growing availability of modern information and communication technologies (ICTs) for developing smart societies and communities. For example, Cloud Computing [1] has simplified access to computing resources and software applications, while the Internet of Things (IoT) [2] enables enhanced monitoring, understanding, and control of our environment. Despite the prosperity of smartness brought about by modern ICTs, one important barrier is the digital divide, which is associated with a range of access problems regarding physical ICT infrastructure and software and individual capabilities of engaging with ICTs [3]. As ICTs have driven the paradigm shift in the relationship of our society and technology, digital divide research has shifted its focus from the initial physical access divide to the literacy gaps in ICT technological skills and usage and then to the emerging smart divide that centers on modern ICT infrastructural and literacy gaps in the age of smart societies and communities [3,4]. While the debate continues over whether the smart divide presents a distinct profile from the digital divide, it is undeniable that greater attention should be focused on digital inequalities in a modern technological landscape characterized by variable availability and quality of advanced ICT infrastructure and services.
The smart divide was defined as “a type of social inequalities that are associated with imbalanced penetration and matureness of smart infrastructure and smart applications and services, as well as the intellectual and skill gap among communities and regions in the age of smart cities and communities” [4]. While the smart divide was originally framed as an impending future risk, it became an urgent issue to resolve during the COVID-19 epidemic, when people, being isolated at home, were forced to engage with smart technologies and applications such as smart education, telecommuting, and telehealth. In this article, we concentrated on smart infrastructure and introduced the term ‘smart infrastructural divide’ to specifically address the physical infrastructure elements within the broader concept of the smart divide. Presently, tremendous resources have focused on the availability, accessibility, and quality of broadband infrastructure for those ‘underserved’ and ‘unserved’ regions [5], most of which are rural areas with limited market capacities for traditional internet service providers.
Compared with its urban counterpart, rural America has a long history of insufficient investment in network infrastructures [6]. The signal strength is often weak and unstable, especially in remote and impoverished villages [7]. Fewer rural broadband network ports are available that provide high-speed internet connections [8]. As broadband infrastructure development and improvement have been widely regarded as an effective means of bridging economic gaps between urban and rural areas, the United States has taken solid steps to reduce the broadband gaps. For example, in 2017 California launched the Internet for All Now Act, which allocated more than USD 300 million to help expand Internet access areas with the goal of covering 98% of California [9]. The more recent U.S. Infrastructure Investment and Jobs Act provides a once-in-a-lifetime opportunity of advancing broadband connections in those remote rural areas with historic federal investment [10]. Despite ongoing investment, there is still no consensus on the most suitable means of addressing broadband access in underserved rural areas. We argue that a place-based context is important for understanding and examining the needs and solutions related to smart infrastructural divide.
In this paper, we aimed at examining pathways for advancing rural broadband access and bridging smart infrastructural divide in rural America. In particular, we focused on the roles that wireless network infrastructures play in narrowing the divide. Hereafter, this paper is organized in the following sections. In Section 2, we analyzed the bandwidth needs in support of smart applications, especially smart education and smart telehealth. In Section 3, we reviewed and examined different options of network infrastructures for resolving rural smart divide based on broadband types (fixed vs. wireless) and their technical and financial feasibility. In Section 4, we used two rural towns in Southern Illinois as study areas to demonstrate the challenges and opportunities of deploying wireless network based on user-inspired data collection efforts. In Section 5, we discussed future innovative technological and policy solutions. In the last section, the paper was concluded with a summary.
2. Smart Applications
Smart applications are one of the most direct and effective approaches to deliver the benefits of ICT infrastructures to the citizens. While smart applications are powered by computing and storage resources in the backend, they allow direct connection to users through the network. In this section, we first summarize the bandwidth needs of common smart applications, then discuss broadband needs of two types of applications that are critical to rural areas: smart education and telehealth.
2.1. A Summary of Bandwith Needs of Commom Smart Applications
The bandwidth requirements of a smart application are contingent upon both the nature of the data being transmitted and the specific real-time interaction demands stipulated by the application’s underlying business logic. In general, heightened demands for data transfer and increased sensitivity to latency necessitate a correspondingly higher allocation of bandwidth resources. Table 1 summarizes the network bandwidth needs for common online activities.

Table 1.
Bandwidth needs for common online activities.
2.2. Bandwith Needs for Smart Education
Smart education is referred to as the process of using modern information technologies to promote efficient and effective education programs. The technical features of smart education include digitization, networking, intelligence, and multimedia, and its merits are openness, sharing, interaction, collaboration, and ubiquity [11].
Despite significant advances being achieved, advanced information technologies are not yet fully integrated into education programs. At present, video communication is still the most common technique employed for smart education. In Table 2, we list the bandwidth needs of different types of video communications, recommended by the teleconferencing software Zoom, as a reference for illustrating the bandwidth needed for smart education [12].

Table 2.
Recommended bandwidth for meetings and webinar panelists (Mbps).
Furthermore, there has been a growing trend of applying Virtual Reality (VR) technology to support online education [13]. VR has demonstrated advantages such as more realistic and vivid classroom-like teaching scenes. It can simulate different physical, biological, and chemical processes in a virtual environment, and allow students to conduct various experiments that may be difficult, dangerous, costly, or infeasible to operate. However, the gigantic amount of real-time video data transfer needed to support immersive 360° video experience requires enormous bandwidth demands [14]. Even low-resolution 360° experience (which most VR headsets offer) requires at least 25 Mbps network bandwidth, as shown in Figure 1. To achieve a resolution comparable to that in HDTV, the bandwidth needs to be up to 80–100 Mbps [14]. The best “retina” 360° video experience (comparable to 4k TV) would demand 600 Mbps bandwidth [14].
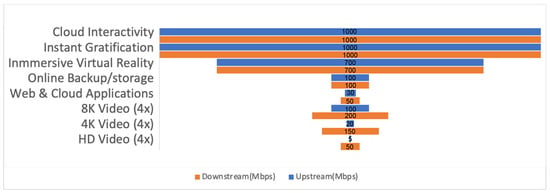
Figure 1.
VR bandwidth needs in Mbps.
2.3. Bandwith Needs for Telehealth
Telehealth encompasses the delivery and distribution of medical services and data utilizing advanced information technologies such as the Internet of Things (IoT) and cloud computing, which are expected to substantively enhance the efficiency, convenience, safety, and quality of healthcare services [15]. Essential functionalities inherent to telehealth encompass online appointment scheduling, hospital-based physician inquiries, online medical consultations, video-based consultations, electronic report dissemination, test sheet interpretation, disease inquiry, and pharmaceutical prescription. Among these functionalities, the roles played by video consultations becomes pivotal. Both healthcare providers and patients necessitate expeditious and secure internet connections to ensure seamless transmission of video and audio, thereby fostering efficient and effective remote healthcare consultations. Consequently, the bandwidth requirements established for video-centric smart education, as discussed in the preceding subsection, are equally germane to the domain of telehealth applications. To achieve a satisfactory video consultation experience, a minimum network bandwidth of 10 megabits per second (Mbps) downstream and 5 Mbps upstream is imperative [16].
3. Roles of Wireless Networks on Resolving Rural Smart Divide
In this section, to elucidate the benefits of wireless broadband in ameliorating the rural digital divide, this study conducted a comprehensive comparative analysis, juxtaposing wireless broadband against its fixed counterpart in relation to three key dimensions: affordability, accessibility, and performance. In addition, we summarized current limitations on supporting high-quality wireless broadband services in rural areas.
In the pursuit of closing the divide in the future, it is important to acknowledge the ongoing efforts by the Federal Communications Commission (FCC), which has designated rural broadband as a top priority and has actively supported numerous broadband funding initiatives. These initiatives aim to extend access to communication and broadband services to a wider spectrum of the American population. Nonetheless, it remains a grim reality that, despite these initiatives, some regions and communities continue to experience an absence of sufficient broadband coverage.
3.1. Affordability
The affordability of fixed and mobile wireless network services can be compared with the concept of “cost to own”, i.e., users’ costs to use the service. However, there are several challenges to address in terms of their price.
First, it is essential to recognize that fixed and mobile wireless network services are dispensed by distinct providers, each frequently embracing divergent pricing methodologies and service provisions. Notably, these variances encompass not only the monthly expenditures but also ancillary facets such as the usage limits or lock-in contracts [17]. Additionally, mobile wireless plans frequently include bundled services, such as voice calls and text messaging. Thus, undertaking a direct comparison of data services between mobile wireless and fixed broadband plans proves to be unviable within the context of this assessment.
Second, utilizing current price data poses a challenge when attempting to estimate the future affordability of fixed and mobile wireless network services within rural locales. The intricacies of cost structures for service provision in rural areas markedly diverge from those observed in more urbanized and developed regions. Specifically, the following provisions are generally required to service broadband in an area [18]:
- Establish high-speed ISP connection at your location.
- Install ground cables for local access at the service location.
- Employ skilled workforce for system maintenance.
- Build network backbone for local, regional, and national connectivity.
- Upgrade network when ISP reaches capacity.
As a result, providing broadband services to rural areas tends to incur higher expenditure cost. Thus, we opt to undertake a comparative analysis of price differentials across distinct geographic regions, juxtaposed with the nationwide average pricing for broadband services [19]. The former elucidates the prospective cost dynamics associated with extending services to rural locales, while the latter furnishes insights into the prevailing costs of both fixed and wireless broadband services, which have significant presence in rural areas in United States.
Figure 2 illustrates the varying costs residents incur for fixed broadband services per Mbps across different U.S. states in 2020 [17]. Notably, a significant imbalance exists, with states characterized by extensive rural regions (e.g., those in the Midwest) tending to have higher costs compared to states with predominantly urban areas (e.g., those along the coast). Despite recent reductions in per-megabit service prices [20], this regional imbalance persists. Additionally, as detailed in Table 3, our case study (refer to Section 4) highlights that the two cities under examination experience relatively more expensive internet services when compared to the five largest cities in the United States [21].
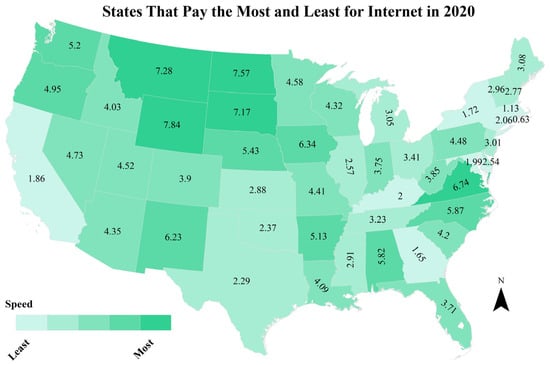
Figure 2.
State Internet costs (in USD) per megabit in 2020.

Table 3.
Two cities network prices comparing with 5 large cities.
On the other hand, Wireless broadband service prices exhibit comparatively less variation. Leading U.S. cellular service providers like Verizon, AT&T, and T-Mobile offer consistent pricing that extends to over 90% of the nation’s population [22]. This stability is partly due to the inherent nature of mobile networks, which provide continuous connectivity and service as people move across diverse geographic regions. This trend suggests that the affordability of wireless broadband contributes to narrowing the affordability gap between urban and less-developed rural areas.
Moreover, according to the study [23], the average monthly costs of various types of Internet services in U.S. are as follows: USD 91.89 for Cable Internet, USD 92.75 for Fiber Internet, USD 99.99 for Satellite Internet, and USD 62.00 for Wireless Internet. These data highlight that, on average, wireless internet tends to be a more cost-effective option. Considering both the consistency of pricing and the national average costs, we contend that wireless networks offer significant advantages in terms of affordability, making them a promising solution for bridging the smart infrastructural divide between urban and rural areas.
3.2. Accessibility
Addressing accessibility is crucial when tackling smart infrastructural divide challenges. In this context, we direct our attention towards the accessibility of fixed and wireless broadband services within the United States. To gauge this accessibility, we employ the deployment ratio as our comparative metric. This ratio signifies the percentage of the population with access to broadband services, irrespective of affordability considerations [24].
To define fixed Internet service as broadband, we adhere to the Federal Communications Commission (FCC) criterion, requiring speeds of at least 25/3 Mbps (download/upload) [25]. Conversely, as our representative wireless broadband service, we have chosen the 4G LTE mobile network. This choice is informed by the fact that 4G LTE represents the first generation of cellular networks capable of delivering broadband-level speeds. Figure 3 illustrates the deployment ratios of fixed broadband services and the Mobile 4G LTE network in the United States.

Figure 3.
Deployment ratio of fixed broadband services and the Mobile 4G LTE network in US.
As depicted in Figure 3, by the end of 2019, 95.6% of the U.S. population had access to fixed broadband services, marking an increase from 94.4% in 2018 [26]. However, this percentage dropped to 82.7% for rural areas and further to 79.1% for tribal lands. This implies that approximately 20% of Americans residing outside urban areas lacked access to fixed broadband services. Conversely, the deployment ratio for 4G LTE across the entire U.S. reached 97.4% by the end of 2019, rising from 93.8% in 2018. Notably, in contrast to fixed broadband services, the 4G LTE network exhibited higher accessibility in rural areas, with a deployment ratio of 90.8% [26].
Of greater significance, Figure 3 reveals a substantial increase in the deployment ratio of the 4G LTE network, rising from 82.2% to 97.4% over a five-year period culminating in 2019, while fixed broadband service increased from 89.9% to 95.6% within the same timeframe. This underscores the ability of 4G LTE networks, and cellular networks in general, to rapidly expand their services to the American populace [27]. A closer examination of the deployment ratio breakdown in urban and rural areas reveals that this advancement was mainly achieved in rural regions, aligning with our expectations. In light of this data, it becomes evident that wireless mobile broadband holds a distinct advantage in terms of accessibility when compared to fixed broadband.
3.3. Performance
Three commonly adopted fixed broadband technologies—DSL, Cable, and Fiber—offer varying speed ranges as shown in Table 4, with Fiber broadband providing the fastest speeds. Fiber broadband has seen significant advancements in recent years, with AT&T introducing a 5Gbps Fiber broadband service in the US since late 2022 [28]. On the other hand, wireless broadband services primarily rely on cellular technologies like 4G LTE and 5G. A 2021 report [29] indicated that the average download and upload speeds for 4G LTE services from major US carriers ranged from 10 to 30 Mbps and 7 to 15 Mbps, respectively. While the latest 5G cellular service boasts a theoretical maximum speed of 20 Gbps, practical speeds in the US currently hover around 50–150 Mbps [30], and its coverage remains somewhat limited. This substantial speed gap between fixed and wireless broadband services is a global trend. Worldwide, the average download and upload speeds for mobile broadband are approximately 42 Mbps and 10.3 Mbps, respectively, while fixed broadband averages around 80.1 Mbps and 30.1 Mbps, respectively [31].

Table 4.
Speed range of fixed broadband technologies (Mbps).
With these data in mind, it is widely recognized that fixed broadband currently offers significantly higher average bandwidth than wireless broadband. However, it is important to note that wireless broadband can easily deliver network bandwidth exceeding 10 Mbps, making it suitable for a wide range of smart applications, including video streaming, deployable in rural areas. Moreover, given the ultra-high theoretical speeds of 5G technology, we believe that while not matching the speed of fixed broadband, wireless broadband holds substantial potential to bridge the rural smart divide effectively.
3.4. Flexibility
In general, wireless networks offer far greater flexibility than their wired counterparts. With wireless networks, users can maintain Internet connectivity through wireless access points (APs) while on the move. This is because wireless signals transmit over the air and can penetrate common obstacles like buildings, vehicles, and trees. The service range of an AP varies depending on the technology: typically, around 100 m for WiFi, 3 to 5 km for 4G LTE, and extending to thousands of kilometers for satellite Internet [32]. Moreover, there have been emerging wireless technologies that do not rely on dedicated APs or spectrums, e.g., ambient scatter [33], cognitive radio networks [34,35]. They would further enhance the flexibility of wireless networks. Such convenience and flexibility translate into reduced infrastructure costs when providing services.
In contrast, wired networks only provide access when the end device is physically connected, such as via a cable to a router. While they deliver reliable and high-speed service, they limit user mobility and involve substantial costs for extending cables and necessary infrastructure to remote locations where service is required.
Considering these factors, we believe that wireless networks hold greater promise for bridging smart infrastructural divide in rural areas. Their combination of reliable service and infrastructure flexibility makes them a compelling choice for expanding connectivity in these regions.
3.5. Challenges and Barriers
In rural areas, the coverage and popularization of networks are facing serious challenges [36].
- Inadequate infrastructure construction. Compared to urban areas, rural regions face significant challenges in infrastructure construction, which contributes to insufficient network coverage. These areas often lack essential infrastructural components like communication towers, supporting equipment, and network lines. Further complicating the issue are topographical challenges, such as mountainous terrain and expansive distances, that hinder the advancement of network infrastructure. Consequently, networks in rural areas are often slower, with weaker signals and unstable connections, negatively affecting the Internet experience of residents.
- High cost. The number of users in rural areas is not only smaller but also more geographically dispersed compared to cities, leading to elevated costs for rural network infrastructure. Establishing such networks demands extensive cabling, equipment, and a considerable investment in both manpower and materials. This high level of investment poses a barrier to achieving comprehensive network coverage in rural areas, presenting challenges akin to those faced in deploying fixed broadband infrastructures.
- Insufficient user base. The majority of residents in many rural areas are older adults who, compared to their urban counterparts, have a reduced demand for network applications. This diminished need for online services is a significant factor hindering the widespread adoption of network infrastructure in rural communities.
4. Case Study
4.1. Study Areas
To demonstrate challenges and opportunities of the current wireless network infrastructure in rural regions, we collected wireless network quality data in two rural towns in Southern Illinois, Carbondale and Cairo, as shown in Figure 4. Carbondale is the largest city in Southern Illinois, with a population of 21,857 in 2020. Cairo, located at the southernmost tip of Illinois, is the only city in the state that surrounds a flood levee. It had a total population of 1733 in 2020. Both communities in their entirety or partly had extreme poverty, defined as a poverty rate of 40.0 percent or more for the period 2015–2019.
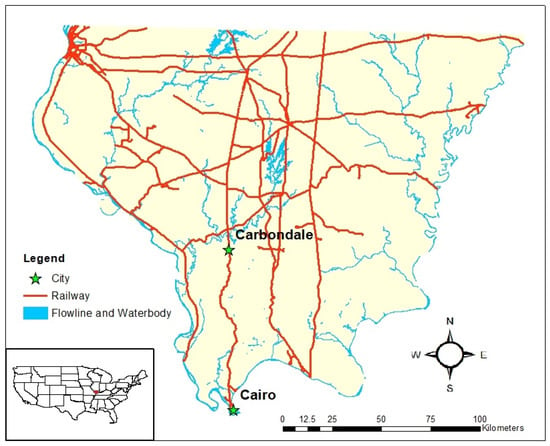
Figure 4.
Map of the studying areas.
4.2. On-Site Speed Testing
Network speed is a critical indicator of wireless network infrastructure performance, and it can be influenced by several key factors [37]:
- Network Standard: The type of network standard in use, such as 3G, 4G, or 5G, plays a pivotal role. Each standard offers different network capabilities. For instance, 5G networks typically provide faster speeds compared to 4G, and 4G surpasses the speeds of 3G.
- Mobile Phone Performance: The performance of mobile phones varies significantly based on both software and hardware factors. Different models and brands can deliver varying network speeds.
- Variable Wireless Environments: Even when utilizing the same network standard as 4G or 5G, the network speed experienced by a mobile device can differ across locations due to variations in wireless coverage. Factors like signal strength and interference affect speed.
- Concurrent users: The number of users simultaneously accessing the network through the same base station has a direct impact on network speed. High user traffic during peak times can lead to slower network speeds.
- Server performance: The performance of the servers responsible for delivering network services also plays a crucial role in determining network speed.
- Subscription Plans: The speed experienced by users can vary based on their chosen subscription plans. Different plans often come with varying levels of maximum bandwidth allocation, which directly influences the speed at which users can access the network.
4.2.1. Testing Software and Hardware
To accurately measure mobile wireless network speed, we created an Android application capable of assessing real-time network performance from the perspective of user experiences. The graphical user interface (GUI) of our testing application is depicted in Figure 5. We developed the app using Ookla’s internet speed service as the underlying framework [38]. The application conducts download and upload tests, each lasting 15 s. Upon completion of these tests, the app calculates the network speed by analyzing the volume of data downloaded and uploaded during the specified time frame.
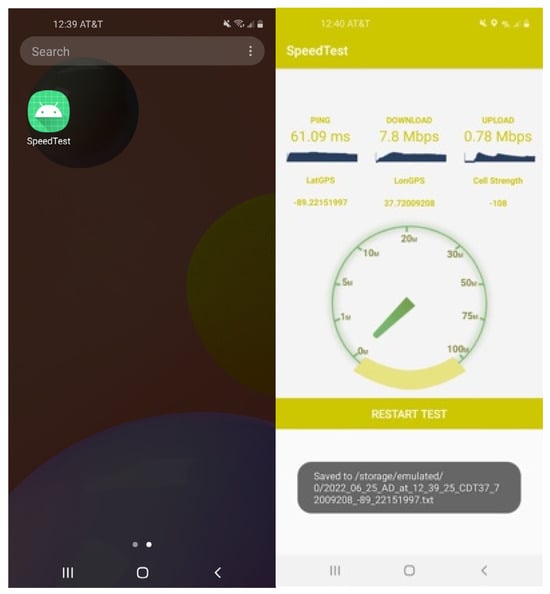
Figure 5.
GUI of the internet speed testing APP.
Using our custom-developed app, we conducted mobile network quality tests on three identical Samsung A11 smartphones, each connected to a different service provider: AT&T, T-Mobile, and Verizon. Speed measurements were carried out in both Carbondale and Cairo.
4.2.2. Performance Measurement
In our study, we focused on two primary metrics to evaluate network performance: network speed and Reference Signal Received Power (RSRP) [39].
Network speed serves as the most critical performance index for assessing network quality. It indicates the rate at which data are transmitted from a host computer to a computer network over a digital channel. Within the realm of network speed, we specifically measured two different types: upload speed and download speed [40]. Bandwidth, often considered the most intuitive indicator of network quality, refers to the maximum amount of data that can be transmitted through the network per unit time [40].
In addition to network speed, we also utilized RSRP as a key performance indicator. RSRP is measured in decibels milliwatts (dBm), ranging from 0dBm (indicating the best signal) to −110 dBm (indicating the weakest or no signal). RSRP characterizes the strength of the wireless signal in an LTE network and is a requirement for physical layer measurements) [39]. It is the average value of the received signal power over all Resource Elements (REs) carrying a reference signal within a specific symbol. Although some devices display Received Signal Strength Indicator (RSSI) alongside RSRP for LTE connections, RSRP is generally considered a more accurate measure of signal strength. Table 5 shows how different ranges of RSRP correspond to differential signal strength. Our case studies followed the steps shown in Figure 6.

Table 5.
Speed rang of fixed broadband technologies (Mbps) [41].
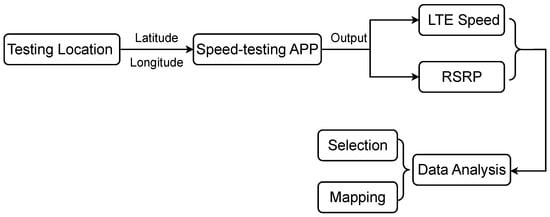
Figure 6.
Flowchart showing data collection and analyses in the case study.
4.3. Testing Results
To avoid unintended debate on service quality comparison (which is irrelevant to this paper), we used Provider 1, 2, and 3 as pseudo names to represent the three major service providers in the testing area that were adopted in this study. To better present the results, we visualize the speed measurement results on city maps (i.e., Figure 7, Figure 8, Figure 9, Figure 10, Figure 11 and Figure 12) and use tables to present aggregated data at the census block level (i.e., Table 6 and Table 7).
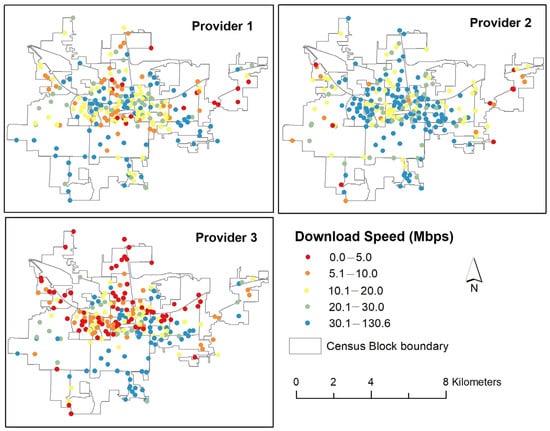
Figure 7.
Download speed of three carriers in Carbondale.
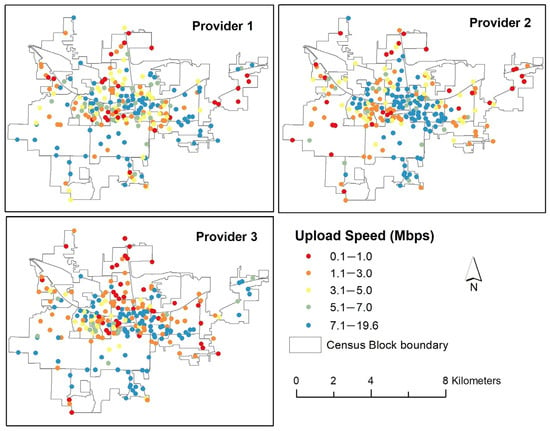
Figure 8.
Upload speed of three carriers in Carbondale.
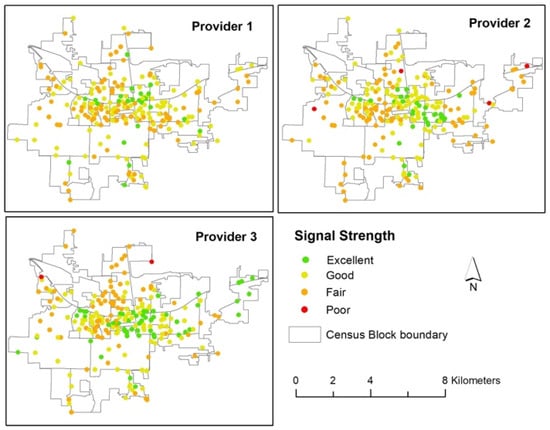
Figure 9.
Signal strength of three carriers in Carbondale.
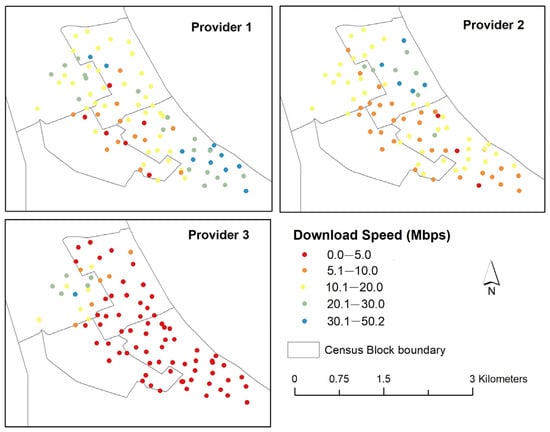
Figure 10.
Download speed of three carriers in Cairo.
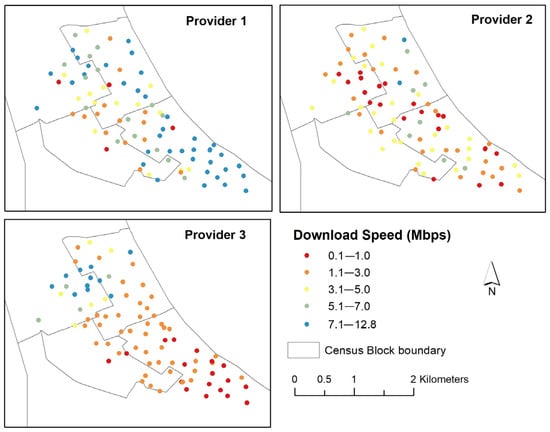
Figure 11.
Upload speed of three carriers in Cairo.
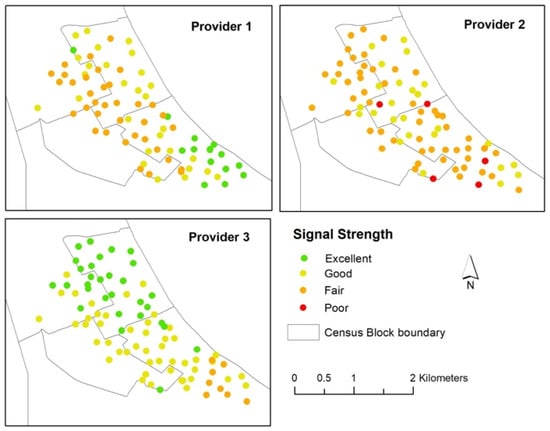
Figure 12.
Signal strength of three carriers in Cairo.

Table 6.
Statistics of aggregated download and upload speed by census blocks in Carbondale.

Table 7.
Statistics of aggregated download and upload speed by census blocks in Cairo.
4.3.1. Carbondale Testing Outcomes
Figure 7, Figure 8 and Figure 9 present the download speed, upload speed, and signal strength of the three carrier providers measured in Carbondale. Figure 7 and Figure 8 suggest that the overall download/upload speeds in Carbondale were acceptable. For all three providers, we measured more than 20 Mbps download speed and more than 4 Mbps upload speed (along with decent signal strengths) in many areas. However, such speeds are still lower than state and national averages. The average download speed in Carbondale is 24.68 Mbps, which is 68.4% of the Illinois average and 90.2% of the national average [28].
Based on Figure 7 and Figure 8, it is evident that specific regions, such as the central and southeast parts of the city, consistently exhibit high bandwidth across all three providers, as indicated by blue and grey dots representing high bandwidth levels. This uneven distribution suggests that wireless broadband service is not equitably available throughout the city. When considered alongside our measurements of signal strength, it appears that these disparities arise from inadequate network infrastructure coverage. Interestingly, although there are 18 internet providers serving the area, 19% of Carbondale residents still face limited options for wired broadband services [28].
To provide a more accurate depiction of measured network speeds, we have compiled statistics across 30 census blocks in Table 6. While the average speed largely complies with household broadband requirements as set forth by the FCC Speed Guide [27], there are regions that fail to meet the minimum speed criteria for specific tasks, such as telecommuting and HD video conferencing. Additionally, the high standard deviation in network speed corroborates our earlier observations about uneven service distribution. Such disparities can limit the ability of residents in certain communities to effectively use smart applications for educational and professional activities.
4.3.2. Cairo Testing Outcomes
Cairo, another city in southern Illinois, has just a tenth of Carbondale’s population. FCC records reveal that there is no wired broadband internet available for residential addresses in Cairo. The most common form of internet access available to residents is wireless broadband from towers. Typically, residents have limited options, with only 1–2 internet service providers to choose from.
Figure 10, Figure 11 and Figure 12 depict the download speed, upload speed, and signal strength for the three carrier providers as measured in Cairo. Across all providers, the overall network speed in Cairo is notably low, with the majority of measurement locations registering less than 20 Mbps for download speed and 4 Mbps for upload speed. Despite this, the signal strength was generally strong at most measurement locations. These findings highlight the limitations in Cairo’s network infrastructure capabilities.
We have summarized the speed statistics in Table 7, revealing that network speeds in Cairo are generally lower than those in Carbondale. These speeds are sufficient only for the most basic functionalities of smart applications. Interestingly, we observed that the variations in service across different census blocks and among different service providers in Cairo are less pronounced than in Carbondale. This is likely attributable to uniformly weak infrastructure throughout the city.
4.4. Summary and Comparison
In a detailed analysis comparing broadband speeds in Carbondale and Cairo, we discovered that the network capabilities in both locations are marginally adequate for current and future data-intensive smart applications, primarily due to their constrained infrastructural resources. This limitation is likely influenced by the less-developed socio-economic conditions prevalent in rural settings.
We noted that Carbondale generally has superior average network speeds compared to Cairo. Although Cairo’s network quality might seem satisfactory when assessed solely based on Reference Signal Received Power (RSRP), it lags considerably behind Carbondale in terms of overall 4G wireless network quality. This disparity may be a result of limited signal tower coverage overlap and minimal interference between 4G grids in Cairo. Additionally, within each town, network service quality varies; for instance, some areas in Carbondale consistently outperform others across all three providers studied, underscoring the existing infrastructural and customer-based inequalities within the town.
Intriguingly, our results also suggest that a high RSRP level does not automatically imply exceptional network performance. This could be attributed to a range of factors, both technical and commercial. For example, the quality of 4G network service is more closely associated with the Signal to Interference plus Noise Ratio (SINR), and some regions may suffer from outdated or poorly maintained infrastructure.
In summary, our study indicates a pressing need for both towns to invest in improved ICT infrastructure to support high-quality wireless broadband services and bridge the ‘smart divide’ with urban areas.
5. Technology and Policy Solutions
As stated earlier, wireless networks present a high potential to bridge the rural smart divide, though it has some limitations in comparison with wired broadband technologies. To advance wireless network infrastructures for addressing rural smart divide, we need the support from the next-generation wireless technologies and governmental broadband policies.
5.1. Technology Support
While there are many novel future wireless broadband technologies, we primarily discussed two most popular representatives in this paper, i.e., Starlink and 5G, due to their high potentials. Starlink’s satellite-based Internet service has the potential to bridge the smart divide in rural areas by providing high-speed, low-latency connectivity without the need for extensive ground infrastructure [42]. This can stimulate economic development, improve access to resources, and offer a competitively priced, rapidly deployable solution. On the other hand, 5G technology offers high data speeds, low latency, and large connection capacities, with applications ranging from enhanced mobile broadband to industrial automation and smart cities [43]. Both technologies are poised to significantly impact various sectors, including those in rural and remote areas.
The Starlink project, run by SpaceX, aims to offer high-speed Internet globally through a network of low-orbit satellites. Unlike traditional satellite Internet, which uses geosynchronous-orbit satellites, Starlink offers lower latency and higher bandwidth due to the shorter distance between satellites and end devices. As of the end of 2023, the service is available in several countries and is expanding rapidly as more satellites are launched. Current download speeds range from 50 Mbps to 250 Mbps. Once fully operational, Starlink will offer global coverage and significantly reduce infrastructure needs for providing broadband in rural and remote areas, requiring only reception equipment.
5G is the latest generation of mobile communication technology, featuring high speed, low latency, and the ability to handle a large number of connections. The International Telecommunication Union (ITU) identifies three main application scenarios [43] for 5G: enhanced mobile broadband (eMBB) for better mobile internet experience, ultra-reliable and low-latency communications (uRLLC) for applications like industrial control and telemedicine, and massive machine-type communications (mMTC) for smart cities and environmental monitoring. Traditional 5G deployment relies on a dense network of small cells, which may be economically unfeasible in low-population areas. However, low-band spectrum can cover larger areas and may be more suitable for rural deployment [44]. For example, low-latency, high-speed 5G can also improve access to remote healthcare and educational resources, which are often limited in rural areas.
5.2. Policy Support
Compared with urban counterparts, rural areas generally need more support to address long-standing digital divide and smart infrastructural divide. Smaller cities, which are often rural and mostly with 10,000 households or less, are especially vulnerable to the divide [45]. Established and innovative policy supports are critical to close the divide.
Federal and state support is vital to broadband infrastructure deployment in rural areas because capital costs per potential customer are very high resulting in low or nonexistent returns on investment. Prior to COVID19 pandemic, the Federal Communications Commission (FCC)’s Rural Digital Opportunity Fund (RDOF) mainly provided funding to broadband service providers in rural areas. During the pandemic, the Coronavirus Aid, Relief, and Economic Security (CARES) Act allocates billions of dollars for distance learning, telehealth, and remote work requiring enhanced broadband infrastructure [46]. The Infrastructure Investment and Jobs Act remarkably expands federal investment into rural areas where households have historically lower access to broadband through federal programs administered by administered by the U.S. Department of Commerce’s National Telecommunications and Information Administration (NTIA), the FCC, and the U.S. Department of Agriculture [47]. At the state level, almost every state has in-state programs for supporting broadband development. For example, Illinois Office of Broadband administers the Connect Illinois Broadband Infrastructure Grant Program. Many states’ broadband grant programs explicitly request and reward those consider affordability, digital equity, and economic development [48]. Sometimes, these state programs were implemented via Public Private Partnerships (PPP).
6. Conclusions
The paper delves into the intricate challenges posed by the digital divide and the evolving smart divide, specifically focusing on their pronounced impact in rural regions of the United States. It places an emphasis on the critical role of wireless network infrastructure in bridging the divide within rural America. To provide tangible evidence of the disparities prevalent in the current wireless broadband landscape, we undertook a comprehensive case study in Carbondale and Cairo—two rural towns situated in Southern Illinois. Through the development of a self-engineered network speed testing smartphone app, we gained insights into the performance of the networks from three commonly used wireless providers. The results unveiled an intriguing trend wherein larger towns with more substantial population bases tended to surpass their smaller counterparts in terms of wireless broadband speed, quality, and accessibility. We also found that there is substantial variability on network performances within census blocks in both towns, underscoring the substantial geographical inconsistency in wireless broadband quality. In light of these findings, our recommendations for addressing this persistent wireless infrastructure disparity extend beyond mere technological solutions. We advocate for a holistic approach that encompasses not only technological advancements but also strategic investments, all targeted towards ameliorating the growing smart infrastructural divide.
We acknowledge that the scope of our research, including the data and measurements, is limited, leaving some questions unanswered. Moving forward, we aim to further research the relationship between wireless network infrastructures and the rural ‘smart divide’ by incorporating more comprehensive data, policy analyses, and measurements from a wider range of geographical locations.
Author Contributions
Conceptualization, X.C., K.C., M.W. and R.L.; methodology, X.C., K.C., M.W. and R.L.; software, X.C. and M.W.; validation, K.C. and R.L.; formal analysis X.C., K.C., M.W. and R.L.; investigation, X.C. and M.W.; resources, X.C., K.C., M.W. and R.L.; data curation, X.C. and M.W.; writing—original draft preparation, X.C. and M.W.; writing—review and editing, K.C. and R.L.; visualization, X.C., M.W. and R.L.; supervision, K.C. and R.L.; project administration, K.C. and R.L.; funding acquisition, K.C. and R.L. All authors have read and agreed to the published version of the manuscript.
Funding
This research was funded by the National Science Foundation [grant # 2122092].
Data Availability Statement
Not applicable.
Acknowledgments
We appreciate the funding support from the National Science Foundation [grant # 2122092].
Conflicts of Interest
Kang Chen currently is a full-time software engineer at Google Inc. and an Adjunct Associate Professor at SIUC.
References
- Ruparelia, N.B. Cloud Computing; Mit Press: Cambridge, MA, USA, 2023. [Google Scholar]
- Balaji, S.; Nathani, K.; Santhakumar, R. IoT technology, applications and challenges: A contemporary survey. Wirel. Pers. Commun. 2019, 108, 363–388. [Google Scholar] [CrossRef]
- Van Dijk, J.A. Digital divide research, achievements and shortcomings. Poetics 2006, 34, 221–235. [Google Scholar] [CrossRef]
- Li, R.; Chen, K.; Wu, D. Challenges and opportunities for coping with the smart divide in rural America. Ann. Am. Assoc. Geogr. 2020, 110, 559–570. [Google Scholar] [CrossRef]
- U.S. Government Accountability Office (GAO). Projects and Policies Related to Deploying Broadband in Unserved and Underserved Areas. 2014. Available online: https://www.gao.gov/assets/gao-14-409.pdf (accessed on 1 September 2023).
- Lythreatis, S.; Singh, S.K.; El-Kassar, A.N. The digital divide: A review and future research agenda. Technol. Forecast. Soc. Chang. 2022, 175, 121359. [Google Scholar] [CrossRef]
- Allmann, K.; Blank, G. Rethinking digital skills in the era of compulsory computing: Methods, measurement, policy and theory. Inf. Commun. Soc. 2021, 24, 633–648. [Google Scholar] [CrossRef]
- Ragnedda, M.; Ruiu, M.L.; Addeo, F. The self-reinforcing effect of digital and social exclusion: The inequality loop. Telemat. Inform. 2022, 72, 101852. [Google Scholar] [CrossRef]
- Wielicki, T.; Cavalcanti, G. Study of Digital Divide: Measuring ICT Utilization and Implementation Barriers Among SMEs of Central California. In Business Information Systems–9th International Conference on Business Information Systems (BIS 2006); Gesellschaft für Informatik eV: Bonn, Germany, 2006. [Google Scholar]
- Arendt, L. Barriers to ICT adoption in SMEs: How to bridge the digital divide? J. Syst. Inf. Technol. 2008, 10, 93–108. [Google Scholar] [CrossRef]
- Van De Werfhorst, H.G.; Kessenich, E.; Geven, S. The digital divide in online education: Inequality in digital readiness of students and schools. Comput. Educ. Open 2022, 3, 100100. [Google Scholar] [CrossRef]
- Chang, H.; Varvello, M.; Hao, F.; Mukherjee, S. A tale of three videoconferencing applications: Zoom, Webex, and Meet. IEEE/ACM Trans. Netw. 2022, 30, 2343–2358. [Google Scholar] [CrossRef]
- Reinius, H.; Kaukinen, I.; Korhonen, T.; Juuti, K.; Hakkarainen, K. Teachers as transformative agents in changing school culture. Teach. Teach. Educ. 2022, 120, 103888. [Google Scholar] [CrossRef]
- Feng, X.; Bao, Z.; Wei, S. LiveObj: Object semantics-based viewport prediction for live mobile virtual reality streaming. IEEE Trans. Vis. Comput. Graph. 2021, 27, 2736–2745. [Google Scholar] [CrossRef] [PubMed]
- Makri, A. Bridging the digital divide in health care. Lancet Digit. Health 2019, 1, e204–e205. [Google Scholar] [CrossRef]
- Hassani, H.; Huang, X.; MacFeely, S. Impactful digital twin in the healthcare revolution. Big Data Cogn. Comput. 2022, 6, 83. [Google Scholar] [CrossRef]
- Martin, M.S. The FCC’s national broadband plan. Bus. Lawyer 2010, 66, 255–260. [Google Scholar]
- Warschauer, M. Reconceptualizing the digital divide. First Monday 2002, 7. [Google Scholar] [CrossRef]
- Canfield, C.I.; Ona, E.; Jacob, H.; Suzanna, L. Opportunities and challenges for rural broadband infrastructure investment. In Proceedings of the 2019 International Annual Conference of the American Society for Engineering Management, ASEM, Philadelphia, PA, USA, 23–26 October 2019. [Google Scholar]
- Chakravorti, B. How to Close the Digital Divide in the US. Harvard Business Review, 20 July 2021; 1–10. [Google Scholar]
- Paul, K.; Varghese, A.; Iyer, S.; Ramamurthi, B.; Kumar, A. WiFiRe: Rural area broadband access using the WiFi PHY and a multisector TDD MAC. IEEE Commun. Mag. 2007, 45, 111–119. [Google Scholar] [CrossRef]
- Darbari, F.; Brew, M.; Weiss, S.; Robert, W.S. Practical aspects of broadband access for rural communities using a cost and power efficient multi-hop/relay network. In Proceedings of the 2010 IEEE Globecom Workshops, Miami, FL, USA, 6–10 December 2010; pp. 731–735. [Google Scholar]
- Kumar, A.; Kumar, R.; Rathod, P.; Karandikar, A. How much TV UHF band spectrum is sufficient for rural broadband coverage? In Proceedings of the 2015 13th International Symposium on Modeling and Optimization in Mobile, Ad Hoc, and Wireless Networks (WiOpt), Mumbai, India, 25–19 May 2015; pp. 419–426. [Google Scholar]
- Nandi, S.; Thota, S.; Nag, A.; Divyasukhananda, S.; Goswami, P.; Aravindakshan, A.; Rodriguez, R.; Mukherjee, B. Computing for rural empowerment: Enabled by last-mile telecommunications. IEEE Commun. Mag. 2016, 54, 102–109. [Google Scholar] [CrossRef]
- Gallardo, R. Digital Divide Index; Purdue Center for Regional Development: West Lafayette, IN, USA, 2017. [Google Scholar]
- Reddick, C.G.; Enriquez, R.; Harris, R.J.; Sharma, B. Determinants of broadband access and affordability: An analysis of a community survey on the digital divide. Cities 2020, 106, 102904. [Google Scholar] [CrossRef]
- Federal Communications Commission. 2020 Broadband Deployment Report; Federal Communications Commission: Washington, DC, USA, 2020.
- Average Mobile and Fixed Broadband Download and Upload Speeds Worldwide as of April 2023. Available online: https://www.statista.com/statistics/896779/average-mobile-fixed-broadband-download-upload-speeds/ (accessed on 1 September 2023).
- Broadband Now. Available online: https://broadbandnow.com/guides/dsl-vs-cable-vs-fiber (accessed on 1 September 2023).
- FCC Broadband Speed Guide. Available online: https://www.fcc.gov/consumers/guides/broadband-speed-guide (accessed on 1 September 2023).
- Natalie Gagliordi. Available online: Zdnet.com/article/iot-to-drive-growth-in-connected-devices-through-2022-cisco/ (accessed on 24 March 2020).
- Pahlavan, K.; Krishnamurthy, P. Evolution and impact of Wi-Fi technology and applications: A historical perspective. Int. J. Wirel. Inf. Netw. 2021, 28, 3–19. [Google Scholar] [CrossRef]
- Duan, R.; Wang, X.; Yigitler, H.; Sheikh, M.U.; Jantti, R.; Han, Z. Ambient backscatter communications for future ultra-low-power machine type communications: Challenges, solutions, opportunities, and future research trends. IEEE Commun. Mag. 2020, 58, 42–47. [Google Scholar] [CrossRef]
- Wang, B.; Liu, K.R. Advances in cognitive radio networks: A survey. IEEE J. Sel. Top. Signal Process. 2010, 5, 5–23. [Google Scholar] [CrossRef]
- Zheng, K.; Jia, X.; Chi, K.; Liu, X. DDPG-based joint time and energy management in ambient backscatter-assisted hybrid underlay CRNs. IEEE Trans. Commun. 2022, 71, 441–456. [Google Scholar] [CrossRef]
- Vassilakopoulou, P.; Hustad, E. Bridging the Digital Divide: A literature review and research agenda for information systems research. Inf. Syst. Front. 2023, 3, 955–969. [Google Scholar] [CrossRef] [PubMed]
- Borralho, R.; Mohamed, A.; Quddus, A.U.; Vieira, P.; Tafazolli, R. A survey on coverage enhancement in cellular networks: Challenges and solutions for future deployments. IEEE Commun. Surv. Tutor. 2021, 23, 1302–1341. [Google Scholar] [CrossRef]
- Paul, U.; Liu, J.; Adarsh, V.; Gu, M.; Gupta, A.; Belding, E. Characterizing performance inequity across us Ookla speedtest users. arXiv 2021, arXiv:2110.12038. [Google Scholar]
- Putra, G.M.; Budiman, E.; Malewa, Y.; Cahyadi, D.; Taruk, M.; Hairah, U. 4G LTE Experience: Reference Signal Received Power, Noise Ratio and Quality. In Proceedings of the 2021 3rd East Indonesia Conference on Computer and Information Technology (EIConCIT), Surabaya, Indonesia, 9–11 April 2021; pp. 139–144. [Google Scholar]
- Sarr, C.; Chaudet, C.; Chelius, G.; Lassous, I.G. Bandwidth estimation for IEEE 802.11-based ad hoc networks. IEEE Trans. Mob. Comput. 2008, 7, 1228–1241. [Google Scholar] [CrossRef]
- Zhang, F.; Li, M.; Zhang, X.; Wang, Z.; Fan, W. Achieving wireless cable testing for mimo terminals based on maximum rsrp measurement. IEEE Trans. Antennas Propag. 2022, 70, 7084–7093. [Google Scholar] [CrossRef]
- McDowell, J.C. The low earth orbit satellite population and impacts of the SpaceX Starlink constellation. Astrophys. J. Lett. 2020, 892, L36. [Google Scholar] [CrossRef]
- Ateya, A.A.; Muthanna, A.; Makolkina, M.; Koucheryavy, A. Study of 5G services standardization: Specifications and requirements. In Proceedings of the 2018 10th international congress on ultra-modern telecommunications and control systems and workshops (ICUMT), Moscow, Russia, 5–9 November 2018; pp. 1–6. [Google Scholar]
- Noohani, M.Z.; Magsi, K.U. A review of 5G technology: Architecture, security and wide applications. Int. Res. J. Eng. Technol. (IRJET) 2020, 7, 3440–3471. [Google Scholar]
- Broadband Models for Unserved and Underserved Communities. Available online: https://www.us-ignite.org/wp-content/uploads/2020/07/USIgnite_Altman-Solon_Whitepaper-on-Broadband-Models_FINAL_7-9-2020.pdf (accessed on 1 September 2023).
- Hovis, J.; Baller, J.; Talbot, D.; Blake, C. Public Infrastructure/Private Service: A Shared-Risk Partnership Model for 21st Century Broadband Infrastructure. Benton Institute for Broadband & Society. 2020. Available online: http://benton.org/publications/public-infrastructure-prvate-service (accessed on 1 September 2023).
- Infrastructure Investment and Jobs Act: Funding for USDA Rural Broadband Programs. Available online: https://crsreports.congress.gov/product/pdf/IF/IF11918 (accessed on 1 September 2023).
- Sherman, R.; Hovis, J.; Levin, J. Putting State Broadband Funds to Work. Available online: https://www.benton.org/sites/default/files/state-funds-final.pdf (accessed on 1 September 2023).
Disclaimer/Publisher’s Note: The statements, opinions and data contained in all publications are solely those of the individual author(s) and contributor(s) and not of MDPI and/or the editor(s). MDPI and/or the editor(s) disclaim responsibility for any injury to people or property resulting from any ideas, methods, instructions or products referred to in the content. |
© 2023 by the authors. Licensee MDPI, Basel, Switzerland. This article is an open access article distributed under the terms and conditions of the Creative Commons Attribution (CC BY) license (https://creativecommons.org/licenses/by/4.0/).