
Shrinkage of Micro-Synthetic Fiber-Reinforced Mortar


Abstract
1. Introduction
2. Shrinkage Prediction Models
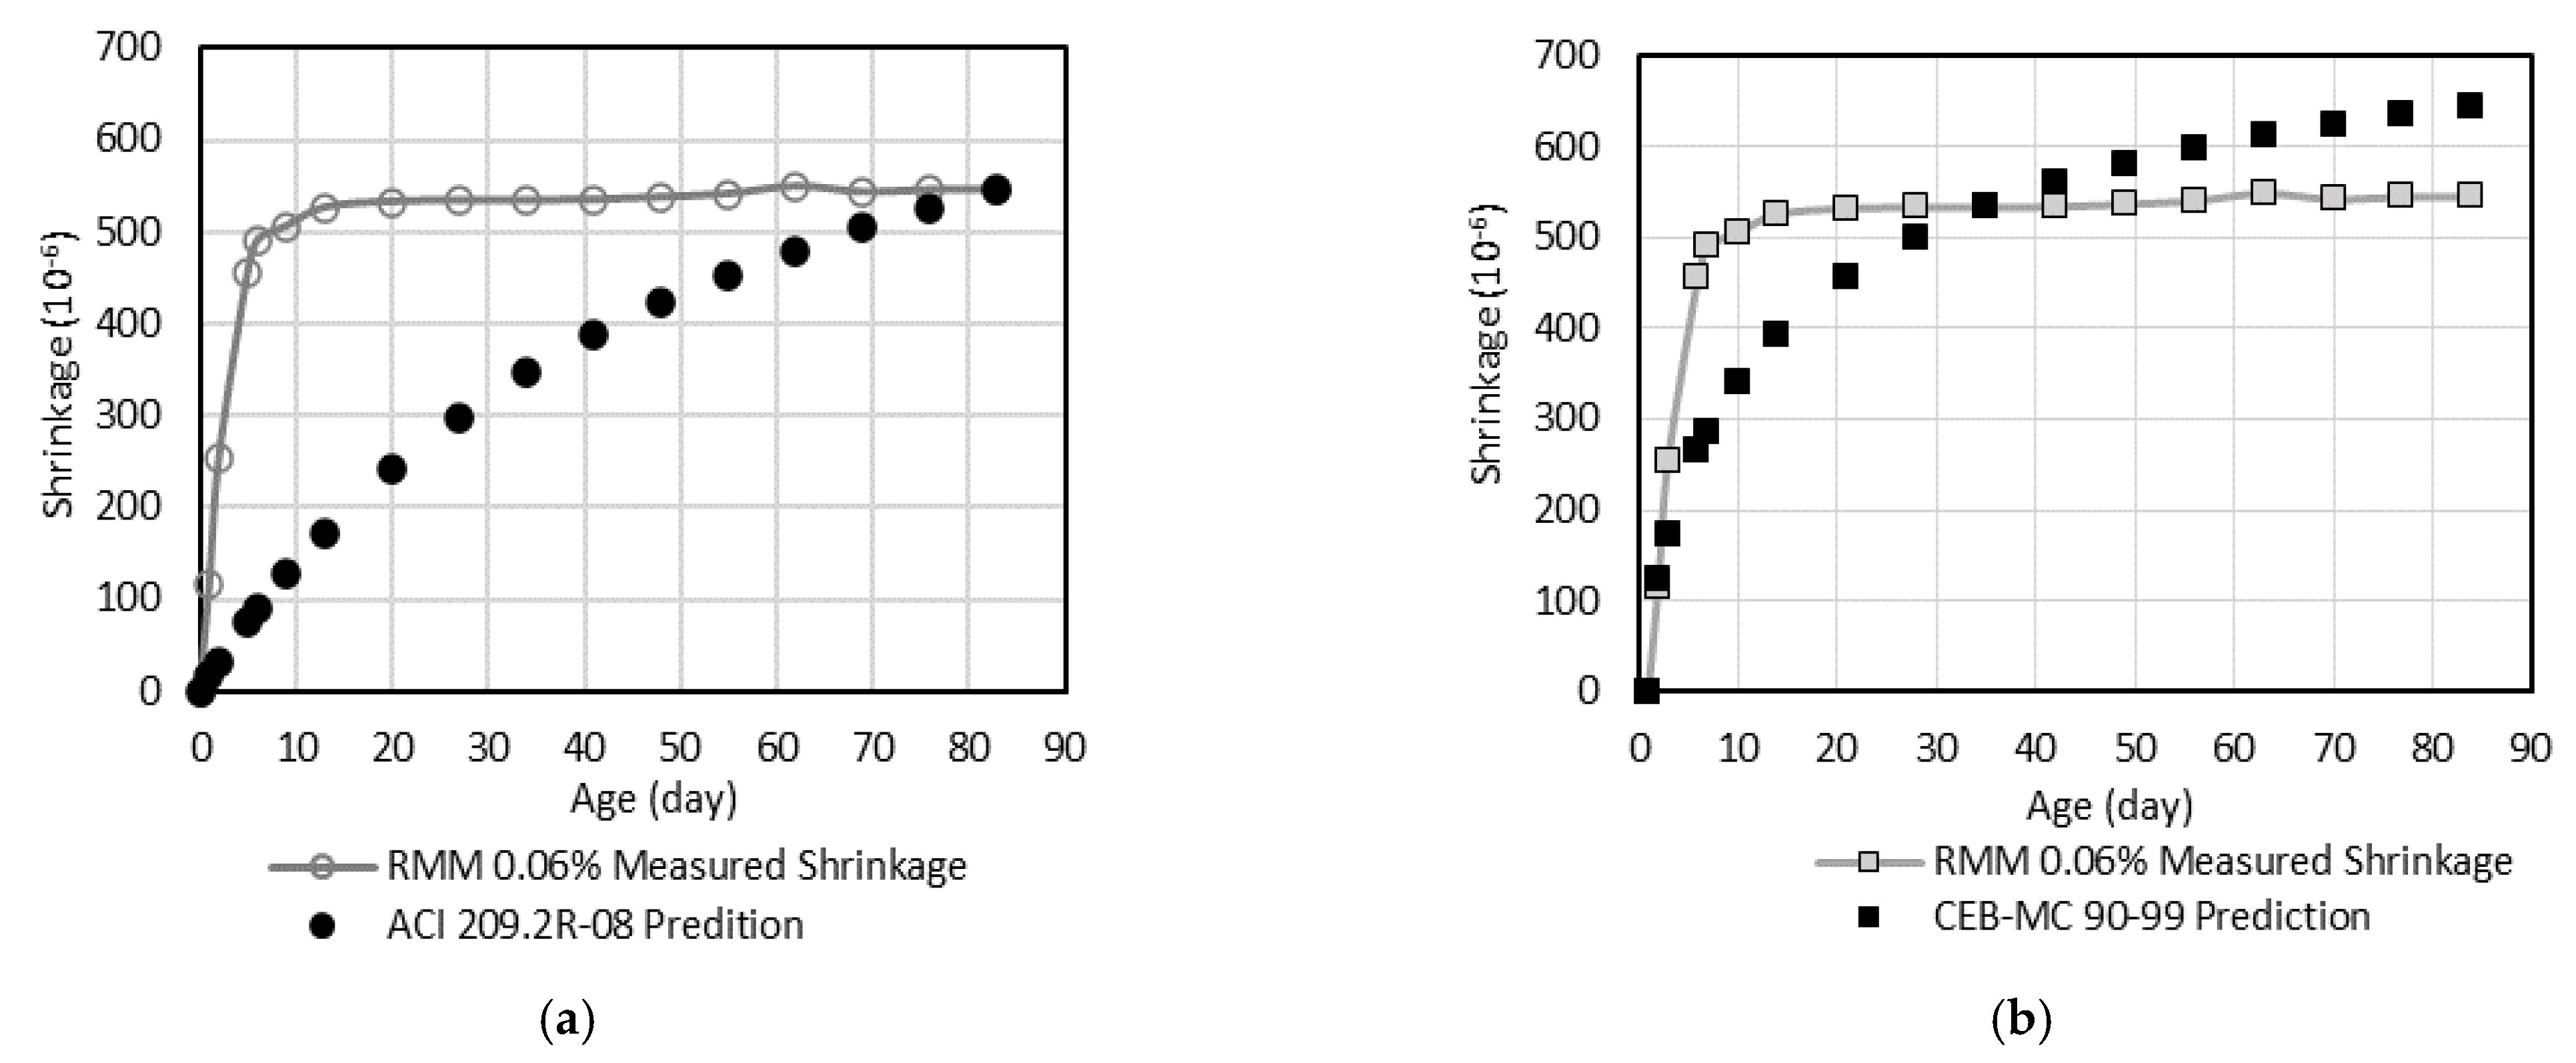
- (a)
- ACI 209.2R-08
- (b)
- CEB-MC 90-99
3. Materials and Method
3.1. Mix Proportion
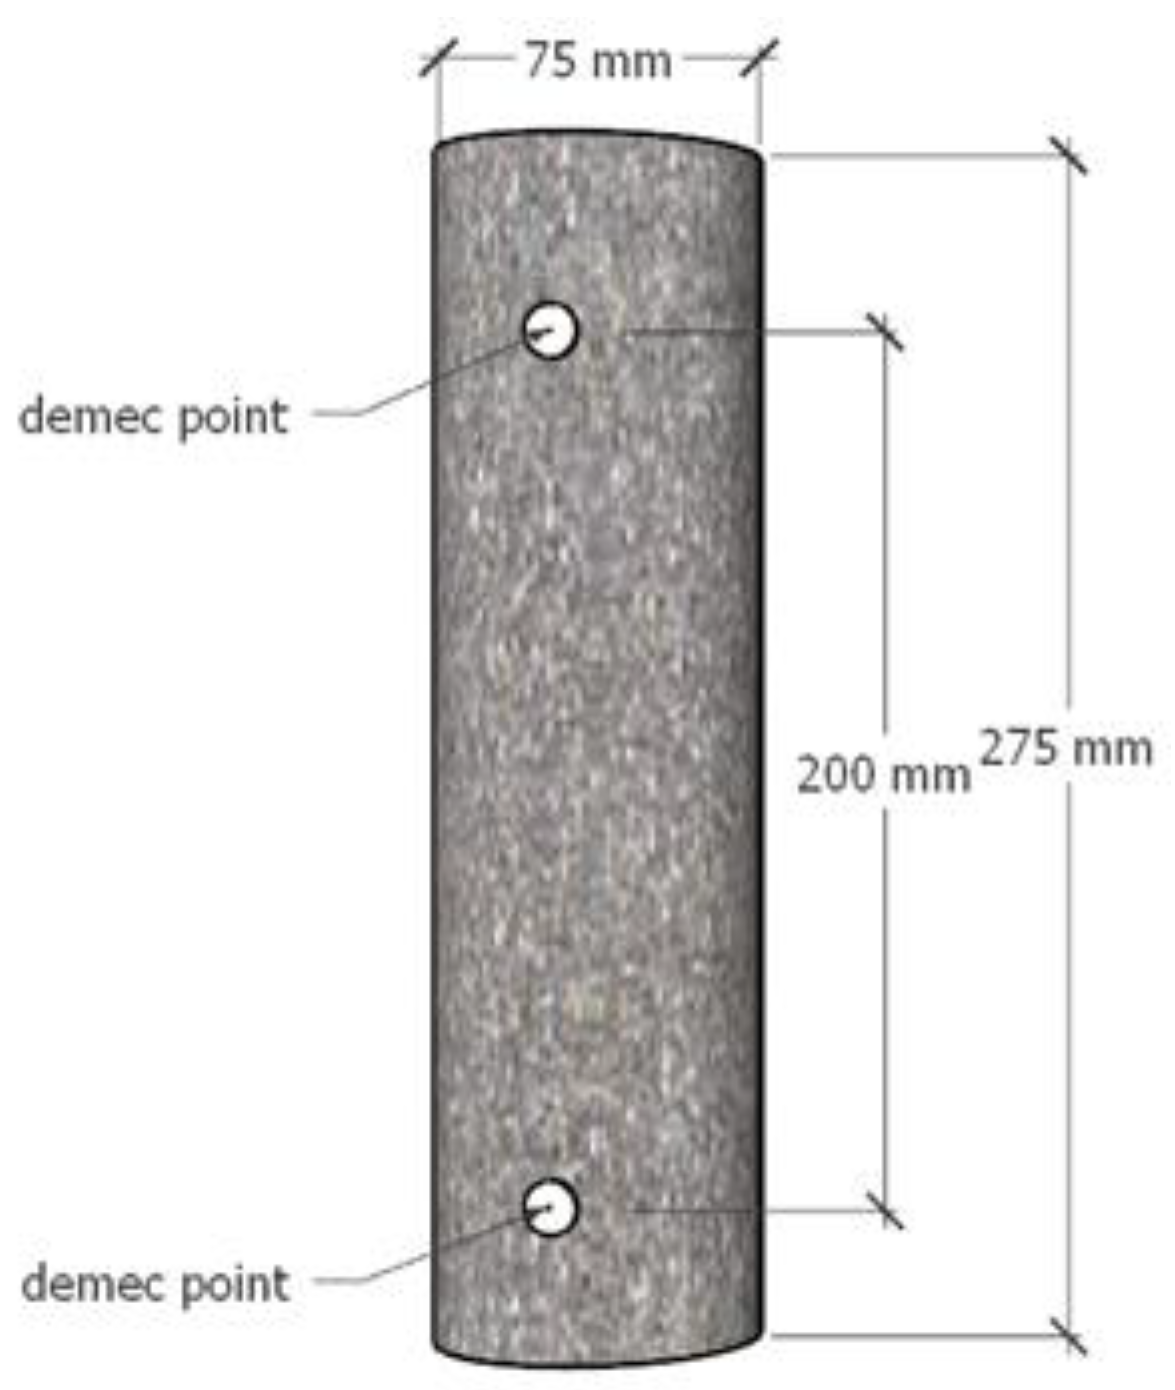
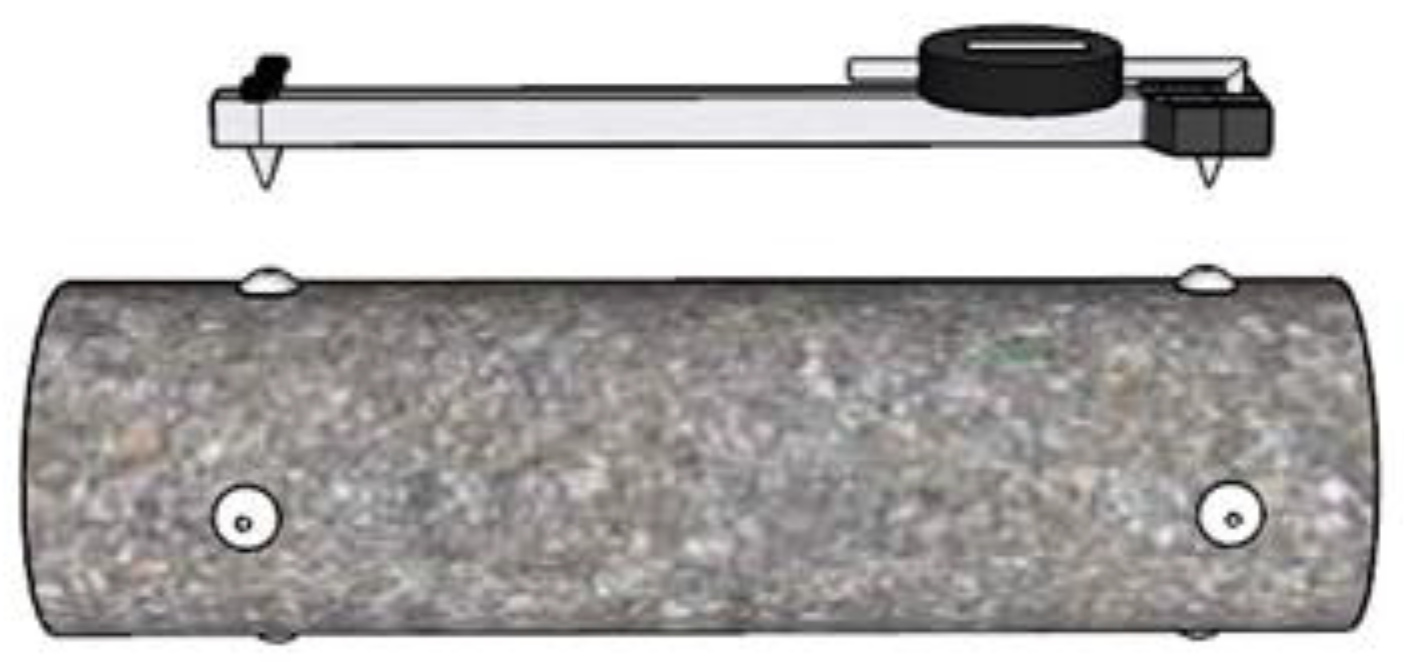
3.2. Specimens Preparation and Shrinkage Test
4. Results and Discussion
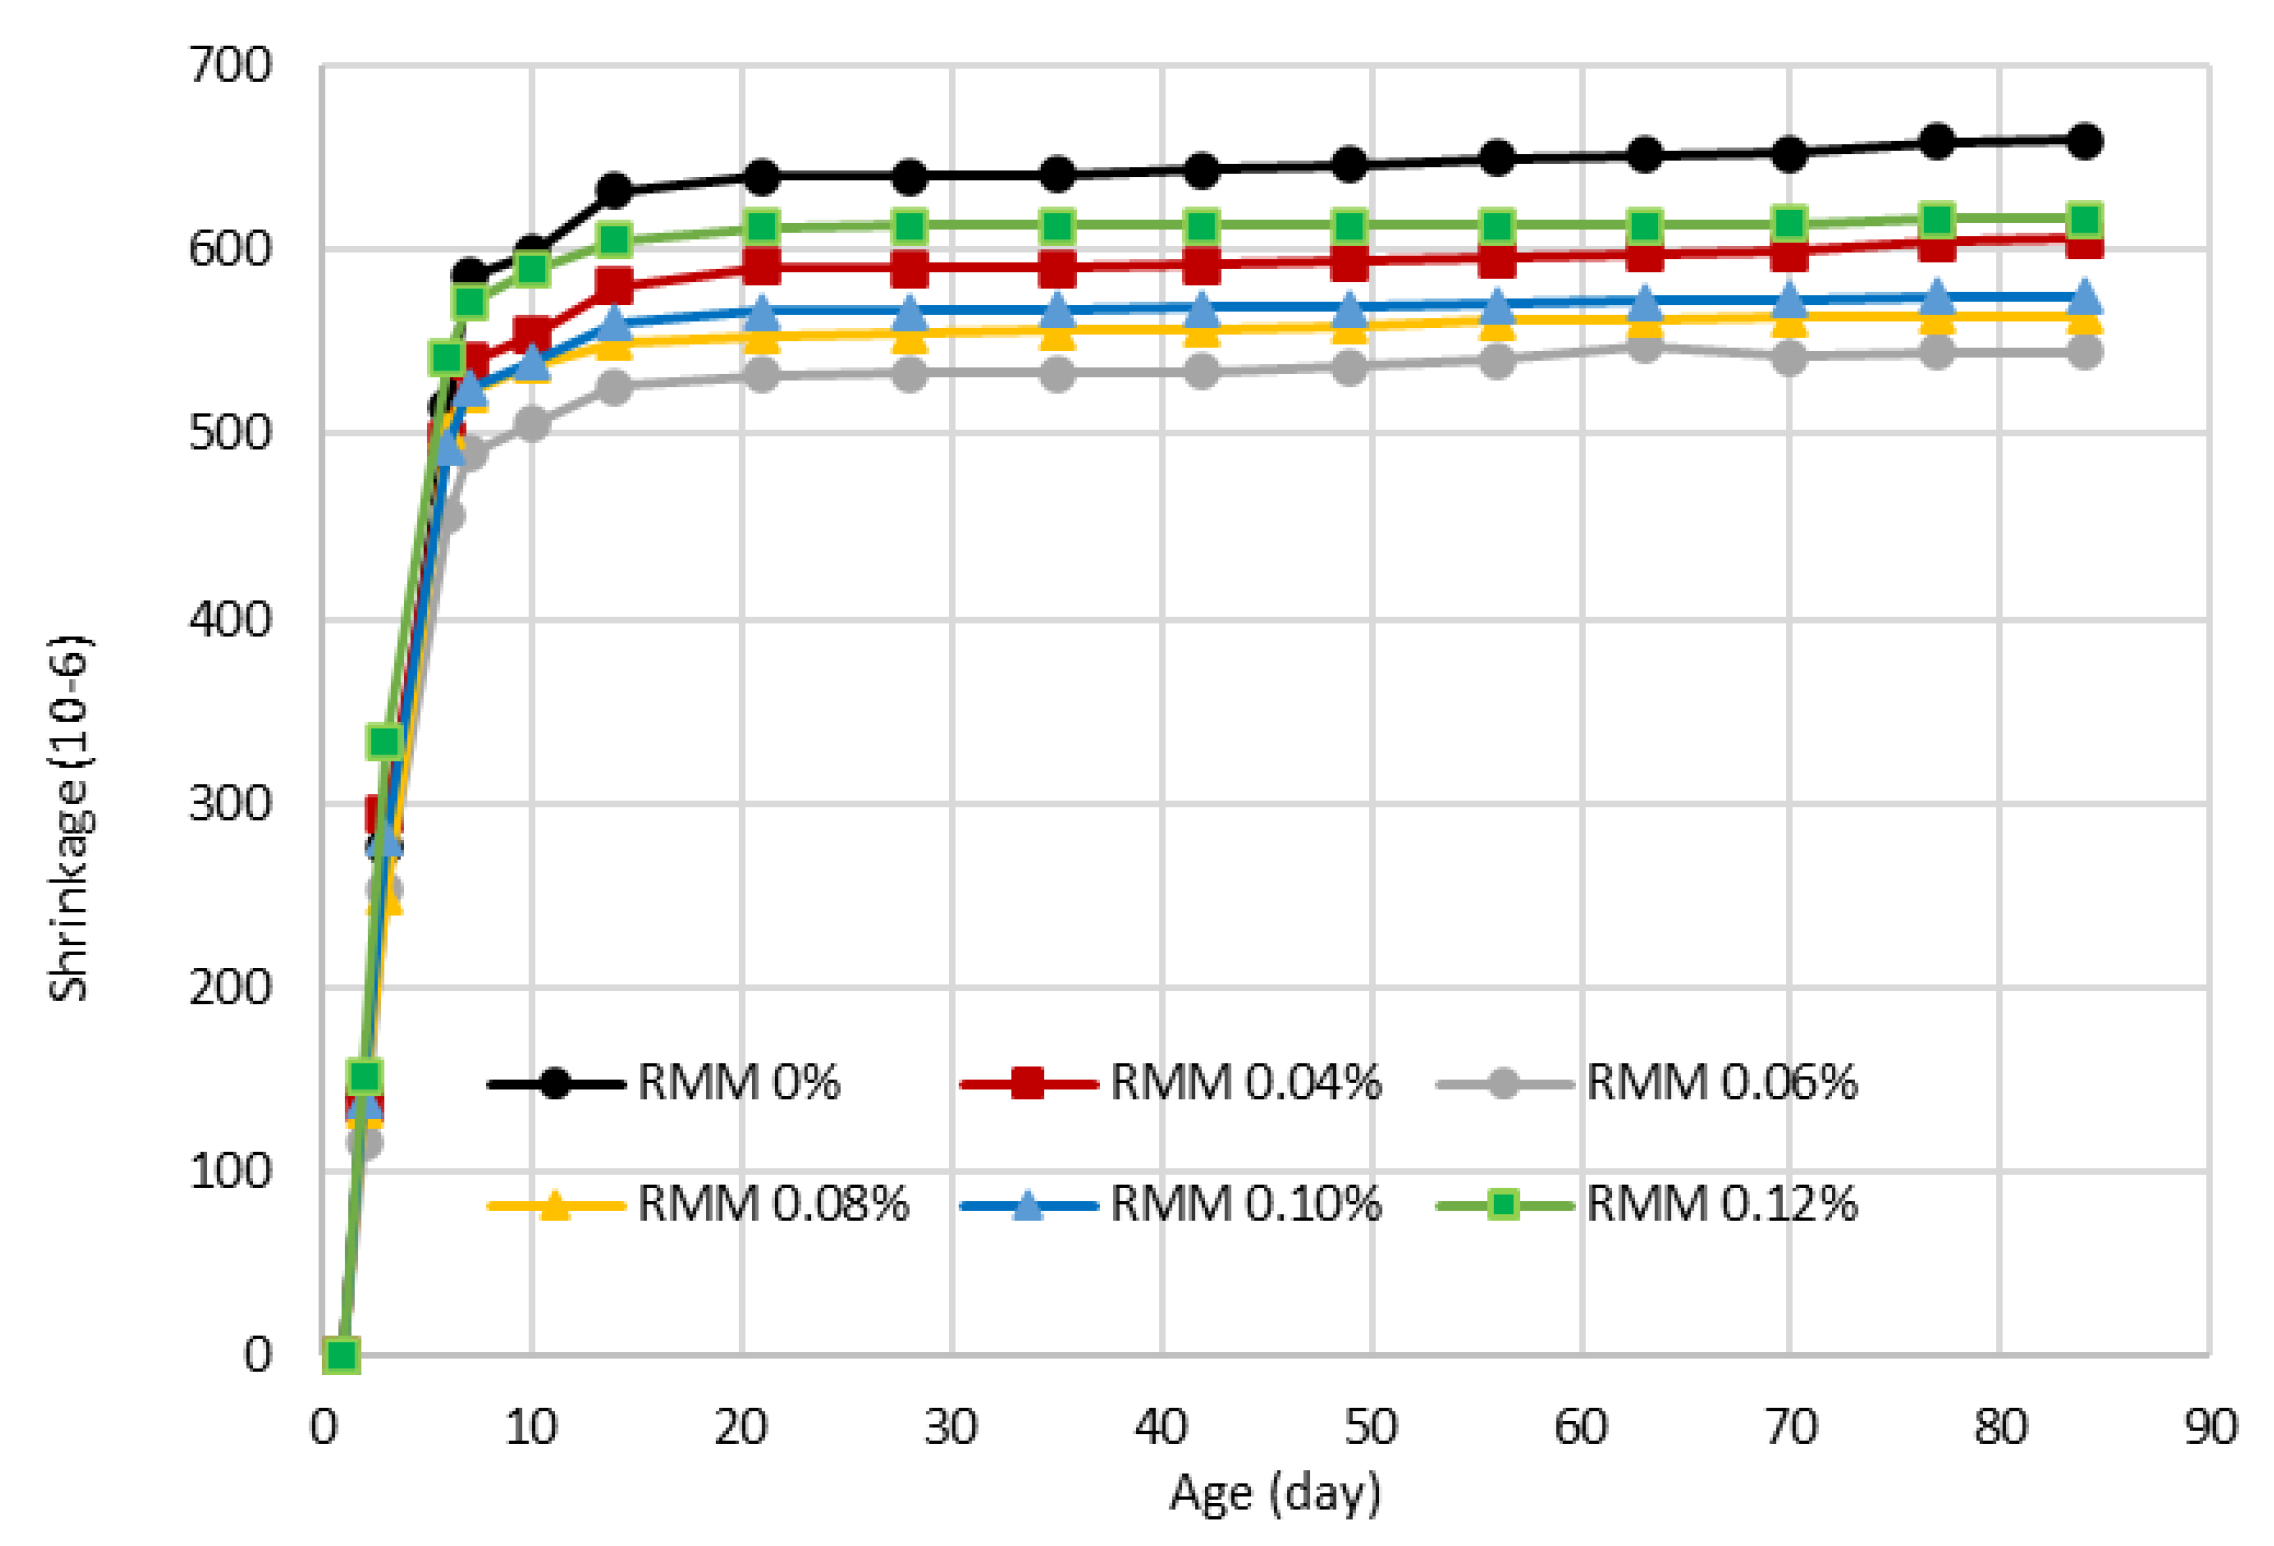
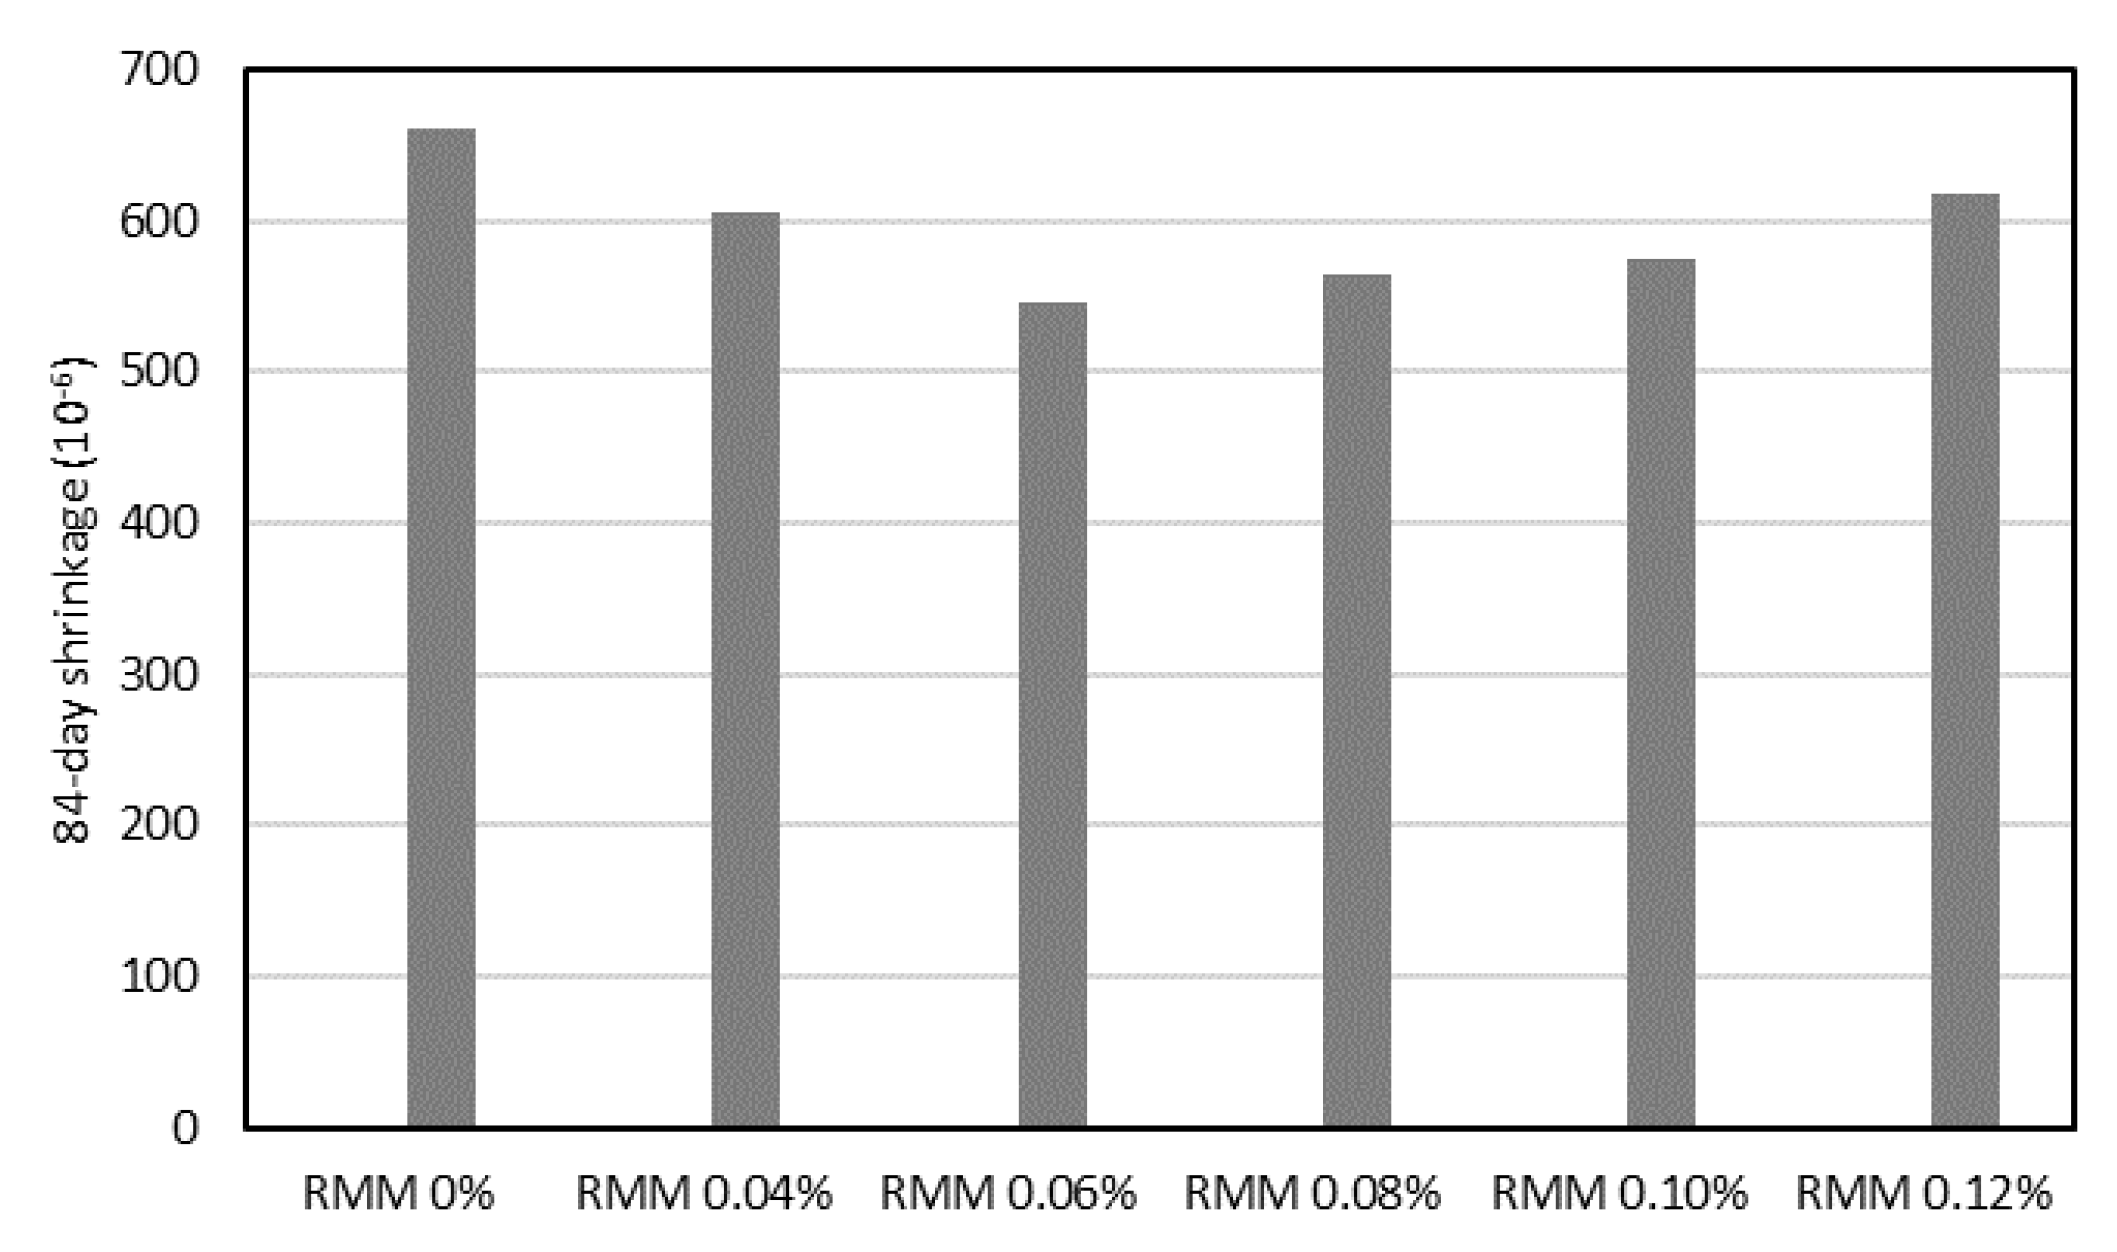
4.1. Shrinkage Development with Time
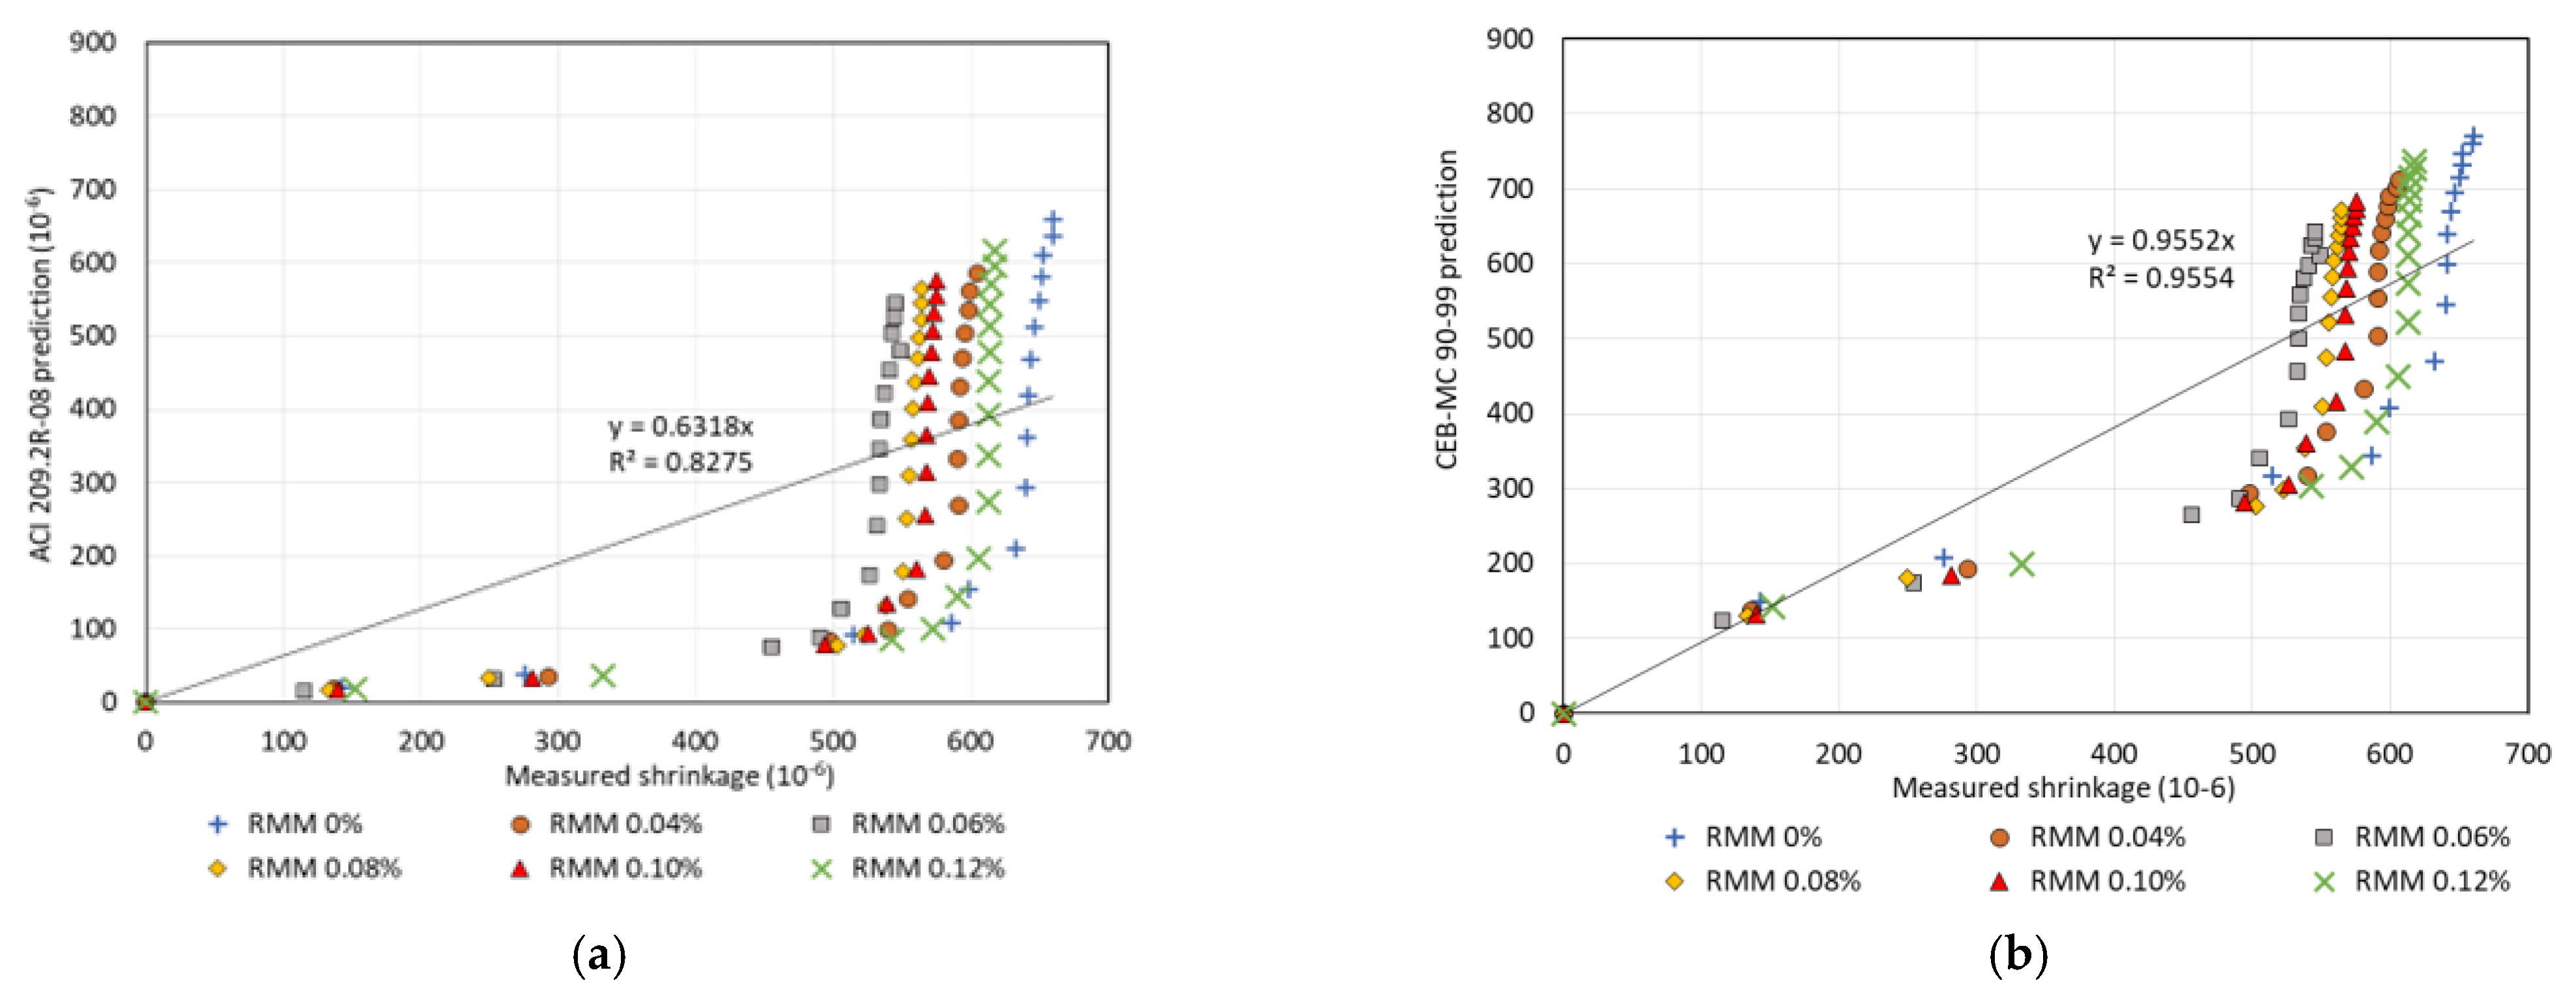
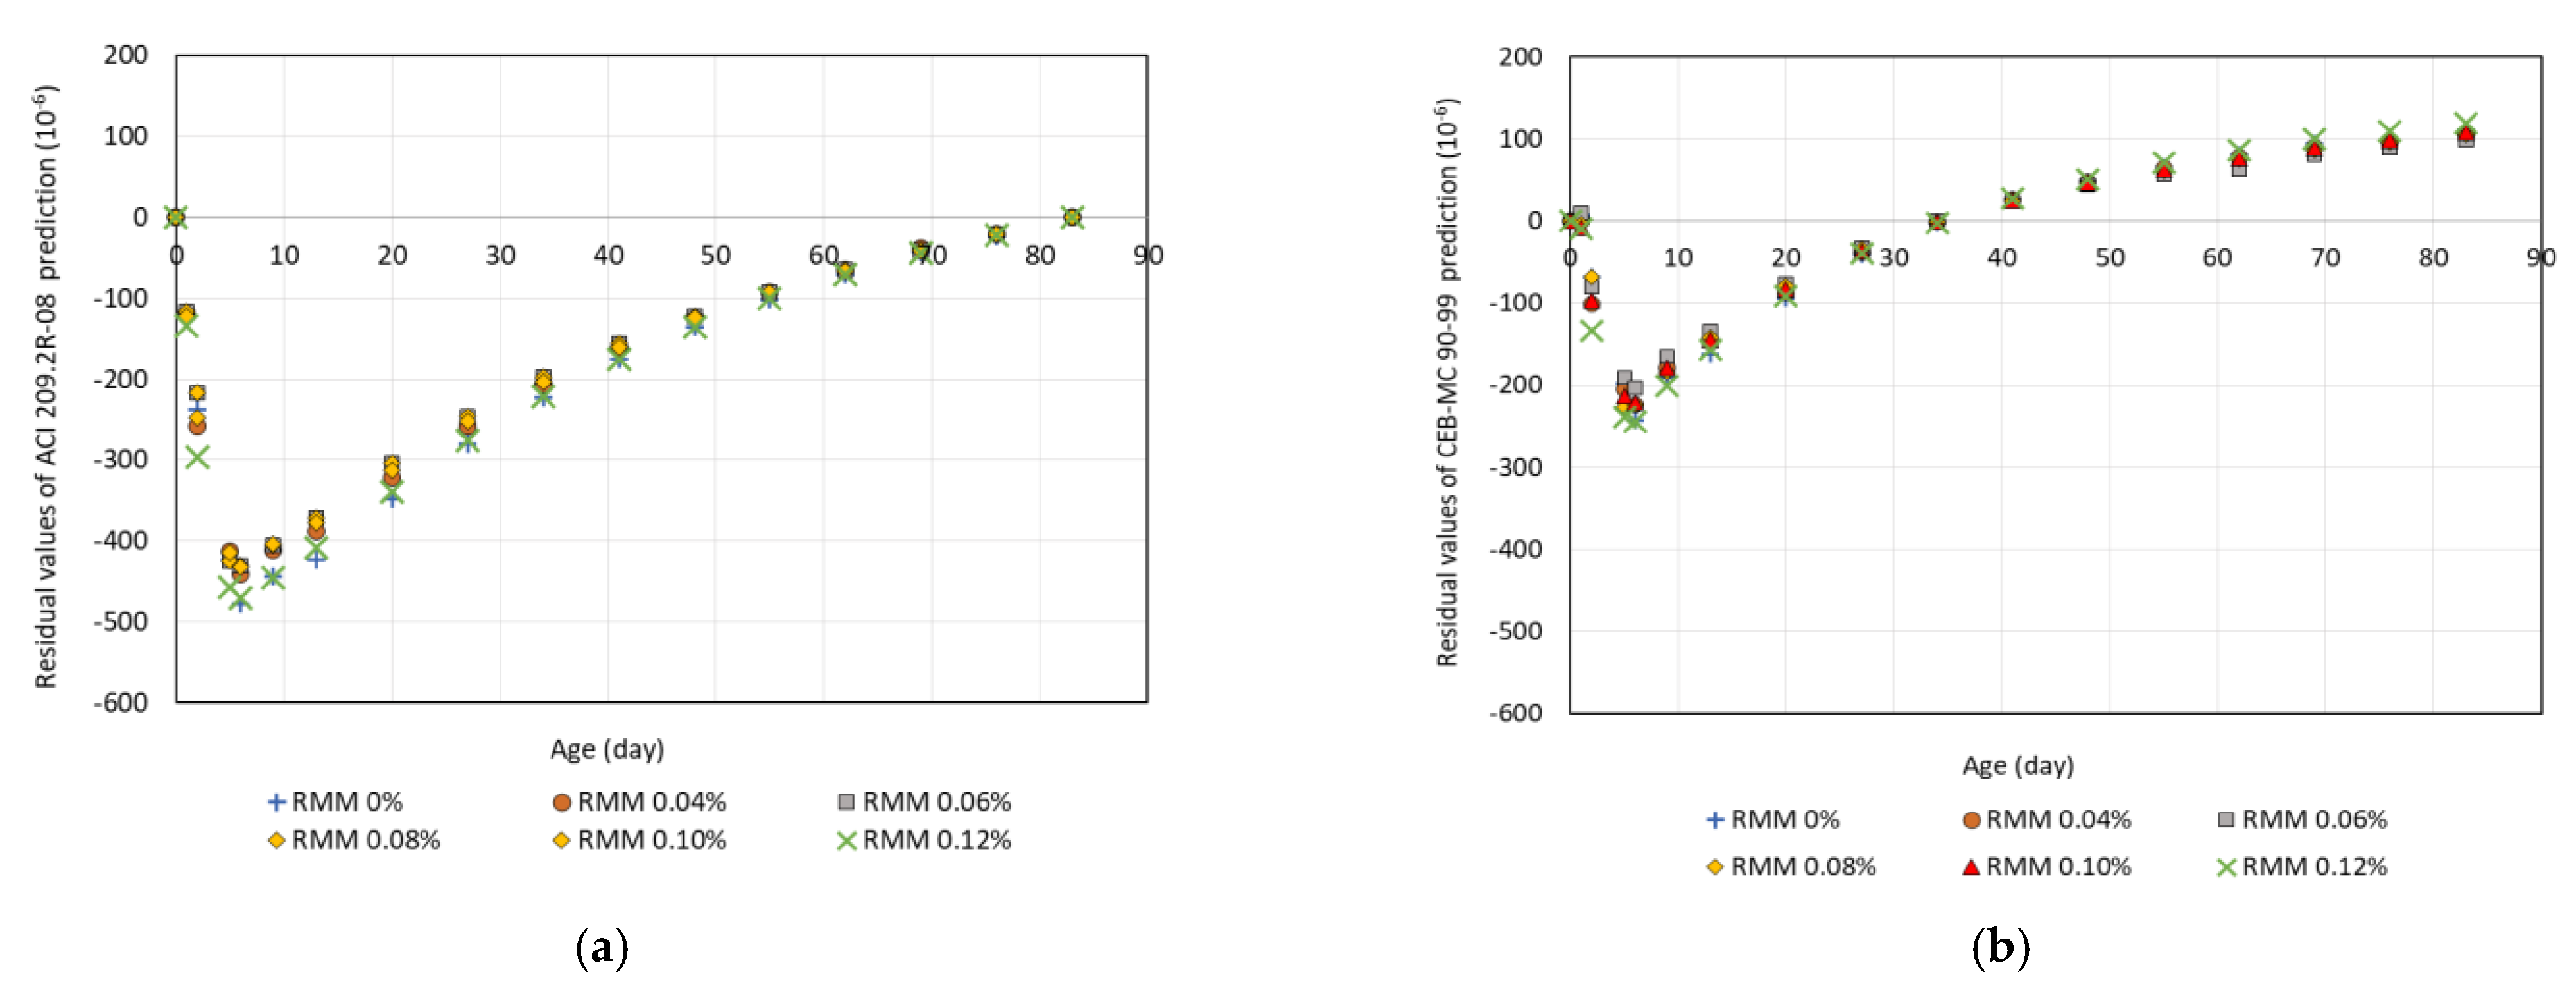
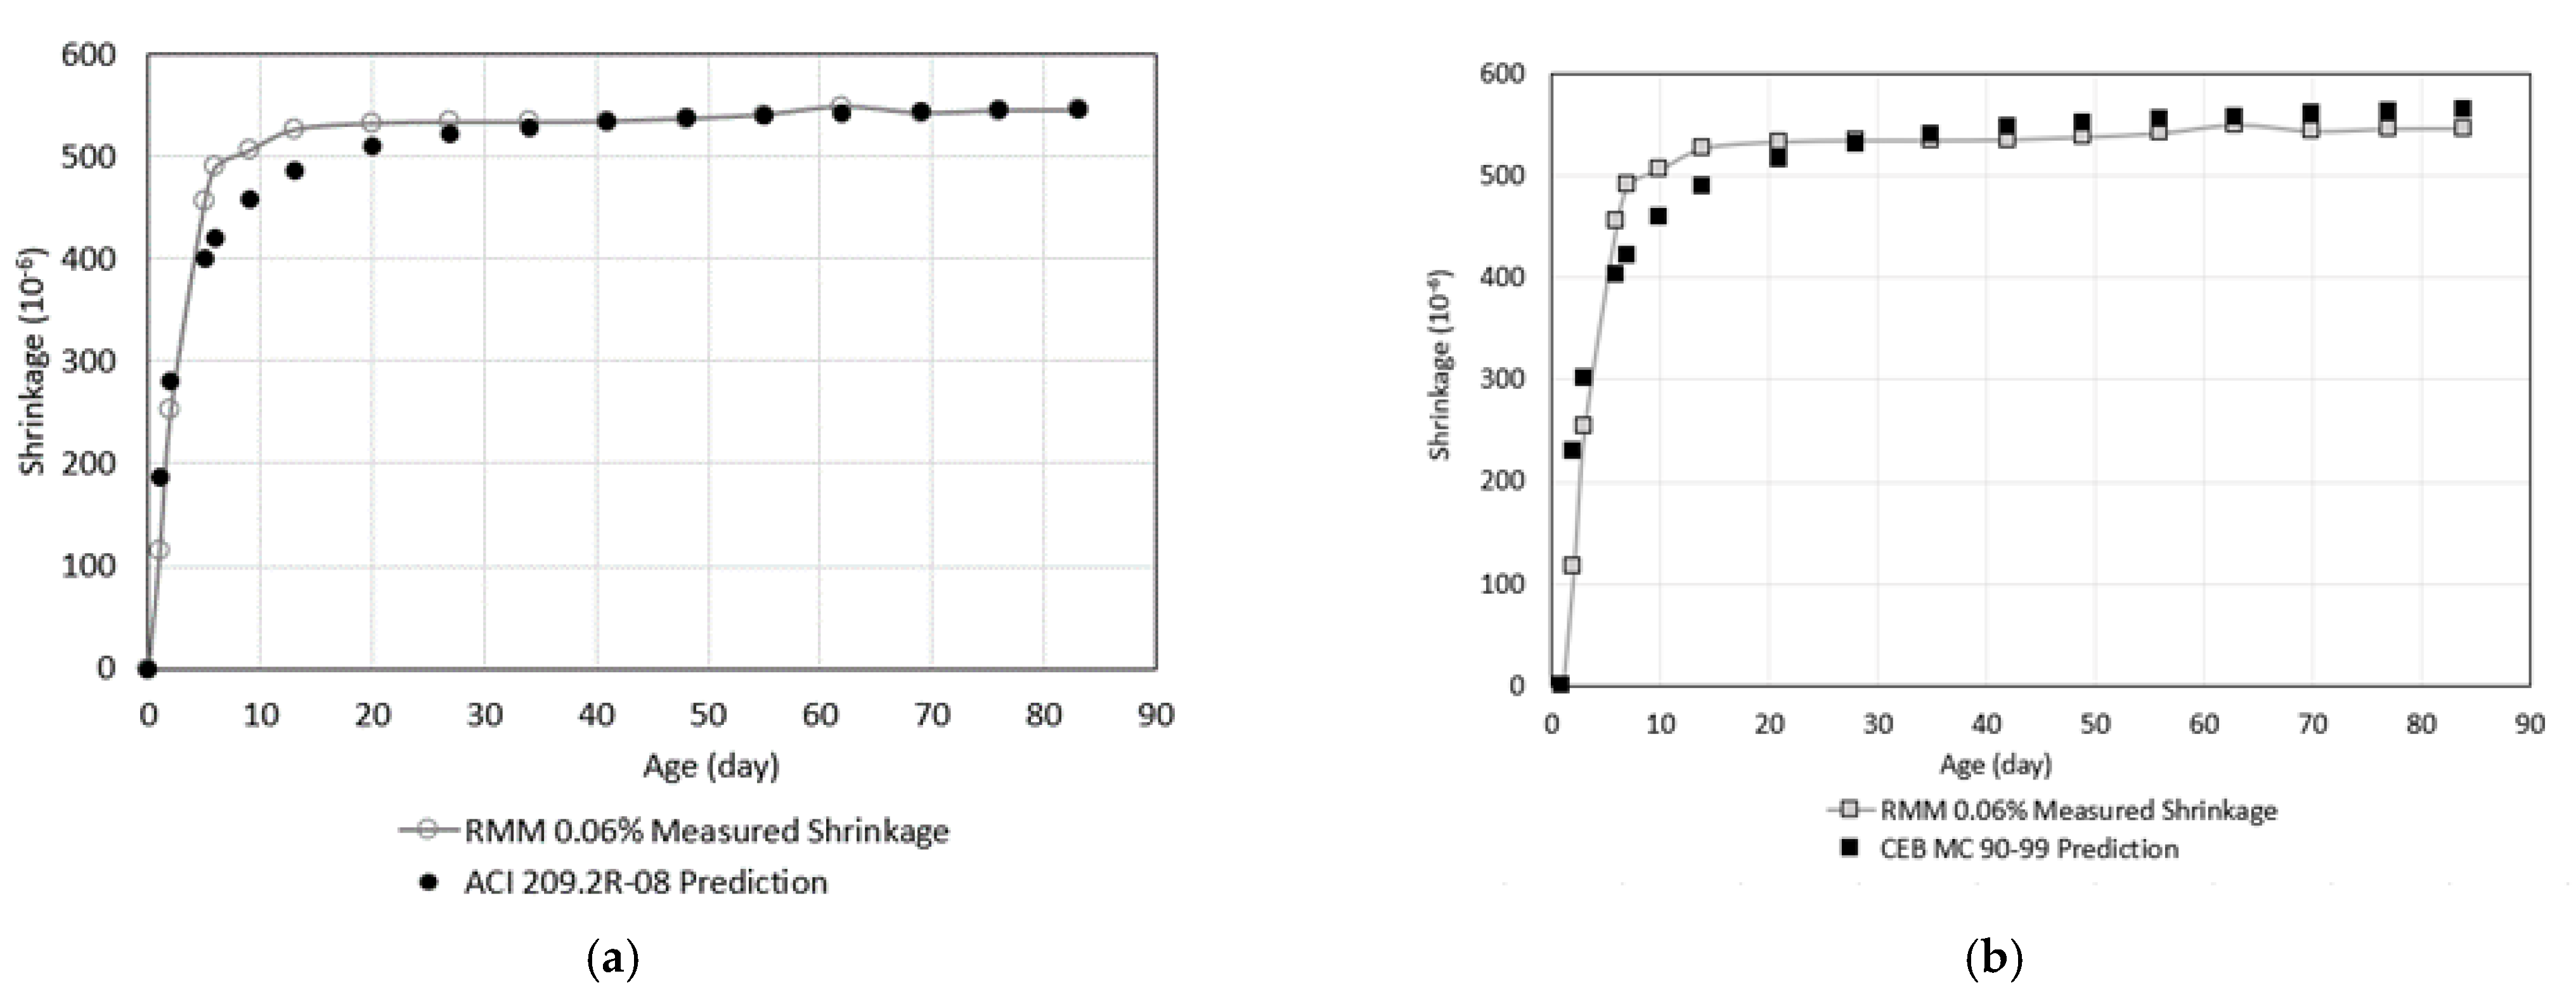
4.2. Comparison with the Prediction Models
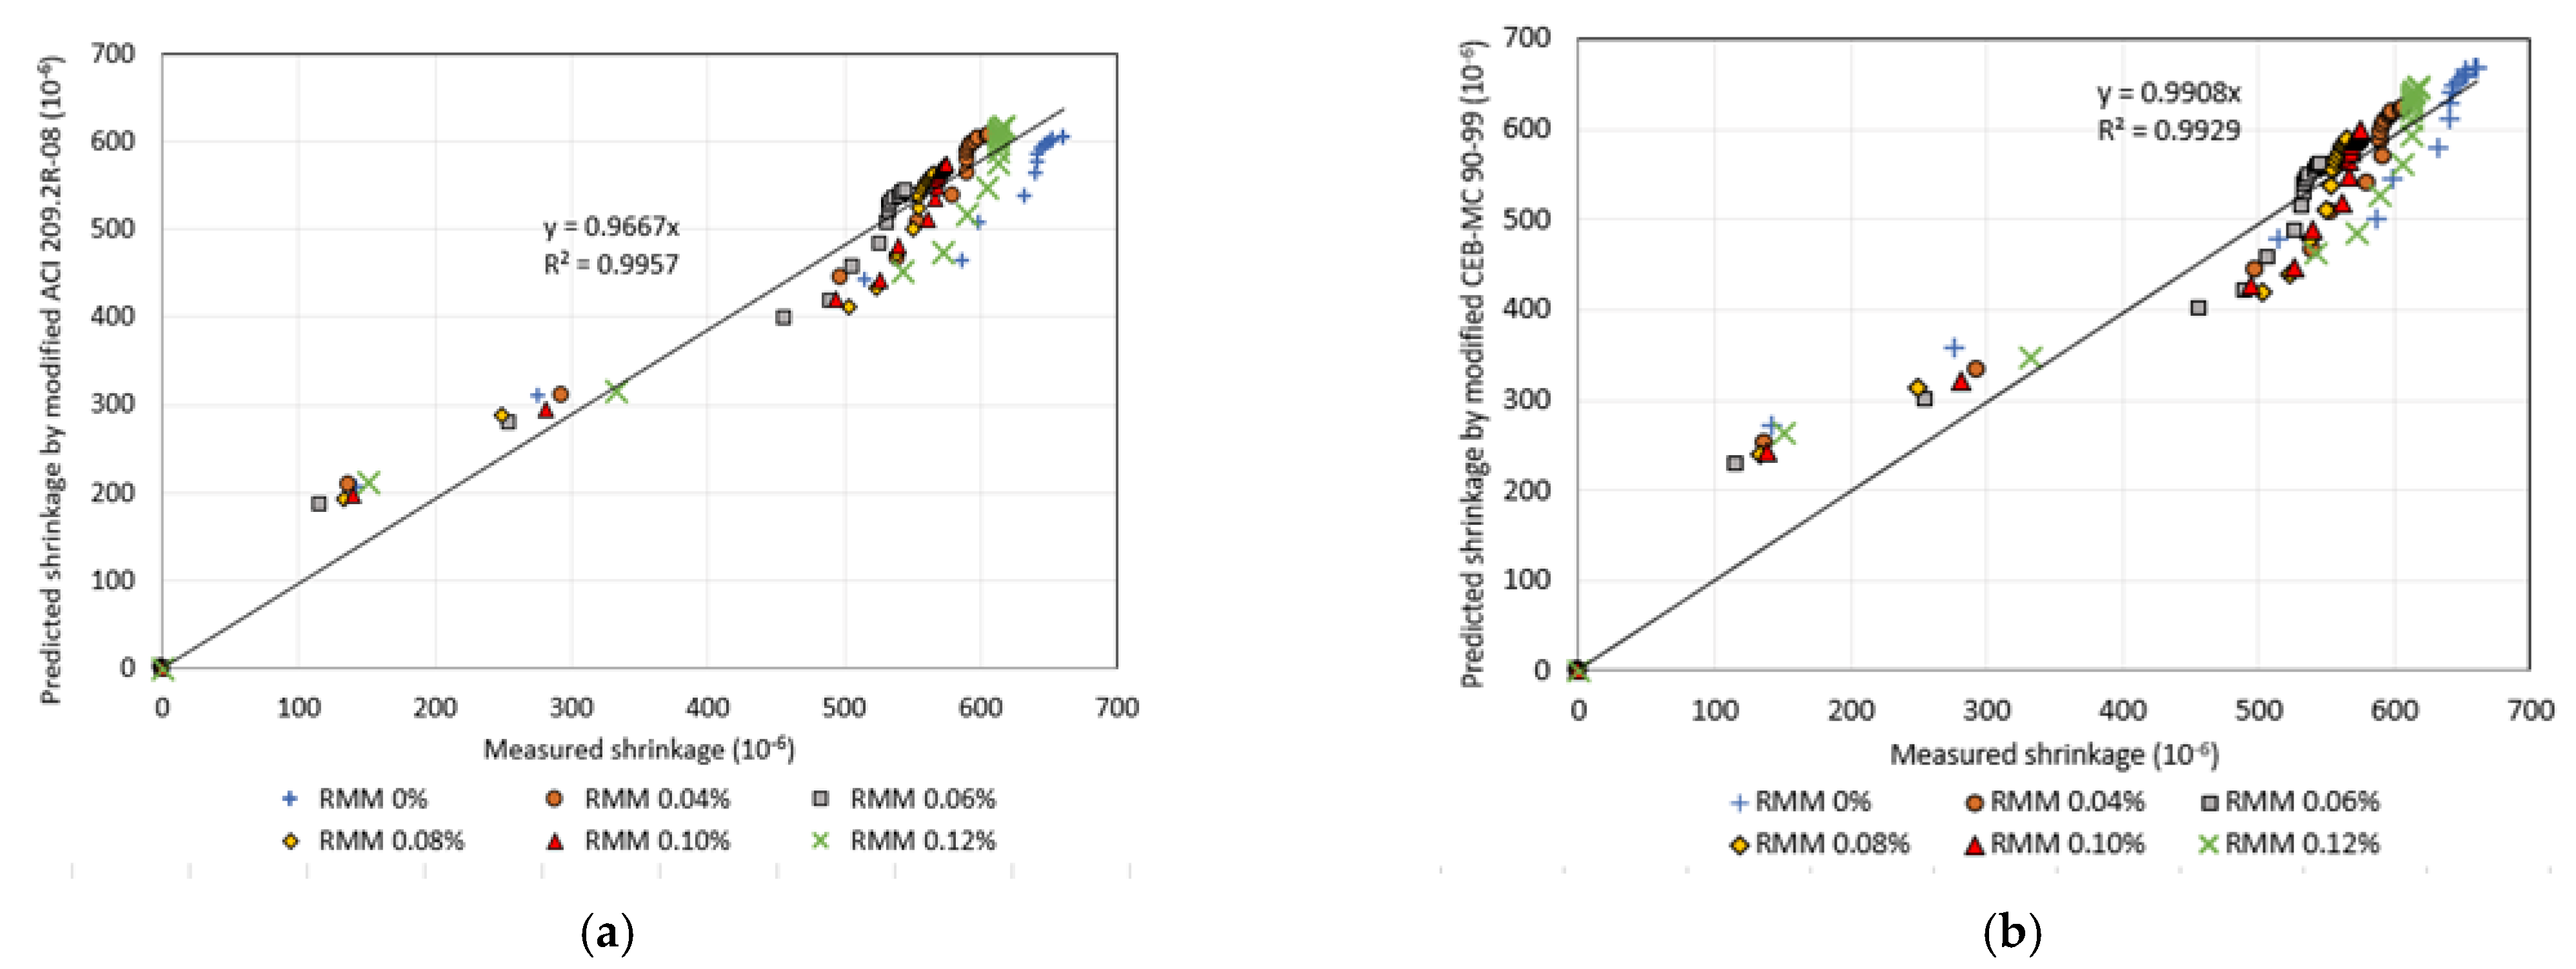
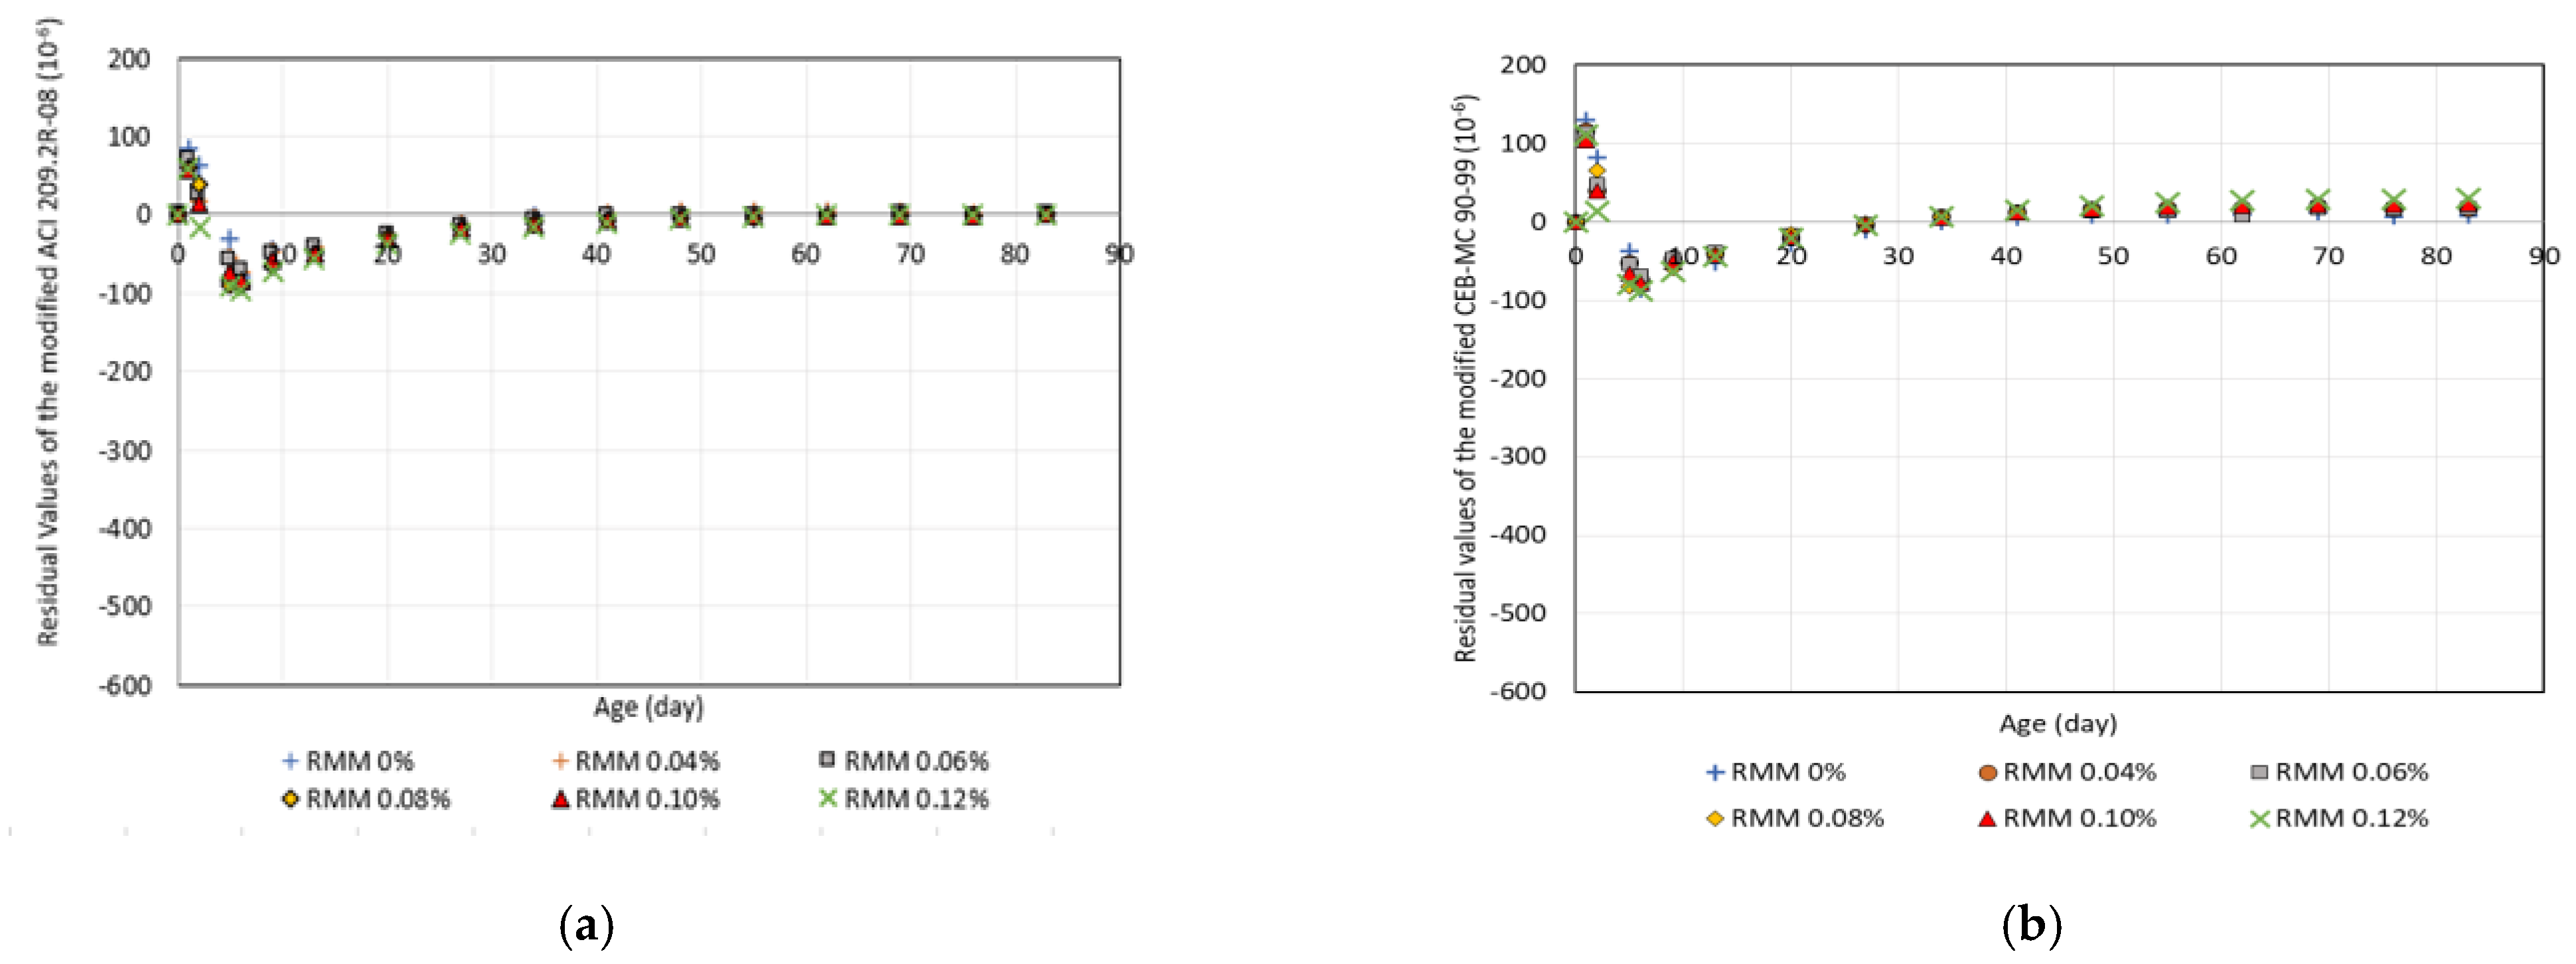
4.3. Improvement of the Models
5. Conclusions
- The shrinkage behavior of the micro-synthetic fiber-reinforced mortar shows rapid development of shrinkage at an early age. The inclusion of fibers does not influence the shrinkage rate, but does affect the magnitude of shrinkage. The lowest shrinkage occurs in the mixture with a fiber dosage of 0.06%.
- The shrinkage rapid development of the micro-synthetic fiber-reinforced mortar at an early age is characterized by a shorter shrinkage half-time (3 days) and a faster trend of reaching asymptotic value (after 14 days) than shrinkage of normal concrete.
- The shape of the shrinkage curve of the micro-synthetic fiber-reinforced mortar cannot be accurately estimated by the ACI 209.2R-08 and CEB-MC 90-99 models. The difference between the measured shrinkage and the predicted shrinkage by these models has been evaluated quantitatively using the method of best fit line, residual analysis, and coefficient of error. The quantitative evaluations indicate a high erroneousness.
- The ACI 209.2R-08 and CEB-MC 90-99 models have been modified in such a way to reflect the shrinkage behavior of the micro-synthetic fiber-reinforced mortar. The modified models give fairly accurate prediction of the shrinkage.
Author Contributions
Funding
Institutional Review Board Statement
Informed Consent Statement
Data Availability Statement
Acknowledgments
Conflicts of Interest
References
- Haddad, R.H.; Shannag, M.J.; Al-Hambouth, M.T. Repair of reinforced concrete beams damaged by alkali-silica reaction. ACI Struct. J. 2008, 105, 145–153. [Google Scholar] [CrossRef]
- Bhikshma, V.; Reddy, M.K.; Sunitha, K. Experimental study on rehabilitation of RC beams using epoxy resins. Asian J. Civ. Eng. 2010, 11, 533–542. [Google Scholar]
- Park, S.K.; Yang, D.S. Flexural behavior of reinforced concrete beams with cementitious repair materials. Mater. Struct. Constr. 2005, 38, 329–334. [Google Scholar] [CrossRef]
- Jumaat, M.; Kabir, M.H.; Obaydullah, M. A Review of the Repair of Reinforced Concrete Beams. J. Appl. Sci. Res. 2006, 2, 317–326. [Google Scholar]
- Jumaat, M.Z.B.; Kabir, M.H.; Obaydullah, M. Structural performance of reinforced concrete beams repairing from spalling. Eur. J. Sci. Res. 2010, 45, 89–102. [Google Scholar]
- Kristiawan, S.A.; Saifullah, H.A.; Supriyadi, A. Influence of Patching on the Shear Failure of Reinforced Concrete Beam without Stirrup. Infrastructures 2021, 6, 97. [Google Scholar] [CrossRef]
- Turcry, P.; Loukili, A.; Haidar, K.; Pijaudier-Cabot, G.; Belarbi, A. Cracking Tendency of Self-Compacting Concrete Subjected to Restrained Shrinkage: Experimental Study and Modeling. J. Mater. Civ. Eng. 2006, 18, 46–54. [Google Scholar] [CrossRef]
- Baluch, M.H.; Rahman, M.K.; Al-Gadhib, A.H. Risks of Cracking and Delamination in Patch Repair. J. Mater. Civ. Eng. 2002, 14, 294–302. [Google Scholar] [CrossRef]
- Bhutta, A.; Farooq, M.; Banthia, N. Performance characteristics of micro fiber-reinforced geopolymer mortars for repair. Constr. Build. Mater. 2019, 215, 605–612. [Google Scholar] [CrossRef]
- Tayeh, B.A.; Akeed, M.H.; Qaidi, S.; Bakar, B.H.A. Case Studies in Construction Materials Influence of microsilica and polypropylene fibers on the fresh and mechanical properties of ultra-high performance geopolymer concrete ( UHP-GPC ). Case Stud. Constr. Mater. 2022, 17, e01367. [Google Scholar] [CrossRef]
- Sharma, S.K.; Kumar, A.A.; Ransinchung, G.D.R.N.; Kumar, P. Micro fiber reinforced cement paste and mortar overlays—A review. Int. J. Pavement Res. Technol. 2013, 6, 765–772. [Google Scholar] [CrossRef]
- Banthia, N.; Azzabi, M.; Pigeon, M. Restrained shrinkage cracking in fibre-reinforced cementitious composites. Mater. Struct. 1993, 26, 405–413. [Google Scholar] [CrossRef]
- Aly, T.; Sanjayan, J.G. Shrinkage-cracking behavior of OPC-fiber concrete at early-age. Mater. Struct. Constr. 2010, 43, 755–764. [Google Scholar] [CrossRef]
- Bissonnette, B.; Pierre, P.; Pigeon, M. Influence of key parameters on drying shrinkage of cementitious materials. Cem. Concr. Res. 1999, 29, 1655–1662. [Google Scholar] [CrossRef]
- Al-musawi, H.; Figueiredo, F.P.; Guadagnini, M.; Pilakoutas, K. Shrinkage properties of plain and recycled steel—Fibre-reinforced rapid hardening mortars for repairs. Constr. Build. Mater. 2019, 197, 369–384. [Google Scholar] [CrossRef]
- Kristiawan, S.A. Evaluation of Models for Estimating Shrinkage Stress in Patch Repair System. Int. J. Concr. Struct. Mater. 2012, 6, 221–230. [Google Scholar] [CrossRef][Green Version]
- Bouziadi, F.; Boulekbache, B.; Hamrat, M. The effects of fibres on the shrinkage of high-strength concrete under various curing temperatures. Constr. Build. Mater. 2016, 114, 40–48. [Google Scholar] [CrossRef]
- Sheng, Y.; Xue, B.; Li, H.; Qiao, Y.; Chen, H.; Fang, J.; Xu, A. Preparation and Performance of a New-Type Alkali-Free Liquid Accelerator for Shotcrete. Adv. Mater. Sci. Eng. 2017, 2017. [Google Scholar] [CrossRef]
- ACI Committee 209; ACI 209.2R-08 Guide for Modeling and Calculating Shrinkage and Creep in Hardened Concrete. ACI: Farmington Hills, MI, USA, 2008.
- Comite Euro-International du Beton. CEB-FIP Model Code 1990; Thomas Telford Ltd.: London, UK, 1990; pp. 57–58. [Google Scholar]
- Kristiawan, S.; Sangadji, S. Prediction model for shrinkage of lightweight. Asian J. Civ. Eng. 2009, 10, 1–11. [Google Scholar]
- Kristiawan, S.A.; Aditya, M.T.M. Effect of high volume fly ash on shrinkage of self-compacting concrete. Procedia Eng. 2015, 125, 705–712. [Google Scholar] [CrossRef]
- Pasalli, D.A.; Tudjono, S.; Nurhuda, I. A Creep Prediction Model for Concrete Made from Pit Sand with Low Silica Content. Infrastructures 2022, 7, 134. [Google Scholar] [CrossRef]
- Kratos Fibers. Available online: https://kratosreinforcement.com/wp-content/uploads/2022/05/KratosBrosur_ENDONEZYA_DUSUK_043.pdf (accessed on 17 December 2022).
- RILEM Technical Committees 129. RILEM TC 129-MHT Part 9: Shrinkage for service and accident conditions. Mater. Struct. Constr. 2000, 33, 224–228. [Google Scholar]
- Wang, Y.; Zhu, J.; Guo, Y.; Wang, C. Early shrinkage experiment of concrete and the development law of its temperature and humidity field in natural environment. J. Build. Eng. 2023, 63, 105528. [Google Scholar] [CrossRef]
- Zhang, J.; Li, V.C. Influences of Fibers on Drying Shrinkage of Fiber-Reinforced Cementitious Composite. J. Eng. Mech. 2001, 127, 37–44. [Google Scholar] [CrossRef]
- Bandelj, B.; Saje, D.; Šušteršič, J.; Lopatič, J.; Saje, F. Free Shrinkage of High Performance Steel Fiber Reinforced Concrete Free Shrinkage of High Performance Steel Fibre Reinforced Concrete. J. Test. Eval. 2011, 39, 166–176. [Google Scholar] [CrossRef]


| Category | Properties |
|---|---|
| Fiber class | EN 14889-2 Class 1 |
| Raw material | 100% Polyamide 6.6 |
| Fiber type | Monofilament |
| Specific gravity | 1.14 gr/cm3 |
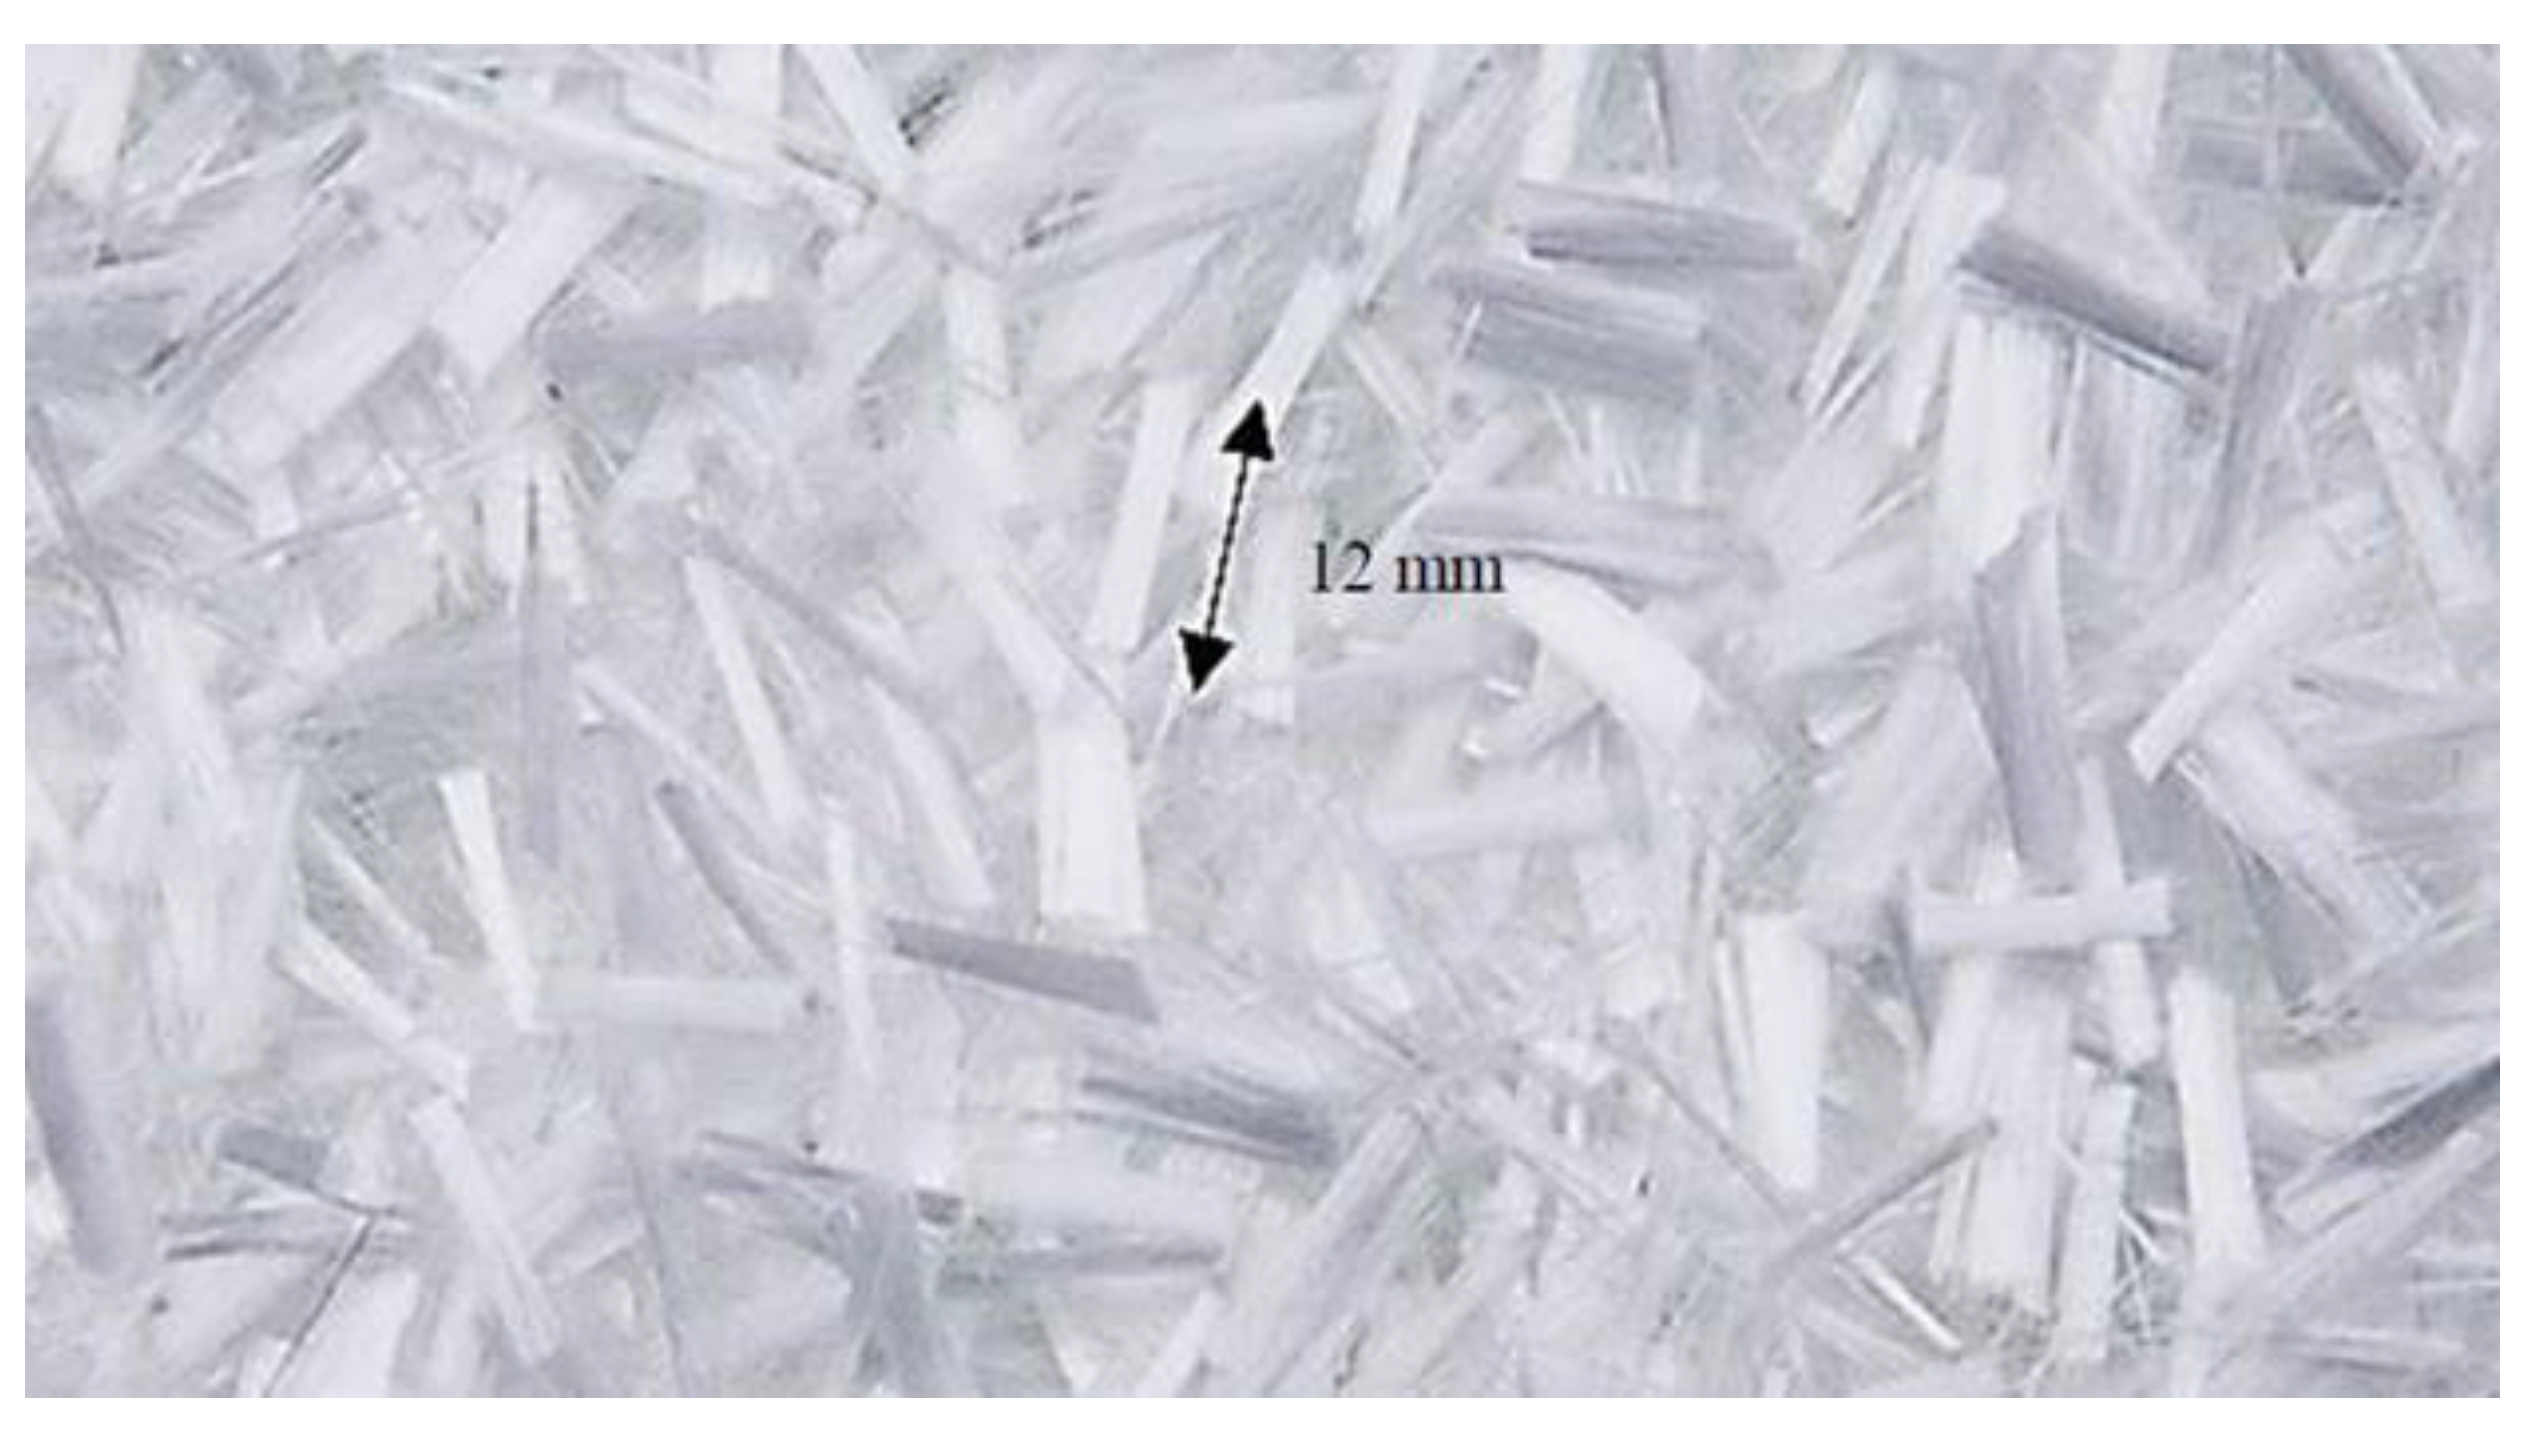
| Length | 12 mm |
| Filament diameter | 27 micron |
| Tensile strength | 900 MPa |
| Elongation at break | 17.55% |
| Melting point | 260 °C |
| Alkali resistance | Excellent |
| Resistance to corrosion | Excellent |
| Number of fibers/kg | 111,000,000 |
| Specimen ID | Fiber Dosage | Cement | Fine Aggregate (Sand) | Water | Accelerator | Micro-Synthetic Fiber |
|---|---|---|---|---|---|---|
| (kg/m3) | (kg/m3) | (lt/m3) | (lt/m3) | (kg/m3) | ||
| RMM 0% | 0.00% | 800 | 1600 | 200 | 80 | 0.00 |
| RMM 0.04% | 0.04% | 800 | 1600 | 200 | 80 | 0.40 |
| RMM 0.06% | 0.06% | 800 | 1600 | 200 | 80 | 0.60 |
| RMM 0.08% | 0.08% | 800 | 1600 | 200 | 80 | 0.80 |
| RMM 0.10% | 0.10% | 800 | 1600 | 200 | 80 | 1.00 |
| RMM 0.12% | 0.12% | 800 | 1600 | 200 | 80 | 1.20 |
| Method | ACI 209.2R-08 | CEB MC 90-99 |
|---|---|---|
| Best fit line | y = 0.6318 x | y = 0.9552 x |
| R2 = 0.8275 | R2 = 0.9554 | |
| Residual values (R) | −207.73 | −26.51 |
| Coefficient of error (M) | 161.83% | 73.97% |
| Method | ACI 209.2R-08 | CEB-MC 90-99 | Modified ACI 209.2R-08 | Modified CEB-MC 90-99 |
|---|---|---|---|---|
| Best fit line | y = 0.6318 x | y = 0.9552 x | y = 0.9667 x | y = 0.9908 x |
| R2 = 0.8275 | R2 = 0.9554 | R2 = 0.9957 | R2 = 0.9929 | |
| Residual values (R) | −207.73 | −26.51 | −14.14 | 1.28 |
| Coefficient of error (M) | 161.83% | 73.97% | 20.53% | 26.74% |
Disclaimer/Publisher’s Note: The statements, opinions and data contained in all publications are solely those of the individual author(s) and contributor(s) and not of MDPI and/or the editor(s). MDPI and/or the editor(s) disclaim responsibility for any injury to people or property resulting from any ideas, methods, instructions or products referred to in the content. |
© 2022 by the authors. Licensee MDPI, Basel, Switzerland. This article is an open access article distributed under the terms and conditions of the Creative Commons Attribution (CC BY) license (https://creativecommons.org/licenses/by/4.0/).
Share and Cite
Safitri, E.; Kusworo, R.A.; Kristiawan, S.A. Shrinkage of Micro-Synthetic Fiber-Reinforced Mortar. Infrastructures 2023, 8, 7. https://doi.org/10.3390/infrastructures8010007
Safitri E, Kusworo RA, Kristiawan SA. Shrinkage of Micro-Synthetic Fiber-Reinforced Mortar. Infrastructures. 2023; 8(1):7. https://doi.org/10.3390/infrastructures8010007
Chicago/Turabian StyleSafitri, Endah, Ridan Adi Kusworo, and Stefanus Adi Kristiawan. 2023. "Shrinkage of Micro-Synthetic Fiber-Reinforced Mortar" Infrastructures 8, no. 1: 7. https://doi.org/10.3390/infrastructures8010007
APA StyleSafitri, E., Kusworo, R. A., & Kristiawan, S. A. (2023). Shrinkage of Micro-Synthetic Fiber-Reinforced Mortar. Infrastructures, 8(1), 7. https://doi.org/10.3390/infrastructures8010007