Article

Radioactive Waste Immobilization Using Vitreous Materials for Facilities in a Safe and Resilient Infrastructure Classified by Multivariate Exploratory Analyses

1
Vitreous Materials Lab, Department of Chemical Engineering, Polytechnic School, Federal University of Bahia, R. Aristides Novis 2, Federação, Salvador 40210-630, Bahia, Brazil
2
Ilum School of Science, Brazilian Center for Research in Energy and Materials (CNPEM), Campinas 13083-970, Sao Paulo, Brazil
3
School of Engineering, University of Pisa, Largo Lucio Lazzarino 1, 56122 Pisa, Italy
4
Center of Exact Sciences and Technology, Department of Physics, Federal University of Sergipe, Av. Marechal Rondon, s/n, Jd, Rosa Elze, São Cristovão 49100-000, Sergipe, Brazil
*
Author to whom correspondence should be addressed.
Infrastructures 2022, 7(9), 120; https://doi.org/10.3390/infrastructures7090120
Submission received: 8 August 2022 / Revised: 2 September 2022 / Accepted: 7 September 2022 / Published: 13 September 2022
(This article belongs to the Special Issue Smart, Sustainable and Resilient Infrastructures, Volume II)

Abstract

:
A database of 479 glass formulations used to immobilize radioactive wastes for facilities in a safe and resilient infrastructure was analyzed, searching for underlying statistical patterns and associated glass performance features. The analyzed data cover many oxides, including SiO2, B2O3, Na2O, Fe2O3, and some fluorides. Borosilicates were the most common glasses (60.1%), while silicates were only 11.9%. In addition to these two families, five radioactive waste vitrification matrices were identified: Boroaluminosilicates, iron phosphates, aluminosilicates, sodium iron phosphates, and boroaluminates, totaling seven glass families. Almost all compositions (97.7%) contained sodium oxide, followed by silica (91.4%), iron (82.7%), boron (73.7%), phosphorus (54.9%), and cesium oxides (26.1%). Multivariate exploratory methods were applied to analyze and classify glass compositions using hierarchical and non-hierarchical (K-means) clusters and principal component analysis. Four main clusters were observed, the largest comprising 417 formulations containing mainly silicates, borosilicates, aluminosilicates, and boroaluminosilicates; two principal components, representing 73.75% of all compositions, emerge from these four clusters derived from a covariance analysis. The principal components and four clusters may be associated with the following glass features in terms of glass compositions: liquidus temperature, glass transition temperature, density, resistivity, microhardness, and viscosity. Some general underlying properties emerged from our classification and are discussed.

1. Introduction

Nuclear power plants currently provide about 10% of the global electricity production from 440 nuclear reactors in operation, with only one in long-term shutdown and 54 under construction in 2022, according to the Power Reactor Information System developed and maintained by the IAEA (pris.iaea.org, accessed on 11 September 2022). These plants do not release greenhouse emissions and are the second-largest low-carbon power source, but they produce large amounts of radioactive waste materials. Therefore, a global waste growth is expected, with serious implications on ecological balance, which would also threaten the global sustainable development and human well-being. A search for safe compositions for better infrastructure facilities is mandatory. After reprocessing the spent fuel and recovering reusable U and Pu isotopes, the residual high-level radioactive wastes (HLW) must be appropriately immobilized and stored [1,2]. Long-lived radioactive isotopes of concern are beta-particle and gamma-ray emitting fission products, such as isotopes of Se, Zr, Tc, Pd, I, and Cs, alpha-particle emitting actinides, such as Np, Am, and Cm, as well as some Cf. Moreover, the latter isotopes emit neutrons via spontaneous fission, while neutrons may also arise when alpha particles from the actinides react with the surrounding oxides.
Vitrification is among the most efficient and effective procedures to immobilize high-level radioactive waste. Glass matrices are utilized thanks to their relatively low cost and high radiation durability. Moreover, glasses present appealing chemical properties: They are stable and compatible with about 80 of the 118 natural and synthetic elements [3]. Indeed, since the first nuclear reactors went into operation and started producing spent fuel and radioactive waste, vitrification has been the most common treatment and conditioning process to generate manageable radioactive wasteforms [4]. As there are differences in nuclear waste compositions, waste materials must be melted with different glass-forming additives, such as sodium, lithium, calcium oxides, and alumina. The final vitreous product incorporates the waste contaminants.
To our knowledge, one of the glasses initially proposed for immobilization of HLW was on a sodium-aluminosilicate base, as reported by Watson et al. [5]. Borosilicate and phosphate glasses are formulations of choice for radioactive waste immobilization [6]. However, there are hundreds of possible formulations found in the literature and potential new reagent combinations. As emphasized by the authors of [6], the nuclear waste vitrification is attractive due to technological and compositional flexibility, large number of elements which can be safely immobilized in the glass, high corrosion and radiation durability, and reduced volume of the resulting wasteform. This study aims to shed light on issues related to nuclear waste-immobilization glass compositions, showing a possibility to map them in few glass systems.
To accomplish this, statistical analyses provide data that support decision-making in various fields. They may be applied in selecting the most appropriate glass formulation for the specific goal of nuclear waste immobilization. These analyses can also improve the design of new formulations to predict the chemical and physical stability of new glass matrices, and search for future (and possibly) new sustainable and resilient compositions.
Multivariate analyses were used in this study to assess, explain, and predict the degree of correlation between glass-formulation variables and their relevance. Multivariate exploratory methods evaluate three or more variables simultaneously, providing an efficient method to replace countless univariate or bivariate analyses. The analysis highlights groups of most closely related variables, searching for interference factors and creating statistical and probability models.
The study is part of a large ongoing project to identify key factors contributing to the formulation and selection of safe and durable glass compositions for radioactive waste immobilization of infrastructure facilities, in an effort to reduce environmental, economic, and social impacts for safety.

2. Materials and Methods

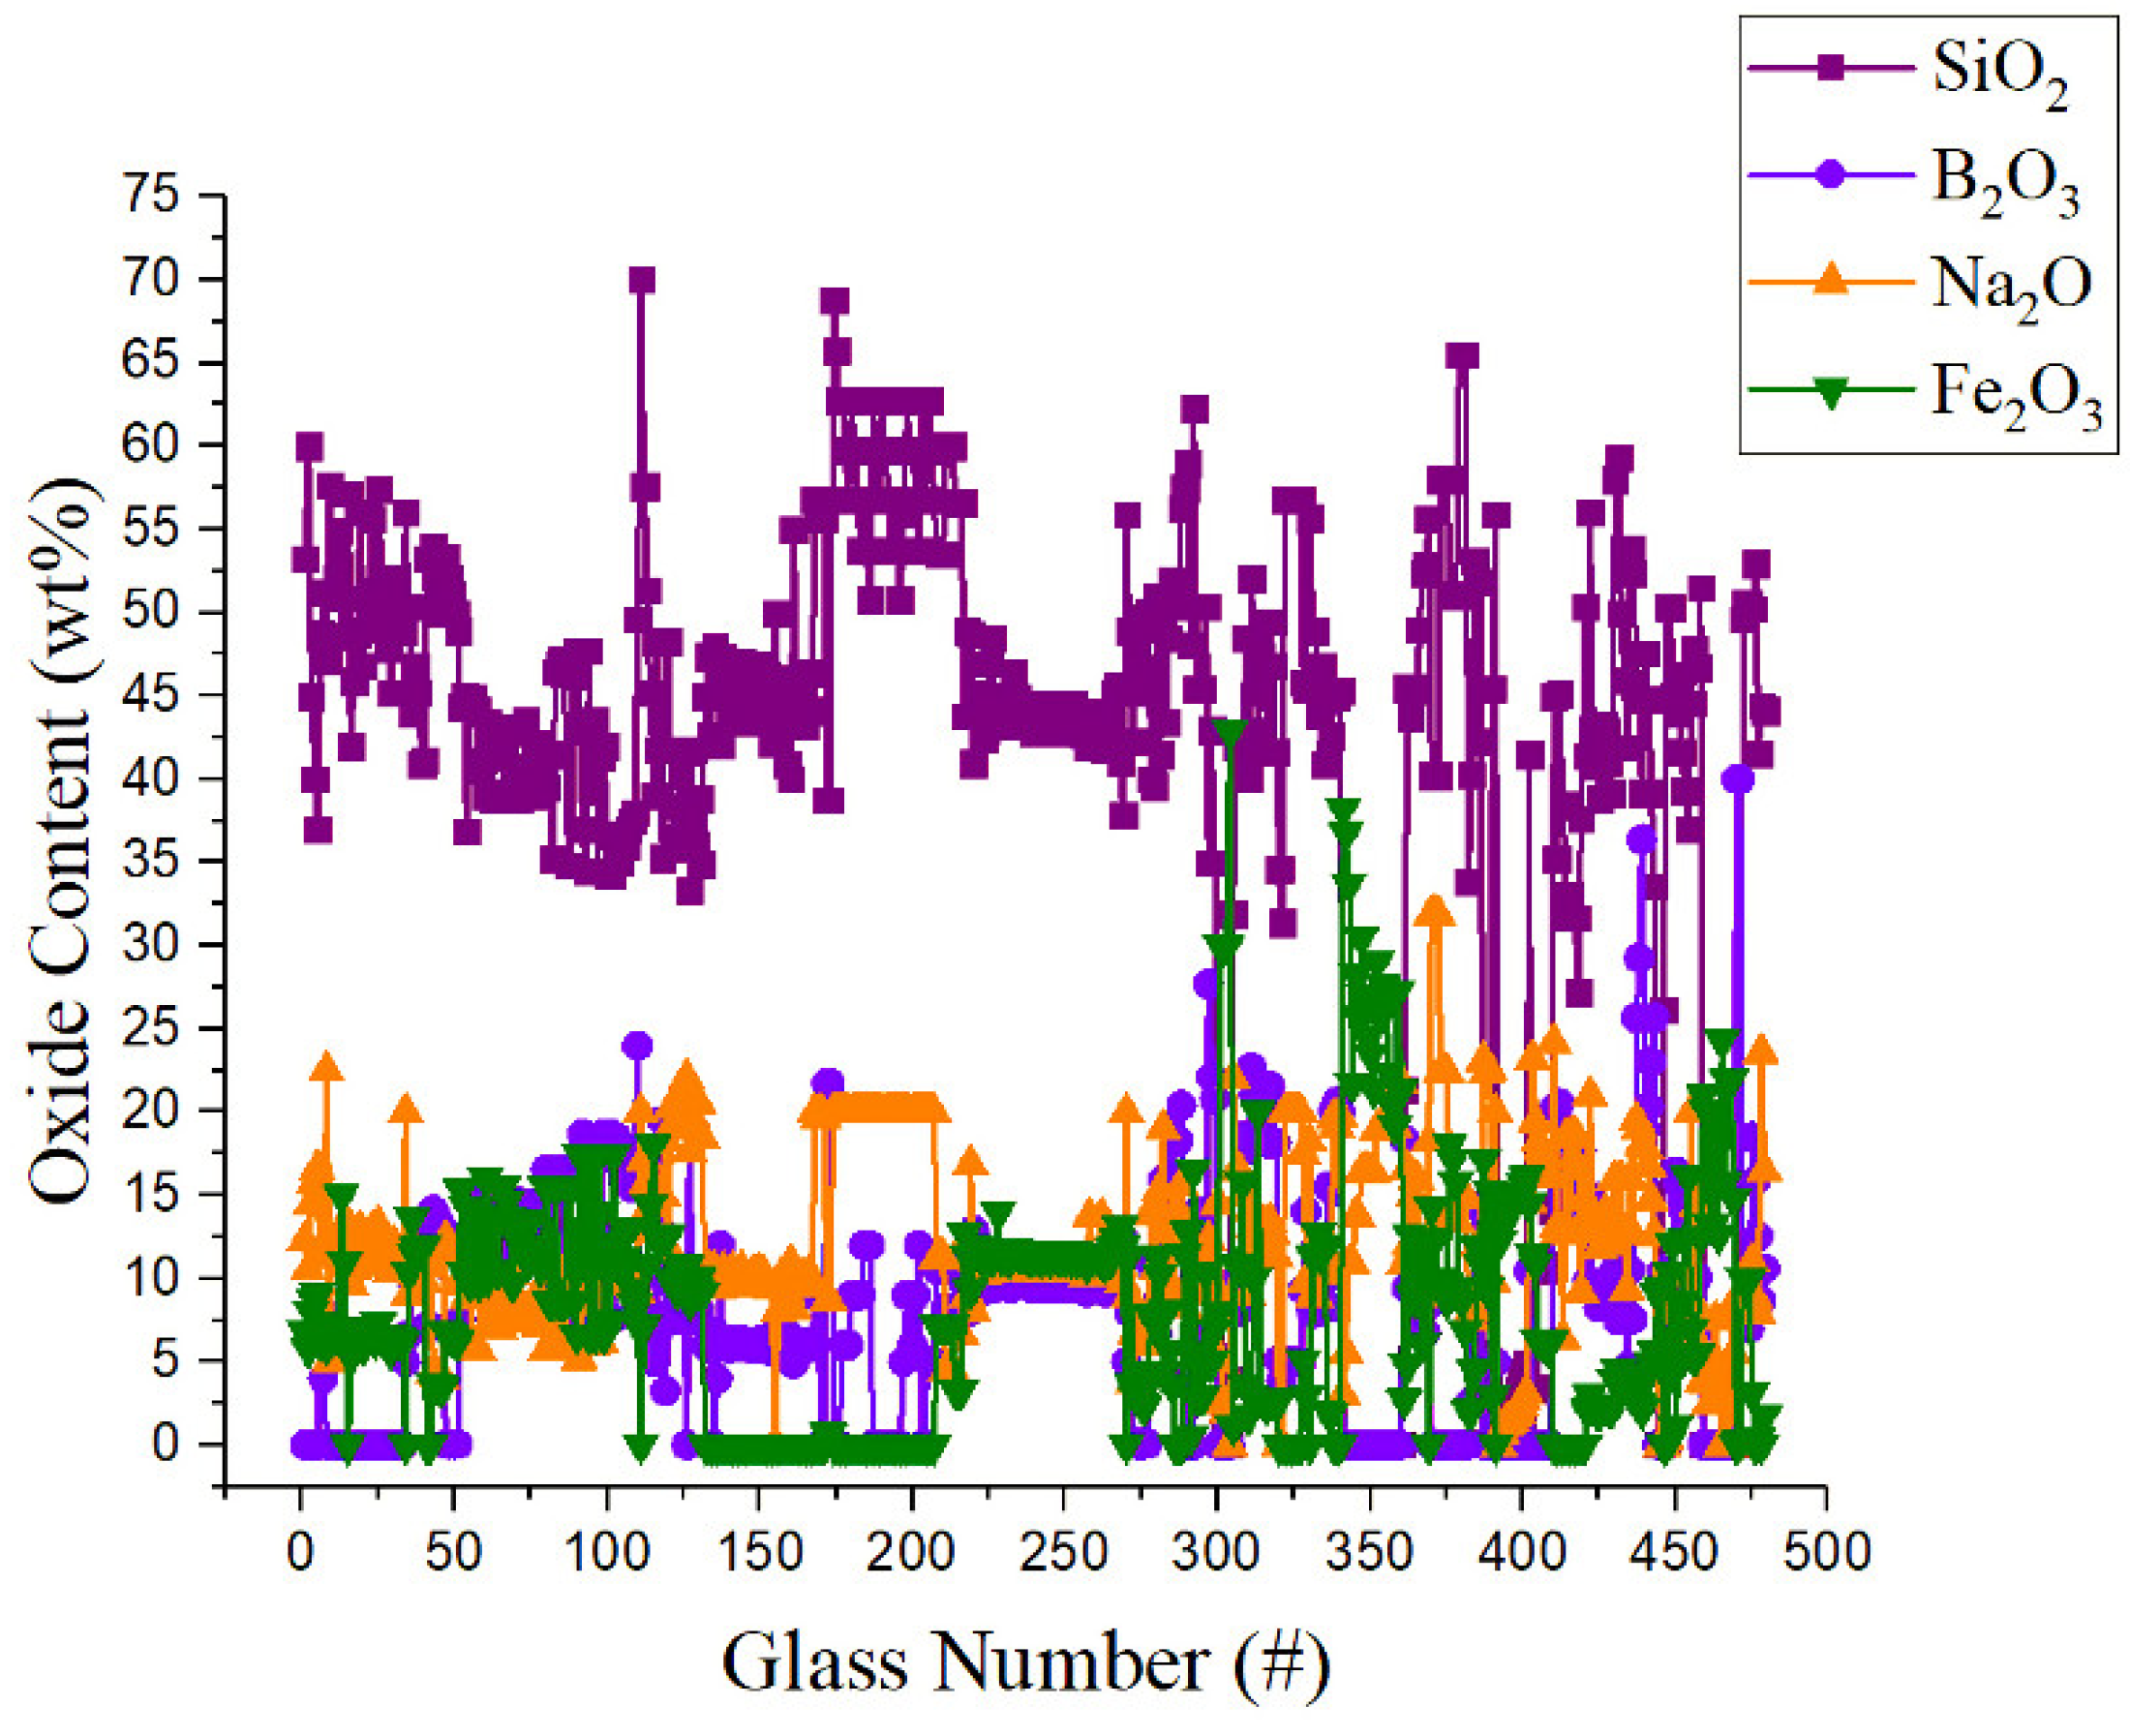
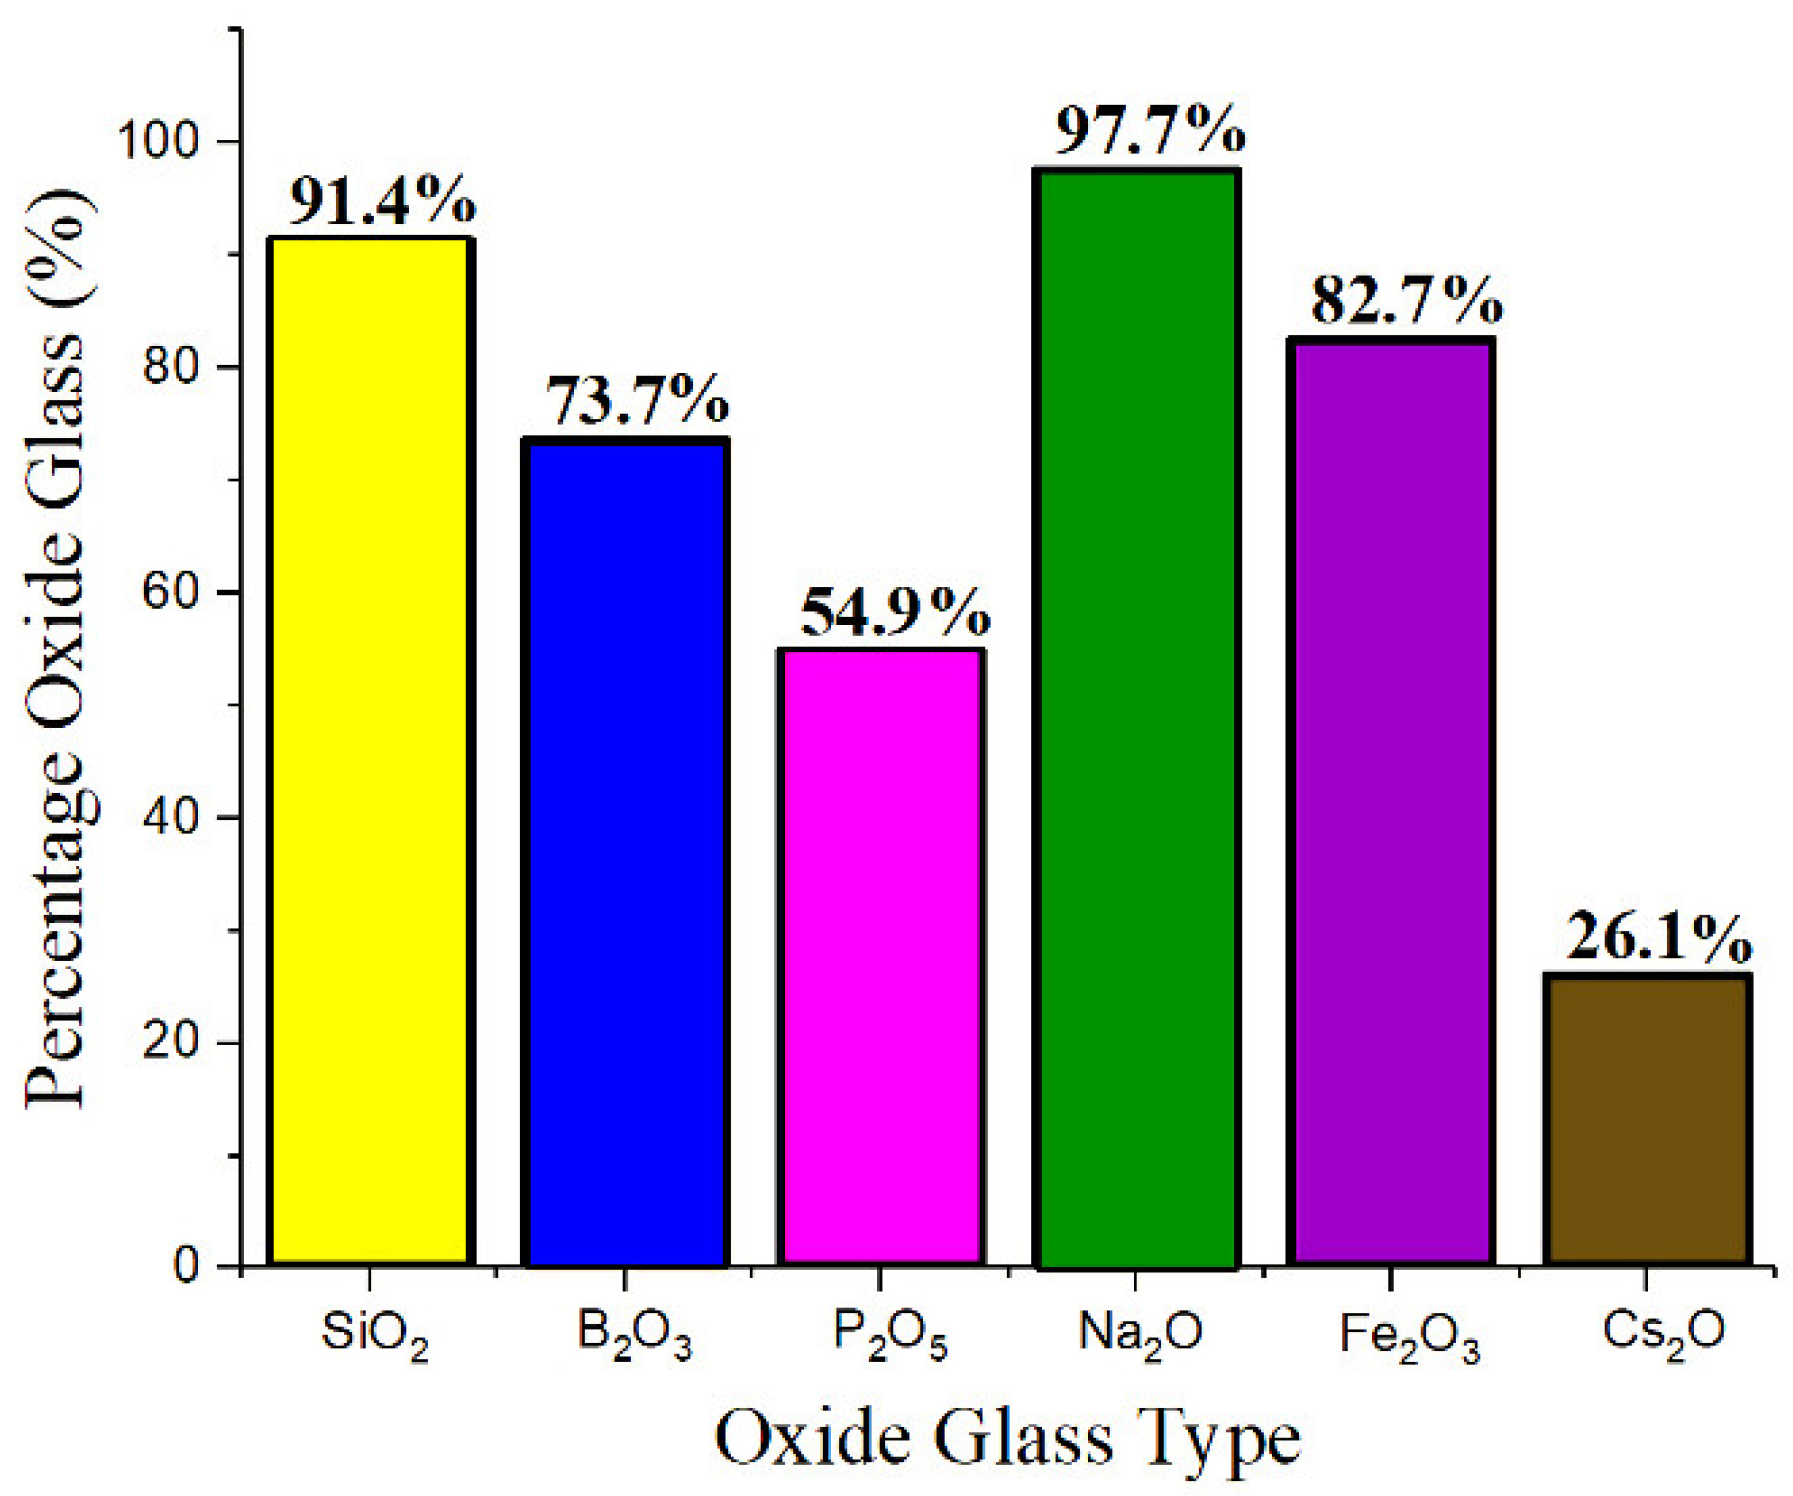
2.1. Selection of Data on Glass Composition

The analyzed data were collected from the SciGlassTM Russian-American database (version 7.9). SciGlass is one of the largest glass databases (the other is the Japanese Interglad©, currently in version 8.1, Japan Glass Industry Center 2F, 3-21-16 Hyakunincho, Shinjuku-ku, Tokyo 169-0073), and it contains data for approximately 375,000 glass systems, including oxides, chalcogenides, and halides and covering thermal, electrical, elastic, optical, acoustical as well as other properties [7]. The examined glass compositions were extracted from the database using the search string “radioactive waste”, which identified 479 different formulations. Most data used for the analysis are in fact designed for testing purposes (e.g., durability and leaching) rather than real use. The data used in our multivariate analyses are reported in Supplementary Table S1 and the corresponding references [8,9,10,11,12,13,14,15,16,17,18,19,20,21,22,23,24,25,26,27,28,29,30,31,32,33,34,35,36,37,38,39,40,41,42,43,44,45,46,47,48,49,50,51,52,53,54,55,56,57,58,59,60,61,62,63,64,65,66,67,68,69,70,71,72,73,74,75,76,77,78,79,80,81,82,83,84,85,86,87,88,89,90,91,92,93,94].
The chemical compositions for the t = 479 glasses (or labels) used in this work are reported in Supplementary Table S1 and references therein and relate to many glass compositions produced in France, the United Kingdom, Russia, India, Belgium, and others, of high-level wastes. These data form a matrix X, in which columns are the fractions of the n = 51 chemical compounds listed in Table 1. The glasses are all identified in Supplementary Table S1 and grouped in seven radioactive-waste glass families: Borosilicates (SiB: 288 compositions), silicates (Si: 57 compositions), boroaluminosilicates (SiAlB or SiBAl: 54 compositions), iron phosphates (PFe and PFeSi: 32 compositions), aluminosilicates (SiAl: 20 compositions), sodium iron phosphates (PNaFe, PFeNa, PNaAlFe, PNaFeAlSi: 26 compositions), and boroaluminates (BAl: 2 compositions).

2.2. Hierarchical and Non-Hierarchical Clustering Methods

Clustering is a multivariate computational technique that groups a set of data points into a fixed number of clusters, in order that points within a cluster are similar and points from different clusters are dissimilar [95,96,97]. Hierarchical and non-hierarchical clustering are exploratory methods in a multivariate analysis that identify groups with similar characteristics [98]. The formation of these groups can help in identifying common factors not perceived without the grouping.
First, we used hierarchical arrangements to define the sorting and attribution of observations (or labels), thus allowing us to recognize, assess, and select the number of clusters employing the largest Euclidean distance leap [99]. Then, we considered this number of clusters for the non-hierarchical procedure.
Next, we applied K-means clustering, one of the most popular methods of non-hierarchical cluster analysis. It is an unsupervised clustering method that reduces observer subjectivity by partitioning data into K-clusters for compressing or summarizing original values. The mathematical algorithm is that each group is nucleated by a centroid, the central point of the cluster [100,101]. Therefore, the K-means concept is a generalization of the ordinary sample mean [97], where the centroid can be viewed as a special case of a mean, or average, of a cluster. The partitioning criterion is a distance measure, for example, the Euclidean distance. Conceptually, K-means is quite simple: In each iteration, every datum is associated with the cluster nearest to the cluster’s center [102]. Then, this center changes as new data are associated with the cluster until convergence occurs.
In this work, we utilized dendrograms: Diagrams that display clusters formed by grouping observations at each step and their similarity levels. We computed a dendrogram based on Euclidean distances and the average linkage method [99]. Analyzing the dendrogram makes it possible to select the number of clusters formed based on distance weighting [99].

2.3. Principal Component Analysis

The principal component analysis (PCA) is one of the simplest multivariate techniques offering the best results when the original variables are highly correlated [98,103,104]. It is a method widely used for simplifying the data. PCA identifies the degree of relationships and impacts of the variables, separating data that contain all the required information. It is a process of condensation of the sample under study with minimal loss of information. PCA analyzes a set of data described by many variables and extracts the most important information through new orthogonal principal components. The original data are reported in a new coordinate system with fewer variables, whose importance relates to the variation in the data [103,104]. According to Hair et al. [98], distance measurements considering hierarchical and non-hierarchical clustering focus on magnitude values and portray similar cases that are closer, even including their different patterns across the variables. In contrast, covariance from PCA focuses on the patterns across the variables and does not consider the magnitude of the differences between waste glass compositions. Covariance PCA analyses focus on patterns rather than the more traditional distance measure and require a different interpretation of the results.
The PCA procedure can be expressed in terms of matrix algebra [105]. First, the eigenvalue equation of matrix X is solved, namely, an equation in λ with n roots (n = 51, the matrix dimension). The eigenvalues correspond to the amount of original variance for the respective eigenvectors, following an order of relevance related to every principal component: λi > λj > … > λn and with λi + λj + … + λn = n.
The number of principal components were selected using the “scree plot” [98], a line plot of the eigenvalues of principal components in an analysis. This plot allows the display of high dimensional data, the search for essential attributes/variables, and a dimensionality reduction [105]. The first component (PC1) is the path across the data plot that defines the highest variability. The second and subsequent component (PC2) must be orthogonal to the previous PC1 and describe the maximum remaining variabilities [106].

2.4. Execution of Numerical Multivariate Computations

Multivariate analyses were performed on the raw data for the 479 different glass compositions to determine which one of the 51 variables mentioned above (i.e., the relative concentrations of different glass formers) is more relevant. The computations were performed using IBM SPSS Statistics 25 and OriginLab 2017.
As mentioned earlier, a hierarchical approach was first used to explore similarities between observations based on the behavior of certain variables. This approach allowed us to sort and allocate the observations, providing options for selecting the number of clusters and analyzing them [99].
A subsequent non-hierarchical approach named K-means [97] was performed. This algorithm groups data points into predefined clusters based on the relative distance of the points from their centroids. For every round of K-means, the distance between every data point and every centroid was calculated via Euclidean distances. A key issue with the K-means algorithm is selecting the initial conditions (the centroids). We followed the general approach of randomly choosing the initial centroids within the range of the data until convergence occurred [97]. To verify the overall adequacy of our PCA, Bartlett’s “sphericity test” was then performed [99,107], which consists of comparing a correlation matrix (Supplementary Table S2) with an identity matrix of the same dimension: The PCA method is deemed adequate if the two matrices are significantly different.

3. Results and Discussion

Our data highlight the existence of seven radioactive-waste glass families, including 60.1% borosilicates, followed by 11.9% silicates, 11.3% aluminoborosilicates, 6.7% iron phosphates, 5.4% sodium iron phosphates, 4.2% silicoaluminates, and 0.4% boroaluminates. The composition of these glasses includes not only glass formers, but also glass modifiers and intermediates. Most glasses are not fully homogeneous and thus require additives to contrast the presence of significant amounts of bubbles, foreign inclusions, such as refractory oxides, and other immiscible components [1]. Small quantities of SO3, a well-known refining substance, were detected in almost all analyzed substances.
Figure 1 shows the frequency distribution of the main oxides encountered in the glasses, namely SiO2, B2O3, Na2O, and Fe2O3 for the 479 glasses. Silica is prevalent over a wide composition range with a maximum of 70 wt%, followed by boron oxide with up to 40 wt%. Cases with nil concentrations of both silica and boron oxide were also encountered, mainly among phosphate glasses.
Figure 2 shows the percentage of oxide glass formers and modifiers considering any percentage content (i.e., from dopant level up to the maximum concentration). Sodium, silicon, iron, and boron oxides prevail in most radioactive-waste glasses analyzed in this work.
In a first analysis, two variables, Xi and Xj, each one corresponding to n variables and t labels, and their respective averages, were examined in terms of the Pearson correlation coefficient [108] corr(Xi, Xj). The results reported in Supplementary Table S2, regardless of the magnitude of each Xi variable, show that silica and phosphorus glass formers are highly correlated, with a correlation coefficient corr(X1, X30) = −0.857. The highest correlation was observed between CaF and CdO, with corr(X6, X8) = 0.868. The same procedure analyzing Cs2O and TeO2 resulted in corr(X13, X42) = 0.819; also, Nd2O3 and WO3 substances resulted in corr(X28, X46) = 0.816, followed by F and WO3, with corr(X16, X46) = 0.804, and then by HfO2 and PuO2, that resulted in corr(X20, X33) = 0.803, showing that they are also highly correlated. These results agree with Bartlett’s test of sphericity due to the fact that if the correlation matrix data are close to an identity matrix, there would be no correlations between the variables.

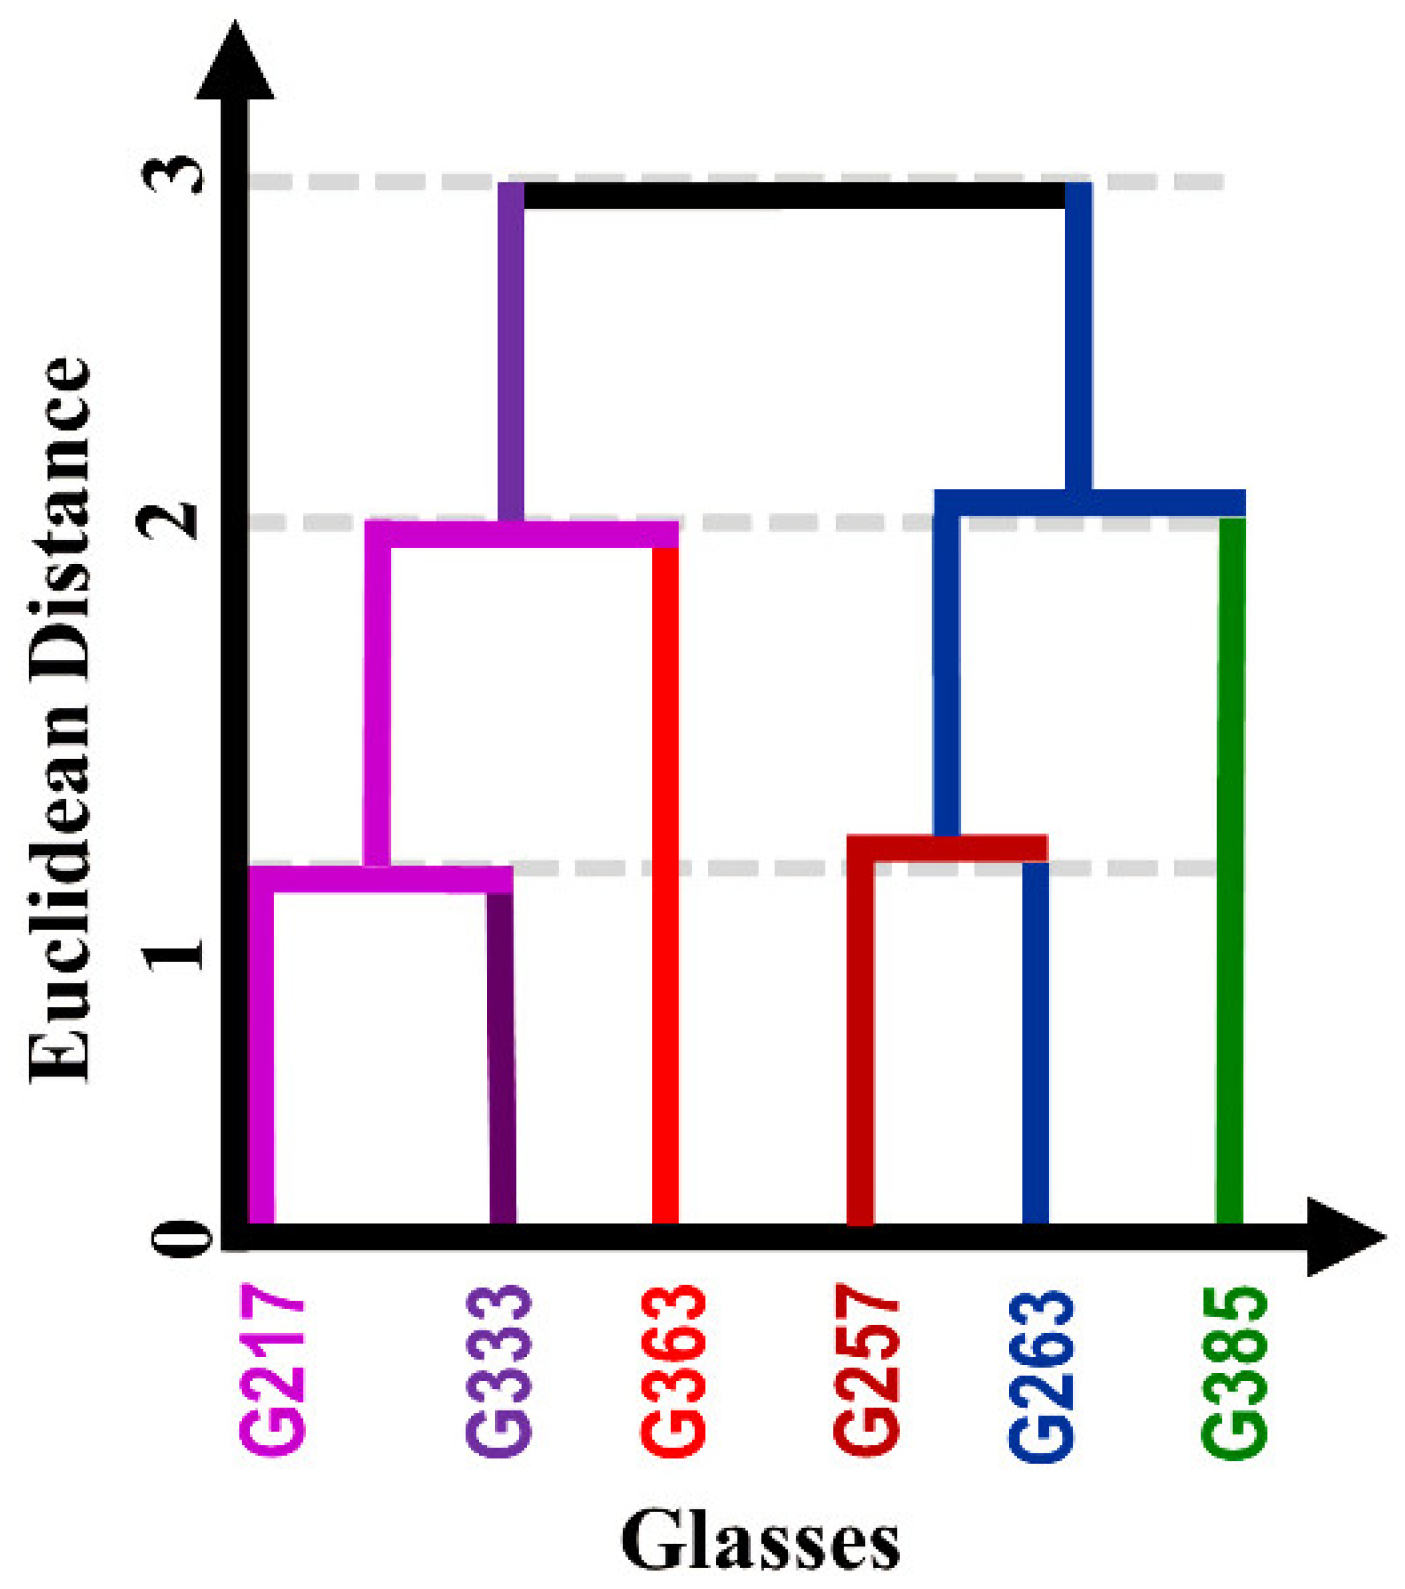
3.1. Hierarchical Clustering

Four clusters were established from the dendrogram, which were obtained by taking the largest Euclidean distance leap [99]. From these data, it was possible to verify that glasses G217 and G333 were the most similar (due to the smallest distance) among the 479 glass compositions and the 51 variables, leading to the first clustering stage. A schematic dendrogram is presented in Figure 3. The first cluster comprises 419 glasses (G1 to G299, G305 to G340, G361 to G386, G390 and G391, G402, G410 to G443, G446 to G458, G472 to G479), mainly silicates, borosilicates, aluminosilicates, and boroaluminosilicates. The second cluster comprises 46 iron phosphate glasses (G300 to G304, G341 to G360, G387 to G389, G403 to G409, G459 to G469) with considerable amounts of aluminum, silicon, and sodium oxides. The third cluster comprises 12 iron phosphate glasses (G392 to G401, G444 and G445), and the fourth cluster has only 2 boroaluminate glasses (G470 and G471). All clusters agree with the 7 radioactive-waste glass families identified.
As presented in a schematic plot (Figure 3), glasses G217 and G333 were the most similar, followed by G363 forming a small cluster. In the same way, glasses G257 and G263 were the most similar, followed by G385 in terms of composition.

3.2. Non-Hierarchical Data Analysis

Four clusters were also obtained using K-means, providing almost the same results obtained from our hierarchical clustering. Two minor differences were observed between hierarchical and non-hierarchical clusters: G361 and G446 changed from clusters 1 to 4. These minor differences are mainly due to computational procedures. For example, one relevant difference is that the distance matrix is calculated once in the hierarchical method, while in the non-hierarchical method, it is modified many times until convergence. The first cluster comprises 417 glasses (G1 to G299, G305 to G340, G362 to G386, G390 and G391, G402, G410 to G443, G447 to G458, G472 to G479), mainly silicates, borosilicates, aluminosilicates, and boroaluminosilicates. The second cluster comprises 46 iron phosphate glasses (G300 to G304, G341 to G360, G387 to G389, G403 to G409, G459 to G469) with considerable amounts of aluminum, silicon, and sodium oxides. The third cluster comprises 12 iron phosphate glasses (G392 to G401, G444 and G445), and the fourth cluster has only 4 boron aluminate glasses (G361, G446, G470 and G471).

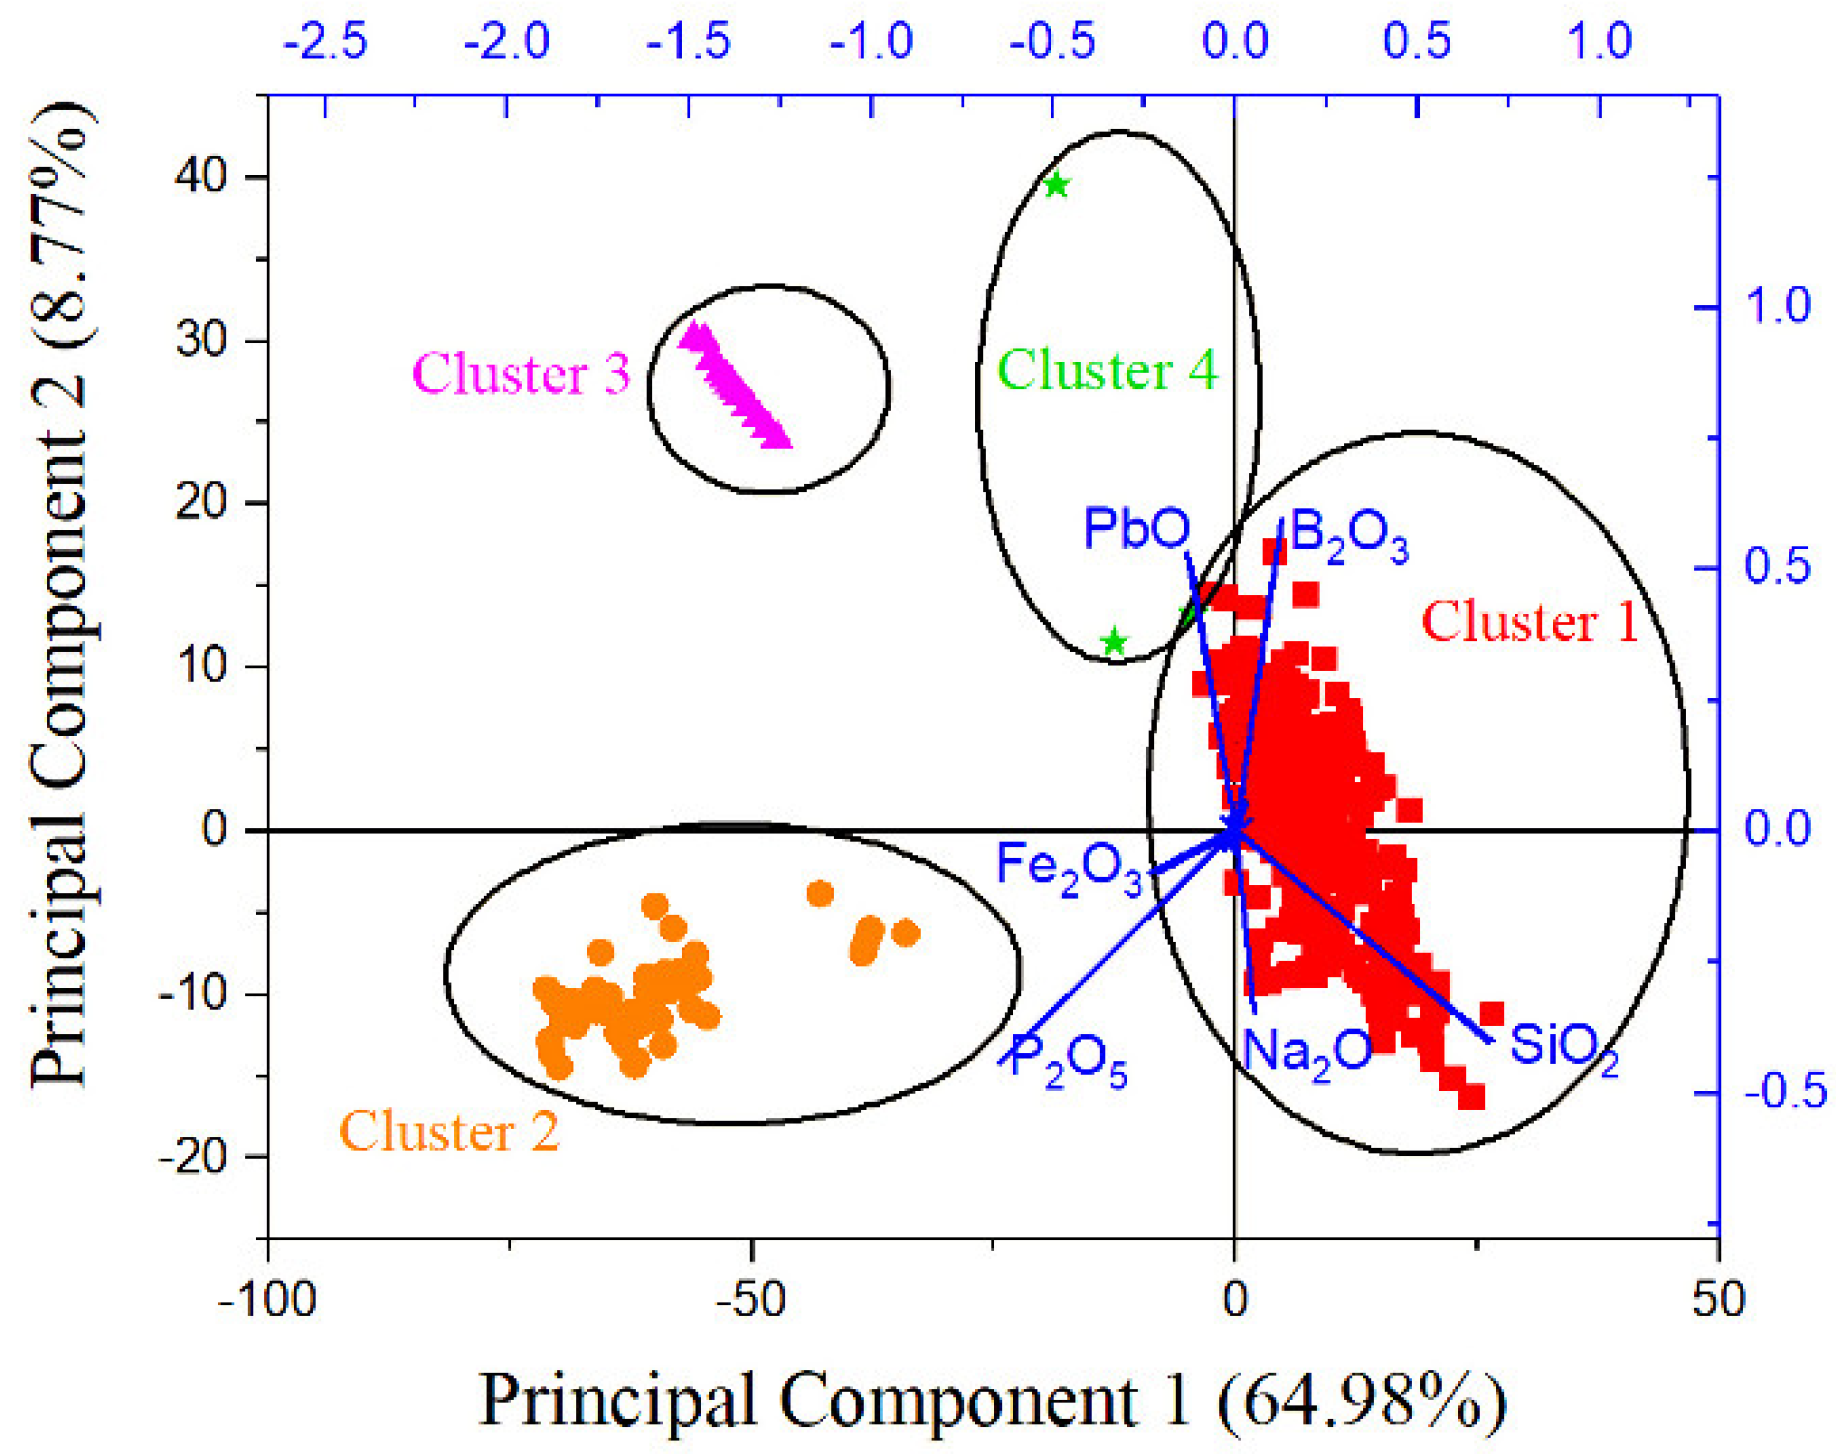
3.3. Principal Component Analysis

Bartlett’s sphericity test yielded a significantly higher result than the relevant threshold value, indicating that our PCA analysis on radioactive-waste glass compositions was adequate [98], as presented by high correlations between the variables shown in Supplementary Table S2. Indeed, several examples of glass compositions analyzed by PCA can be found in the literature [106], considering a plethora of data on binary and ternary silicate and borate glass systems or only silica glass types [109].
By examining the raw data, the number of main components identified from the data chart was two, which was obtained by plotting the eigenvalue against the number of variables in their order of extraction. The shape of the resulting curve is used to evaluate the cut-off point by applying the tangent method (defining the intercept between the two lines), as suggested by Hair et al. [98]. Therefore, from the scree plot (not shown in this work), only two eigenvalues were found, respectively, representing 64.98% and 8.77% of the variance.
Figure 4 shows the mapping distribution of principal component 1 (PC1), related mainly to silicates and borosilicates, and principal component 2 (PC2) related mainly to lead iron phosphate glasses, as described below. More precisely, almost all data could be characterized by the first two axes (and in agreement with the results presented in Table 2 and Table 3). Silicates, borosilicates, aluminosilicates, and boroaluminosilicates are located at the center of this two-dimensional graph, and two borates are located above the graph. Iron phosphate glasses with considerable amounts of aluminum, silicon, and sodium oxides are located in the third quadrant, and iron phosphates are located in the second quadrant. Moreover, it is possible to distinguish the four boroaluminate glasses. These results agree with the previous cluster analysis, showing four clusters.
Table 2 shows the total and cumulative percentages and respective eigenvalues of each axis considered, whereas Table 3 presents the eigenvector values of these respective parameters for the corresponding two PC axes.
The first component PC1, using the covariance matrix, can be expressed in terms of raw Xi variables from these tables as follows [110]:
PC1 = +0.70438X1 + 0.10248X2 + 0.0466X3 + 0.001X4 − 0.01909X5 − 0.01763X6 + 0.02779X7 + 1.73 × 10−4X8 + 0.003X9 − 4.14 × 10−5X10 + 2.31 × 10−4X11 − 0.00351X12 + 0.00117X13 + 2.23 × 10−4X14 + 1.65 × 10−5X15 + 2.21 × 10−4X16 − 0.21738X17 + 0.0069X18 + 0.0012X19 − 1.07 × 10−4X20 + 0.01541X21 − 0.00159X22 + 0.02854X23 + 0.00998X24 + 0.006X25 + 2.46 × 10−4X26 + 0.05085X27 + 6.63 × 10−4X28 + 0.00445X29 − 0.64988X30 − 0.12033X31 − 1.98 × 10−4X32 − 1.23 × 10−4X33 − 6.57 × 10−6X34 − 3.66 × 10−5X35 + 5.32 × 10−4X36 − 1.52 × 10−4X37 + 1.93 × 10−4X38 + 1.12 × 10−4X39 − 7.36 × 10−5X40 + 0.00302X41 + 1.55 × 10−4X42 + 0.00697X43 − 0.031X44 − 0.00441X45 + 1.42 × 10−4X46 + 7.81 × 10−5X47 + 0.00659X48 + 0.01827X49 + 0.0191X50 + 1.95 × 10−4X51
The coefficients (absolute values) of the first principal components in Equation (1), as presented in Table 3, are related in decreasing order to SiO2 (X1), P2O5 (X30), Fe2O3 (X17), B2O3 (X2), and PbO (X31) with their respective eigenvectors. More precisely, PC1 will be greater if X1 and X2 are high and if X17, X31, and X30 are low (other contributions are equal or below 5% in terms of coefficients). Therefore, the difference in these coefficients shows that 64.98% of the variation in the data are mainly related positively to borosilicates and negatively to iron phosphates and lead. As a result, the first principal component is influenced by approximately five substances for representing the variation in compositions of the 479 waste radioactive glasses.
The second principal component (considering the covariance matrix) can be interpreted similarly as follows:
PC2 = −0.40027X1 + 0.48875X2 − 0.02062X3 + 0.00743X4 − 0.01048X5 + 0.00699X6 + 0.05747X7 + 0.00372X8 − 0.0024X9 − 6.86 × 10−4X10 + 8.89 × 10−4X11 − 0.00788X12 + 0.00769X13 + 1.94 × 10−4X14 + 5.99 × 10−4X15 − 0.00361X16 − 0.07948X17 + 0.01948X18 + 0.00683X19 + 0.00242X20 + 0.06735X21 + 0.01509X22 + 0.05249X23 + 0.02401X24 − 0.01138X25 + 0.01802X26 − 0.34555X27 − 0.04281X28 − 0.00317X29 − 0.441X30 + 0.50572X31 + 0.00321X32 + 0.00692X33 + 8.36 × 10−5X34 − 4.06 × 10−5X35 − 0.0058X36 + 0.0092X37 + 5.44 × 10−4X38 + 0.00444X39 + 3.15 × 10−4X40 + 0.03535X41 + 0.001281X42 + 0.01526X43 − 0.03633X44 − 0.00248X45 − 7.56 × 10−4X46 + 3.44 × 10−4X47 − 0.02766X48 + 0.01158X49 + 0.07827X50 + 1.49 × 10−4X51
The coefficients of the second principal component in Equation (2), as presented in Table 3, relate to PbO (X31), B2O3 (X2), Na2O (X27), SiO2 (X1), and P2O5 (X30) with their respective eigenvectors. Specifically, PC2 will be greater if X2 and X31 are high and if X27, X1, and X30 are low (other contributions are below 8% in terms of coefficients). Therefore, the difference in these coefficients shows that 8.77% (see Table 2) of the variation in the data are mainly related positively to lead borates and negatively to sodium silicophosphates. With Equations (1) and (2), it is possible to plot Figure 4 considering the Xi data.

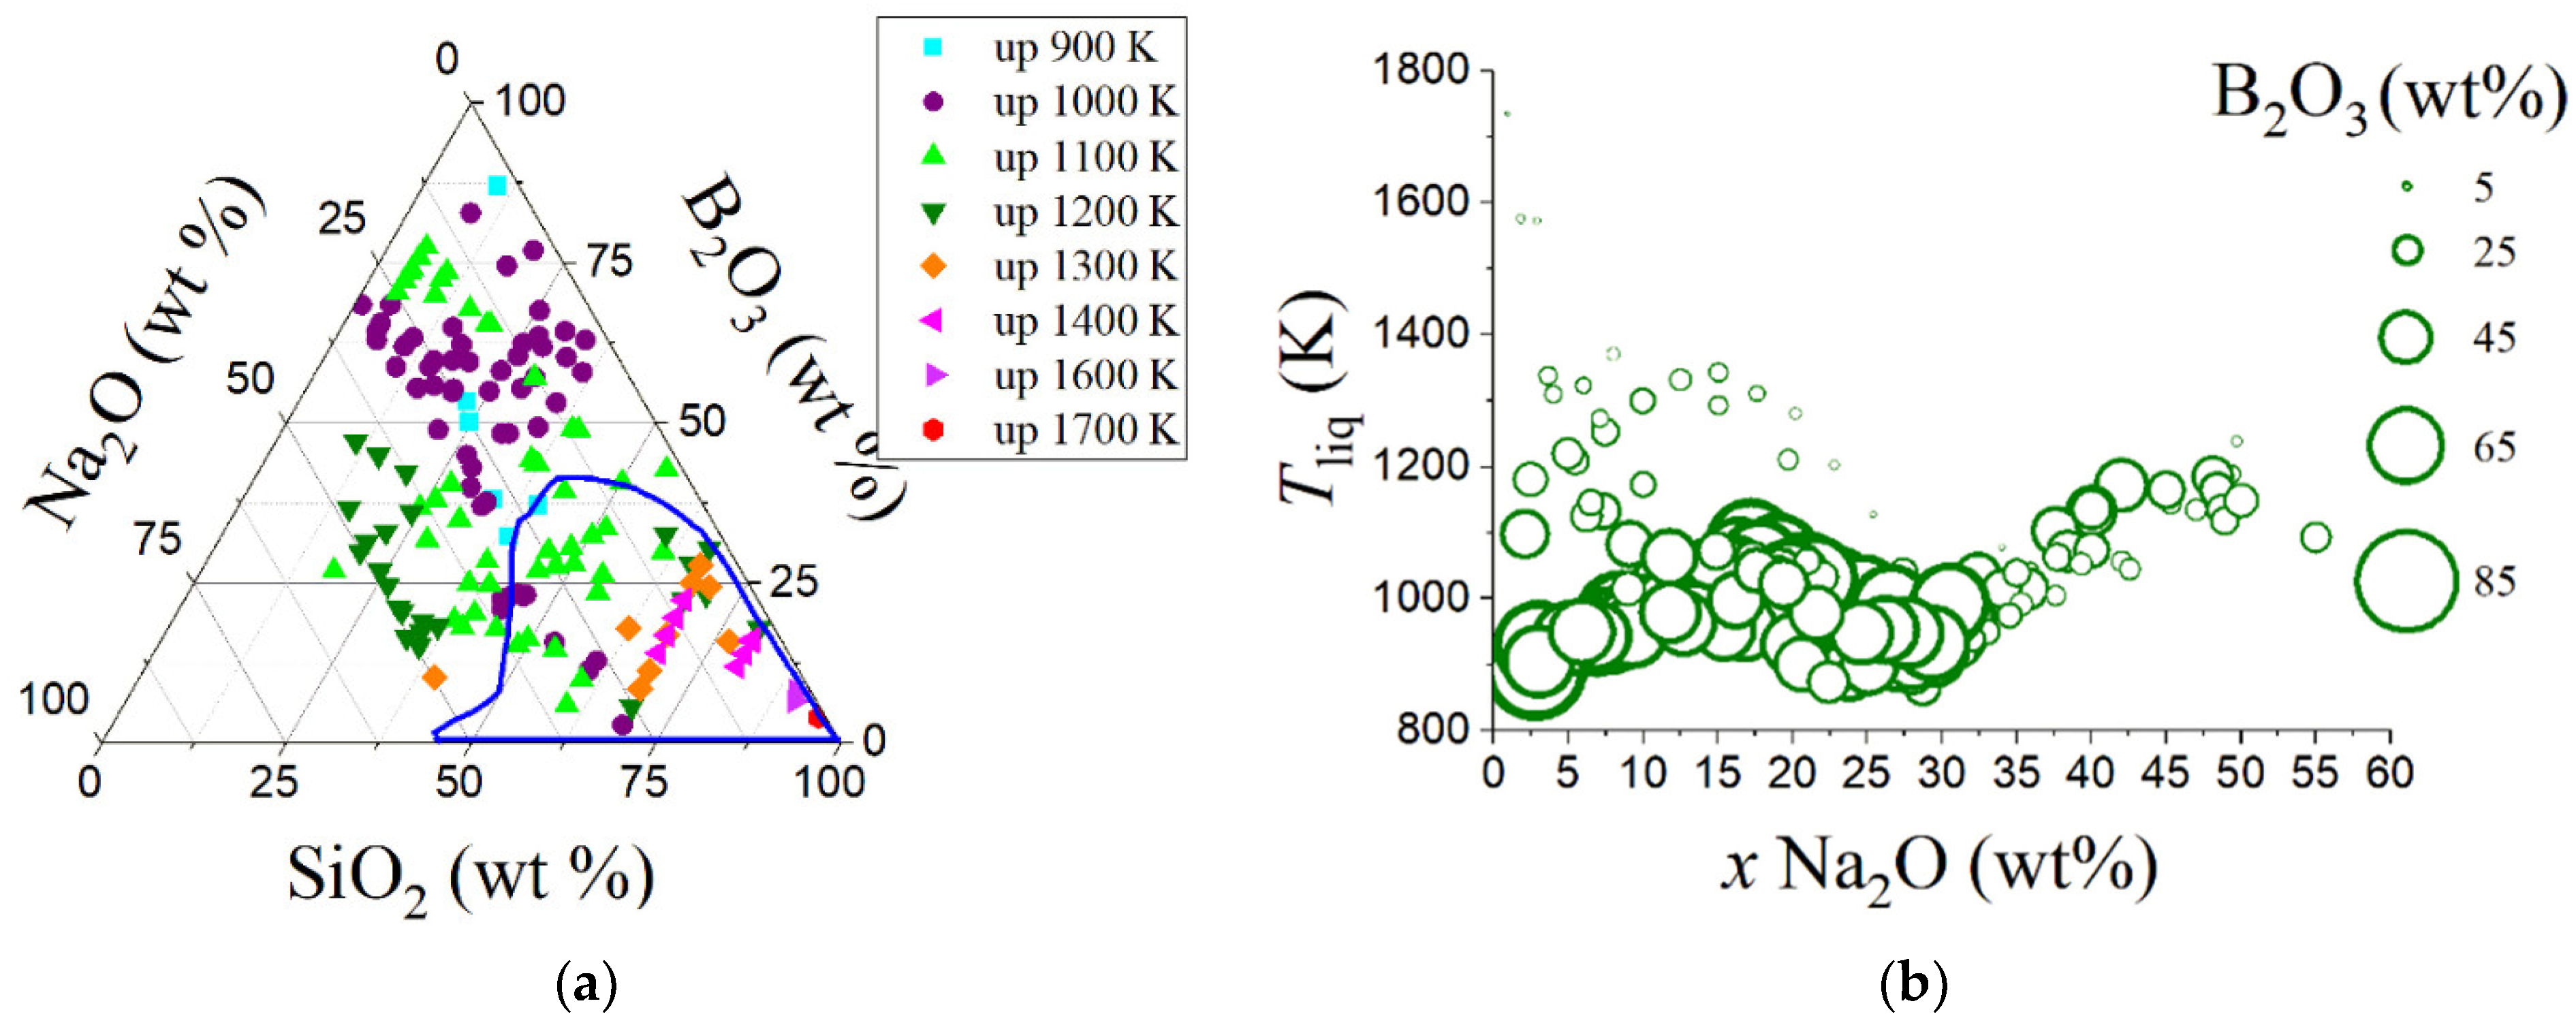
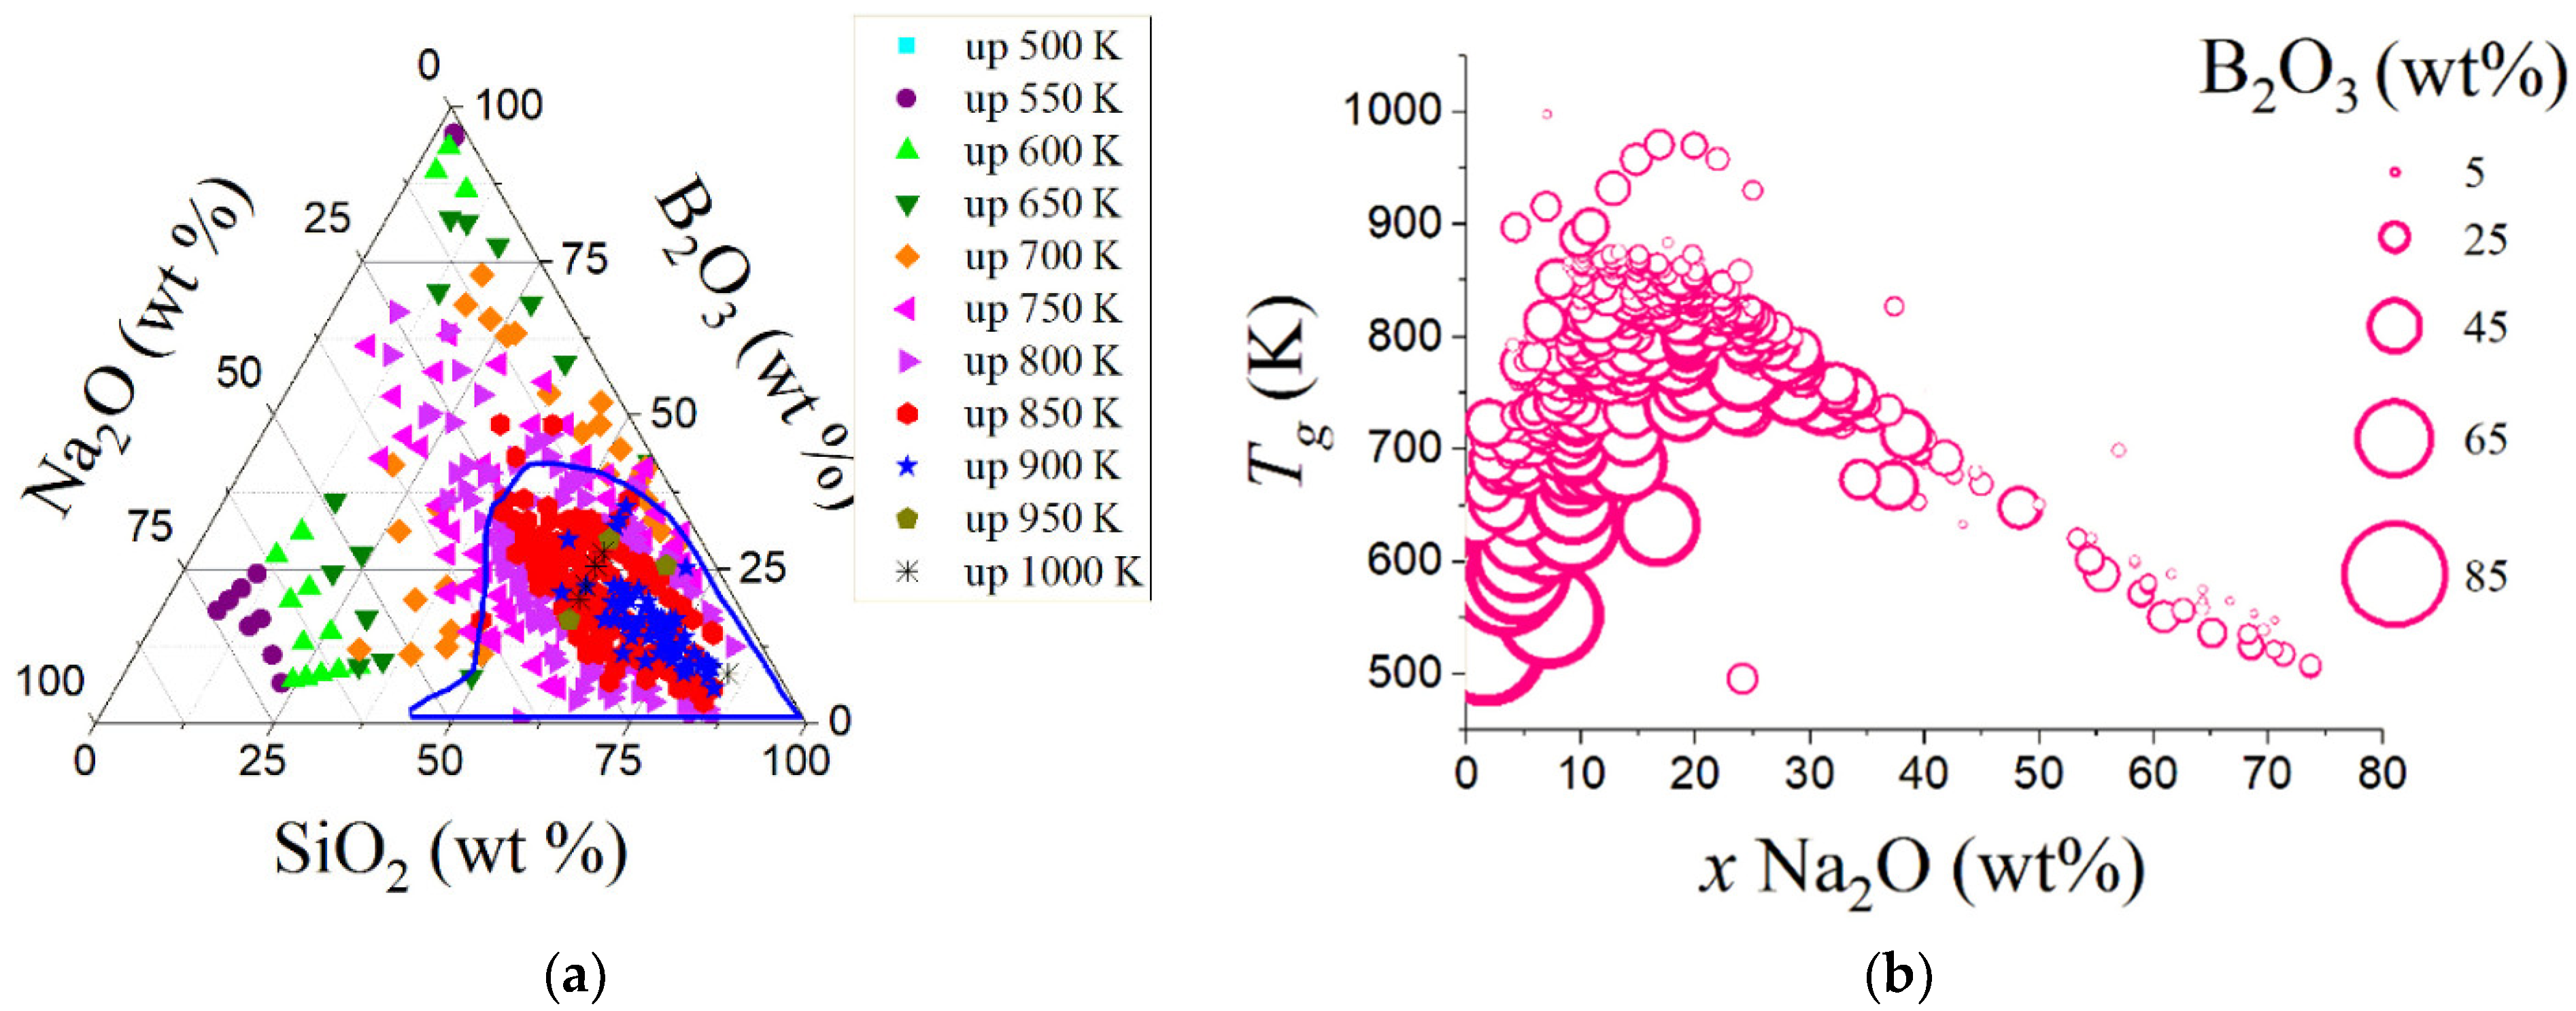
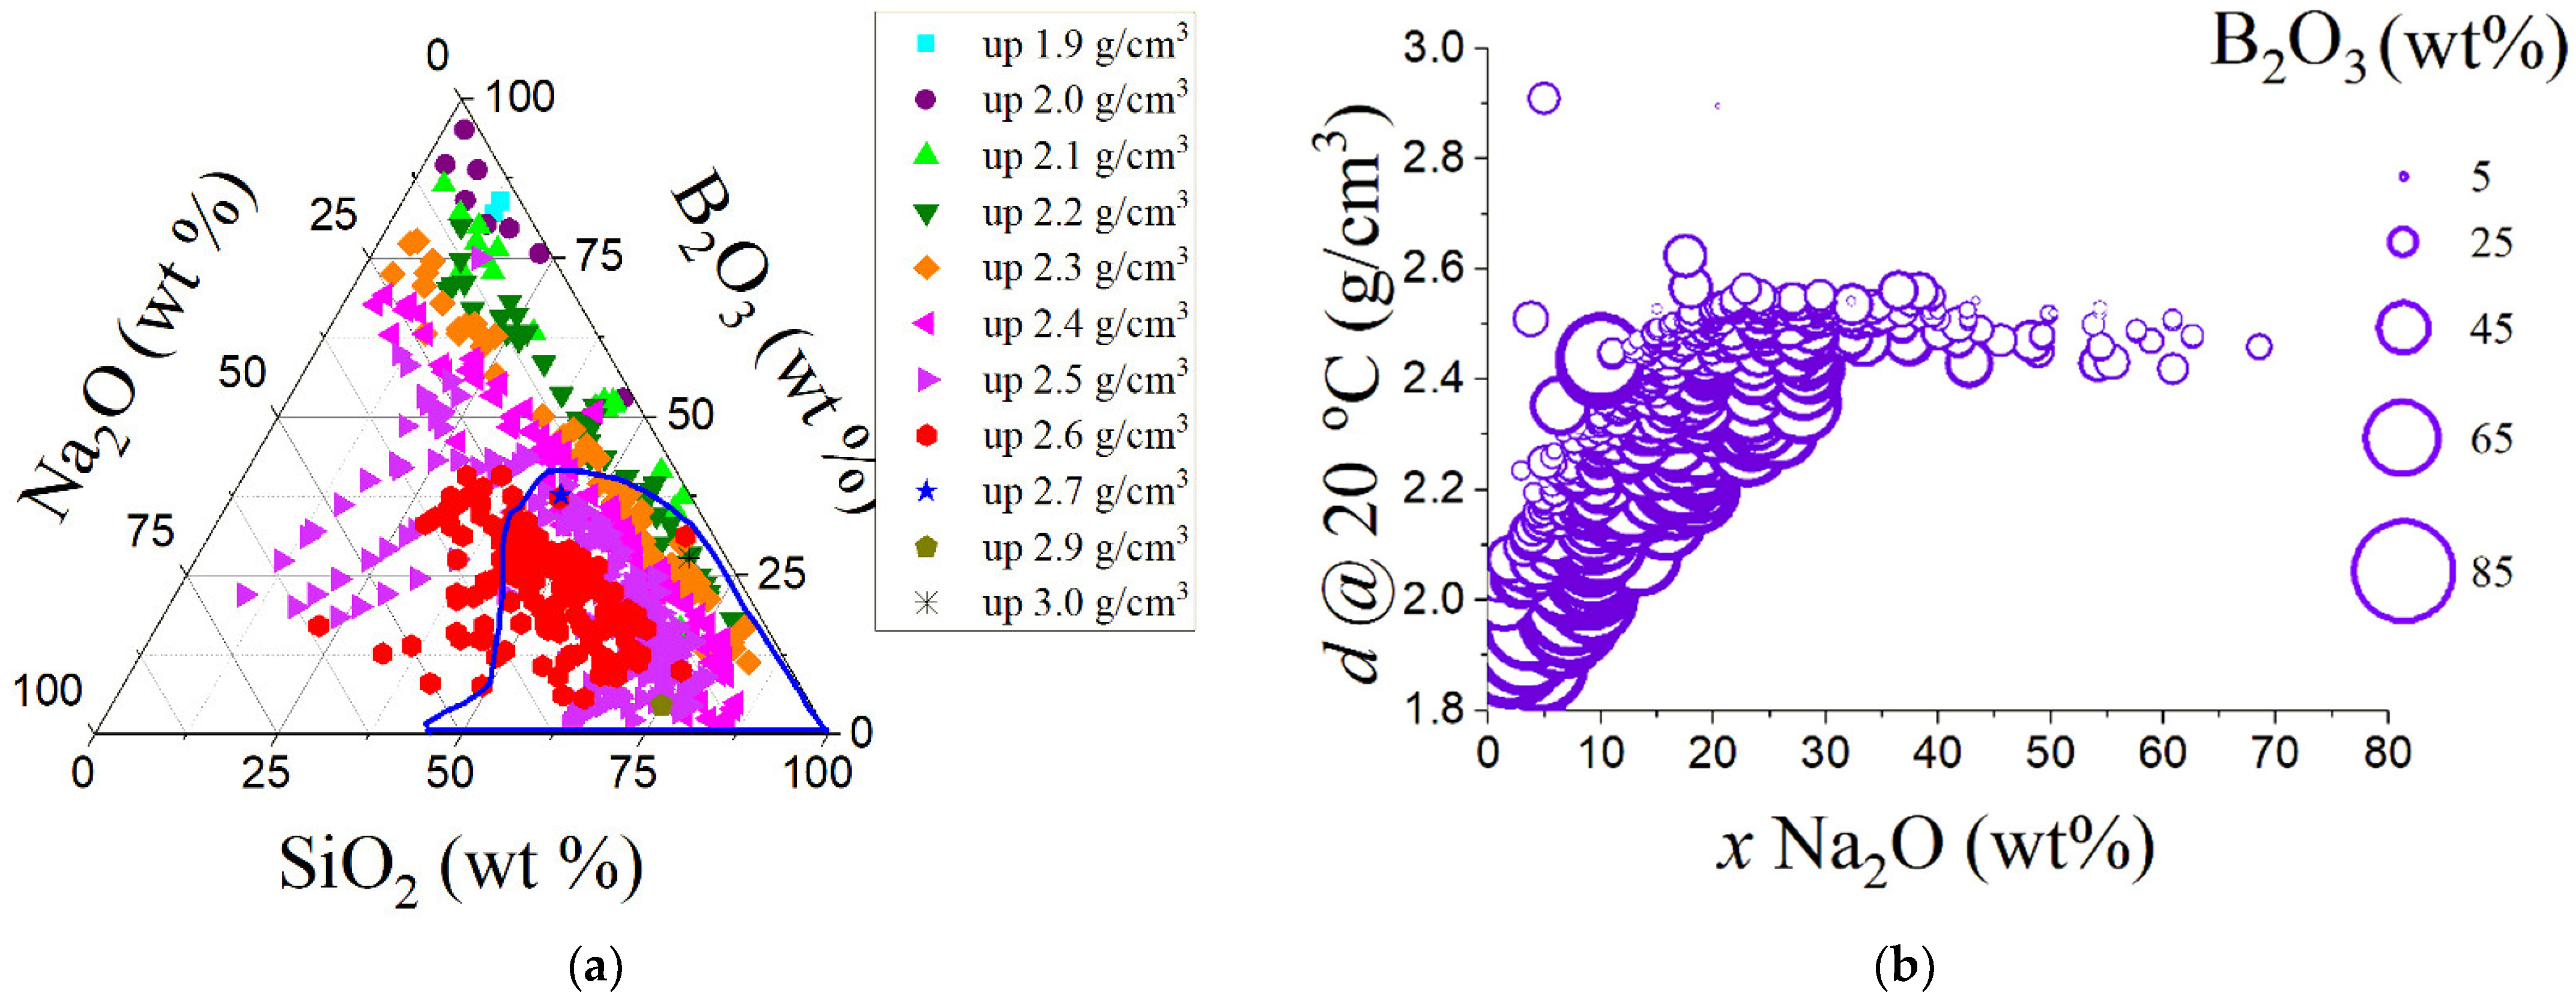
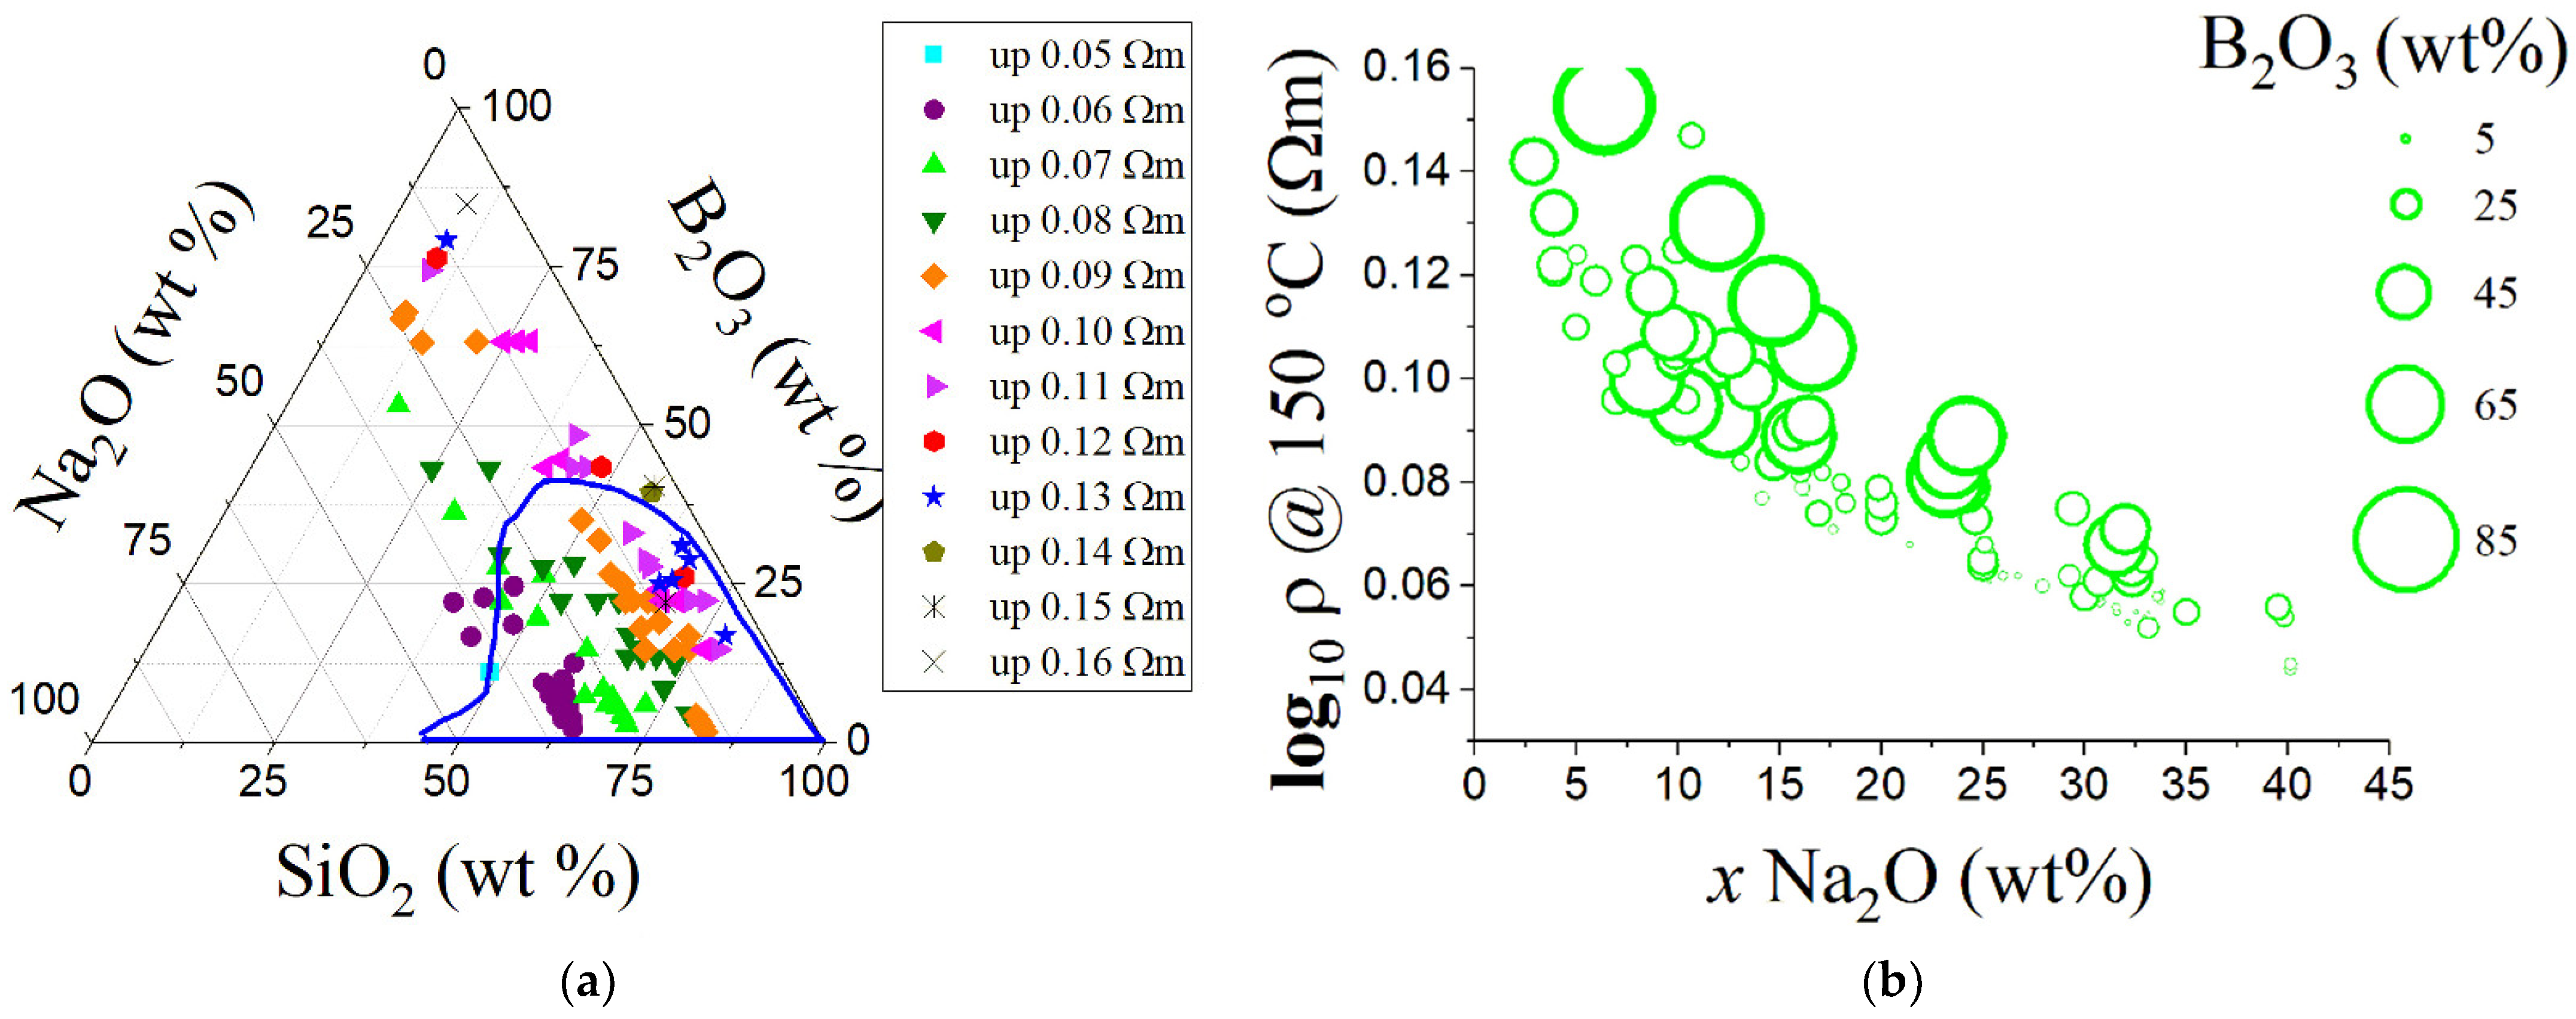
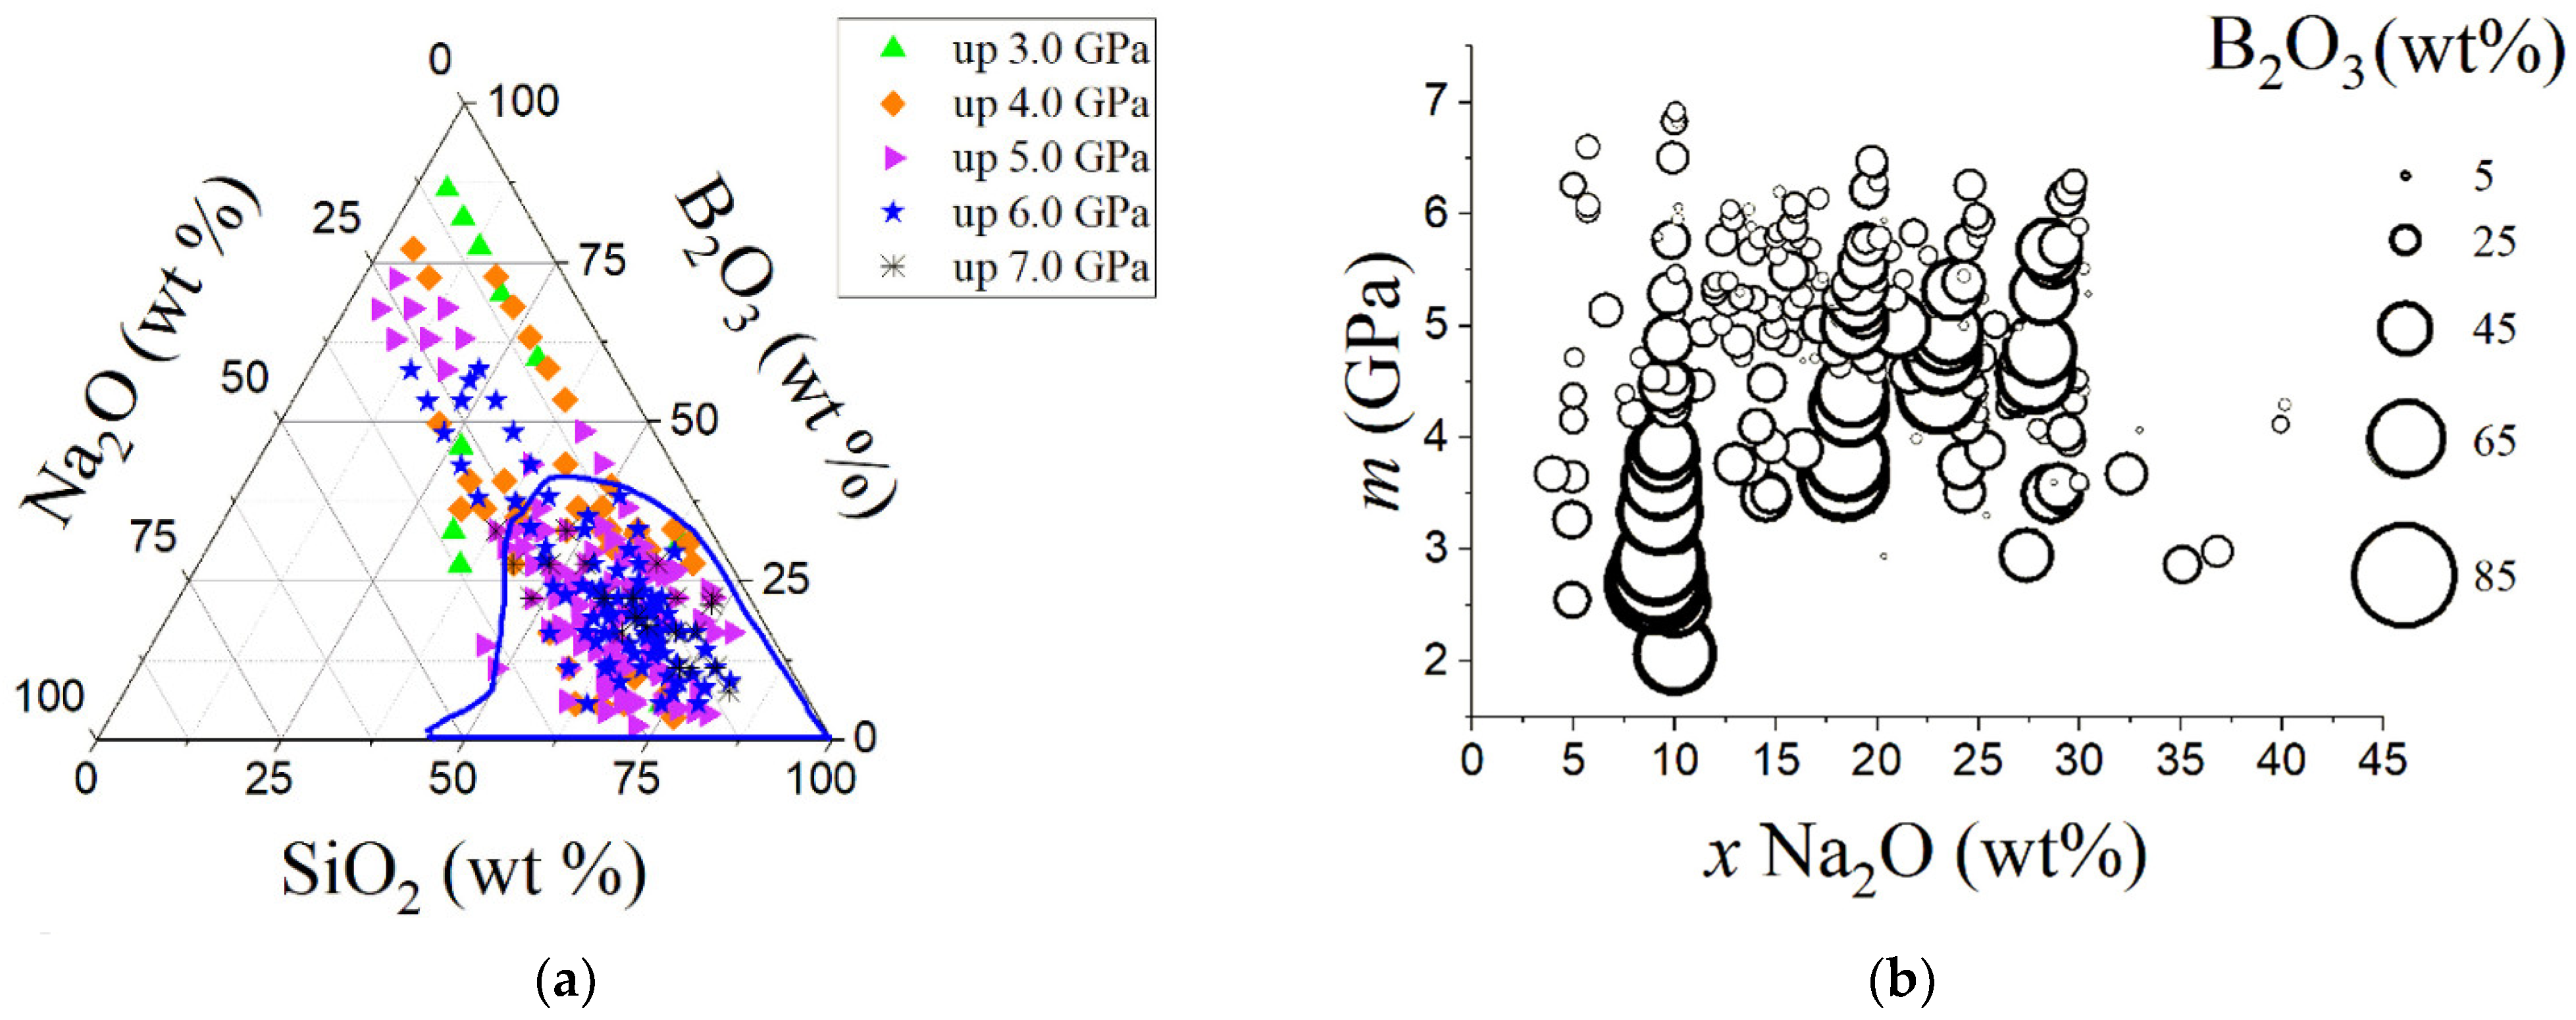
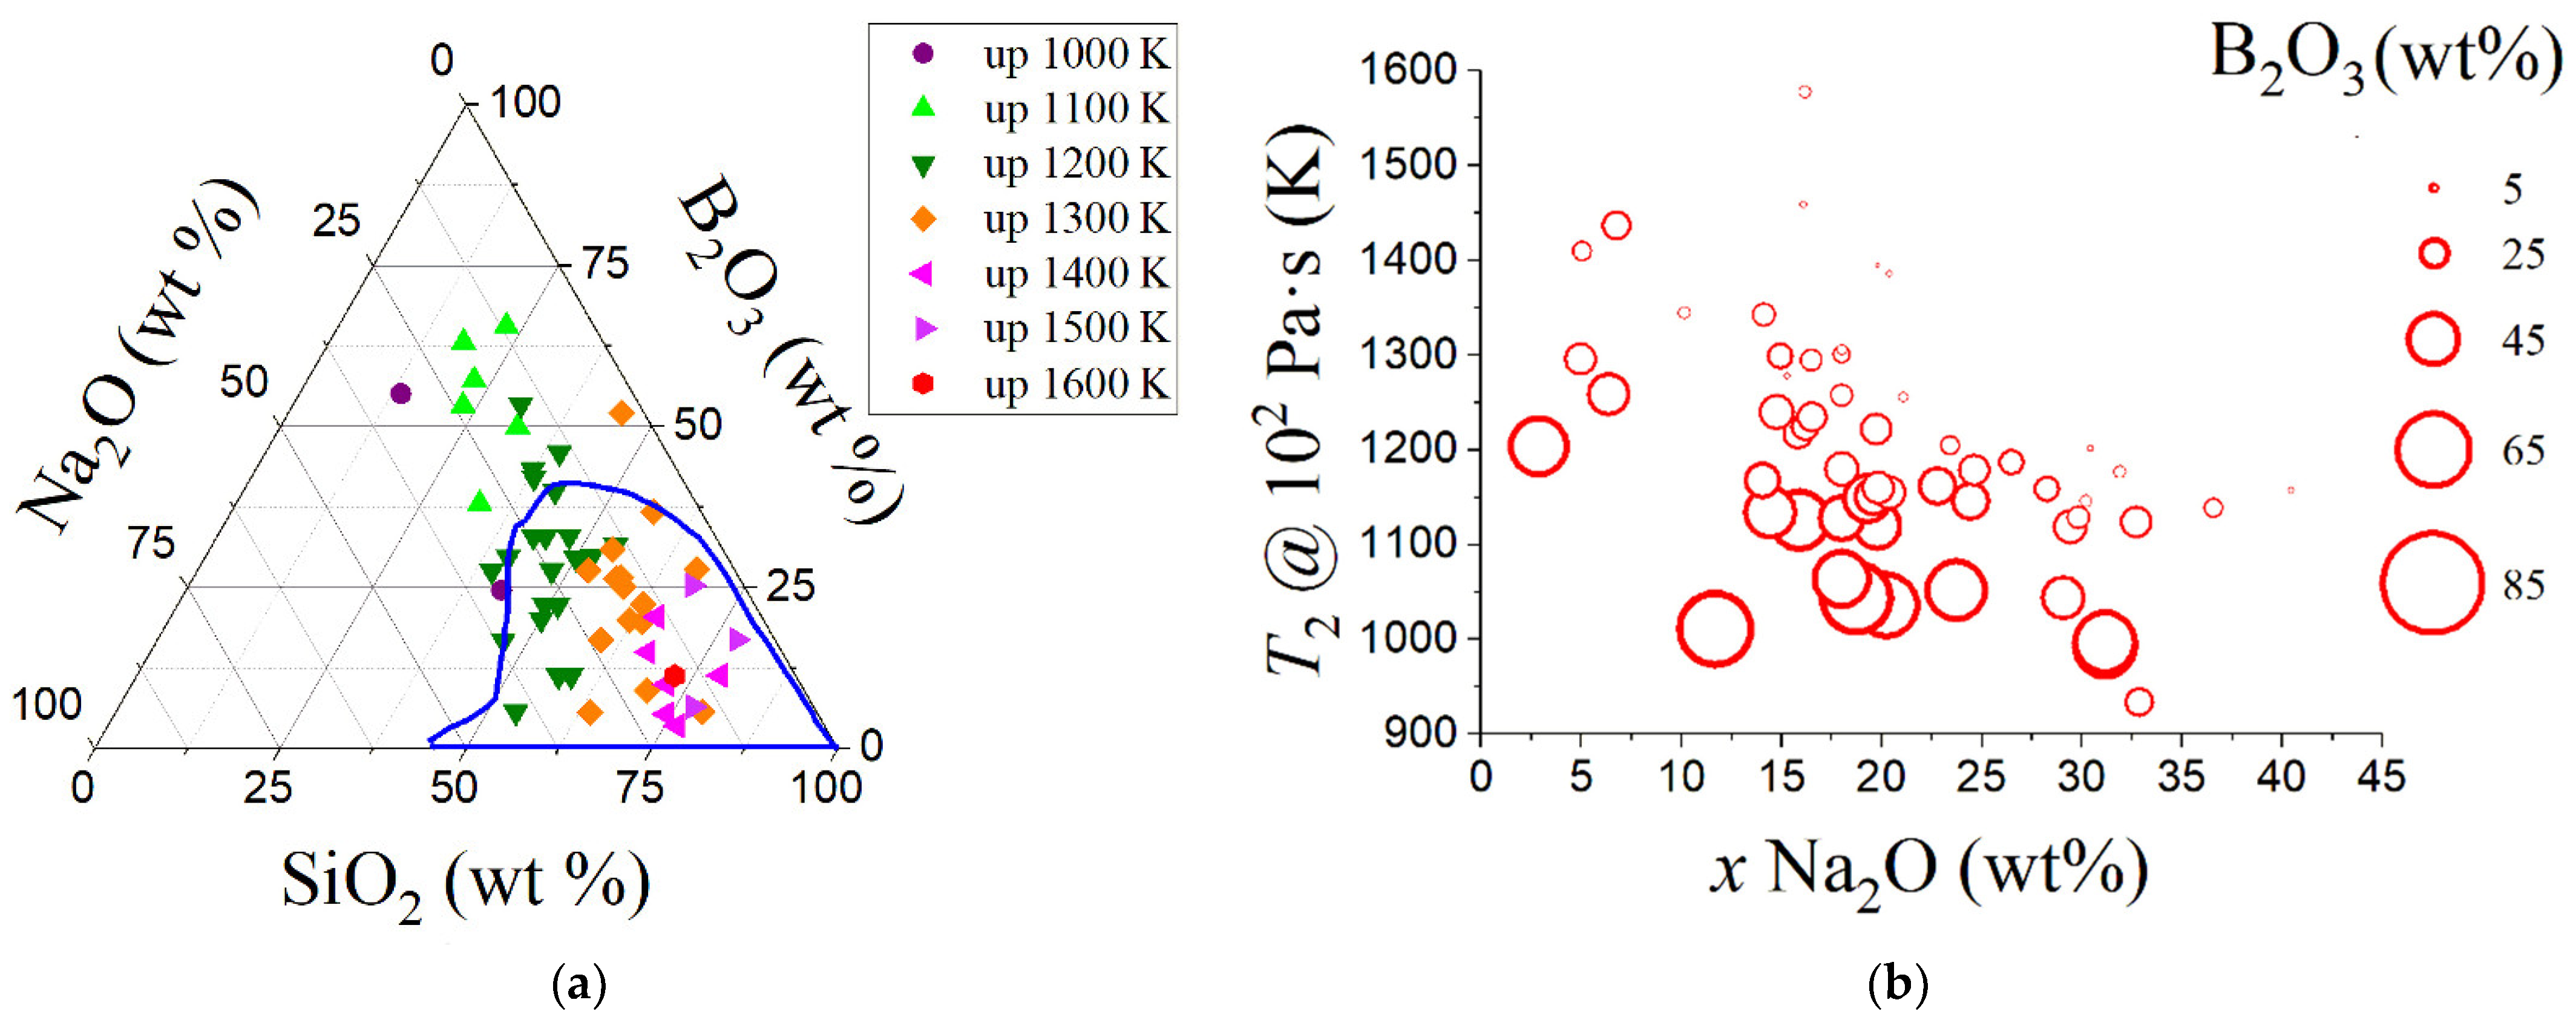
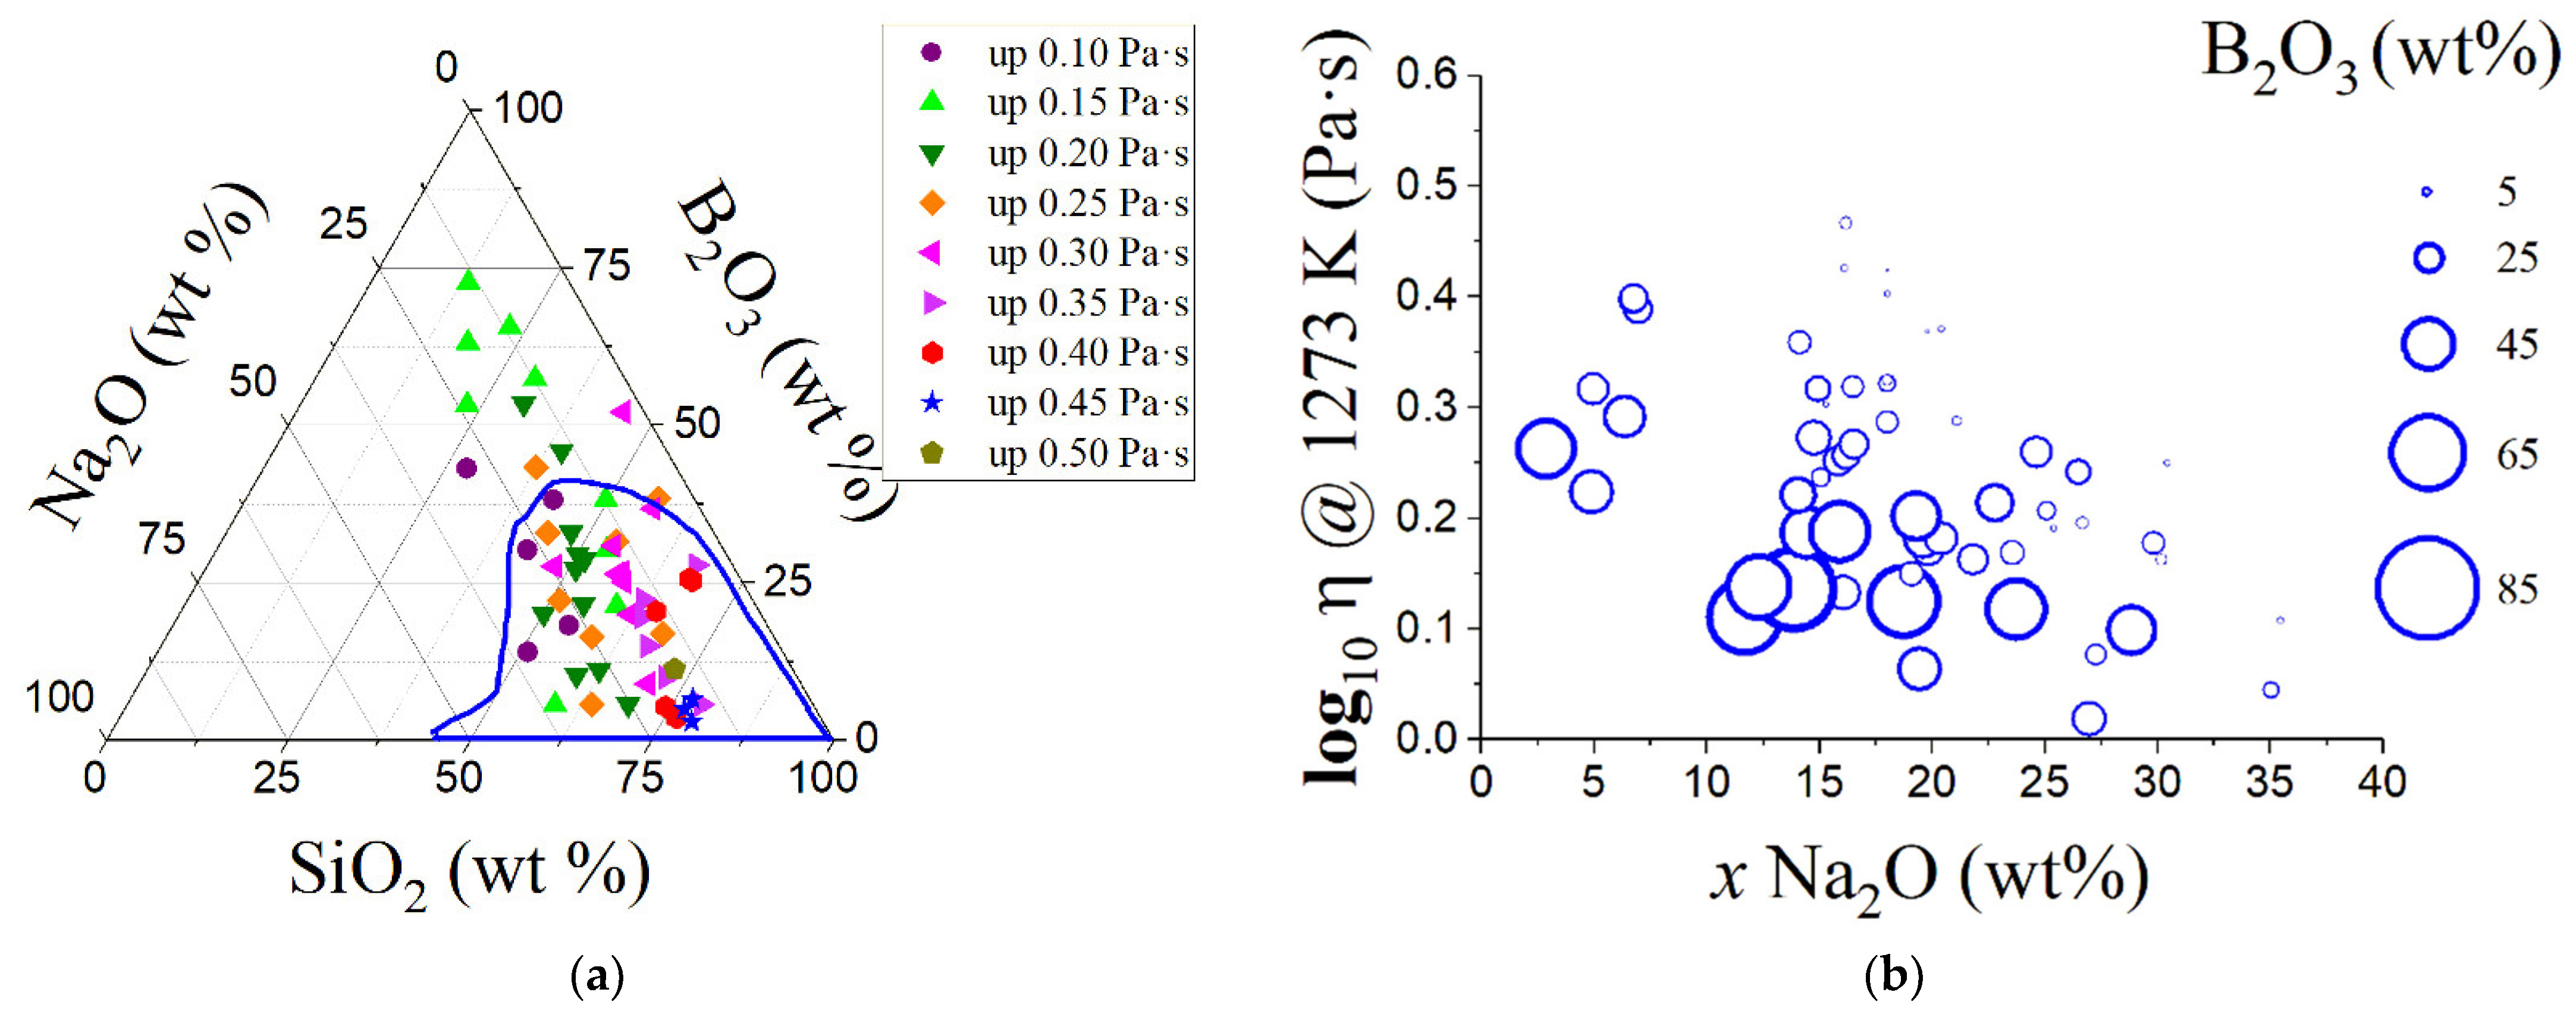
3.4. Analysis of the Borosilicate Cluster

From a practical point of view, clustering analysis, such as K-means or PCA, can help in better understanding the general properties of the glasses. We emphasize that hierarchical and non-hierarchical clustering relates to similarities between different glasses, while in PCA the main criterion relates to covariance/correlation between the amounts of glass formers.
For this analysis, we produced a series of ternary diagrams and bubble plots comparing radioactive-waste immobilization glasses with sets of standard sodium borosilicates (termed “NBS”) compositions, which are all drawn from the SciglassTM database. Some of these NBS glasses have been developed and amply deployed to immobilize high-level radioactive wastes in the India and UK [111,112].
Figure 5a, Figure 6a, Figure 7a, Figure 8a, Figure 9a, Figure 10a and Figure 11a are SiO2-B2O3-Na2O ternary diagrams, and Figure 5b, Figure 6b, Figure 7b, Figure 8b, Figure 9b, Figure 10b and Figure 11b are the respective bubble plots of the selected glass properties reported as a function of sodium and boron oxide contents. The blue line in Figure 5a, Figure 6a, Figure 7a, Figure 8a, Figure 9a, Figure 10a and Figure 11a encompasses approximately the sodium borosilicate waste-immobilization glass compositions analyzed in this work. Na2O and B2O3 were chosen as the main variables to observe since they changed most of the glass properties analyzed. In addition, both Na2O and B2O3 increase waste solubility and reduce viscosity, and in general SiO2 increases durability [112,113].
Figure 5a shows the liquidus temperature Tliq, in which each material is completely liquid with many NBS compositions, including quite a few HWL. A highly fluid (low viscosity) is preferred to minimize mixing problems during the melt, thus elevated temperatures are usually necessary for glass making. However, higher temperatures are associated with greater volatility of fission products, mainly Cs and Ru. Therefore, glass that melts at lower temperatures has advantages in this regard. From this figure, it is possible to observe that most waste-immobilization glasses melt around or above 1273 K. Figure 5b shows that by increasing sodium oxide, the liquidus temperature decreases. Moreover, boron oxide has an important role: For Na2O contents up to 30 wt%, Tliq typically increases when B2O3 decreases.
Figure 6a shows the glass transition temperature Tg of 602 NBS compositions, which are not all related to HWL. Most NBS-based waste-immobilization glasses have Tg higher than 800 K, reaching up to 1000 K. The corresponding Figure 6b shows that Tg is around 800 K with 20 wt% of Na2O, and Tg varies strongly with sodium and boron oxides. For sodium oxide contents up to 25 wt%, Tg increases when B2O3 decreases.
The glass transition temperature (Tg) is one of the fundamental kinetic properties of glassy materials. It must be assessed carefully to select the most suitable material for the immobilization of radioactive waste. The glassy state is achieved when the internal energy of a non-crystalline material becomes insufficient to permit the mobility of its molecules within the observation time. This process can be reversed by increasing the temperature or observation time, allowing the glass to restore its broken ergodicity. During the immobilization of radioactive waste, the molten residual glass is poured into containers usually made of stainless steel or carbon steel. As the temperature decreases, the energy available to the mixture and consequently the molecular mobility is reduced. Performing this process quickly enough makes it possible to avoid crystallization, freezing the liquid state in a solid-like non-crystalline substance. Additives can be used both to lower the melting temperature and to change Tg, improving some performance properties of the glass. However, the immobilization of radioactive materials also introduces safety issues that must be considered since radioactive decay can cause a considerable increase in the temperature of the glass and may even cause its crystallization. Even if the glass composition does not change, the crystallization, or phase separation, could lead to significant property changes. Therefore, Tg is one of the decisive factors in choosing the most stable and durable composition.
Figure 7a shows the density at room temperature (20 °C) of 719 NBS glasses, presenting a strong dependence on sodium and boron oxide contents. NBS-based waste composition glasses present a wide range of densities, from 2.2 to 3.0 g/cm3. Figure 7b shows an increase in density when changing the Na2O content up to 30 wt% (from 1.8 to 2.5 g/cm3), which then becomes somewhat constant for higher sodium oxide concentrations.
Figure 8a shows the ionic resistivity ρ of 115 NBS glasses at 150 °C. The resistivity shows a strong dependence on sodium content, as expected due to its ionic conduction, but boron contents also influence it. Figure 8b shows how resistivity decreases with increasing Na2O contents, and for a fixed sodium oxide content, resistivity in general also decreases with decreasing B2O3 contents [113]. The design and operation of electric glass melting furnaces depend on the electrical resistivity of glass melts since the electric current is mostly transported through mobile ions. Therefore, the electrical resistivity of glass melts is a factor to be controlled to allow easy processing.
Figure 9a shows the microhardness m of 258 NBS glasses. The value depends strongly on the amount of sodium and boron contents. Figure 9b shows that, in general, m increases with the decreasing B2O3 content for a fixed sodium content. Na2O content significantly impacts glass behavior under a sharp indenter, as Barlet et al. [114] documented. They produced NBS glasses with sodium content between 12.2 and 35.4 mol% and measured their mechanical properties. A material’s hardness refers to its stiffness or resistance to bending, scratching, abrasion, or cutting. The hardness of glass can be both beneficial and harmful.
Hardness is the property that allows glasses to resist surface plastic deformation, usually by penetration. However, the internal stresses that increase the hardness and strength can make its surface fragile and lead to cracks. Therefore, the analysis of the microhardness of glasses for radioactive waste immobilization is essential. It can determine the degree of cracking during cooling, movement, or after an accident. In general, low-sodium borosilicates maintain highly connected networks, and, conversely, NBS glasses with high sodium content partake in a more depolymerized network favoring deformation by shear flow. In summary, the addition of Na2O induces non-bridging oxygens in the borosilicate network, thus changing the boron coordination.
Figure 10a presents the temperature T2 at which viscosity η is 102 Pa⋅s of 57 NBS glasses. As shown in Figure 10b, T2 has a similar trend to the liquidus temperature: Increasing the amount of sodium oxide diminishes T2. It is also observed that, for a fixed Na2O content, a decrease in B2O3 corresponds to an increase in T2.
Figure 11a shows the logarithm of viscosity η for 58 NBS glasses at a temperature of 1273 K. As shown in Figure 11b, the logarithm of viscosity at 1273 K decreases with the Na2O content and, in general, for a given sodium oxide content, the logarithm of viscosity increases with a decrease in B2O3 [112,113].
In summary, increasing the sodium oxide content in borosilicates diminishes Tliq, Tg (only for amounts higher than 20 wt%), ρ at 150 °C and η at 1273 K, and it increases density at 20 °C (when limited to 30 wt% of Na2O).

4. Conclusions

Using multivariate exploratory methods, we examined a set of 479 radioactive-waste glass formulations covering a wide range of 51 oxides and some fluorides. Almost all compositions presented some amount of sodium oxide (around 97.7%), followed by silica (91.4%), iron (82.7%), boron (73.7%), phosphorus (54.9%), and cesium oxides (26.1%). Seven main radioactive-waste glass families were identified, comprising silicates, borosilicates, boroaluminosilicates, iron phosphates, aluminosilicates, sodium iron phosphates, and boroaluminates.
Hierarchical and non-hierarchical algorithms allowed us to group radioactive-waste glasses into four different clusters. Using the K-means analysis, the largest group included 417 glasses, mainly silicates, borosilicates, aluminosilicates, and boroaluminosilicates. It was also possible to map radioactive-waste glasses according to their compositions. The two principal components, representing 73.75% of all compositions, were related to the four clusters via a covariance matrix.
These results support the use of multivariate analysis to evaluate the waste of radioactive glass compositions. Silica, boron, and phosphorus oxides emerge as key glass formers in radioactive-waste glass compositions, accounting for clustering and covariance analysis. This observation agrees with analyses from the literature documenting the prevalence of sodium borosilicate compositions for radioactive-waste vitrification.
The main advantage of the present multivariate analysis was introducing intuitive graphical criteria to classify waste radioactive glasses. For this task, we used only composition data to organize a plethora of glass compositions. Indeed, multivariate exploratory methods proved to be complementary tools to help in elaborating future tailored, sustainable, and resilient glass compositions, searching for a design innovation tentative. From these classifications, it was possible to highlight a series of glass properties for sodium borosilicate, a widely used waste immobilization matrix. For example, increasing the sodium oxide content in borosilicates diminishes liquidus and glass transition temperatures (only for amounts higher than 20 wt%), as well as resistivity and viscosity, and it increases density (when limited to 30 wt% of Na2O). A paramount parameter of nuclear wasteforms is the normalized leaching rate which characterizes the corrosion durability of materials in contact with water and should be considered in ongoing projects.

Supplementary Materials

The following supporting information can be downloaded at: https://www.mdpi.com/article/10.3390/infrastructures7090120/s1. Supplementary Table S1: Composition of 479 waste radioactive glasses, considering 51 substances, most of them oxides; Supplementary Table S2: Correlation matrix of 51 substances analyzed from 479 waste radioactive glasses.

Author Contributions

Conceptualization, M.L.F.N., R.C., S.O.d.S. and F.E.; methodology, M.L.F.N., R.C., S.O.d.S. and F.E.; software, M.L.F.N.; validation, M.L.F.N. and D.R.C.; formal analysis, M.L.F.N., D.R.C., S.O.d.S., R.C. and F.E.; investigation, M.L.F.N., S.O.d.S., R.C. and F.E.; resources, M.L.F.N.; data curation, M.L.F.N.; writing—original draft preparation, M.L.F.N., R.C., S.O.d.S. and F.E.; writing—review and editing, M.L.F.N., D.R.C., S.O.d.S., R.C. and F.E.; visualization, M.L.F.N., D.R.C., R.C., S.O.d.S. and F.E.; supervision, M.L.F.N., D.R.C., S.O.d.S., R.C. and F.E.; project administration, M.L.F.N.; funding acquisition, M.L.F.N. All authors have read and agreed to the published version of the manuscript.

Funding

This research was funded in part by grants 304705/2015-2, 404004/2016-4, and 305331/2018-3 from the Brazilian National Council for Scientific and Technological Development (CNPq).

Data Availability Statement

Data will be made available on request.

Acknowledgments

We sincerely thank the three anonymous reviewers whose comments and suggestions helped in improving and clarifying this work.

Conflicts of Interest

The authors declare no conflict of interest.

References

  1. Ojovan, M.I.; Lee, W.E. An Introduction to Nuclear Waste Immobilisation, 1st ed.; Elsevier: Oxford, UK, 2014; p. 362. [Google Scholar]
  2. Lutze, W.; Ewing, R.C. Radioactive Waste Forms for the Future, 1st ed.; North Holland: Amsterdam, The Netherlands, 1988; p. 791. [Google Scholar]
  3. Zanotto, E.D.; Coutinho, F.A.B. How Many Non-Crystalline Solids Can be Made from All the Elements of the Periodic Table? J. Non-Cryst. Sol. 2004, 347, 285–288. [Google Scholar] [CrossRef]
  4. Vernaz, E.; Bruezière, J. History of Nuclear Waste Glass in France. Procedia Mater. Sci. 2014, 7, 3–9. [Google Scholar] [CrossRef]
  5. Watson, L.C.; Aikin, A.M.; Bancroft, A.R. The Permanent Disposal of Highly Radioactive Wastes by Incorporation into Glass. In International Atomic Energy Agency. Disposal of Radioactive Wastes, Proceedings of the Conference Jointly Sponsored by IAEA and UNESCO, IAEA, Monaco, Vienna, Austria, 16–21 November 1959; IAEA: Monaco, Vienna, Austria, 1960; pp. 373–393. [Google Scholar]
  6. Robbins, R.A.; Ojovan, M. Vitreous Materials for Nuclear Waste Immobilisation and IAEA Support Activities. MRS Adv. 2017, 2017, 4201–4206. [Google Scholar] [CrossRef]
  7. Priven, A.I.; Mazurin, O.V. Glass Property Databases: Their History, Present State, and Prospects for Further Development. Adv. Mat. Res. 2008, 39, 147–152. [Google Scholar] [CrossRef]
  8. Lemmens, K.; van Iseghem, P. The long-term dissolution behavior of the pamela borosilicate glass SM527—Application of SA/V as accelerating parameter. Mater. Res. Soc. Symp. Proc. 1992, 257, 49–56. [Google Scholar] [CrossRef]
  9. Vienna, J.D.; Hrma, P.; Schweiger, M.J.; Langowski, M.H. Compositional dependence of elemental release from HLW glasses by the product consistency test: One-component-at-a-time study. Ceram. Trans. 1996, 72, 307–315. [Google Scholar]
  10. Bakel, A.J.; Ebert, W.L.; Strachan, D.M. Glass dissolution at 20, 40, 70 and 90 °C: Short-term effects of solution chemistry and long-term Na release. Ceram. Trans. 1996, 72, 271–278. [Google Scholar]
  11. Feng, X.; Pegg, I.L. A glass dissolution model for the effects of S/V on leachate pH. J. Non-Cryst. Solids 1994, 175, 281–293. [Google Scholar] [CrossRef]
  12. Li, H.; Vienna, J.D.; Hrma, P.; Schweiger, M.J.; Smith, D.E.; Gong, M. Borosilicate based glasses for immobilization of plutonium-bearing materials. Ceram. Trans. 1996, 72, 399–408. [Google Scholar]
  13. Langowski, M.H.; Li, H.; Hrma, P.; Schweiger, M.J.; Smith, D.E. The effect of phosphate on crystallization, viscosity, and chemical durability of simulated Hanford Site high-level radioactive waste glasses. Ceram. Trans. 1996, 72, 291–298. [Google Scholar]
  14. Feng, X.; Hrma, P.; Peeler, D.K.; Kim, D.; Schweiger, M.J.; Chang, C.; Li, H.; Bakel, A.J.; Ebert, W.L. Glass durability evaluation using product consistency, single-pass flow-through, and vapor hydration tests. Ceram. Trans. 1996, 72, 93–102. [Google Scholar]
  15. Piepel, G.; Redgate, T. Mixture experiment techniques for reducing the number of components applied for modeling waste glass sodium release. J. Am. Ceram. Soc. 1997, 80, 3038–3044. [Google Scholar] [CrossRef]
  16. Hyun, S.-H.; Song, W.-S. Chemical durability of simulated waste glasses. J. Korean Ceram. Soc. 1989, 27, 521–531. [Google Scholar]
  17. Li, H.; Vienna, J.D.; Hrma, P.; Smith, D.E.; Schweiger, M.J. Nepheline precipitation in high-level waste glasses: Compositional effects and impact on the waste form acceptability. Mater. Res. Soc. Symp. Proc. 1997, 465, 261–268. [Google Scholar] [CrossRef]
  18. Bulkley, S.A.; Vienna, J.D. Composition effects on viscosity and chemical durability of simulated plutonium residue glasses. Mater. Res. Soc. Symp. Proc. 1997, 465, 1243–1250. [Google Scholar] [CrossRef]
  19. Chaoying, R.; Hong, L.; Hrma, P.R.; Cho, H.M. Spectroscopic investigation of simulated low-level nuclear waste glasses. Ceram. Trans. 1996, 72, 505–511. [Google Scholar]
  20. Wei, J.; van Iseghem, P. The effect of humic acids on the element release from high level waste glass. Mater. Res. Soc. Symp. Proc. 1997, 465, 189–196. [Google Scholar] [CrossRef]
  21. Dong-Sang, K.; Hrma, P.; Palmer, S.E.; Smith, D.E.; Schweiger, M.J. Effect of B2O3, CaO, and Al2O3 on the chemical durability of silicate glasses for hanford low-level waste immobilization. Ceram. Trans. 1995, 61, 531–538. [Google Scholar]
  22. Bakel, A.J.; Ebert, W.L.; Luo, J.S. Long-term performance of glasses for hanford low-level waste. Ceram. Trans. 1995, 61, 515–522. [Google Scholar]
  23. Hong, L.; Tomozawa, M. Chemical durability of simulated nuclear waste glasses containing water. Ceram. Trans. 1995, 61, 539–546. [Google Scholar]
  24. Ebert, W.L.; Tam, S.-W. Dissolution rates of DWPF glasses from long-term PCT. Mater. Res. Soc. Symp. Proc. 1997, 465, 149–156. [Google Scholar] [CrossRef]
  25. Ebert, W.L. The effects of the leachate pH and the ratio of glass surface area to leachant volume on glass reactions. Phys. Chem. Glasses 1993, 34, 58–65. [Google Scholar]
  26. Pickering, S. Kinetics of surface-layer formation on simulated nuclear waste glass. J. Am. Ceram. Soc. 1980, 63, 558–562. [Google Scholar] [CrossRef]
  27. Ebert, W.L. Laboratory testing of West Valley reference 6 glass. Ceram. Trans. 1995, 61, 471–478. [Google Scholar]
  28. Feng, X.; Pegg, I.L.; Barkatt, A.; Macedo, P.B.; Cucinell, S.J.; Lai, S. Correlation between composition effects on glass durability and the structural role of the constituent oxides. Nuclear Technol. 1989, 85, 334–345. [Google Scholar] [CrossRef]
  29. Clark, D.E.; Urwongse, L.; Maurer, C. Application of glass corrosion concepts to nuclear waste immobilization. Nuclear Technol. 1982, 56, 212–225. [Google Scholar] [CrossRef]
  30. McGrail, B.P.; Martin, P.F.; Lindenmeier, C.W. Accelerated testing of waste forms using a novel pressurized unsaturated flow (PUF) method. Mater. Res. Soc. Symp. Proc. 1997, 465, 253–260. [Google Scholar] [CrossRef]
  31. Buechele, A.C.; Muller, I.S.; Pegg, I.L.; Kim, C.-W.; Yaschenko, E. Properties of glasses for Idaho mixed waste vitrification. Ceram. Trans. 1995, 61, 203–211. [Google Scholar]
  32. Fu, S.S.; Gan, H.; Muller, I.S.; Pegg, I.L.; Macedo, P.B. Optimization of Savannah River M-Area mixed waste for vitrification. Mater. Res. Soc. Symp. Proc. 1997, 465, 139–146. [Google Scholar] [CrossRef]
  33. Yan, Q.; Buechele, A.C.; Hu, S.; Wang, E.; Fu, S.S. Effect of crystallization on the durability of mixed waste glasses. Ceram. Trans. 1995, 61, 167–176. [Google Scholar]
  34. Oversby, V.M.; Phinney, D.L. The development of surface alteration layers on SRL-165 nuclear waste glasses. J. Nucl. Mater. 1992, 190, 247–268. [Google Scholar] [CrossRef]
  35. Pederson, L.R.; Buckwalter, C.Q.; McVay, G.L.; Riddle, B.L. Glass surface area to solution volume ratio and its implications to accelerated leach testing. Mater. Res. Soc. Symp. Proc. 1983, 15, 45–54. [Google Scholar] [CrossRef]
  36. Moir, D.L.; Chatt, A. Studies on leaching behavior of sodium borosilicate glasses by neutron activation: Effects of groundwater composition, pH, surface area to volume ratio, and temperature. J. Radioanal. Nucl. Chem. 1992, 161, 503–526. [Google Scholar] [CrossRef]
  37. Ishiguro, K.; Kawanishi, N.; Sasaki, N.; Nagaki, H.; Yamamoto, M. Growth of surface layer during the leaching of the simulated waste glass and its barrier effects on the leaching. Mater. Res. Soc. Symp. Proc. 1983, 15, 135–142. [Google Scholar] [CrossRef]
  38. Hermansson, H.-P.; Christensen, H.; Clark, D.E.; Werme, L. Effects of solution chemistry and atmosphere on leaching of alkali borosilicate glass. Mater. Res. Soc. Symp. Proc. 1983, 15, 143–150. [Google Scholar] [CrossRef]
  39. Heimann, R.B.; Wood, D.D.; Hamon, R.F. Multicomponent leach tests in standard canadian shield saline solution on glasses containing simulated nuclear waste. Mater. Res. Soc. Symp. Proc. 1984, 26, 191–200. [Google Scholar] [CrossRef]
  40. Chick, L.A.; Pederson, L.R. The relationship between reaction layer thickness and leach rate for nuclear waste glasses. Mater. Res. Soc. Symp. Proc. 1984, 26, 635–642. [Google Scholar] [CrossRef]
  41. Fillet, S.; Nogues, J.L.; Vernaz, E.; Jacquet-Francillon, N. Leaching of actinides from the french LWR reference glass. Mater. Res. Soc. Symp. Proc. 1985, 50, 211–218. [Google Scholar] [CrossRef]
  42. Jantzen, C.M.; Bibler, N.E. The role of groundwater oxidation potential and radiolysis on waste glass performance in crystalline repository environments. Mater. Res. Soc. Symp. Proc. 1985, 50, 219–230. [Google Scholar] [CrossRef]
  43. Dwivedi, A.; Berta, Y.; Speyer, R.F. Effect of controlled crystallization on the chemical durability of a lead-containing waste glass. J. Mater. Sci. 1994, 29, 2304–2308. [Google Scholar] [CrossRef]
  44. Elliot, M.N.; Auty, D.B. The durability of glass for the disposal of highly radioactive waste. Discussion of method and effect of leaching conditions. Glass Technol. 1968, 9, 5–13. [Google Scholar]
  45. Sales, B.C.; Boatner, L.A. Lead phosphate glass as a stable medium for the immobilization and disposal of high-level nuclear waste. Mater. Lett. 1984, 2, 301–304. [Google Scholar] [CrossRef]
  46. Sales, B.C.; Boatner, L.A. Physical and chemical characteristics of lead-iron phosphate nuclear waste glasses. J. Non-Cryst. Solids 1986, 79, 83–116. [Google Scholar] [CrossRef]
  47. Kamizono, H.; Hayakawa, I.; Muraoka, S. Effects of some glass additives on nuclear waste glass durability in water. J. Mater. Sci. Lett. 1991, 10, 423–425. [Google Scholar] [CrossRef]
  48. Marasinghe, G.K.; Karabulut, M.; Ray, C.S.; Day, D.E.; Shuh, D.K.; Allen, P.G.; Saboungi, M.L.; Grimsditch, M.; Haeffner, D. Properties and structure of vitrified iron phosphate nuclear wasteforms. J. Non-Cryst. Solids 2000, 263–264, 146–154. [Google Scholar] [CrossRef]
  49. Prokin, E.S.; Kuptsov, V.S.; Ananina, T.N.; Ermolaev, E.E. Characteristics of borosilicate glass in simulation of alpha-radiation and thermal conditions for storage of vitrified highly radioactive wastes. Radiokhimiya 1988, 30, 694–698. [Google Scholar]
  50. Sales, B.C.; White, C.W.; Begun, G.M.; Boatner, L.A. Surface layer formation on corroded nuclear waste glasses. J. Non-Cryst. Solids 1984, 67, 245–264. [Google Scholar] [CrossRef]
  51. Kamizono, H. Leaching behaviour of simulated high-level waste glass in groundwater. J. Nucl. Mater. 1985, 127, 242–246. [Google Scholar] [CrossRef]
  52. Hara, S.; Terai, R.; Yamanaka, H. Chemical durability of borosilicate glasses containing simulated high-level nuclear wastes (I). Bull. Governm. Ind. Res. Inst. Osaka 1983, 34, 1–8. [Google Scholar]
  53. Bibler, N.E.; Ramsey, W.G.; Meaker, T.F.; Pareizs, J.M. Durabilities and microstructures of radioactive glasses for immobilization of excess actinides at the savannah river site. Mater. Res. Soc. Symp. Proc. 1996, 412, 65–72. [Google Scholar] [CrossRef]
  54. Li, H.; Schweiger, M.J.; Hrma, P.; Feng, X. Surface characterization of simulated low-level radioactive waste glasses corroded in water and LiOH buffer solution. Mater. Res. Soc. Symp. Proc. 1996, 412, 213–220. [Google Scholar] [CrossRef]
  55. Mazer, J.J.; Bates, J.K.; Biwer, B.M.; Bradley, C.R. AEM analyses of SRL 131 glass altered as a function of SA/V. Mater. Res. Soc. Symp. Proc. 1992, 257, 73–81. [Google Scholar] [CrossRef]
  56. Gin, S.; Godon, N.; Mestre, J.P.; Vernaz, E.Y.; Beaufort, D. Experimental investigation of aqueous corrosion of R7T7 nuclear glass at 90C in the presence of humic acids: A kinetic approach. Mater. Res. Soc. Symp. Proc. 1994, 333, 565–572. [Google Scholar] [CrossRef]
  57. Knauss, K.G.; Bourcier, W.L.; McKeegan, K.D.; Marzbacher, C.I.; Nguyen, S.N.; Ryerson, F.J.; Smith, D.K.; Weed, H.C.; Newton, L. Dissolution kinetics of a simple analogue nuclear waste glass as a function of pH, time and temperature. Mater. Res. Soc. Symp. Proc. 1990, 176, 371–381. [Google Scholar] [CrossRef]
  58. Inagaki, Y.; Furuya, H.; Idemitsu, K.; Maeda, T.; Sakai, A. Corrosion behavior of a powdered simulated nuclear waste glass under anoxic condition. Mater. Res. Soc. Symp. Proc. 1995, 353, 23–30. [Google Scholar] [CrossRef]
  59. Ebert, W.L.; Bates, J.K. A comparison of glass reaction at high and low glass surface/solution volume. Nuclear Technol. 1993, 104, 372–384. [Google Scholar] [CrossRef]
  60. Feng, X.; Pegg, I.L.; Guo, Y.; Barkatt, A.; Macedo, P.B. Effects of surface area-to-solution volume ratio on chemical durability of nuclear waste glasses. Mater. Res. Soc. Symp. Proc. 1990, 176, 383–392. [Google Scholar] [CrossRef]
  61. Raman, S.V. Analysis of the hydrated zone in nuclear waste glass forms by electron microprobe, Raman spectroscopy and diffusion models. Phys. Chem. Glasses 2001, 42, 27–41. [Google Scholar]
  62. Day, D.E.; Wu, Z.; Ray, C.S.; Hrma, P. Chemically durable iron phosphate glass wasteforms. J. Non-Cryst. Solids 1998, 241, 1–12. [Google Scholar] [CrossRef]
  63. Pinet, O.; Baudrey, E.; Dussossoy, J.L.; Fillet, C.; Hollebecque, J.F. Redox effect on waste containment glass properties: Case of a borosilicate glass containing 16 wt% MoO3. In Proceedings of the XIX International Congress Glass, Edinburgh, Scotland, 1–6 July 2001; Society of Glass Technology: Sheffield, UK, 2002; Volume 43C, pp. 158–161. [Google Scholar]
  64. Bates, J.K.; Ebert, W.L.; Feng, X.; Bourcier, W.L. Issues affecting the prediction of glass reactivity in an unsaturated environment. J. Nucl. Mater. 1992, 190, 198–227. [Google Scholar] [CrossRef]
  65. Suzuki, M.; Hara, S.; Nagaoka, K. Disposal method by the vitrification of wastes containing heavy metals. The collected particles from the electrostaic precipitator of cupola. Bull. Governm. Ind. Res. Inst. Osaka 1988, 39, 194–200. [Google Scholar]
  66. Kawamoto, T.; Terai, R.; Hara, S. Effects of crystallization on thermal properties and chemical durability of the glasses containing simulated high level radioactive wastes. Bull. Governm. Ind. Res. Inst. Osaka 1978, 29, 168–173. [Google Scholar]
  67. Helebrant, A.; Pekarkova, I. Kinetic of glass corrosion in acid solutions. Ber. Bunsenges. Phys. Chem. 1996, 100, 1519–1522. [Google Scholar] [CrossRef]
  68. Yi-Ming, P.; Jain, V.; Pensado, O. Degradation of high-level waste glass under simulated repository conditions. J. Non-Cryst. Solids 2003, 319, 74–88. [Google Scholar]
  69. Kim, C.-W.; Day, D.E. Immobilization of Hanford LAW in iron phosphate glasses. J. Non-Cryst. Solids 2003, 331, 20–31. [Google Scholar] [CrossRef]
  70. Godon, N.; Thomassin, J.H.; Touray, J.C.; Vernaz, E. Experimental alteration of R7T7 nuclear model glass in solutions with different salinities (90 °C, 1 bar): Implications for the selection of geological repositories. J. Mater. Sci. 1988, 23, 126–134. [Google Scholar] [CrossRef]
  71. McGrail, B.P.; Ebert, W.L.; Bakel, A.J.; Peeler, D.K. Measurement of kinetic rate law parameters on a Na-Ca-Al borosilicate glass for low-activity waste. J. Nucl. Mater. 1997, 249, 175–189. [Google Scholar] [CrossRef]
  72. Reis, S.T.; Karabulut, M.; Day, D.E. Structural features and properties of lead-iron-phosphate nuclear wasteforms. J. Nucl. Mater. 2002, 304, 87–95. [Google Scholar] [CrossRef]
  73. Kim, C.W.; Ray, C.S.; Zhu, D.; Day, D.E.; Gombert, D.; Aloy, A.; Mogus-Milankovic, A.; Karabulut, M. Chemically durable iron phosphate glasses for vitrifying sodium bearing waste (SBW) using conventional and cold crucible induction melting (CCIM) techniques. J. Nucl. Mater. 2003, 322, 152–164. [Google Scholar] [CrossRef]
  74. Huang, W.; Day, D.E.; Ray, C.S.; Kim, C.W.; Reis, S.T.D. Properties and solubility of chrome in iron alumina phosphate glasses containing high level nuclear waste. Glass Sci. Technol. 2004, 77, 203–210. [Google Scholar]
  75. Raman, S.V. The effect of mixed modifiers on nuclear waste glass processing, leaching, and Raman spectra. J. Mater. Res. 1998, 13, 8–15. [Google Scholar] [CrossRef]
  76. Luckscheiter, B.; Nesovic, M. Long term corrosion behaviour of the WAK-HLW glass in salt solutions. Waste Manag. 1997, 17, 429–436. [Google Scholar] [CrossRef]
  77. Sheng, J. Examination of the leachability of PG-glass. Glass Technol. 2005, 46, 36–38. [Google Scholar]
  78. Choi, K.; Sheng, J.; Lee, M.-C.; Song, M.-J. Utilizing the KEP-A glass frit to vitrify low-level radioactive waste from Korean NPPs. Waste Manag. 2000, 20, 575–580. [Google Scholar] [CrossRef]
  79. Ji, H.; Rouxel, T.; Abdelouas, A.; Grambow, B.; Jollivet, P. Mechanical behavior of a borosilicate glass under aqueous corrosion. J. Am. Ceram. Soc. 2005, 88, 3256–3259. [Google Scholar] [CrossRef]
  80. Gauthier, A.; le Coustumer, P.; Motelica, M.; Donard, O.F.X. Real time alteration of a nuclear waste glass and remobilization of lanthanide into an interphase. Waste Manag. 2000, 20, 731–739. [Google Scholar] [CrossRef]
  81. Ferrand, K.; Abdelouas, A.; Grambow, B. Water diffusion in the simulated French nuclear waste glass SON 68 contacting silica rich solutions: Experimental and modeling. J. Nucl. Mater. 2006, 355, 54–67. [Google Scholar] [CrossRef]
  82. Yanagi, T.; Yoshizoe, M.; Kuramoto, K.I. Leach rates and thermal properties of lead-iron phosphate glass waste forms. J. Nucl. Sci. Technol. 1989, 26, 948–954. [Google Scholar] [CrossRef]
  83. Crawford, C.L.; Marra, J.C.; Bibler, N.E. Glass fabrication and product consistency testing of lanthanide borosilicate glass for plutonium disposition. J. Alloys Compd. 2007, 444–445, 569–579. [Google Scholar] [CrossRef]
  84. Barkatt, A.; Saad, E.E.; Adiga, R.; Sousanpour, W.; al Barkatt; Adel-Hadadi, M.A.; O’Keefe, J.A.; Alterescu, S. Leaching of natural and nuclear waste glasses in sea water. Appl. Geochem. 1989, 4, 593–603. [Google Scholar] [CrossRef]
  85. Gin, S.; Godon, N.; Mestre, J.P.; Vernaz, E.Y.; Beaufort, D. Experimental investigation of aqueous corrosion of R7T7 nuclear glass at 90 °C in the presence of organic species. Appl. Geochem. 1994, 9, 255–269. [Google Scholar] [CrossRef]
  86. Cassingham, N.J.; Bingham, P.A.; Hand, R.J.; Forder, S.D. Property modification of a high level nuclear waste borosilicate glass through the addition of Fe2O3. Glass Technol. Eur. J. Glass Sci. Technol. A 2008, 49, 21–26. [Google Scholar]
  87. Pierce, E.M.; Rodriguez, E.A.; Calligan, L.J.; Shaw, W.J.; McGrail, B.P. An experimental study of the dissolution rates of simulated aluminoborosilicate waste glasses as a function of pH and temperature under dilute conditions. Appl. Geochem. 2008, 23, 2559–2573. [Google Scholar] [CrossRef]
  88. Mesko, M.G.; Day, D.E. Immobilization of spent nuclear fuel in iron phosphate glass. J. Nucl. Mater. 1999, 273, 27–36. [Google Scholar] [CrossRef]
  89. Ezz-Eldin, F.M. Leaching and mechanical properties of cabal glasses developed as matrices for immobilization high-level wastes. Nucl. Instr. Methods Phys. Res. B 2001, 183, 285–300. [Google Scholar] [CrossRef]
  90. Wellman, D.M.; Icenhower, J.P.; Weber, W.J. Elemental dissolution study of Pu-bearing borosilicate glasses. J. Nucl. Mater. 2005, 340, 149–162. [Google Scholar] [CrossRef]
  91. Weber, W.J.; Wald, J.W.; McVay, G.L. Effects of (alfa)-radiolysis on leaching of a nuclear waste glass. J. Am. Ceram. Soc. 1985, 68, C-253. [Google Scholar] [CrossRef]
  92. Gan, X.Y.; Zhang, Z.T.; Yuan, W.Y.; Wang, L.; Bai, Y.; Ma, H. Long-term product consistency test of simulated 90-19/Nd HLW glass. J. Nucl. Mater. 2011, 408, 102–109. [Google Scholar] [CrossRef]
  93. Kim, C.-W.; Park, J.-K.; Hwang, T.-W. Analysis of leaching behavior of simulated LILW glasses by using the MCC-1 test method. J. Nucl. Sci. Technol. 2011, 48, 1108–1114. [Google Scholar] [CrossRef]
  94. Riley, B.J.; Rieck, B.T.; McCloy, J.S.; Crum, J.V.; Sundaram, S.K.; Vienna, J.D. Tellurite glass as a waste form for mixed alkali-chloride waste streams: Candidate materials selection and initial testing. J. Nucl. Mater. 2012, 424, 29–37. [Google Scholar] [CrossRef]
  95. Sokal, R.R. Distance as a Measure of Taxonomic Similarity. Syst. Zool. 1961, 10, 70–79. [Google Scholar] [CrossRef]
  96. Sokal, R.R.; Sneath, P.H.A. Principles of Numerical Taxonomy; W. H. Freeman and Company: San Francisco, CA, USA; London, UK, 1963; p. 359. [Google Scholar]
  97. MacQueen, J.B. Some Methods for Classification and Analysis of Multivariate Observations. In Proceedings of the Fifth Berkeley Symposium on Mathematical Statistics and Probability, Oakland, CA, USA, 21 June–18 July 1965; University of California: California, CA, USA, 1967; pp. 281–297. [Google Scholar]
  98. Hair, J.F., Jr.; Black, W.C.; Babin, B.J.; Anderson, R.E. Multivariate Data Analysis; Cengage: Hampshire, UK, 2019; p. 813. [Google Scholar]
  99. Favero, L.P.; Belfiore, P. Data Science for Business and Decision Making; Academic Press: Cambridge, UK, 2019; p. 1170. [Google Scholar]
  100. Kopec, D. Classic Computer Science Problems in Python; Manning Publications, Co.: Shelter Island, NY, USA, 2019; p. 206. [Google Scholar]
  101. Everitt, B.S.; Landau, S.; Leese, M.; Stahl, D. Cluster Analysis; John Wiley & Sons, Ltd.: West Sussex, UK, 2011; p. 330. [Google Scholar]
  102. Nascimento, M.L.F. In Search of Star Clusters: An Introduction to the K-Means Algorithm. J. Humanist. Math. 2022, 12, 243–255. [Google Scholar] [CrossRef]
  103. Pearson, K. On Lines and Planes of Closest Fit to Systems of Points in Space. Phil. Mag. 1901, 2, 559–572. [Google Scholar] [CrossRef]
  104. Hotelling, H. Analysis of a Complex of Statistical Variables into Principal Components. J. Ed. Psych. 1933, 24, 498–520. [Google Scholar] [CrossRef]
  105. Jolliffe, I.T. Principal Component Analysis; Springer: Berlin/Heidelberg, Germany, 2002; p. 518. [Google Scholar]
  106. Nascimento, M.L.F.; Aparicio, C. Viscosity of Strong and Fragile Glass-forming Liquids Investigated by Means of Principal Component Analysis. J. Phys. Chem. Solids 2007, 68, 104–110. [Google Scholar] [CrossRef]
  107. Manly, B.F.J.; Alberto, J.A.N. Multivariate Statistical Methods; Routledge: Abingdon, UK, 2016; p. 269. [Google Scholar]
  108. Bartlett, M.S. A Note on the Multiplying Factors for Various χ2 Approximations. J. Roy. Stat. Soc. Ser. B. 1954, 16, 296–298. [Google Scholar] [CrossRef]
  109. Nascimento, H.H.S.; Nascimento, M.L.F. Identifying silica types using viscosity data and principal component analysis. J. Phys. Chem. Solids 2021, 157, 110177. [Google Scholar] [CrossRef]
  110. Pearson, K., VII. Mathematical Contributions to the Theory of Evolution. III. Regression, Heredity, and Panmixia. Phil. Trans. R. Soc. Lond. 1896, 187, 253–318. [Google Scholar]
  111. Harrison, M.T. Vitrification of High Level Waste in the UK. Procedia Mat. Sci. 2014, 7, 10–15. [Google Scholar] [CrossRef]
  112. Raj, K.; Kaushik, C.P. Glass Matrices for Vitrification of Radioactive Waste—An Update on R & D Efforts. IOP Conf. Ser. Mater. Sci. Eng. 2009, 2, 012002. [Google Scholar]
  113. Anonymous. Vitrification Technologies for Treatment of Hazardous and Radioactive Waste: Handbook; United States Environmental Protection Agency, Office of Research and Development: Washington, DC, USA, 1992; p. 96.
  114. Barlet, M.; Delaye, J.-M.; Charpentier, T.; Gennisson, M.; Bonamy, D.; Rouxel, T.; Rountree, C.L. Hardness and Toughness of Sodium Borosilicate Glasses via Vickers’s Indentations. J. Non-Cryst. Solids 2015, 417, 66–79. [Google Scholar] [CrossRef] [Green Version]
Figure 1. Content distribution of the main oxides in the glasses, namely SiO2, B2O3, Na2O, and Fe2O3 in 479 compositions.
Infrastructures 07 00120 g001
Figure 2. Percentage of occurrence of the main oxide glass formers and modifiers considering any percentage content.
Infrastructures 07 00120 g002
Figure 3. Schematic dendrogram of the first six glasses of all 479 glass substances analyzed considering Euclidean distance and the linkage method. For example, from these data, it was possible to verify that glasses G217 and G333 were the most similar due to the smallest Euclidean distance considering 479 glass systems and 51 variables, thus promoting the first clustering stage. The difference between these compositions relates to small amounts of PuO2 and ThO2, of less than 0.03 wt%, as presented in Supplementary Table S1.
Infrastructures 07 00120 g003
Figure 4. Biplot of principal component 1 (related mainly to SiO2, P2O5, Fe2O3, B2O3, and PbO contents) versus principal component 2 (related mainly to PbO, B2O3, Na2O, SiO2, and P2O5) considering all waste glass compositions and the covariance matrix. Borosilicate glasses are predominant and located at the center. It is possible to map all glasses in four clusters related to hierarchical and non-hierarchical results. All other variables were discarded from this biplot for a better view of the main oxides.
Infrastructures 07 00120 g004
Figure 5. (a) Ternary diagram of selected sodium borosilicate glasses from SciglassTM database (version 7.9). The blue region corresponds to approximately the Tliq behavior from a plethora of sodium borosilicate waste-immobilization glasses. (b) The liquidus temperature (Tliq, in K) dependence on sodium oxide content. In this graph, it is possible to observe that the liquidus temperature decreases when sodium oxide increases up to near 30%, and boron oxide has also an important role.
Infrastructures 07 00120 g005
Figure 6. (a) Ternary diagram of selected sodium borosilicate glasses from SciglassTM database (version 7.9). The blue region corresponds to approximately the Tg behavior from a plethora of sodium borosilicate waste-immobilization glasses. (b) The Tg dependence on sodium oxide content. Most NBS-based waste-immobilization glasses present a Tg around 800 K with 20 wt% of Na2O, and Tg varies strongly with sodium and boron oxides. For a fixed sodium oxide content up to 25 wt%, Tg increases when boron oxide decreases.
Infrastructures 07 00120 g006
Figure 7. (a) Ternary diagram of selected sodium borosilicate glasses from SciglassTM database (version 7.9). The blue region corresponds to approximately the density behavior from a plethora of sodium borosilicate waste-immobilization glasses. (b) The density dependence on sodium oxide content at 20 °C. Density shows a high increase, from 1.8 to 2.5, changing the sodium oxide content up to 30 wt%, and maintaining this fixed value for higher sodium concentrations.
Infrastructures 07 00120 g007
Figure 8. (a) Ternary diagram of selected sodium borosilicate glasses from SciglassTM database (version 7.9). The blue region corresponds to approximately the logarithm of resistivity behavior at 150 °C from a plethora of sodium borosilicate waste-immobilization glasses. (b) The resistivity dependence on sodium oxide content at 150 °C. Resistivity decreases with the increasing sodium oxide content, and for a fixed sodium oxide content, resistivity in general also decreases with the decreasing boron oxide content.
Infrastructures 07 00120 g008
Figure 9. (a) Ternary diagram of selected sodium borosilicate glasses from SciglassTM database (version 7.9). The blue region corresponds to approximately the microhardness behavior from a plethora of sodium borosilicate waste-immobilization glasses. (b) The microhardness dependence on sodium oxide content at 102 Pa⋅s. Microhardness depends strongly on the amount of sodium and boron contents.
Infrastructures 07 00120 g009
Figure 10. (a) Ternary diagram of selected sodium borosilicate glasses from SciglassTM database (version 7.9). The blue region corresponds to approximately the T2 behavior from a plethora of sodium borosilicate waste-immobilization glasses. (b) The temperature dependence of viscosity fixed at 102 Pa⋅s on sodium oxide content. The temperature in which viscosity reaches 102 Pa⋅s (T2) shows a similar trend observed for the liquidus temperature when the addition of sodium oxide diminishes T2. It was also observed that the decrease in boron oxide follows an increase in T2 for a fixed sodium oxide content.
Infrastructures 07 00120 g010
Figure 11. (a) Ternary diagram of selected sodium borosilicate glasses from SciglassTM database (version 7.9). The blue region corresponds to approximately the logarithmic behavior of viscosity from a plethora of sodium borosilicate waste-immobilization glasses. (b) The dependence of the logarithm of viscosity at 1273 K on sodium oxide content. The logarithm of viscosity at a fixed temperature of 1273 K decreases with the sodium oxide content. In general, the viscosity increases with a decrease in boron oxide content for a fixed sodium oxide content.
Infrastructures 07 00120 g011
Table 1. Definition of each variable (or substance) Xi, i from 1 to n = 51, related to the composition of every glass analyzed in this work.
VariableGlass ComponentVariableGlass ComponentVariableGlass ComponentVariableGlass ComponentVariableGlass Component
X1SiO2X11CoOX21K2OX31PbOX41ThO2
X2B2O3X12Cr2O3X22La2O3X32Pr2O3X42TeO2
X3Al2O3X13Cs2OX23Li2OX33PuO2X43TiO2
X4BaOX14CuOX24MgOX34Rb2OX44UO2
X5Bi2O3X15Eu2O3X25MnO2X35RuO2X45U3O8
X6CaFX16FX26MoO3X36SO3X46WO3
X7CaOX17Fe2O3X27Na2OX37Sm2O3X47Y2O3
X8CdOX18Gd2O3X28Nd2O3X38SnOX48ZnO
X9CeO2X19GeO2X29NiOX39SrOX49ZrO2
X10ClX20HfO2X30P2O5X40Tb2O3X50RmOn *
X51H2O **
* Sum of other substances; ** Hydrated glasses.
Table 2. Total and cumulative percentages and respective eigenvalues of each axis considering the covariance mode.
PC AxisEigenvalue Total Percent (%)Cumulative Percent (%)PC AxisEigenvalue Total Percent (%)Cumulative Percent (%)
1508.6510864.9864.98260.347940.0499.85
268.652328.7773.75270.281070.0499.89
355.655937.1180.86280.237130.0399.92
442.670855.4586.31290.15850.0299.94
524.125813.0889.39300.096250.0199.95
620.350362.6091.99310.079130.0199.96
713.920041.7893.77320.067790.0199.97
812.03991.5495.31330.057620.0199.98
98.540771.0996.40340.044610.0199.98
104.177660.5396.93350.040650.0199.99
113.416340.4497.37360.019750.0099.99
122.629620.3497.71370.014680.0099.99
132.338790.3098.01380.011650.00100.00
142.160810.2898.28390.00880.00100.00
151.792140.2398.51400.006330.00100.00
161.628740.2198.72410.005360.00100.00
171.453060.1998.90420.002650.00100.00
181.384260.1899.08430.002420.00100.00
191.149680.1599.23440.001940.00100.00
201.121130.1499.37450.001420.00100.00
210.967740.1299.50469.34 × 10−40.00100.00
220.86840.1199.61477.79 × 10−40.00100.00
230.665660.0999.69486.43 × 10−40.00100.00
240.501620.0699.76493.25 × 10−40.00100.00
250.427780.0599.81509.50 × 10−50.00100.00
518.00 × 10−50.00100.00
Table 3. Eigenvector values of first and second main components considering the covariance and correlation matrices, respectively.
PC AxisEigenvalue Total Percent (%)Cumulative Percent (%)PC AxisEigenvalue Total Percent (%)Cumulative Percent (%)
X1SiO20.70438−0.40027X26MoO32.46 × 10−40.01802
X2B2O30.102480.48875X27Na2O0.05085−0.34555
X3Al2O30.0466−0.02062X28Nd2O36.63 × 10−4−0.04281
X4BaO0.0010.00743X29NiO0.00445−0.00317
X5Bi2O3−0.01909−0.01048X30P2O5−0.64988−0.441
X6CaF−0.017630.00699X31PbO−0.120330.50572
X7CaO0.027790.05747X32Pr2O3−1.98 × 10−40.00321
X8CdO1.73 × 10−40.00372X33PuO2−1.23 × 10−40.00692
X9CeO20.003−0.0024X34Rb2O−6.57 × 10−68.36 × 10−5
X10Cl−4.14 × 10⁻⁵−6.86 × 10−4X35RuO2−3.66 × 10⁻⁵−4.06 × 10−5
X11CoO2.31 × 10−48.89 × 10−4X36SO35.32 × 10−4−0.0058
X12Cr2O3−0.00351−0.00788X37Sm2O3−1.52 × 10−40.0092
X13Cs2O0.001170.00769X38SnO1.93 × 10−45.44 × 10−4
X14CuO2.23 × 10−41.94 × 10−4X39SrO1.12 × 10−40.00444
X15Eu2O31.65 × 10−55.99 × 10−4X40Tb2O3−7.36 × 10−53.15 × 10−4
X16F2.21 × 10−4−0.00361X41ThO20.003020.03535
X17Fe2O3−0.21738−0.07948X42TeO21.55 × 10−40.00128
X18Gd2O30.00690.01948X43TiO20.006970.01526
X19GeO20.00120.00683X44UO2−0.031−0.03633
X20HfO2−1.07 × 10−40.00242X45U3O8−0.00441−0.00248
X21K2O0.015410.06735X46WO31.42 × 10−4−7.56 × 10−4
X22La2O3−0.001590.01509X47Y2O37.81 × 10−53.44 × 10−4
X23Li2O0.028540.05249X48ZnO0.00659−0.02766
X24MgO0.009980.02401X49ZrO20.018270.01158
X25MnO20.006−0.01138X50RmOn0.01910.07827
X51H2O1.95 × 10−41.49 × 10⁻⁴
Publisher’s Note: MDPI stays neutral with regard to jurisdictional claims in published maps and institutional affiliations.

