Abstract
The seismic response of underground structures such as subway stations is critical. However, the complex underground structure experiments under a dynamic centrifuge shaking table are significantly limited. This study conducts a shaking table test of a two-story three-span underground structure under 50 g gravitational centrifuge acceleration to investigate soil–structure interaction effects (SSI). The test is performed on a sand soil-structural model using a laminar shear box with depths of 2.5 m, and the input motion is a Parkfield wave. The experimental results indicate that the central column of the two-story three-span underground structure is the weak component during the earthquake. In addition, the numerical simulations of the soil–structure system are carried out to study the effect of buried depth and foundation soil type on the seismic response of the underground structures. The experimental and numerical results proved that the performed centrifuge test can reproduce the key seismic response characteristics of the SSI in the prototype underground structure and provided guidelines to design a similar underground structure in the future development of the urban subway systems.
1. Introduction
The collapse of critical underground structures such as subway stations and nuclear reactors due to earthquakes would cause catastrophic loss of life and property damage to society [1,2,3]. Their seismic risks have equal importance to the infrastructure above the ground. For example, the 1995 Hyogo-ken-Nanbu earthquake in Japan caused severe damage to the reinforced concrete subway structures, particularly the complete collapse of the Daikai Statio [4]. This earthquake also severely damaged the Kosaku Nagata and Sannomiya stations in the same line. Furthermore, an underground shopping mall near the Shinkaichi Station and the Shinkansen (the Japanese bullet train) tunnels were also severely damaged [5]. Similar seismic failures were also observed in the November 1999 earthquake in Turkey, which contributed to the failure of the Bolu highway tunnel under construction. It also contributed to the 1999 Chi-Chi earthquake in Taiwan, which caused severe damage to underground gas and water pipelines [2]. These failures attracted immediate attention and later resulted in extensive studies of seismic damage to underground structures.
The general approaches to studying the seismic performance of underground structures can be investigated by field investigations, model tests, and numerical simulations. The in situ observations generally reflect the characteristics of soil–structure interaction effects due to the actual dynamic responses of underground structures during an earthquake. However, the data obtained through the field is rare and limited. It is unusual to install instruments before the seismic event at exact locations where the failure occurs [6]. The other physical approach relies on the model test, which provides a controllable source of observation. It allows for well-controlled testing conditions, which is relevant for conducting parametric studies and investigating failure mechanisms [7,8,9]. The model test is also very useful for validating numerical tools, constitutive models, and the boundary-value problem [7]. In addition, many numerical studies have been conducted on the seismic failure mechanism of underground structures [10,11,12,13,14], but most studies lack validation by physical model tests. Therefore, model tests are critical to investigate the seismic response of complex underground structures.
Dynamic model tests for geotechnical engineering can be generally divided into two categories, namely those performed under 1 g gravitational field (1 g shaking table tests) and those performed under n g gravitational field (centrifuge tests). The 1 g shaking table and centrifuge tests have merits and limitations [8]. The dimension of the model structure can be large in a 1 g shaking table test so that the foundation soil can be filled, compacted, and instrumented relatively easily in the model structure. Meanwhile, the 1 g shaking table tests can conduct multi-axis input motions. The particle size problems and the disturbance arising from the instruments can be ignored for a larger model. However, the confining stress in the 1 g shaking table tests is scaled accordingly, and it is generally lower than the stress in the prototype, which may induce different dynamic behavior for soil between the model and prototype scale.
On the other hand, centrifuge modeling techniques are increasingly used to investigate the seismic response of the underground structure. The physical model under the centrifuge field can reproduce the stress state as in the prototype, and due to its small similitude for length, the size of the model can be very small [15]. Therefore, the centrifugal model tests enable considerable cost savings regarding the total quantity of materials, labor, and time spent in model preparation compared to large-scale shaking table tests [7,16]. However, most research focused on the effect of input earthquake characteristics or liquefaction sites on the seismic response of underground structures [17,18,19,20,21,22]. These tests are mostly limited to small-scale underground structures such as buried pipes or subway tunnels. The model tests on the seismic response of large-section underground structures are still rare, and there is still a lack of research on the additional deformation and internal forces of underground structures caused by earthquakes [6,16]. In addition, limited studies have been carried out to investigate the soil–structure interaction (SSI) effects [14,15].
Therefore, this work aims to study the seismic response of a two-story three-span subway station and its SSI effect by conducting a geotechnical centrifuge shaking table test at centrifugal accelerations of 50 g. Compared to traditional model tests on pipelines, this soil structure, an actual structural system of a subway station with a more complex geometric feature, and its SSI effect under earthquake is mainly unknown. To better reproduce the actual stress conditions on the structure due to the soil pressure, we take advantage of our institute’s centrifuge shaking table test facility with an acceleration of 50 g. In addition, we also created a scaled model out of gypsum material with low strength and elastic modulus such that the failure of the specimen can be induced. Numerical simulations were carried out to study the effect of buried depth and foundation soil types on the dynamic response of the underground structure. Based on the experimental and numerical simulation results, the seismic response in terms of acceleration and strain in the soil–underground structure system, along with their vulnerability, can be revealed.
2. Method: Centrifuge Shaking Table Test
2.1. Test Equipment and Set-Up
The centrifuge shaking table test is conducted using the shaking table facility at the Institute of Geotechnical Engineering at Tsinghua University. The effective radius of the shaking table is 2.4 m, and the area is 0.42 m2. The facility can produce sinusoidal waves or arbitrary waveform seismic waves, and the frequency of the input motion ranges from 10 to 250 Hz. The centrifuge shaking table with a maximum payload of 100 kg can provide an acceleration over 20 g and a maximum duration of 4 s. In addition, the system can provide precisely unidirectional horizontal vibration at a maximum centrifugal acceleration of 50 g, as shown in Figure 1.
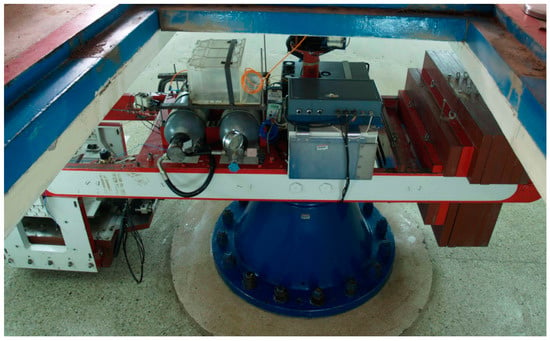
Figure 1.
Centrifuge shaking table with a maximum centrifugal acceleration of 50 g at Tsinghua.
To minimize the boundary effect resulting from the soil container and more accurately simulate one-dimensional wave propagation fields, i.e., free-field conditions, the laminar shear box (also referred to as the stacked ring box) is used in the shaking table system for centrifuge [23]. The laminar shear box used in the test was designed and fabricated by Tsinghua University. The height of the shear box is 30 cm, and its horizontal section dimension is 50 cm × 20 cm. The shear stack weighs approximately 40.6 kg. It is made up of 15 lightweight rectangular hollow aluminum square tubes with a height of 2 cm connected by guide tracks with low friction. It is intended that the composite shear stiffness of the stack is significantly less than that of the contained soil deposit. To prevent the leakage of the soil from the connections between aluminum frames, there is a rubber membrane attached to the internal wall of the box. The rubber membrane with excellent ductility hardly affects the shear stiffness of the stack. Four staff gauges are mounted on the rubber membrane inside the box to control the filling thickness during the sample preparation process.
2.2. Similitude Ratio Design
To ensure that the experimental model can accurately simulate the soil–structure dynamic interaction in the prototype structure, the experimental similitude ratio design should satisfy the following principles: (1) The stress in the prototype and the test model is similar; (2) The relative stiffness of the soil and the underground structure in test model is similar to that of the prototype; (3) The similitude constant of the dynamic displacement response is consistent with the geometric similitude constant. (4) The soil–structure interface properties are similar in the test and the prototype.
In the centrifuge shaking table test, we adopt the same soil material for the prototype and model structure, and it ensures that the self-weight stress in the model is the same as the prototype when the size of the model is reduced to 1/n (n = 50) of the prototype and the field acceleration of the model is increased to n times the acceleration of gravity. In this paper, the maximum acceleration of the geotechnical centrifuge is 50 g. Hence, the similitude ratio corresponding to the length (L) and acceleration (a) in the basic dimension system is taken as 1/50 and 50 (model/prototype), respectively. The similitude ratio of the density dimension (ρ) is set to be 1 because the soil in the test model is the same as the prototype. The similitude relations for other parameters are summarized in Table 1.

Table 1.
Similitude relations used in centrifuge model test.
2.3. The Model Soil and Structure
The common sandy soil in the city of Beijing was adopted in the centrifuge model test. Figure 2 shows the cumulative curve of particle size gradation of sand soil. The P represents the cumulative content of soil smaller than a certain particle size d. The relative compactness and confining pressure of sand have a significant influence on the mechanical properties of sand. During the preparation of the test soil samples, the method of layered compaction was adopted after adding soil material in layers into the tested model. The contact surface between each soil layer was continuous and not layered. The relative compactness and confining pressure are ensured by controlling the mass density of sandy soil. During the test, the density of sand was 1.65 g/cm3, the average water content was 5%, the relative compactness was 0.403, and the void ratio was 0.671.
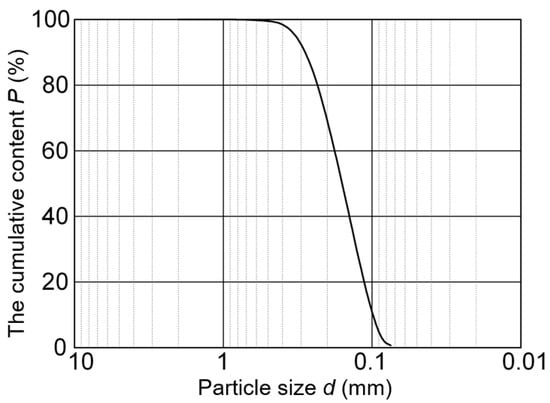
Figure 2.
Grain size distribution of sand.
The prototype of the underground structure is a two-story three-span frame structure with a total width of 12.1 m and a total height of 5.15 m. The cross-section dimensions of the structure are shown in Figure 3a. The strength grade of the concrete adopted in the structure is C30. For the model structure, gypsum and low elastic modulus pure aluminum wire are used to simulate the prototype concrete and steel rebar, respectively. Gypsum has been used for structural model making for a long time [24,25,26]. Its properties are relatively close to concrete, all of which are brittle materials, and the performance is stable, easy to form, and easy to process. Its strength and modulus of elasticity are small, which can simulate the destructive behavior of concrete structures. To ensure the synergistic performance of the gypsum composite material and the steel wire, we used pure aluminum wire with a low elastic modulus in the gypsum model to simulate the prototype reinforced concrete structure. According to the testing of six pure aluminum wires with a diameter of 2 mm, the average elastic modulus of pure aluminum wire is 70 GPa. It can be found that the ratio of the elastic modulus of pure aluminum wires to gypsum composite in the model is similar to the ratio of the elastic modulus of steel reinforcement to concrete in the prototype structure. In addition, there is good adhesion between the gypsum composite material and the pure aluminum wire based on the experimental observation. Hence, gypsum and low elastic modulus pure aluminum wire can well simulate the prototype concrete and steel rebar, respectively.
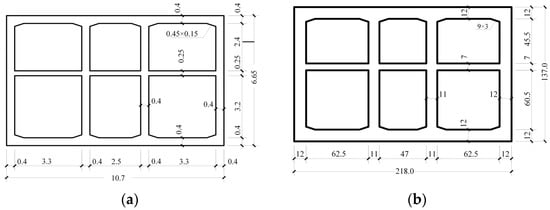
Figure 3.
The cross-section dimension underground structure. (a) Prototype structure (unit m); (b) model structure (unit mm).
The underground structure’s dynamic response under an earthquake’s action is controlled by its bending stiffness EI. Therefore, the scaling law for the model structure is calculated based on the structure’s similarity ratio of bending stiffness EI, as shown in Table 1. The corresponding member sizes of the model structure are calculated according to the bending stiffness per meter of the member satisfying the similarity ratio. The cross-section dimensions of the model structure are shown in Figure 3b. The elastic modulus of gypsum and pure aluminum is 7963 MPa and 70 GPa, respectively. According to the similitude relations, the thicknesses of the gypsum model’s sidewall, top slab, bottom slab, and middle slab are 12 mm, 12 mm, 12 mm, and 7 mm, respectively. The side length of the middle column is 11 mm. The reinforcement ratio of the model structure is consistent with that of the prototype, which is 1.2% and 1.5% for slab and column, respectively. The reinforcement scheme of the model structure slab and sidewall components is double-layer bidirectional reinforcement, except for the middle slab, which adopts single-layer bidirectional aluminum reinforcement. The diameter of aluminum wire is 1.2 mm, and the spacing is 10 mm. The center column adopts 4 mm × 1.2 mm aluminum bars with a spacing of 5.3 mm.
2.4. Instrumentation Configuration
Sensors are used to monitor the dynamic response of soil and structure throughout the shaking table test. The layout of the sensors in the model structure is shown in Figure 4 and Figure 5. It includes 17 strain gauges, 13 accelerometers, 3 displacement transducers, and 4 earth pressure transducers, denoted as S, AH, D, and E, respectively. The strain gauges are installed near the structural weakness. The earth pressure sensors on the sidewall are aimed to monitor the influence of dynamic earth pressure on the structural strain during the vibration.
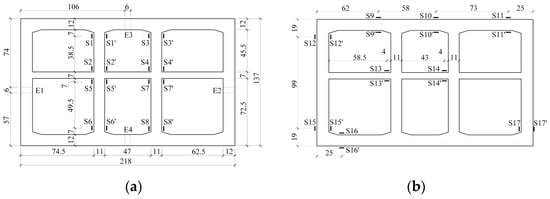
Figure 4.
Layout of strain sensors in cross-section of the model. (a) Major observation section; (b) secondary observation section (unit mm).

Figure 5.
Installed accelerometers and displacement transducers. (a) Layout in the test model; (b) snapshot of the actual specimen with installed devices.
The acceleration sensors are arranged along the axis, and the near-field soil layer of the model structure aimed to measure the variation of acceleration along with the height and to study the influence of the existence of structure on the near-field soil layer acceleration. The displacement time history at the top and bottom of the model structure can be obtained by integrating the acceleration time history acquired by the acceleration sensors. Then, the correlation between the structural response and the displacement of the soil layer near the top and bottom slab of the structure was obtained.
3. Numerical Simulation Analysis
An FEA model using the OpenSees program was established to simulate the dynamic interaction system of the soil–underground structure. The effects of buried depth on the seismic response of the underground structure were studied according to numerical simulation. As well, the soil layer conditions that adversely affect the seismic performance of the underground structure are discussed.
The Description of the Numerical Model
The constitutive model of sand soil in this paper adopted the Press Depend Multi Yield (PDMY) model implemented into OpenSees by Yang and Elgamal [27,28]. The PDMY model is an elastic–plastic constitutive model of soil, which can present the mechanical properties of sand with various constraint pressure. This model also can simulate the nonlinear hysteretic properties of the stress–strain relationship of sand, the shear dilation of dense sand, and the shear contraction of loose sand. The parameters of the sandy soil constitutive model and the soil damping ratio used in the numerical model were calibrated according to the experimental results. The physical and mechanical parameters of the model soil are summarized in Table 2.

Table 2.
The parameters of the PDMY model for sandy soil.
The challenge of considering the mechanical properties of reinforced concrete is a crucial part of building an accurate numerical model of underground structures. Currently, the fiber model based on the flexibility method and one-dimensional material constitutive has a relatively higher accuracy to simulate the nonlinear behavior of reinforced concrete frame structures [29]. The fiber model uses the uniaxial stress-strain relationship of the material to describe its mechanical properties. In this paper, the Fiber Section model in OpenSees was adopted. The constitutive model of concrete adopted the modified Kent–Park model [30], and the stress–strain curve is shown in Figure 6a. The Menegotto–Pinto model was adopted for the simulation of steel rebar, and the uniaxial stress–strain curve is shown in Figure 6b.

Figure 6.
Constitutive models of materials. (a) The constitutive model of sand soil; (b) modified Kent–Park model for concrete; (c) Menegotto–Pinto model for steel rebar.
In the FEA model, the underground structure is modeled using a beam element, and the soil is modeled with a 3D solid element, as shown in Figure 7. Reasonable boundary conditions for simulating model tests determine the accuracy of the numerical simulation. In the model test, the side walls of the stacked ring box have the same motion at the same soil layer depth. Hence, the nodes at the same depth on both sides of the model are coupled together in the numerical simulation. The boundary condition of the model is simulated with a “tie boundary” model. Moreover, the dimension and reinforcement ratio of the underground structure in the numerical model are the same as those of the prototype. The parameters of concrete in the prototype structure corresponding to the gypsum composite structural model are shown in Table 3. The elastic modulus (Es) and yield strength (fy) of steel rebar are 200 GPa and 115 MPa, respectively.
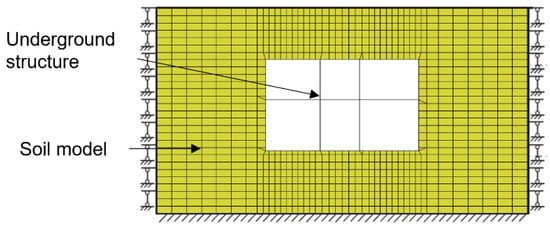
Figure 7.
The FE model of the soil–underground structure.

Table 3.
Concrete material parameters of the prototype underground structure.
4. Results and Discussion
4.1. Experimental Results
In this paper, a centrifuge shaking table test of a soil–underground structure system is carried out. The structure model was built with gypsum and pure aluminum bars and the buried depth of the structure roof is 2.5 m. The input seismic wave in the test adopts Parkfield motion, which is recorded in the 1966 Parkfield (California) Earthquake. Figure 8 shows the acceleration records and Fourier spectrum of the input motions in the main vibration direction of the shaking table. The actual peak vibration acceleration is 0.069 g.

Figure 8.
Acceleration records (a) and Fourier spectrum (b) of input motions on the shaking table surface.
In this section, the dynamic responses including acceleration and strain in the horizontal vibration test of the soil–underground structure system are discussed. All the results are obtained by converting the model test data into the prototype scales according to the similitude relations presented in Table 1.
4.1.1. Acceleration Response of the Model Soil and Underground Structure
The acceleration time history and acceleration Fourier spectrum of the model soil and underground structure is shown in Figure 9 and Figure 10. The acceleration responses are recorded by accelerometers at points AH1, AH4, and AH5 for the model soil, and at points AH7, AH9, and AH10 for the structure, with buried depths of 1.5 m, 9.5 m, and 12 m, respectively. The peak accelerations at points AH1, AH4, and AH5 for the structure are 0.042 g, 0.032 g, and 0.031 g, respectively. In addition, the peak accelerations at points AH7, AH8, AH9, and AH10 in the model soil are 0.047 g, 0.039 g, 0.027 g, and 0.032 g, respectively. Comparing the peak accelerations measured by sensors AH4 and AH9 with the same buried depth of 9.5 m, it can be found that the acceleration response of AH4 is increased by 19% compared to AH9, due to the existence of an underground structure. Considering the influence of underground structure on the acceleration Fourier spectrum from Figure 10, It is found that the structure has a certain attenuation effect on the high-frequency components of the acceleration.
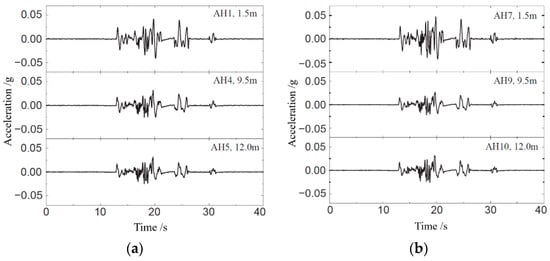
Figure 9.
Acceleration time history: (a) in the structure; (b) in the model soil.
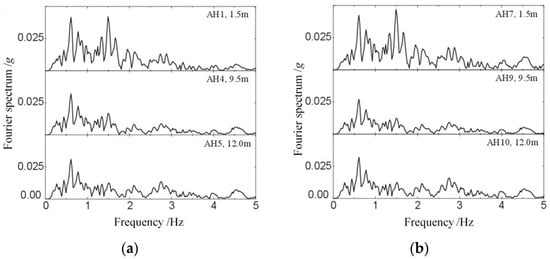
Figure 10.
Acceleration Fourier spectrum: (a) in the structure; (b) in the model soil.
In the seismic analysis of underground structures, there is a corresponding relationship between the deformation of the structure and the soil around the structure. The underground structure is constrained by the surrounding soil and vibrates along with the soil under seismic motion. Therefore, deformation of the foundation soil is a vital parameter reflecting the seismic response of the underground structure. To analyze the relationship between the deformation of the foundation soil and the dynamic response of the underground structure, the deformation of the foundation soil near the top and bottom slab of the structure is obtained by integrating twice the acceleration time history, which is measured by the accelerometers AH1 and AH4 in the structure. Due to the poor accuracy of the accelerometers to measure the low-frequency components of the acceleration, the drift of displacement appears. Hence, high-pass filtering is applied to the acceleration time history in the process of acceleration integration and the cut-off frequency is set to 0.2 Hz.
Figure 11 shows the displacement and displacement difference time history obtained by integrating the acceleration time history recorded by accelerometers AH1 and AH4 and the peak displacement difference is 5.3 mm. In addition, the deformation of the near-field foundation is calculated as 7.4 mm, which is obtained by the accelerometers AH7 and AH9 time history in the model soil with the height close to the top and bottom slab of the structure. As a result, the deformation of the structure near the foundation is slightly smaller than that of the foundation soil near the structure in the sand soil–structure underground system with a buried depth of 2.5 m.

Figure 11.
The displacement response at AH1 and AH4: (a) displacement time history; (b) displacement difference time history.
4.1.2. Strain in the Model Structure
The strain gauges are installed symmetrically on both sides of the measurement point. According to the recordings of the two strain gauges, the bending moment and axial force response at the measurement point can be calculated. Figure 12 shows the strain time history responses of two strain gauges at the measuring point S1 during the test. Under the input motion, the strain responses caused by the bending moment and the axial force, respectively, can be calculated according to the strain gauge records. Figure 13 shows the strain time history at point S1 produced by the bending moment and the axial force, respectively. It is found that bending deformation dominates in the dynamic response of the central column. The strain caused by axial force is relatively low in the underground structure.

Figure 12.
Strain time history at point S1: (a) the left side of S1; (b) the right side of S1.

Figure 13.
The strain responses at point S1 are caused by: (a) bending moment and (b) axial force.
Under the action of the earthquake, both the structure and foundation soil are subject to inertial forces. Meanwhile, the sidewalls of the underground structure are subject to the dynamic earth pressure of the foundation soil and the top and bottom slab are subject to the shear stress transmitted from the soil to the structure. Therefore, the underground structural components will be deformed and strained under the action of these forces. Figure 14 shows the strain time history caused by bending moments at points S4 and S5 in the structure. The peak additional bending strain at points S1, S4, and S5 on the central column in the structure are 38 με, 42 με, and 56 με, respectively. It shows that the central column of the two-story three-span underground structure is the most unfavorable member during the earthquake.

Figure 14.
The strain responses at point S1 are caused by: (a) bending moment and (b) axial force.
The plane section assumption is adopted to calculate the peak bending moment at the corresponding section of the central column according to the relationship between the bending normal strain and the bending moment, as shown in Equation (1).
here, M is the calculated bending moment, ε is the measured strain of the prototype structure converted according to the similitude relationship, E is the elastic modulus corresponding to the prototype structure, and W is the cross-sectional inertia moment of the calculated component.
M = εEW
According to Equation (1), the bending moments of the central column at points S1, S4 and S5 are 12 kN·m, 13 kN·m, and 18 kN·m, respectively. It can be found that the bending moment of the central column in the substructure is smaller than that in the superstructure. In addition, the additional axial force of the structure is relatively small under the action of the earthquake, which indicates that the additional axial force does not have a prominent effect on the underground structure under the action of the horizontal earthquake.
4.2. Numerical Simulation Results
4.2.1. Validation of the Numerical Model
The experimental results of the geotechnical centrifuge shaking table test for sandy soil–underground structure reported in Section 4.1 are used to assess the accuracy of the numerical model established herein. In the FEA model, it is assumed that the beam element and the solid element have the same line displacement at the joint node. Furthermore, the dynamic contact between the structure and the surrounding soil is not considered. The input seismic motion in the FEA model has adopted the acceleration corresponding to the prototype using the acceleration records of the accelerometer AH6 located at the bottom of the foundation soil.
The comparison of peak acceleration for simulation and experimental results at the corresponding sensor position and burial depth is shown in Table 4. It is found that the peak acceleration response at the axis of the structural model (corresponding to accelerometers AH1, AH3, and AH4) in simulation matches well with that of the experiment results. However, the relative error of acceleration response in the foundation soil near the sidewall of the model structure in simulation and experiment is high. It is mainly due to the boundary condition provided by the stacked ring box in the test is not ideal, which has a certain impact on the experimental results. Figure 15 shows the simulation and experimental results of acceleration time history recorded by accelerometers AH1 and AH4. It can be observed from the figure that the acceleration time history of the simulation results matches well with that of the experimental results. Generally, it can be concluded that the acceleration response of the sandy soil–underground structure system can be well-simulated by numerical models.

Table 4.
The comparison of peak acceleration for simulation and experimental results.
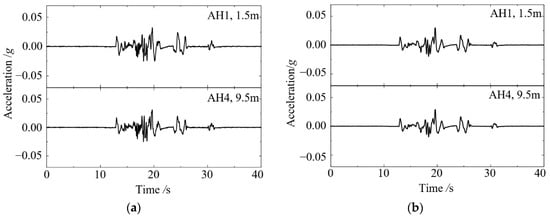
Figure 15.
The acceleration time history of accelerometers AH1 and AH4: (a) experimental result; (b) simulation result.
The verified numerical model is used to study the effect of the buried depth and soil layer conditions on the seismic response of the underground structure. The buried depth of 2.5 m and 5.0 m are considered. The foundation soil category adopts sandy soil and two kinds of layered soil foundation, i.e., layered soil-1 (upper-layer sand–underlayer clay), and layered soil-2 (upper-layer sand–underlayer clay). The seismic motion used in the numerical simulation model includes Parkfield motion consistent with the test and Kobe motion recorded in the Hyogoken–Nanbu Earthquake.
4.2.2. The Effect of Buried Depth
The impact of burial depth on seismic responses to underground structures can be manifold. On the one hand, the shear effect and soil pressure of the overburden layer on the underground structure increase with the buried depth, which is unfavorable to the seismic response of the underground structure. On the other hand, the constraint effect of the soil layer on the underground structure is strengthened with the increasing buried depth, which limits the deformation of the structure. Hence, it is beneficial to the seismic response of the underground structure.
Numerical simulations are carried out to investigate the effect of buried depth on the seismic response of the underground structure, where the buried depth of the top slab in the structures is 2.5 m and 5.0 m, respectively. To study the relationship between the internal force response and the burial depth under the combined action of the self-weight and seismic load, the simulation results at points S1, S6, S12, and S15 in the model structure are selected. The peak internal force responses, including bending moment and axial force, are shown in Table 5.

Table 5.
The peak values of internal force with various buried depths.
As can be seen from Table 5, the relationship between internal force response and buried depth under the action of Kobe and Parkfield waves motion is similar. The bending moment at the top of the central column (S1) is larger than that of the bottom (S6), but the bending moment of the central column does not change much with the buried depth. Yet, the buried depth has a greater effect on the axial force of the central column. As well, for the sidewall of the structure (S12 and S15), both the bending moment and axial force become larger with an increased buried depth. According to the internal force response of the central column and sidewall under different burial depth conditions and seismic vibrations, it can be found that the buried depth plays a controlling role on the axial force of the middle column, and also has a significant impact on the bending moment and axial force of the sidewall.
4.2.3. The Effect of Foundation Soil Type
The influence of foundation soil types on the seismic response of the underground structure is discussed in this section. The foundation soil type refers to different soil layer conditions around the underground structure. The foundation soil types considered in the numerical simulation model include sand, layered soil-1 (upper-layer sand–underlayer clay), and layered soil-2 (upper-layer sand–underlayer clay). The constitutive model of clay soil adopts the Press Independ Multi Yield (PIMY) model proposed by Iwan WD [31] and Mroz Z [32] and implemented into OpenSees by Yang and Elgamal [27,28]. The parameters of the PIMY model for clay soil are based on the experimental tests and the recommended values by OpenSees. The physical and mechanical parameters of the model soil are summarized in Table 6.

Table 6.
The parameters of the PDMY model for clay soil.
The internal force response of the underground structure under various soil foundation types is shown in Table 7. It can be seen that the internal force of the structure varies with the change of the soil types under the seismic vibrations. The internal force response of structures in the sand and upper-layer sand–underlayer clay foundation is lower than that of the upper-layer sand–underlayer clay foundation. Due to the shear modulus of the upper-layer sandy soil being higher than that of the underlayer clay soil in the upper-layer sand–underlayer clay soil foundation, it is equivalent to the existence of a soft soil underlying stratum in the foundation, which is not conducive to the seismic resistance of the underground structure. In addition, the bending moment and axial force of the structure under seismic vibrations are found to be lowest in the sandy soil foundation, but highest in the upper layer of the sand–underlayer clay soil foundation. Overall, the condition of the soil foundation has a significant effect on the internal force response of underground structures and the presence of a soft soil underlying stratum in the foundation should be avoided.

Table 7.
The peak values of internal force with various soil foundation types.
5. Conclusions
In this paper, the centrifuge shaking table test of a two-story three-span sand soil–underground structure is carried out to investigate the soil–structure dynamic interaction (SSI) effect. The acceleration and strain response of the soil–underground structure system is analyzed based on the experimental results. According to the dynamic response of the soil–underground structure system, it is found that the central column of the two-story three-span underground structure is the weakest component under seismic motion. The peak additional bending strain at the top end of the column is greater than that of the bottom end, with a similar axial force. Hence, the top end of the column may be damaged earlier than the bottom end in the underground structure under seismic motion.
Special attention should be paid to the top of the column when performing seismic design. The strain responses in the two representative cross-sections are consistent, indicating that the integrity of the seismic response of the structural model is well and the sealing measures taken at the ends of the structural model work well. In addition, numerical simulations of the soil–structure system are carried out to study the effect of buried depth and foundation soil type on the seismic response of the underground structure. The experimental and numerical results showed good agreement. The validated numerical model revealed that the buried depth and foundation soil type has an important impact on the seismic response of the underground structure. The internal force of the sidewall in the underground structure is increased with the increase of the buried depth. The foundation soil condition with soft soil underlying stratum should be avoided, which harms the performance of the underground structures under seismic loads.
This study provides useful experimental data for designing critical underground structures (such as subway stations). However, there are some limitations to this research. The centrifuge shaking table test of soil–underground structure in this study was carried out under unidirectional vibration. Further research should be done to investigate the response of soil-subsurface structures in centrifugal shaking table tests under multidirectional seismic action. In numerical simulations, advanced computational techniques such as machine learning should be considered to accelerate the prediction as well as consider the uncertainty of the problem. In addition, the seismic response of multi-layer and multi-span underground structures considering the soil-foundation interaction should be further investigated.
Author Contributions
Conceptualization, D.Z.; project administration, J.L.; writing—original draft, D.Z.; writing—review and editing, D.Z. and J.L. All authors have read and agreed to the published version of the manuscript.
Funding
This research received no external funding.
Institutional Review Board Statement
Not applicable.
Informed Consent Statement
Not applicable.
Data Availability Statement
The original contributions presented in the study are included in the article; further inquiries can be directed to the corresponding author.
Conflicts of Interest
The authors declare no conflict of interest.
References
- Iida, H.; Hiroto, T.; Yoshida, N.; Iwafuji, M. Damage to daikai subway station. Soils Found. 1996, 36, 283–300. [Google Scholar] [CrossRef]
- Wang, W.L.; Wang, T.T.; Su, J.J.; Lin, C.H.; Seng, C.R.; Huang, T.H. Assessment of damage in mountain tunnels due to the taiwan chi-chi earthquake. Tunn. Undergr. Space Technol. 2001, 16, 133–150. [Google Scholar] [CrossRef]
- Wang, Z.Z.; Gao, B.; Jiang, Y.J.; Yuan, S. Investigation and assessment on mountain tunnels and geotechnical damage after the wenchuan earthquake. Sci. China Ser. E Technol. Sci. 2009, 52, 546–558. [Google Scholar] [CrossRef]
- Lu, C.-C.; Hwang, J.-H. Nonlinear collapse simulation of daikai subway in the 1995 kobe earthquake: Necessity of dynamic analysis for a shallow tunnel. Tunn. Undergr. Space Technol. 2019, 87, 78–90. [Google Scholar] [CrossRef]
- Huo, H.; Bobet, A.; Fernandez, G.; Ramirez, J. Load transfer mechanisms between underground structure and surrounding ground: Evaluation of the failure of the daikai station. J. Geotech. Geoenviron. Eng. 2005, 131, 1522–1533. [Google Scholar] [CrossRef]
- Sun, L. Centrifuge Modeling and Finite Element Analysis of Pipeline Buried in Liquefiable Soil; Columbia University: New York, NY, USA, 2001. [Google Scholar]
- Kloukinas, P.; di Santolo, A.S.; Penna, A.; Dietz, M.; Evangelista, A.; Simonelli, A.L.; Taylor, C.; Mylonakis, G. Investigation of seismic response of cantilever retaining walls: Limit analysis vs. shaking table testing. Soil Dyn. Earthq. Eng. 2015, 77, 432–445. [Google Scholar] [CrossRef]
- Prasad, S.K.; Towhata, I.; Chandradhara, G.P.; Nanjundaswamy, P. Shaking table tests in earthquake geotechnical engineering. Curr. Sci. 2004, 87, 1398–1404. [Google Scholar]
- Chen, Z.; Huang, P.; Chen, W. Seismic response characteristics of multi-story subway station through shaking table test. Adv. Struct. Eng. 2021, 24, 2185–2200. [Google Scholar] [CrossRef]
- Sun, Z.; Kong, L.; Guo, A.; Xu, G.; Bai, W. Experimental and numerical investigations of the seismic response of a rock–soil mixture deposit slope. Environ. Earth Sci. 2019, 78, 716. [Google Scholar] [CrossRef]
- Zhong, Z.; Shen, Y.; Zhao, M.; Li, L.; Du, X. Seismic performance evaluation of two-story and three-span subway station in different engineering sites. J. Earthq. Eng. 2021, 1–31. [Google Scholar] [CrossRef]
- Feizi, D.; Marnani, J.A.; Alielahi, H.; Panji, M. Seismic ground amplification induced by box-shaped tunnels. Earthq. Eng. Eng. Vib. 2022, 21, 697–714. [Google Scholar] [CrossRef]
- Zhuang, H.; Ren, J.; Miao, Y.; Jing, L.; Yao, E.; Xu, C. Seismic performance levels of a large underground subway station in different soil foundations. J. Earthq. Eng. 2019, 25, 2808–2833. [Google Scholar] [CrossRef]
- Alielahi, H.; Feizi, D. Numerical study on dynamic effects of soil-tunnel-structure interaction. Int. J. Civ. Eng. 2021, 19, 1339–1355. [Google Scholar] [CrossRef]
- Liu, J.; Liu, X.; Wang, Z.; Zhao, D. Dynamic centrifuge model test of a soil–structure interaction system. China Civ. Eng. J. 2010, 43, 114–121. [Google Scholar]
- Chen, S.; Zhuang, H.; Quan, D.; Yuan, J.; Zhao, K.; Ruan, B. Shaking table test on the seismic response of large-scale subway station in a loess site: A case study. Soil Dyn. Earthq. Eng. 2019, 123, 173–184. [Google Scholar] [CrossRef]
- Chen, Z.Y.; Liu, Z.Q. Effects of pulse-like earthquake motions on a typical subway station structure obtained in shaking-table tests. Eng. Struct. 2019, 1981, 09557. [Google Scholar] [CrossRef]
- Cilingir, U.; Madabhushi, S.P.G. A model study on the effects of input motion on the seismic behaviour of tunnels. Soil Dyn. Earthq. Eng. 2011, 31, 452–462. [Google Scholar] [CrossRef]
- Chian, S.C.; Madabhushi, S.P.G. Excess pore pressures around underground structures following earthquake induced liquefaction. Int. J. Geotech. Earthq. Eng. 2012, 3, 25–41. [Google Scholar] [CrossRef]
- Xu, C.S.; Zhang, Z.H.; Li, Y.; Du, X.L. Seismic response and failure mechanism of underground frame structures based on dynamic centrifuge tests. Earthq. Eng. Struct. Dyn. 2021, 50, 2031–2048. [Google Scholar] [CrossRef]
- Koga, Y.; Matsuo, O. Shaking table tests of embankments resting on liquefiable sandy ground. Soils Found. 1990, 30, 162–174. [Google Scholar] [CrossRef]
- Elgamal, A.-W.; Zeghal, M.; Parra, E. Liquefaction of reclaimed island in kobe, japan. J. Geotech. Eng. 1996, 122, 39–49. [Google Scholar] [CrossRef]
- Bandini, V.; Cascone, E.; Biondi, G.; Di Filippo, G.; Ingegneri, S.; Casablanca, O.; Aliberti, D.; Genovese, F. The shaking table with laminar box of the university of messina. In Earthquake Geotechnical Engineering for Protection and Development of Environment and Constructions; CRC Press: Boca Raton, FL, USA, 2019; pp. 1289–1296. [Google Scholar]
- Liu, J.; Zhao, D.; Wang, W. Study of model material and scaling laws design of dynamic centrifuge shaking table test for a soil-structure interaction system. Yanshilixue Yu Gongcheng Xuebao/Chin. J. Rock Mech. Eng. 2012, 31, 3181–3187. [Google Scholar]
- An, J.; Tao, L.; Wang, H.; Li, J. Shaking table experiments on seismic response of a shield-enlarge-dig type subway station structure in liquefiable ground. Yanshilixue Yu Gongcheng Xuebao/Chin. J. Rock Mech. Eng. 2017, 36, 2018–2030. [Google Scholar]
- Liu, X.; Li, X.; Sang, Y.; Lin, L. Experimental study on normal fault rupture propagation in loose strata and its impact on mountain tunnels. Tunn. Undergr. Space Technol. 2015, 49, 417–425. [Google Scholar] [CrossRef]
- Elgamal, A.; Yang, Z.H.; Parra, E.; Ragheb, A. Modeling of cyclic mobility in saturated cohesionless soils. Int. J. Plast. 2003, 19, 883–905. [Google Scholar] [CrossRef]
- Yang, Z. Numerical Modeling of Earthquake Site Response Including Dilation and Liquefaction; Columbia University: New York, NY, USA, 2000. [Google Scholar]
- Taucer, F.F.; Spacone, E.; Filippou, F.C. A Fiber Bream-Column Element for Seismic Response Analysis of Reinforced Concrete Structures; University of California: Berkeley, CA, USA, 1991. [Google Scholar]
- Mazzoni, S.; McKenna, F.; Scott, M.H.; Fenves, G.L. Opensees command language manual. Pac. Earthq. Eng. Res. Cent. 2006, 264, 137–158. [Google Scholar]
- Iwan, W.D. On a class of models for the yielding behavior of continuous and composite systems. J. Appl. Mech. 1967, 34, 612–617. [Google Scholar] [CrossRef]
- Mróz, Z. On the description of anisotropic workhardening. J. Mech. Phys. Solids 1967, 15, 163–175. [Google Scholar] [CrossRef]
Publisher’s Note: MDPI stays neutral with regard to jurisdictional claims in published maps and institutional affiliations. |
© 2022 by the authors. Licensee MDPI, Basel, Switzerland. This article is an open access article distributed under the terms and conditions of the Creative Commons Attribution (CC BY) license (https://creativecommons.org/licenses/by/4.0/).