1. Introduction
Ports represent complex systems of elements with different features and vulnerabilities. Thus, various facilities can be damaged under earthquake loading, from wharves with their supporting systems to superstructures and utilities. Port facilities can be classified into three main categories: waterfront structures (i.e., wharves, seawalls); cranes, cargo handling, and storage facilities; port infrastructures, such as transportation and utility systems.
Different structural typologies of wharves are adopted within the maritime port area, such as pile-supported wharves, blockwork wharves, sheet pile wharves, and caisson-type quay walls. Among others, pile-supported wharves are widely used as export and import facilities. During past earthquakes, the performance of wharves has not always been satisfactory. Severe damage to the seaport waterfront structures occurred during the Richter magnitude M7.0 Port-au-Prince earthquake in 2010 a Haiti (GEER, 2010) [
1]. The 2016 M7.8 Kaikoura earthquake in New Zealand induced widespread manifestations of soil liquefaction and significant ground cracks at CentrePort, Wellington, which, in turn, damaged wharves and seaport facilities (Cubrinovski et al., 2018) [
2].
In this framework, research efforts have been carried out to assess and improve the seismic performance of pile-supported wharves by leveraging analytical and experimental methods. Investigating the seismic response of pile-supported wharves has always been challenging in numerical modelling in earthquake engineering, since it imposes a three-dimensional dynamic Soil-Structure Interaction (SSI) system in sloping conditions. Moreover, the problem’s configuration allows a family of approaches spanning from purely structural to purely geotechnical points of view. In the literature, six mainstream analytical approaches can be found to address the issue. In
Table 1, these different branches are listed along with their representative publications and are briefly illustrated.
The approaches numbered from 1 to 4 adopt the use of SSI elements that comply with soil reactions in contact with an individual pile, including skin friction-vertical displacement (t-z), pile tip-vertical displacement (Q-z), and soil reaction-horizontal reaction (p-y). In current practice, these elements are defined in compliance with API (1993) [
12] recommendations or similar design guidelines that provide the soil reaction-relative displacement between the pile element and the surrounding soil. In the mentioned codes and guidelines, the definitions of the strength of the soil structure response are based on either fully physics-based derivations (e.g., skin friction) or engineering approximations (e.g., bearing capacity below the pile as defined in Meyerhof 1963 [
13]; soil horizontal resistance behind the pile as defined in Broms 1964 [
14], Meyerhof 1981 [
15], Poulos 1995 [
16], Zhang et al., 2005 [
17]). The stiffness of the interaction elements is tailored based on experimental evidence. Among the three interaction elements, p-y has the most direct impact on the pile structural demand as the horizontal actions directly result in bending moment demands. Such a relation is visible from the differential equation of equilibrium considering a horizontally loaded elastic pile, as shown in Equation (1).
In Equation (1), EI is the flexural rigidity of the pile, y is the pile displacement, ysoil is the soil displacement, N is the axial load applied on the pile, and P is the force per length exerted as soil resistance. Being specific to Approach 1, only the linear portions of the SSI elements are used, allowing response spectrum applications, whereas in Approaches 2 to 4 an entire non-linear backbone curve may be generated.
Among the listed methods, Approach 6 provides the most accurate and precise solution tailored to the case-specific geometry and specifications, with a cost of computational burden that may not be feasible if the desired study includes scenarios based on multiple input motions. The decrease in solution accuracy compensates for reduction of the computational burden by reducing the computational domain to 2D and the use of SSI springs. More specifically, the classical use of p-y curves disregards the effect of the presence of piles on the slope response and the unsymmetric response between downslope/upslope directions. In contrast, the choice of reduction to 2D geometry without using p-y curves raises the issue of the rigid connection between the structural and soil elements.
In seismic risk assessment and loss estimation, fragility models can effectively describe the probability of exceeding a given performance level of a structure under earthquake loading. Fragility curves are usually represented as two-parameter (ln-median and ln-standard deviation) cumulative lognormal distributions, which link a ground motion intensity measure with the seismic response of the considered structure. Fragility models are available in the literature for the main port components, including the wharf structures and cranes. HAZUS (NIBS, 2004 [
18]) proposed empirical fragility curves for waterfront structures (without distinction between different wharf typologies) and the cargo handling equipment. With specific reference to pile-supported wharves, analytical fragility functions based on the outcomes from the numerical analysis were developed by different authors, such as Na et al., (2009) [
19], Shafieezadeh (2011) [
20], Thomopoulos and Lai (2012) [
21], Yang et al., (2012) [
5], Mirfattah (2013) [
22], Heidary-Torkamani et al., (2013) [
23], Bozzoni et al., (2014) [
24], Ntritsos (2015) [
25], Su et al., (2019) [
10], Shah (2020) [
3], and Mirzaeefard et al., (2021) [
26]. Kosbab (2010) [
27] and Tran et al., (2019) [
28] proposed analytical fragility curves for container cranes. It turns out that there is a lack of effort in deriving the fragility functions by considering the wharf-crane-soil as a combined system.
This paper focuses on numerical modelling of a pile-supported wharf structure, a container crane overlaying the wharf and the surrounding soil deposits. The reference infrastructure components are strategic facilities of the port of Gioia Tauro (southern Italy), described in
Section 2. Based on the outcomes from non-linear time-history analyses for the built model (
Section 3), analytical fragility curves for single port components and the wharf-crane-soil system are proposed (
Section 4). To the authors’ best knowledge, the latter is developed for the first time and becomes the main contribution to the literature. Finally, in
Section 5, damage percentages, obtained by applying the fragility curves proposed in this study and various models available in the literature, are compared concerning an earthquake scenario.
2. Description of the Target Port Infrastructure Components
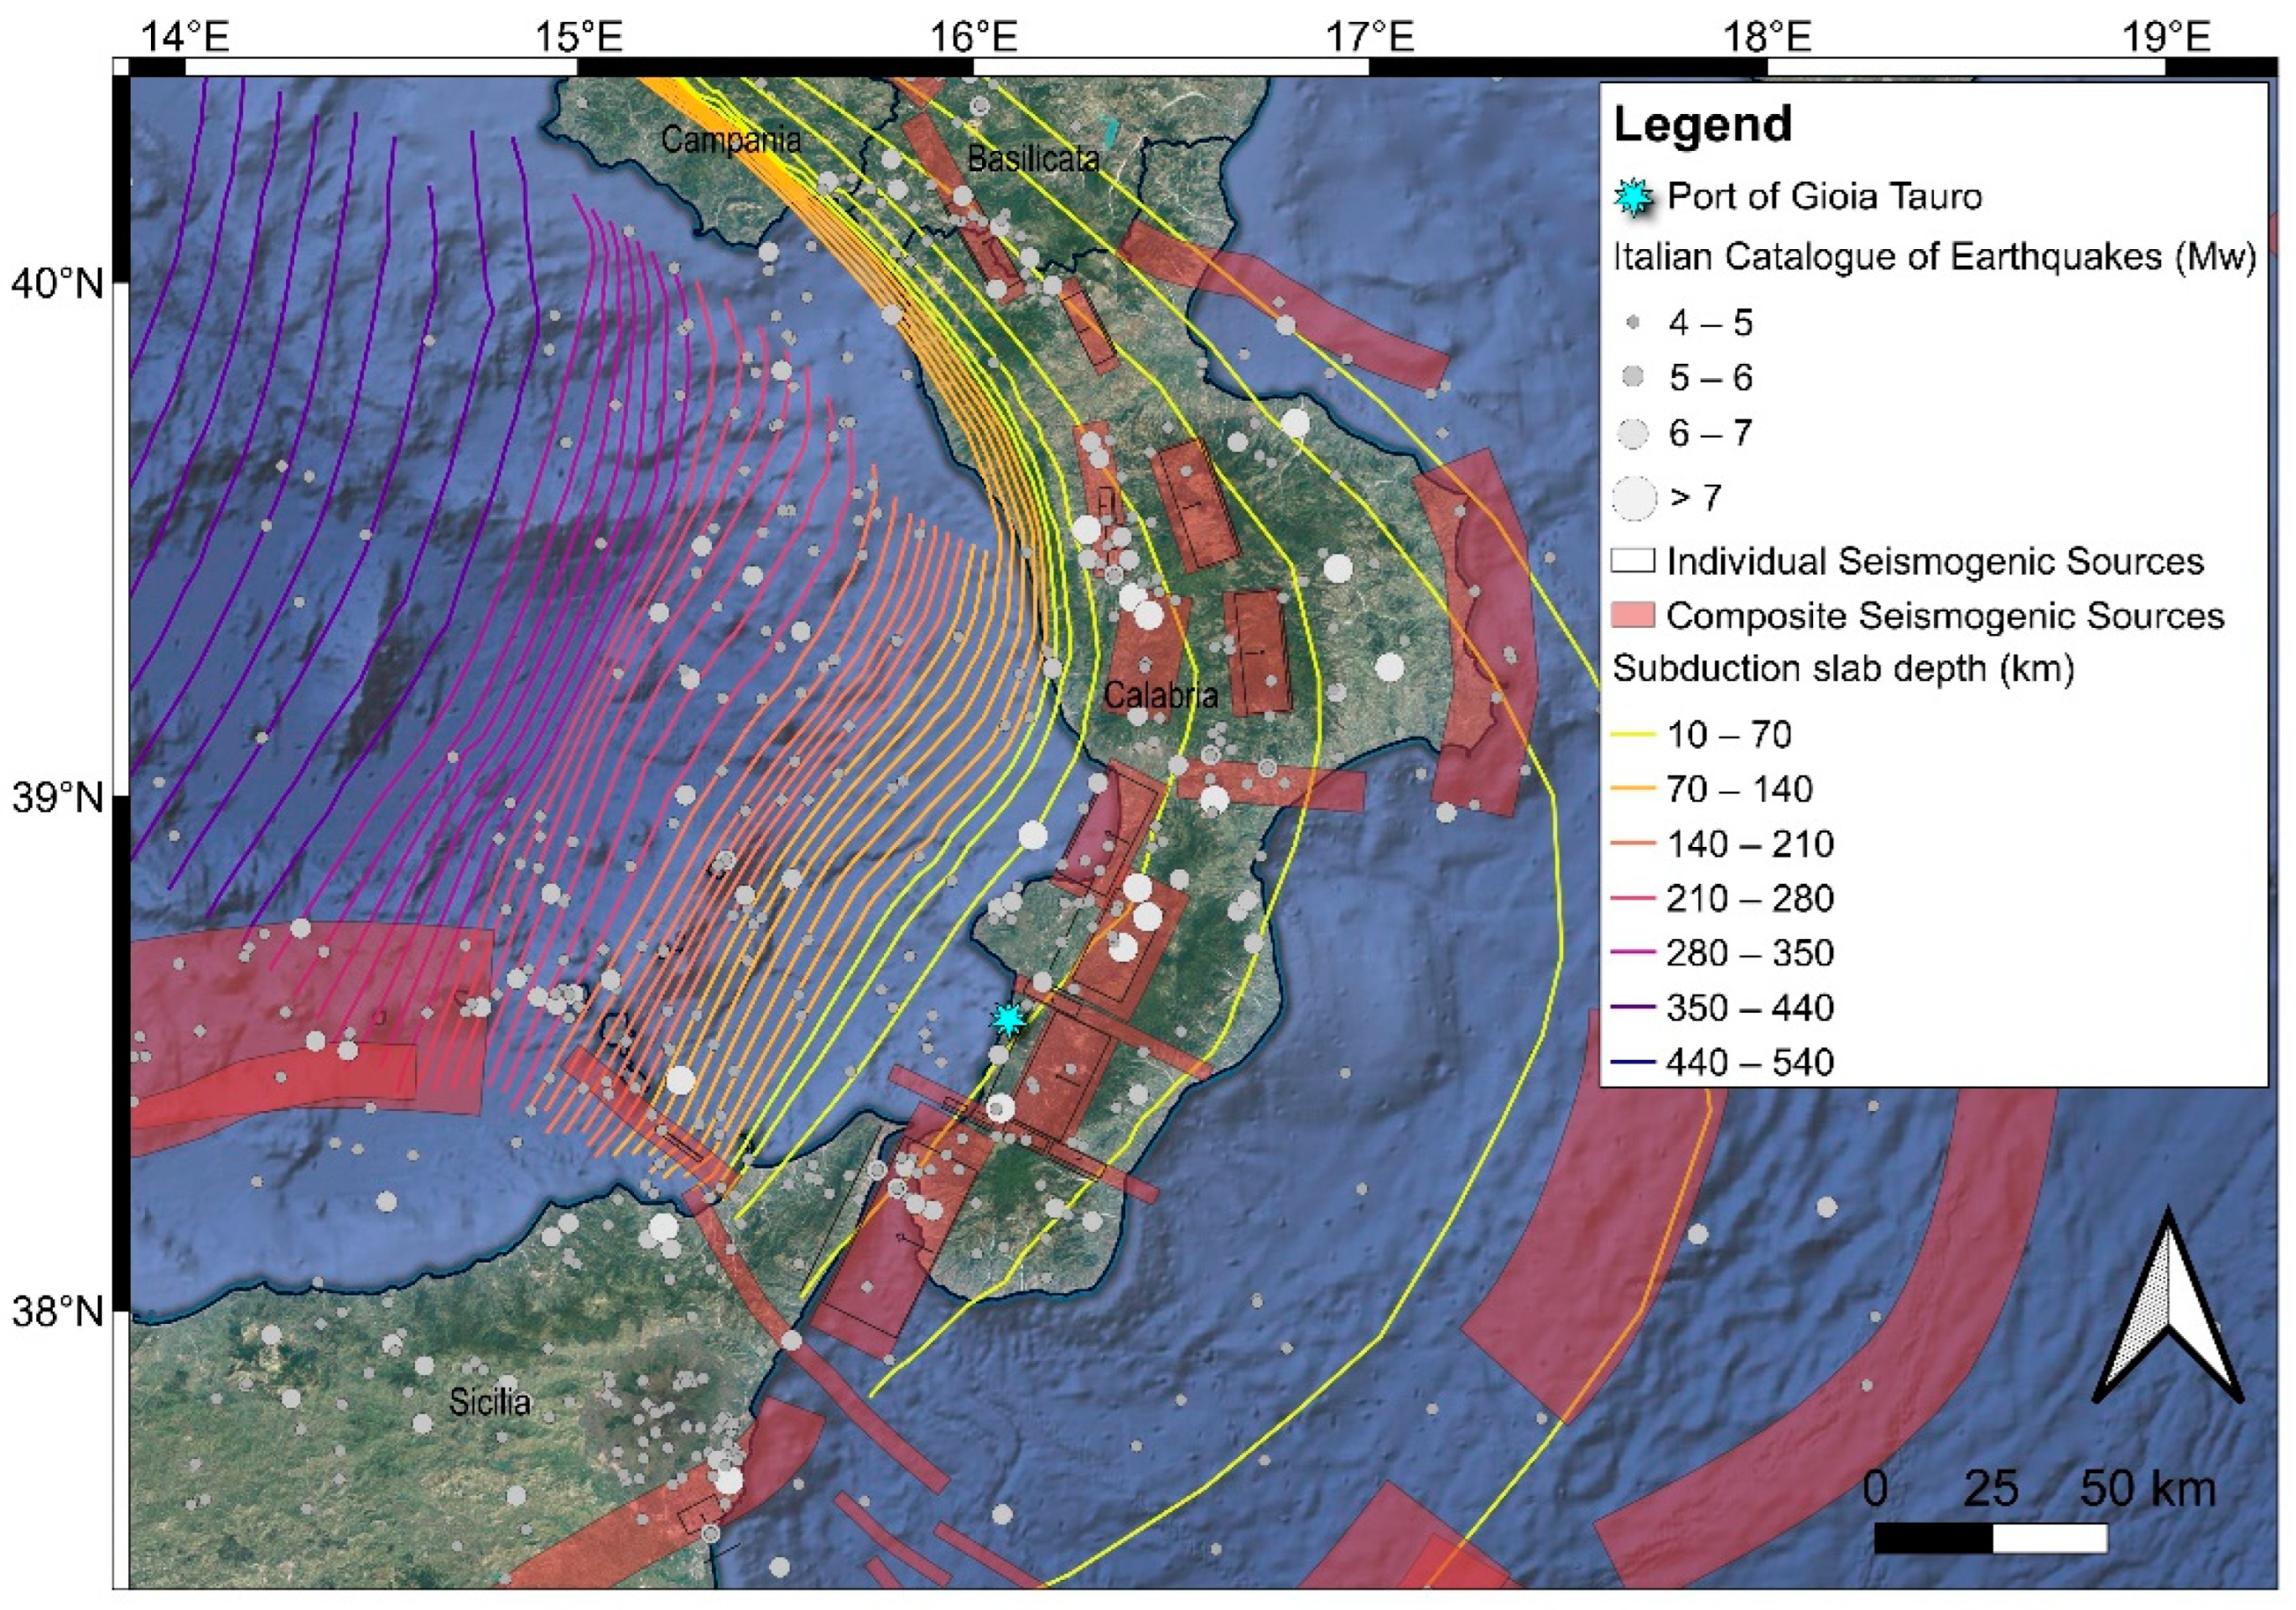
The basis for building the numerical model in this work is represented by existing infrastructure components at the port of Gioia Tauro. This maritime port is located in southern Italy along the Tyrrhenian coast, within the Calabria region, one of the regions in Italy characterized by the highest seismic hazard. The seismicity of the area under investigation is shown in
Figure 1. The figure shows the seismogenic sources around the port and the location of historical earthquakes in the region.
The seaport of Gioia Tauro is the largest terminal for container throughput in Italy. More than one-third of all national trans-shipment traffic in Italy takes place at the port of Gioia Tauro, which is classified by Italian law as a port of international economic relevance. It is also one of the most important trans-shipment hubs in the Mediterranean Sea by connecting the global and regional networks that cross the Mediterranean. The Gioia Tauro port is close to the east-west route that stretches from the Strait of Gibraltar to the Suez Canal, and it is one of the busiest maritime corridors globally.
Furthermore, the port of Gioia Tauro plays a key role for Civil Protection purposes by serving, during the rescue operations, as a priority entry point into a territory potentially affected by a strong earthquake (i.e., with a moment magnitude Mw greater than 7, as shown in
Figure 1). In this framework, it is worth mentioning that the Italian Department of Civil Protection appointed Eucentre to develop a web-based GIS (WebGIS) computational platform for Italian seaports. This interactive tool allows users to assess the seismic risk of maritime ports (Bozzoni et al., 2018) [
29]. Being a critical infrastructure for emergency management in case of a seismic event, the port of Gioia Tauro is also included in the WebGIS platform.
Figure 1.
Map of the location of Gioia Tauro Port (star in light blue), located in southern Italy within the Calabria Region, along with the seismogenic areas according to the Database of Individual Seismogenic Sources (DISS Working Group, 2021 [
30]) and the seismic events (grey circles) that have occurred in the region from the Italian catalogue of earthquakes (Rovida et al., 2022 [
31]). The size and colour of the circles representing the earthquakes are proportional to the event magnitude (Mw).
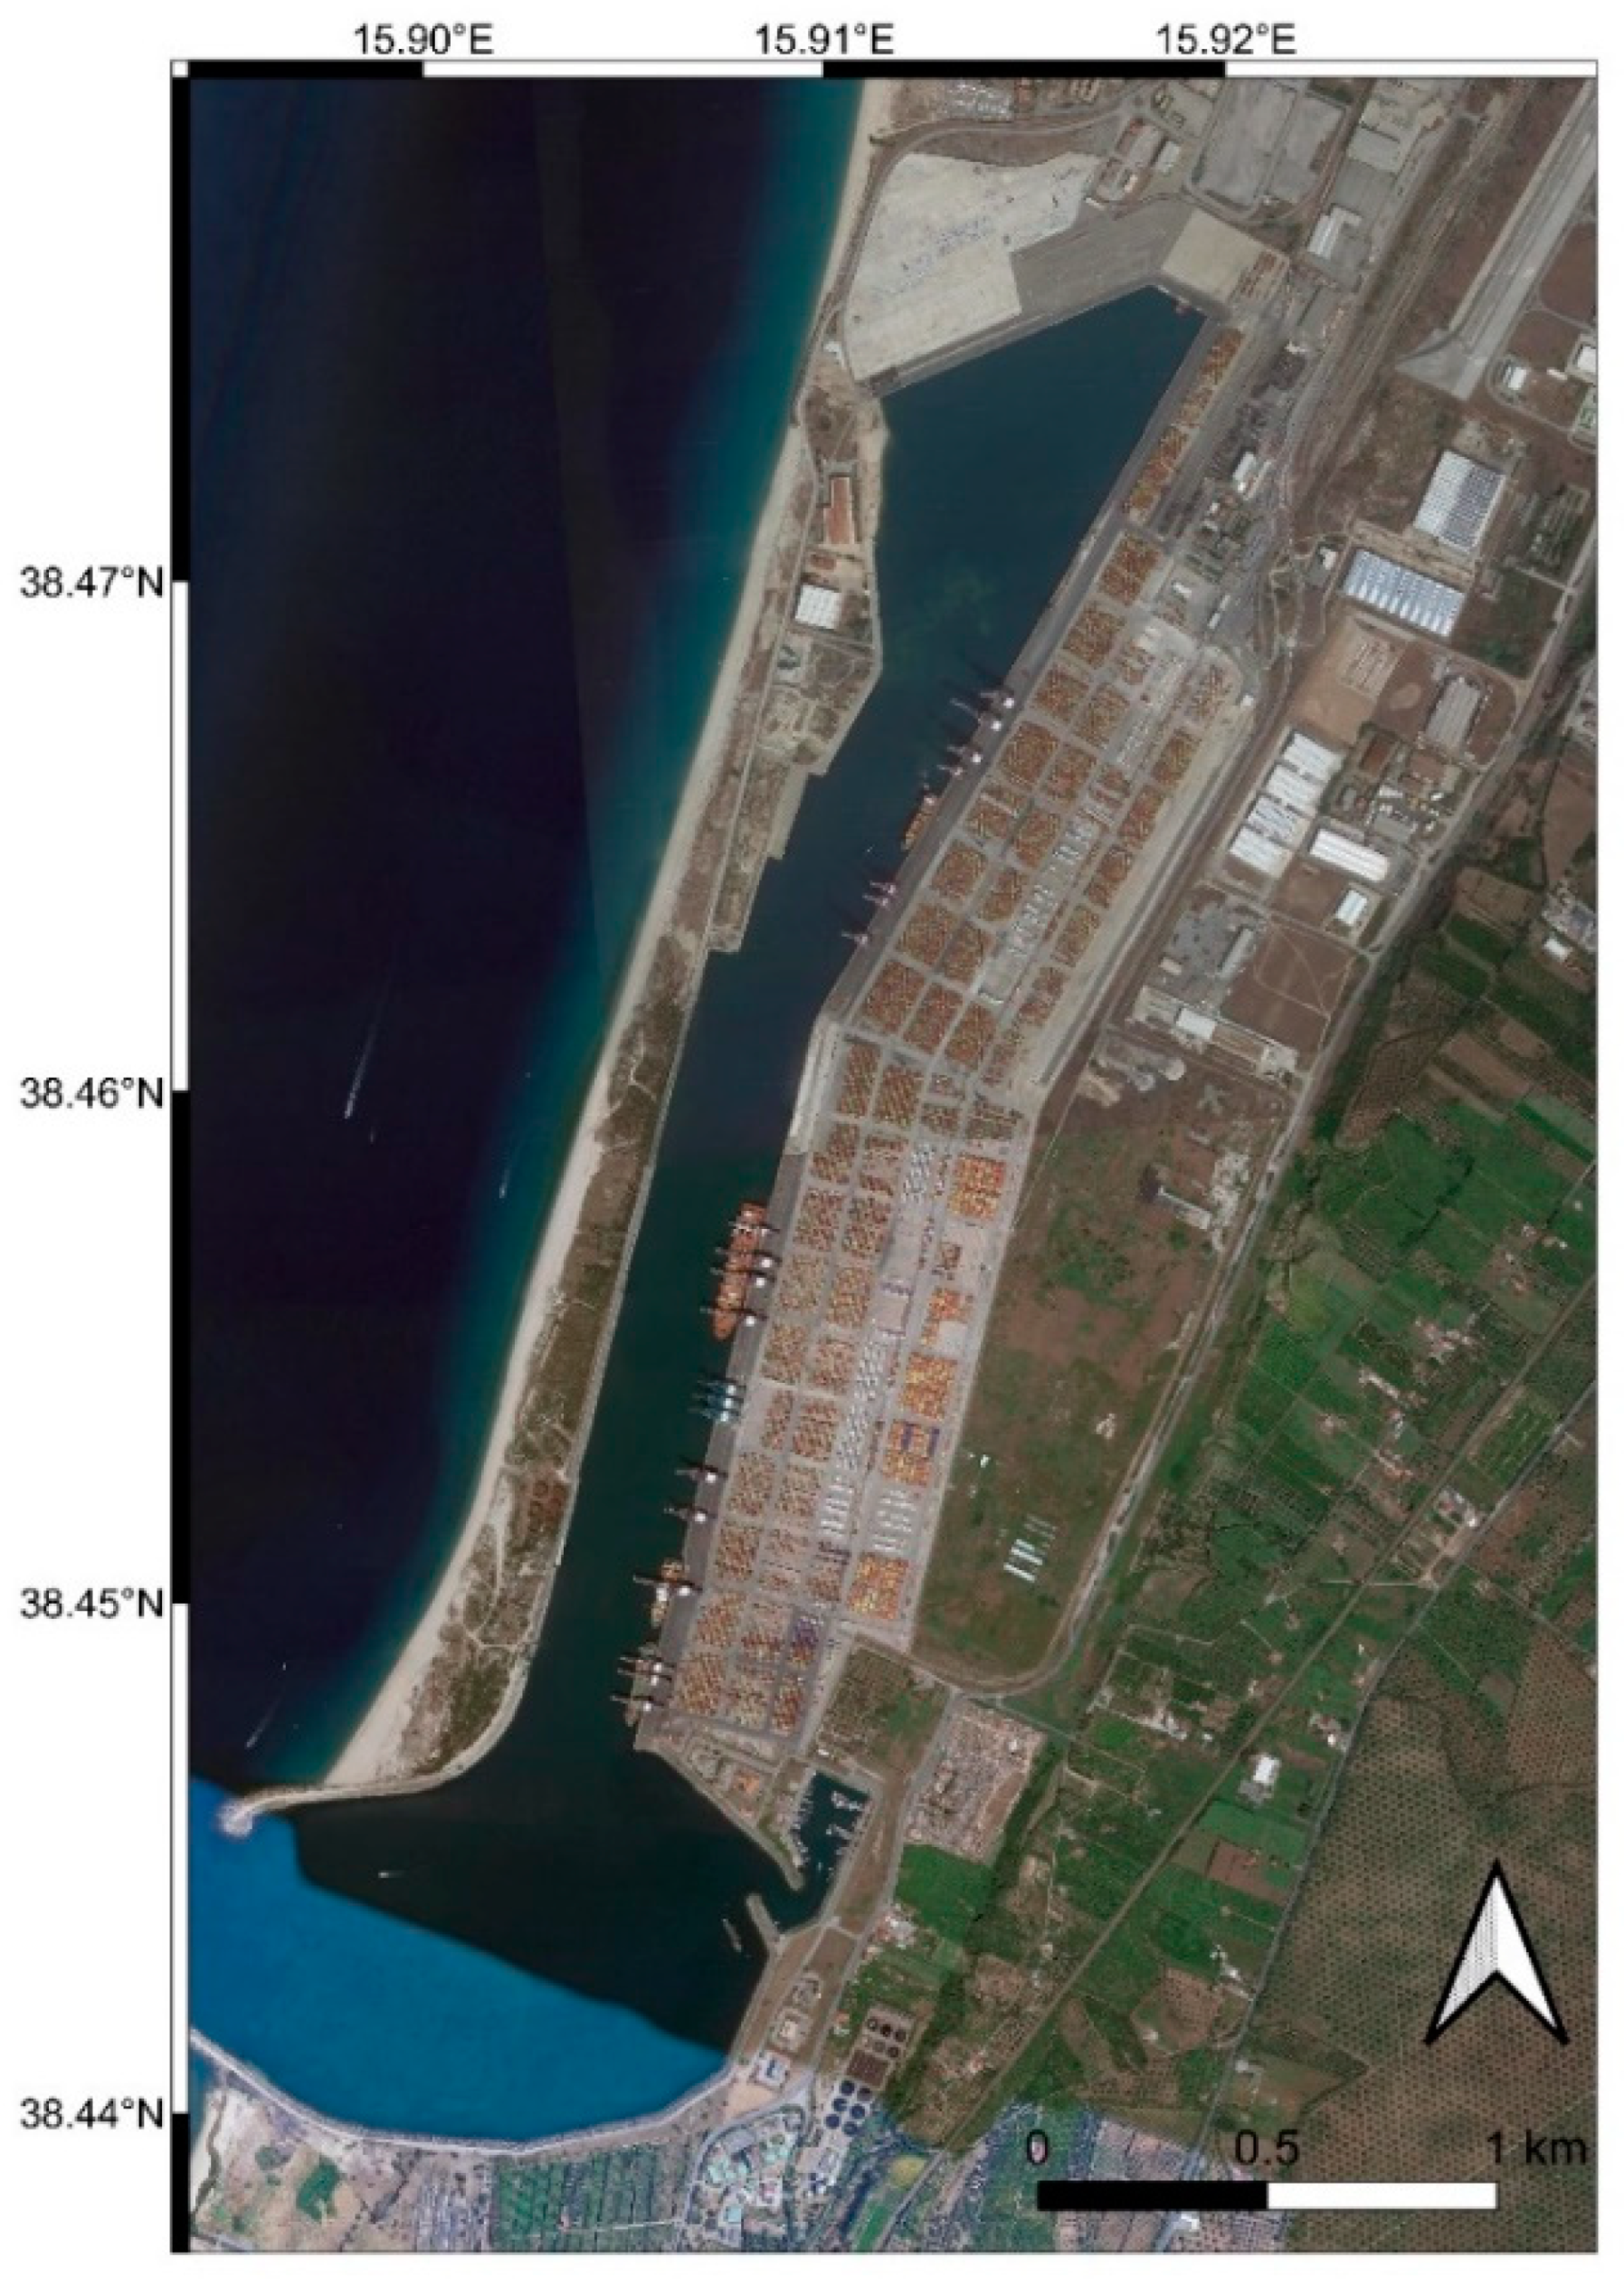
The Gioia Tauro port consists of an artificial channel, 200 m (min)–250 m (max) wide and 3 km long, running parallel to the coastline with a 300 m wide entrance and an evolution basin of 750 m in diameter. The port has eight docks with extensions of more than 5 km and is composed of interconnected structural and infrastructural elements that constitute a framework supporting the functionality of the entire multi-component system. Various facilities exist within the Gioia Tauro seaport. Different typologies of wharf structures, cargo handling and storage infrastructure, utility systems (e.g., electric power system), road and rail transportation lines, and more can be identified in
Figure 2.
The port of Gioia Tauro was selected as one of the testbeds within the 2019–2022 European Horizon 2020 project named TURNkey (Towards more Earthquake-resilient Urban Societies through a Multi-sensor-based Information System enabling Earthquake Forecasting, Early Warning, and Rapid Response actions). In the framework of the TURNkey project, a multi-sensor system was deployed within the port area of Gioia Tauro, including low-cost sensors (i.e., accelerometers and GNSS) for seismic ground motion and structural monitoring (Bozzoni et al., 2021 [
32]). Tools were developed to process the streamed data to effectively implement an Earthquake Early Warning (EEW) and Rapid Response to Earthquake (RRE) system at the port of Gioia Tauro. By leveraging the implemented algorithms concerning the multi-component nature of the port system (Conca et al., 2021 [
33]), a risk-informed Decision Support System (DSS) was delivered for mitigating earthquake impacts (Cremen et al., 2022 [
34]).
In this framework, this study aims to assess the seismic vulnerability of critical infrastructure at the port of Gioia Tauro, starting from a detailed numerical model built to represent the wharf-crane-soil system. The target waterfront structure is a pile-supported wharf characterized by large piles, typically adopted in Mediterranean countries. The geometry of the object infrastructure components within the port area of Gioia Tauro is defined based on the drawings, which the Port Authority provided. Data for the ground characterization are available in Bozzoni et al. (2014) [
24].
3. Numerical Modelling and Dynamic Analysis of the Target Infrastructure
A numerical model was built regarding the configuration of the target infrastructure located in the southern part of the port of Gioia Tauro. This section illustrates the numerical modelling of the port facilities under investigation, including a pile-supported wharf structure, a crane overlying the wharf, and the underlying soil deposits. Then, using the soil-wharf-crane interaction system, dynamic analyses are carried out using real accelerograms as seismic input. The final aim consists of computing analytical fragility functions starting from the outcomes of the numerical simulations.
3.1. Building the Numerical Model of the Wharf-Crane-Soil System
Owing to its vast open-source libraries rendering accuracy and flexibility for simulating the seismic response of structural and geotechnical systems, OpenSees (Open System for Earthquake Engineering Simulation;
https://opensees.berkeley.edu/index.php, accessed on 1 March 2021; McKenna et al., 2000 [
35]), was adopted as computational platform to build the numerical model of the object port facilities.
Lithostratigraphic layers and geotechnical properties were assigned according to the subsoil modelling carried out by Bozzoni et al., (2014) [
24], based on the results obtained from ground investigation campaigns performed within the port area. The considered profiles of shear wave velocity (Vs), unit weight, and main soil lithotypes for the port area under investigation are shown in
Figure 3. It should be noted that the unlikelihood of soil liquefaction obtained through in situ test-based soil liquefaction analysis was found for deep layers, whereas the superficial part may liquefy under strong seismic demand.
As shown in
Figure 4, the 2D numerical model, standing for an out-of-plane dimension of 6 m, considers the most strategic port facilities in the southern part of the port area, composed of a pile-supported wharf and a crane. The geometry of the model represents the drawings provided by the Port Authority. Soil elements are modelled with 6372 four-noded quadUP elements, partially associated with the well-known PressureDependentMultiYield02 (PDMY02) constitutive model developed after Yang et al., (2003) [
36] (for the geological units 1 to 3 and rock-fill), ideally permitting the consideration of the changes in the pore water pressure (PWP) distribution. The water inside the pores is modelled with a bulk modulus of 2.2 GPa, and hydrostatic pressures are assumed during static and dynamic analyses.
PDMY02 does not allow for the definition of cohesion. Because of this, small contributions in terms of shear strength resulting from the silt presence are reflected in the analytical approach by changing the internal friction angles in Unit 2 and Unit 3. The outermost yield surfaces of the PDMY02 materials are assigned as 42° for the rock-fill (shown with magenta colour in
Figure 4), 32° for Unit 1, 34° for Unit 2, and 40° for Unit 3. On the other hand, geological unit 4 and the engineering bedrock are modelled with a linear constitutive model. A small percentage of damping is taken into account using a tangent stiffness-proportional Rayleigh formulation fixed at 1% at 2.5 Hz. It is noted that the mass proportional portion of the formulation is not activated in order not to over-damp the system during the plastic deformations of the slope itself.
The port section consists of four rows of large diameter (D = 1.5 m) reinforced concrete circular piles with spacing (S) of 6 m. Having a longitudinal steel ratio of 2%, piles do not include any prestressing strands, and have lengths, from sea-side to land-side, of 40, 30, 30, and 25 m, respectively. The 30-m-long deck is supported by precast beams and a concrete slab of 0.65 m thickness. Mass of the deck and surcharge corresponding to S = 6 m (md = 612 t) is distributed in terms of lumped masses on the deck-pile cap interaction nodes. The combination of a uniform-geometry rock-fill layer consisting of massive rocks with a thickness of about 1.8 m, bedded by a 0.9 m thick tout-venant gravel layer, provides drainage and protection to the slope of about 33.5°. A backfill layer is added into the excavated zone to insert the tie rod.
A super post-Panamax container gantry crane is also typical infrastructure for cargo handling overlaying the wharf. This crane has a height of about 80 m and a support width of 30.5 m, lying directly on the deck with rails installed on the land-side (e.g., P1) and seaside (e.g., P4) piles. The crane covers an out-of-plane dimension of about 30 m, of which a 6-m portion is used by scaling the mass and stiffness quantities properly.
Structural elements of the wharf are modelled with linear (for deck and pile-cap beams) and non-linear (for piles) formulations. The non-linear formulation of the pile elements consists of forced-based (above ground level) and displacement-based (below ground level) fibre elements. The latter group contains about 20 smaller segments with three integration sections per pile, while the former constitutes a single element with five to ten integration sections. Constitutive models for the reinforced concrete section consist of 1D uni-axial non-linear models for concrete (Concrete01, Kent-Park-Scott) and steel (Steel02, Menegotto-Pinto) fibres. The concrete compressive strength has been taken as 30 MPa to account for the potential deterioration of the concrete resulting from prolonged exposure to an aggressive environment. Steel yield strength is assigned as 420 MPa. Since detailed data are not available on the cross-section properties of the crane (and its mass), an idealized model was built by accessing the abundance of information (e.g., Kosbab, 2010 [
27]; Tran et al., 2019 [
28]) through the use of linear beam-column elements. The fundamental period of the sway mode of the crane is considered 1.5 s due to its close similarity with the well-known Californian (Kosbab, 2010 [
27]) and Korean (Tran et al., 2019 [
28]) jumbo cranes. The upper story of a two-story structure is defined with rigid columns restricting the relative deformation between the top and bottom levels (i.e., this idealization reflects the presence of the additional diagonal members). The crane-wharf connection is pinned for both legs, shown sufficiently reliable in Kosbab (2010) [
27]. The uplift condition is evaluated as reaching zero compressive force in the sea-side leg. The mass of the deck is lumped at the top of beam caps. The mass of the crane is asymmetrically set up with 60% on the land side and 40% on the seaside.
The interactions between soil and pile elements are modelled with t-z and Q-z element formulations (TzSimple1, and QzSimple1) for circumferential, tangential, and pile tip directions (Boulanger et al., 1999 [
37]). The soil and pile elements are connected with rigid elastic elements for the horizontal direction.
Two bulky free-field columns with a thickness of 10,000 m are added to ensure the 1D propagation at the lateral sides. These columns are directly tied to the main mesh (i.e., equalDOF in the horizontal direction). Seismic motion is applied from the bottom horizontal boundary as force-time history calculated from the rock outcrop velocity time histories. At the bottom boundary, Lysmer-Kuhlemeyer type of viscous dashpots are defined to absorb the reflected wavefront in the horizontal direction, and classical normal-direction fixities are present in the vertical direction.
3.2. Time-History Analysis
Numerical simulations were carried out using a set of nine real accelerograms as seismic input with two horizontal components recorded at outcropping rock conditions. The reference input motions were purposely selected from the ITalian ACcelerometric Archive, ITACA (
https://itaca.mi.ingv.it/ItacaNet_32/#/home, accessed on 1 March 2021; Russo et al., 2022 [
38]), a web application including more than 54,900 three-component accelerometric waveforms generated by about 2270 earthquakes with magnitude greater than 3.0 in the time frame 1972–2021, including more than 35,000 waveforms of good quality manually processed by specialists.
Numerical simulations were carried out by using a set of single horizontal-component signals through their direct use and as well as with moderate linear scaling (i.e., up to 300%). By reversing the polarity of the signals of both components, a complete set consisting of 108 combinations (e.g., nine motions × two components × two polarities (positive & negative signs) × three sets) was analysed.
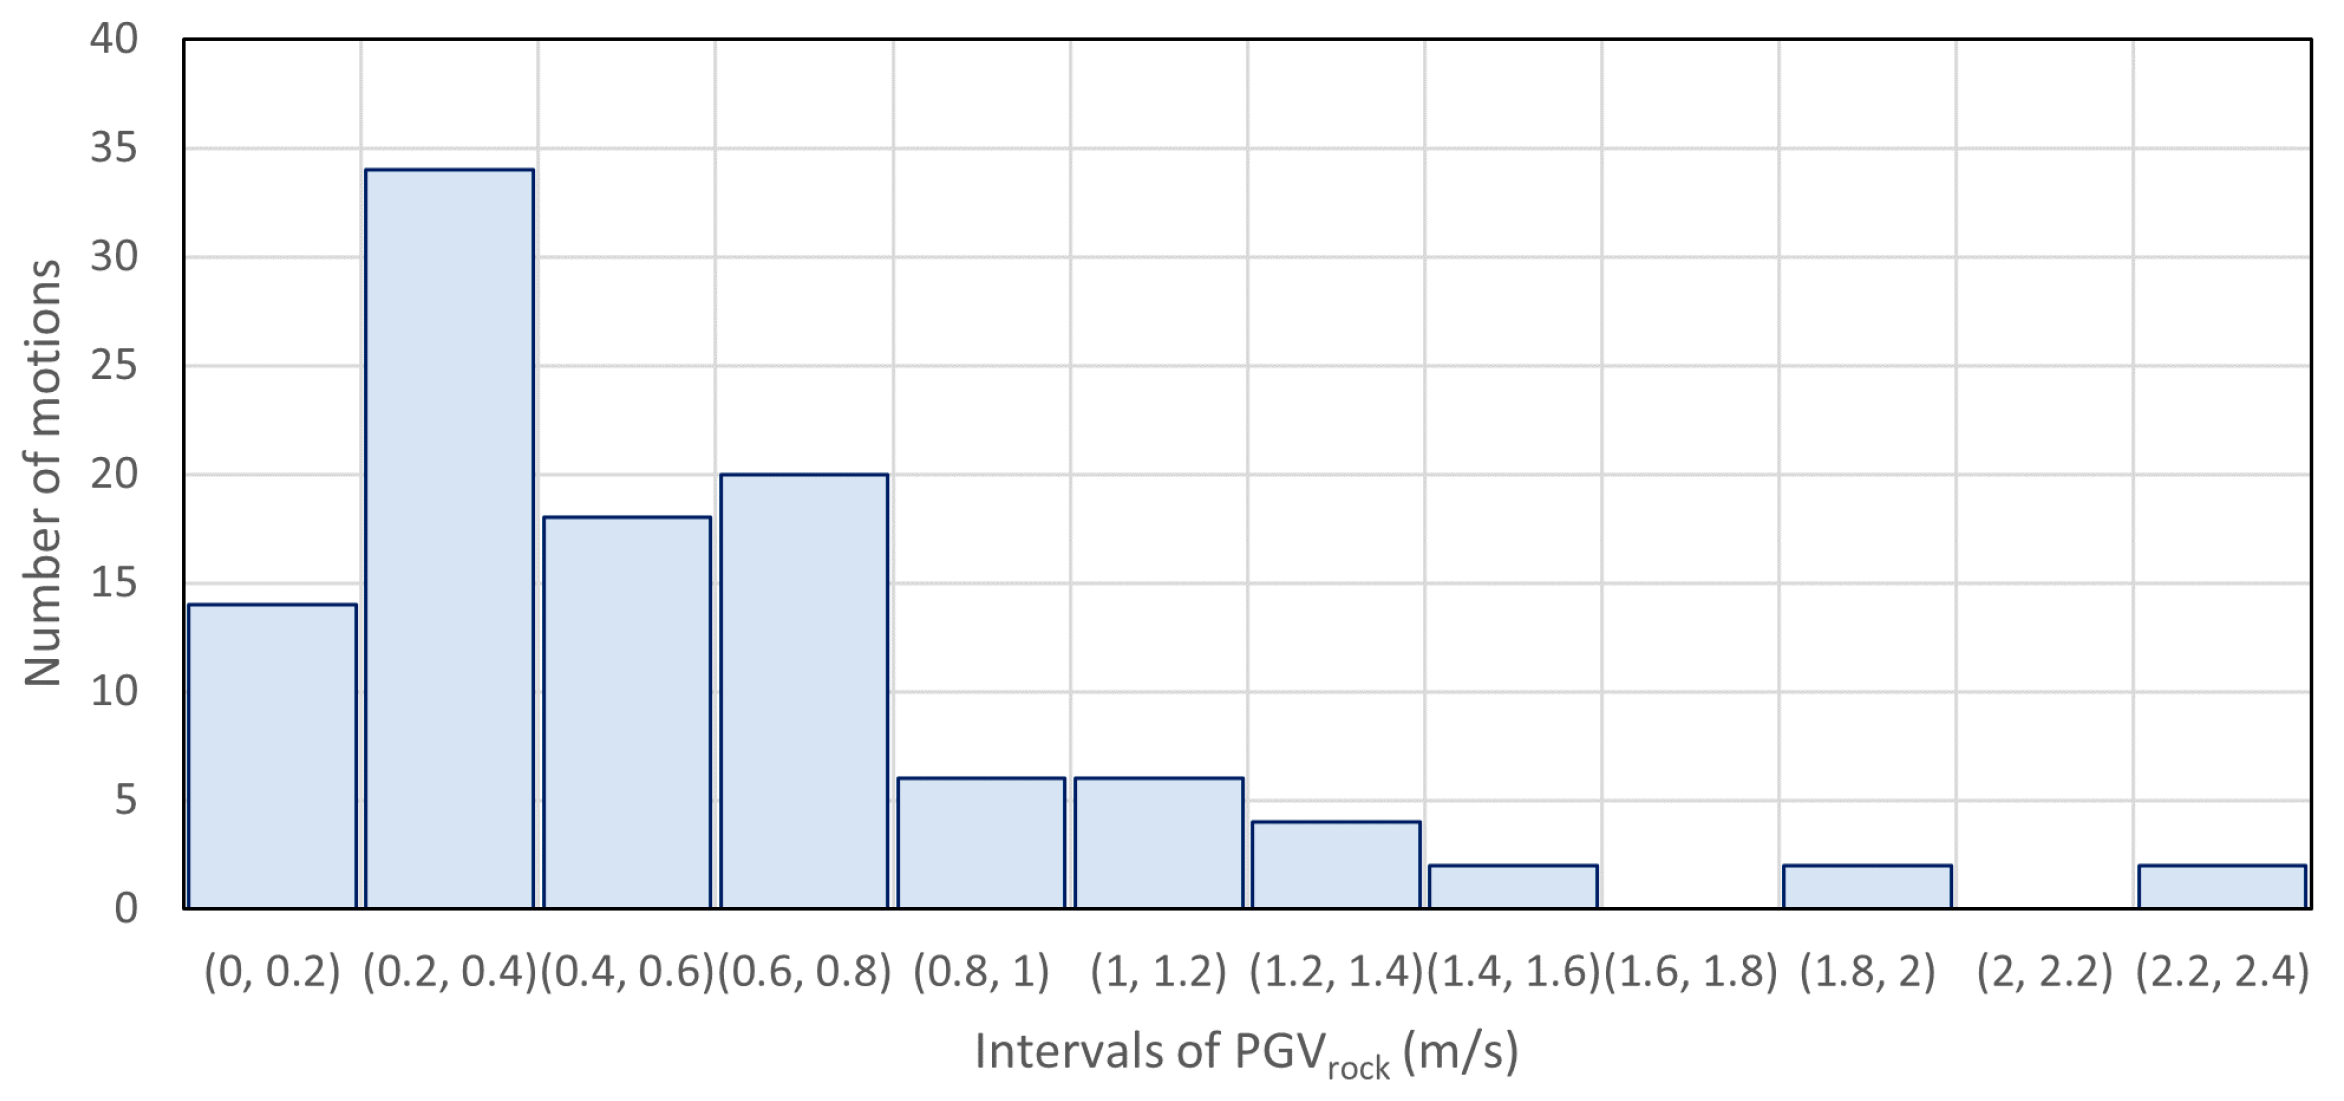
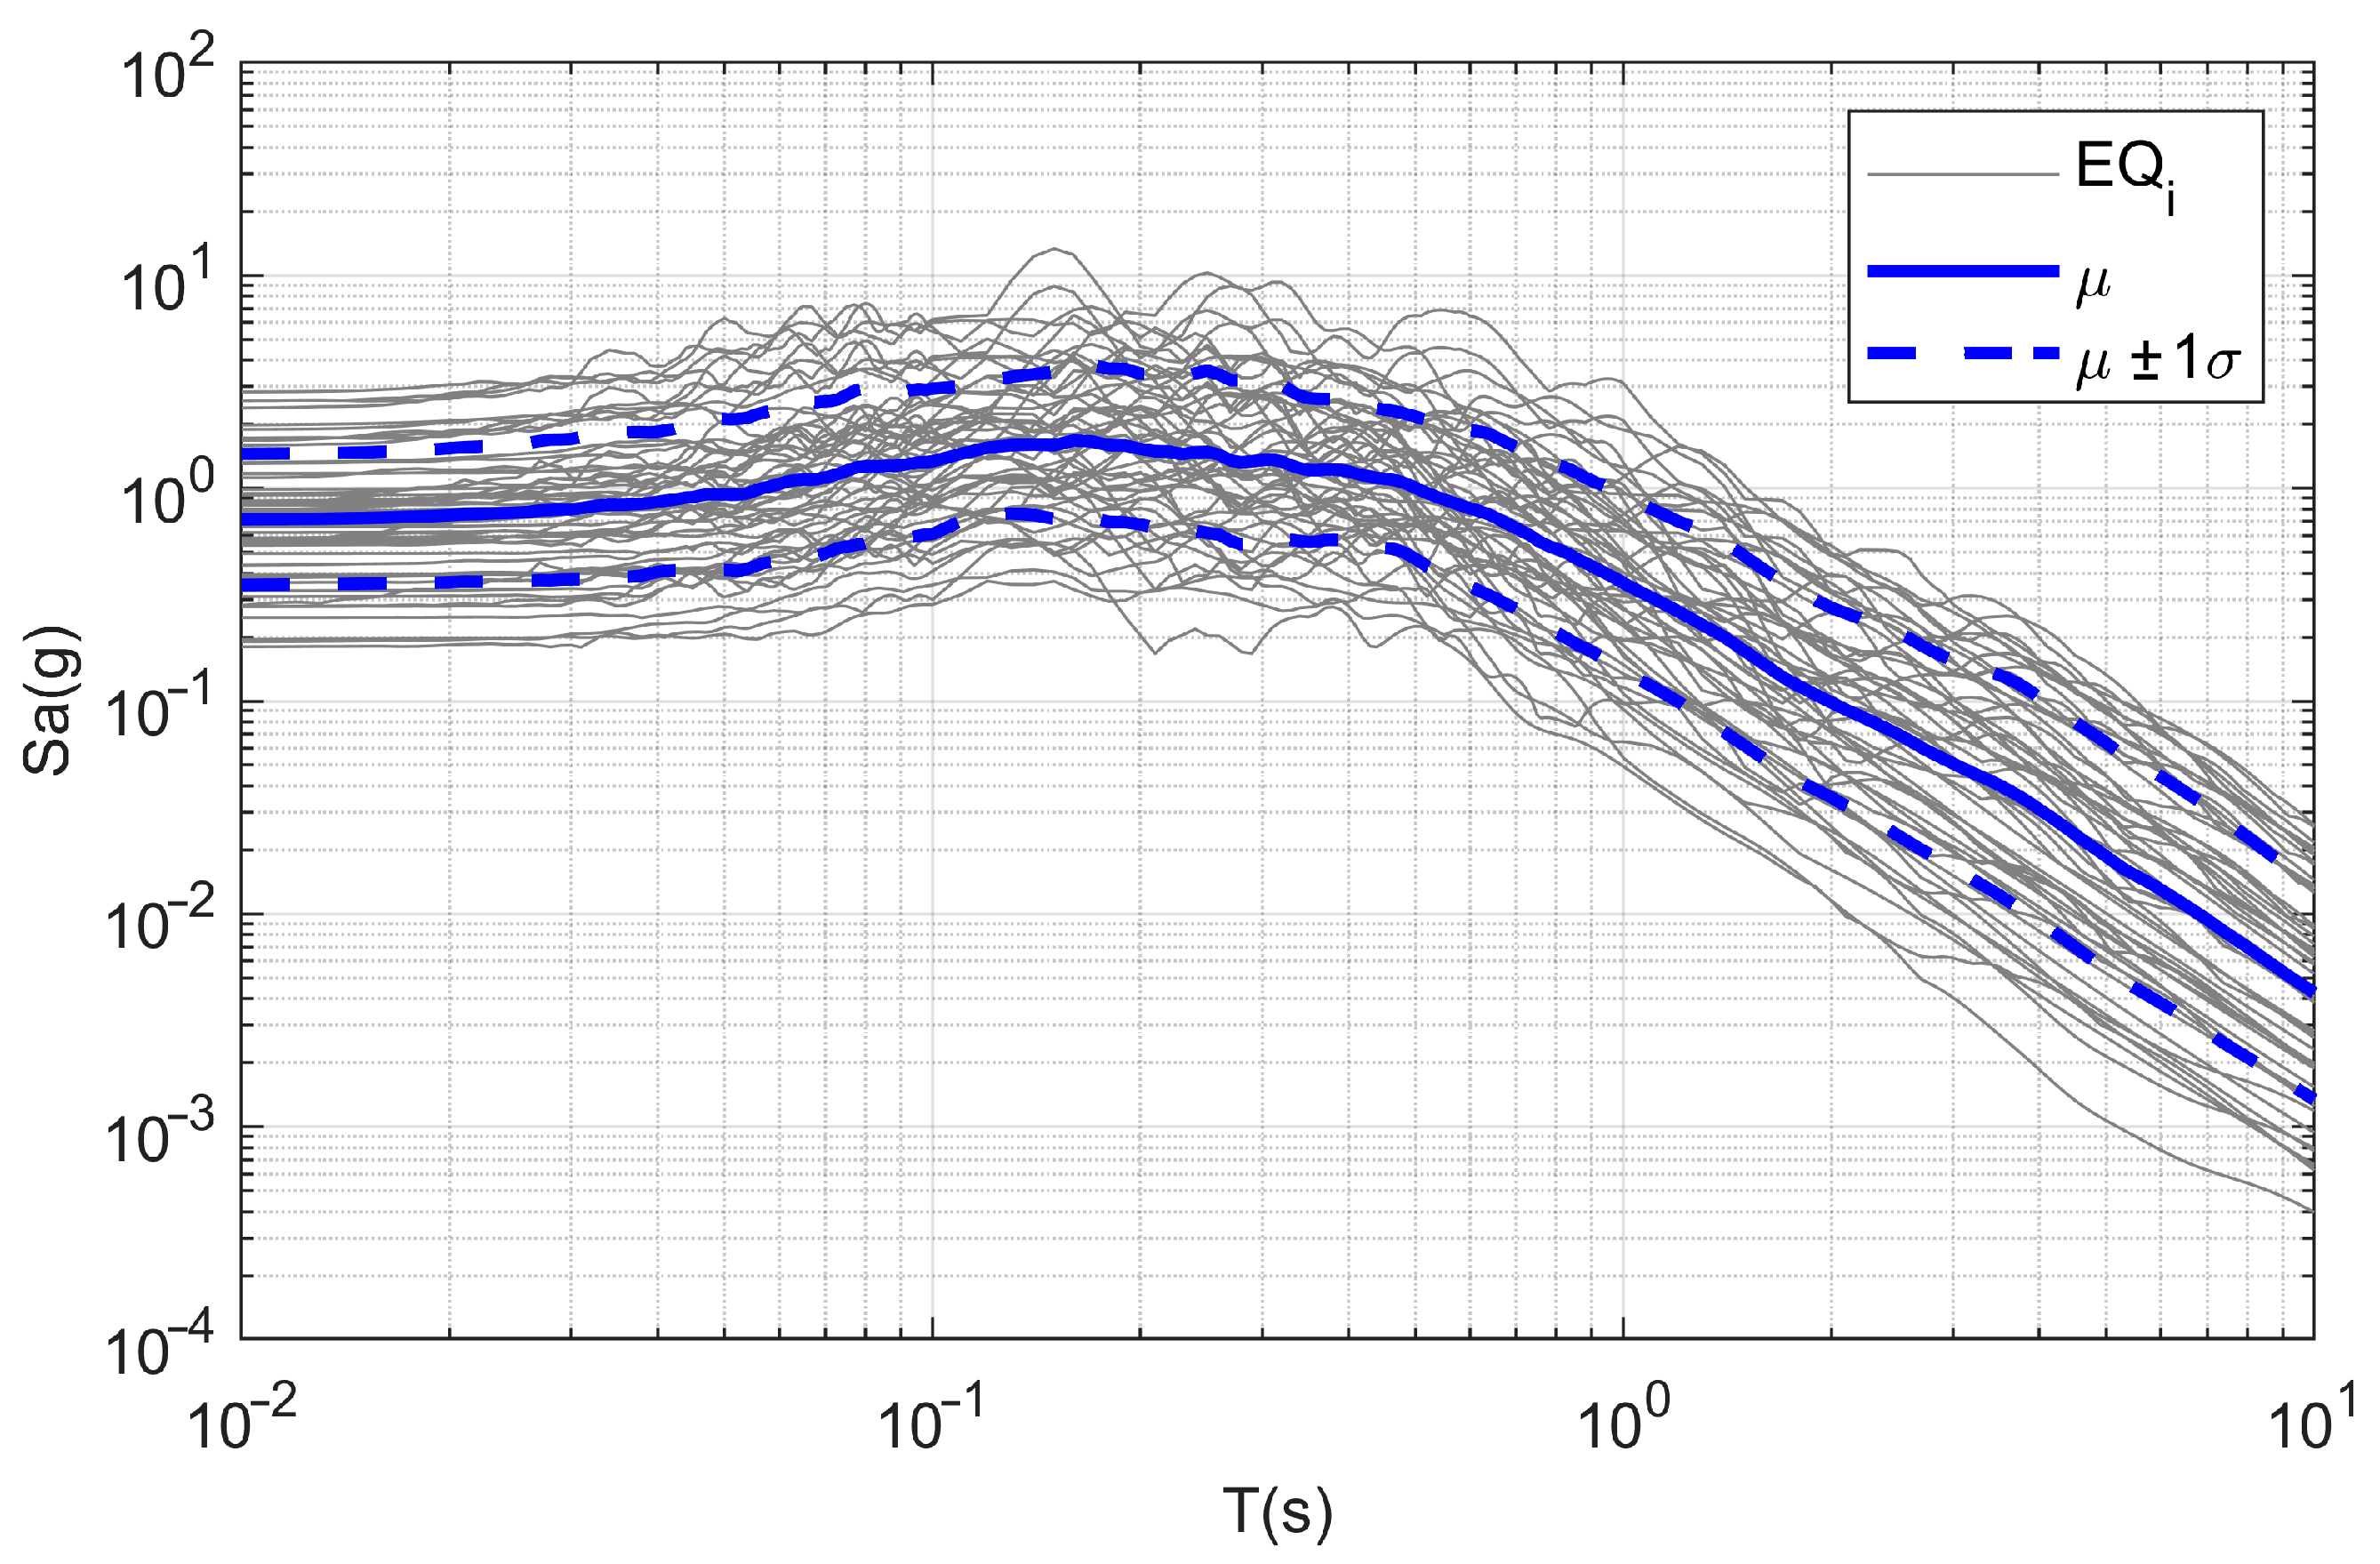
Figure 5 illustrates the PGV (Peak Ground Velocity) histogram, and
Figure 6 presents the 5%-damped elastic pseudo-acceleration response spectra of the seismic input adopted in the time-history analysis.
Damage limit states for wharves were assigned using the information provided in well-established international documents, standards, and guidelines (i.e., PIANC, 2001 [
39]; ASCE, 2014 [
40]), especially for the sections in which a visual post-earthquake survey is possible. Based on the recommendations of PIANC on adapting more stringent criteria for the embedded zones of the piles, steel strains are lowered to 25% of their original values (for Limit State 2, LS2, and LS3) to take into account possible crack opening within a zone subjected to an aggressive environment. For LS1, a 0.005 steel strain is chosen to represent crack opening and water penetration initiation. Defined limit states correspond to elastic (minor damage-LS1), limited damage (moderate damage-LS2), and life safety (extensive damage-LS3) which should be satisfied for hazard levels with 50, 10, and 2% exceedance in 50 years; respectively. It is noted that the information on the crane configuration is limited due to privacy concerns, hence a nonlinear model was not possible to implement to represent the response of the crane elements. Due to this, two limit states were considered as LS1 dictated by uplifting standing for minor damage, and LS2/LS3 dictated by a representative 2% portal drift representing intermediate to extensive damage (e.g., Kosbab, 2010 [
27]; Tran et al., 2019 [
28]). Although the distinction between LS2 and LS3 was not achieved in the corresponding fragility curves, the output product is still useful in the immediate aftermath of crane operability, as both LS2 and LS3 define the crane as out-of-use. The damage limit states adopted for the target port infrastructure components are summarised in
Table 2.
A representative example set of results obtained from numerical simulations is shown in
Figure 7 in terms of damage curvature distributions along with the pile length, superposed by the actual damage state and the slope deformation below the wharf. The piles P1 and P3 show the highest demands. It should be noted that the deformation demands of the soil elements are more significant on the crest than on the toe side. Due to this, the classical short pile effect expected for P1 is significantly reduced. The damage on the P3 is concentrated at the interface when the piles pass through the stiffer and stronger layer. Finally, owing to the presence of large diameter piles, it should be underlined that the structural configuration allows large displacements of the deck. It is noted that Werner and Cook (2010) [
41] recommended maximum deck displacements of 0.3 (LS1), 2.5 (LS2), and 15.2 cm (LS3), based on the expert opinion made on cranes in which the land-side leg lies outside of the wharf itself. The structural configuration of the Gioia Tauro port represents good practice by having a large enough space to contain both of the crane rails on its deck; hence it is not affected by this criterion which becomes the most stringent. Furthermore, it is observed that the more extended embedment depth provided in P4 (seaside pile) provides enhanced stability of the entire system and crane weight on P1 (land-side pile), helping to reduce the tension softening problems noted previously by Su et al., (2017) [
11].
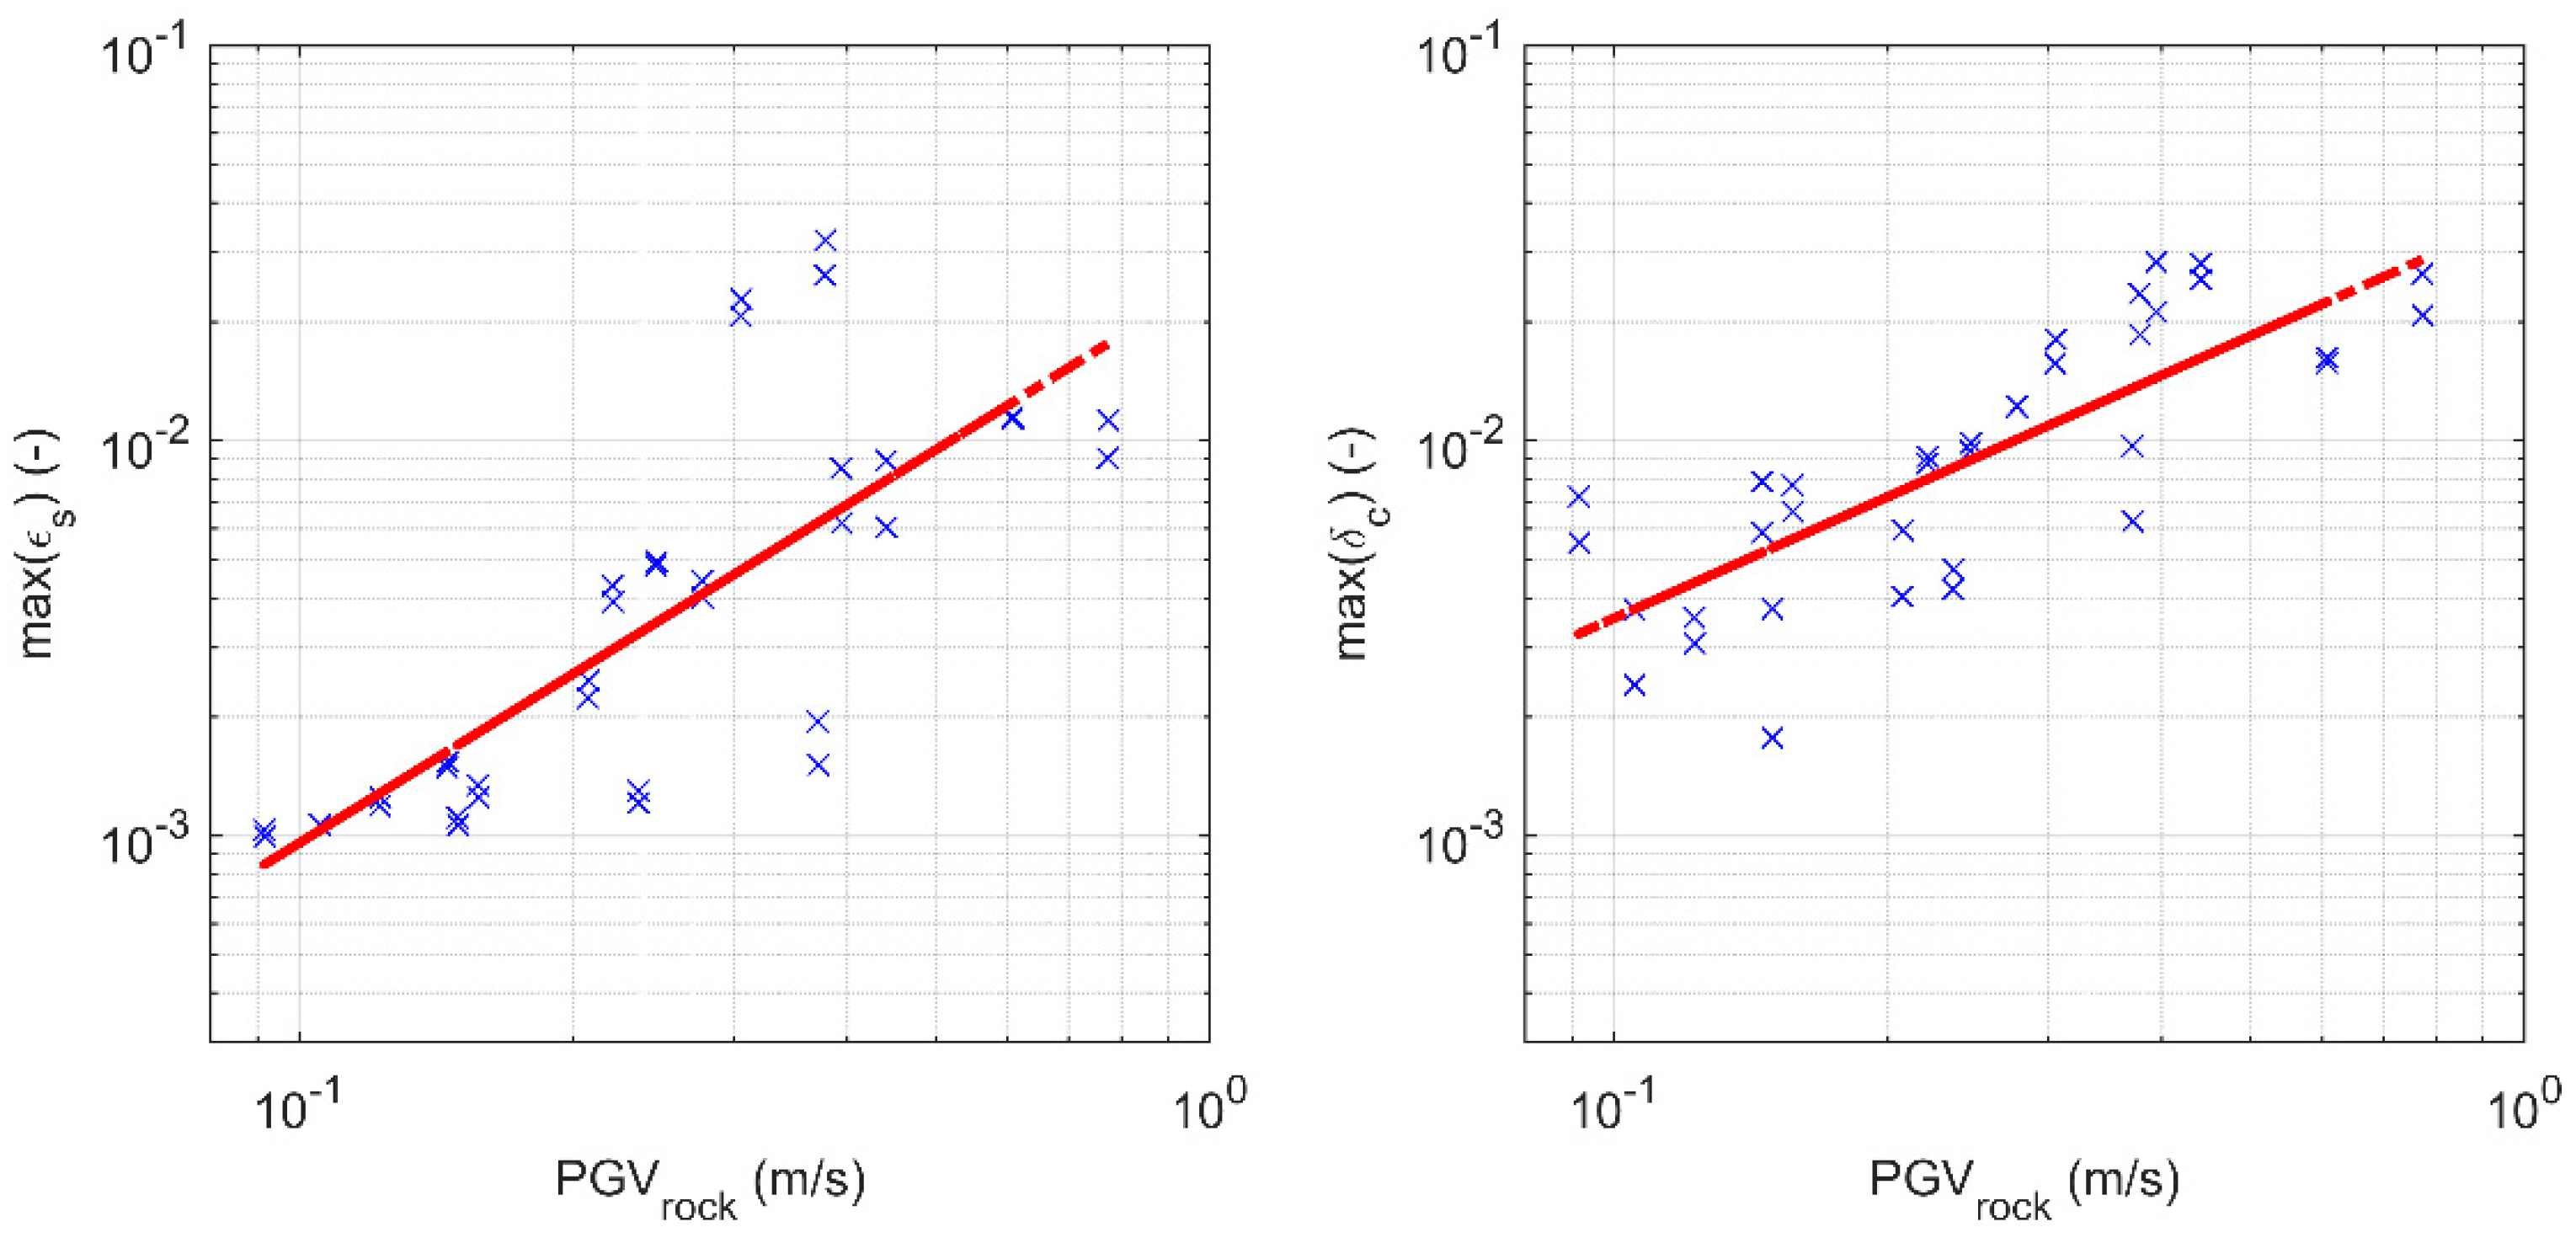
In this work, the suitability condition of the input intensity measure (IM) was not studied. Instead, it is assigned as PGV based on the available information in the literature, by giving particular importance to [
25] in which a port structure similar to Gioia Tauro was subjected to efficiency, sufficiency, and proficiency analyses with an outcome of PGV as the optimal intensity measure. Moreover, PGV also satisfies the condition of availability of worldwide hazard maps or abundance of implementations in the Ground Motion Model (GMMs). As shown in
Figure 8, peak ground velocity corresponding to the rock outcrop conditions (PGV
rock) shows satisfactory agreement with engineering demand parameters chosen in the current study, which could be interpreted as a linearly increasing demand parameter with the intensity measure and sufficiently equally spaced pairs of damage-intensity measure pairs (e.g., see a similar discussion in Manfredi et al. [
42]).
4. Development of Analytical Fragility Curves
Fragility curves represent a ready-to- use tool that can be utilized for fast assessment of the seismic vulnerability of the object infrastructure in risk assessment and loss estimation. They become very useful during management of, and preparedness for, seismic risk mitigation. These curves describe the probability of exceeding different limit states given a level of ground shaking. In this study, starting from the outcomes of dynamic analysis (
Section 3), fragility curves were generated concerning strategic port facilities, i.e., the wharf-crane-soil system.
Fragility curves are usually described by a lognormal probability distribution function, as stated in Equation (2).
Here, P is the probability of exceeding a particular damage state (ds) for a given seismic intensity level defined by the earthquake intensity measure, Φ is the standard cumulative probability function, is the median threshold value of IM required to cause the ith damage state, and βtot is the total lognormal standard deviation.
Analytical fragility curves were derived from the outcomes of the numerical results for port components. The level of the port infrastructure damage was described by a damage index expressing the exceedance of certain limit states, and the fragility curves were estimated based on the evolution of the damage index with increasing earthquake intensity.
The lognormal standard deviation (
βtot) that describes the total variability associated with each fragility curve was estimated. Three primary sources of uncertainty are typically considered (HAZUS; NIBS, 2004 [
18]), namely (i) the definition of damage states (
βds), (ii) the response and resistance (capacity) of the element (
βC), and (iii) the earthquake input motion, i.e., demand (
βD). The total uncertainty is estimated as the root of the sum of the squares of the component dispersions. In the literature (e.g., HAZUS NIBS, 2004 [
18]), constants 0.4 and 0.3 are assigned to
βds and
βC, respectively. The variability in the structural response due to the variability of ground motion can describe
βD.
The first step in this study was to randomize the limit states shown in
Table 2 by adopting a uniform distribution between 80–120% of each limit state using 100 Monte Carlo simulations. In this manner, variability in the damage states was directly considered (
βds = 0). Although varying the limit state thresholds also emphasizes the resistance (capacity) of the elements, the system’s response inevitably comes from a single computational configuration. Due to this,
βC is reduced to 0.2 instead of 0.3. It was considered that the selected suit of input motions would cover a sufficient variability in the input frequency content compatible with the tectonic context of the studied region.
Last but not least, it should be highlighted that in this study a new approach was followed in the determination of the fragility curves. In detail, instead of scaling the input motions to a certain set of intensity values, the output damage probabilities were averaged consecutively every five PGVrock values by following a moving average approach. Benefiting from the abundance of ground motions which are relatively homogeneously distributed in the PGV domain, such simplification yields coefficient of variations of about 45% for each PGVrock point of interest for the peak ground velocities under 1.3 m/s, which is considered acceptable. On the other hand, by not scaling the original signals (hence the first 36 motions of the total of 108), it is ensured that the input energy contents are not artificially altered for the low PGV zone, where more frequent events are expected. Finally, by inserting the averaged damage probability parameters into a grid searching algorithm, the best fitting values of βd (hence ) and of Equation (2) are determined.
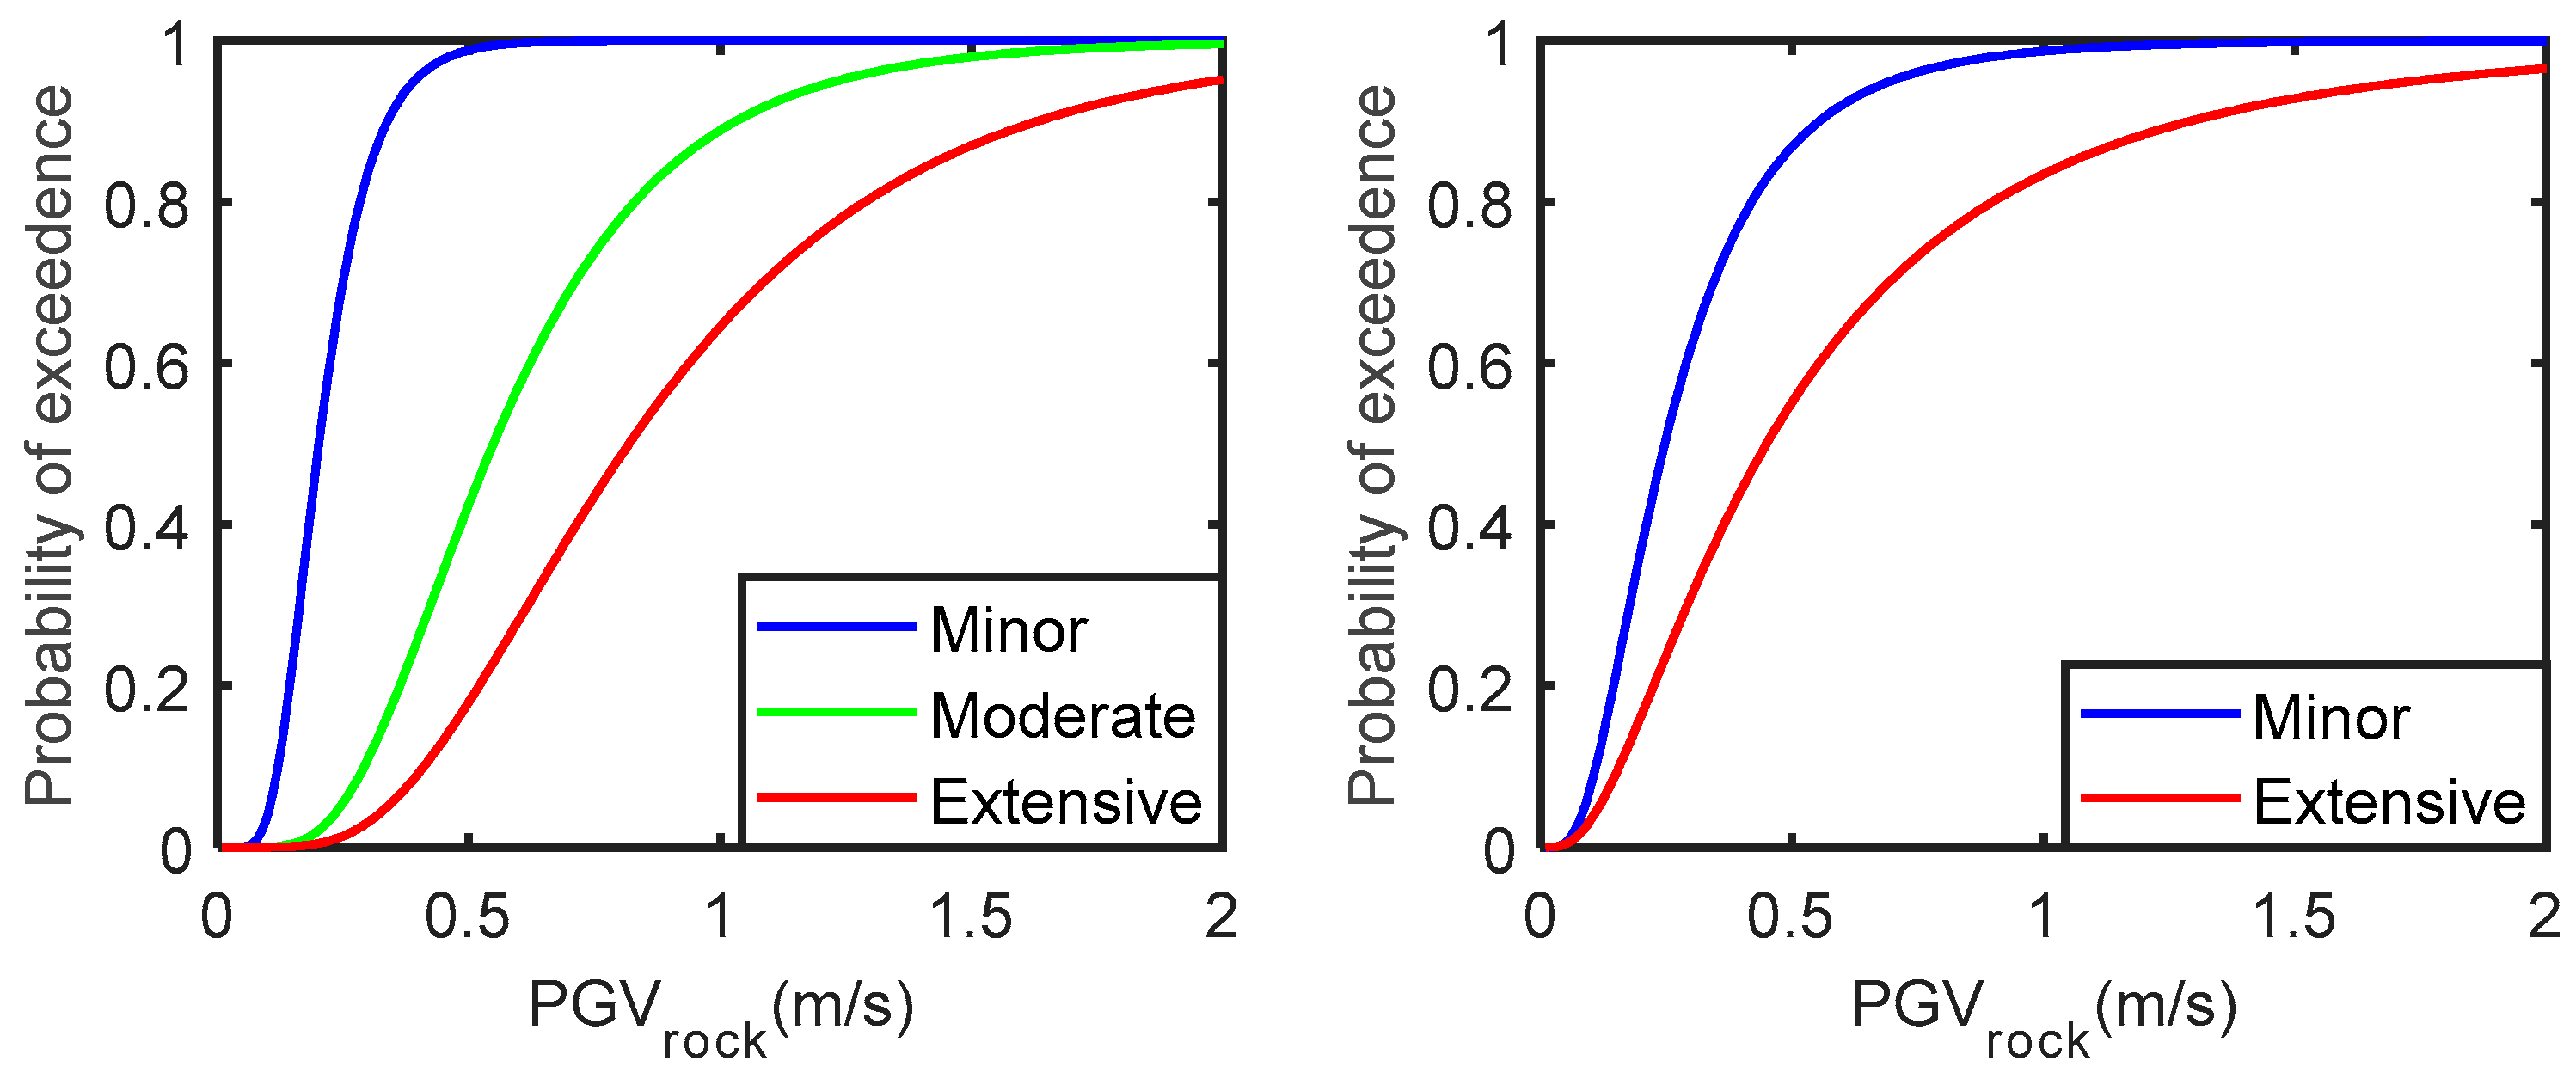
Figure 9 shows the analytical fragility curves obtained for the pile-supported wharf (left) and the overlying crane (right) linked to
PGVrock.
Table 3 presents the lognormal parameters of the fragility curves generated for the target port infrastructure components, where the parameters are defined in Equation (2).
5. Comparison of Damage with Models Available in the Literature
In this section, damage percentages obtained by applying the fragility curves proposed in this study and various models available in the literature are compared concerning a scenario earthquake with Mw = 6.5 and Joyner-Boore distance R
JB = 5 km. The scenario earthquake is compatible with disaggregation of seismic hazard in terms of PGA
rock corresponding to a 2% probability of exceedance in 50 years, according to the MPS04 model developed by INGV for Italy (
http://esse1.mi.ingv.it/ accessed on 1 June 2022). As observed from the hazard map of the region shown in
Figure 10, PGA
rock values reach about 0.55 g around Gioia Tauro. Using the most updated GMM for Italy (e.g., Lanzano et al., 2019 [
43]), this value was obtained when considering the prediction of
µ + 1.15
σ. Using the same percentile and GMM, the corresponding PGV
rock becomes about 35 cm/s.
From the MPS04 hazard model, short-period spectral acceleration (T = 0.2 s) and long-period spectral acceleration (T = 1 s) values correspond to the probability of exceedance of 2% in 50 years were extracted as 1.375 g (S
α, 2475) and 0.55 g (S
β, 2475). The methodology of the recent Eurocode 8 draft (e.g., Labbe, 2018 [
44]; Paolucci et al., 2021 [
45]) was adopted to find the soil amplification factors. Based on the soil profile shown in
Figure 3, soil depth until V
s = 800 m/s (H
800) is 80 m, and the corresponding equivalent shear wave velocity speed (V
s,H) was about 300 m/s. Based on this combination of H
800 and V
s,H, the site category was assigned as Site C. By using the corresponding equations, short and long-period amplification factors (F
α and F
β) were calculated as 1.16 and 1.92, respectively. In this context, the peak ground acceleration on the soil surface (PGA
soil) amplified to about 0.65 g.
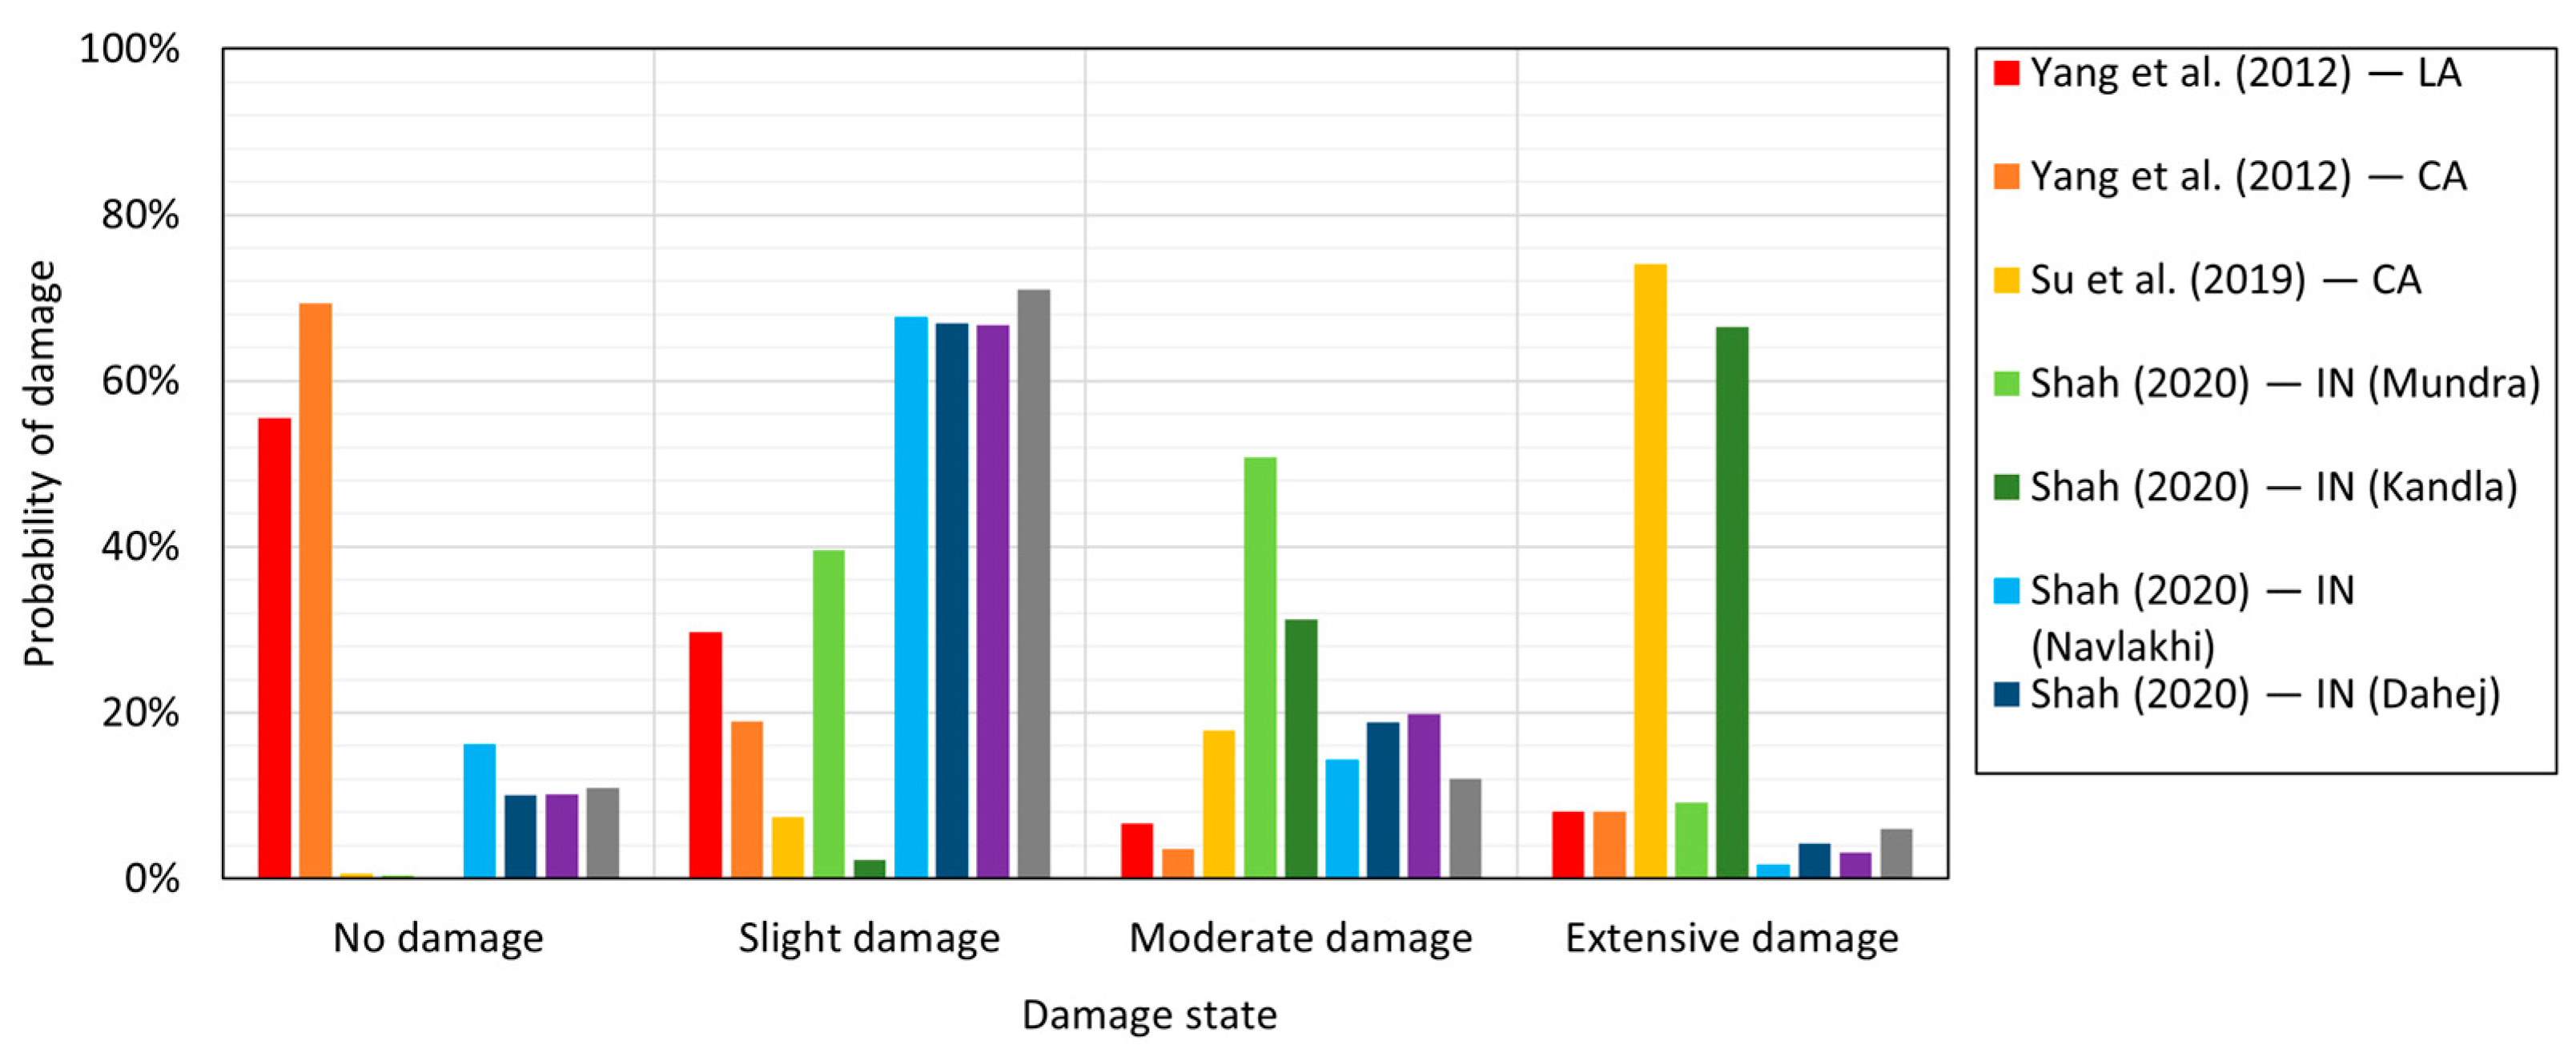
Figure 11 compares the wharf structure damage estimations obtained using the method developed in this study with those obtained by the methods available in the literature for the chosen scenario earthquake.
The models included in the comparison are the fragility model developed by Shah (2020) [
3] for pile-supported wharves in Indian ports, and the fragility models developed by Yang et al., (2012) [
5] and Su et al., (2019) [
10] for piled-wharves in United States ports. The close agreement between the present study results and those obtained by the Shah deserves special attention. It is possible to explain this agreement because the typology of the Gioia Tauro is similar to that of Indian ports (i.e., large diameter piles attached to the slab supported by precast beams). Slight discordance is present in the distributions of DG2 (moderate damage) and DG1 (slight damage). On the other hand, North American ports typically contain smaller diameter post-tensioned piles that deviate from the typology of the Gioia Tauro port. Interestingly, when the damage estimates of the Gioia Tauro port are compared with the ones obtained by using Yang et al., (2012) [
5] for LA and CA ports, it can be observed that they are higher than the predictions of Yang et al. (2012) [
5] but significantly lower than the ones suggested by Su et al., (2019) [
10]. The authors believe that this deviation occurs because of epistemic uncertainty stemming from the initial numerical modelling assumptions mentioned in
Table 1.
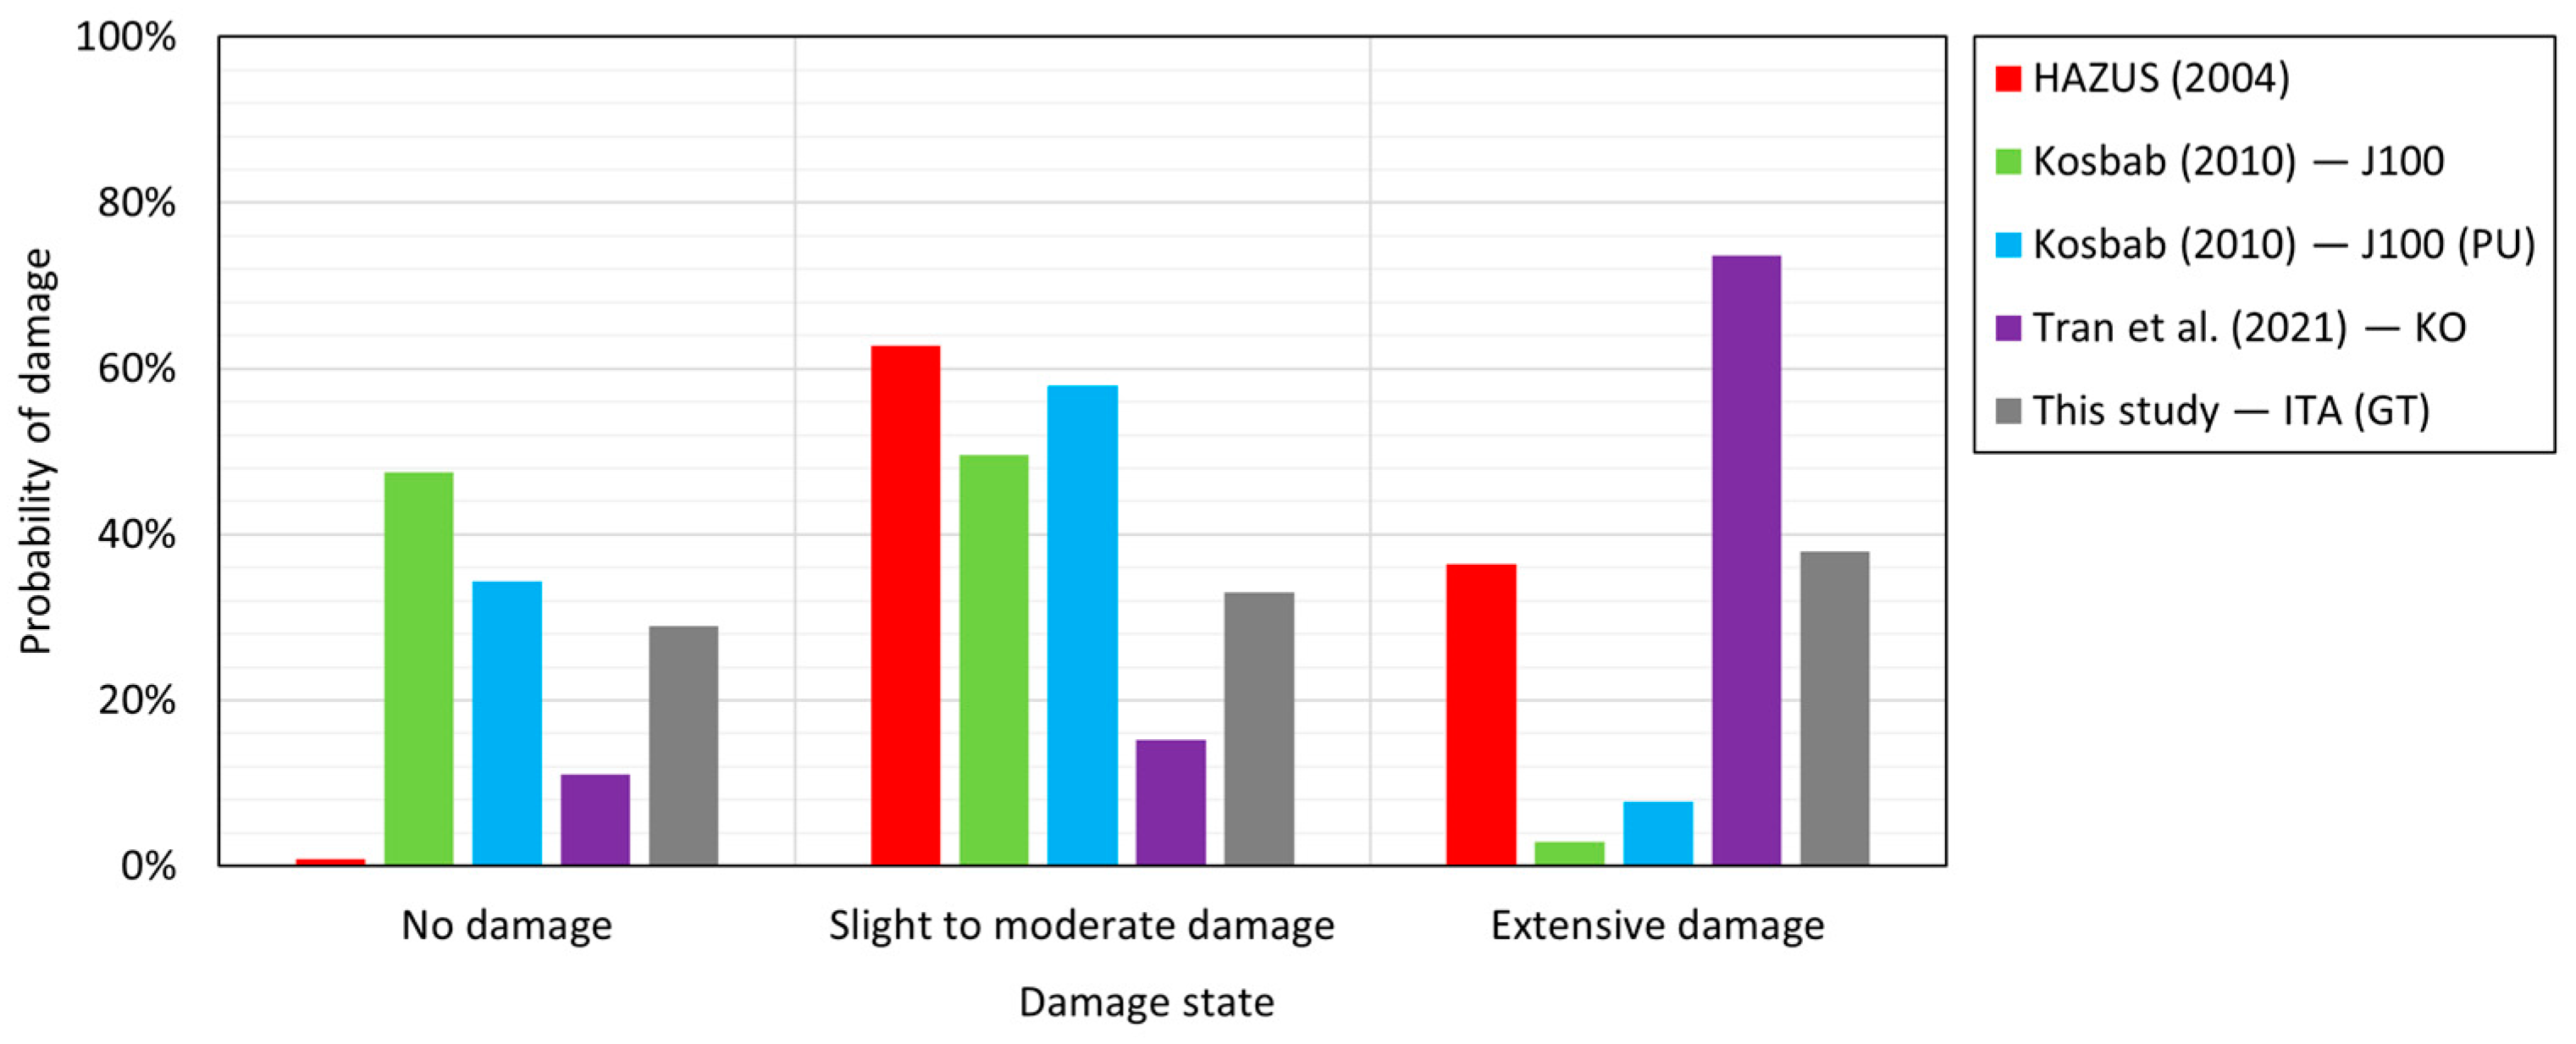
A similar comparison was carried out regarding the fragility models available in the literature for cranes (
Figure 12). The latter concerns the fragility curves of HAZUS (2004) [
18], those proposed by Kosbab (2010) [
27], and the fragility model of Tran et al., (2021) [
28]. It is worth mentioning that spectral acceleration at the free surface is also needed according to the model of Kosbab (2010). Referring to the MPS04 model and using 2% exceedance in 50 years, S
1.
5,2475 was found to be 0.325 g amplified at the soil surface as F
β S
1.
5,2475 = 0.625 g.
As observed from
Figure 12, the damage expected on the cranes calculated according to this study agrees well with the other models with no damage prediction close enough to Kosbab (2010) [
27], slight to moderate damage in between Tran et al., (2019) [
28] and Kosbab (2010) [
27], and heavy damage to collapse similar to that of HAZUS (2004) [
18]. It is important to note that analytical fragility functions suggested by Kosbab (2010) [
27] and Tran et al., (2019) [
28] require an accurate definition of the input motion parameters at the base of the cranes, which is not easy to provide without creating a numerical model. Due to this, crane performances should be integrated with wharf responses, whenever possible, by considering the underlying soil as well.


