Article

Traffic and Climate Impacts on Rutting and Thermal Cracking in Flexible and Composite Pavements

1
Department of Civil and Environmental Engineering, Manhattan College, 4513 Manhattan College Parkway, Riverdale, NY 10471, USA
2
Angelo DelZotto School of Construction Management, Centre for Construction and Engineering Technologies, George Brown College, 160 Kendal Avenue, Toronto, ON M5R 1M3, Canada
3
Department of Civil Engineering, Faculty of Engineering and Architectural Science, Ryerson University, 350 Victoria Street, Toronto, ON M5B 2K3, Canada
*
Author to whom correspondence should be addressed.
Infrastructures 2022, 7(8), 100; https://doi.org/10.3390/infrastructures7080100
Submission received: 29 June 2022 / Revised: 25 July 2022 / Accepted: 25 July 2022 / Published: 29 July 2022

Abstract

:
The study presented in this paper analyzed four long-term pavement performance (LTPP) test sections located in the states of New York (NY) and California (CA). Two of them are flexible pavement sections, whereas the other two are composite pavement sections. Two levels of analysis—in-state analysis and cross-state analysis—were performed for these pavement sections to determine the impacts of traffic and climate conditions. The performance of the pavement sections was evaluated in respect of thermal cracking and rutting resistance. The in-state analysis focused on comparing the pavement sections located in the same state. The two pavement sections located in CA exhibited insignificant variation in thermal cracking, although one of them had an additional 1.5” (38 mm) dense-graded asphaltic concrete (AC) layer. On the other hand, the additional 1.5” (38 mm) AC layer resulted in a significant reduction in the rutting depth in one pavement section. The in-state analysis of the two pavement sections located in NY revealed that the 0.8” (20.4 mm) chip seal layer had significantly low resistance to thermal cracking and rutting. The cross-state analysis examined pavement sections of comparable structural capacities—two with low structural capacity, and two with high structural capacity. The performance comparison of the two pavement sections with low structural capacity revealed that the chip seal layer exhibited a significantly high rutting depth, i.e., low rutting resistance under high traffic loads in a freezing climate. On the contrary, the two pavement sections with high structural capacity showed relatively high rutting resistance in both warmer and freezing climates. Furthermore, this paper presents the pavement deterioration models for rutting and thermal cracking in the LTPP test sections. These models were developed using multiple linear regression considering the pavement service life (age), traffic load (average annual daily truck traffic, AADTT), and climate impact (freezing index, FI). The deterioration models had coefficients of determination (r2) in the range of 0.82–0.99 and standard errors varying from 0.01 to 9.92, which indicate that the models are reliable.

1. Introduction

The performance of pavements is impacted by traffic and climate conditions. Pavements experience different types of distress due to traffic loads and climate variations (e.g., temperature changes, wet–dry cycles, and freeze–thaw cycles) [1,2]. The frequent distresses in flexible or asphaltic concrete (AC) pavement are rutting and transverse (thermal) cracking [3,4]. Rutting is a permanent deformation of AC pavement resulting from repeated heavy traffic loading on the wheel path [5,6]. Repeated traffic loading causes permanent strains [7], which greatly depend on the magnitude of the load. Traffic loads cause densification and shear-related deformation, resulting in rutting in the pavements [8]. Rutting could stem from the presence of an unstable supporting layer (base and/or subbase) underneath the AC courses. It could also occur due to the use of inappropriate hot-mix asphaltic concrete (HMAC) with a high binder content and filler–binder ratio or insufficient compaction. Furthermore, the climate condition, particularly temperature, can affect the rutting resistance of pavements by influencing their stiffness [6]. Rutting significantly occurs in a warmer climate (higher temperature during summer) as the AC binder turns to a viscous (softer) material at high temperatures that reduces the resistance of HMAC to permanent deformation and consolidation under traffic loads [9,10]. In addition, more rutting occurs in pavement segments with relatively high vehicle speeds [9].
Traffic loading and climate factors can also play a significant role in causing transverse cracks. Transverse cracks are perpendicular to the traffic direction. These cracks predominantly result from the thermal impact of HMAC, especially after the AC binder becomes stiff due to oxidation and aging [11]. Therefore, transverse cracks are typically known as thermal cracks [12]. The thermal stresses result in transverse strain during abrupt temperature drops or through multiple freeze–thaw cycles. Thermal cracks occurring at sub-normal temperatures are sometimes called low-temperature cracks. The severe cold climate intensifies the growth of low-temperature cracks in HMAC pavements [13]. At a very low temperature, when the pavement material becomes too stiff, its ductility is reduced significantly. Hence, HMAC pavements exposed to a freezing climate exhibit low-temperature cracking, which can be worsened under larger traffic loads. This is indeed a primary failure mode in flexible pavements and poses a serious concern in cold-region countries [14].
The most common distress types in composite pavements are surface cracking and instability rutting [15,16]. Surface cracking is mostly caused by top-down cracks resulting from traffic loads and thermal stress. Ling et al. [17] investigated top-down cracks and concluded that, as crack lengths reach a critical length, the crack propagation extends in terms of the crack width and number of cracks to create a map cracking pattern. The propagation of top-down cracks is affected by the modulus gradient in the AC layer, mixture fracture properties, and the structural capacity of the pavement [18]. Moreover, Von Quintus et al. [19] and the National Cooperative Research Program (NCHRP) team [20] reported that reflective cracking is the major distress type in composite pavements. Reflective cracks result from horizontal and vertical displacements in the joints of concrete slabs acting as a cement-treated base under the AC wearing surface [21]. Similar to flexible pavements, composite pavements could also be subjected to other distresses, such as transverse (thermal) cracking and rutting [22], during their service life.
The performance of pavements under various traffic and climate conditions can be predicted through models. Piryonesi and El-Diraby [23] used machine learning algorithms in developing models to predict the deterioration of the pavement condition through combinations of 15 characteristics. They found that the accuracy of the models decreased when the prediction time span was increased; conversely, the accuracy increased when the number of prediction classes (levels of deterioration) was reduced. In addition, they observed that dividing the data into 14 different climate zones enhanced the relative importance of the characteristics and the overall accuracy of the models. The same authors also used a machine learning tool to predict the condition of flexible pavements by analyzing a large dataset (more than 3000 road sections) gathered from the long-term pavement performance (LTPP) database and considering the impact of climate change [24]. They selected major climate factors (e.g., temperature ranges, precipitation, and freeze–thaw cycles) and basic road attributes (e.g., age and functional class) in developing the models for quantifying the impact of climate change. Their findings showed that climate change may alleviate or exacerbate the deterioration of pavements depending on the location. Furthermore, by using a machine learning tool, Gong et al. [25] developed a random forest regression (RFR) model to estimate the international roughness index (IRI) of flexible pavements from distress, traffic, climate, maintenance, and structural data. In the model development, they used more than 11,000 samples extracted from the LTPP database, with 80% of the randomly sampled data used for training and the remaining 20% used for testing the RFR model. They compared the performance of the RFR model with that of the regular linear regression model. Their RFR model significantly outperformed the regular linear regression model, with a coefficient of determination (r2) greater than 0.95. However, Piryonesi and El-Diraby [26] implied that simpler algorithms, such as linear regression or decision trees, can provide higher accuracy in predicting the IRI of flexible pavements.
The present study investigated the deterioration of four LTPP test sections with respect to rutting and thermal cracking. The selected pavement sections are situated in the states of New York (NY) and California (CA). The two LTPP sections from NY are part of General Pavement Studies-6B (GPS-6B) and Specific Pavement Studies-3 (SPS-3). These are flexible pavement sections consisting of a similar unbound (granular) subbase and bound (asphalt-treated) HMAC base, but double or triple AC layers with a significantly different total thickness. They are subjected to the same traffic and climate conditions. On the other hand, the two LTPP sections from CA are part of Specific Pavement Studies-6 (SPS-6). These are composite pavement sections with a similar bound (cement-treated) base and jointed Portland cement concrete (PCC) layer, but a single AC layer of a significantly different thickness. They are exposed to the same traffic and climate conditions, which differ from those of the NY pavement sections.
The degree of deterioration of the selected pavement sections was analyzed in this study. The pavement distresses emphasized were rutting and thermal cracking. The impacts of different traffic and climate conditions on the thermal cracking and rutting resistance of the selected pavement sections were evaluated. The effect of the structural capacity of the pavement on these distresses was also analyzed. In addition, the deterioration models for the selected pavement sections were developed in this study based on multiple linear regression analysis.

2. Significance of the Study

The serviceability and structural integrity of pavements are affected by the density and severity of pavement distresses. The functional and structural conditions of the selected LTPP test sections are well documented through frequent in situ testing and visual observations. The authors focused on thermal cracking and rutting as indicators of the deterioration of the pavement sections analyzed in this study. The analysis results revealed that the application of chip seal significantly decreased the thermal cracking and rutting resistance of the pavement, compared to the thin HMA concrete overlay. The freezing climate showed more impacts than the warmer climate in causing rutting and thermal cracking in the pavement. Furthermore, the authors developed the deterioration models for thermal cracking and rutting in the four LTPP test sections using multiple linear regression. These models will be useful in predicting the rutting depth and the degree of thermal cracking in the pavement sections considered for this study.

3. Background

The Federal Highway Administration (FHWA) has managed the LTPP program since 1992. The program was initiated by the NCHRP team in 1986 [27]. The program includes SPS-3, SPS-6, and GPS-6B to evaluate the performance of different pavements (e.g., flexible, rigid, and composite pavements) through experiments and observations. In this study, one pavement section from SPS-3, two sections from SPS-6, and one section from GPS-6B were selected for the analysis of performance under different traffic and climate conditions.

3.1. SPS-3

The SPS-3 studies were conducted to evaluate the effectiveness of preventive maintenance of flexible pavements. It studied several parameters including climate zones, subgrade type (fine or coarse), traffic loads (greater or less than 85,000 ESALs (equivalent single axle loads)/year), initial condition (good, fair, or poor), and structural capacity (low or high). The preventive maintenance treatments included slurry seal, chip seal, crack seal, and a thin overlay—they were used to improve the functional performance and prolong the service life of pavements by mitigating existing distresses or delaying their further development.
The key findings of the SPS-3 studies in the context of the present study were as follows [28,29]: (a) the thin overlay was noted as the most effective preventive maintenance technique to mitigate or slow pavement rutting under all circumstances; (b) the chip seal efficiently decreased the development of rutting in wet regions and non-freezing zones; (c) the thin overlay was efficient in alleviating and delaying the growth of pavement roughness, particularly in freezing zones and under high traffic conditions; (d) the thin overlay was better than the chip seal in constraining transverse or thermal cracks. Moreover, it was found that the structural capacity of the pavement sections had an insignificant impact on the performance of the maintenance treatments, as compared to the traffic and climate factors [29].

3.2. SPS-6

The SPS-6 studies were conducted to examine the rehabilitation methods of jointed PCC pavements. The test sections were spread to include two climate regions (wet–freezing and wet–non-freezing), two pavement types (plain and reinforced concrete), and different traffic loads. The rehabilitation techniques included AC overlays using 4” (102 mm) and 8” (204 mm) layers. Limited slab preparation or full slab restoration was applied prior to applying the AC overlays [30].
The SPS-6 studies identified the most effective rehabilitation techniques to restore the IRI, as well as rutting and cracking resistance. The treatments (ranked from the most effective to the least effective) were [31]: (a) an 8” (204 mm) AC overlay on cracked/broken and seated pavement; (b) a 4” (102 mm) AC overlay on either intact or cracked/broken and seated pavement with or without sawing and sealing of transverse joints, and with minimal or intensive pre-overlay repair; (c) concrete pavement restoration with diamond grinding, full-depth repair, and joint and crack sealing; and (d) concrete pavement restoration without diamond grinding but with full-depth repair and joint and crack sealing.

3.3. GPS-6B

The GPS-6B studies were conducted on the pavement sections originally included in GPS-1 and GPS-2 studies. One of the test sections selected for the present study originally belonged to the GPS-2 studies, which examined a dense-graded HMAC surface layer with or without other HMAC layers, placed over a bound base layer. The test sections included bituminous and non-bituminous bound base layers. Bituminous bases included asphalt cement, cutback asphalt, emulsified asphalt, and road tar. Non-bituminous bases included hydraulic cement, lime, fly ash, natural pozzolan, or combinations thereof. The test sections were constructed to examine the effects of variations among the climate zones, subgrade types, traffic spectrum, and surface and base layer thicknesses [32]. The GPS-6B sections received a 1” (25.5 mm) overlay on the original pavement sections [31].
The GPS-6B studies concluded that about 0.24” (6 mm) of rutting (initial rutting) is developed in the first year following the application of an AC overlay on top of an AC pavement. This could result from traffic compaction of the new AC layer. The initial rutting is independent of the overlay thickness, mixture type, pre-overlay preparation, and pre-overlay rutting level [31].

4. Pavement Test Sections

4.1. Locations

Two LTPP test sections selected from NY were analyzed. They are 36-1643 (Figure 1) and 36-A350 (Figure 2) located on the US-4 highway within Washington County. These two sections are 1 mi (1.6 km) apart and located 66 mi (106.2 km) north of Albany, NY. They are situated in a wet and freezing climate zone. One of these two LTPP test sections was under SPS-3, and the other belonged to GPS-6B.
Two more LTPP test sections selected from CA were analyzed in this study. They are 06-0603 (Figure 3) and 06-0606 (Figure 4) located within the vicinity of the Interstate-5 freeway in Siskiyou County. These two sections are located 60 mi (96.6 km) north of the City of Redding, CA. They are situated in the Northern CA climate region, which is wet and non-freezing. Each of these two LTPP test sections belonged to SPS-6.
The research team of NCHRP investigated additional pavement sections in SPS-6, SPS-3, and GPS-6B to expand the database. However, the authors of this paper did not obtain reliable data on the additional sections of an approximately similar structural capacity and subjected to similar traffic loads. Therefore, instead of extending the number of sections by including the data from incomparable sections, the authors used a limited number of pavement sections in this analysis that include reliable and realistic data.

4.2. Structural Cross-Sections

The authors analyzed four LTPP test sections: two (36-1643 and 36-A350) of them are flexible test sections (Figure 1 and Figure 2), and the other two (06-0603 and 06-0606) are composite test sections (Figure 3 and Figure 4). The pavement performance was compared with respect to thermal cracking and rutting resistance, for each pair of test sections with low or high structural capacity.

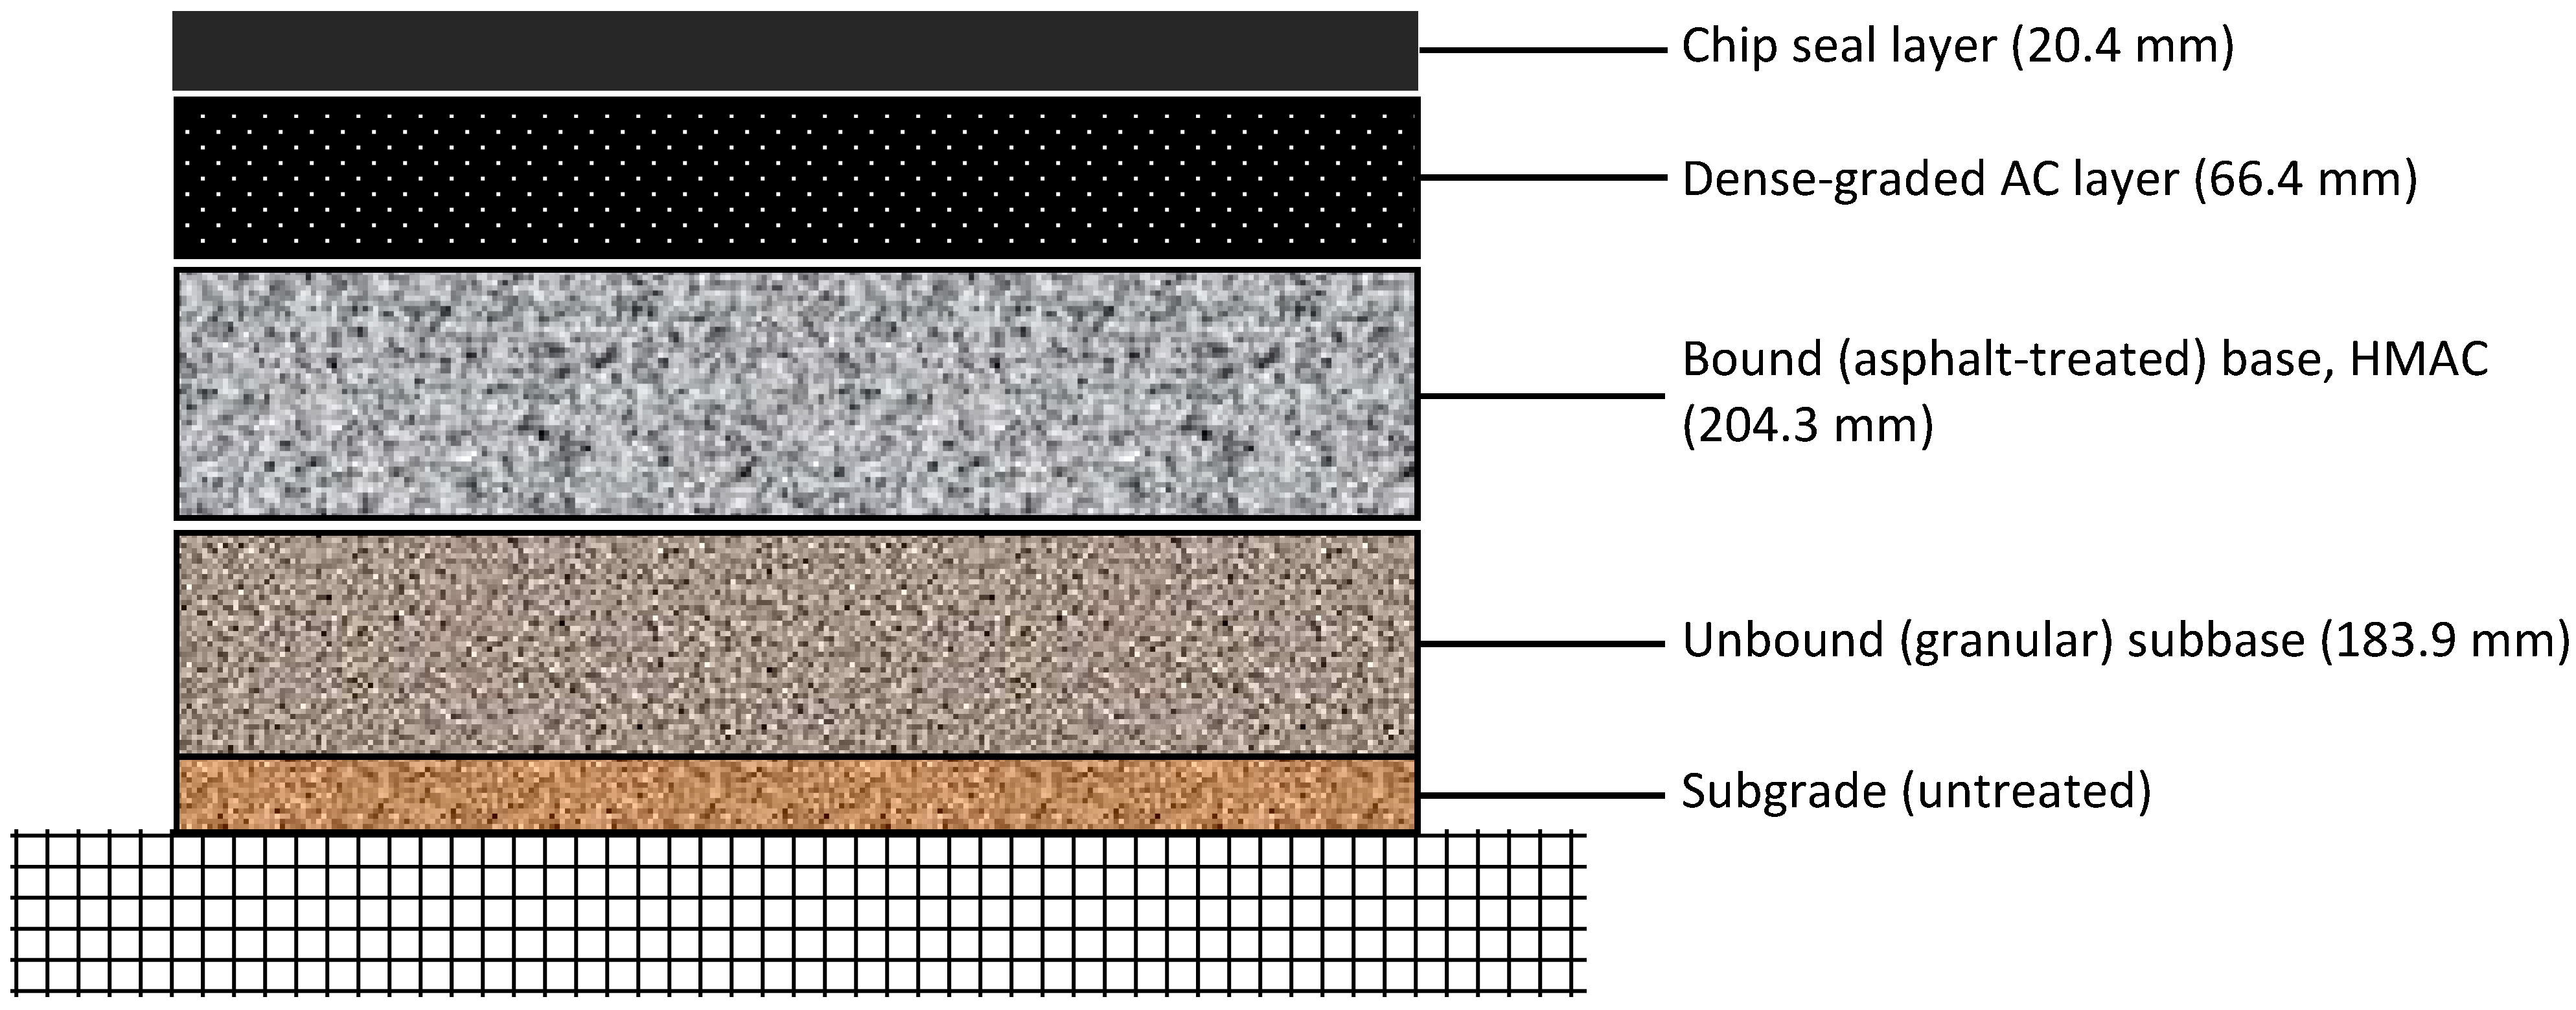
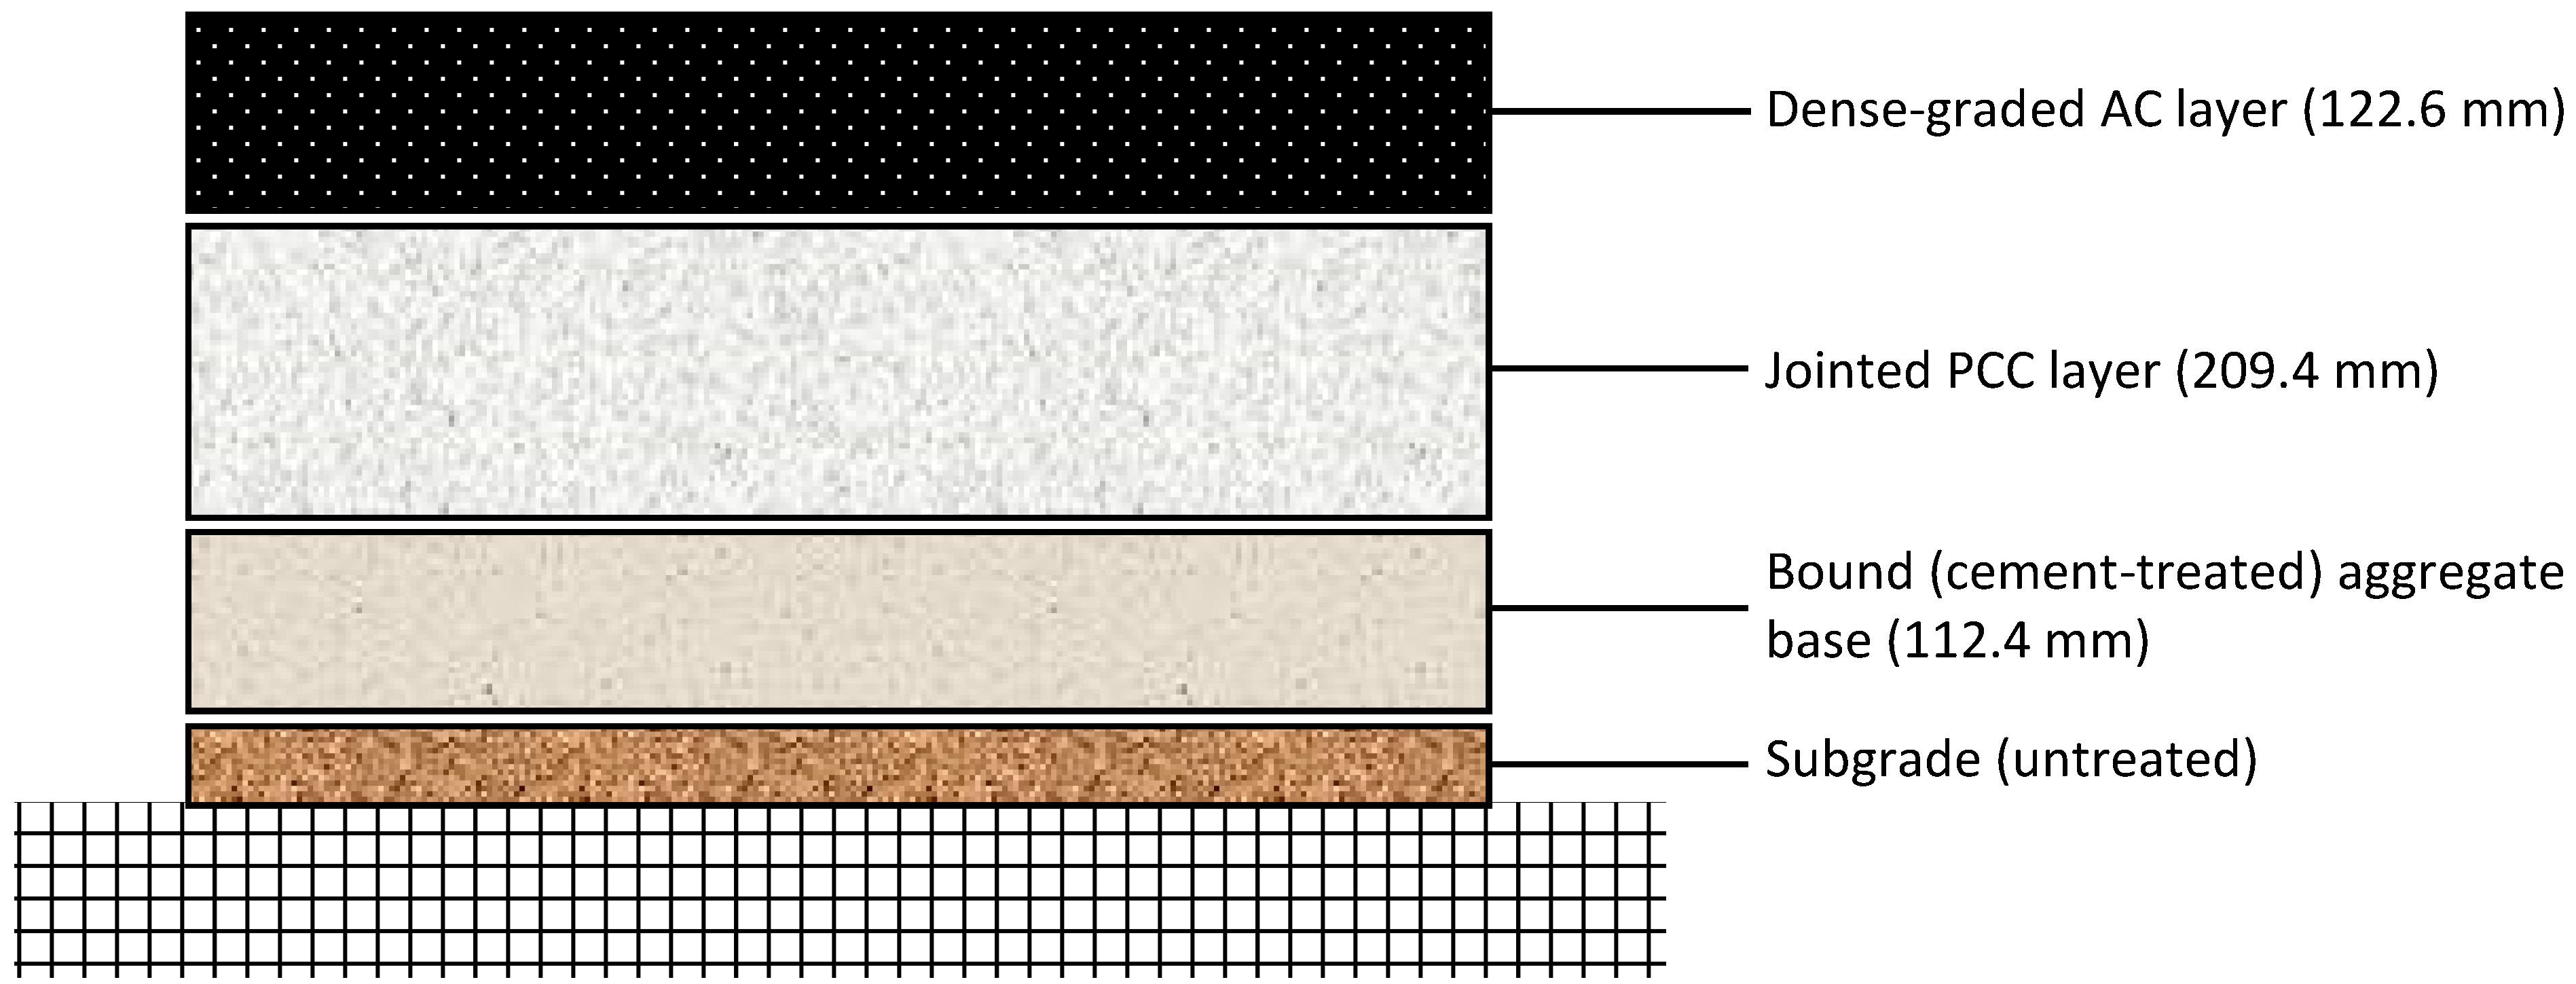
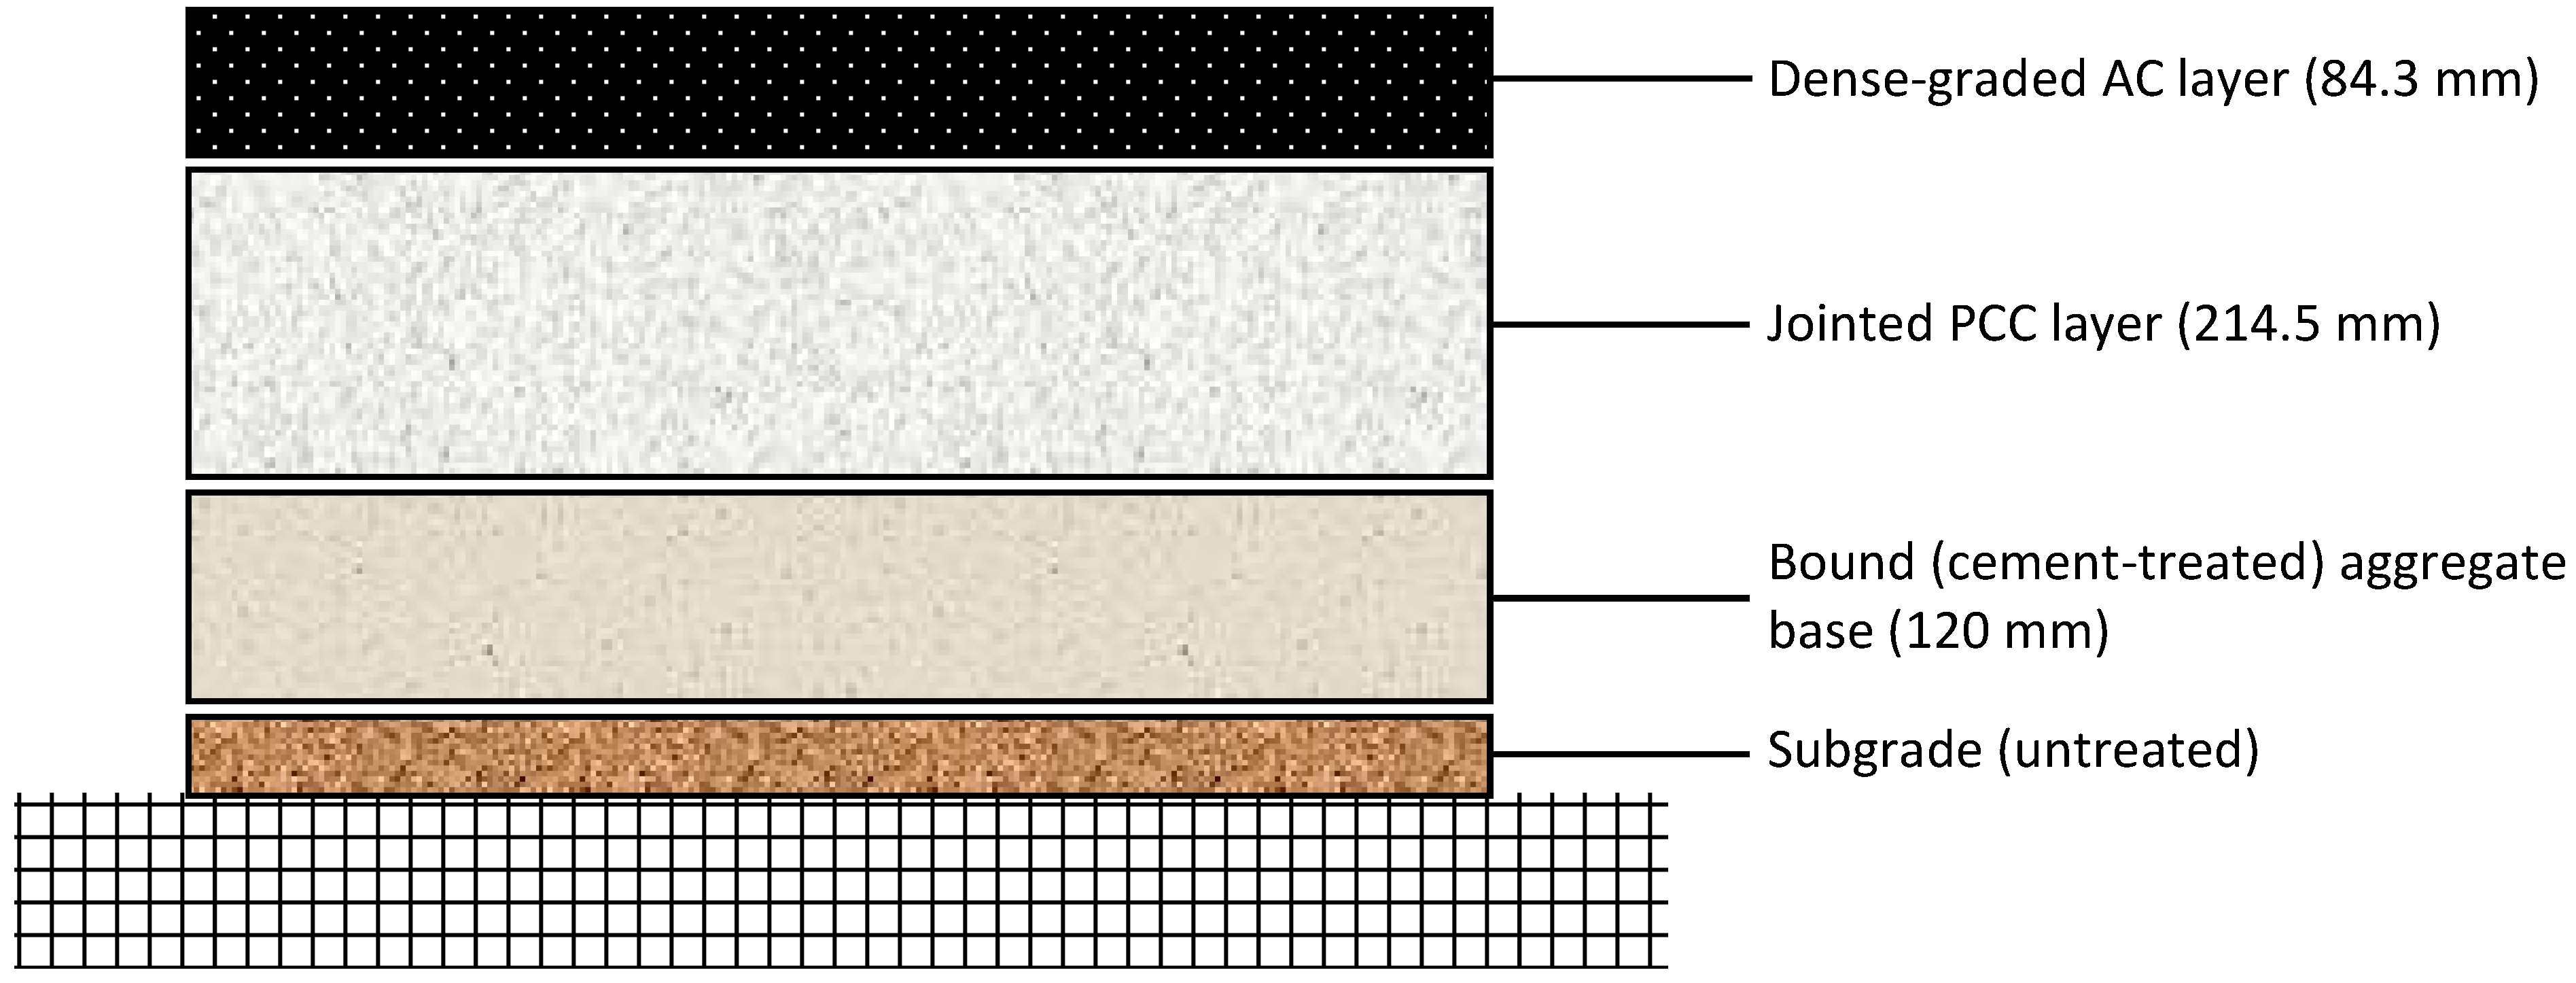
4.2.1. New York (NY) Sections

LTPP test sections 36-1643 and 36-A350 are situated in NY. The pavement cross-section of 36-1643 is constructed with 1.1” (28.1 mm), 1.8” (46 mm), and 2.2” (56.2 mm) dense-graded AC layers, followed by an 8.2” (209.4 mm) bound (asphalt-treated) base (HMAC) and a 7.2” (183.9 mm) unbound (granular) subbase on an untreated subgrade, as shown in Figure 1. On the other hand, 36-A350 consists of a 0.8” (20.4 mm) chip seal layer, a 2.6” (66.4 mm) dense-graded AC course, an 8” (204.3 mm) bound (asphalt-treated) base (HMAC), and a 7.2” (183.9 mm) unbound (granular) subbase on an untreated subgrade, as shown in Figure 2. The subgrade in these two test sections is made using well-graded sand with silt and gravel. They have significantly different AC layer thicknesses. The total thickness of the AC layers is 5.1” (130.3 mm) in 36-1643. In contrast, 36-A350 has a significantly lower total AC layer thickness of 3.4” (86.8 mm).

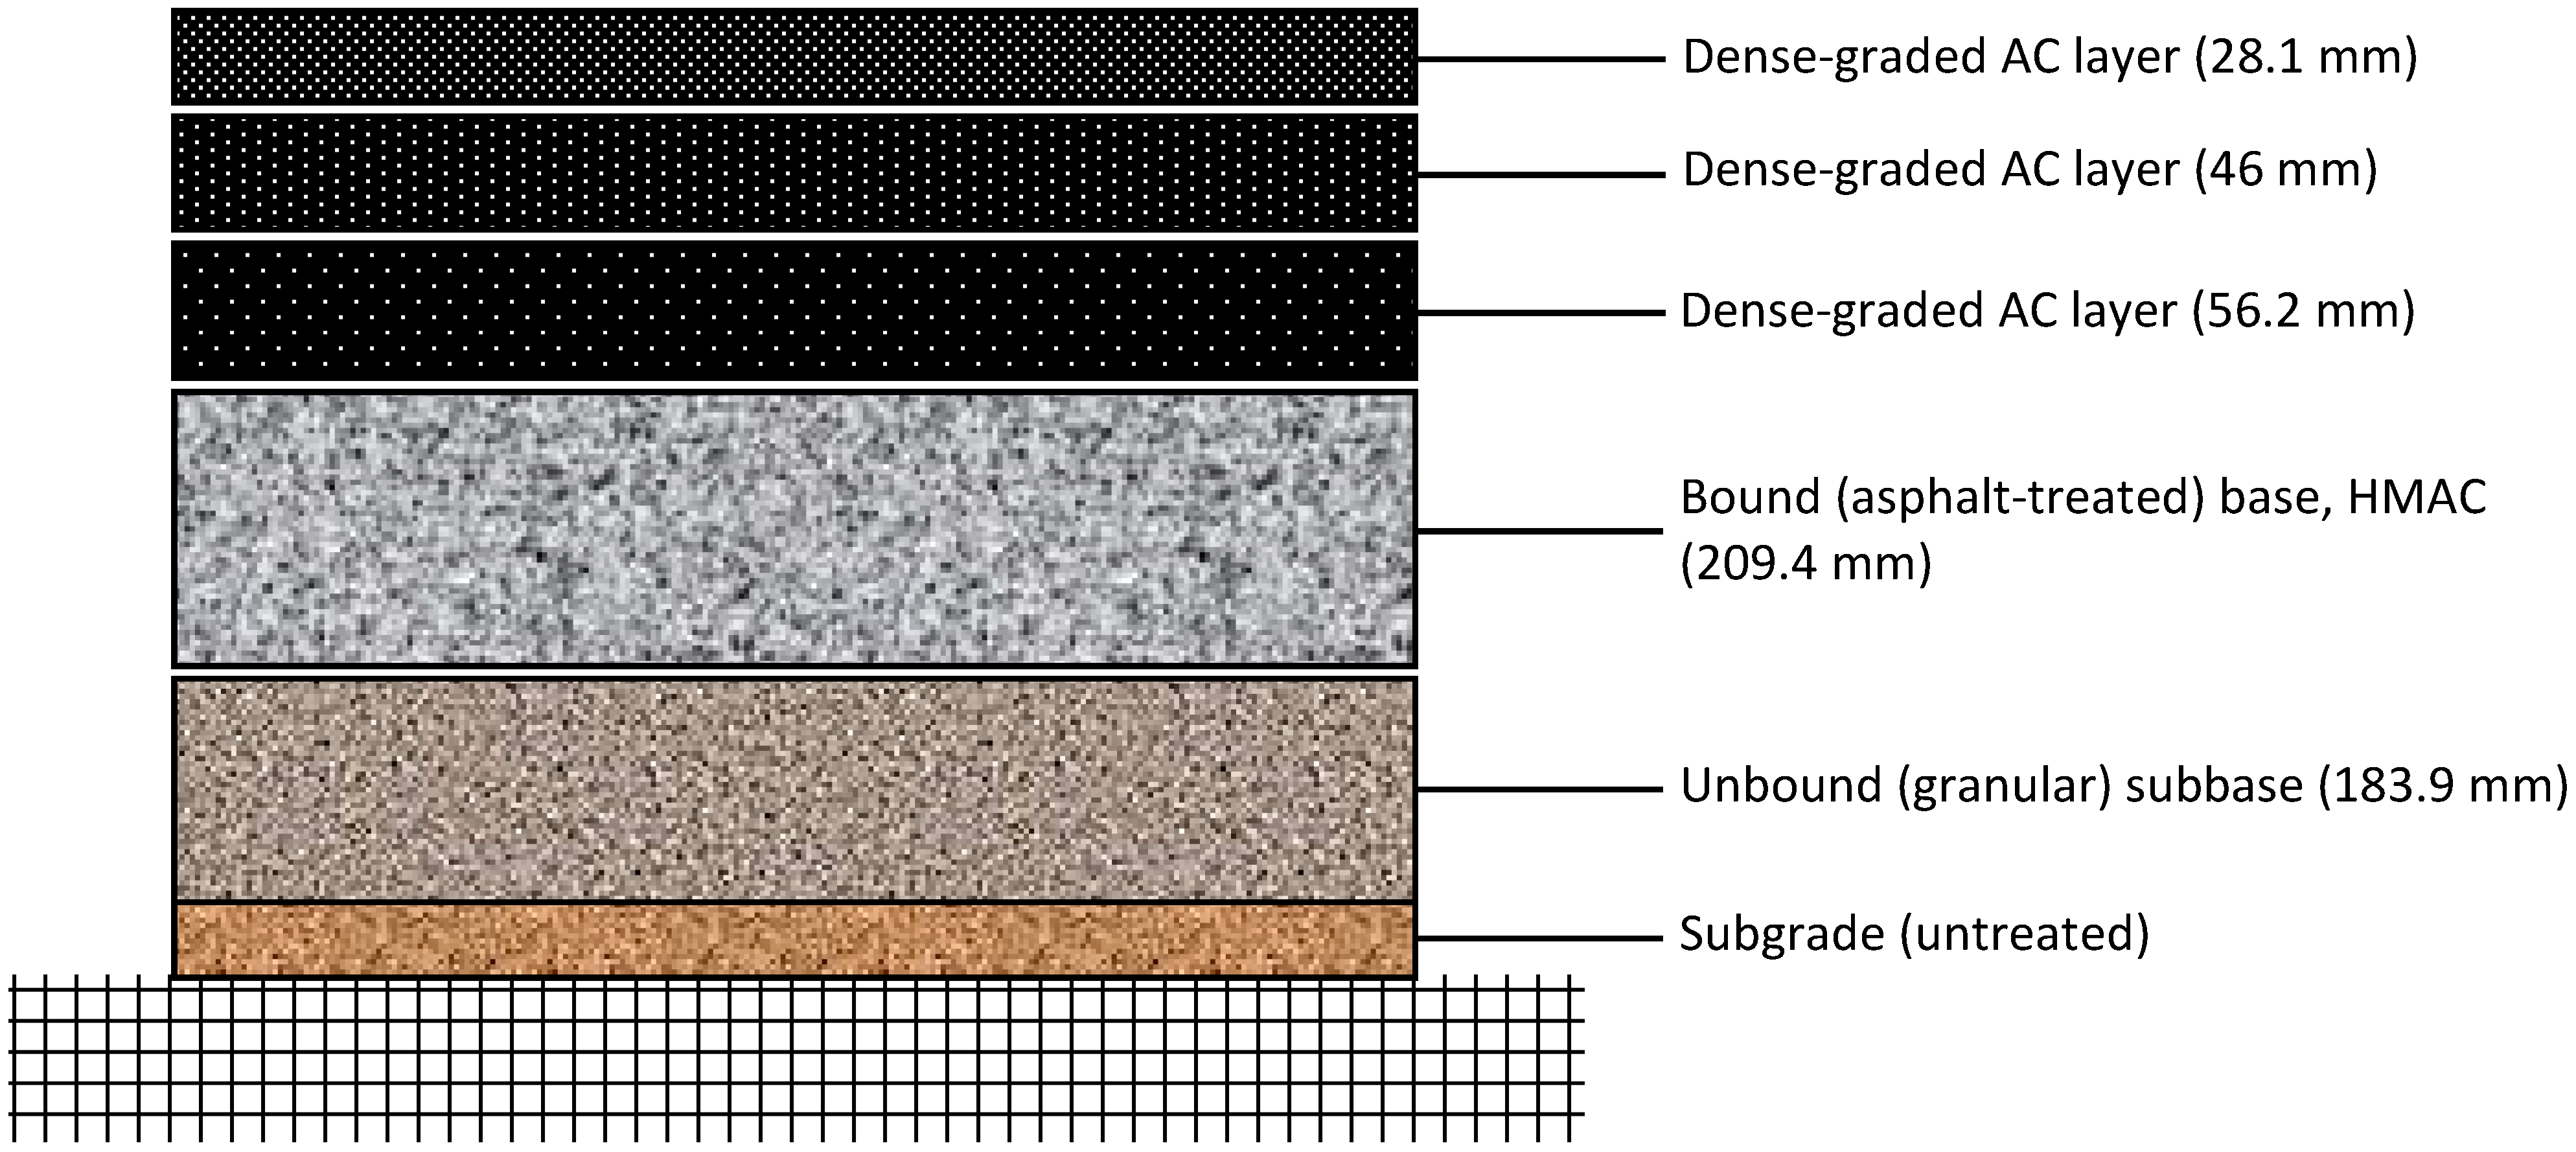
4.2.2. California (CA) Sections

LTPP test sections 06-0603 and 06-0606 are sited in CA. The pavement cross-section of 06-0603 has a 4.8” (122.6 mm) dense-graded AC course and an 8.2” (209.4 mm) jointed PCC layer on top of a 4.4” (112.4 mm) cement-treated bound aggregate base, which is placed on an untreated subgrade, as can be seen in Figure 3. On the other hand, the pavement cross-section of 06-0606 has a 3.3” (84.3 mm) dense-graded AC course, an 8.4” (214.5 mm) jointed PCC layer, and a 4.7” (120 mm) cement-treated bound aggregate base on an untreated subgrade, as shown in Figure 4. The subgrade in these two test sections is made using poor-graded gravel with sand. The main difference between the two sections is the thickness of the AC layer—06-0603 has a thicker AC layer than 06-0606 (4.8” (122.6 mm) versus 3.3” (84.3 mm)).

4.2.3. Comparison of New York (NY) and California (CA) Sections

The pavement test sections selected from NY and CA are structurally comparable: 06-0603 (CA) and 36-1643 (NY) consist of 4.8” (122.6 mm) and 5.1” (130.3 mm) dense-graded AC layers, respectively. The base layers in 06-0603 and 36-1643 are 8.2” (209.4 mm) jointed PCC and 8.2” (209.4 mm) HMAC, respectively. On the other hand, 06-0606 (CA) and 36-A350 (NY) consist of 3.3” (84.3 mm) and 3.4” (86.8 mm) dense-graded AC layers, respectively. The base layer in 06-0606 is 8.4” (214.5 mm) jointed PCC, whereas it is 8” (204.3 mm) HMAC in the case of 36-A350. However, it should be mentioned that the two NY sections are flexible pavements. On the other hand, the two CA sections are composite pavements.

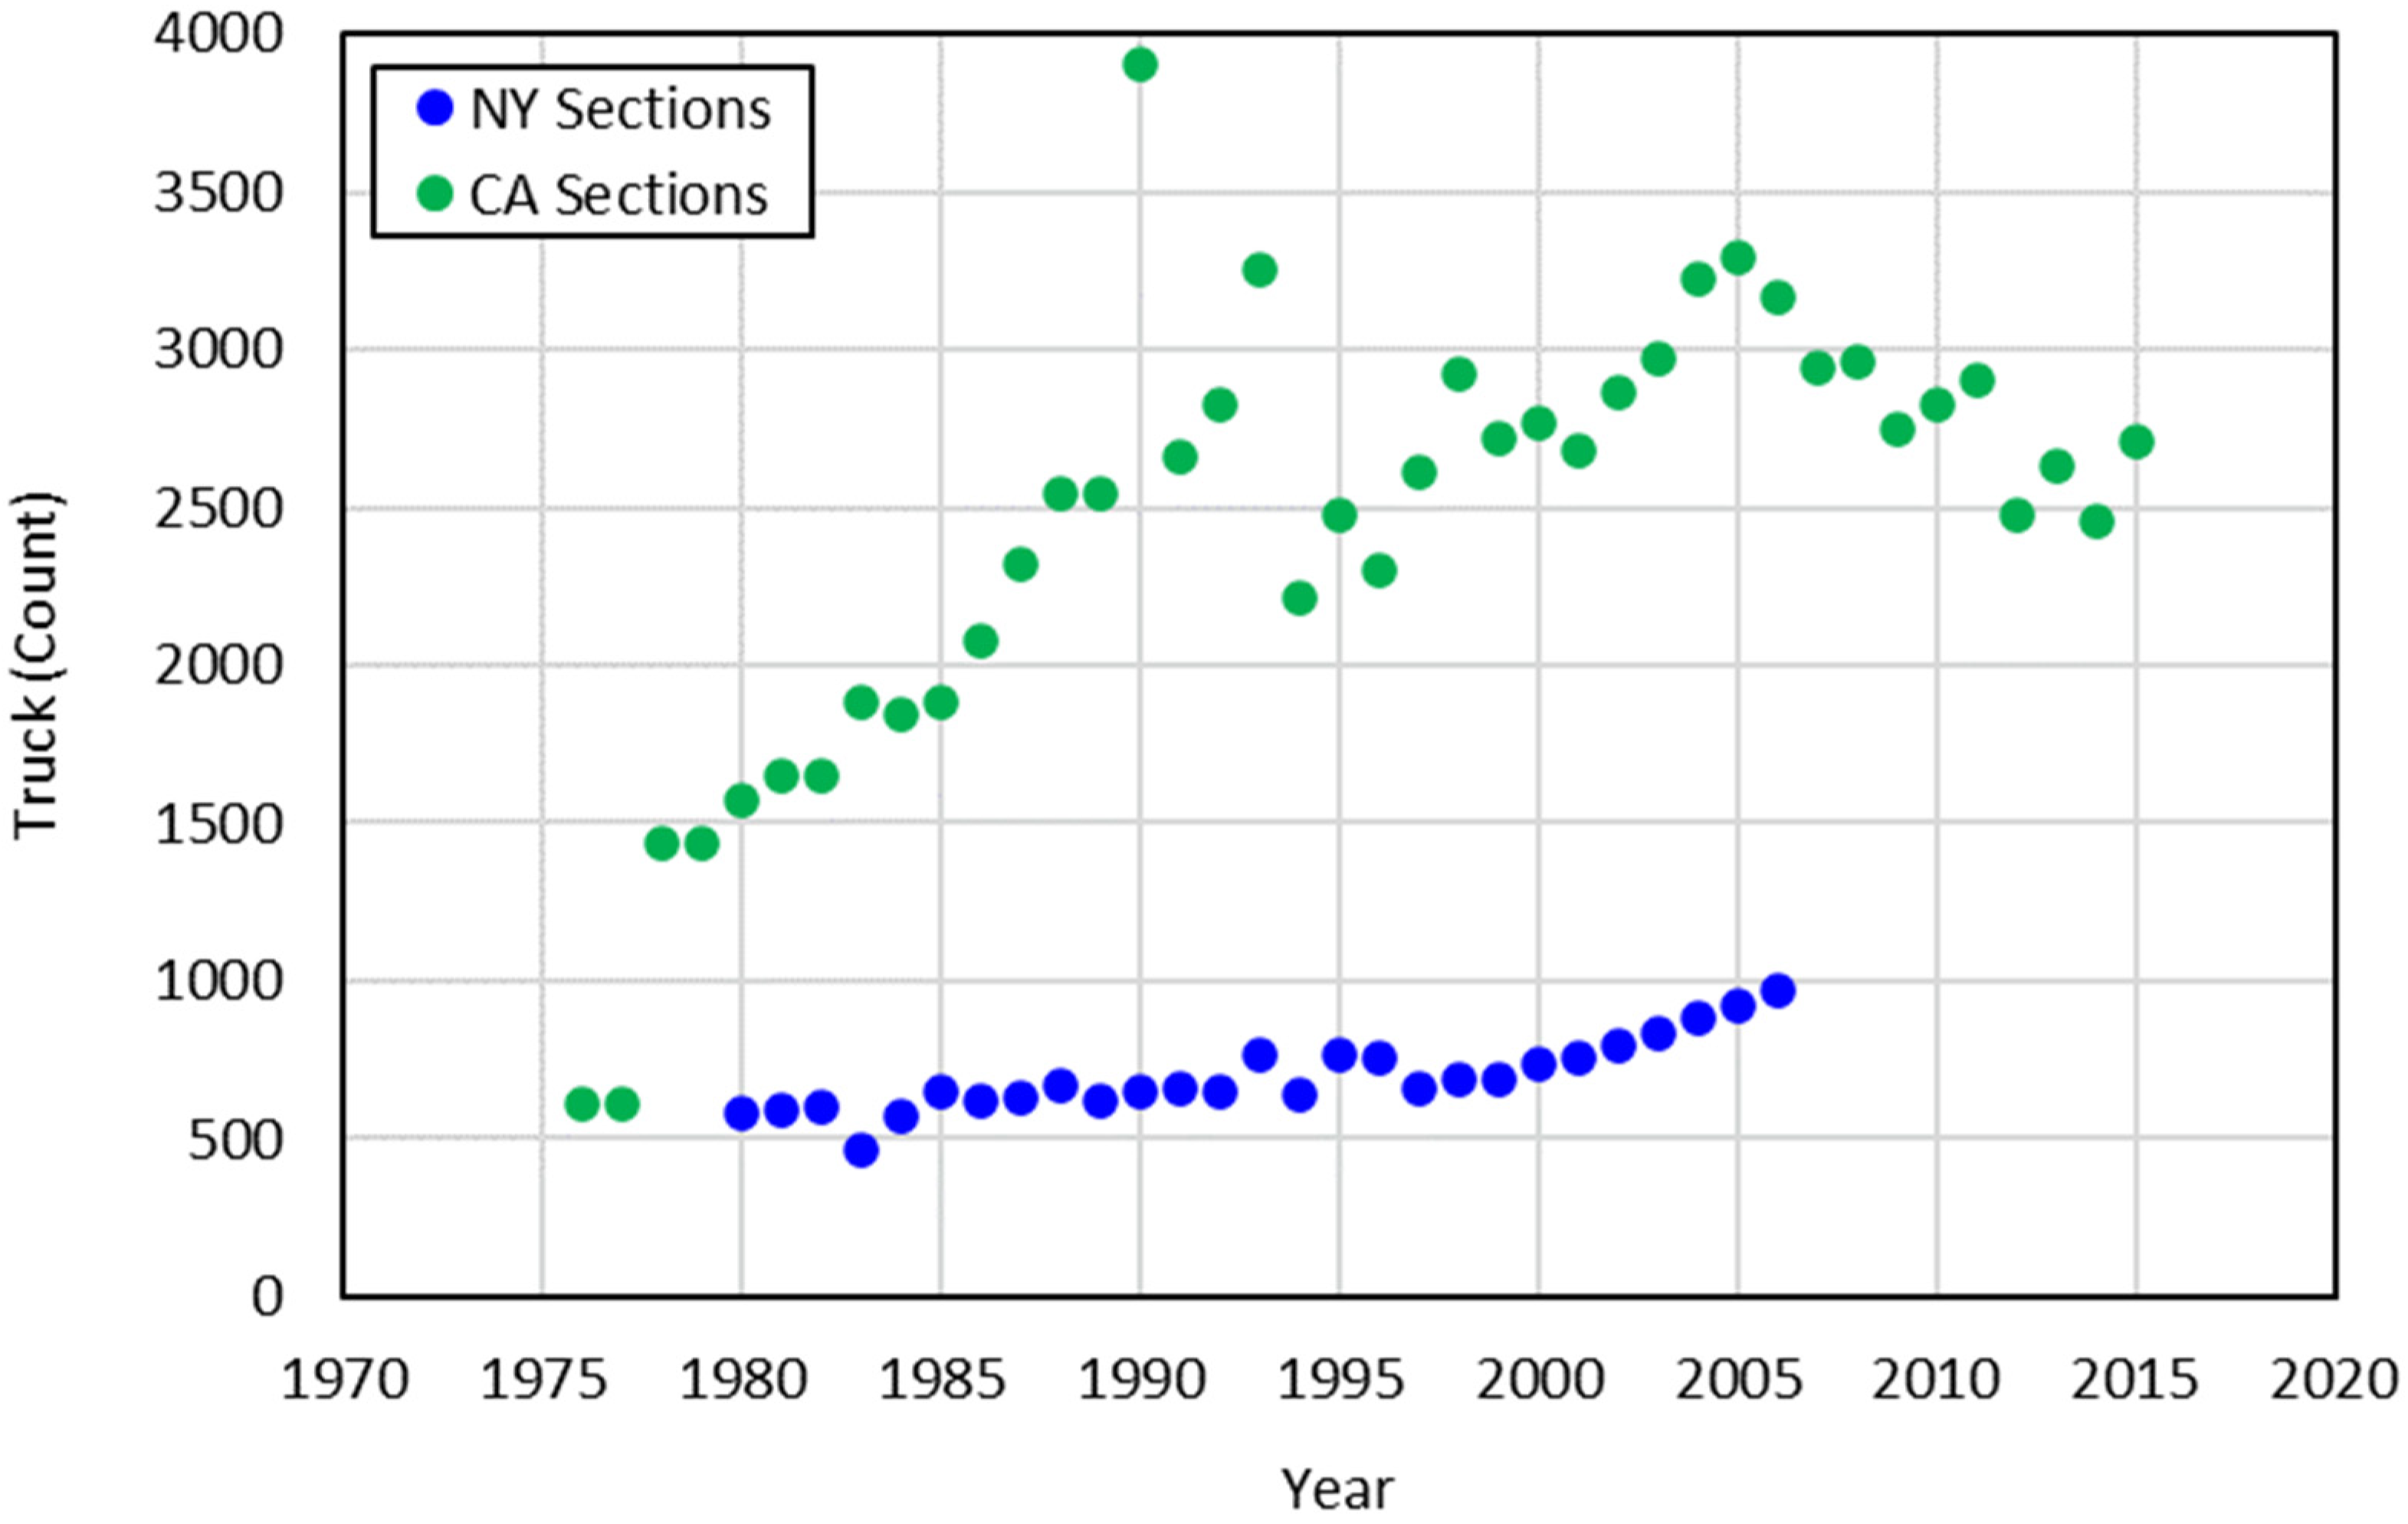
4.3. Traffic Loading

The traffic spectrum on LTPP test sections 36-1643 and 36-A350 selected from NY was identical. The average annual daily truck traffic (AADTT) on these two test sections varied in the range of 450–1000 from 1980 to 2006, as can be seen in Figure 5.
LTPP test sections 06-0603 and 06-0606 located in CA are also characterized by an identical traffic spectrum. The AADTT on these two test sections fell within the range of 600–4000 from 1976 to 2015, as can be seen in Figure 5.
It is worth mentioning that the authors of this paper aimed to analyze the effect of traffic loading on the selected pavement sections without any additional surface treatment. Any treatment on the pavement surface during the study years will influence such an analysis by affecting the distress record and provide erroneous results. Hence, the traffic data that are not impacted by preventive maintenance were used in the analysis.

4.4. Climate Conditions

The two NY pavement sections were subjected to the same climate conditions. The annual average precipitation for the location of the NY pavement sections varied from 744.8 to 1434.2 mm for the years of 1978–2012. During these years, the annual average temperature of the location of the NY pavement sections was in the range of 6.6–10.6 °C (see Table 1).
The two CA pavement sections were also exposed to the same climate conditions. The annual average precipitation for the location of the CA pavement sections varied from 316.2 to 1906.4 mm for the years of 1973–2012. During these years, the annual average temperature of the location of the CA pavement sections was in the range of 8.5–11 °C (see Table 1). In general, the CA pavement sections were exposed to a warmer climate than the NY pavement sections. It should be mentioned that traffic data were available for the years of the climate data considered in this study. Moreover, climate data were used to observe their impact on the rutting and thermal cracking in the selected pavement sections without having an influence of any additional maintenance treatment during the period of analysis.
The authors of this paper considered the temperature as the critical climate factor in the analysis of the performance of the selected pavement sections. The annual average temperature, as shown in Table 1, was calculated from the mean daily temperatures, which were also used to determine the annual average freezing index. The historical climate data (the mean daily temperatures) used to calculate the annual average freezing index were downloaded from Weather Underground [34]. The freezing index was calculated using the following formula [35,36]:
FI = ( T ¯ 32   ° F )
In the above equation, T ¯ is the mean daily temperature (°F), which was calculated taking the average of the daily minimum and maximum temperatures. In this study, the authors used the mean daily temperature in °C and therefore replaced 32 °F with 0 °C in Equation (1) to obtain the annual average FI values in °C-day. The annual average FI indexes for the locations of the selected pavement sections in different years are also shown in Table 1. It is evident from this table that the annual average freezing indexes of the NY sections were significantly higher than those of the CA sections.

4.5. Maintenance History

The LTPP test sections located in NY received patching and shoulder restoration in 1995. The subsequent patching was recorded in 2002, which influenced the distress records afterwards. Hence, the authors of this paper used the distress data from 1995 to 2002 to perform the analysis of the performance of the pavement sections.
The LTPP test sections located in CA received a full-depth patch and shoulder restoration in 1992. Crack sealing was performed on the AC pavement surface in 1999, which impacted the distress records thereafter. Therefore, the authors performed the analysis for the CA pavement sections based on the data collected from 1992 to 1999.

5. In-State Analysis

This part of the paper presents the findings by comparing the performance of the adjacent pavement sections located on the same highway with variation in the pavement thickness. The in-state analysis mainly evaluated the impact of variation in the structural capacity of the pavement sections. The impact was analyzed in respect of the thermal crack count and rutting depth. A statistical t-test was performed to determine the predominance regarding the occurrences of thermal cracking and rutting.

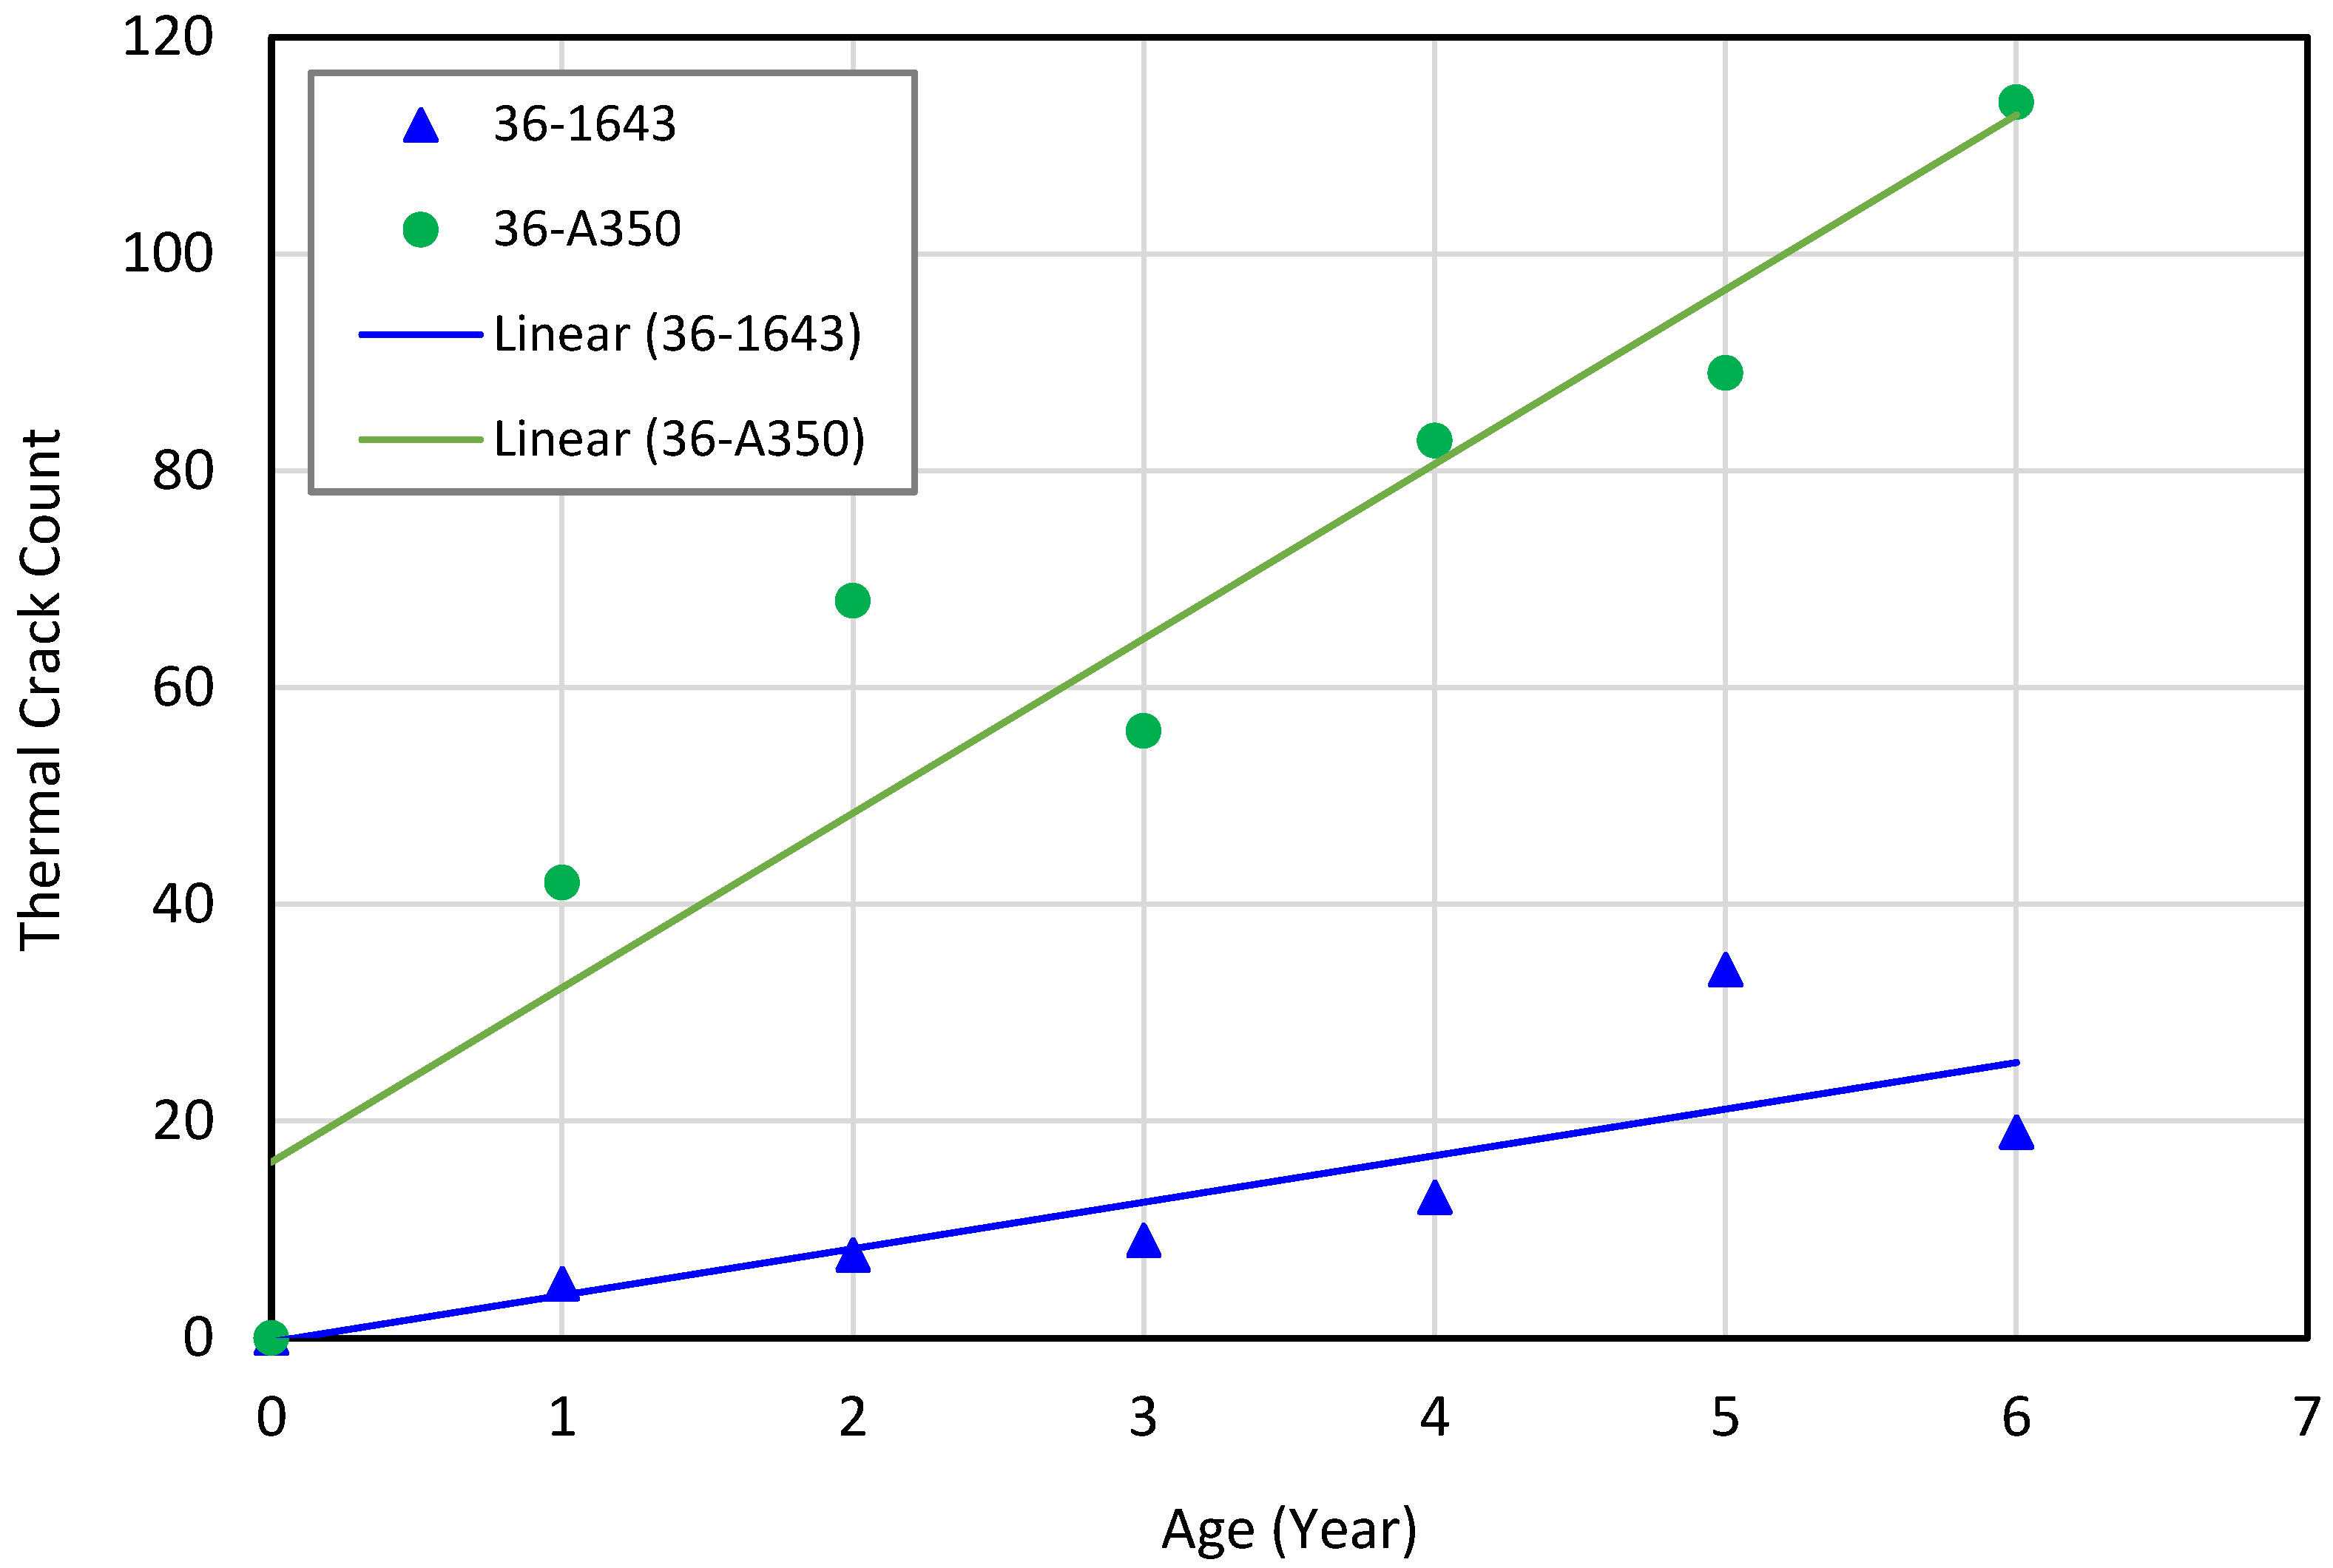
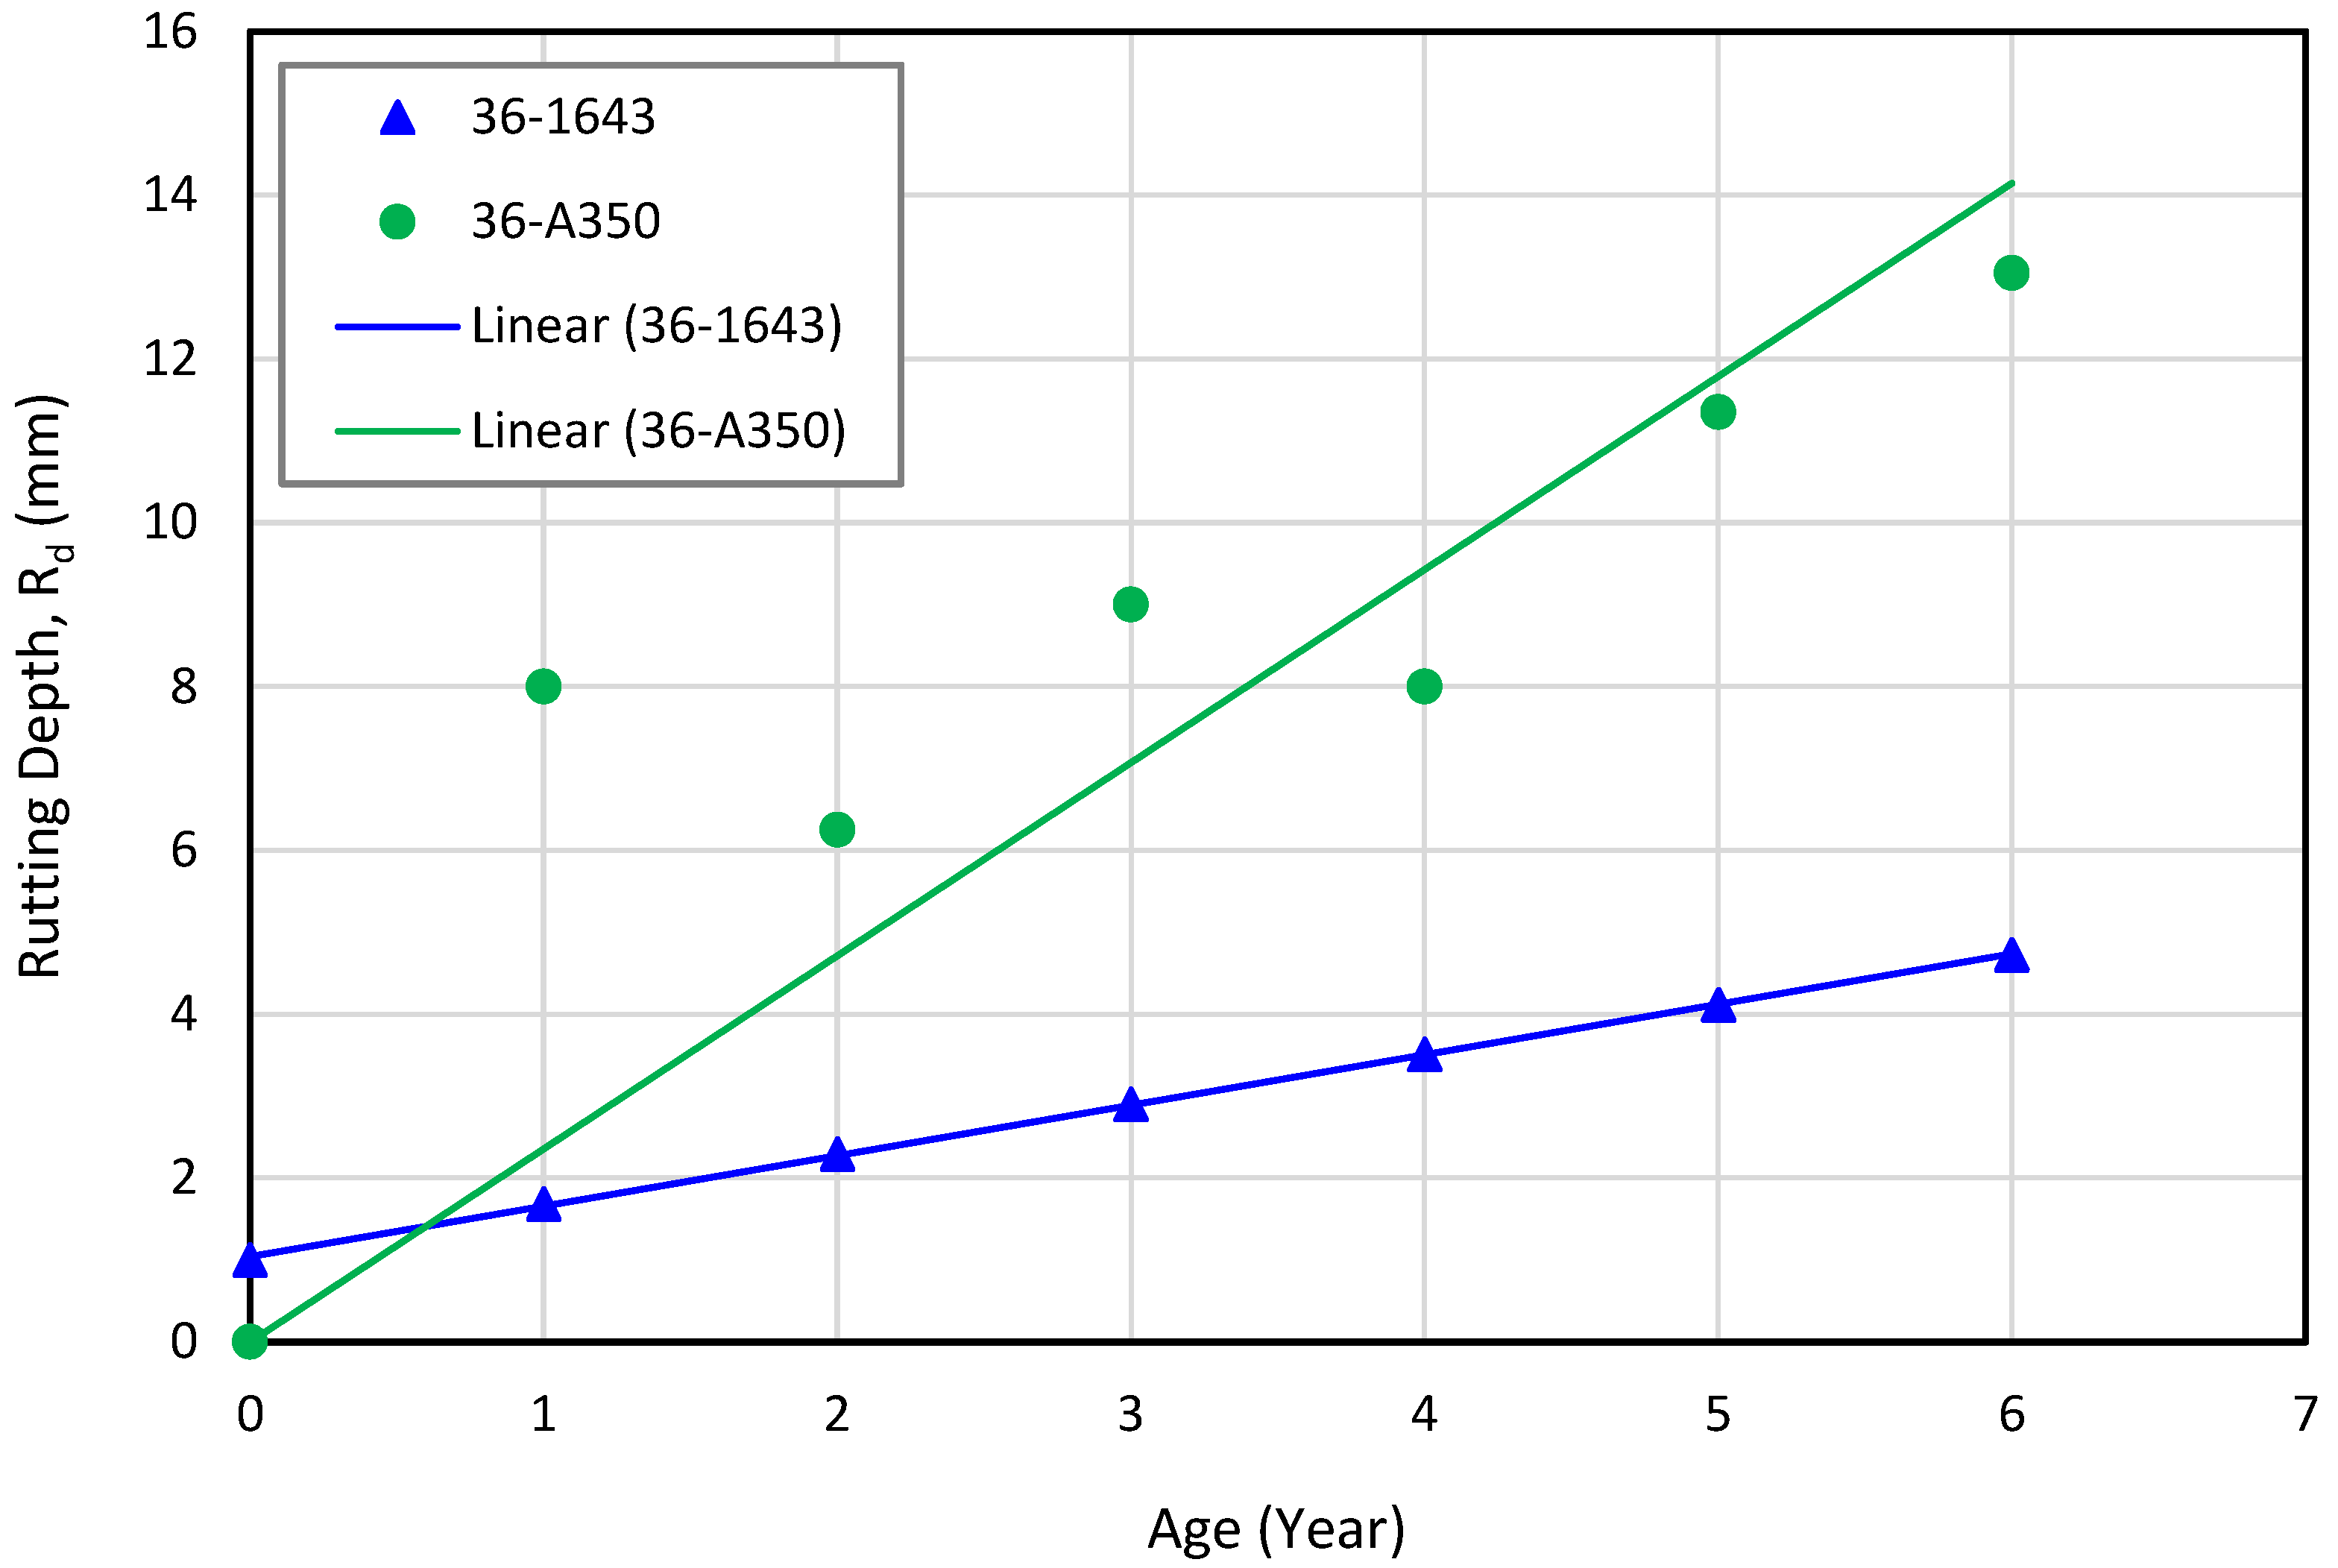
5.1. New York (NY) Sections (36-1643 and 36-A350)

The performance of the NY pavement sections was analyzed for the period from 1995 to 2002. The NY sections studied are flexible pavement sections, which exhibited both rutting and thermal cracking. Significant variation in the performance of 36-1643 and 36-A350 was noted by analyzing the rutting depth and the count of thermal cracks. The principal differences between these two pavement sections located in NY are the material and thickness of the surface wearing course: 36-A350 is characterized by a 0.8” (20.4 mm) chip seal layer followed by a thin 2.6” (66.4 mm) dense-graded AC surface layer, whereas 36-1643 includes 5.1” (130.3 mm) dense-graded AC layers (three layers). The material properties of the chip seal with a relatively thin layer resulted in a significant increase in thermal cracks on 36-A350. Morian et al. [29] reported that chip seal is less effective in alleviating thermal cracking in flexible pavements. The statistical t-test performed in this study showed that the count of thermal cracks on 36-A350 was significantly higher than that on 36-1643. In this case, the p-value for the statistical t-test was 0.002. Figure 6 presents the progression of thermal crack counts on the pavement sections located in NY.
The rutting depth in 36-A350 was significantly higher than that in 36-1643, as can be seen in Figure 7. In this case, the p-value determined from the statistical t-test was also 0.002. It should be noted that 36-1643 was treated by a thin AC overlay at year 0 (1995) and exhibited 0.07” (1.8 mm) of rutting after the first year (1996). This behavior matches the conclusion drawn from NCHRP Project 20-50(3/4) [31]. The presence of rutting in pavement sections located in freezing climate zones could result from the deterioration of the granular layer through freeze–thaw cycles [37]. In addition, using their three-dimensional discrete element model, Wang et al. [38] proved that thin overlays suffer from severe shear forces, which accelerate the development of rutting in the AC surface layer of flexible pavements.

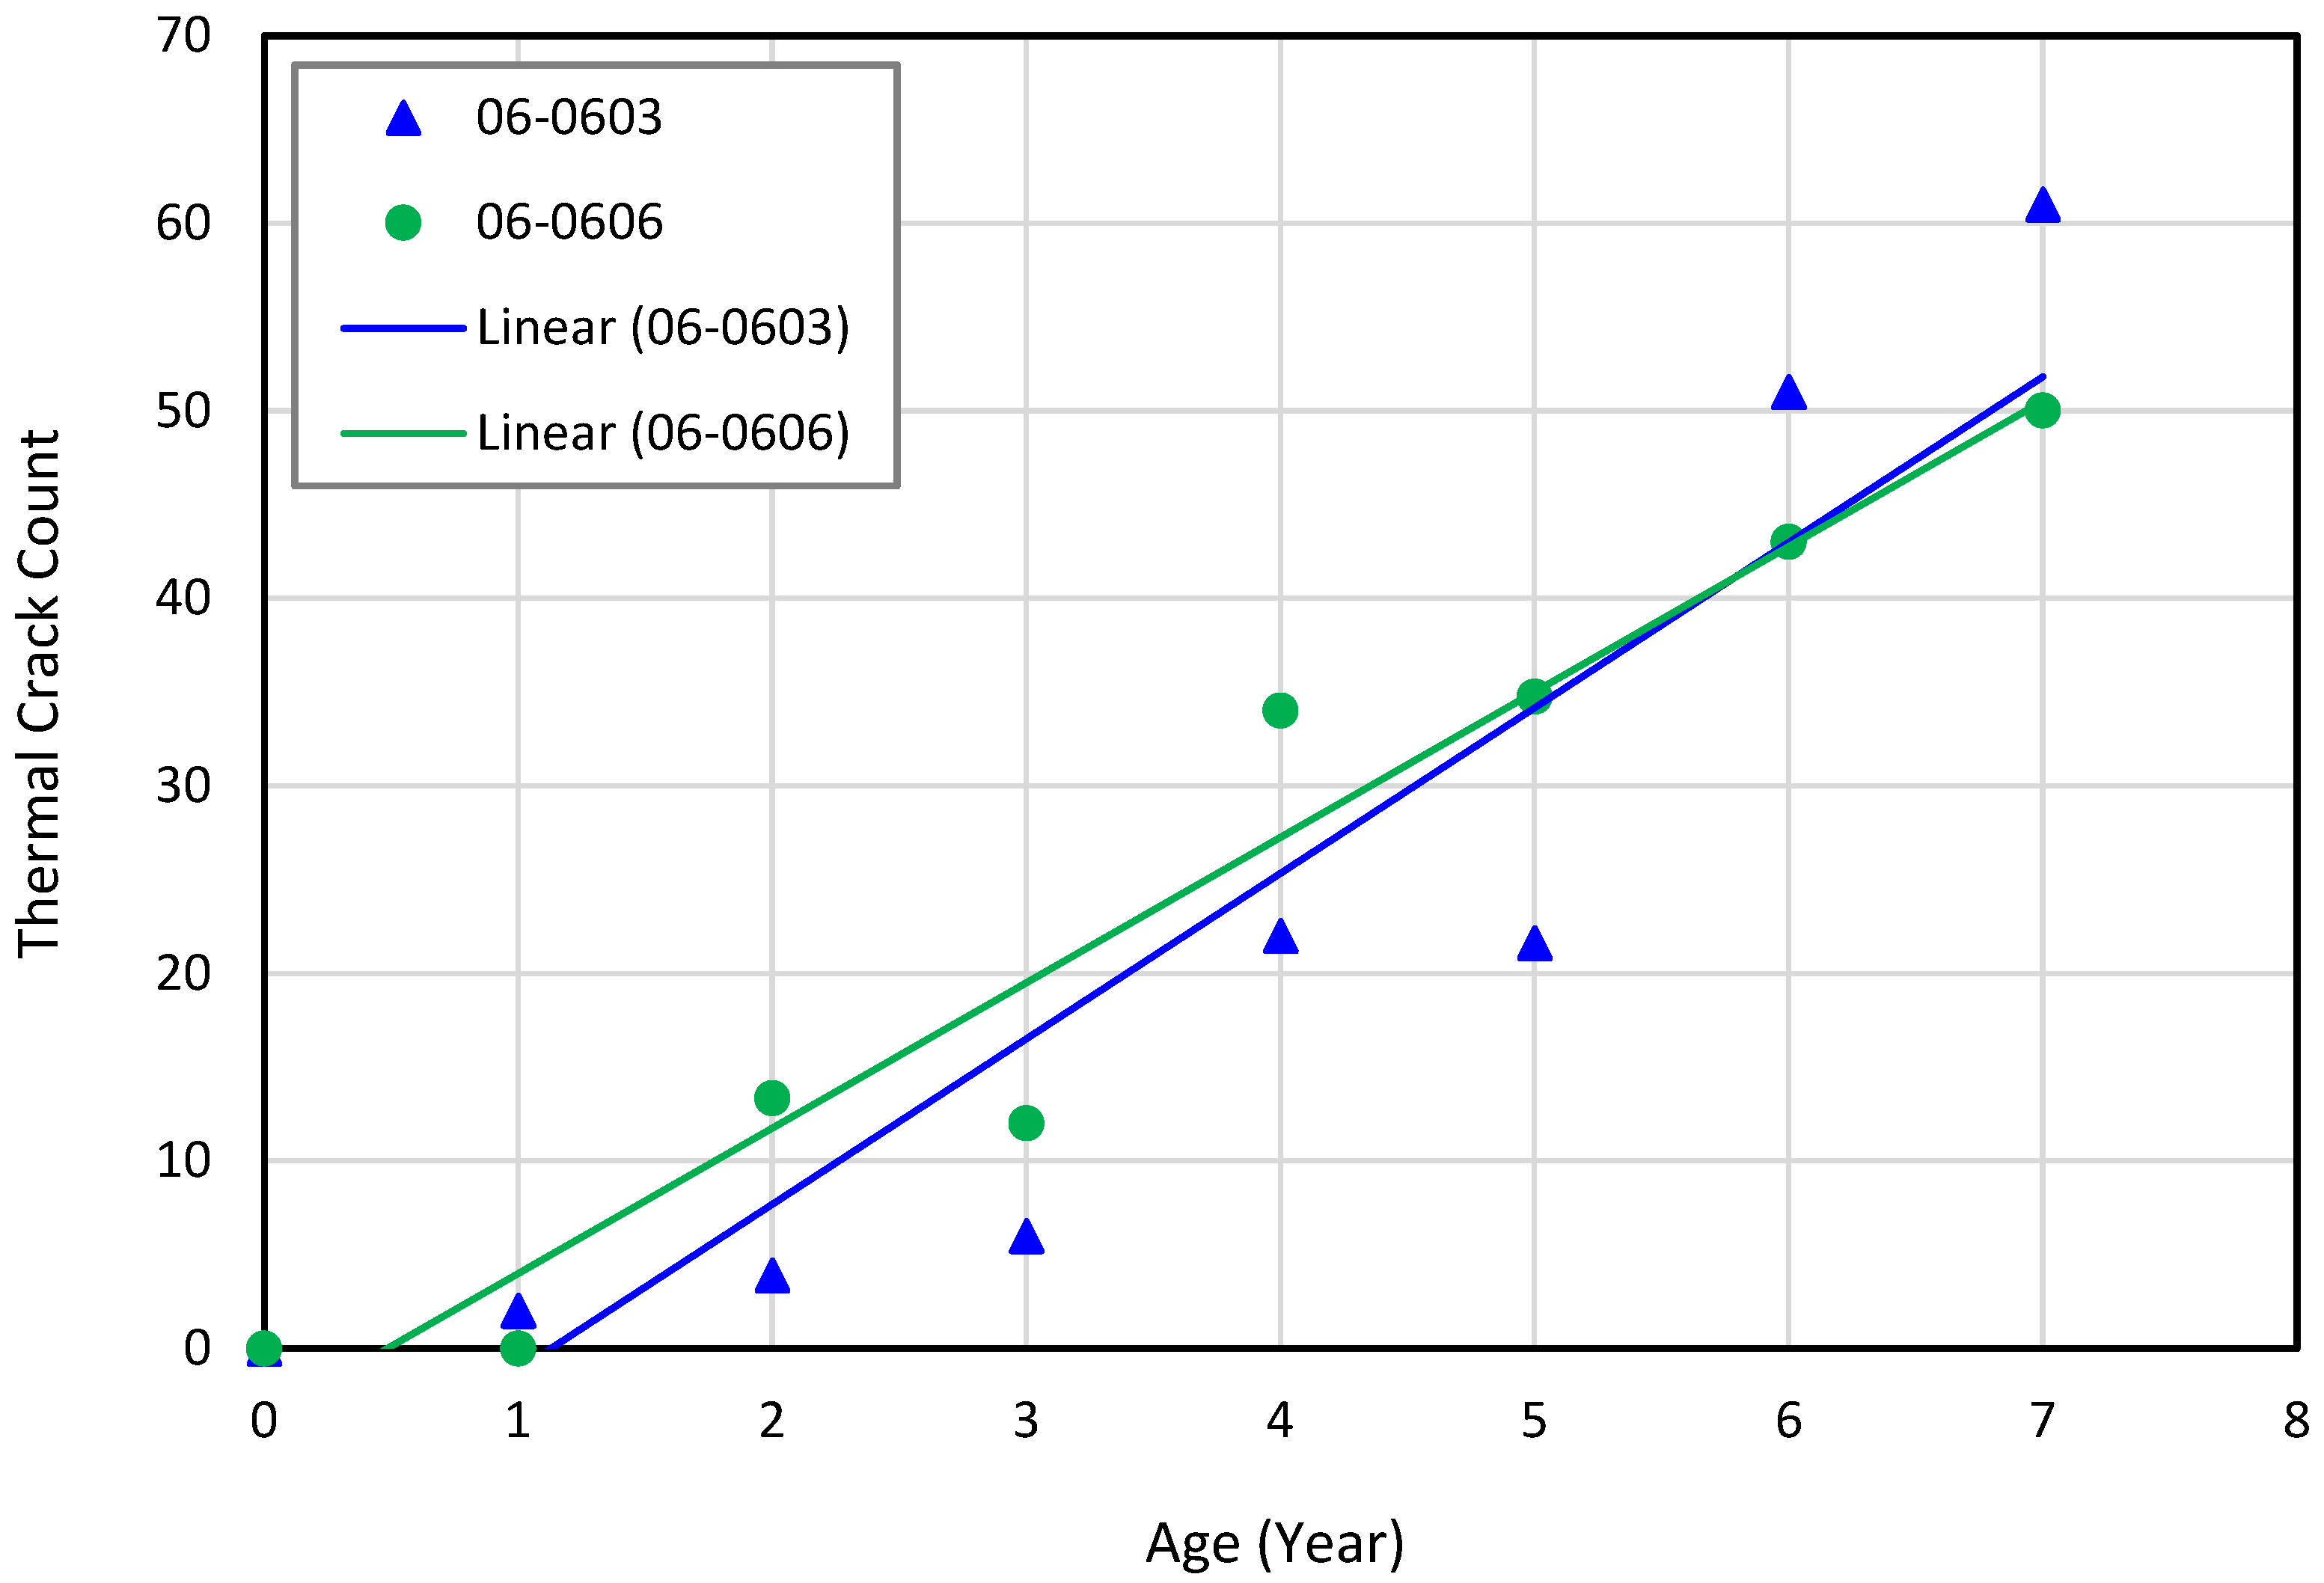
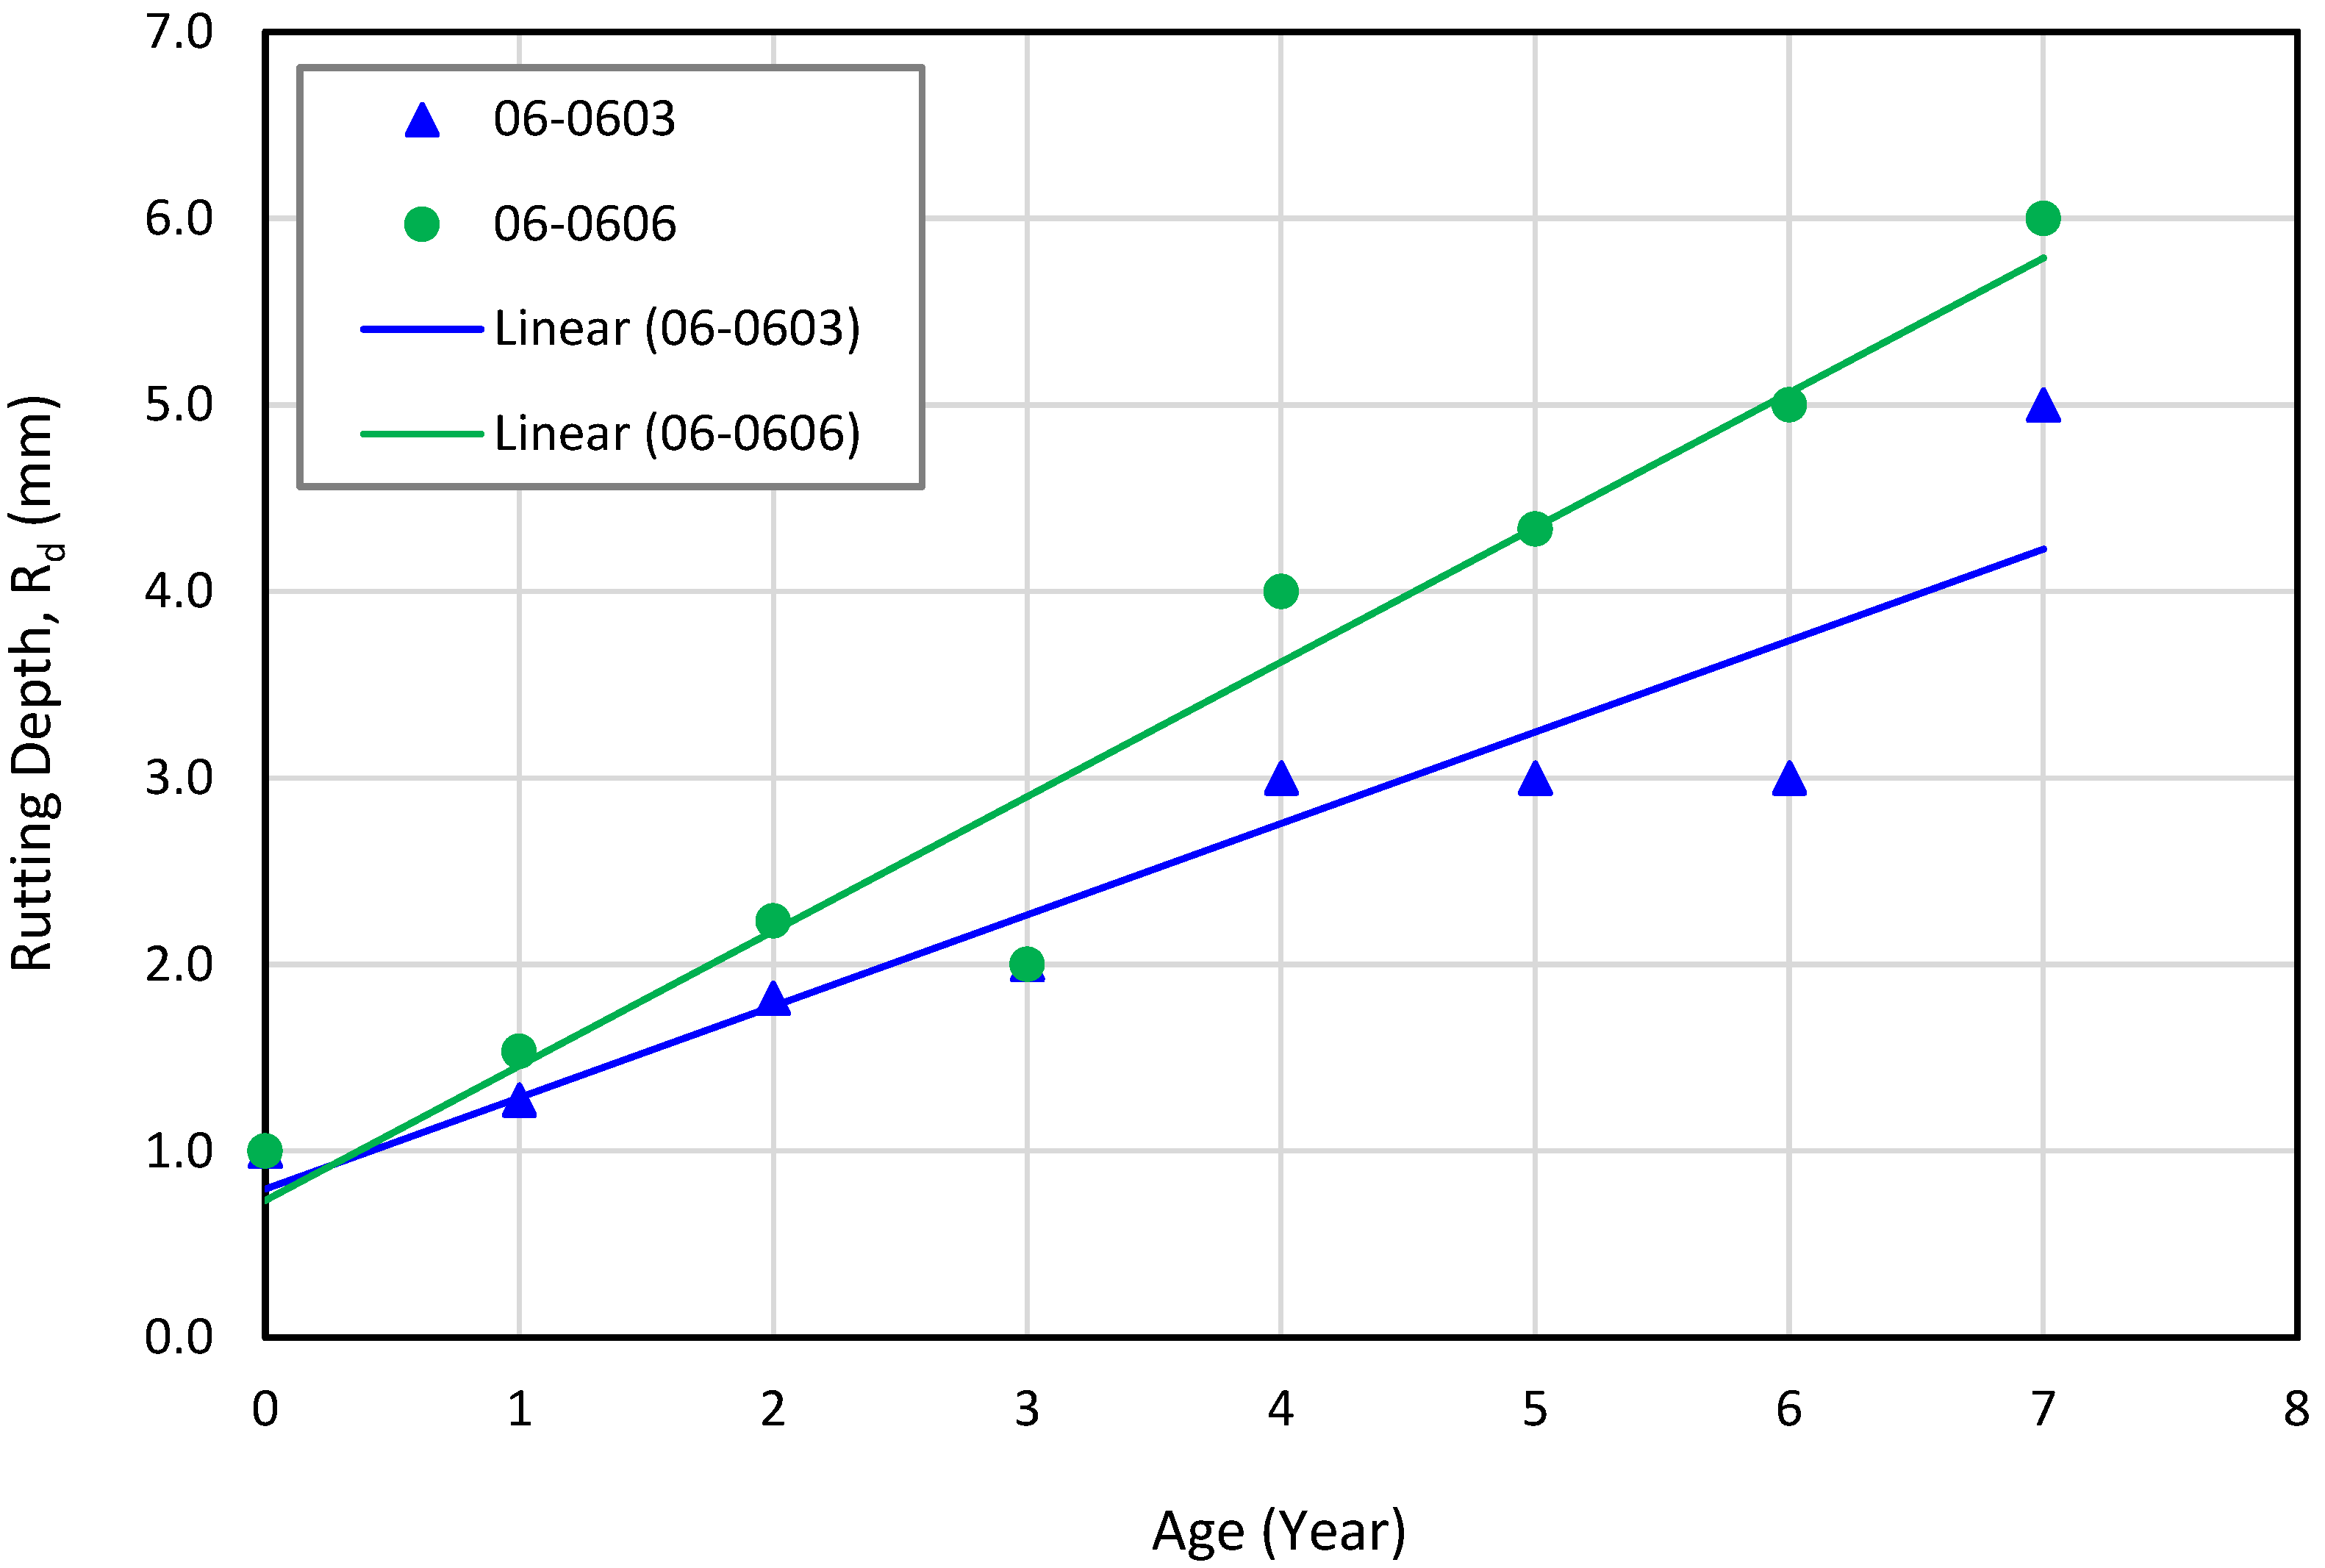
5.2. California (CA) Sections (06-0603 and 06-0606)

The performance of the CA sections was analyzed for the period from 1992 to 1999. The CA sections studied are composite pavement sections. These composite sections exhibited thermal cracking. They also showed instability rutting, which is caused by high tire–pavement contact shear stresses near the surface. The high stress and radial truck tires result in surface tension, which reduces confinement significantly [39,40].
Limited variation was noted in the transverse (thermal) cracking count by comparing the performances of 06-0603 and 06-0606. These two pavement sections are characterized by an identical climate condition, traffic load, and subgrade type. Transverse (thermal) cracks in non-freezing climate zones are typically classified as surface-initiated reflective cracks, especially in composite pavement sections [41]. Numerous scholars reported the possibility of the propagation of transverse (thermal) top-down cracks through the overlay surface to match the existing transverse (thermal) cracks in the lower pavement layer [42,43,44,45]. In the present study, the slight performance variation between the two CA sections resulted from the disparity in the thickness of the AC layer: 06-0603 is characterized by an additional 1.5” (38.3 mm) of AC on the surface pavement layer compared to 06-0606. However, the additional pavement thickness had an insignificant impact on the transverse or thermal crack count. Figure 8 presents the progression of thermal crack counts for the CA pavement sections.
The variation in the AC thickness in 06-0603 and 06-0606 had a significant impact on the pavement rutting. The execution of the statistical t-test, comparing the mean rutting in both pavement sections, resulted in a p-value of 0.01. Therefore, a significant improvement (at the 95% confidence level) was noted in rutting resistance through the additional 1.5” (38.3 mm) AC layer applied on 06-0603, which showed a lower rutting depth due to the reduced rutting progression. Figure 9 presents the rutting progression of both CA pavement sections throughout the analysis period.

6. Cross-State Analysis

The cross-state analysis compared the performance of pavement sections with low as well as high structural capacity from both states. The pavement sections with low structural capacity are 06-0606 (CA) and 36-A350 (NY): 06-0606 has a 3.3” (84.3 mm) dense-graded AC course and an 8.4” (214.5 mm) jointed PCC layer, whereas 36-A350 includes 0.8” (20.4 mm) of chip seal and a 2.6” (66.4 mm) dense-graded AC course on an 8” (204.3 mm) HMAC base. On the other hand, the pavement sections with high structural capacity are 06-0603 (CA) and 36-1643 (NY): 06-0603 has a 4.8” (122.6 mm) dense-graded AC course on an 8.2” (209.4 mm) jointed PCC layer, whereas 36-1643 includes three dense-graded AC layers of 5.1” (130.3 mm) above an 8.2” (209.4 mm) HMAC base. The AADTT on the NY pavement sections ranged from 600 to 800, while that on the CA pavement sections ranged from 2200 to 3300, in the analysis period considered in this study (see Figure 5). It should also be noted that the CA pavement sections are situated in a wet, non-freezing climate zone, while the NY pavement sections are sited in a wet, freezing climate zone. The temperatures and freezing indexes of the two climate zones are presented in Table 1.
The performance of the pavement sections located in CA and NY differed due to the variations in the traffic spectrum, structural capacity, and climate zone. In the present study, the impact of such factors was analyzed in respect of the rutting depth and thermal crack count. A statistical t-test was executed to determine the prevalence of the occurrences of rutting and thermal cracking.

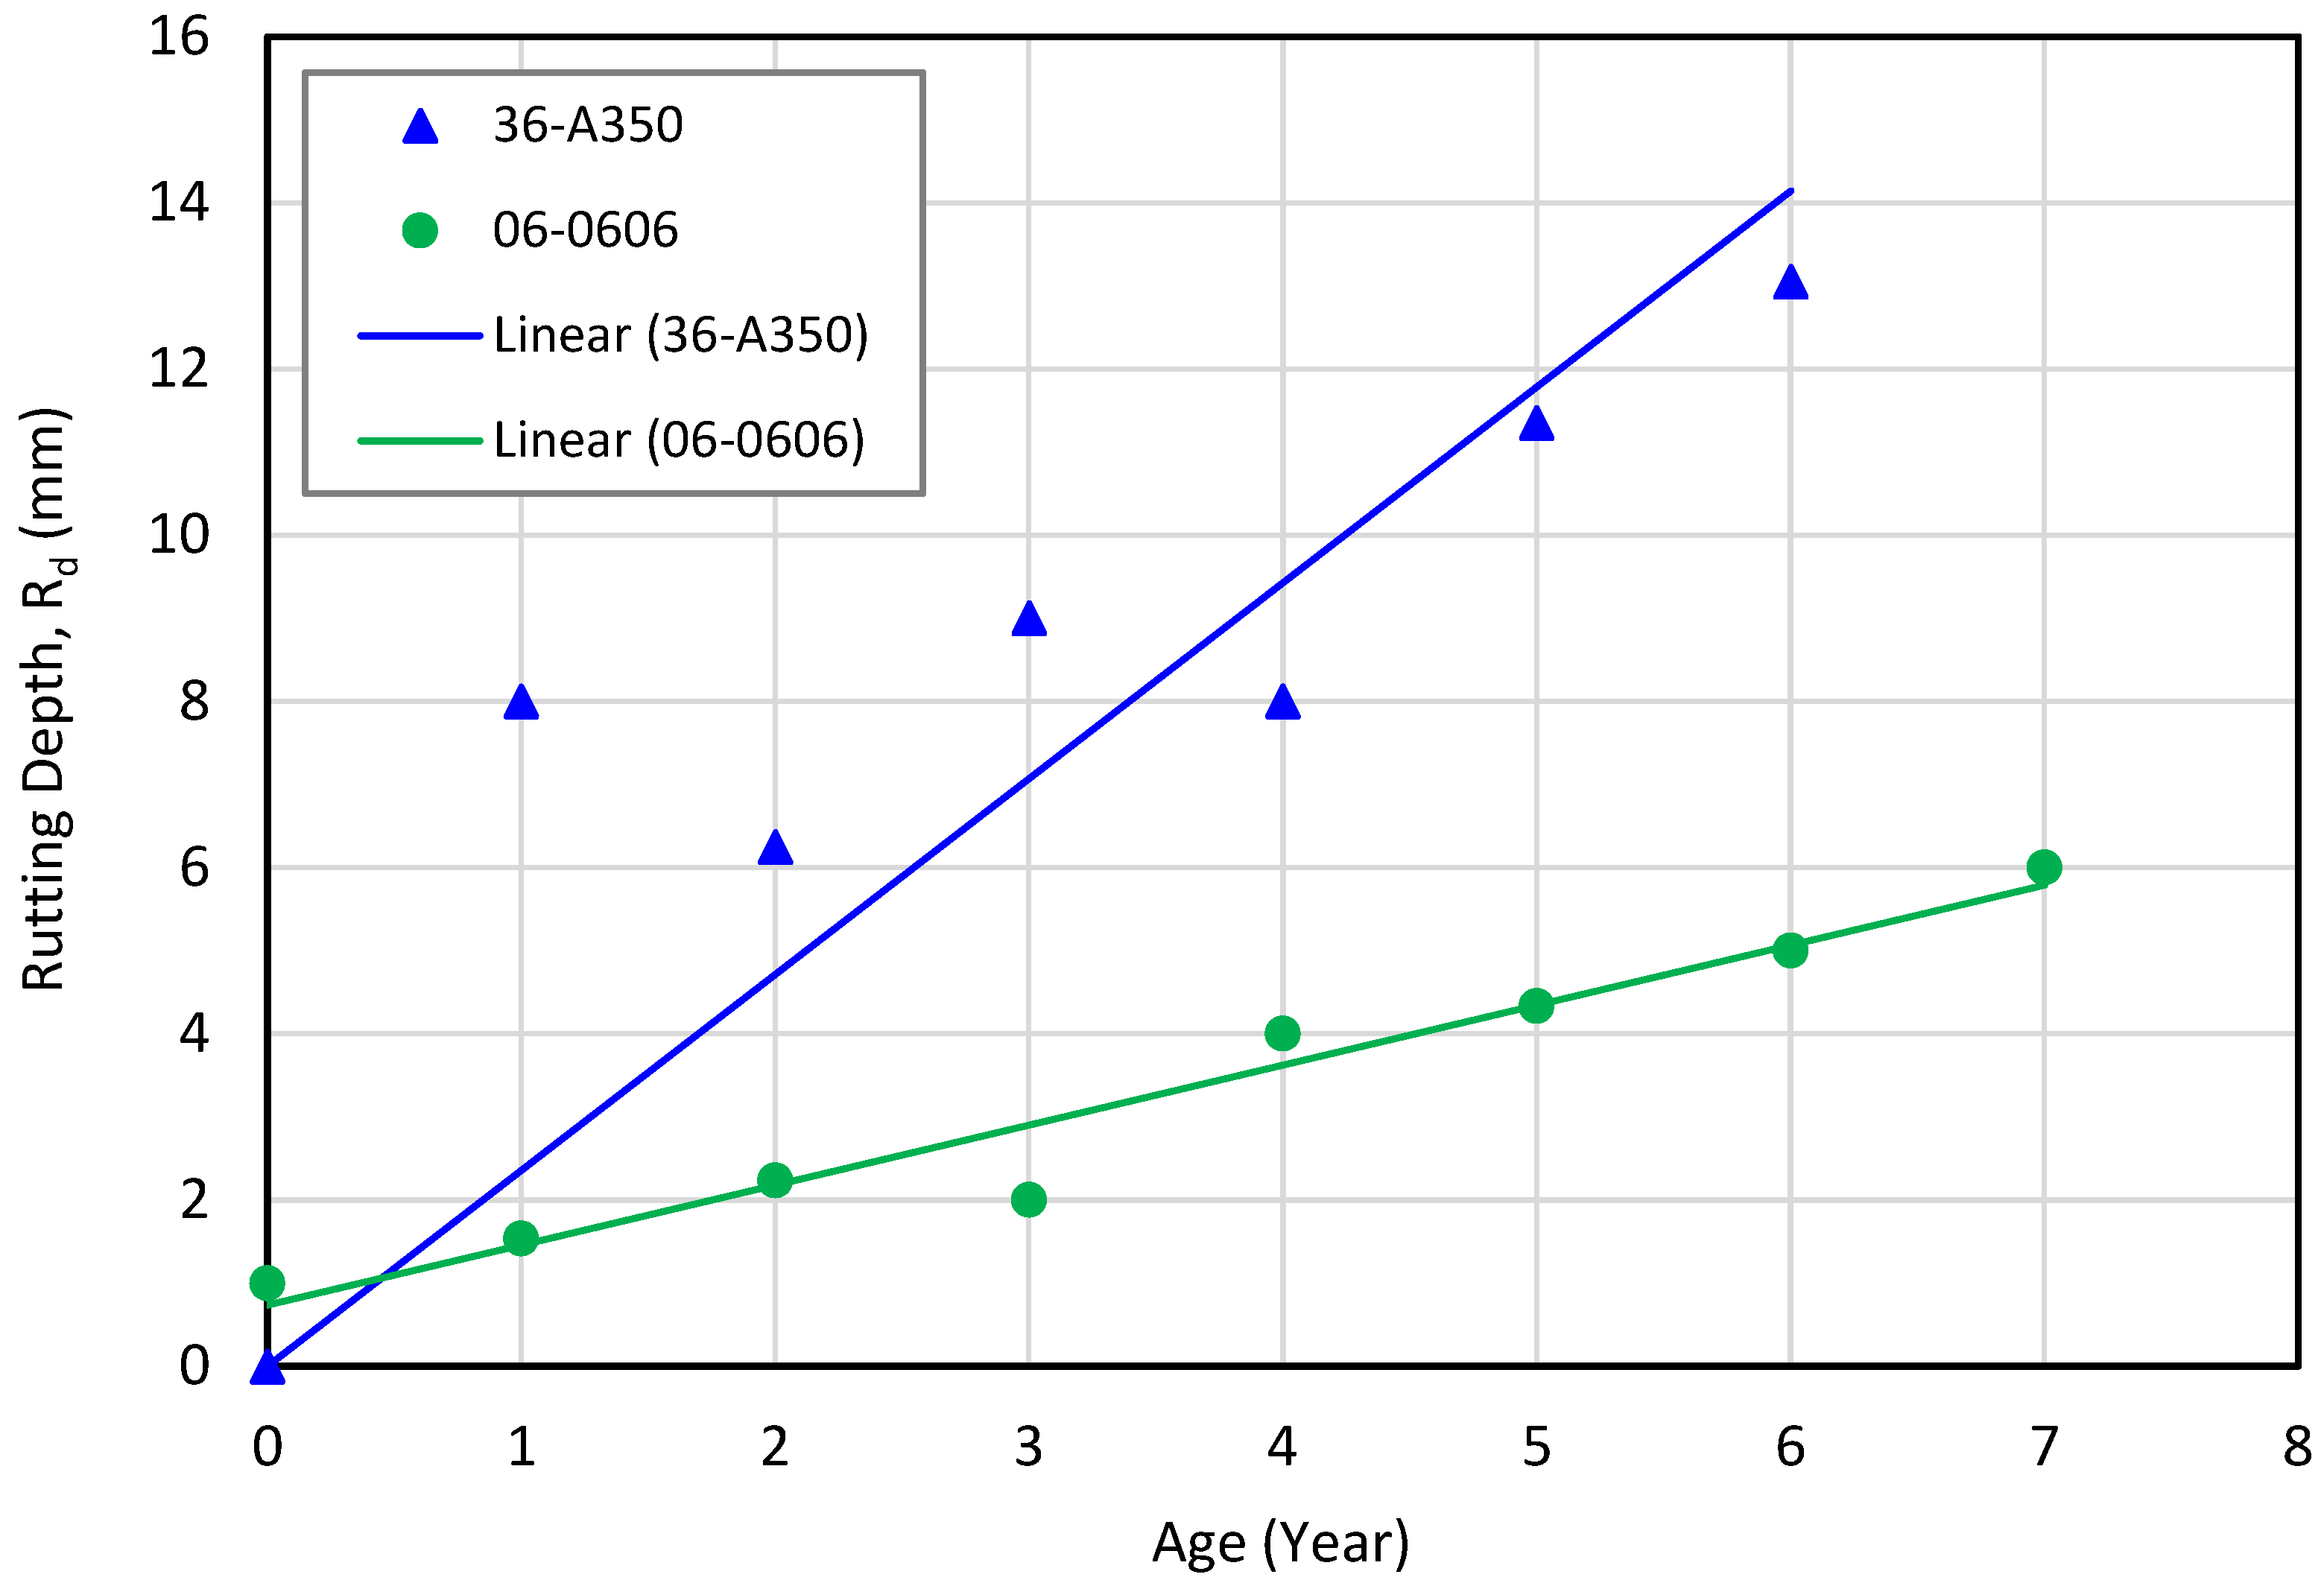
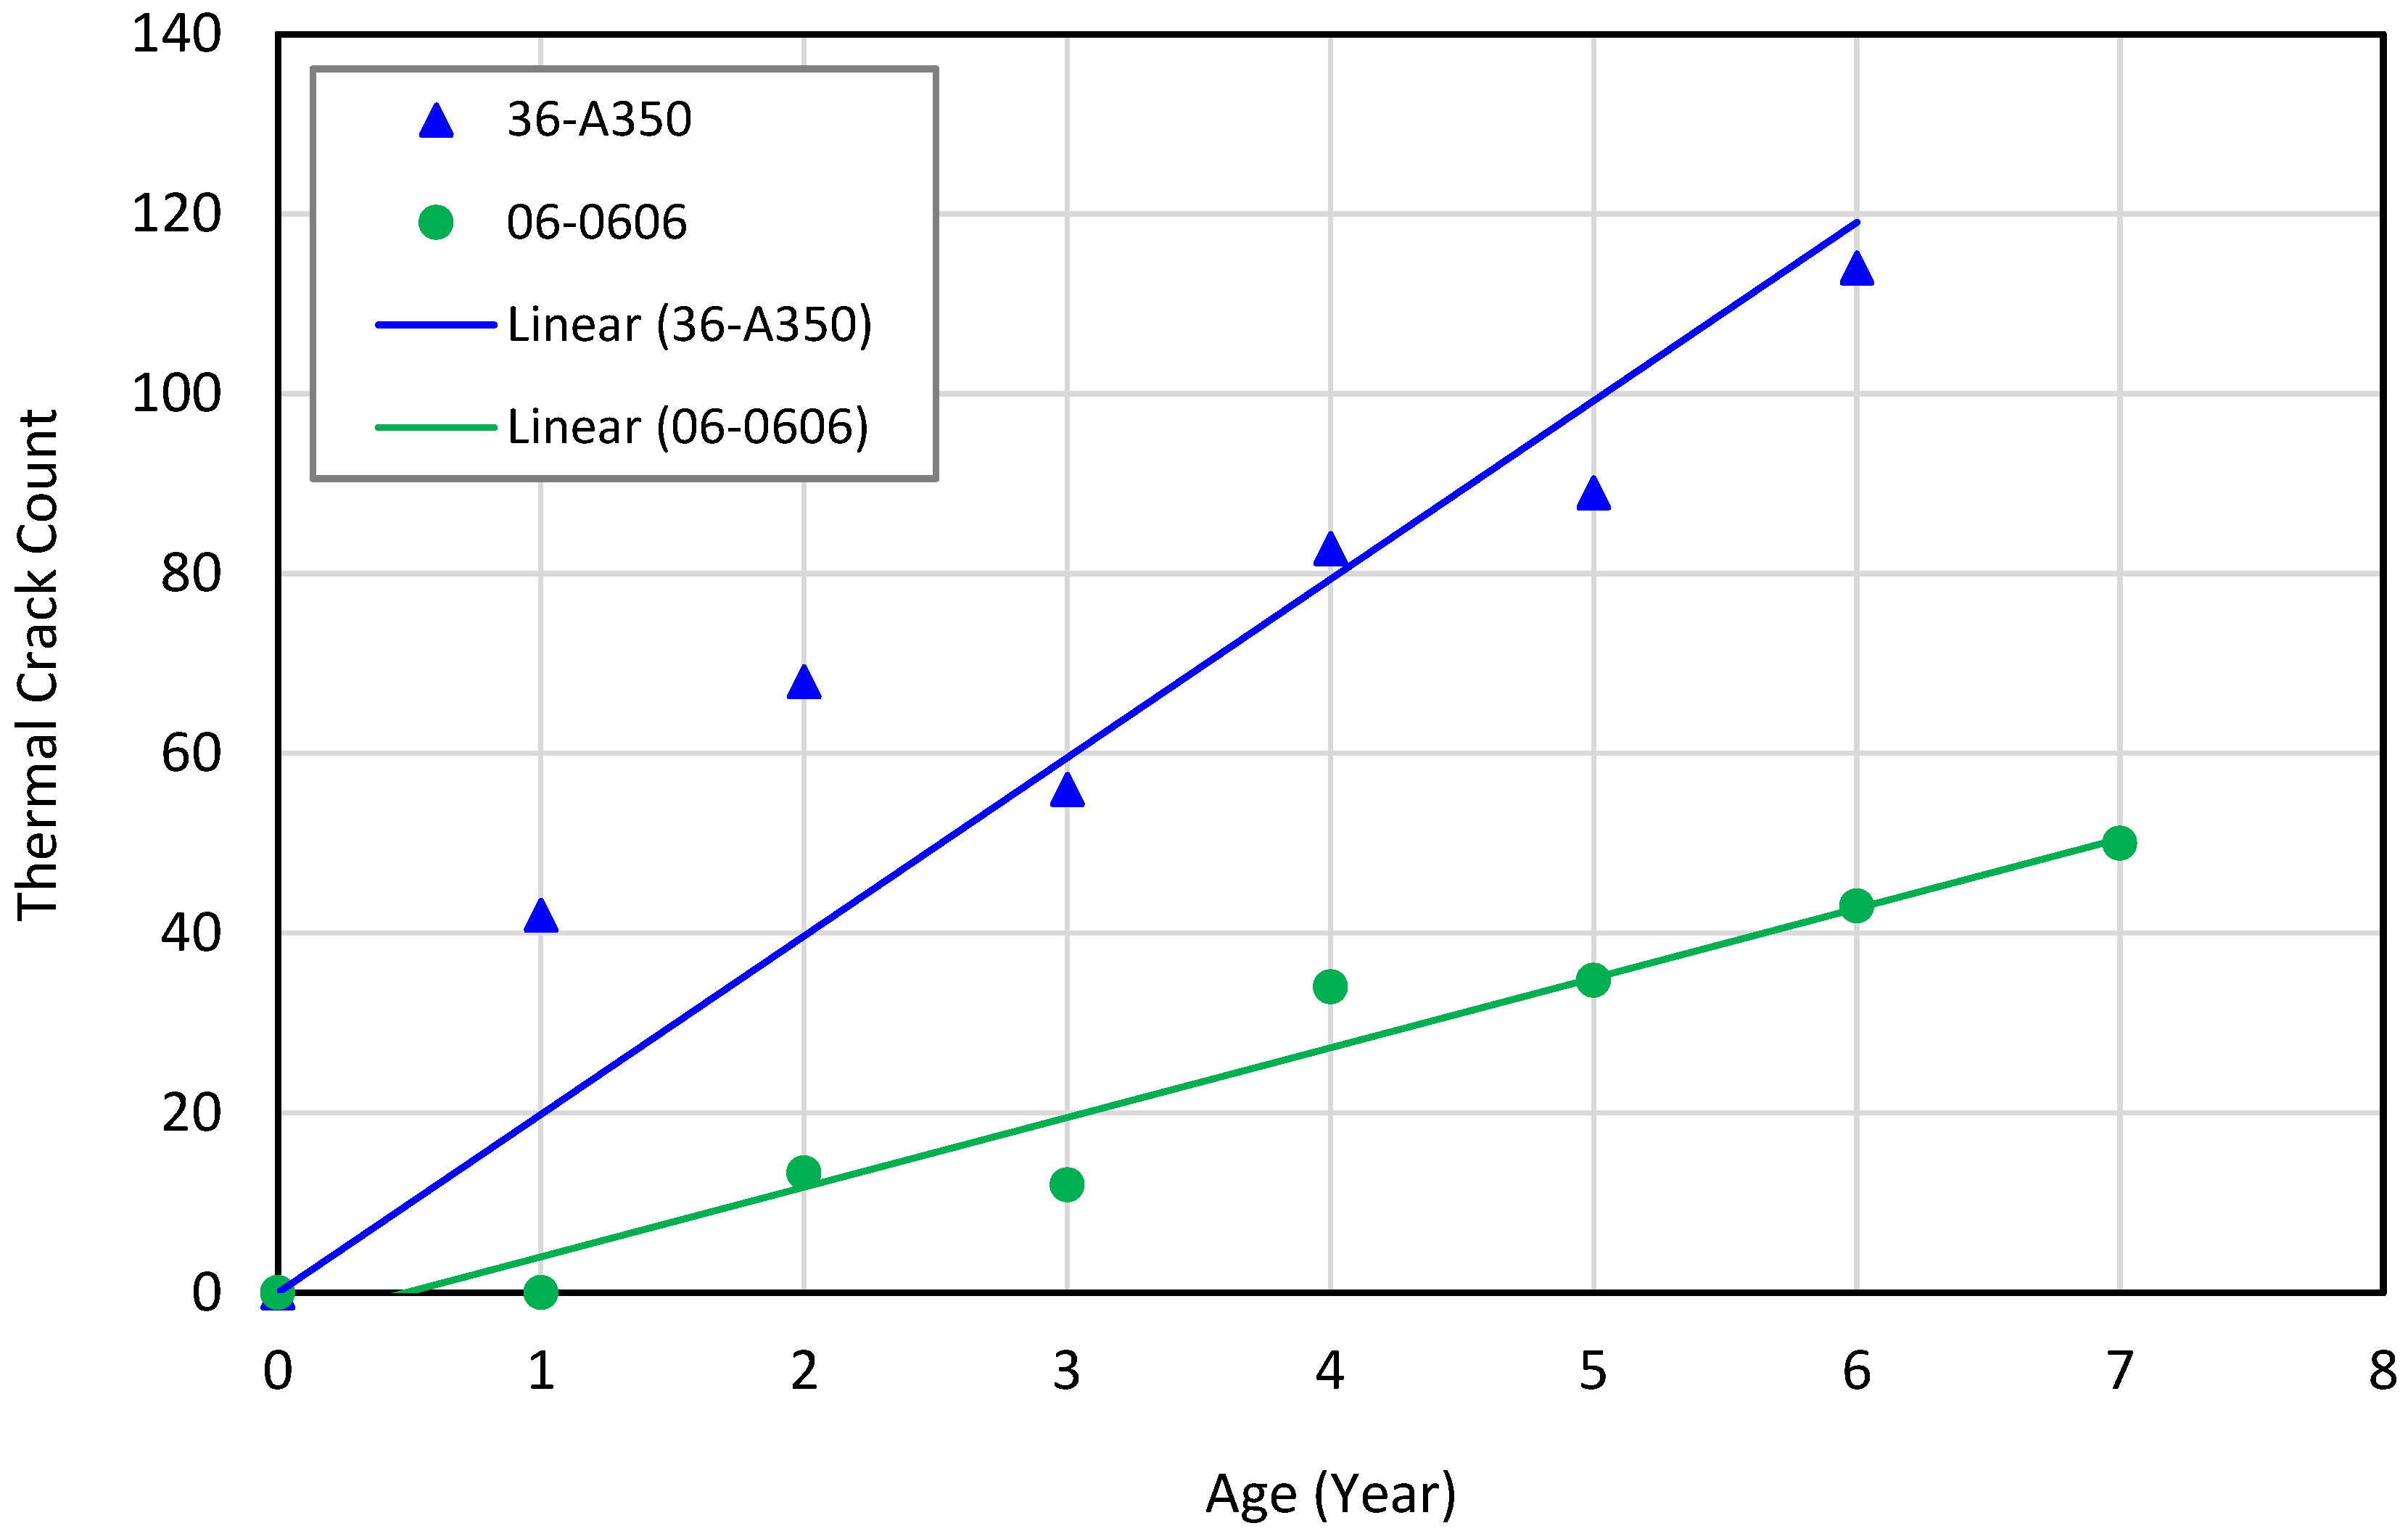
6.1. Low-Structural Capacity Sections (06-0606 and 36-A350)

The thermal crack counts on the pavement sections with low structural capacity are presented in Figure 10. This figure shows that the transverse or thermal crack count in the NY section (36-A350) was significantly higher than the crack count in the CA section (06-0606). In this case, the p-value for the statistical t-test was 0.002. This result was expected as the NY pavement section is situated in a wet, freezing climate zone, while the climate zone in CA is wet and non-freezing. In addition, this comparison proves that traffic loads would have no significant impact on the thermal crack progression in pavements. The AADTT on 36-A350 was much lower than that on 06-0606. However, the thermal or transverse cracks show the rapid deterioration of 36-A350, which is located in a wet–freezing climate zone, even when subjected to low AADTT. This result implies that the climate condition may aggravate pavement deterioration depending on the location. A similar finding was reported by Piryonesi and El-Diraby [24] for flexible pavements in Texas and Ontario.
The comparison between rutting in the pavement sections located in CA and NY illustrated a significantly high rutting depth in the NY section (36-A350) compared to the CA section (06-0606). In this case, the p-value for the statistical t-test was 0.003. The authors noted that the AADTT on 36-A350 was almost 75% lower than that on 06-0606. In addition, the location of 36-A350 in a wet–freezing climate zone would offer it a relative advantage with respect to rutting, compared to 06-0606, which is situated in a wet, non-freezing climate zone. The temperature in the location of the NY pavement section is relatively low, which would contribute to a lower degree of rutting. This is because the extent of rutting is lessened with a low pavement surface temperature [46]. However, the NY pavement section exhibited high rutting. The authors of this paper believe that the significantly high rutting depth of 36-A350 resulted from the 0.8” (20.4 mm) chip seal layer. This layer showed low resistance to rutting and thermal cracking. Figure 11 shows the progression of rutting on the pavement sections with low structural capacity.

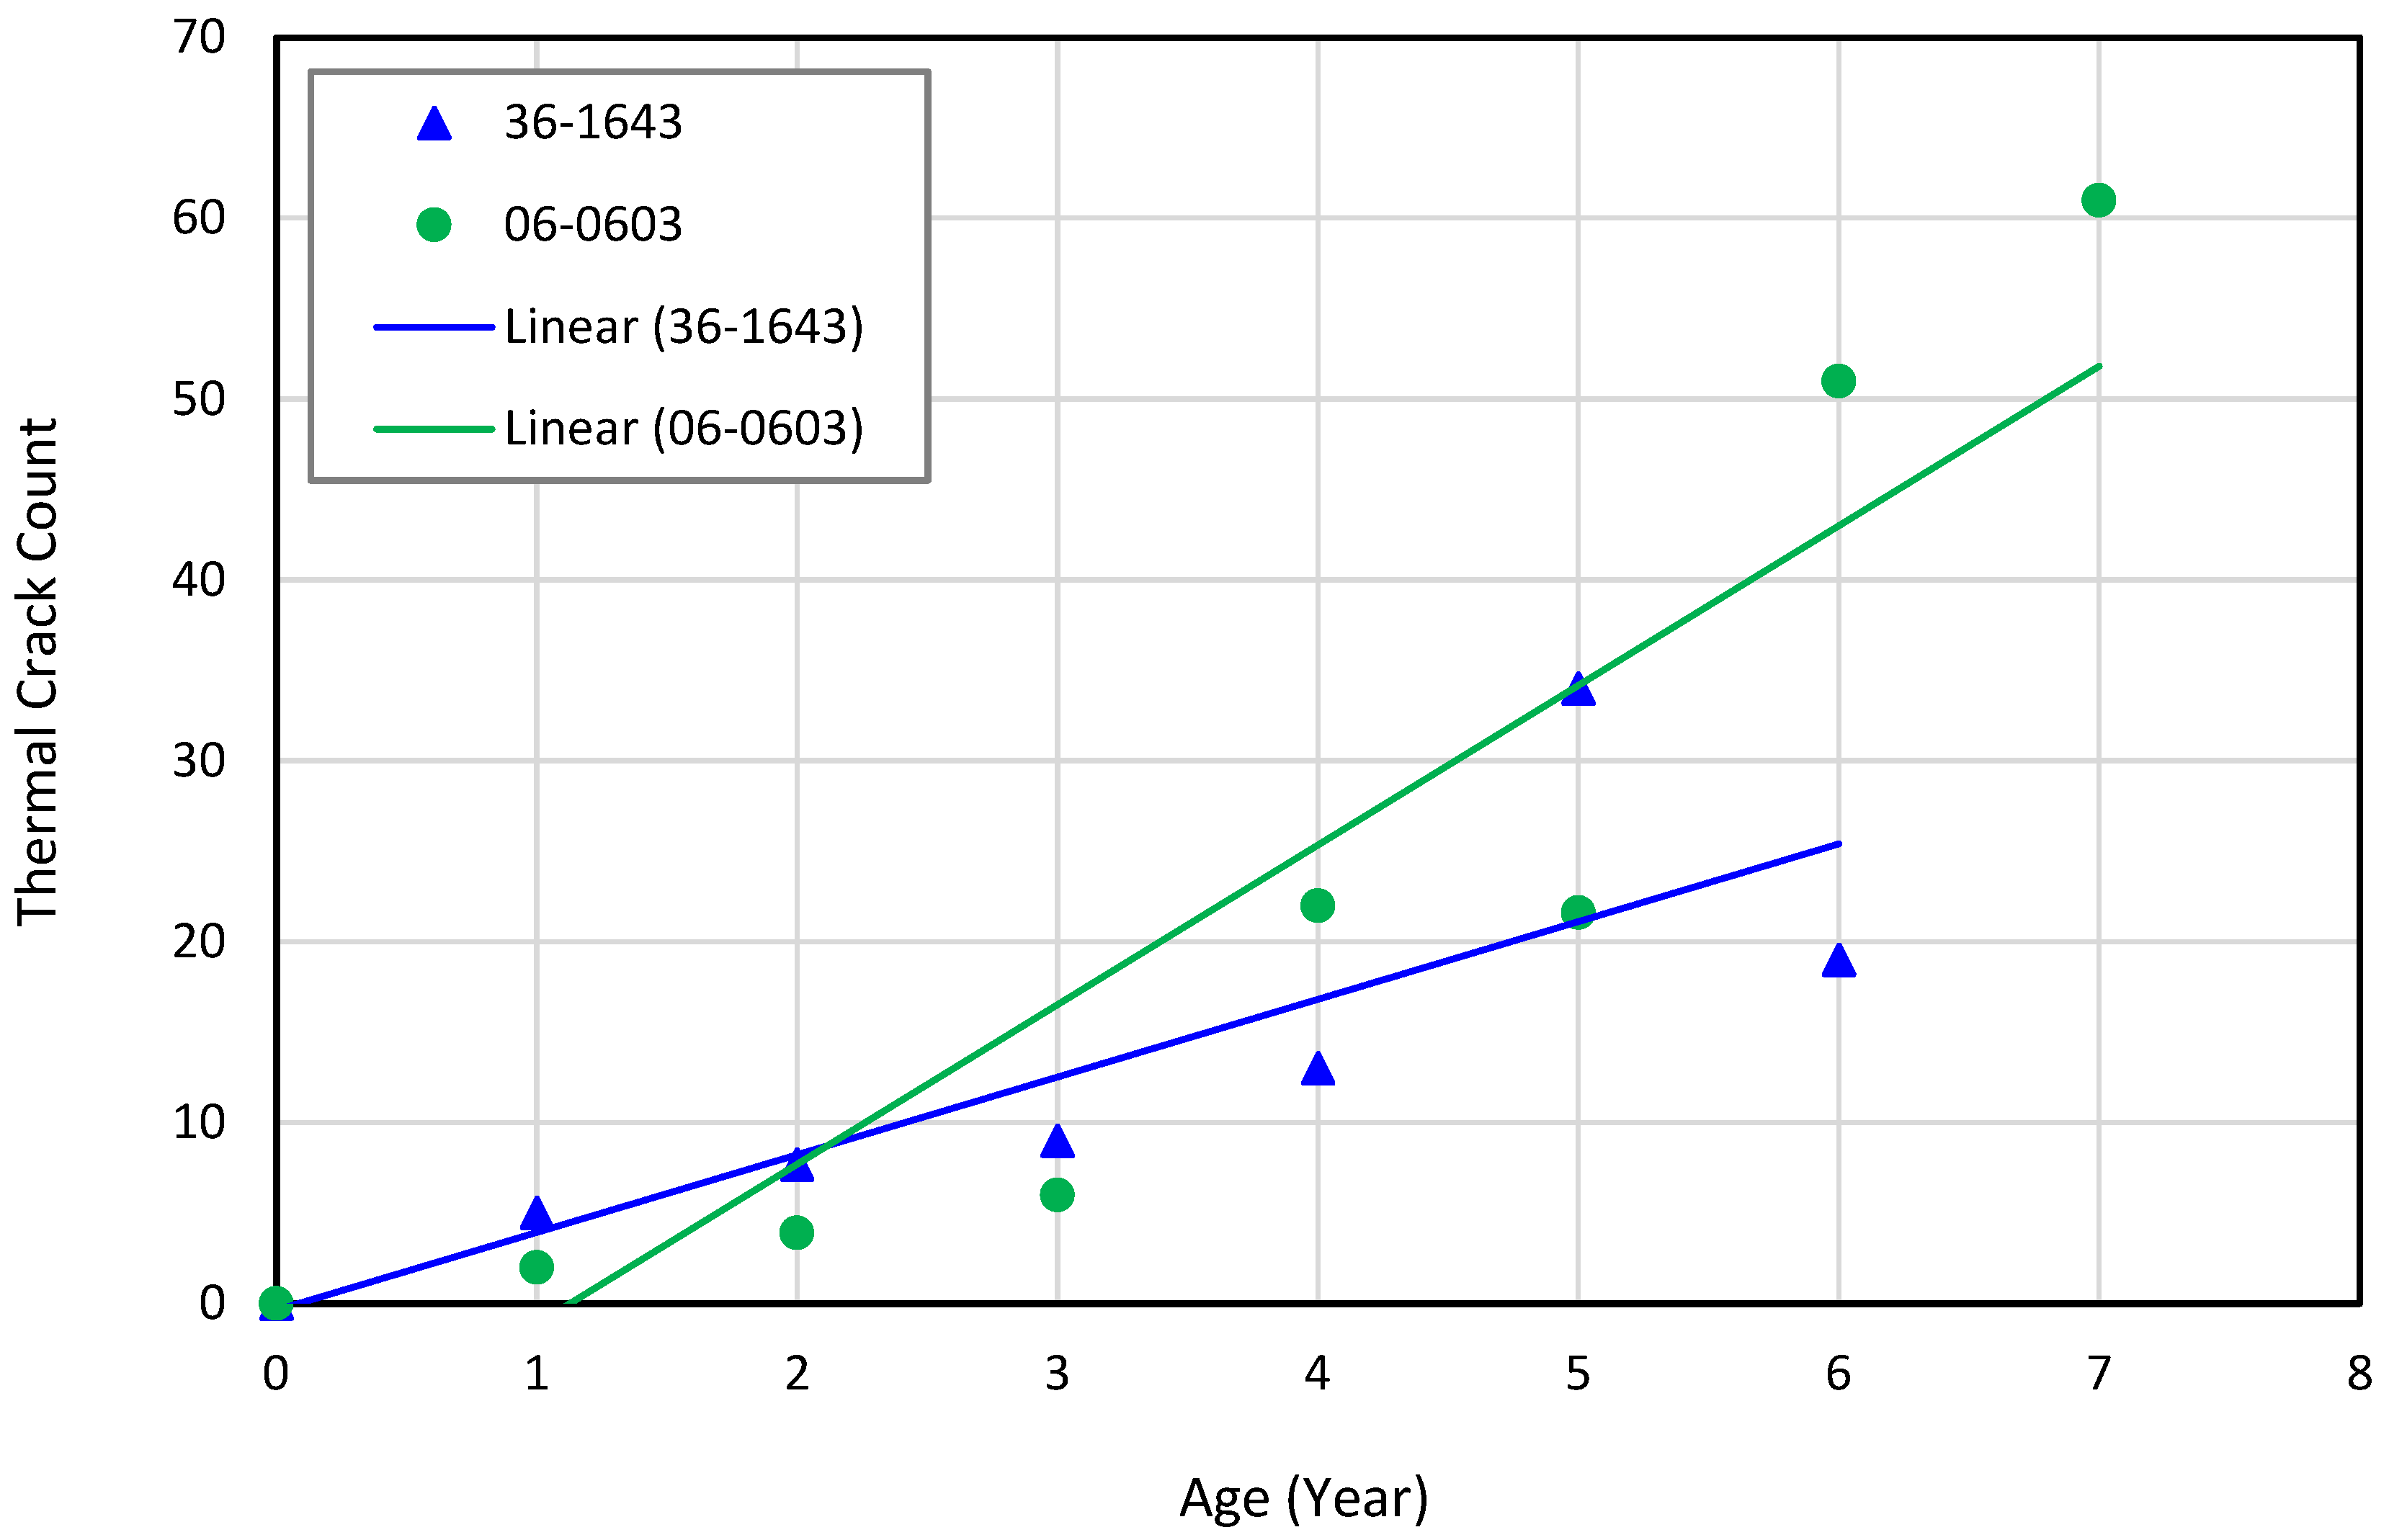
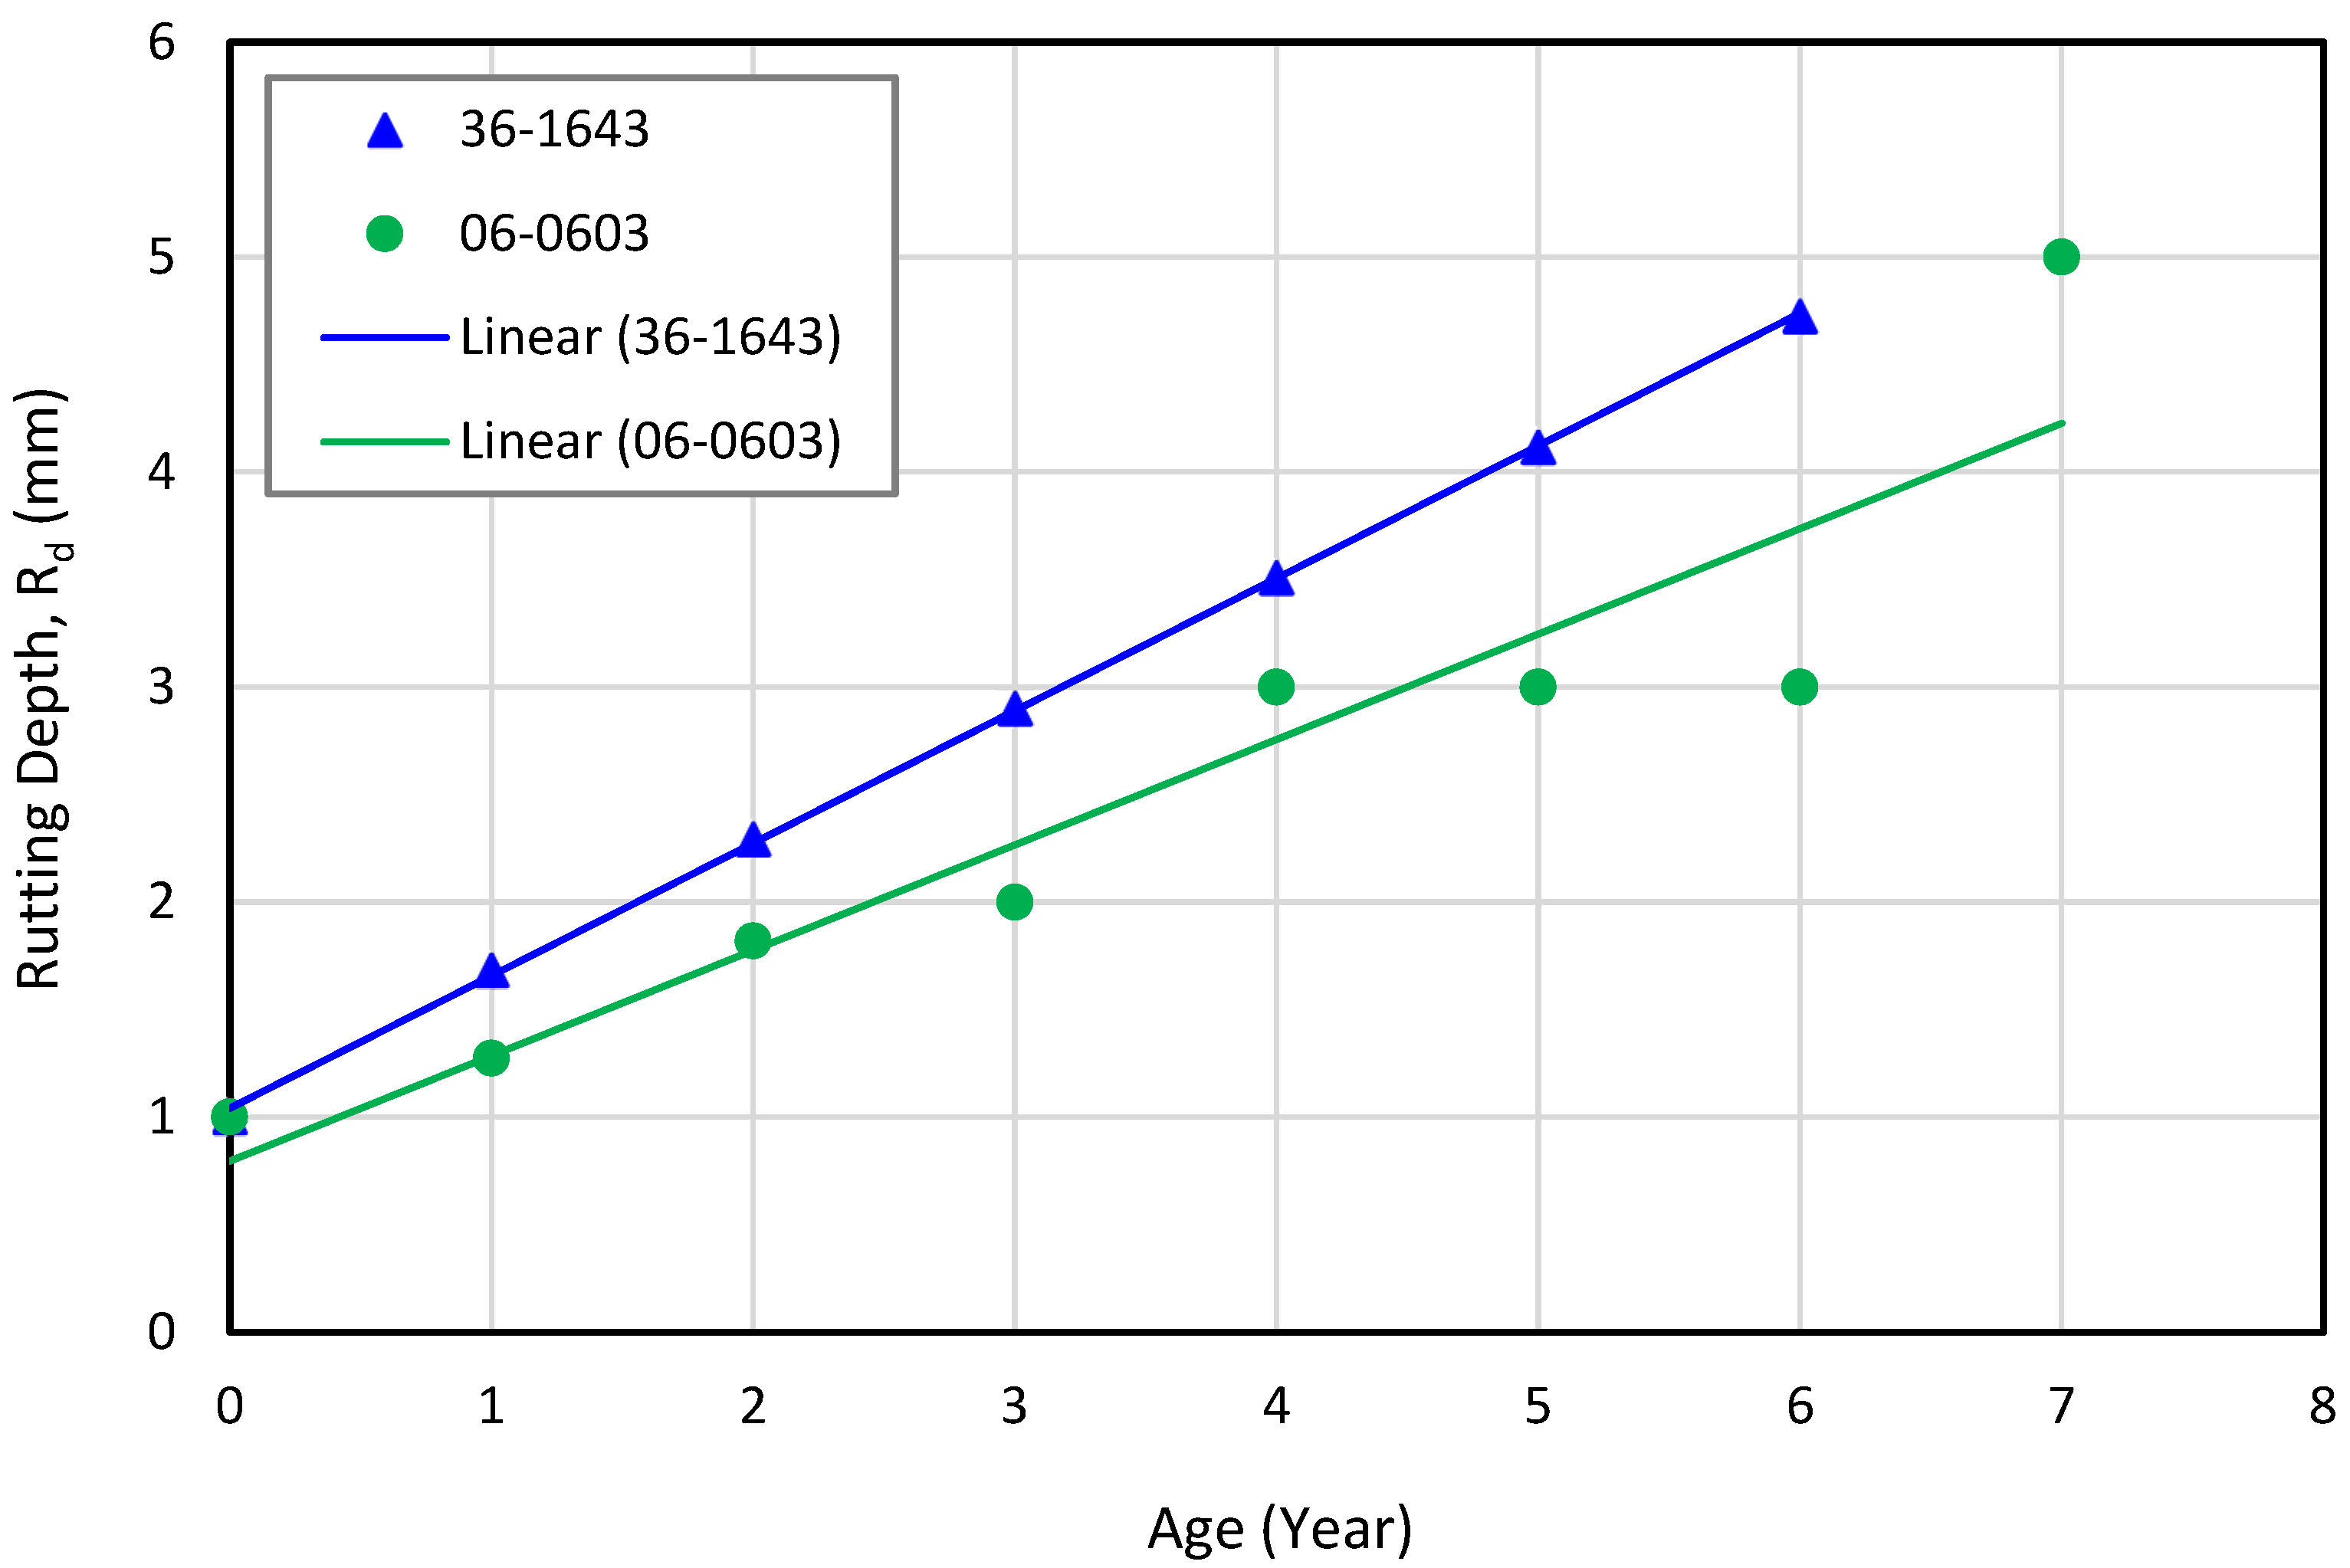
6.2. High-Structural Capacity Sections (06-0603 and 36-1643)

The thermal crack count in the pavement sections with high structural capacity indicated that the NY section (36-1643) had a slight advantage compared to the CA section (06-0603). The comparison between thermal cracks in both sections was conducted using a statistical t-test. In this case, the p-value was 0.048 (slightly lower than the 0.05 threshold). The thermal crack count was close during the first 5 years. However, for the CA section, the thermal crack count was relatively high at years 6 and 7, as the effect of temperature changes (e.g., freezing and thawing) increased with the pavement age. It should be mentioned that the thermal crack count at year 7 was not documented for the NY section. Based on the first 5 years of thermal crack count data, the authors can consider these two sections to have comparable performance in respect of thermal cracking. Nevertheless, the available data and the best-fit trendline suggest that the NY section exhibited less thermal cracking after year 5. Moreover, the overall results obtained for 36-1643 and 06-0603 also imply that the traffic load (AADTT) had no significant influence on thermal cracking. Figure 12 presents the thermal crack count on the pavement sections with high structural capacity.
The analysis of rutting in both pavement sections showed no statistical difference among the rutting depths. In this case, the p-value obtained from the t-test was 0.22. This result suggests a slight advantage for the CA section (06-0603) as it performed slightly better even though it was subjected to higher AADTT compared to the NY section (36-1643) and is located in a warmer climate zone. Figure 13 presents the progression of rutting on the pavement sections with high structural capacity.

7. Deterioration Models

Multiple linear regression analysis was performed to develop the deterioration models for the four LTPP test sections. Liner regression analysis was chosen due to the lower number of pavement sections and variables. The regression models were developed using the pavement service life (age), traffic load (AADTT), and climate impact (freezing index) as the independent variables. The data period covered for these variables was from 1992 to 1999 for the CA pavement sections and from 1995 to 2002 for the NY pavement sections.
The deterioration models developed are presented in Table 2. The results of the multiple linear regression analysis are reported along with the models’ r2 (coefficient of determination) and SE (standard error) values. The coefficient of determination generally measures the goodness of fit of a model. The authors obtained r2 values in the range of 0.82–0.99, which is an indication of reliable models. As a rule of thumb, an r2 value of 0.75 is considered substantial for structural model assessment [47]. However, the r2 value only indicates the in-sample explanatory power of a model—it does not say anything about the model’s predictive power [48]. From this standpoint, the SE can be used to assess a model’s predictive power. It provides a measure of how much the predicted values could differ from the mean of the actual values.
In the present study, the r2 values of the models developed from multiple linear regression analysis were relatively high, indicating greater in-sample accuracy. Piryonesi and El-Diraby [26] implied that simpler algorithms, such as linear regression, can contribute to achieving a higher accuracy for pavement performance modeling. However, a model with a higher r2 value may not always produce good predictions with a minimum error. It can be noted from Table 2 that several models with an r2 of ≥ 0.90 had a higher SE than the others within the range of 0.01–9.92. Therefore, both the r2 and SE values were used in this study to judge the accuracy of the models. Furthermore, it was noticed that the SE was higher for the thermal cracking models. This may be due to the higher number of independent variables considered for these models compared to the rutting models. The rutting models were developed using two independent variables (pavement age and AADTT). In contrast, the thermal cracking models were developed using three independent variables (pavement age, AADTT, and freezing index).
The deterioration models developed in this study were based on the pavement test sections through the LTPP program. The developed models will be applicable to other pavement sections with a similar structure, climate condition, and traffic spectrum. The models will be useful to predict the degree of rutting and thermal cracking in the selected pavement sections for years ahead, although they may not be applicable to identical pavement sections under different traffic and climate conditions in other locations.

8. Conclusions

This paper presented the results of a technical analysis of the performance of four LTPP test sections (two flexible and two composite pavements) located in CA and NY. The performance of the test sections was analyzed with respect to thermal cracking and rutting, focusing on the impacts of the traffic spectrum and climate condition. Furthermore, the influence of the structural capacity of the pavements was evaluated. The analysis was performed at two levels—in-state analysis and cross-state analysis. The performed analysis utilized fundamental statistics for controlled comparisons of the pavement sections.
The following conclusions can be drawn from the in-state analysis conducted on the performance of the flexible pavement sections located in NY:
  • The chip seal layer laid with a thickness of 0.8” (20.4 mm) showed low resistance to thermal cracking and rutting compared to the thin AC overlay;
  • The pavement section treated with a thin AC overlay had 0.07” (1.8 mm) of rutting after the first year of service, but the deterioration rate was low compared to the pavement section treated with a chip seal layer.
The following conclusions can be derived from the in-state analysis regarding the performance of the composite pavement sections located in CA:
  • Structural capacity had an insignificant impact on the thermal cracking in the pavement sections;
  • The additional 1.5” (38.3 mm) thickness of the AC layer resulted in a significant decrease in the rutting depth because of the lower rutting progression.
The cross-state analysis was performed by analyzing the pavement sections located in two different states (CA and NY) with comparable (low or high) structural capacities. The following conclusions can be drawn based on the results of the analysis conducted for the CA and NY pavement sections with low structural capacity:
  • A wet and freezing climate contributed to a higher degree of thermal cracking in the pavement section;
  • The chip seal layer had low resistance to thermal cracking, even when subjected to low traffic loads;
  • The ability of the chip seal layer to resist rutting was limited, even in a wet, freezing climate zone.
The following conclusions can be derived from the results of the cross-state analysis of the CA and NY pavement sections with high structural capacity:
  • Despite being subjected to higher truck loads (AADTT), the pavement section in the non-freezing climate zone exhibited slightly lower thermal cracking than the pavement section in the freezing climate zone;
  • The rutting resistance of the pavement sections in freezing and non-freezing climate zones was comparable with an insignificant difference, as confirmed by the result of the statistical t-test.
The deterioration models for thermal cracking and rutting in all LTPP test sections were developed using multiple linear regression analysis. The pavement age, AADTT, and freezing index were considered as the independent variables in developing the models. The coefficient of determination (r2) for the deterioration models developed fell in the range of 0.82–0.99, and the standard error (SE) varied from 0.01 to 9.92, suggesting that the models are reliable.

Author Contributions

Conceptualization, A.R., M.B., M.S. and M.E.-H.; methodology, A.R., M.B., M.S. and M.E.-H.; investigation, A.R. and M.B.; data curation, A.R. and M.B.; formal analysis, A.R., M.B., M.S. and M.E.-H.; project administration, M.E.-H.; software, A.R., M.B., M.S. and M.E.-H.; supervision, M.E.-H.; validation, M.S. and M.E.-H.; visualization, A.R., M.B., M.S. and M.E.-H.; writing—original draft preparation, A.R. and M.B.; writing—review and editing, M.S. and M.E.-H. All authors have read and agreed to the published version of the manuscript.

Funding

This research received no external funding.

Institutional Review Board Statement

Not applicable.

Informed Consent Statement

Not applicable.

Data Availability Statement

The data used in this study are publicly available.

Acknowledgments

The authors express their sincere gratitude to the Department of Civil and Environmental Engineering, Manhattan College, NY, USA, and the Angelo DelZotto School of Construction Management, George Brown College, Toronto, Canada, for providing the opportunity to carry out the study presented in this paper.

Conflicts of Interest

The authors declare no conflict of interest.

References

  1. Bhandari, S.; Luo, X.; Wang, F. Understanding the effects of structural factors and traffic loading on flexible pavement performance. Int. J. Transp. Sci. Technol. 2022; in press. [Google Scholar] [CrossRef]
  2. Gudipudi, P.; Underwood, S.; Zalghout, A. Impact of climate change on pavement structural performance in the United States. Transp. Res. D Transp. Environ. 2017, 57, 172–184. [Google Scholar] [CrossRef]
  3. Tamrakar, N.K. Overview on causes of flexible pavement distresses. Bull. Nepal Geol. Soc. 2019, 36, 245–250. [Google Scholar]
  4. Sarireh, M.K. Flexible pavement distress evaluation and analysis. Int. J. Adv. Res. Eng. 2016, 2, 1–7. [Google Scholar]
  5. Erlingsson, S. Rutting development in a flexible pavement structure. Road Mater. Pavement Des. 2012, 13, 218–234. [Google Scholar] [CrossRef]
  6. Safiuddin, M.; Tighe, S.L.; Uzarowski, L. Evaluation of stiffness to predict rutting resistance of hot-mix asphalt: A Canadian case study. Balt. J. Road Bridge Eng. 2014, 9, 283–296. [Google Scholar] [CrossRef]
  7. Ahmad, J.; Rahman, M.Y.A.; Hainin, M.R. Rutting evaluation of dense graded hot mix asphalt mixture. Int. J. Eng. Technol. 2011, 11, 56–60. [Google Scholar]
  8. Hu, S.; Zhou, F.; Scullion, T. Development, calibration, and validation of a new M-E rutting model for HMA overlay design and analysis. J. Mater. Civ. 2011, 23, 89–99. [Google Scholar] [CrossRef]
  9. Abdallah, I.; Nazarian, S. Strategies to Improve and Preserve Flexible Pavement at Intersections; FHWA/TX 10/0-5566-1; Center for Transportation Infrastructure Systems, the University of Texas at El Paso: El Paso, TX, USA, 2011. [Google Scholar]
  10. Federal Highway Administration (FHWA). Climate Change Adaptation for Pavements; FHWA-HIF-15-015; FHWA Office of Asset Management, Pavements and Construction, USA Department of Transportation: Washington, DC, USA, 2015.
  11. Ghos, S.; Ali, S.A.; Zaman, M.; Chen, D.H.; Hobson, K.; Behm, M. Evaluation of transverse cracking in flexible pavements using field investigation and AASHTOWare pavement ME design. Int. J. Pavement Res. Technol. 2021, 15, 561–576. [Google Scholar] [CrossRef]
  12. Mastin, N. NCDOT Digital Imagery Distress Evaluation Handbook; Version 1.0; Pavement Management Unit, North Carolina Department of Transportation: Raleigh, NC, USA, 2011.
  13. Ahmad, T.; Khawaja, H. Review of low-temperature crack (LTC) developments in asphalt pavements. Int. J. Multiphysics 2018, 12, 169–188. [Google Scholar]
  14. Ambaiowei, D.C.; Sanchez, X.; Safiuddin, M.; Tighe, S.L. Investigating thermal cracking potential of RAP incorporated HMA mixtures. In Proceedings of the 2013 TAC Conference, Winnipeg, MB, Canada, 22–25 September 2013. [Google Scholar]
  15. European Commission. COST 324: Long Term Performance of Pavements; Final Report (ISBN 92-828-0308-2); Publications Office of European Union: Luxembourg, 1997. [Google Scholar]
  16. European Commission. COST 333: Development of New Bituminous Pavement Design Method; Final Report (ISBN 92-828-6796-X); Publications Office of European Union: Luxembourg, 1999. [Google Scholar]
  17. Ling, M.; Luo, X.; Chen, Y.; Hu, S.; Lytton, R.L. A calibrated mechanics-based model for top-down cracking of asphalt pavements. Constr. Build. Mater. 2019, 208, 102–112. [Google Scholar] [CrossRef]
  18. Hernando, D.; Del Val, M.A. A comprehensive overview on main distress mechanisms in composite pavements. Int. J. Pavement Res. Technol. 2013, 6, 737–744. [Google Scholar]
  19. Von Quintus, H.L.; Finn, F.N.; Hudson, W.R.; Roberts, F.L. Flexible and Composite Structures for Premium Pavements: Vol. 1–Development of Design Procedure; FHWA-RD-81-154; Federal Highway Administration: Washington, DC, USA, 1979.
  20. National Cooperative Highway Research Program. Guide for Mechanistic-Empirical Design of New and Rehabilitated Pavement Structures; NCHRP 1-37A; Transportation Research Board: Washington, DC, USA, 2004. [Google Scholar]
  21. Flintsch, G.W.; Diefenderfer, B.K.; Nunez, O. Composite Pavement Systems: Synthesis of Design and Construction Practices; FHWA/VTRC 09-CR2; Virginia Transportation Research Council: Charlottesville, VA, USA, 2008. [Google Scholar]
  22. Fang, X. Development of Distress and Performance Models of Composite Pavements for Pavement Management. Doctoral Dissertation, The University of North Carolina at Charlotte, Charlotte, NC, USA, 2017. [Google Scholar]
  23. Piryonesi, S.M.; El-Diraby, T. Data analytics in asset management: Cost-effective prediction of the pavement condition index. J. Infrastruct. Syst. 2020, 26, 04019036. [Google Scholar] [CrossRef]
  24. Piryonesi, S.M.; El-Diraby, T. Climate change impact on infrastructure: A machine learning solution for predicting pavement condition index. Constr. Build. Mater. 2021, 306, 124905. [Google Scholar] [CrossRef]
  25. Gong, H.; Sun, Y.; Shu, X.; Huang, B. Use of random forests regression for predicting IRI of asphalt pavements. Constr. Build. Mater. 2018, 189, 890–897. [Google Scholar] [CrossRef]
  26. Piryonesi, S.M.; El-Diraby, T. Using machine learning to examine impact of type of performance indicator on flexible pavement deterioration modeling. J. Infrastruct. Syst. 2021, 27, 04021005. [Google Scholar] [CrossRef]
  27. Federal Highway Administration (FHWA). Long Term Pavement Performance Program: Accomplishments and Benefits 1989–2009; FHWA-HRT-10-071; Turner Fairbank Highway Research Center: McLean, VA, USA, 2009.
  28. Federal Highway Administration (FHWA). Results of Long-Term Pavement Performance SPS-3 Analysis: Preventive Maintenance of Flexible Pavements; FHWA-HRT-11-049; Turner-Fairbank Highway Research Center: McLean, VA, USA, 2011.
  29. Morian, D.A.; Gibson, S.D.; Epps, J.A. Maintaining Flexible Pavements—The Long-Term Pavement Performance Experiment SPS-3: 5-Year Data Analysis; FHWA-RD-97-102; Turner-Fairbank Highway Research Center: McLean, VA, USA, 1998.
  30. Federal Highway Administration (FHWA). SPS-6: Rehabilitation of Jointed Portland Cement Concrete Pavements: Construction Report; FHWA-AZ92-379-II; Arizona Department of Transportation: Phoenix, AZ, USA, 1992.
  31. Hall, K.T.; Correa, C.E.; Simpson, A.L. LTPP Data Analysis: Effectiveness of Maintenance and Rehabilitation Options; NCHRP Web Document 47 (Project 20-50(3/4)); National Cooperative Highway Research Program: Washington, DC, USA, 2002.
  32. Elkins, G.E.; Thompson, T.; Simpson, A.; Ostrom, B. Long-Term Pavement Performance Information Management System Pavement Performance Database User Reference Guide; FHWA-RD-03-088; Turner-Fairbank Highway Research Center: McLean, VA, USA, 2012.
  33. LTPP InfoPave. U.S. Department of Transportation, Federal Highway Administration; Turner-Fairbank Highway Research Center: McLean, VA, USA. Available online: https://infopave.fhwa.dot.gov/ (accessed on 31 July 2017).
  34. Weather Underground. The Weather Company, Brookhaven, GA, USA. Available online: https://www.wunderground.com (accessed on 31 July 2017).
  35. Pavement Interactive. Freezing and Thawing Indexes. Available online: http://www.pavementinteractive.org/calculation-offrost-depth/ (accessed on 31 July 2017).
  36. Mahoney, J.P.; Rutherford, M.S.; Hicks, R.G. Guidelines for Spring Highway Use Restrictions; FHWA-TS-87-209; Turner-Fairbank Highway Research Center: McLean, VA, USA, 1987.
  37. Naiel, K. Flexible Pavement Rut Depth Modeling for Different Climate Zones. Ph.D. Thesis, Department of Civil and Environmental Engineering, Wayne State University, Detroit, MI, USA, 2010. [Google Scholar]
  38. Wang, H.; Zhou, Z.; Huang, W.; Dong, X. Investigation of asphalt mixture permanent deformation based on three-dimensional discrete element method. Constr. Build. Mater. 2021, 272, 121808. [Google Scholar] [CrossRef]
  39. Drakos, C.A.; Roque, R.; Birgisson, B. Effects of measured tire contact stresses on near-surface rutting. Transp. Res. Rec. 2001, 1764, 59–69. [Google Scholar] [CrossRef]
  40. Novak, M.; Birgisson, B.; Roque, R. Tire contact stresses and their effects on instability rutting of asphalt mixture pavements. Transp. Res. Rec. 2003, 1853, 150–156. [Google Scholar] [CrossRef]
  41. Zhang, W. Evaluation of Field Transverse Cracking of Asphalt Pavements. Ph.D. Thesis, Department of Civil and Environmental Engineering, Washington State University, Pullman, WA, USA, 2015. [Google Scholar]
  42. Nesnas, K.; Nunn, M. A model for top-down reflection cracking in composite pavements. In Proceedings of the Fifth International RILEM Conference on Reflective Cracking in Pavements, Limoges, France, 5 May 2004; pp. 409–416. [Google Scholar]
  43. Bennert, T.; Worden, M.; Turo, M. Field and laboratory forensic analysis of reflective cracking on Massachusetts Interstate 495. Transp. Res. Rec. 2009, 2126, 27–38. [Google Scholar] [CrossRef]
  44. Shen, S.H.; Zhang, W.G.; Wang, H.; Huang, H. Numerical evaluation of surface-initiated cracking in flexible pavement overlays with field observations. Road Mater. Pavement Des. 2016, 18, 221–234. [Google Scholar] [CrossRef]
  45. Zhang, W.; Khan, A.R.; Shen, S.; Gao, Y. Laboratory validation of surface-initiated transverse cracking of asphalt pavement. Appl. Sci. 2020, 10, 1002. [Google Scholar] [CrossRef] [Green Version]
  46. Kandhal, P.; Cooley, L.A., Jr. Accelerated Laboratory Rutting Tests: Evaluation of the Asphalt Pavement Analyzer; NCHRP Report 508; Transportation Research Board: Washington, DC, USA, 2003. [Google Scholar]
  47. Hair, J.F., Jr.; Hult, G.T.M.; Ringle, C.M.; Sarstedt, M.; Danks, N.P.; Ray, S. Partial Least Squares Structural Equation Modeling (PLS-SEM) Using R; Springer: Cham, Switzerland, 2021. [Google Scholar]
  48. Hair, J.F.; Sarstedt, M. Explanation plus prediction—The logical focus of project management research. Proj. Manag. J. 2021, 52, 319–322. [Google Scholar] [CrossRef]
Figure 1. Pavement cross-section of LTPP test section 36-1643 (not in scale; data source: [33]).
Infrastructures 07 00100 g001
Figure 2. Pavement cross-section of LTPP test section 36-A350 (not in scale; data source: [33]).
Infrastructures 07 00100 g002
Figure 3. Pavement cross-section of LTPP test section 06-0603 (not in scale; data source: [33]).
Infrastructures 07 00100 g003
Figure 4. Pavement cross-section of LTPP test section 06-0606 (not in scale; data source: [33]).
Infrastructures 07 00100 g004
Figure 5. AADTT in NY and CA pavement sections (data source: [33]).
Infrastructures 07 00100 g005
Figure 6. Thermal crack counts on the LTPP test sections located in NY.
Infrastructures 07 00100 g006
Figure 7. Rutting progression on the LTPP test sections located in NY.
Infrastructures 07 00100 g007
Figure 8. Thermal crack counts on the LTPP test sections located in CA.
Infrastructures 07 00100 g008
Figure 9. Rutting progression on the LTPP test sections located in CA.
Infrastructures 07 00100 g009
Figure 10. Thermal crack count on the LTPP test sections with low structural capacity.
Infrastructures 07 00100 g010
Figure 11. Rutting progression on the LTPP test sections with low structural capacity.
Infrastructures 07 00100 g011
Figure 12. Thermal crack count on the LTPP test sections with high structural capacity.
Infrastructures 07 00100 g012
Figure 13. Rutting progression on the LTPP test sections with high structural capacity.
Infrastructures 07 00100 g013
Table 1. Annual average temperature in the locations of the NY and CA pavement test sections.
YearAnnual Average Temperature *
(°C)
Annual Average Freezing Index
(°C-day)
NY SectionsCA SectionsNY SectionsCA Sections
1973-9.9-52
1974-9.7-115
1975-8.8-84
1976-9.4-44
1977-9.3-89
19786.99.182289
19798.19.466983
19807.39.774634
19818.210.46144
19827.48.5767100
19838.69.349220
19848.59.549555
19858.09.464689
19868.210.45718
19877.911.062451
19888.010.562561
19897.99.4769102
19909.59.5295156
19919.210.346311
19927.610.852334
19937.89.267997
19947.79.880747
19958.510.35597
19968.010.160538
19977.89.950248
19989.99.130081
19999.39.747228
20008.21059215
20019.310.338653
20029.510.228655
20037.910.676820
20048.310.270130
20059.310.162944
20069.29.927370
20076.610.278384
20087.910.1672106
20098.010.565964
20109.610.042522
20119.49.953526
201210.610.622650
* Data source: Weather Underground [34].
Table 2. Deterioration models of the selected LTPP test sections.
StatePavement SectionDistressDeveloped ModelCoefficient of Determination (r2)Standard Error (SE)
CA06-0603RuttingRd = 0.398 Age + 0.0012 AADTT − 1.980.890.51
CA06-0606RuttingRd = 0.412 Age + 0.0042 AADTT − 8.580.920.29
CA06-0603Thermal crackingCtc = 4.606 Age + 0.0541 AADTT + 40.09 FI − 140.110.909.92
CA06-0606Thermal crackingCtc = 4.39 Age + 0.0469 AADTT − 24.68 FI − 102.680.983.54
NY36-1643RuttingRd = 0.623 Age − 0.0001 AADTT + 1.440.990.01
NY36-A350RuttingRd = −1.041 Age + 0.0035 AADTT − 7.560.840.96
NY36-1643Thermal crackingCtc = 2.894 Age − 0.0099 AADTT + 0.41 FI + 50.560.826.71
NY36-A350Thermal crackingCtc = 20.797 Age + 0.0055 AADTT − 0.91 FI − 8.360.979.14
Rd: rutting depth (mm); Ctc: thermal crack count.
Publisher’s Note: MDPI stays neutral with regard to jurisdictional claims in published maps and institutional affiliations.

