
Predicting Pavement Condition Index Using Fuzzy Logic Technique


1
Department of Civil Engineering, Faculty of Engineering and Applied Science, Memorial University of Newfoundland, St. John’s, NL A1B 3X5, Canada
2
Department of Civil Engineering, Faculty of Engineering, Azzaytuna University, Tarhuna P.O. Box 5338, Libya
3
Department of Civil Engineering, Faculty of Engineering, Kafr El Sheikh University, Kafr El Sheikh 33516, Egypt
4
Department of Civil Engineering, Faculty of Engineering, Tripoli University, Tripoli P.O. Box 13275, Libya
*
Author to whom correspondence should be addressed.
Infrastructures 2022, 7(7), 91; https://doi.org/10.3390/infrastructures7070091
Submission received: 23 May 2022
/
Revised: 20 June 2022
/
Accepted: 29 June 2022
/
Published: 2 July 2022
(This article belongs to the Special Issue Modern Material and Methods for Infrastructures)
Abstract
:The fuzzy logic technique is one of the effective approaches for evaluating flexible and rigid pavement distress. The process of classifying pavement distress is usually performed by visual inspection of the pavement surface or using data collected by automated distress measurement equipment. Fuzzy mathematics provides a convenient tool for incorporating subjective analysis, uncertainty in pavement condition index, and maintenance-needs assessment, and can greatly improve consistency and reduce subjectivity in this process. This paper aims to develop a fuzzy logic-based system of pavement condition index and maintenance-needs evaluation for a pavement road network by utilizing pavement distress data from the U.S. and Canada. Considering rutting, fatigue cracking, block cracking, longitudinal cracking, transverse cracking, potholes, patching, bleeding, and raveling as input variables, the variables were fuzzified into fuzzy subsets. The fuzzy subsets of the variables were considered to have triangular membership functions. The relationships between nine pavement distress parameters and PCI were represented by a set of fuzzy rules. The fuzzy rules relating input variables to the output variable of sediment discharge were laid out in the IF–THEN format. The commonly used weighted average method was employed for the defuzzification procedure. The coefficient of determination (), root mean squared error (RMSE), and mean absolute error (MAE) were used as the performance indicator metrics to evaluate the performance of analytical models.
1. Introduction and Related Work
Pavements are considered the primary asset of road infrastructure in many countries. Pavement performance is measured using three indicators: the present serviceability rating (PSR), the pavement condition index (PCI), and the international roughness index (IRI). They are widely used in the development of pavement maintenance programs. The PCI is one of the most effective approaches to evaluating pavement performance. Pavement condition evaluation is conducted by visual inspection by personnel trained for that objective. Many agencies use conventional techniques to predict performance variables, but there are some drawbacks due to the time, large workforce, and equipment required to collect data from the field. Moreover, the amount of time needed for data input and model development is also of concern. Moreover, subjectivity and inconsistency are significant problems in many highways agencies’ pavement distress evaluation process.
The United States Army Corps of Engineers developed this technique. The PCI is calculated by visual inspection of a pavement and a numerical value between 0 and 100, with 0 representing a failed pavement and 100 representing the best possible conditions [1]. The standard PCI utilizes a scale of seven different classifications (excellent, very good, good… etc., to failed) to show different situations within the rankings, as demonstrated in Figure 1. Shahin and Walther [2] proposed the following method to a procedure for calculating PCI for flexible pavement:
Step 1: Determine the severity and extent of each type of distress for a pavement section. The severity level is expressed using three terms: Minimal, Moderate, and Severe. Depending on the type of distress, the extent is measured in linear, square (metre), or numbers.
Step 2: Determine the density of pavement distress by:
Step 3: Determine deduction points (DP) for each pavement distress type using deducting value curves.
Step 4: Calculate the total deduction value (TDV) for each section’s distresses.
Step 5: Calculate the corrected deduction value (CDV) to adjust the total deduction value (TDV).
Step 6: Subtract the CDV from 100 to the calculate PCI for each section.
In recent decades, machine-based surveys have become an essential part of routine pavement condition evaluation because they provide the technology to collect surface distresses in a repeatable, detailed, and timely manner. However, the analysis method needs to be improved for the efficient conversion of these massive amounts of data into information. Due to advances in computational power, soft computing techniques have gained favor in pavement engineering in recent decades. The advanced computational and widely available resources for soft techniques enable the low-cost storage and handling of enormous data volumes. Soft computing, such as fuzzy logic and artificial intelligence, has recently been used in the asphalt pavement to predict and classify pavement conditions.
These approaches are adaptable and can handle scenarios that engineers find unclear. Since engineering decisions necessitate a high level of human skill and must also be consistent, using soft computing in these situations is a good option for pavement engineers.
Numerous researchers have used new statistical and computational procedures to analyze and assess pavement condition and recommend the most appropriate maintenance activity. Ahmed et al. [4] applied a multiple linear regression technique to develop the PCI.
Several studies examined pavement performance in terms of common distresses such as rutting and fatigue and methods for predicting pavement performance. For example, Mousa et al. used multi-layer elastic analysis software (KENLAYER) to predict the performance of constructed pavement with a base layer consisting of reclaimed asphalt pavement (RAP)/virgin aggregate blends, taking into account the horizontal tensile strain at the bottom of the AC layer and the vertical resilient strain at critical locations within the pavement system [5]. They calculated the total pavement rutting and fatigue cracking using the critical strains computed by the multi-layer elastic analysis and the performance models and transfer functions from the mechanistic-empirical pavement design guide.
Ali et al. [6] proposed a procedure for evaluating the pavement performance of 19 roads in St. John’s, Newfoundland, Canada, where the pavement condition index (PCI) and international roughness index (IRI) were the main indicators in the characterization of the overall pavement performance of asphalt pavement. Sagheer et al. [7] developed a knowledge-based technique for pavement distress categorization using logic programming and the Prolog language to assess distresses in flexible pavements.
Relatively few studies have been conducted in recent years to predict the PCI of flexible pavements using machine learning approaches [8,9]. Few studies have been conducted to predict the PCI value based on artificial intelligence methods [10,11,12].
In the research of Imam et al. [13], IRI was the pavement condition indicator for predicting PCI using gene expression programming.
Piryonesi and El-Diraby [14] conducted a study to measure the accuracy of algorithms in predicting two of the most popular performance indicators, IRI and PCI, which use machine learning techniques to indicate asphalt pavement distress.
In 1965, Zadeh proposed the fuzzy set theory. Zadeh’s development of this approach was primarily to offer efficient solutions to complex problems. A model can incorporate quantitative (qualitative) and qualitative (quantitative) data with the fuzzy logic technique. Since its inception, fuzzy set theory has been applied to various fields, including civil engineering and others [15].
Moazami et al. [16] implemented the fuzzy logic for pavement maintenance and rehabilitation. Mahmood and Mahmood et al. [17,18] applied fuzzy logic theory for PCI models. In addition, Karashahin and Terzi [19] and Jeong et al. [20] used fuzzy logic technique to evaluate pavement performance and prediction models of pavement distress. All researchers mentioned above agreed that fuzzy modelling can handle a large number of pavement sections and provides more precise results than other soft computing techniques such as multiple linear regression, artificial neural networks, or other analytical processes.
The assessment of the influence of pavement distress variables on any pavement section at an individual level and prioritization for maintenance and rehabilitation (M&R) is a challenging task, particularly due to the difference in opinion of decision-makers. Therefore, it is desirable to devise a rating mechanism or condition indicator that would represent qualitative and quantitative measurements capturing the condition of the pavements. In the present study, the researchers try to present a model to estimate PCI values based on a fuzzy inference system (FIS). The FIS model predicts the PCI based on pavement distress. The FIS models were based on data collected from the long-term pavement performance (LTPP) dataset.
1.1. Fuzzy Logic Approach
Several artificial intelligence technologies, including fuzzy logic and genetic algorithms, can predict various situations [21]. Zadeh introduced fuzzy theory in 1965 with the perception of uncertainty and certainty, and it has numerous applications [22,23,24]. In the field of engineering, the fuzzy approach can be used to evaluate uncertain problems [25]. In recent decades, fuzzy logic has been widely used in electronic machines, such as washing machines, microwave ovens, and industrial process control [26]. Fuzzy logic set method is one of the accurate mathematical methods for modelling and simulating incomplete knowledge [27].
An approach to modelling based on fuzzy logic is more in line with the way humans think and demonstrates the ability to deal with ambiguity, subjectivity, and uncertainty. Fuzzy logic imparts mathematical knowledge and expertise to less-experienced engineers based on membership degree rather than on crisp membership of the classical binary logic. Researchers in pavement performance classification have frequently employed this technique. Figure 1 depicts the components of the fuzzy inference system.
1.2. Fuzzy Rule-Based System
A fuzzy inference rule-based system is among the most common techniques used to solve classification problems. Fuzzy inference is a process that interprets the values in the independent variables and assigns values to the output variables based on user-defined rules. Initially, this method’s advantages are that intelligence is expressed in the form of IF–THEN laws, making the reasoning process understandable in human terms. Meanwhile, it would have the ability to take linguistic information from human analysts and combine it with numerical data. Lastly, it can approximate complex nonlinear functions with a simple method. Figure 2 presented the diagram of a fuzzy Inference system.
2. Research Objective
This paper focuses mainly on developing a pavement condition index (PCI) model that correspond to an effective maintenance strategy using field data, based on fuzzy inference systems (FIS) technique.
Methodology and Data Collection
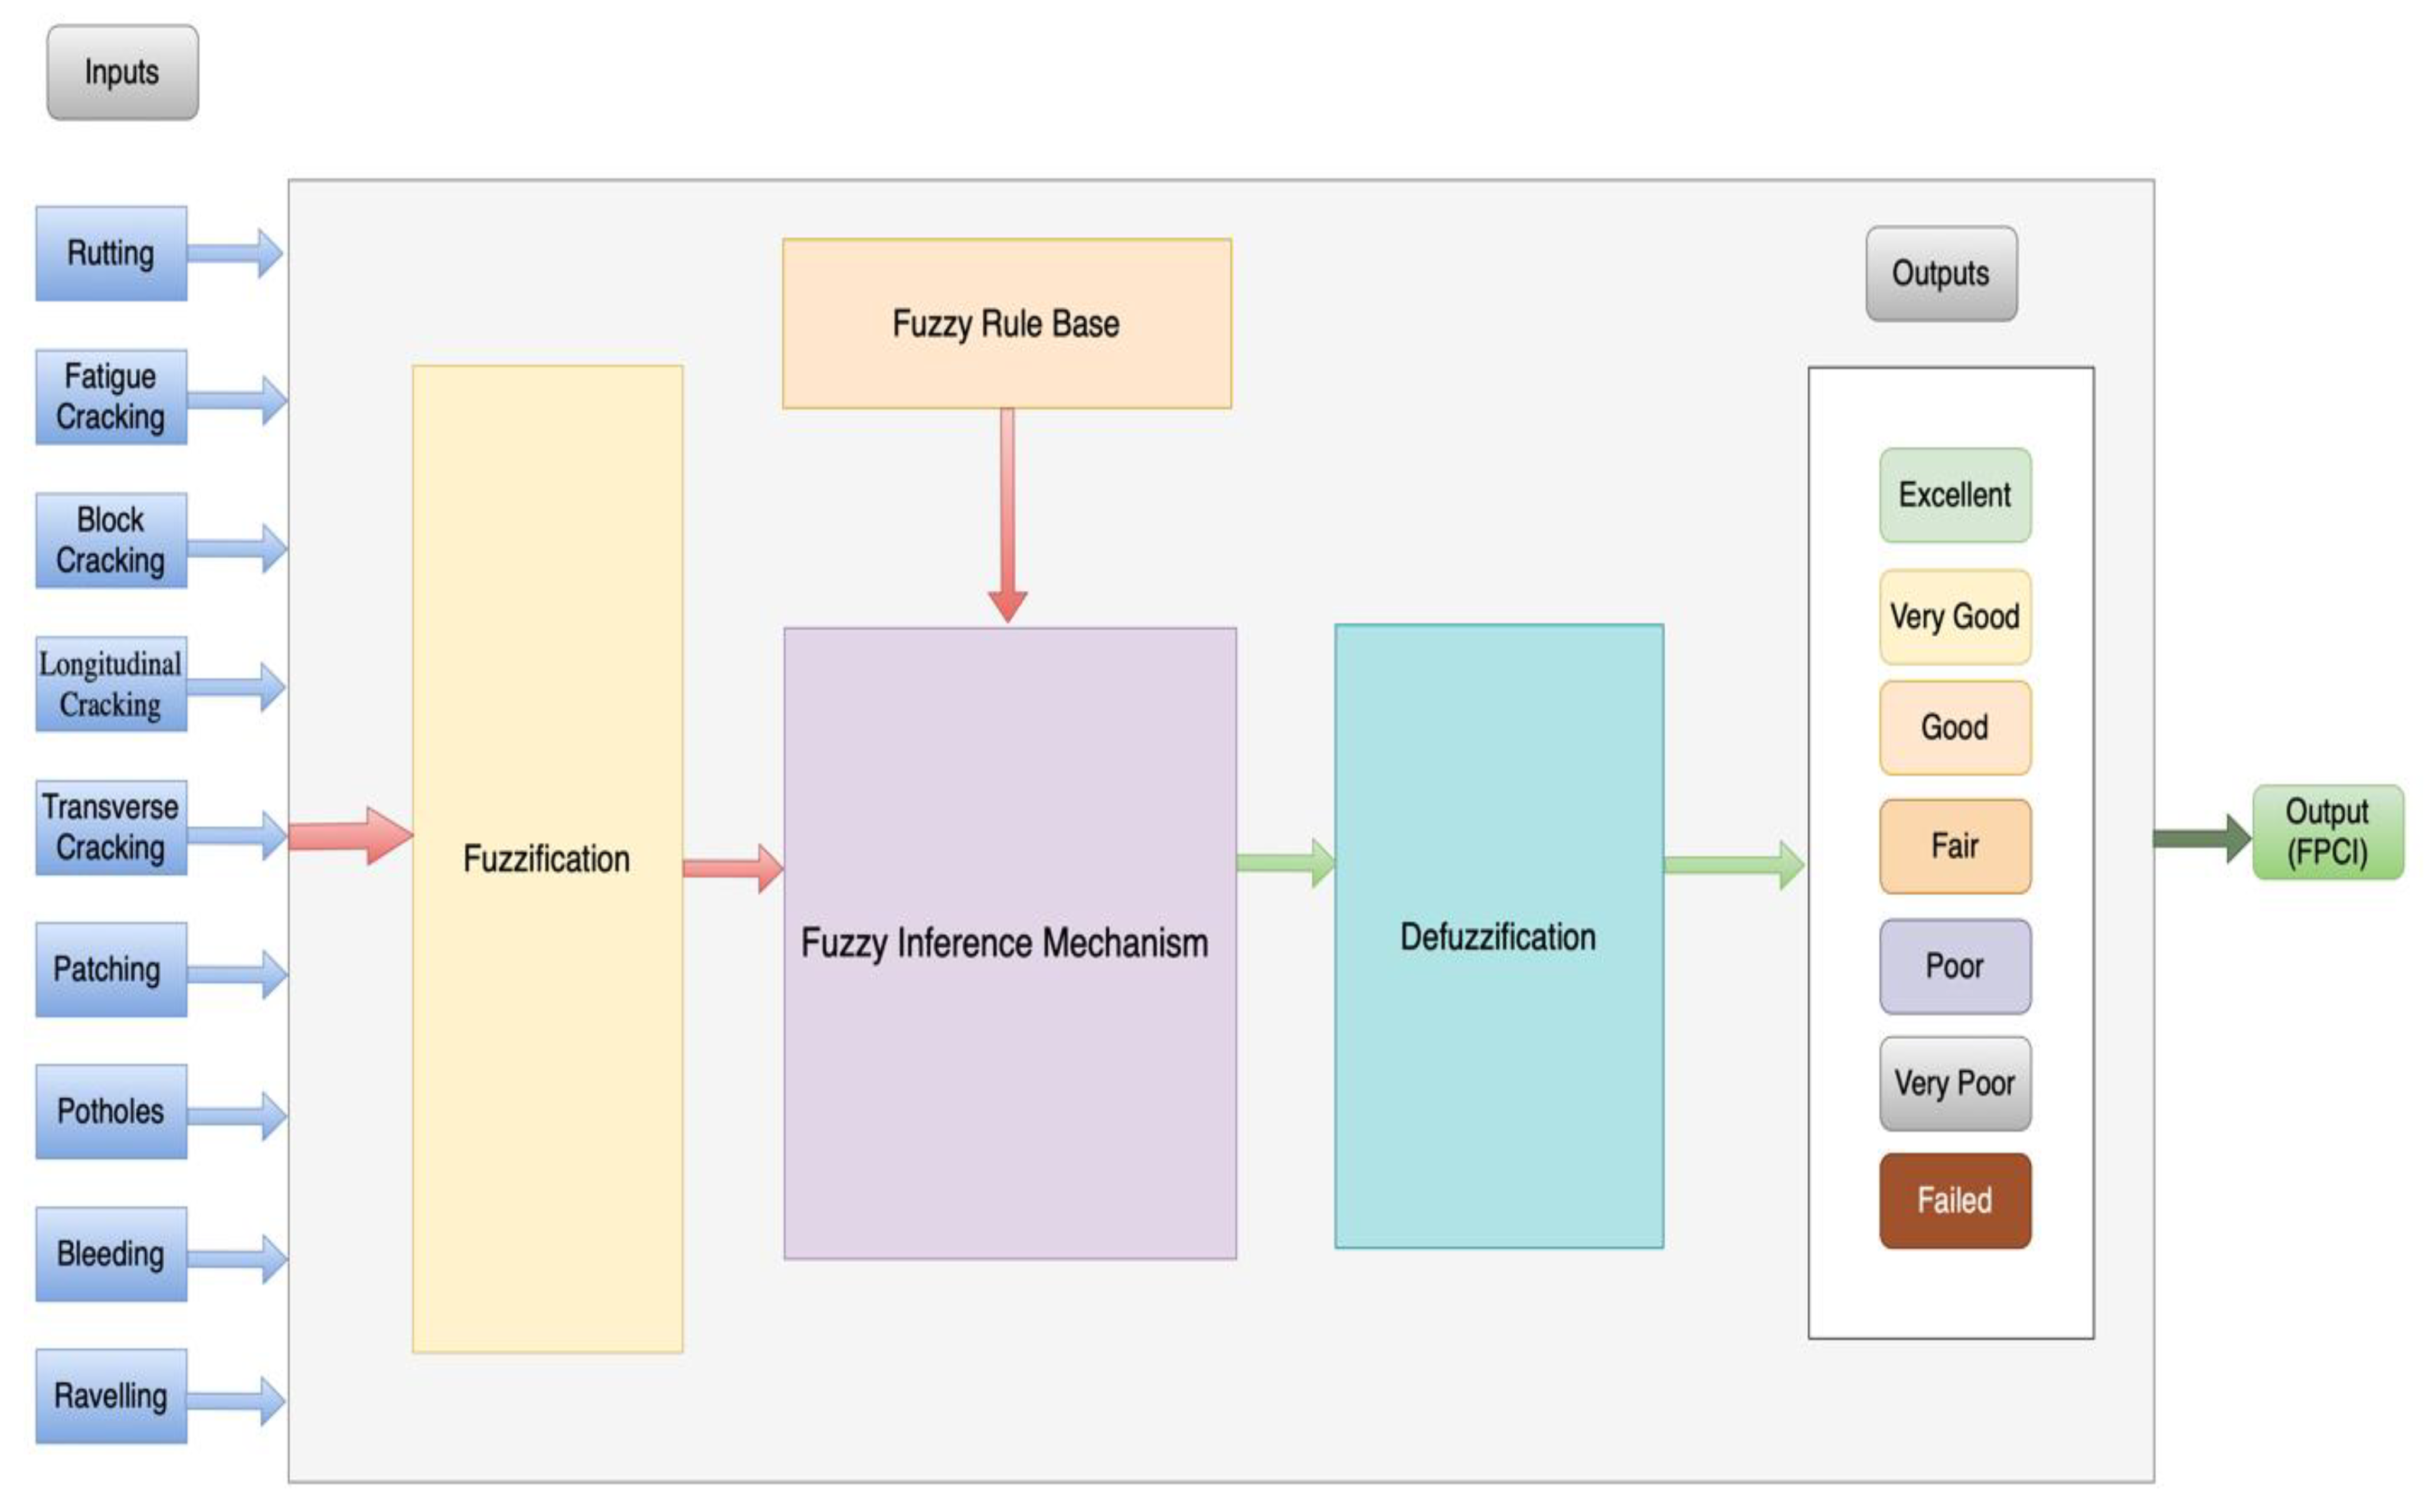
Table 1 illustrates the input variables used in the PCI models and the ranges of variables for two datasets (120) and (150) sections from the LTPP dataset to create the fuzzy logic. The effect of pavement distresses is considered for each distress. There are nine different types of distress in these sections, including rutting, fatigue cracking, block cracking, longitudinal cracking, transverse cracking, patching, potholes, bleeding, and raveling. Table 1 presents the descriptive statistics for 120 and 150 sections of the measured deterioration. Figure 3 shows structure of the fuzzy logic approach to the PCI.
3. Fuzzy Inference System (FIS) and Membership Function
The inference process transforms fuzzy input values into fuzzy output values. An IF–THEN rule that includes an antecedent and a consequence is known as a fuzzy rule. Rules are defined in linguistic terms and consider linguistic variables of both inputs and outputs. The membership functions for input and output variables functions are then decided. All input variables have three membership functions, which are classified as Minimal, Moderate, and Severe. Similarly, the output variables have seven membership functions for FPCI, classified as Failed, Very Poor, Poor, Fair, Good, Very Good, and Excellent, as explained in Figure 1. In this method, for each input and output FPCI, the x-axis reflects the distress density, while the y-axis is a membership function varying between 0 and 1, where ‘0’ indicates no statistical relationship and ‘1’ indicates a strong relationship [28].
4. Mathematical Development
4.1. Model Formulation
The research study presents a model estimating the fuzzy pavement condition index (FPCI) based on the magnitude of the different distress values considered. To develop a fuzzy-based pavement serviceability model, initially incorporated the pavement densities measured to ASTM D6433-18 [29]. Eventually, the fuzzy inference system software MATLAB 2020b was then used to design a fuzzy inference system from the LTPP data. Further, a methodology based on a case study to evaluate road pavements using soft computing techniques has been proposed. These methods aim to research the tolerance to ambiguity, approximation, and imprecision involved in collecting and extracting data and finding solutions to real-world problems that are difficult to model in an unpredictable environment.
4.2. Data Pre-Processing and Fuzzification
After extracting and revising data from the LTPP data set, the fuzzy model is prepared with nine independent parameters of distress types. Nine independent variables as input and one dependent variable as output FPCI are considered for the fuzzy modelling study.
Fuzzification is the process of converting numerical values to a linguistic fuzzy set using a membership function. The MF is a mathematical formula for dealing with fuzziness.
Membership functions are used in the fuzzification and defuzzification steps of a fuzzy inference system to map the crisp values to fuzzy linguistic terms and vice versa. In the proposed system, the crisp values are fuzzified into three degrees: Minimal, Moderate, and Severe. The level to which each input is considered Minimal, Moderate, and Severe, is computed using the membership functions. The simplest and sufficient function to represent severity, density, and weighting factors is triangular fuzzy numbers (TFNs). Equations (4)–(8) explain the concept of TFN:
where is the membership function, and are the lower and upper domains, respectively, and is the value to which its corresponding membership measure is equal to 1.
The fuzzy method provides convenient tools to combine subjective analysis and uncertainty in international roughness index, pavement condition index, and maintenance-needs evaluation.
The two most common types of fuzzy rules are Takagi–Sugeno and Mamdani [30]. Known also as “Sugeno”, the Takagi–Sugeno type of fuzzy rules is more widely used than the other type, as it clearly defines output in the rules as being a function of all the input variables. The Takagi–Sugeno fuzzy rules may be formulated as:
IF is and is and is THEN = f (, , ), = g (, , ) where:
, , : input parameters, , : outputs, , , : fuzzy sets; f (x) and g (x) indicate any type of function.
In the proposed FIS, triangular membership function is selected to fuzz the crisp values of input variables, and various numbers of membership functions (MF) are specified for each input and output variable described in Table 2.
4.3. Fuzzy Rule Generation
Generating the rules is a significant challenge in FIS throughout the second phase of this work because it is complicated to generate all rules concerning all previous combinations. The classification model’s generation rules described here are difficult and complex, as they consist of nine inputs and one output. Table 3 presents rule-based FIS for FPCI.
4.4. Defuzzification Methods
The overall result of the inference process is a fuzzy certainty value indicating the PCI in each of the seven categories (Failed, Very Poor, Poor, Fair, Good, Very Good, and Excellent). The final outcome must be defuzzified to obtain crisp results. This is the aim of the defuzzification component of the fuzzy logic, which performs the defuzzification based on the membership function of the output variable. This implies that PCI will be in the range [0, 100], with 100 being the best possible value and 0 the worst [28]. In this study, four methods will be used for defuzzification, as follows.
- 1.
- Centroid method
Sugeno developed this widely used technique. A centroid defuzzification method can be expressed as follows [31]:
where is the crisp output, is the aggregated membership function, and Z is the output variable.
- 2.
- Bisector Method
Essentially, a bisector is a vertical line dividing an area into two equal zone subregions. Sometimes it coincides with the centroid line, but not always. A bisector defuzzification method can be expressed as follows:
where is the crisp output.
- 3.
- Largest of Maximum
Largest of maximum takes the largest amongst all z that belong to [, ] as the crisp value called .
- 4.
- Smallest of Maximum
This selects the smallest output with the maximum membership function as the crisp value . In other words, in Smallest of Maximum chooses the smallest among all z that belong to [, ].
4.5. Evaluation of Model’s Performance
To evaluate the performance of the fuzzy logic PCI model and measurement values, the following three statistical criteria were selected [32]:
= actual value observation i; = predicted value of observation I; and n = number of observations.
5. Results and Discussions
The system was tested for two section data sets after generating membership functions and rules by calculating the performance of the FIS. Three Statistical Measures (, RMSE, and (MAE) were used as the performance indicator metrics in evaluating the performance FPCI of analytical models. Four defuzzification methods (Centroid, Bisector, Som, and Lom) to calculate FPCI.
5.1. Fuzzy Inference Systems’ Configurations for 120 Sections
Table 4 presents the level agreement of the FPCI values for 120 sections. Figure 4 presents the relation between the observed and fuzzified FPCI for four defuzzified methods of analyses for 120 sections.
According to Table 4, several conclusions can be drawn:
- Centroid method: The value was 97.3%, while the RMSE and MAE values were 5.28% and 4.617%.
- Bisector method: The value was 96.3%, while the RMSE and MAE values were 5.916% and 5.367%.
- Lom method: The value was 95.4%, while the RMSE and MAE values were 8.096% and 6.185%.
- Som method: The value was 95.8%, while the RMSE and MAE values were 6.696% and 5.567%.
- The results showed the Centroid method gives a more accurate result ( = 97.3%, RMSE = 5.28%, and MAE = 4.617%) compared to other techniques.
- The results showed the Lom method gives the lowest accurate result ( = 95.4%, RMSE = 8.096%, and MAE = 6.185%) compared to other techniques.
5.2. Fuzzy Inference Systems’ Configurations for 150 Sections
Table 5 presents the level agreement of the (FPCI) values for 150 sections. Figure 5 presents the relation between the observed and fuzzified FPCI for four defuzzified methods of analyses for 150 sections.
According to Table 5, several conclusions can be drawn:
- Centroid method: The value was 98.3%, while the RMSE and MAE values were 4.957% and 4.243%.
- Bisector method: The value was 96.9%, while the RMSE and MAE values were 5.499% and 5.347%.
- Lom method: The value was 98.2%, while the RMSE and MAE values were 5.042% and 4.487%.
- Som method: The value was 97.6%, while the RMSE and MAE values were 5.465% and 4.92%.
- The results showed the Centroid method gives a more accurate result ( = 98.3%, RMSE = 4.957%, and MAE = 4.243%) compared to other techniques.
- The results showed the Bisector method gives the lowest accurate result ( = 96.9%, RMSE = 5.449%, and MAE = 5.347%) compared to other techniques.
5.3. Sensitivity Analysis
The effect of input parameters on the efficiency of the fuzzy pavement categorization system in the computation of output parameters (FPCI) is investigated using a sensitivity analysis. The FPCI models were created through several steps. The first step was the fuzzy partition generation for inputs and outputs for the 120 and 150 road sections of pavement. The second step was the generation of fuzzy rules from numerical data. The third step was the FPCI and FIRI model development of a pavement classification model, using nine variables as FIS inputs: rutting, fatigue, block, longitudinal, and transverse cracking, patching and potholes, bleeding, and ravelling. The results of the sensitivity analysis are shown in Table 6 and Figure 6.
The effect of input parameters on the efficiency of the fuzzy pavement categorization system in the computation of output parameters (FPCI) was investigated using a sensitivity analysis. The sensitivity analysis was performed by creating the FIS model and analyzing the influence of each input while cancelling the effects of other inputs.
Table 6 summarizes a sensitivity analysis to determine the effects of input variables on the efficacy of models in the PCI evaluation. is used as the index to evaluate the correlation strength between independent and dependent input variables.
Figure 6 presents the sensitivity analysis for FPCI, and this analysis showed that rutting and transverse cracking were the most significant impacts on FPCI fuzzified classification compared to other distress types. Fatigue cracking and longitudinal cracking have some effects on the prediction model. In contrast patching, bleeding, and ravelling have minor impacts on the FPCI model.
5.4. Comparison and Validation of the Models
To validate the developed models in this paper, all models were evaluated by comparing four defuzzified methods and two data sets based on pavement distress, as shown in Table 7.
The performance of the 120 sections of fuzzy inference systems’ configurations was compared with the performance of the 150 fuzzy inference systems’ configurations to evaluate the accuracy of the models in predicting pavement performance based on pavement distress parameters. , RMSE, and MAE values were used to measure and compare the performance of the models. Table 7 compares the fuzzy inference systems’ configurations for 120 and 150 sections.
According to Table 7, several conclusions can be drawn:
- Centroid method: The results of the statistical measures of 150 sections were improved by 1.03%, 6.12%, and 8.10% compared to 120 sections for , RMSE, and MAE, respectively.
- Bisector method: The results of the statistical measures of 150 sections were improved by 0.62%, 7.01%, and 0.372% compared to 120 sections for , RMSE, and MAE, respectively.
- Lom method: The results of the statistical measures of 150 sections were improved by 2.85%,37.72%, and 27.45% compared to 120 sections for , RMSE, and MAE, respectively.
- Som method: The results of the statistical measures of 150 sections were improved by 1.84%,18.38%, and 11.6% compared to 120 sections for , RMSE, and MAE, respectively.
- The results show the Centroid method of 150 sections gave a more accurate result ( = 98.3%, RMSE = 4.957%, and MAE = 4.243%) compared to other techniques.
The results show the Lom method of 120 sections gives the lowest accurate result ( = 95.4%, RMSE = 8.096%, and MAE = 6.185%) compared to other techniques.
Despite the slight improvement in the accuracy of models, the accuracy grade improved as the number of sections increased (with an increase of only 30 sections).
6. Conclusions
This study presented the development of a new and simplified section classification model for asphalt pavement. The nine types of the density of pavement distress—rutting, fatigue cracking, block cracking, longitudinal cracking, transverse cracking, patching, potholes, bleeding, and ravelling—were considered FIS inputs. In contrast, the calculation of FPCI was considered as the FIS output. As a result, the fuzzy pavement classification FPCI was more accurate than the observed (PCI). The importance of assessing crack severity during road condition assessments is that its over- or underestimation severely affects pavement management decisions, leading to inefficient rehabilitation and maintenance funding.
This technique has several important advantages as shown in this study, which are below.
- This technique has a crucial advantage because it generates rules from large-scale distress data in a short time, especially when robust distress data are required, and the distress classification has become more consistent.
- As the FIS technique uses linguistic variables, this technique enables pavement engineers to identify pavement conditions and enhance decision-making processes, reduces human involvement in decision-making processes, and provides consistency to the process.
- Rutting and transverse cracking have the most influence on the FPCI calculation. Longitudinal cracking and fatigue cracking have some influence on the model, while patching, bleeding, and ravelling had only minor effects on the FPCI calculation.
- According to the results, the differences between the observed data and results from fuzzy logic system techniques were acceptable within allowed limits. The results also indicate that the models became more accurate as the number of road sections increased.
Author Contributions
Conceptualization, A.A., U.H., A.H. and M.E; Data curation, A.A. and U.H; Formal analysis, A.A., U.H., A.H. and M.E.; Investigation, A.A. and U.H.; Methodology, A.A., U.H., A.H. and M.E.; Software, A.A. and U.H; Supervision, A.H.; Validation, U.H., A.H. and M.E.; Visualization, A.A.; supervision, A.H.; project administration, U.H.; funding acquisition, M.E.; writing—original draft preparation, A.A. and U.H.; Writing—review & editing, A.A. and M.E. All authors have read and agreed to the published version of the manuscript.
Funding
This research received no external funding.
Institutional Review Board Statement
Not applicable.
Informed Consent Statement
Not applicable.
Data Availability Statement
All data, models, and code generated or used during the study appear in the submitted article.
Conflicts of Interest
The authors declare that there are no conflict of interest regarding the publication of this paper.
References
- Shahin, M.Y. Pavement Management for Airports, Roads, and Parking Lots; Chapman & Hall: New York, NY, USA, 1994. [Google Scholar]
- Fwa, T.F. The Handbook of Highway Engineering; CRC Press: Boca Raton, FL, USA, 2006; pp. 19–25. [Google Scholar]
- Shahin, M.Y. Pavement Management for Airports, Roads, and Parking Lots, 2nd ed.; Springer: New York, NY, USA, 2005. [Google Scholar]
- Ahmed, N.G.; Awda, G.J.; Saleh, S.E. Development of pavement condition index model for flexible pavement in Baghdad city. J. Eng. 2008, 14, 2120–2135. [Google Scholar]
- Mousa, E.; El-Badawy, S.; Azam, A. Effect of reclaimed asphalt pavement in granular base layers on predicted pavement performance in Egypt. Innov. Inf. Solut. 2020, 5, 57. [Google Scholar] [CrossRef]
- Ali, A.; Dhasmana, H.; Hossain, K.; Hussein, A. Modeling Pavement Performance Indices in Harsh Climate Regions. J. Transp. Eng. Part B Pavements 2021, 147, 04021049. [Google Scholar] [CrossRef]
- Sagheer, A.M.; Al Kubaisy, Y.A.; Awad, H.A. Diagnosis of Flexible Pavement Road Deterioration by Using Expert System. Iraqi J. Civ. Eng. 2008, 12, 1–25. [Google Scholar]
- Piryonesi, S.M.; El-Diraby, T. Using Data Analytics for Cost-Effective Prediction of Road Conditions: Case of the Pavement Condition; Rep. No. FHWA-HRT-18-065; Federal Highway Administration: Washington, DC, USA, 2018. [Google Scholar]
- Sony, S.; Laventure, S.; Sadhu, A. A literature review of next-generation smart sensing technology in structural health monitoring. Struct. Control Health Monit. 2019, 26, e2321. [Google Scholar] [CrossRef]
- Piryonesi, S.M.; El-Diraby, T. A machine-learning solution for quantifying the impact of climate change on roads. In Proceedings of the CSCE Annual Conf. Montreal: Canadian Society for Civil Engineering, Montreal, QC, Canada, 12–15 June 2019. [Google Scholar]
- Kırba, Ş.U.; Karaşahin, M. Performance models for hot mix asphalt pavements in urban roads. Constr. Build. Mater. 2016, 116, 281–288. [Google Scholar] [CrossRef]
- Piryonesi, S.M.; El-Diraby, T.E. Data analytics in asset management: Cost-effective prediction of the pavement condition index. J. Infrastruct. Syst. 2020, 26, 04019036. [Google Scholar] [CrossRef]
- Piryonesi, S.M.; El-Diraby, T.E. Role of data analytics in infrastructure asset management: Overcoming data size and quality problems. J. Transp. Eng. Part B. Pavement 2020, 146, 04020022. [Google Scholar] [CrossRef]
- Imam, R.; Murad, Y.; Asi, I.; Shatnawi, A. Predicting pavement condition index from international roughness index using gene expression programming. Innov. Infrastruct. Solut. 2021, 6, 139. [Google Scholar] [CrossRef]
- Zadeh, L.A. Fuzzy Sets. Inf. Control 1965, 38, 656–657. [Google Scholar] [CrossRef] [Green Version]
- Moazami, D.; Behbahani, H.; Muniandy, R. Pavement rehabilitation and maintenance prioritization of urban roads using fuzzy logic. Expert Syst. Appl. 2011, 38, 12869–12879. [Google Scholar] [CrossRef]
- Mahmood, M.S. Pavement section classification by using fuzzy rule-based system. In Proceedings of the Research and the Researcher 4th Annual Research Practice Course Conference, Nottingham, UK, 17 May 2013; pp. 58–63. [Google Scholar]
- Mahmood, M.S. Network-Level Maintenance Decisions for Flexible Pavement Using a Soft Computing-Based Framework. Ph.D. Thesis, Highway and Airport Engineering, Nottingham Trent University, Nottingham, UK, 2015. [Google Scholar]
- Jeong, H.; Kim, H.; Kim, K.; Kim, H. Prediction of flexible pavement deterioration in relation to climate change using fuzzy logic. J. Infrastruct. Syst. 2017, 23, 04017008. [Google Scholar] [CrossRef]
- Karashahin, M.; Terzi, S. Performance model for asphalt concrete pavement based on the fuzzy logic approach. Transport 2014, 29, 18–27. [Google Scholar] [CrossRef] [Green Version]
- Mamdani, E.H. Application of fuzzy algorithms for control of simple dynamic plants. Proc. IEEE 1976, 121, 1585–1588. [Google Scholar] [CrossRef]
- Artificial intelligence-based decision support technologies in pavement management. Comput. Aided Civ. Infrastruct. Eng. 2001, 16, 143–157. [CrossRef]
- Zadeh, L.A. Probability Theory and Fuzzy Logic; Computer Science Division Department of EECS UC: Berkeley, CA, USA, 2003. [Google Scholar]
- Zadeh, L.A. Fuzzy sets, information and control. Inf. Technol. 1965, 8, 338–353. [Google Scholar]
- Wang, K.; Liu, F. Fuzzy set-based and performance-oriented pavement network optimization system. J. Infrastruct. Syst. 1997, 3, 154–159. [Google Scholar] [CrossRef]
- Isik, H.; Arslan, S. The design of ultrasonic therapy device via fuzzy logic. Expert Syst. App 2011, 38, 7342–7348. [Google Scholar] [CrossRef]
- Kusan, H.; Aytekin, O.; Ozdemir, I. The use of fuzzy logic in predicting house selling price. Expert Syst. Appl. 2010, 37, 1808–1813. [Google Scholar] [CrossRef]
- Hainin, R.; Reshi, W.F.; Niroumand, H. The Importance of Stone Mastic Asphalt in Construction. Electron. J. Geotech. Eng. 2012, 17, 49–56. [Google Scholar]
- STM International. ASTM D6433-18 Standard Practice for Roads and Parking Lots Pavement Condition Index Surveys; STM: West Conshohocken, PA, USA, 2018. [Google Scholar] [CrossRef]
- Mehran, K. Takagi-sugeno fuzzy modeling for process control. Ind. Autom. Robot. Artif. Intell. 2008, 262, 1–31. [Google Scholar]
- Sugeno, M. An introductory survey of fuzzy control. Inf. Sci. 1985, 36, 59–83. [Google Scholar] [CrossRef]
- Bunce, J.A. Effect of boundary layer conductance on the response of stomata to humidity. Plant Cell Environ. 2000, 8, 55–57. [Google Scholar] [CrossRef]
Figure 1.
Rating scale used for pavement condition index (PCI) [3].
Figure 1.
Rating scale used for pavement condition index (PCI) [3].
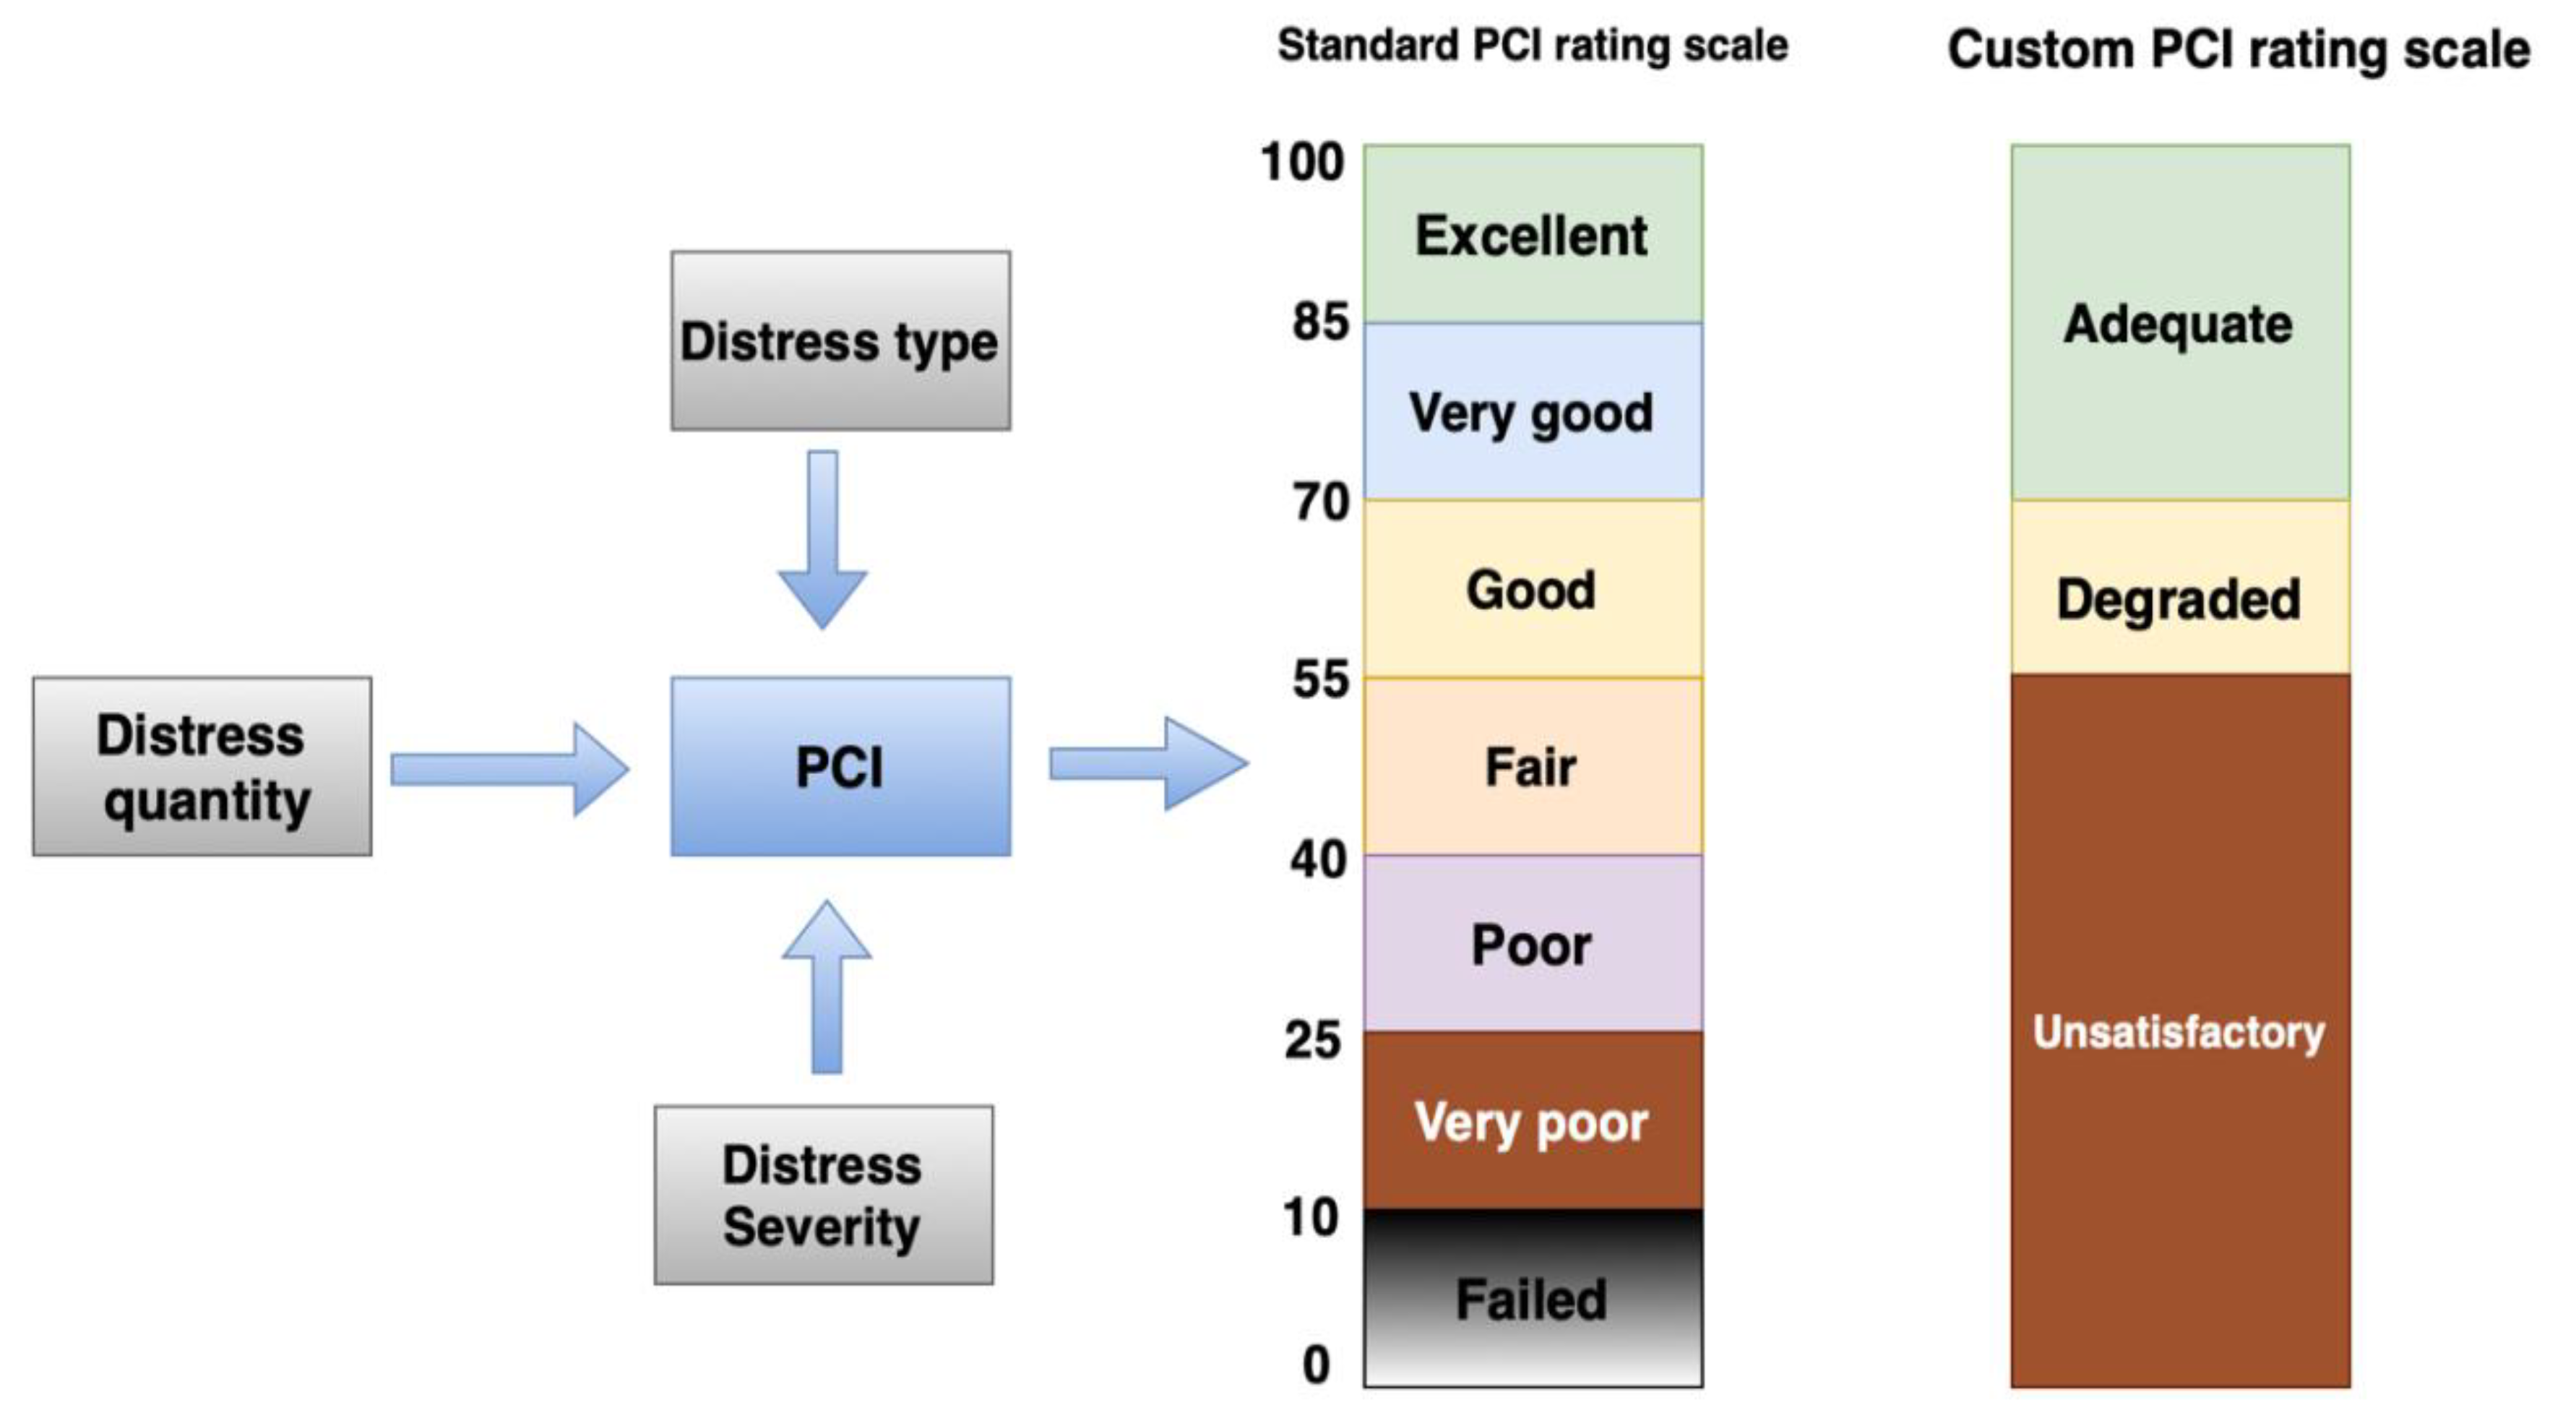
Figure 2.
Schematic diagram of a fuzzy inference system.
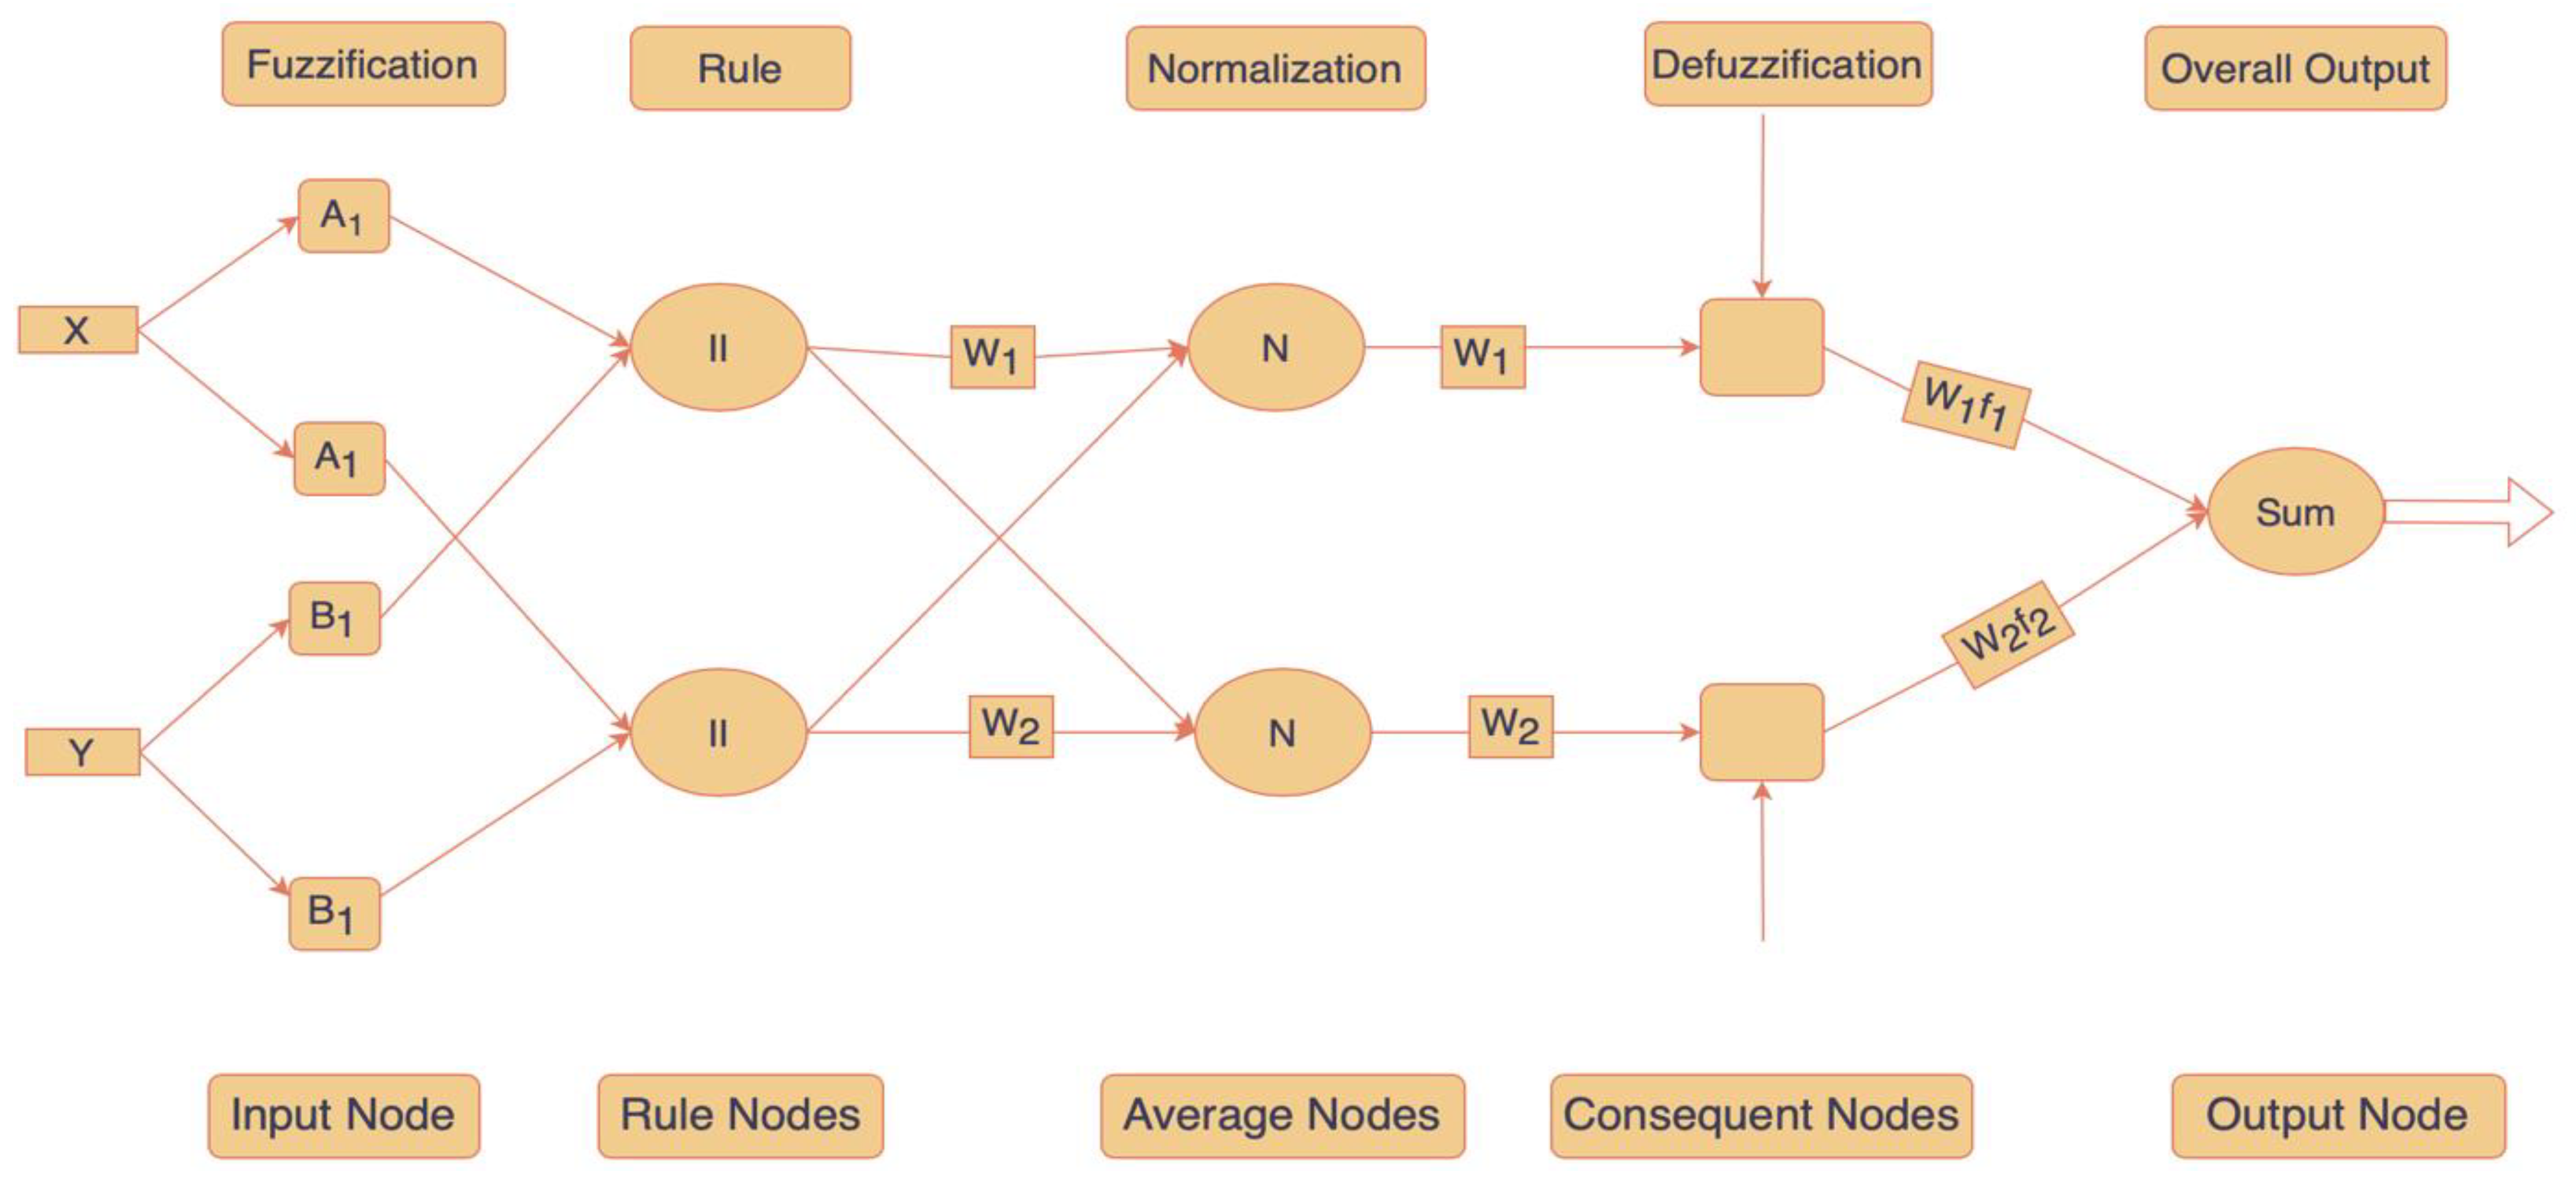
Figure 3.
Structure of the fuzzy logic approach to the PCI.

Figure 4.
Performance of a fuzzy inference system-based PCI for 120 sections.

Figure 5.
Performance of a fuzzy inference system-based PCI for 150 sections.
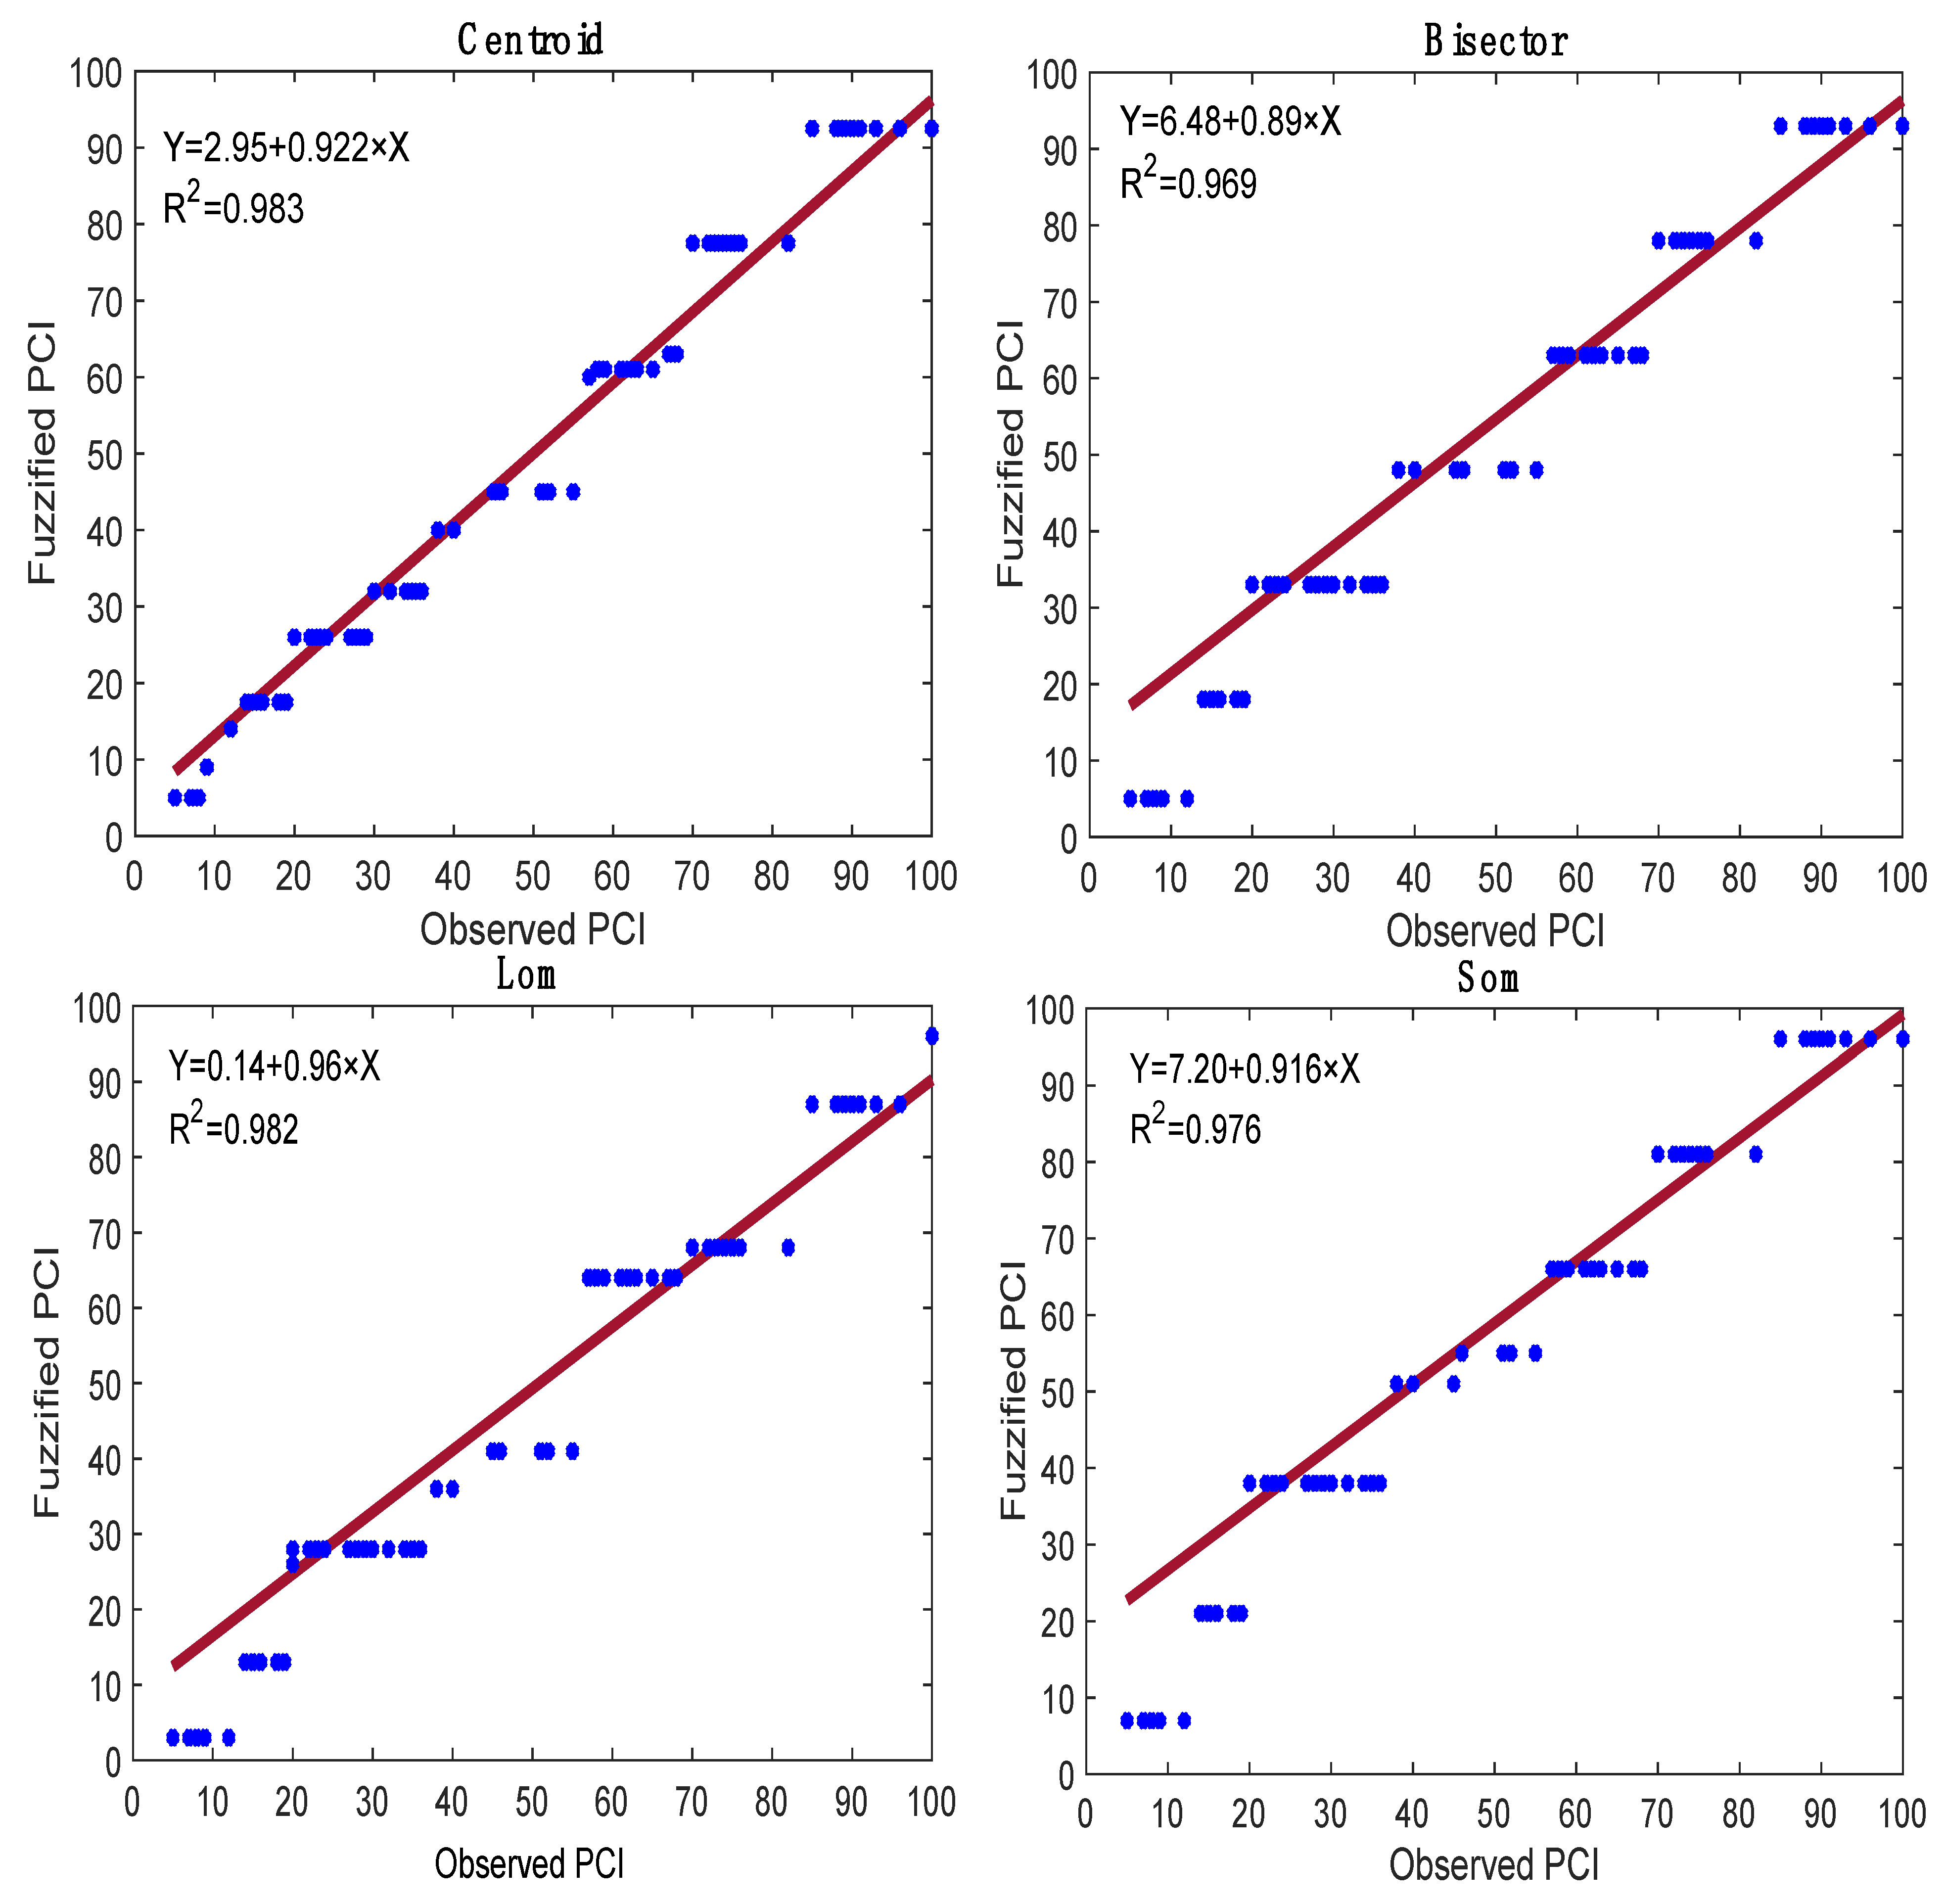
Figure 6.
Sensitivity analysis of input variables on prediction for FPCI.


Table 1.
Descriptive statistics for 120 and 150 sections of the measured deterioration.
| Parameters | Unit | Min Statistic | Maxi Statistic | Mean Statistic | Mean Std. Error | Std Statistic |
|---|---|---|---|---|---|---|
| PCI | - | 5.00 | 100.00 | 59.07 | 2.78 | 32.34 |
| Rutting | (mm) | 0.0 | 135.9 | 23.6 | 3.1 | 37.7 |
| Fatigue Cracking | () | 0.00 | 377.90 | 38.59 | 6.58 | 76.48 |
| Block Cracking | () | 0.00 | 557.60 | 5.80 | 4.30 | 50.01 |
| Longitudinal Cracking | () | 0.00 | 325.60 | 66.88 | 7.77 | 90.29 |
| Transverse Cracking | () | 0.00 | 192.30 | 30.63 | 3.74 | 43.50 |
| Patching | ( | 0.00 | 45.80 | 1.52 | 0.67 | 7.73 |
| Potholes | (Number) | 0.00 | 0.00 | 0.00 | 0.00 | 0.00 |
| Bleeding | () | 0.00 | 350.80 | 18.95 | 6.12 | 70.32 |
| Ravelling | () | 0.00 | 564.30 | 44.98 | 10.62 | 122.05 |
Table 2.
Distress types and number of membership functions to evaluate the PCI.
| Distress of Type | Category | Number of MF | Description |
|---|---|---|---|
| Rutting | Input | 3 | Extremely important |
| Fatigue Cracking | Input | 3 | Relatively important |
| Block Cracking | Input | 3 | Relatively important |
| Longitudinal Cracking | Input | 3 | Important |
| Transverse Cracking | Input | 3 | Important |
| Patching | Input | 3 | Moderately important |
| Potholes | Input | 3 | Moderately important |
| Ravelling | Input | 3 | Relatively important |
| Bleeding | Input | 3 | Relatively important |
| PCI | Output | 7 | Extremely important |
Table 3.
Rule base formed for FIS for FPCI.
| Rule No. | Distress Type (Input) | FPCI (Output) | ||||||||
|---|---|---|---|---|---|---|---|---|---|---|
| Rutting | Fatigue Cracking | Block Cracking | Longitudinal Cracking | Trans Cracking | Patching | Potholes | Bleeding | Ravelling | ||
| 1 | Minimal | Minimal | Minimal | Minimal | Minimal | Minimal | Minimal | Minimal | Minimal | Excellent |
| 2 | Minimal | Minimal | Minimal | Moderate | Minimal | Minimal | Minimal | Minimal | Minimal | Excellent |
| 3 | Minimal | Minimal | Minimal | Severe | Minimal | Minimal | Minimal | Minimal | Moderate | Very Good |
| 4 | Minimal | Minimal | Minimal | Minimal | Severe | Minimal | Minimal | Minimal | Minimal | Good |
| 5 | Minimal | Severe | Minimal | Moderate | Minimal | Minimal | Minimal | Minimal | Minimal | Good |
| 6 | Minimal | Moderate | Minimal | Minimal | Severe | Minimal | Minimal | Minimal | Minimal | Good |
| 7 | Minimal | Moderate | Minimal | Minimal | Minimal | Minimal | Minimal | Minimal | Minimal | Good |
| 8 | Minimal | Minimal | Minimal | Minimal | Minimal | Minimal | Minimal | Minimal | Moderate | Good |
| 9 | Minimal | Moderate | Minimal | Moderate | Severe | Minimal | Minimal | Moderate | Minimal | Good |
| 10 | Minimal | Moderate | Minimal | Moderate | Minimal | Minimal | Minimal | Minimal | Severe | Fair |
| 11 | Minimal | Minimal | Minimal | Moderate | Moderate | Minimal | Minimal | Minimal | Minimal | Fair |
| 12 | Moderate | Severe | Minimal | Minimal | Minimal | Minimal | Minimal | Moderate | Minimal | Fair |
| 13 | Moderate | Minimal | Minimal | Minimal | Minimal | Minimal | Minimal | Minimal | Severe | Poor |
| 14 | Minimal | Severe | Minimal | Minimal | Moderate | Minimal | Minimal | Minimal | Minimal | Poor |
| 15 | Moderate | Moderate | Minimal | Minimal | Minimal | Moderate | Minimal | Minimal | Minimal | Poor |
| 16 | Minimal | Minimal | Minimal | Moderate | Severe | Minimal | Minimal | Minimal | Minimal | Poor |
| 17 | Minimal | Minimal | Minimal | Moderate | Moderate | Minimal | Minimal | Minimal | Minimal | Very Poor |
| 18 | Moderate | Moderate | Minimal | Minimal | Moderate | Minimal | Minimal | Moderate | Minimal | Very Poor |
| 19 | Moderate | Moderate | Minimal | Moderate | Severe | Minimal | Minimal | Moderate | Moderate | Very Poor |
| 20 | Minimal | Minimal | Minimal | Minimal | Moderate | Minimal | Minimal | Minimal | Severe | Very Poor |
| 21 | Minimal | Severe | Minimal | Severe | Severe | Minimal | Minimal | Moderate | Minimal | Very Poor |
| 22 | Moderate | Moderate | Minimal | Moderate | Moderate | Minimal | Minimal | Minimal | Moderate | Very Poor |
| 23 | Minimal | Minimal | Minimal | Severe | Severe | Minimal | Minimal | Minimal | Minimal | Very Poor |
| 24 | Minimal | Moderate | Minimal | Minimal | Moderate | Minimal | Minimal | Minimal | Minimal | Failed |
| 25 | Moderate | Severe | Minimal | Moderate | Severe | Minimal | Minimal | Minimal | Minimal | Failed |
| 26 | Severe | Moderate | Minimal | Moderate | Severe | Minimal | Minimal | Minimal | Minimal | Failed |
| 27 | Severe | Severe | Minimal | Moderate | Moderate | Minimal | Minimal | Moderate | Minimal | Failed |
Table 4.
Assessment various fuzzy inference systems’ configurations for 120 sections.
| Inference | Number of Sections | Defuzzification | Statistical Measures | ||
|---|---|---|---|---|---|
| RMSE | MAE | ||||
| Mamdani (Triangular) | 120 | Centroid | 97.3 | 5.28 | 4.617 |
| Bisector | 96.3 | 5.916 | 5.367 | ||
| Lom | 95.4 | 8.096 | 6.185 | ||
| Som | 95.8 | 6.696 | 5.567 | ||
Table 5.
Assessment various fuzzy inference systems’ configurations for 150 sections.
| Inference | Number of Sections | Defuzzification | Statistical Measures | ||
|---|---|---|---|---|---|
| RMSE | MAE | ||||
| Mamdani (Triangular) | 150 | Centroid | 98.3 | 4.957 | 4.243 |
| Bisector | 96.9 | 5.499 | 5.347 | ||
| Lom | 98.2 | 5.042 | 4.487 | ||
| Som | 97.6 | 5.465 | 4.92 | ||
Table 6.
Sensitivity analysis of input variables on prediction for FPCI.
| Independent Variable | ||
|---|---|---|
| 120 Sections | 150 Sections | |
| Rutting | 45.1 | 46.5 |
| Fatigue | 27.9 | 28.4 |
| Block Cracking | 0. 1 | 0. 2 |
| Longitudinal Cracking | 26.6 | 26.6 |
| Transverse Cracking | 35.5 | 39.9 |
| Patching | 5.1 | 0.6 |
| Potholes | - | - |
| Bleeding | 9.6 | 7.2 |
| Ravelling | 6.5 | 7.1 |
Table 7.
Comparison of the fuzzy inference systems’ configurations for 120 and 150 sections.
| Inference | Number of Sections | Defuzzification | Statistical Measures | Improvement (%) | ||||
|---|---|---|---|---|---|---|---|---|
| RMSE | MAE | R2 | RMSE | MAE | ||||
| Mamdani (Triangular) | 120 | Centroid | 97.3 | 5.28 | 4.617 | - | - | - |
| Bisector | 96.3 | 5.916 | 5.367 | - | - | - | ||
| Lom | 95.4 | 8.096 | 6.185 | - | - | - | ||
| Som | 95.8 | 6.696 | 5.567 | - | - | - | ||
| 150 | Centroid | 98.3 | 4.957 | 4.243 | +1.03 | +6.12 | +8.10 | |
| Bisector | 96.9 | 5.499 | 5.347 | +0.62 | +7.01 | +0.372 | ||
| Lom | 98.2 | 5.042 | 4.487 | +2.85 | +37.72 | +27.45 | ||
| Som | 97.6 | 5.465 | 4.92 | +1.84 | +18.38 | +11.6 | ||
Publisher’s Note: MDPI stays neutral with regard to jurisdictional claims in published maps and institutional affiliations. |
© 2022 by the authors. Licensee MDPI, Basel, Switzerland. This article is an open access article distributed under the terms and conditions of the Creative Commons Attribution (CC BY) license (https://creativecommons.org/licenses/by/4.0/).
Share and Cite
MDPI and ACS Style
Ali, A.; Heneash, U.; Hussein, A.; Eskebi, M. Predicting Pavement Condition Index Using Fuzzy Logic Technique. Infrastructures 2022, 7, 91. https://doi.org/10.3390/infrastructures7070091
AMA Style
Ali A, Heneash U, Hussein A, Eskebi M. Predicting Pavement Condition Index Using Fuzzy Logic Technique. Infrastructures. 2022; 7(7):91. https://doi.org/10.3390/infrastructures7070091
Chicago/Turabian StyleAli, Abdualmtalab, Usama Heneash, Amgad Hussein, and Mohamed Eskebi. 2022. "Predicting Pavement Condition Index Using Fuzzy Logic Technique" Infrastructures 7, no. 7: 91. https://doi.org/10.3390/infrastructures7070091