Article

A Sustainable Decision Support System for Drinking Water Systems: Resiliency Improvement against Cyanide Contamination

by
Mohammad Gheibi
1,
Mohammad Eftekhari
2,
Mehran Akrami
1,
Nima Emrani
3,
Mostafa Hajiaghaei-Keshteli
1,
Amir M. Fathollahi-Fard
4 and
Maziar Yazdani
5,*
1
Tecnologico de Monterrey, Escuela de Ingeniería y Ciencias, Puebla 14380, Mexico
2
Department of Chemistry, Faculty of Sciences, University of Neyshabur, Neyshabur 9319774446, Iran
3
Department of Civil Engineering, Ferdowsi University of Mashhad, Mashahd 9177948944, Iran
4
Department of Electrical Engineering, École de Technologie Supérieure, University of Québec, Montréal, QC H2L 2C4, Canada
5
School of Civil and Environmental Engineering, University of New South Wales, Sydney 2052, Australia
*
Author to whom correspondence should be addressed.
Infrastructures 2022, 7(7), 88; https://doi.org/10.3390/infrastructures7070088
Submission received: 30 April 2022 / Revised: 9 June 2022 / Accepted: 17 June 2022 / Published: 23 June 2022
(This article belongs to the Special Issue Challenges of Rehabilitation of Infrastructures in Future)

Abstract

:
Maintaining drinking water quality is considered important in building sustainable cities and societies. On the other hand, water insecurity is an obstacle to achieving sustainable development goals based on the issues of threatening human health and well-being and global peace. One of the dangers threatening water sources is cyanide contamination due to industrial wastewater leakage or sabotage. The present study investigates and provides potential strategies to remove cyanide contamination by chlorination. In this regard, the main novelty is to propose a sustainable decision support system for the dirking water system in a case study in Iran. First, three scenarios have been defined with low ([CN] = 2.5 mg L−1), medium ([CN] = 5 mg L−1), and high ([CN] = 7.5 mg L−1) levels of contamination. Then, the optimal chlorine dosage has been suggested as 2.9 mg L−1, 4.7 mg L−1, and 6.1 mg L−1, respectively, for these three scenarios. In the next step, the residual cyanide was modelled with mathematical approaches, which revealed that the Gaussian distribution has the best performance accordingly. The main methodology was developing a hybrid approach based on the Gaussian model and the genetic algorithm. The outcomes of statistical evaluations illustrated that both injected chlorine and initial cyanide load have the greatest effects on residual cyanide ions. Finally, the proposed hybrid algorithm is characterized by the multilayer perceptron algorithm, which can forecast residual cyanide anion with a regression coefficient greater than 0.99 as a soft sensor. The output can demonstrate a strong positive relationship between residual cyanide- (RCN) and injected chlorine. The main finding is that the proposed sustainable decision support system with our hybrid algorithm improves the resiliency levels of the considered drinking water system against cyanide treatments.

1. Introduction

Access to clean, safe, and sufficient water is a critical aspect of achieving sustainable cities, urban resilience concepts, and human rights [1]. However, population growth and the rapid pace of urbanisation and industrialization, as a barrier to these concepts, have led to the pollution of water resources [2]. Likewise, the risks of old infrastructure in megacities, such as problems with concrete sewer pipes in traffic loads, are possibly more dangerous than other features, which can present a high risk for the health of water and wastewater infrastructures. The mentioned emerging phenomenon in megacities threatens water facilities more than in the past [3]. The lack of drinking water resources and recent climate changes with droughts globally are the main motivations for research on the sustainable dirking water systems considering all risks for the pollution of water resources such as cyanide [4,5]. Such facts also highlight the role of resiliency in the quality of drinking water systems [6].
The opposite concept of water insecurity is water security, which UNESCO defines as “the capacity of a population to safeguard sustainable access to adequate quantities of acceptable quality water for sustaining livelihoods, human well-being, and socio-economic development, for ensuring protection against water-borne pollution and water-related disasters and preserving ecosystems in a climate of peace and political stability”
(UNESCO in 2012 available at: https://www.unesco.org/en accessed on 8 May 2022). Therefore, to ensure long-term human security and sustainable development, it is essential to address water security challenges in two aspects, namely quality and accessibility [7].
There are several important sources of surface water pollutants [8]. Industrial wastewater can be considered one of the most important sources due to the high concentration of pollutants and their diversity [9]. However, wastewater treatment can be costly, especially in developing countries that are technologically inferior [10,11]. This has caused 80% of the world’s industrial wastewater to be dumped into the environment without proper treatment, making industrial wastewater a threat to water security and human health (UN-Water in 2015 available at: https://www.unwater.org/publications/world-water-development-report-2015/ and WWAP in 2012 available at: https://www.unwater.org/publications/managing-water-uncertainty-risk/ accessed on 8 May 2022). Studies revealed that some industrial wastewaters need special attention due to highly toxic substances, and leakage of the least amount of these compounds into drinking water systems can pose a severe threat to human health [12,13]. Based on these studies, unsafe drinking water is one of the major causes of death globally. As shown in Figure 1, unsafe drinking water is one of the leading risk factors for death from 1990 to 2019. Moreover, the lack of access to safe water is a major risk factor for some other causes of death, such as infectious diseases.
Therefore, in order to increase water security, maintain the health of consumers, and protect water resources, in addition to proper industrial wastewater treatment, it is necessary to take measures to increase the tolerance of water systems against any possible leakage of industrial wastewater [14,15]. Figure 2 shows the relation between maintaining water quality and Sustainable Development Goals (SDGs) and concepts such as sustainability and infrastructure resiliency.
Threats concerning water quality are divided into physical, chemical, and biological. Studies show that the damage caused by the last two cases is far more severe [20]. Industrial wastewater contains several toxic contaminants, such as pesticides, heavy metals, and pharmaceuticals. Among these pollutants, cyanide is one of the most dangerous chemical contaminants that pollutes water sources worldwide [21,22]. Cyanide reacts with several other chemical elements and forms hundreds of different compounds, some of which can be very toxic, and even very low concentrations of them could cause serious health problems [23].
Although there are several natural sources of cyanide in nature, the primary source of cyanide in water resources is industrial wastewater [24]. Besides, as a lethal contaminant, cyanide is a critical criterion in maintaining water safety [25]. Affordability, ease of access, immediate impact, effectiveness even at low concentrations ([CN] > 70 µg L−1), no physical traces (like color, odor, or turbidity), and the possibility of contamination by industries, such as metal plating, makes cyanide a potential terroristic threat [26].
Different researchers studied cyanide removal during the water treatment process [27]. For instance, Parga, et al. [28] attempted to treat the cyanide waste solutions by employing three techniques, including (1) oxidation by chlorine oxide (ClO2) in a gas-sparged hydro cyclone reactor (GSH) system, (2) ozonation in batch reactors with additional intense shaking (stirred batch reactor), and (3) UV light. The applied methods successfully removed cyanide, each with different advantageous aspects. In addition, Dash, et al. [29] focused on the ability of anaerobic microorganisms in the decomposition of cyanide. Such microorganisms would transform the carbon and nitrogen in cyanide into carbonate and ammoniac, respectively. Another study on the adverse effects of cyanide on human health examined different treatment procedures for removing cyanide from industrial wastewater [30]. In this research, the performance of various treatment processes, such as chlorination, biological treatment, acid removal, evaporation, ion exchange, oxidation with hydrogen peroxide, etc., was tested for removing cyanide. Uppal, et al. [31] attempted to remove cyanide from water resources using zinc peroxide nanoparticles (ZnO2) along with PVP (polyvinyl pyrrolidone) stabilizing factor based on the surface adsorption process. This process mainly depends on the pH, concentration of adsorption material (ZnO2-PVP), contact time, and cyanide concentration.
More recently, Rasoulzadeh, et al. [32] utilized diatomite magnano composite boosted with alginate polymer beads (DMBA) as an adsorbent to remove cyanide from water solution. Moreover, they used the response surface methodology (RSM) to optimize the adsorption process. Singh and Balomajumder [33] studied the phytoremediation potential of water hyacinth (Eichhornia crassipes) for cyanide and phenol decontamination simultaneously and evaluated the effect of pH and contaminant concentration on the removal. Similarly, Tirado-Muñoz, et al. [34] built a novel rotary photocatalytic reactor, used TiO2 as the catalyst, and tested the reactor to remove different concentrations of cyanide varying from 0.05 to 50 ppm. They also optimized the pH and catalyst load in different conditions.
Studies on intentional or unintentional entry of contaminants into water resources can be divided into two classes network contaminations and contaminations prior to network. Among the studies on the safety of water distribution networks, research conducted by Preis, et al. [35] can be considered. In this study, using non-dominated sorted genetic algorithm analysis (NSGAII), they attempted to locate sensor placements in the water distribution network. In recent years, some different ideas about the decontamination of cyanide from water and wastewater resources have been developed, e.g., the application of Bacillus subtilis bacteria due to the biodegradation of cyanide in gold mines. Likewise, all experimental practices are performed in alkaline conditions in the research. While, all biological detection and measurement were conducted using mass spectrometry technique [36]. In addition, in the other research, Li, et al. [37] presented a novel electrochemical precipitation system for the decontamination of cyanide by Zn based electrodes. In the study, all effective features, such as current density, type of electrodes, amperage, etc., are appraised. Meanwhile, the utilization of X-ray photoelectron spectrometer applies all detections. Verma, et al. [38] presented a catalyst-based system for decontaminating cyanide from wastewater resources. In the research, the main focus of the treatment approach was related to the kinetic behavior of the catalyst. Another study undertaken by Pan, et al. [39] developed the utilization of GO/TiO2/ZSM-5 as a photocatalytic oxidation catchment. Moreover, in their research, some process characterization is performed using XPS instrumentation.
The present research aims to determine the optimal doses of injected chlorine to remove cyanide contamination. For this purpose, the following contributions have been made through this study:
  • Experimental practices due to the evaluation of cyanide interactions with injected chlorine in the water treatment plant.
  • Predicting the residual cyanide with mathematical computations and finding the best regression model.
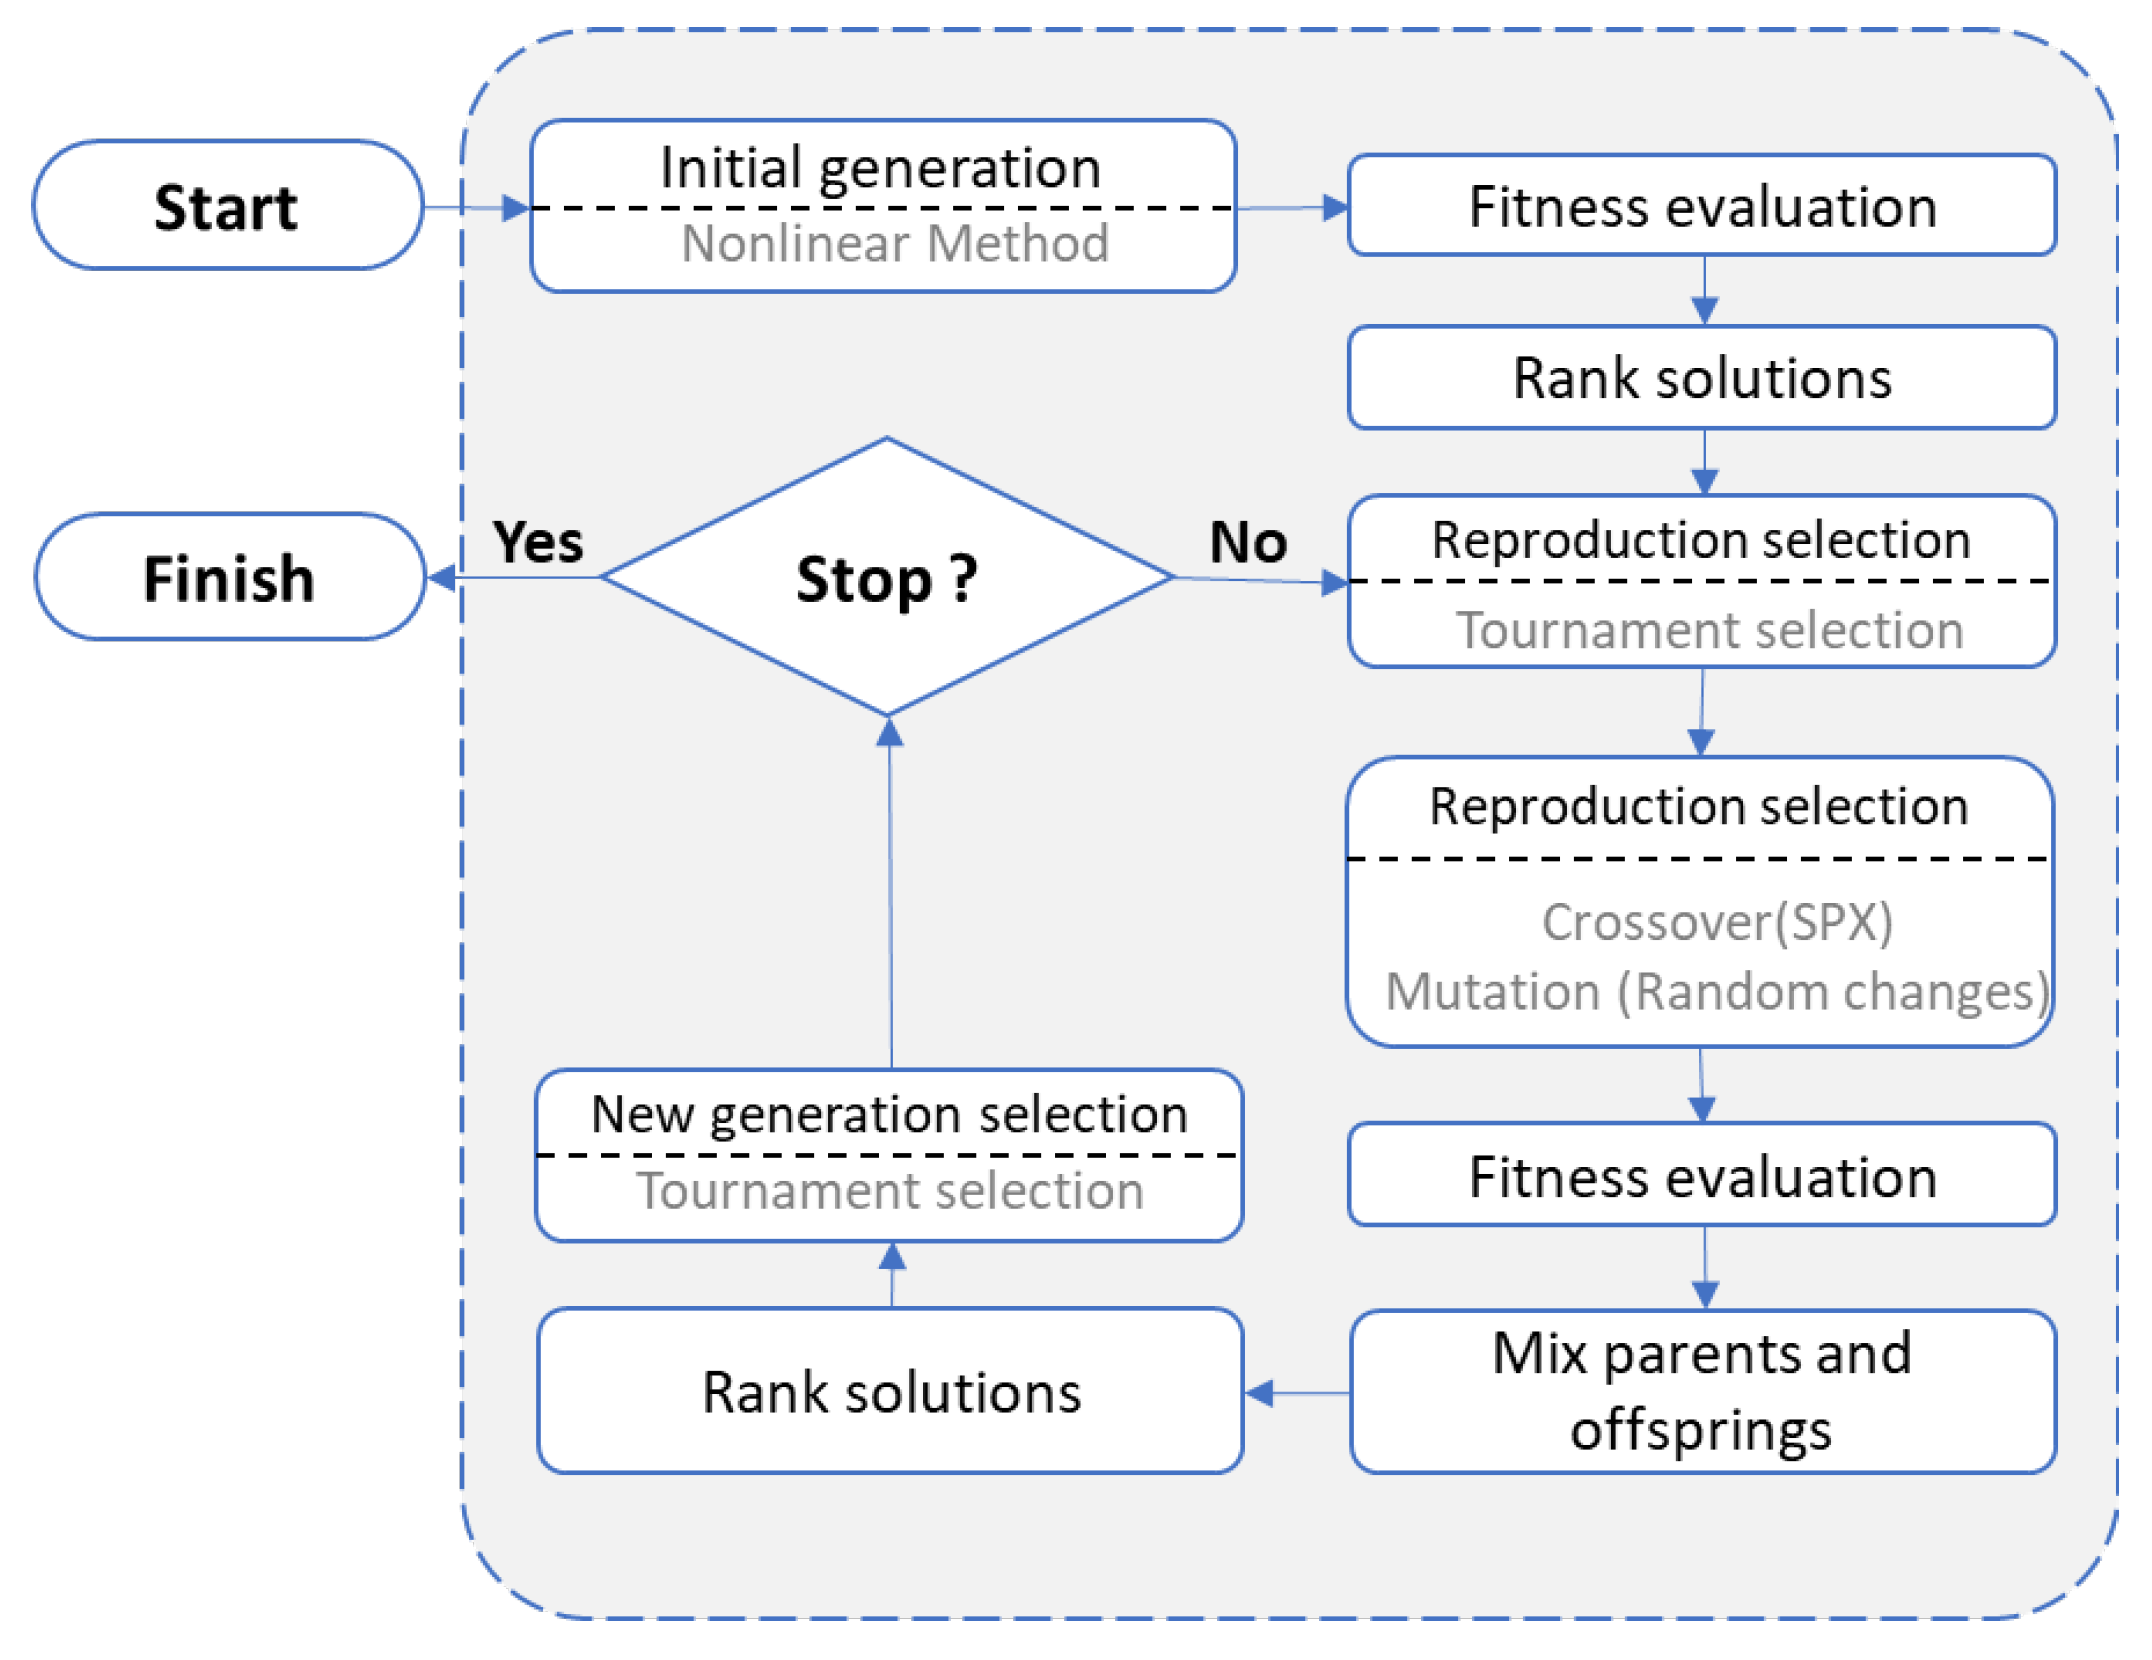
  • Optimizing the proposed model for residual cyanide with the application of a Genetic Algorithm (GA).
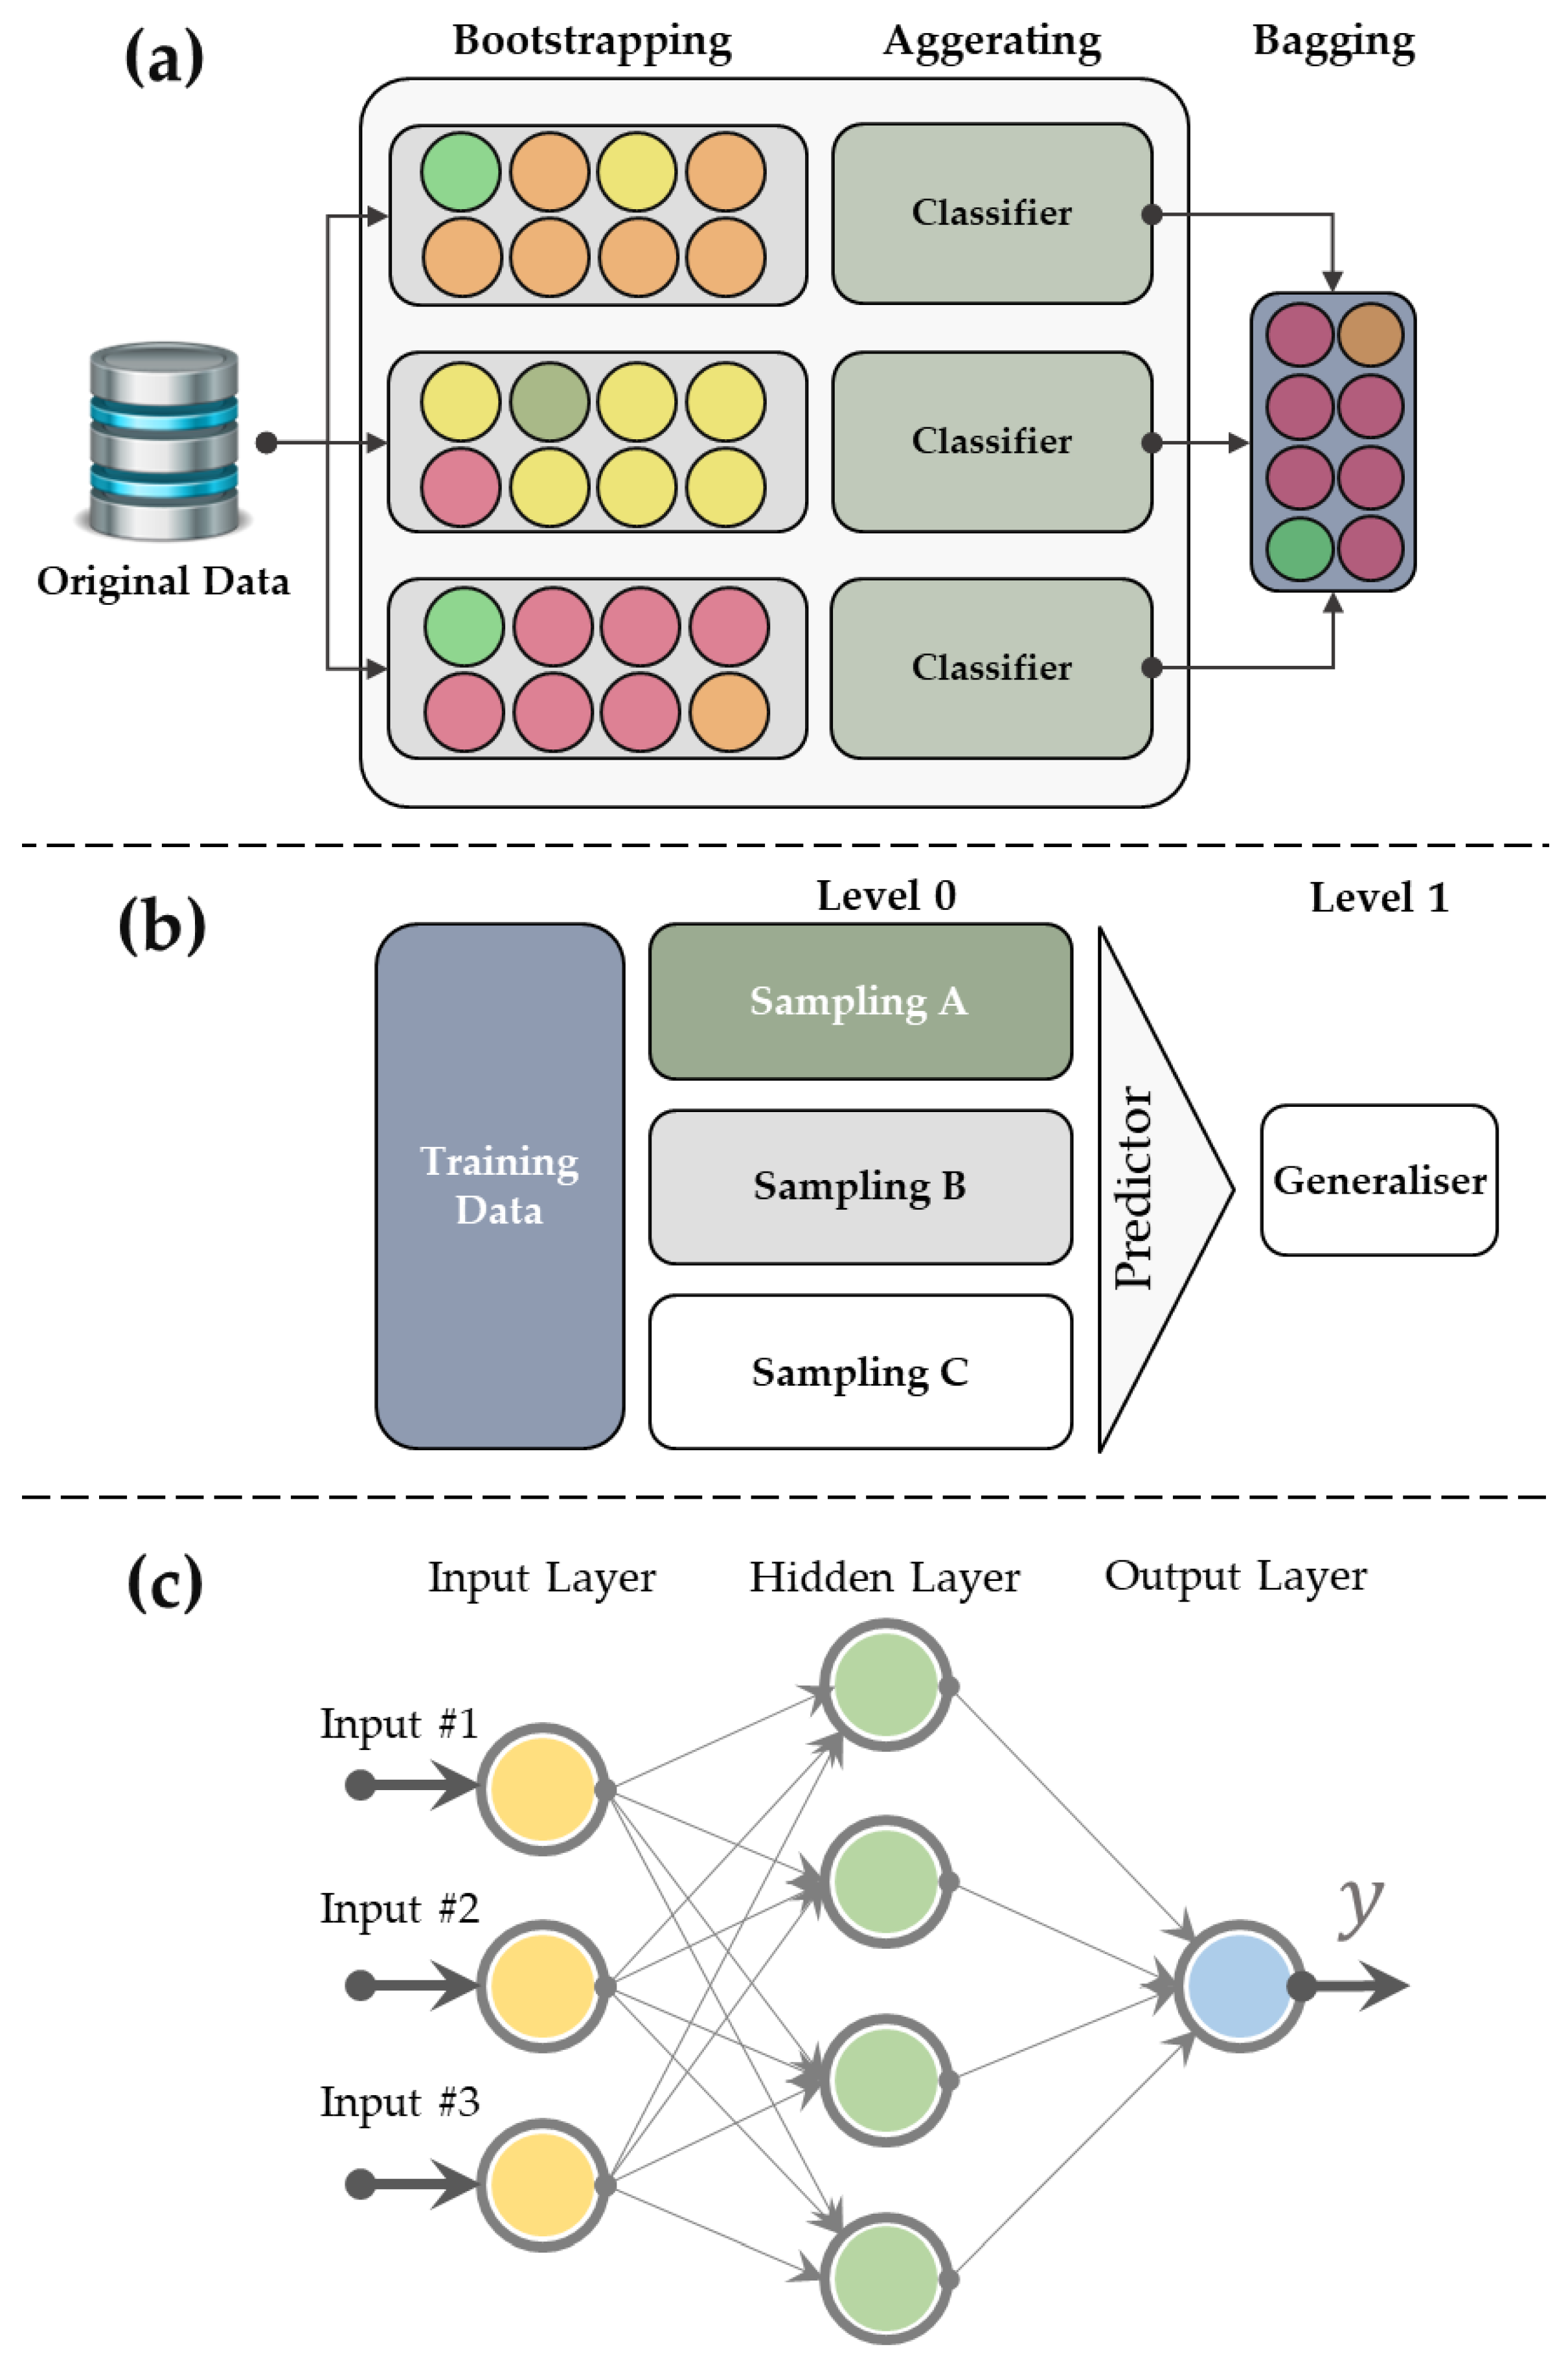
  • Implementation of machine learning (ML) computations as an artificial intelligence technique for soft sensor design in the water treatment plant.
  • Perform a SDGs assessment analysis.
The proposed decision support system (DSS) contains monitoring, prediction, and control sections and in the present research, all of them are satisfied by experimental efforts, machine learning computations, and sensitivity analysis, respectively (Figure 3). It goes without saying that there are different methods due to monitoring cyanide ions in water samples, such as spectroscopy, colorimetry, fluorometry, and chromatography [40]. As such, in the present research, spectroscopy is utilized because of the available equipment and validity of the method. Due to water quality control and prediction, machine learning is applied as a soft sensor [41].
By another point of view, according to Figure 3, it can be seen that in the suggested DSS of the present research, first, the data are provided by sampling and gathering the archive data. Then, the mentioned databank is applied for the implementation of the monitoring system. In the monitoring system as well, with data validation, calibration, and categorization, the feed of the prediction stage is obtained. In the prediction system with the application of three different machine learning computations, the value of RCN as a cost function of the investigation is estimated by some water quality features. Finally, the achieved values are examined by thresholds and the control system is executed.
Having a conclusion from the literature review, the main novelty of the present study is related to the combination of the GA-regression model and machine learning computations which have been applied to the prediction of cyanides in interaction with chlorine as a smart control system for water treatment plants.
In the following, Section 2 describes the regents and methodology of the present study in detail. Then, Section 3 presents a comprehensive discussion of the final results. Finally, Section 4 summarizes this research with findings, limitations, and recommendations.

2. Materials and Methods

The case study of this research is a water treatment plant (WTP) located in Razavi Khorasan Province, Iran (see Figure 4). The studied WTP applies chlorination in primary and final stages to carry out the disinfection process. Field survey assessments have demonstrated the presence of several industrial factories in the vicinity of this WTP, such as metal plating and tubing. Therefore, if the environmental standards of industrial wastewater treatment are not observed, there is a possibility of leakage of industrial wastewater containing cyanide to the upstream sources of the water treatment plant. On the other hand, the water flow between the dam and the WTP is not transferred via a channel or a pipeline and flows gravitationally along the riverbed. Such conditions may intensify the possibility of industrial wastewater leakage.

2.1. Determining the Optimal Concentrations of Chlorine

In this part of the study, three scenarios involving low (2.5 mg L−1), medium (5 mg L−1), and high cyanide contamination (7.5 mg L−1) have been defined. In this study, the scenarios are based on the specifics of the plating plant upstream of the water resources leading to the water treatment plant. According to field inspection reports, the amount of possible cyanide, if not violated by the industrial unit, can be between 2.5 and 7.5 mg /L. Therefore, the scenarios of this study are defined based on the actual reports recorded in the legal authorities. In the first step, samples were taken from the influent of the WTP and tested for cyanide contamination, and the results showed that there was no cyanide in the WTP influent. Then, the samples were contaminated by certain concentrations of cyanide, before different doses of NaOCl were injected into the samples, and the residual cyanide was detected. In order to increase the accuracy and reduce the chance of error, all laboratory tests were performed with 3 repetitions. The United States Environmental Protection Agency (US-EPA) deems the maximum contaminant level for free cyanide in surface water resources must be less than 200 µg L−1 (EPA, 2009). Meanwhile, the 1053 standard of Iran states the limit for existing cyanide in water supplies as 70 µg L−1 (DOE, 2016). Nonetheless, the present study carried out the cyanide removal process until the concentration of cyanide reached 70 µg L−1 in order to satisfy the 1053 standard of Iran. To measure the residual concentration of cyanide in the chlorinated sample, the present study employs a patented method known as US 4871681A, demonstrated in Table 1 [42]. Moreover, to record the absorbance of the sample solutions, an Agilent 8453 spectrophotometer equipped with a photodiode array detector was used.

2.2. Reagents and Materials

Deionized water was used throughout the analysis, and all solutions were made with deionised water produced in the lab by a portable water deioniser. Further, a stock solution of 0.5 mol L−1 Na2CO3 was prepared from Na2CO3 salt, and a stock solution of NaOCl 5 mol L−1 was prepared and standardised according to the 4500-CI. B Iodometric Method I (APHA, 2005). A 1% (w/v) solution of Picric acid was used as a reagent to determine cyanide. Moreover, a 1000 mg L−1 CN stock solution was prepared from KCN salt. Table 2 presents the raw material and instruments’ names and sources.

2.3. Modelling the Residual Cyanide (RCN)

Mathematical modeling of the experimental data has been carried out to provide a relationship between the concentration of cyanide and the required dosage of chlorine to remove contamination. For this purpose, some mathematical models, including polynomial, exponential, Fourier, Gaussian, and rational, have been used. The models are selected as per conventional curve fitting practices [43], and each of them follows specific logics of mathematics. For example, Fourier has been used for repetition events and may be in a specific domain if it is fit to the curve and it should be discussed in terms of physical aspects. Likewise, polynomial distributions are used in different applications and among all models are general. Besides, the Gaussian distribution is a continuous probability distribution utilized for real-valued random variables, while exponential distribution is applied for the functions raised suddenly in a specific domain. In each model, data are put as an input and assigning the constant-coefficient in equations, all computations are performed and based on statistical indicators, the best model is chosen. The appropriate distribution has been chosen by evaluating the statistical parameters of R2, SSE, and RMSE indices. Before the modeling, it is necessary to interpolate the contour between values of injected chlorine and RCN output using the Lagrange method expressed in Equation (1). It is worth mentioning that all the interpolation calculations, as well as the mentioned modelling procedures, have been carried out in MATLAB 2015a software.
f x k = P x k ,           k 0 , 1 , 2 , n P x = k = 0 n f x k   L n , k   x L n , k   x = i = 0   i k   n x x i x k x i
where xi, f(xi), L n , k   x present the variables, main functionalized variables, and Lagrange function, respectively.

2.4. Calibration of Model using Genetic Algorithm (GA)

After determining the relationships between the concentration of injected chlorine and residual cyanide in water, the obtained relationships are adjusted using model calibration tests and single-purpose GA. Moreover, theoretical (calculated through predictive models) and practical values (experimental results) are compared following the cost function equation presented in Equation (2). Using this method, the coefficients of the proposed models are calibrated to lower the cost function (Equation (2)).
Cost   Function   =   min   ( R e R t ) 2 R e   =   Experimental   Response R t R t = Theoretical   Response   ( in   polynomial   model ,   R t = a 0 + a 1 C Naocl + a 2 C Naocl 2 + a n   C Naocl n 1 ) Result   of   equation = to   determine     a 0 ,   a 1 ,   ,   a n
MATLAB 2015a software was utilised to code the GA and computations to analyse the abovementioned issue. According to the research study conducted by De Jong, the set parameters of mutation rate, crossover probability, and initial population were considered as 0.001, 0.6, and 50, respectively [44]. Sensitivity analysis of the algorithm’s behavior concluded at the end value of 400 generations. In the following, the structure of GA is demonstrated as per Figure 5.

2.5. Artificial Intelligence (AI)

In this section, some different software is utilized, such as RapidMiner V9.10, WEKA V3.9, and Minitab V16.2.4.4. Before each numerical practice, some blind sampling and experimental tests are performed based on standard methods for the examination of water and wastewater due to the data gathering of AI processes. Through experimental practices, six water quality features are examined and added as inputs of machine learning computations, such as injected chlorine dosage, initial cyanide load, pH, water temperature in sampling (T), ammonia concentration, and volatile dissolve solid (VDS) concentration. In the following, all the declared factors are utilized for the prediction of RCN- as an output of the model. Due to the prediction of RCN, three AI algorithms are applied to implement decision support system (DSS), including meta bagging, meta random committee, and multilayer perceptron functions. Each DSS has three stages, including monitoring, prediction, and control. In the research, the monitoring is provided according to experimental practices. The prediction section is satisfied by machine learning computations, and finally, by applying metaheuristics, the control section is executed in the research.
The meta bagging computation includes original data entering, bootstrapping, aggregating, and bagging. In the first step, in the training data set D with n size, uniform sampling process is done in new D’ with n’ size as sub dataset. The cycle is run until n=n’ and the declared dataset is named bootstrapping [45]. In the following, the stages of Meta bagging are demonstrated in Figure 6a. As per Figure 6b, in the meta random committee algorithm, a dataset is first created by available records. Then, after using classifiers, the banked data are distributed instantly in different levels based on the algorithm’s logic. Likewise, in the next stage of batch size activities and calculations, the most efficient model is applied for training and testing approaches. Next, the machine learning strings are built by the WEKA model, before partitioning, membership assignment, revision, and estimation are implemented, correspondingly [46]. Multilayer perceptron models include at least three input, hidden, and output layers and the learning process is performed by backpropagation method, which is one of supervised learning techniques [47]. In the model, prediction is executed by the application of weight assignment to each input feature by received signal analysis of the input data (Figure 6c).

3. Results and Discussion

As mentioned before, the studied WTP used chlorine in its gas state [48]. Meanwhile, the results obtained from the studies by Botz have shown that the final product of the reaction between Chlorine gas (Cl2) and cyanide ion does not produce dangerous components, according to Equation (3) [49].
C l 2 + C N   C N C l + C l C N C l + H 2 O O C N + C l + 2 H + O C N + 3 H 2 O C l 2   c a t a l y s t N H 4 + + H C O 3 + O H 3 C l 2 + 2 N H 4 + N 2 + 6 C l + 8 H +

3.1. Experimental and Mathematical Modelling

In this study, the optimal concentrations of chlorine for the removal of cyanide in low (2.5 mg L−1), medium (5 mg L−1), and high (7.5 mg L−1) contamination scenarios have been calculated as 2.9, 4.7, and 6.1 mg L−1, respectively. In the water matrix, different mineral and organic compounds react with chlorine in an oxidation-reduction reaction. With more than 2.5 mg L−1 injected chlorine, there is a sufficient concentration of oxidant and cyanide at the same time. Besides, with the 2.5 oxidant injection, it should be controlled for a complete reaction of mineral and organic compounds and cyanide at the same time. Therefore, as per experimental practices in this study, due to reaching less than 1 mg L−1 residual chlorine concentration, the optimum concentration of chlorine in different dosages of cyanide are examined and the optimal oxidant values are measured.
The relationship between the injected chlorine and the residual cyanide in low, medium, and high degrees of contamination is illustrated in Figure 7a–c. As can be seen, by increasing the concentration of injected chlorine, the residual cyanide is decreased non-linearly. Noticeably, due to the high concentrations of volatile solids (VS) in surface waters, chlorination with the obtained optimal doses increases the possibility of Trihalomethane formation. Two strategies, including initial disinfection using potassium permanganate and multistage chlorination, are recommended to solve this problem [43]. Due to the colour formation by using high concentrations of potassium permanganate (higher than 1 mg L−1), its application encountered many limits. Therefore, multistage chlorination is preferred.
To predict residual cyanide based on the injected chlorine in different contamination scenarios, various mathematical models were evaluated, and the proposed equations for each model are presented in Table 3. Regarding the fitness indices of R2, RMSE, and SSE, the Gaussian model provides the best functionality.
In order to improve the proposed Gaussian models and minimise the cost function (Table 3), Gaussian models were calibrated by single-purpose GA based on Equation (2). The calibrated model for the prediction of residual cyanide in the low contamination (2.5 mg L−1) scenario is presented in Equation (4). The mentioned process has also been applied for cyanide contaminations of 5 and 7.5 mg L−1 (medium and high contamination scenarios). The calibrated models are expressed in Equations (5) and (6), respectively.
    G u s s i a n d i s t r i b u t i o n F o r   C N = 2.5 p p m   R e s i d u a l   C N = a 1 * e x p N a O C l b 1 c 1 2 + a 2 * e x p N a O C l b 2 c 2 2 ) 13.38 a 2 18.34 15.76 b 2 16.01 6.629 c 2 10.94 a 1 =                   0   b 1 =       4.913   c 1 =         0.5982   a 2 =           2.322     b 2 =         0.3245     c 2 =           0.9562  
    G u s s i a n d i s t r i b u t i o n F o r   C N = 5 p p m   R e s i d u a l   C N = a 1 * e x p N a O C l b 1 c 1 2 4.174 a 1 6.052 1.498 b 1 0.88522.268 c 1 4.284 a 1 = 4.855               b 1 = 0.5691     c 1 = 4.023  
G u s s i a n d i s t r i b u t i o n F o r   C N = 7.5 p p m R e s i d u a l   C N = a 1 * e x p N a O C l b 1 c 1 2 0.3544 a 1 4.2292.444   b 1 5.3090.4596 c 1 2.155 a 1 =           2.075       b 1 =           2.559       c 1 =           1.694  
There are several methods for purifying cyanide, each with advantages and disadvantages. Depending on the cyanide composition, concentration, and other factors, the appropriate method should be selected. Common methods for cyanide purification include INCO sulfur dioxide/air, hydrogen peroxide, adsorption, activated carbon polishing, and chemical and biological treatment [49]. For instance, several studies involve the use of cyanide adsorption with different adsorbents, including the works of Manyuchi, et al. [50]. However, the adsorption technique is expensive, and sometimes it is not sustainable due to the use of chemical substances. Another approach is biological treatment [51]. This method is more environmentally friendly than other methods and less costly, but it is mostly used for cyanide-contaminated wastewater and not for drinking water treatment. Therefore, chlorination is one of the best methods for treating cyanide from drinking water and increasing the resiliency of drinking water systems in consideration of the facilities available in water treatment plants. In the following, the convergence of the best solutions in the different iterations for all three scenarios are demonstrated, as in Figure 8. All computations are performed in 400 iterations, but the trends of cost function optimization are converged to constant values after 120 iterations. Likewise, the process of optimization in all the declared scenarios are similar with each other, but the equation using 5 ppm cyanide pollution is reduced with the lowest time in comparison to the other ones.

3.2. AI and Soft-Sensor Design

The outputs of the analysis of variance (ANOVA) for the exact determination of each factor’s effect are determined in Table 4. Here, it is clear that the injected chlorine and initial CN with p-value < 0.0001 have the greatest effects on RCN. Furthermore, the F-value of injected chlorine is more than the other one, and therefore it is the most important feature in these experiments. Meanwhile, as per Table 4, it can be found that the pH has a less important effect (p-value = 0.71) on the response of the present research (RCN).
The outcomes of data availability in the form of a heat map are demonstrated in Figure 9 for initial CN-, ammonia, injected Cl2, RCN- (Figure 9a), T, pH (Figure 9b), and VDS (Figure 9c). Per a literature review [26,52], it can be found that all VDS (mgL−1), ammonia, and water temperatures affect chlorine decay directly, and increasing them, CN anions can release greater water bulk. Therefore, if the concentrations of ammonia and VDS are increased, chlorine should be injected in a relative amount based on specific logic. In the next step of the present research, the value of injected chlorine according to effective features is modelled by machine learning computations as a smart DSS.
In the next step, the available normal diagram of experimental outputs is demonstrated, as shown in Figure 10. As shown, all data distributions follow the normal type.
Before machine learning computations, the sensitive analysis of the most important features is demonstrated, as shown in Figure 11. Here, it is clear that the slope variation of injected chlorine concentration and initial CN dosage are greater than other ones, and this supports the significant effects of them on RCN as a cost function of the present research. As per Figure 11a, it is clear that the slope fluctuation of initial CN load is greater than injected chlorine, and therefore the initial CN concentration is more significant than the other one. Meanwhile, in Figure 11b, it can be seen that the importance of temperature is greater than oxidant concentration based on RCN. Besides, as per Figure 11c,d, the importance degree of the initial concentration of cyanide is greater than the two factors of ammonia concentration and temperature, and this can be deduced from the sensitivity of the target function to this factor. It is clear that, during the cyanide ion decontamination, the ammonia is an active compound for reaction by chlorine, and it plays a significant role in removing the cyanide in the interaction of chlorine as an interference (Figure 11e). It is worth noting that the present research outcomes are local and for each case study should be executed again for the exact adjustment of the equations and models.
The results of AI processes in the present investigation are summarized in Table 5. Based on the results shown, the efficiency of the multilayer perceptron functions algorithm for the prediction of RCN as per the initial CN, ammonia, injected Cl2, RCN, T, pH, and VDS is demonstrated with a correlation coefficient greater than 0.99. Likewise, in the next level, meta bagging and meta random committee are shown to be the most appropriate with regression coefficients of 0.9 and 0.84. The correlation coefficient of the multilayer perceptron functions proves the best fitting of the algorithm for the prediction of RCN based on the experimental data.
There is a supervisory control and data acquisition (SCADA) in each water treatment plant for data transfer, mining, and management. All available qualitative sensors, such as residual real-time chlorine sensors, are connected to the SCADA. Besides, according to valid historical chlorine data, the conventional (without cyanide concentrations) conditions can be controlled and detected by simple IF-THEN frameworks and each increase/decrease from thresholds can trigger an alert by the smart infrastructure as an unconventional situation. Due to the increase of cyanide (as a high risk measured phenomenon in the water treatment plant), the free residual chlorine is decreased, and this unknown event can be interpreted as a dangerous condition. Therefore, the cyanide or other contamination entrance can be detected without adding expensive sensors by putting thresholds for the post computational processing of chlorine sensor data. Moreover, after detection, according to the created models in the present study, exact injection amounts of chlorine will be ordered to dosing pumps by a programmable logic controller and possible crises will be managed.
There is an idea about the injection of chlorine in WTPs and the formation of tri halo methane (THM) as a carcinogenic compound [53] that should be controlled. However, cyanide has an acute effect in crisis conditions and THM has a chronic one. Therefore, the priority of the chlorination process for damping the effects of cyanide emission in drinking water resources is more important than the formation THM in a limited time. Besides, the formation of THM is related to organic compounds and with the reaction of chlorine and VDS, the possibility of the THM formation is increased [54]. However, in the present research, the main idea is related to real-time cyanide reduction to enhance WTP as an infrastructure.

3.3. SDGs Assessment

As mentioned earlier, access to clean water plays an important role in different aspects of sustainable development. Therefore, in this section, the impact of the present study is evaluated based on SDGs. For instance, preventing pollutants such as cyanide from water resources directly contributes to reaching SDG No. 3, 6, and 14. Moreover, SDG No. 1.2 and 1.5 will also be satisfied by reducing the chance of diseases from unsafe water and medical costs and enhancing urban resiliency [55,56]. Another aspect of this study that has an indirect positive effect on SDGs is the increase in infrastructure resilience (No. 9.1), namely the drinking water system in this study. SDGs No.11.B and 11.3 will be met by the transition towards more sustainable cities by removing cyanide from urban water networks [57,58]. Figure 12 evaluates the impact of SDGs through this study and explains the mentioned SDGs in detail.

4. Conclusions and Future Studies

In the present research, a method is developed for the enhancement of water treatment plants’ resiliency against cyanide contaminations. With the application of the method, sensitive infrastructure cities, namely the water treatment plant, can be protected from the side effects of high-risk pollution. After experimental practices, exact interactions of cyanide and chlorine are evaluated in different concentrations during the research. Then, predictive equations of an RCN based on injected chlorine are calibrated by the GA model. Finally, with the application of machine learning computations, the RCN is estimated in different conditions. The study’s main outcomes are related to the reduction of cyanide risks in different levels (2.5, 5, and 7.5 mgL−1) by chlorination. Meanwhile, the interactions of chlorine and cyanide are modeled by regression-GA with high performance outcomes. Finally, the RCN is predicted by multilayer perceptron functions with a correlation coefficient greater than 0.99. As a suggestion for future studies, the application of strong metaheuristics, such as the lion-inspired optimization algorithm [59], social engineering optimization algorithm [60], and red deer algorithm [48,61], can be useful for smart cyanide risk control in the case of water resources [49]. Finally, an evaluation of cyanide fate and transportation in water distribution networks as a qualitative assessment of the facility in different scenarios may be attractive in scientific communities. The main limitation of the research concerned a lack of permission for the execution of the created smart models on the electrical boards and their online testing.

Supplementary Materials

The following supporting information can be downloaded at: https://www.mdpi.com/article/10.3390/infrastructures7070088/s1: Supplementary Materials File S1.

Author Contributions

Conceptualization, M.G., M.E. and M.A.; methodology, M.G., M.A. and N.E.; software, M.G., M.E., M.A., N.E. and M.Y.; validation., M.E. and A.M.F.-F.; formal analysis, M.G., M.E. and M.A.; investigation., M.E., A.M.F.-F. and M.Y.; writing—original draft preparation, M.G., M.E.; writing—review and editing, A.M.F.-F., M.H.-K. and M.Y.; visualization, M.E. and A.M.F.-F.; supervision, A.M.F.-F., M.H.-K. and M.Y.; project administration, M.G. and M.Y. All authors have read and agreed to the published version of the manuscript.

Funding

There is no funding and the financial support for this paper.

Institutional Review Board Statement

Not applicable.

Informed Consent Statement

Not applicable.

Data Availability Statement

The data used in the study is available with the authors and can be shared upon reasonable requests.

Conflicts of Interest

Author declares that they don’t have conflict of interest.

References

  1. Jiang, Y. China’s water security: Current status, emerging challenges and future prospects. Environ. Sci. Policy 2015, 54, 106–125. [Google Scholar] [CrossRef]
  2. Fathollahi-Fard, A.M.; Ahmadi, A.; Al-e-Hashem, S.M. Sustainable closed-loop supply chain network for an integrated water supply and wastewater collection system under uncertainty. J. Environ. Manag. 2020, 275, 111277. [Google Scholar] [CrossRef] [PubMed]
  3. Zamanian, S.; Shafieezadeh, A. Temporal global sensitivity analysis of concrete sewer pipes under compounding corrosion and heavy traffic loads. Struct. Infrastruct. Eng. 2021, 1–14. [Google Scholar] [CrossRef]
  4. Gheibi, M.; Pouresmaeil, H.; Akrami, M.; Kian, Z.; Takhtravan, A.; Mohammadi, M. Presenting a novel approach for designing chlorine contact reactors by combination of genetic algorithm with nonlinear condition functions, simulated annealing algorithm, pattern search algorithm and experimental efforts. Ann. Environ. Sci. Toxicol. 2021, 5, 12–17. [Google Scholar]
  5. Shahsavar, M.M.; Akrami, M.; Kian, Z.; Gheibi, M.; Fathollahi-Fard, A.M.; Hajiaghaei-Keshteli, M.; Behzadian, K.J. Bio-recovery of municipal plastic waste management based on alan integrated decision-making framework. J. Ind. Eng. Chem. 2022, 108, 215–234. [Google Scholar] [CrossRef]
  6. Singgalen, Y.A.; Sasongko, G.; Wiloso, P.G. Community participation in regional tourism development: A case study in North Halmahera Regency-Indonesia. Insights Into Reg. Dev. 2019, 1, 318–333. [Google Scholar] [CrossRef]
  7. Wolde, Z.; Wu, W.; Ketema, H.; Karikari, B.; Liu, X. Quantifying Sustainable Land-Water-Energy-Food Nexus: The Case of Sustainable Livelihoods in an East African Rift Valley. Atmosphere 2022, 13, 638. [Google Scholar] [CrossRef]
  8. Zuo, H.; Chen, Y.; Chen, S.; Li, W.; Zhang, A. The Effect of the Water Tower of Typhoon Mangkhut (2018). Atmosphere 2022, 13, 636. [Google Scholar] [CrossRef]
  9. Mirabi, M.; Karrabi, M.; Gheibi, M. An economic analysis of industrial wastewater treatment systems using multi-attribute decision-making methods (case study: Toos Industrial Estate, Mashhad, Iran). Desalination Water Treat. 2019, 146, 131–140. [Google Scholar] [CrossRef]
  10. Ahmad, A.; Banat, F.; Alsafar, H.; Hasan, S.W. Algae biotechnology for industrial wastewater treatment, bioenergy production, and high-value bioproducts. Sci. Total Environ. 2022, 806, 150585. [Google Scholar] [CrossRef]
  11. Bharagava, R.N.; Saxena, G.; Chowdhary, P. Constructed wetlands: An emerging phytotechnology for degradation and detoxification of industrial wastewaters. In Environmental Pollutants and Their Bioremediation Approaches; CRC Press: Boca Raton, FL, USA, 2017; pp. 397–426. [Google Scholar]
  12. Amasha, R.H.; Aly, M.M. Removal of dangerous heavy metal and some human pathogens by dried green algae collected from Jeddah coast. Pharmacophores 2019, 10, 5–13. [Google Scholar]
  13. Haseena, M.; Malik, M.F.; Javed, A.; Arshad, S.; Asif, N.; Zulfiqar, S.; Hanif, J. Water pollution and human health. Environ. Risk Assess. Remediat. 2017, 1. [Google Scholar] [CrossRef]
  14. Shahsavar, M.M.; Najafzadeh, M.; Akrami, M.; Kian, Z.; Gheibi, M. Qualitative evaluation of surface water resources using iran water quality index (IRWQSC) and national sanitation foundation water quality index (Case Study: Kardeh Dam, Mashhad, Iran). Environ. Sci. Toxicol. 2021, 5, 30–037. [Google Scholar]
  15. Su, Y.; Gao, W.; Guan, D.; Zuo, T. Achieving urban water security: A review of water management approach from technology perspective. Water Resour. Manag. 2020, 34, 4163–4179. [Google Scholar] [CrossRef]
  16. Cheraghalipour, A.; Paydar, M.; Hajiaghaei-Keshteli, M. An integrated approach for collection center selection in reverse logistics. Int. J. Eng. 2017, 30, 1005–1016. [Google Scholar]
  17. Cheraghalipour, A.; Paydar, M.M.; Hajiaghaei-Keshteli, M. Applying a hybrid BWM-VIKOR approach to supplier selection: A case study in the Iranian agricultural implements industry. Int. J. Appl. Decis. Sci. 2018, 11, 274–301. [Google Scholar] [CrossRef]
  18. Liao, Y.; Kaviyani-Charati, M.; Hajiaghaei-Keshteli, M.; Diabat, A. Designing a closed-loop supply chain network for citrus fruits crates considering environmental and economic issues. J. Manuf. Syst. 2020, 55, 199–220. [Google Scholar] [CrossRef]
  19. Sadeghi-Moghaddam, S.; Hajiaghaei-Keshteli, M.; Mahmoodjanloo, M. New approaches in metaheuristics to solve the fixed charge transportation problem in a fuzzy environment. Neural Comput. Appl. 2019, 31, 477–497. [Google Scholar] [CrossRef]
  20. Feng, L.; Zhang, J.; Fan, J.; Wei, L.; He, S.; Wu, H. Tracing dissolved organic matter in inflowing rivers of Nansi Lake as a storage reservoir: Implications for water-quality control. Chemosphere 2022, 286, 131624. [Google Scholar] [CrossRef]
  21. Eftekhari, M.; Akrami, M.; Gheibi, M.; Azizi-Toupkanloo, H.; Fathollahi-Fard, A.M.; Tian, G. Cadmium and copper heavy metal treatment from water resources by high-performance folic acid-graphene oxide nanocomposite adsorbent and evaluation of adsorptive mechanism using computational intelligence, isotherm, kinetic, and thermodynamic analyses. Environ. Sci. Pollut. Res. 2020, 27, 43999–44021. [Google Scholar] [CrossRef]
  22. Mohammadi, M.; Gheibi, M.; Fathollahi-Fard, A.M.; Eftekhari, M.; Kian, Z.; Tian, G. A hybrid computational intelligence approach for bioremediation of amoxicillin based on fungus activities from soil resources and aflatoxin B1 controls. J. Environ. Manag. 2021, 299, 113594. [Google Scholar] [CrossRef] [PubMed]
  23. Kwaansa-Ansah, E.E.; Amenorfe, L.P.; Armah, E.K.; Opoku, F. Human health risk assessment of cyanide levels in water and tuber crops from Kenyasi, a mining community in the Brong Ahafo Region of Ghana. Int. J. Food Contam. 2017, 4, 16. [Google Scholar] [CrossRef] [Green Version]
  24. Ubalua, A.O. Cyanogenic glycosides and the fate of cyanide in soil. Aust. J. Crop Sci. 2010, 4, 223–237. [Google Scholar]
  25. Zhou, Z.; Hu, H.; Xia, L.; Li, G.; Xiao, X. A bisspiropyran fluorescent probe for the selective and rapid detection of cyanide anion in liqueurs. New J. Chem. 2022, 46, 7992–7998. [Google Scholar] [CrossRef]
  26. Onyutha, C.; Kwio-Tamale, J.C. Modelling chlorine residuals in drinking water: A review. J. Environ. Sci. Technol. 2022, 1–18. [Google Scholar] [CrossRef]
  27. Pirmoradi, M.; Hashemian, S.; Shayesteh, M.R. Kinetics and thermodynamics of cyanide removal by ZnO@ NiO nanocrystals. Trans. Nonferrous Met. Soc. China 2017, 27, 1394–1403. [Google Scholar] [CrossRef]
  28. Parga, J.; Shukla, S.; Carrillo-Pedroza, F. Destruction of cyanide waste solutions using chlorine dioxide, ozone and titania sol. Waste Manag. 2003, 23, 183–191. [Google Scholar] [CrossRef]
  29. Dash, R.R.; Balomajumder, C.; Kumar, A. Removal of cyanide from water and wastewater using granular activated carbon. Chem. Eng. J. 2009, 146, 408–413. [Google Scholar] [CrossRef]
  30. Arbabi, M.; Masoudipour, N.; Amiri, M.J. Negative effects of cyanide on health and its removal options from industrial wastewater. Int. J. Epidemiol. Res. 2015, 2, 44–49. [Google Scholar]
  31. Uppal, H.; Tripathy, S.S.; Chawla, S.; Sharma, B.; Dalai, M.; Singh, S.; Singh, S.; Singh, N. Study of cyanide removal from contaminated water using zinc peroxide nanomaterial. J. Environ. Sci. 2017, 55, 76–85. [Google Scholar] [CrossRef]
  32. Rasoulzadeh, H.; Sheikhmohammadi, A.; Abtahi, M.; Alipour, M.; Roshan, B.J. Predicting the capability of diatomite magnano composite boosted with polymer extracted from brown seaweeds for the adsorption of cyanide from water solutions using the response surface methodology: Modelling and optimisation. Int. J. Environ. Anal. Chem. 2021, 1–14. [Google Scholar] [CrossRef]
  33. Singh, N.; Balomajumder, C. Phytoremediation potential of water hyacinth (Eichhornia crassipes) for phenol and cyanide elimination from synthetic/simulated wastewater. Appl. Water Sci. 2021, 11, 144. [Google Scholar] [CrossRef]
  34. Tirado-Muñoz, O.; Tirado-Ballestas, I.; Barbosa Lopez, A.L.; Colina-Marquez, J. Heterogeneous Photocatalytic Pilot Plant for Cyanide decontamination: A novel solar rotary photoreactor. J. Sol. Energy Eng. 2022, 144, 51005. [Google Scholar]
  35. Preis, A.; Ostfeld, A. Multiobjective contaminant sensor network design for water distribution systems. J. Water Resour. Plan. Manag. 2008, 134, 366–377. [Google Scholar] [CrossRef] [Green Version]
  36. Rosario, C.G.A.; Vallenas-Arévalo, A.T.; Arévalo, S.J.; Espinosa, D.C.R.; Tenório, J.A.S. Biodegradation of cyanide using a Bacillus subtilis strain isolated from artisanal gold mining tailings. Braz. J. Chem. Eng. 2022, 1–8. [Google Scholar] [CrossRef]
  37. Li, M.; Li, B.; Chen, J.; Cui, S.; Yang, Y.; Shen, X.; Liu, K.; Han, Q. Purifying cyanide-bearing wastewaters by electrochemical precipitate process using sacrificial Zn anode. Sep. Purif. Technol. 2022, 284, 120250. [Google Scholar] [CrossRef]
  38. Verma, V.; Ghosh, P.; Singh, S.B.; Gupta, V.; Chaudhari, P.K. Kinetics of catalytic treatment of coking wastewater (COD, phenol and cyanide) using wet air oxidation. Int. J. Chem. React. Eng. 2022, 20, 325–341. [Google Scholar] [CrossRef]
  39. Pan, Y.; Zhang, Y.; Huang, Y.; Jia, Y.; Chen, L. Enhanced photocatalytic oxidation degradability for real cyanide wastewater by designing photocatalyst GO/TiO2/ZSM-5: Performance and mechanism research. Chem. Eng. J. 2022, 428, 131257. [Google Scholar] [CrossRef]
  40. Kalboussi, N.; Biard, Y.; Pradeleix, L.; Rapaport, A.; Sinfort, C.; Ait-Mouheb, N. Life cycle assessment as decision support tool for water reuse in agriculture irrigation. Sci. Total Environ. 2022, 836, 155486. [Google Scholar] [CrossRef]
  41. Pouresmaeil, H.; Faramarz, M.G.; ZamaniKherad, M.; Gheibi, M.; Fathollahi-Fard, A.M.; Behzadian, K.; Tian, G. A decision support system for coagulation and flocculation processes using the adaptive neuro-fuzzy inference system. Int. J. Environ. Sci. Technol. 2022, 1–12. [Google Scholar] [CrossRef]
  42. Bilger, E.; Wolf, H. Method for the Colorimetric Determination of the Cyanide Concentration of Aqueous Solutions. U.S. Patent No. 4,871,681, 3 October 1989. [Google Scholar]
  43. Gheibi, M.; Emrani, N.; Eftekhari, M.; Akrami, M.; Abdollahi, J.; Ramezani, M.; Sedghian, A. Experimental investigation and mathematical modeling for microbial removal using potassium permanganate as an oxidant—case study: Water treatment plant No. 1, Mashhad, Iran. Environ. Monit. Assess. 2019, 191, 141. [Google Scholar] [CrossRef]
  44. De Jong, K.A. An Analysis of the Behavior of a Class of Genetic Adaptive Systems; University of Michigan: Ann Arbor, MI, USA, 1975. [Google Scholar]
  45. Azé, J.; Bourquard, T.; Hamel, S.; Poupon, A.; Ritchie, D.W. Using Kendall-τ meta-bagging to improve protein-protein docking predictions. In Proceedings of the IAPR International Conference on Pattern Recognition in Bioinformatics, Delf, The Netherlands, 2–4 November 2011; pp. 284–295. [Google Scholar]
  46. Al-Rousan, N.; Al-Najjar, H.; Alomari, O. Assessment of predicting hourly global solar radiation in Jordan based on rules, trees, meta, lazy and function prediction methods. Sustain. Energy Technol. Assess. 2021, 44, 100923. [Google Scholar] [CrossRef]
  47. Alnuaim, A.A.; Zakariah, M.; Shukla, P.K.; Alhadlaq, A.; Hatamleh, W.A.; Tarazi, H.; Sureshbabu, R.; Ratna, R. Human-Computer Interaction for Recognizing Speech Emotions Using Multilayer Perceptron Classifier. J. Healthc. Eng. 2022, 2022, 6005446. [Google Scholar] [CrossRef] [PubMed]
  48. Gholizadeh, H.; Fathollahi-Fard, A.M.; Fazlollahtabar, H.; Charles, V. Fuzzy data-driven scenario-based robust data envelopment analysis for prediction and optimisation of an electrical discharge machine’s parameters. Expert Syst. Appl. 2022, 193, 116419. [Google Scholar] [CrossRef]
  49. Botz, M.M. Overview of cyanide treatment methods. Min. Environ. Manag. Min. J. 2001, 28, 30. [Google Scholar]
  50. Manyuchi, M.; Sukdeo, N.; Stinner, W. Potential to remove heavy metals and cyanide from gold mining wastewater using biochar. Phys. Chem. Earth Parts A/B/C 2022, 126, 103110. [Google Scholar] [CrossRef]
  51. Alvillo-Rivera, A.J.; Garrido-Hoyos, S.E.; Buitrón, G.J.E.S.; Research, P. Cyanide treatment of mining tailings using suspended biomass and moving bed biomass reactors. Environ. Sci. Pollut. Res. 2022, 29, 37458–37470. [Google Scholar] [CrossRef]
  52. Geng, B.; Fan, J.; Shi, M.; Zhang, S.; Li, J.J.C. Control of maximum water age based on total chlorine decay in secondary water supply system. Chemosphere 2022, 287, 132198. [Google Scholar] [CrossRef]
  53. Okoji, C.N.; Okoji, A.I.; Ibrahim, M.S.; Obinna, O. Comparative analysis of adaptive neuro-fuzzy inference system (ANFIS) and RSRM models to predict DBP (trihalomethanes) levels in the water treatment plant. Arab. J. Chem. 2022, 15, 103794. [Google Scholar] [CrossRef]
  54. Liu, J.-L.; Han, X.; Zhang, J.; Wang, H.-J.; Zhou, M.-X.; Li, S.-W.; Ma, X.; Wang, Y.; Liu, A.-L. Total organic halogen in two drinking water supply systems: Occurrence, variations, and relationship with trihalomethanes. Chemosphere 2022, 288, 132541. [Google Scholar] [CrossRef]
  55. Amiri, S.A.H.S.; Zahedi, A.; Kazemi, M.; Soroor, J.; Hajiaghaei-Keshteli, M. Determination of the optimal sales level of perishable goods in a two-echelon supply chain network. Comput. Ind. Eng. 2020, 139, 106156. [Google Scholar] [CrossRef]
  56. Golmohamadi, S.; Tavakkoli-Moghaddam, R.; Hajiaghaei-Keshteli, M. Solving a fuzzy fixed charge solid transportation problem using batch transferring by new approaches in meta-heuristic. Electron. Notes Discret. Math. 2017, 58, 143–150. [Google Scholar] [CrossRef]
  57. Hajiaghaei-Keshteli, M.; Sajadifar, S.M.; Haji, R.J. Determination of the economical policy of a three-echelon inventory system with (R, Q) ordering policy and information sharing. Int. J. Adv. Manuf. Technol. 2011, 55, 831–841. [Google Scholar] [CrossRef]
  58. Hajiaghaei-Keshteli, M.; Sajadifar, S.M. Deriving the cost function for a class of three-echelon inventory system with N-retailers and one-for-one ordering policy. Int. J. Adv. Manuf. Technol. 2010, 50, 343–351. [Google Scholar] [CrossRef]
  59. Yazdani, M.; Jolai, F. Lion optimization algorithm (LOA): A nature-inspired metaheuristic algorithm. J. Comput. Des. Eng. 2016, 3, 24–36. [Google Scholar] [CrossRef] [Green Version]
  60. Fathollahi-Fard, A.M.; Hajiaghaei-Keshteli, M.; Tavakkoli-Moghaddam, R. The social engineering optimizer (SEO). Eng. Appl. Artif. Intell. 2018, 72, 267–293. [Google Scholar] [CrossRef]
  61. Fathollahi-Fard, A.M.; Hajiaghaei-Keshteli, M.; Tavakkoli-Moghaddam, R. Red deer algorithm (RDA): A new nature-inspired meta-heuristic. Soft Comput. 2020, 24, 14637–14665. [Google Scholar] [CrossRef]
Figure 1. Estimated number of deaths with causes from 1990–2019, Data from, Institute for Health Metrics and Evaluation, the Global Burden of Disease (GBD) study 2019 (available at: http://ghdx.healthdata.org/gbd-results-tool accessed on 8 May 2022).
Infrastructures 07 00088 g001
Figure 2. The relation between SDGs and maintaining drinking water quality [16,17,18,19].
Infrastructures 07 00088 g002
Figure 3. The details of DSS in the present research.
Infrastructures 07 00088 g003
Figure 4. The case study location.
Infrastructures 07 00088 g004
Figure 5. The characterization of GA computation in the research.
Infrastructures 07 00088 g005
Figure 6. The structure of applied machine learning computations in the study based on (a) Meta Bagging (b) Meta Random Committee, and (c) Functions Multilayer Perceptron.
Infrastructures 07 00088 g006
Figure 7. Diagram of changes of the residual cyanide in water at various concentrations of the injected chlorine as per—(a) low contamination scenario ([CN] = 2.5 mg L−1), (b) medium contamination scenario ([CN] = 5 mg L−1), and (c) high contamination scenario ([CN] = 7.5 mg L−1).
Infrastructures 07 00088 g007
Figure 8. The trend of cost functions in different iterations.
Infrastructures 07 00088 g008
Figure 9. Heat map of available data due to machine learning computations in the present research. (a) Initial CN/Injected chlorine, ammonia, and RCN; (b) T and pH; (c) VDS.
Infrastructures 07 00088 g009
Figure 10. The normal diagram of available data in the present research. (a) Initial CN/Injected chlorine, ammonia, and RCN; (b) T and pH; (c) VDS.
Infrastructures 07 00088 g010
Figure 11. Sensitive analysis of the most important factors on RCN in the present research.
Infrastructures 07 00088 g011
Figure 12. Map of SDGs impact assessment.
Infrastructures 07 00088 g012
Table 1. Stages of cyanide detection experiment according to US Patent 4871681A [42].
Test StagesDescription
1Pour 25 mL of the testing solution in the beaker
2Add 5 mL of Na2CO3 0.5 mol L−1
3Add 5 mL Picric acid (1% w/v) into the beaker
4Heat the container to near boiling point to get the color changes
5Let the samples to cool at room temperature
6Measure the absorptions of the standard and testing samples at the wavelength of 520 nm
Table 2. Raw materials and instruments specifications.
NameFormula/Model of InstrumentSource
Raw materialsSodium carbonateNa2CO3Merck, Germany
Sodium hypochloriteNaOClMerck, Germany
Picric acidC6H3N3O7Merck, Germany
Potassium cyanideKCNMerck, Germany
InstrumentsUV-visible Spectroscopy SystemAgilent 8453Agilent Technologies, United States
Table 3. Mathematical models for predicting residual cyanide based on the injected chlorine dose in different scenarios of contamination ((1) [CN] = 2.5 mg L−1, (2) [CN] = 5 mg L−1, (3) [CN] = 7.5 mg L−1).
Model’s NameGeneral FormScenario Num.Typical ContentSSERMSER2
Exponential R C N = a × e x p b × C C + c × e x p d × C C 1 a = 2.57 b = 0.3 c = 0.0002 d = 2.901 0.010.050.97
2 a = 5.774 b = 0.365 c = 0 d = 0 0.020.080.91
3 a = 840.1   b = 1.35   c = 0 d = 0 0.010.030.95
Fourier R C N = a 0 + a 1 × c o s C C × w + b 1 × s i n C C × w 1 a 0 = 1.357 e + 06   a 1 = 1.357 e + 06   b 1 = 583.5   w = 0.0004893 0.010.070.96
2 a 0 = 2.851   a 1 = 2.273   b 1 = 1.059   w = 0.5098 0.010.060.97
3 a 0 = 1.844 e + 05   a 1 = 1.844 e + 05   b 1 = 2447   w = 0.001915 0.000.010.99
Gaussian R C N = a 1 × e x p C C b 1 c 1 2 + a 2 × e x p C C b 2 c 2 2 1 a 1 = 0   b 1 = 4.913   c 1 = 0.5982   a 2 = 2.481   b 2 = 0.1276   c 2 = 2.155 0.010.010.93
2 a 1 = 5.113 b 1 = 0.3064 c 1 = 3.276 a 2 = 0 b 2 = 0 c 2 = 0 0.010.010.97
3 a 1 = 2.292 b 1 = 3.877 c 1 = 1.307 a 2 = 0 b 2 = 0 c 2 = 0 0.000.010.98
Rational R C N = p 1 × C C 2 + p 2 × C C + p 3 q 1 × C C 2 + q 2 × C C + q 3 1 p 1 = 678.8   p 2 = 1193   p 3 = 1.037 e + 04   q 1 = 0   q 2 = 1   q 3 = 4179 0.010.080.96
2 p 1 = 0   p 2 = 9.897   p 3 = 60.37   q 1 = 1   q 2 = 1.41   q 3 = 11.94 0.010.040.97
3 p 1 = 0   p 2 = 2.532   p 3 = 15.72   q 1 = 0   q 2 = 1   q 3 = 2.161 0.000.010.99
Polynomial R C N = p 1 × C C 2 + p 2 × C C + p 3 1 p 1 = 0.1624   p 2 = 0.2855   p 3 = 2.48 0.010.040.96
2 p 1 = 0.02926   p 2 = 1.2   p 3 = 5.357 0.020.020.96
3 p 1 = 0.3383   p 2 = 4.688   p 3 = 16.08 0.000.010.99
Table 4. The outputs of ANOVA method in the present research.
SourceSum of SquaresdfMean SquareF Valuep-Value (Prob > F)
Model46.1012467.68354161.54065<0.0001significant
A-pH0.0177610.017760.1422470.7092
B-VDS0.08386610.0838660.6717210.4202
C-T0.29151910.2915192.33490.1391
D-Initial CN16.59342116.59342132.9036<0.0001
E-Ammonia0.2699210.269922.1619010.1539
F-Cl232.6946132.6946261.8646<0.0001
Residual3.121328250.124853
Cor Total49.2225731
Table 5. The outputs of AI computations in the present research.
Statistical parametersMeta BaggingMeta Random CommitteeFunctions Multilayer Perceptron
Correlation coefficient0.900.840.99
Mean absolute error0.610.810.3
Root mean squared error0.811.120.36
Relative absolute error62.37%70.88%26.49 %
Root relative squared error72.73%83.78%26.98%
Description Equation (S1)Equation (S2)Equation (S3)
Publisher’s Note: MDPI stays neutral with regard to jurisdictional claims in published maps and institutional affiliations.

