Article

The Growing Infrastructure Crisis: The Challenge of Scour Risk Assessment and the Development of a New Sensing System

by
Panagiotis Michalis
* and
Elizabeth Vintzileou
School of Civil Engineering, National Technical University of Athens, 15773 Athens, Greece
*
Author to whom correspondence should be addressed.
Infrastructures 2022, 7(5), 68; https://doi.org/10.3390/infrastructures7050068
Submission received: 5 March 2022 / Revised: 16 April 2022 / Accepted: 19 April 2022 / Published: 5 May 2022
(This article belongs to the Special Issue Road and Rail Infrastructures)

Abstract

:
Scour action is one of the main factors that add significant stress to the growing infrastructure crisis as it is considered one of the most destructive flood-related hazards occurring around underwater foundation elements. Recent cases of bridge failures have highlighted the need for a reliable scour monitoring and early warning system to assess flood and geo-hazards in real-time, providing advanced key info for repair and maintenance actions. Despite the past efforts to provide such a system for scour assessment, most of the developed instruments were not able to offer a reliable solution for scour monitoring, due to technical and cost issues. As a result, there currently exists a gap in the knowledge and understanding of scour mechanism during flood incidents. This study presents the development of a new sensing system to assess hydro-hazards at bridge infrastructure. It initially focuses on factors contributing to the growing infrastructure crisis and provides an overview of the current practices and assessment procedures to assess scour processes and a summary of advantages and limitations of existing monitoring efforts. A new monitoring concept for assessing scour and sediment deposition processes is then presented focusing on modelling the geometric components of a new sensor which is evaluated in simulations under different environments that represent prospective field conditions. Main results are analysed and presented focusing on key criteria that maximize sensitivity of the sensor to scour and sedimentation processes. The obtained results indicate that the sensor has the potential to provide a new monitoring device for scour and sediment deposition monitoring, and it is proposed to be further developed and assessed in laboratory and field conditions. This study aspires to contribute to the ongoing discourse on the use of sensing techniques to monitor, assess, and manage scour action effectively.

1. Introduction

Critical transportation infrastructure is one of the socio-economic backbones of our society. However, nowadays several factors exist that amplify and contribute to the existing growing infrastructure crisis:
  • Ageing infrastructure: The main bridge stock of the Trans-European Transport Network (TEN-T) presents a major issue for European countries. For example, 47% of bridges in Germany are more than 40 years old with an estimated deficiency rate at 37%, while in France and UK, the estimated number of bridges is 233,500 and 155,000 with the rate of defects at 39% and 30%, respectively [1]. Similarly, in the US, the 2020 infrastructure report card published by the American Society of Civil Engineers (ASCE) estimated that almost 42% of more than 617,000 bridges have exceeded their conventional 50-year design lifespan, while 7.5% of bridge stock is designated as structurally deficient [2]. The ageing critical infrastructure indicates that an increasing number of bridges will soon need major rehabilitation or retirement. In many instances, countries lack modern databases and of knowledge about the population of bridges [3], while in many occasions the ‘as built’ information of these ageing structures is also not available. Bridge stock is also owned and managed by various bodies using different management practices [4] and various asset management systems [5], which makes their condition assessment a challenging issue. As a result, countries need to urgently address maintenance and rehabilitation issues to ensure resilience, serviceability and safety of ageing transportation network [6,7].
  • Shifting extreme climatic conditions: In view of climate change predictions [8,9] which anticipate an increase in the intensity of precipitation, bridge failures are also expected to increase due to more frequent or intense flooding. Bridge collapse-inducing flow return periods also vary considerably and are often frequently lower than values considered in many climate impact assessments [10]. As a result, the existing methods that incorporate flood risk into bridge design methods do not capture significant variability associated with collapse return periods.
  • ‘Living’ rivers: Around 82% of the bridges’ cross waterways are anticipated to change morphologically due to their dynamic nature during their lifetime. Soil erosion, sediment transport and deposition processes pose a major threat to infrastructure constructed over ‘living’ rivers. As a result of these processes occurring in river environment, the predominant mode of bridge failures worldwide is considered the combination of flooding and scour effects [11].
  • Socio-economic impact: Hazards associated with highly disruptive and cascading incidents on critical infrastructure systems have major social and economic impact for the general public, the affected regions but also the maintainers and asset owners [12,13]. The direct cost of a bridge failure alone is estimated to be two or three times greater compared to the original cost of the bridge [14]. However, the indirect costs of structural failures suffered by the public, business and industry have estimated to be five times greater than the direct costs of bridge repair [15].
Scour processes therefore pose an important threat to bridge stock as it is expected to occur at most of the hydraulic structures during their service life [16]. This is highlighted by major incidents of bridge failures, associated with fatalities, disruption and significant direct and indirect costs, as a result of the lack of reliable methods to quantify scour depth at structures. In Europe, this has been evidenced by the cases of the Malahide Viaduct failure (Ireland, 2009), the closure of more than 15 bridges in Cumbria (England, 2009) during a period of extensive floods, and the Hintze Ribeiro bridge failure (Portugal, 2001) with 59 fatalities. In Greece, with an estimated number of 17,000 bridges [17], scour has also been the main reason of many structural collapses that led to major disruption of the transport network. Recent cases include: the railway bridge over Ksirias stream (Magnisia region, 2006); a bridge on the Athens-Thessaloniki motorway over Ziliana stream (Pieria region, 2008); Diava bridge over Pineios river (Kalabaka region, 2016); a bridge failure over Kompsato river (Rodopi region, 2017); more than 10 bridge collapses in major flood events in Karditsa region during 2020. Scour processes triggered by extensive flooding has also been the main issue resulting in degradation of cultural monuments such as the high-profile collapse of 18th-century Plaka Bridge over Arachthos river (Arta region, 2015), the third largest one-arch stone bridge in Europe.
These incidents highlight the fact that scour and its combined effect with other hazards can substantially increase bridge risk [4] and cause catastrophic bridge failures, occasionally without prior visual warning. At the same time, they indicate the limitations of the current inspection practices to assess erosion processes. Consequently, scour hazard leads to destructive direct consequences for infrastructure owners/insurers/maintainers due to high direct costs associated with bridge repair and replacement [18].
The main motivation of this work is to explore the development of a new sensing instrument to assess scour risk and potentially fulfil a useful role for cost-effective management of scour susceptible structures. The optimization of the new sensor geometric characteristics is presented for the first time in this study, which can enable continuous monitoring of both scour and sediment deposition conditions at bridge sites. The remainder of this article is structured as follows: Section 2 focuses on the identification of the main issues that arise from the current scour assessment practice and provides and overview of the advantages and limitations of the existing monitoring procedures. Section 3 presents the monitoring concept, measuring principle and conceptual application of the sensor. The main investigation presented in Section 4 focuses on the development of a new sensor for assessing scour and sediment deposition processes. Finite element modelling (FEM) is performed to define and assess key criteria that maximise the sensitivity of the sensor to scour and sedimentation processes, such as extend and magnitude of generated electrostatic field between sensor electrodes, capacitance obtained in various simulated conditions and ability to monitor target processes. Finally, Section 5 presents recommendations for future research followed by the conclusions.

2. Overview of Scour and Backfilling Processes

Scour is a natural phenomenon that involves the interaction between hydraulic conditions and mobile erodible bed materials. Short-term scour is caused by single flash floods with high intensity, which is difficult to estimate as a result of limited existing information with regard to rates of natural scour [19] due a to lack of complete field datasets. The eroded areas start to be re-filled again (i.e., backfilling process) as the flow reduces [20]. However, scour is a time-dependent process and continues to develop after the peak of a flood. The need to obtain real-time information about the scour evolution during flood events is therefore critical.

2.1. Scour Assessment and Monitoring Procedures

Monitoring is an important tool in the assessment of the ongoing performance of critical infrastructure [21]. Although it does not offer a solution to problems directly associated with scour at hydraulic and marine structures, monitoring can provide advanced warning for the public safety and collect data from the field necessary to provide a critical insight about the evolution of the scour mechanism. This enables proactive asset management including strategic maintenance actions and prioritisation of human resources, but it also leads to improved scour mitigation strategies and resilience to climatic hazards.
Over the past decades, several efforts [22,23,24,25,26,27,28,29,30,31,32,33,34] focused on the development and application of scour monitoring techniques. These are based on Sonar, Time-Domain Reflectometry (TDR), passive Radio frequency identification (RFID) technology, Ground Penetrating Radar (GPR), and vibration-based methods to provide real-time assessment of scour conditions around structural elements. Recent studies [33,34] also investigated, for the first time, the Amplitude Domain Reflectometry (ADR) method, which successfully measured scour and sediment deposition processes. However, the majority of these methods have not managed to establish a reliable and efficient solution for scour monitoring addressing the wide course of scour challenges. The main limitations of the developed techniques are mainly due to the high cost, the complexity of the equipment, the capability of providing repeatable and reliable information, the complicated data interpretation, and the harsh environmental conditions [35]. An overview and assessment of the main existing scour monitoring methods alongside with advantages and limitations is presented in Table 1.

2.2. Main Issues That Arise from Current Scour Assessment Practice

The current bridge inspection practice relies on specialist diver engineers carrying out underwater examinations of structural elements [47]. This method is not reliable as bridges are inspected at intervals of several years, posing many threats to bridges due to scour effects, especially during yearly gaps between the inspections. For example, in the UK and Ireland, special inspections requiring an underwater examination of the structural elements take place at time intervals of six years or after specific events (e.g., major floods) [47,48]. Similarly, in the US, scour at hydraulic structures is being evaluated with visual inspections at time intervals of five years [49]. Considering that road infrastructure is subject to more intense and frequent extreme events within its design life, visual inspection practice cannot provide reliable assessment of scour effects between these long-time intervals, leading to undetected scour areas and ultimately catastrophic failures.
Another major issue relies on the fact that most of the assessment and monitoring methods are not able to identify scour holes ‘masked’ by backfill soil [50]. This is of significant importance, as backfill sediment does not have the same soil properties as the original soil [33], and it is easily eroded again during smaller-scale floods compromising the integrity of structures. The limited tools to reliably assess hydro-hazards at bridges, make scour risk assessment a particularly challenging issue. Thus, the research opportunity arises to develop new sensing instruments and structural health monitoring methods that can provide direct and real-time assessment of both scour and sediment deposition conditions and potentially enhance the current understanding of bed level processes under extreme hydrodynamic effects.

3. A New Monitoring Concept

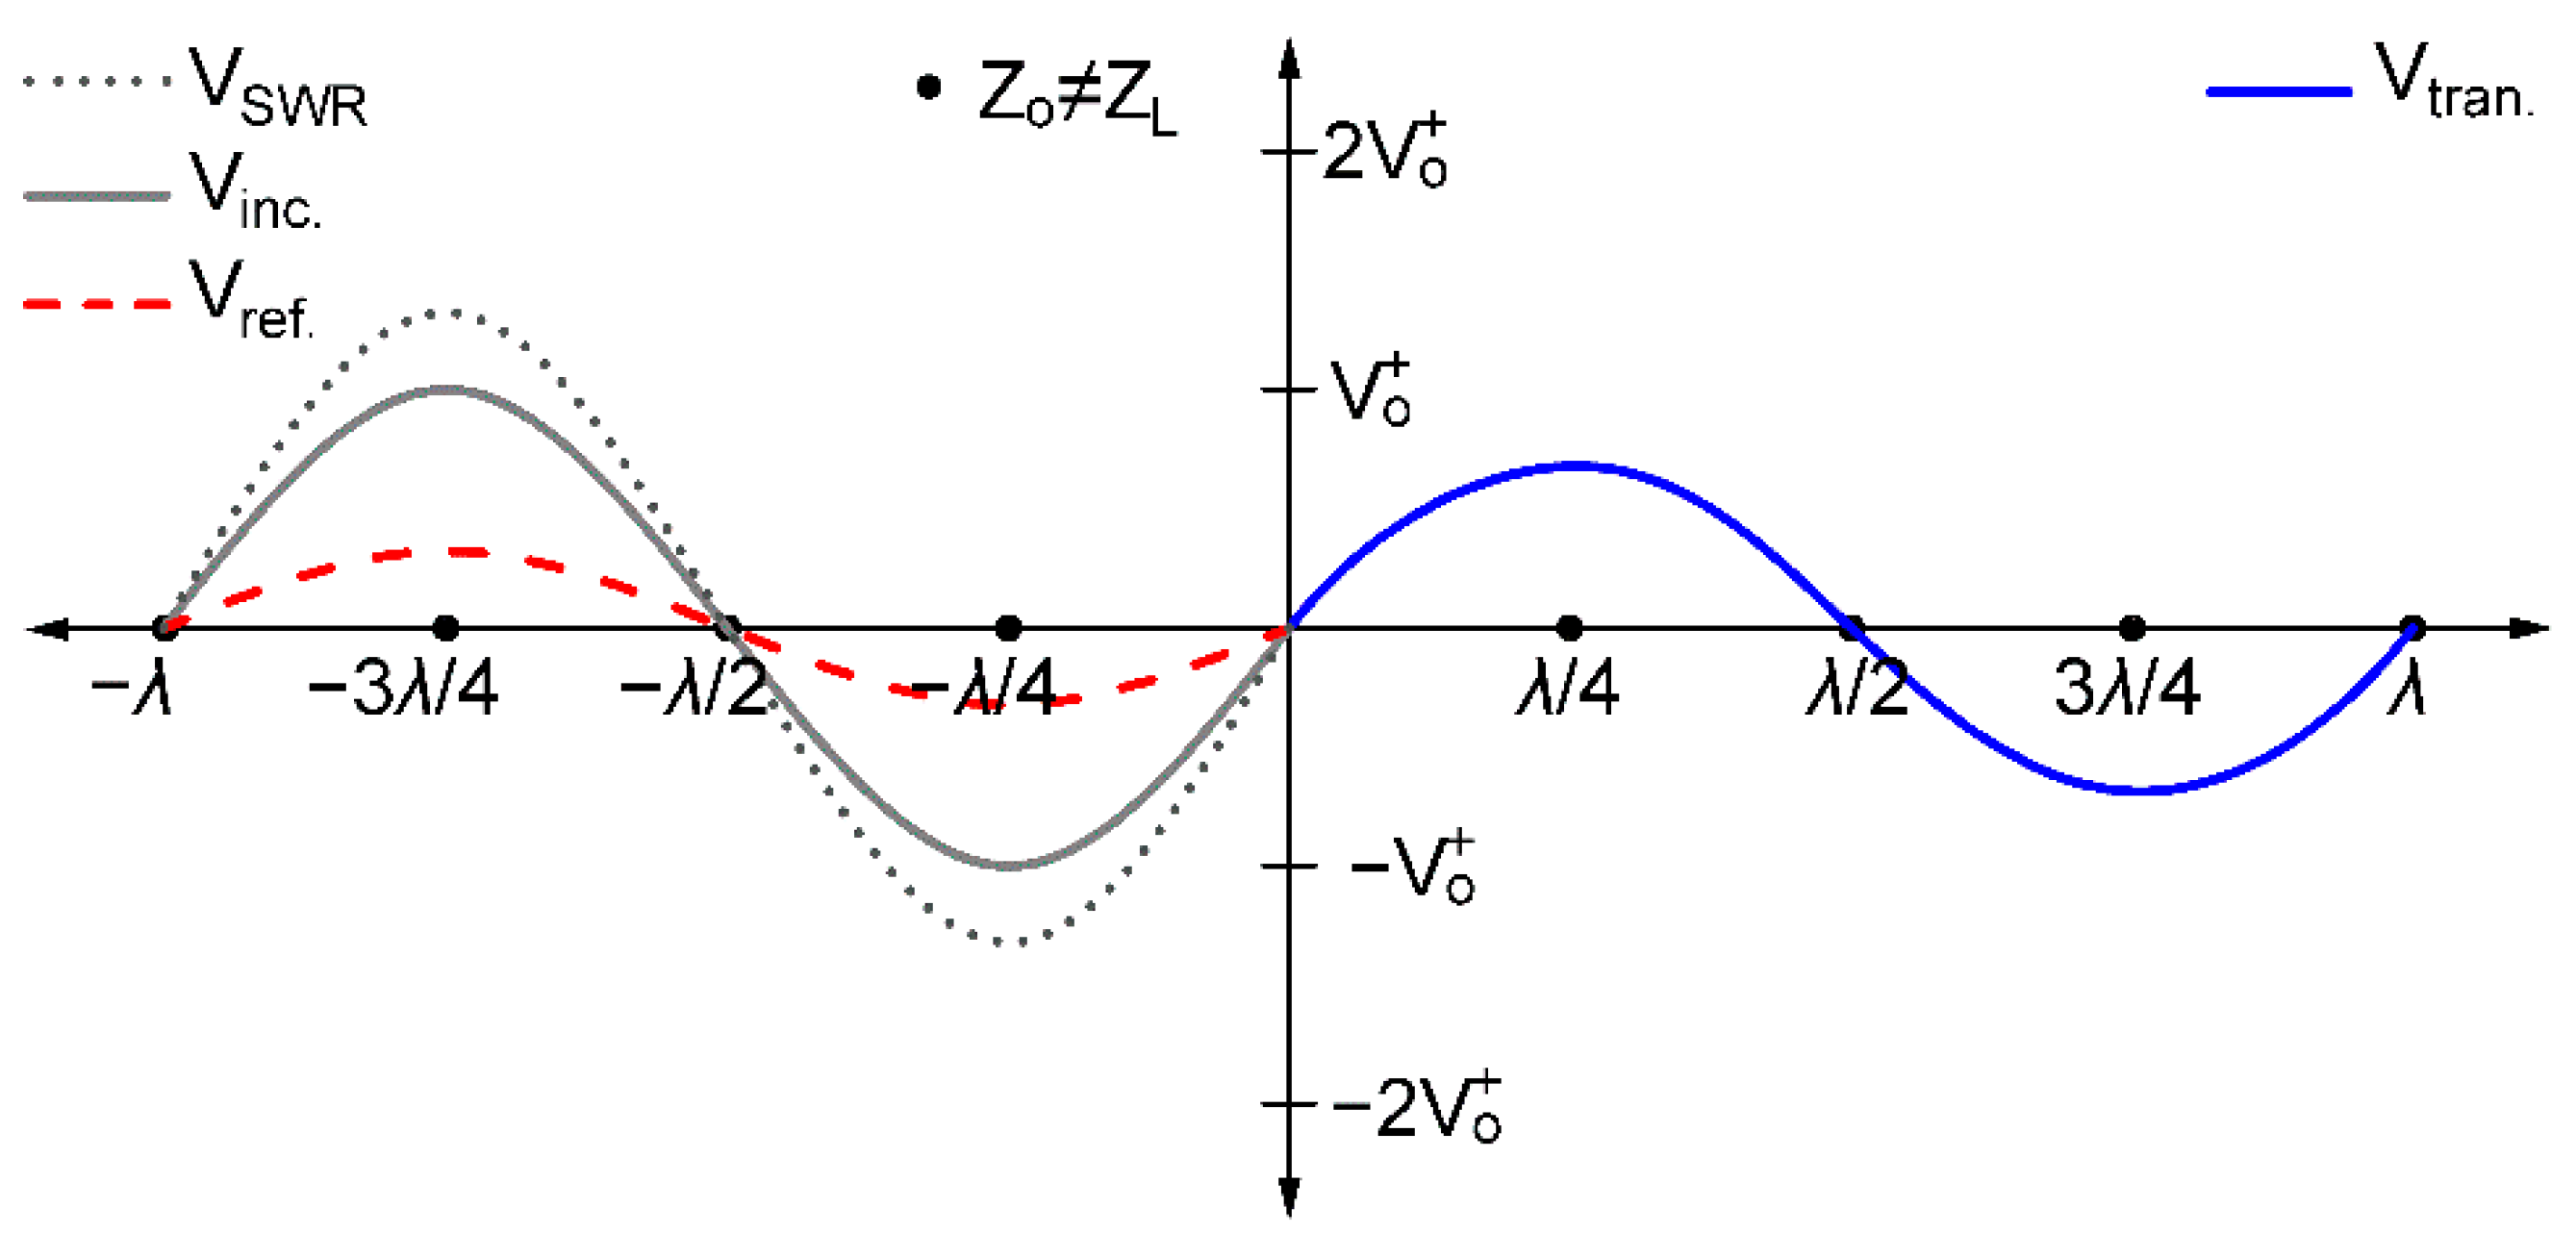
3.1. Measuring Principle

The measuring principle of the proposed scour sensing system is based on the detection of perturbations in the electrical properties of objects surrounding the environment of the instrument. It is based on electromagnetic waves travelling along a transmission line, which are expected to encounter an impedance change at boundaries between materials with different electrical properties. Figure 1 provides an example of the generated voltage patterns. In the case of an impedance mismatch (Zo ≠ ZL), the incident wave (Vinc.) is partitioned to transmitted (Vtran.) and reflected (Vref.) signals. As a result, a standing wave (VSWR) is formed in the incident transmission line while the transmitted wave amplitude is reduced.
By measuring the reflection and transmission parameters of a sensing device it is possible to characterise a transmission line and extract important information about the permittivity (ε) of the medium (i.e., the ability of a material to be polarized by an electric field [51]) that the instrument is inserted. For example, scour conditions (i.e., sensor exposed in water conditions) will correspond to the permittivity value of water (εw ≈ 80), compared to the permittivity values of saturated sediment (εs = 23 ÷ 30) and deposited sediment conditions (εd ≈ 30 ÷ 38) [33]. The large contrast of the permittivity values obtained in the aforementioned conditions will therefore enable to assess scour depth but also to differentiate between original saturated and deposited soil conditions.

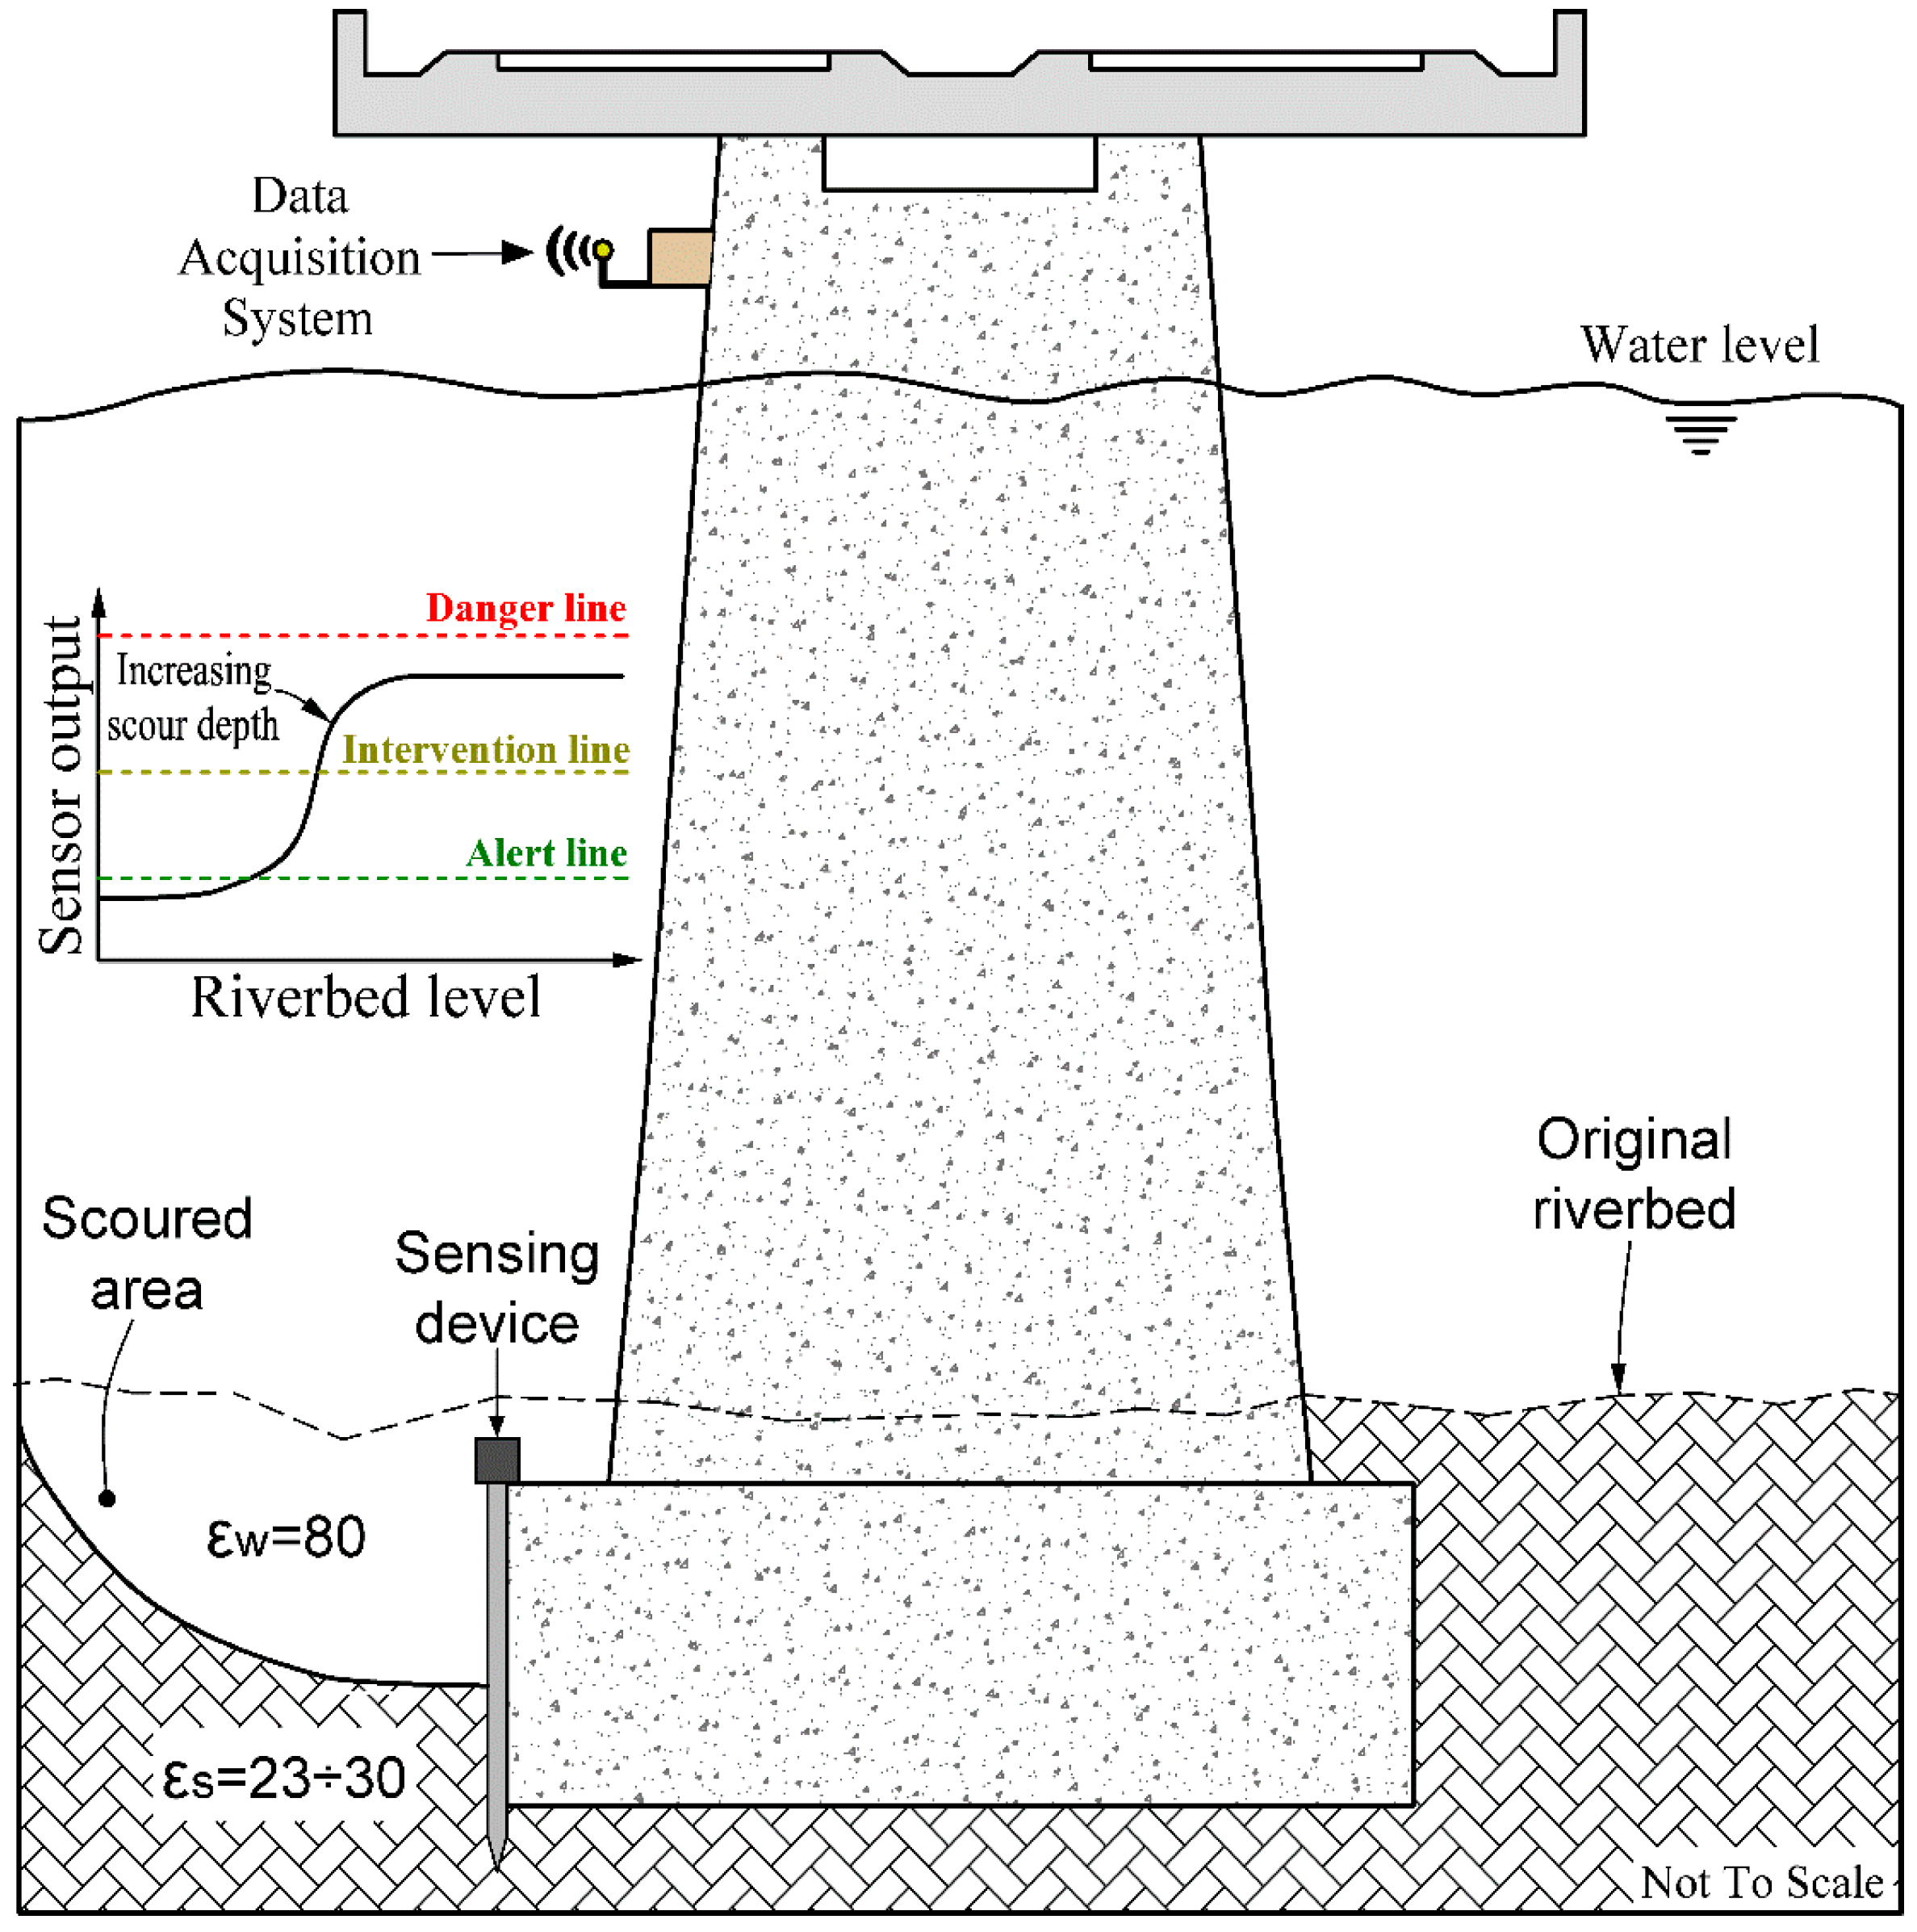
3.2. Conceptual Sensor Components and Application

The conceptual sensor components are presented in Figure 2 and consist of two electrodes attached to a solid structure, which is inserted into a protective access tube. The electrodes generate an electromagnetic field that penetrates the external medium outside the access tube. The total capacitance generated by the sensor depends on the capacitors that correspond to the plexiglass structure, the air, the access tube and the external simulated medium which depends on the permittivity value. The geometric components of the sensor remain constant indicating that the output of the sensor is primarily dependent of the capacitance of the medium that is inserted. The change in the obtained capacitance value of the sensor is therefore employed to provide an indication of scour and sedimentation depth around the sensor location.
An indicative conceptual application of the scour sensor is presented in Figure 3 alongside the typical sensor response that is anticipated during scour evolution around the bridge foundation. During the scouring process, the original riverbed (εs = 23–30) will be gradually substituted by water (εw = 80) conditions. This change in the medium permittivity conditions will cause an increase in the sensor signal, which will indicate a corresponding increase in the scour depth around the sensor location. The sensing system can be coupled by an early warning system in which the signal is transmitted through the data acquisition system to structure maintainer/asset owner. Critical threshold levels can be determined so the scour sensor is able to exceed certain pre-defined values indicating the alert, intervention and danger lines (see Figure 3). This will allow precautionary actions to be carried out increasing safety and reducing bridge maintenance/rehabilitation costs.
In the example demonstrated in Figure 3, the sensing device is shown to be installed on the side of a bridge pier. However, it should be noted that the exact location of the sensor should be derived from the examination of the different factors that influence evolution of scour, as it is considered a complex process. Certain scour development parameters (e.g., size and shape of structural element, riverbed material, river morphology, sedimentation and scour zones, angle of attack of flood flow to the pier, debris risk) need to be taken into account, so that the instrumentation satisfies the requirements of each individual bridge and river. Similarly, for the sensor installation around the bridge pier, the anticipated formation of scour holes and the different scour development patterns that may occur in cohesive compared to non-cohesive sediments should also be taken into account [52,53]. The latter influences the installation location of the sensing device and whether it will be attached into the foundation structure or will be placed at a certain distance from the bridge foundation. Finally, the size of the sensing device installed into the riverbed is influenced by other factors that also need to be determined, e.g., debris impact risk, influence of device on local scour, etc.
Instruments based on similar concepts (i.e., using probe-shaped sensing units installed into the riverbed) have been applied in the past for monitoring scour conditions at bridge structures (see also Table 1) as permanent scour monitoring instruments. For example, the ADR sensor has been experimentally assessed under different environmental conditions in the flume laboratory, and the obtained results indicated that the instrument is able to monitor scour and sediment deposition conditions [33,34]. However, the ADR probe consists of ring-shape electrodes which are located at pre-determined depth intervals. This indicates that scour depth is determined only when bed level surpasses the sensor location; therefore, the instrument cannot provide continuous monitoring of scour along the probe length. Fixed probe sensors based on TDR technology have also been assessed in both laboratory and field conditions for the same purpose as they can provide advanced accuracy of scour evolution along the probe length [25,32]. However, major limitations of TDR instruments lie in the complicated signal interpretation [41] and the high cost of equipment [25].
In light of the limitations of previous scour monitoring efforts, the next sections focused on the investigation via FEM of a new sensor to assess bed level variations. The main aim was to optimise the electrode geometrical characteristics to allow continuous scour monitoring along the probe length, with easy to deploy electrode design and with satisfactory accuracy to assess bed level variations in various simulated environmental conditions.

4. Modelling of a New Sensor

4.1. Input Parameters and Sensor Geometry

The optimum sensor geometry was defined using the two-dimensional (2D) finite element software Maxwell 2D. The study focused on simulating various permittivity conditions that are expected to occur in a representative environment and corresponded to air (εa = 1.0006), saturated sediment (εs = 25), water (εw = 80) and deposited sediment (εd = 35) conditions. Two strip electrodes were simulated in order to define their optimum size and location according to the computed capacitance and the magnitude of the electric flux density (magD). The magD describes the displacement effects of an electric field on the polarisation or bound charges within a dielectric material.
The main aim of the simulations was to define the optimum electrode components of a prospective sensor for the purpose of scour and sediment deposition monitoring based on the following parameters:
  • The extent and magnitude of the electrostatic field penetration in the surrounding medium;
  • The capacitance difference between (a) water and saturated soil conditions, and (b) saturated soil and deposited sediments;
  • The increased magnitude and electric potential between the simulated electrodes.
The model was simulated in the XY plane, and the solver was defined as electrostatic. In 2D elements, the simulation of the cross section is extended infinitely in the orthogonal directions; therefore, the total capacitance that is generated between the strip electrodes was calculated in picoFarads per meter (pF/m). The boundary conditions were set to ‘balloon’, which models the case where the structure is assumed to be infinitely far away from all other electromagnetic sources. The electric potentials of the two strip electrodes were set to +1 Volt (V) and 0 V, respectively.
With regard to the inner cross section, a solid rectangular was simulated as this is expected to add durability for field application purposes and at the same time is anticipated to weaken the external field penetration. The simulated inner cross section therefore comprised of a solid plexiglass structure attached to two mirrored strip electrodes. The permittivity values assigned in the model are presented in Figure 4. A fiberglass access tube was also deemed to be necessary to add durability and resilience of the system to external environmental conditions and was included in the simulations to investigate its effect on the computed capacitance and its influence on the sensitivity of the sensor. An air gap between sensor electrodes was also simulated to investigate the effect of air into the computed capacitance.
The model solver set-up was adjusted to 10% refinement per pass with 10 requested passes, while the error was set to 0.01% to enable us to capture in detail field characteristics into the areas of interest (i.e., next to strip electrodes). The generated typical mesh for simulated water conditions is shown in Figure 5.

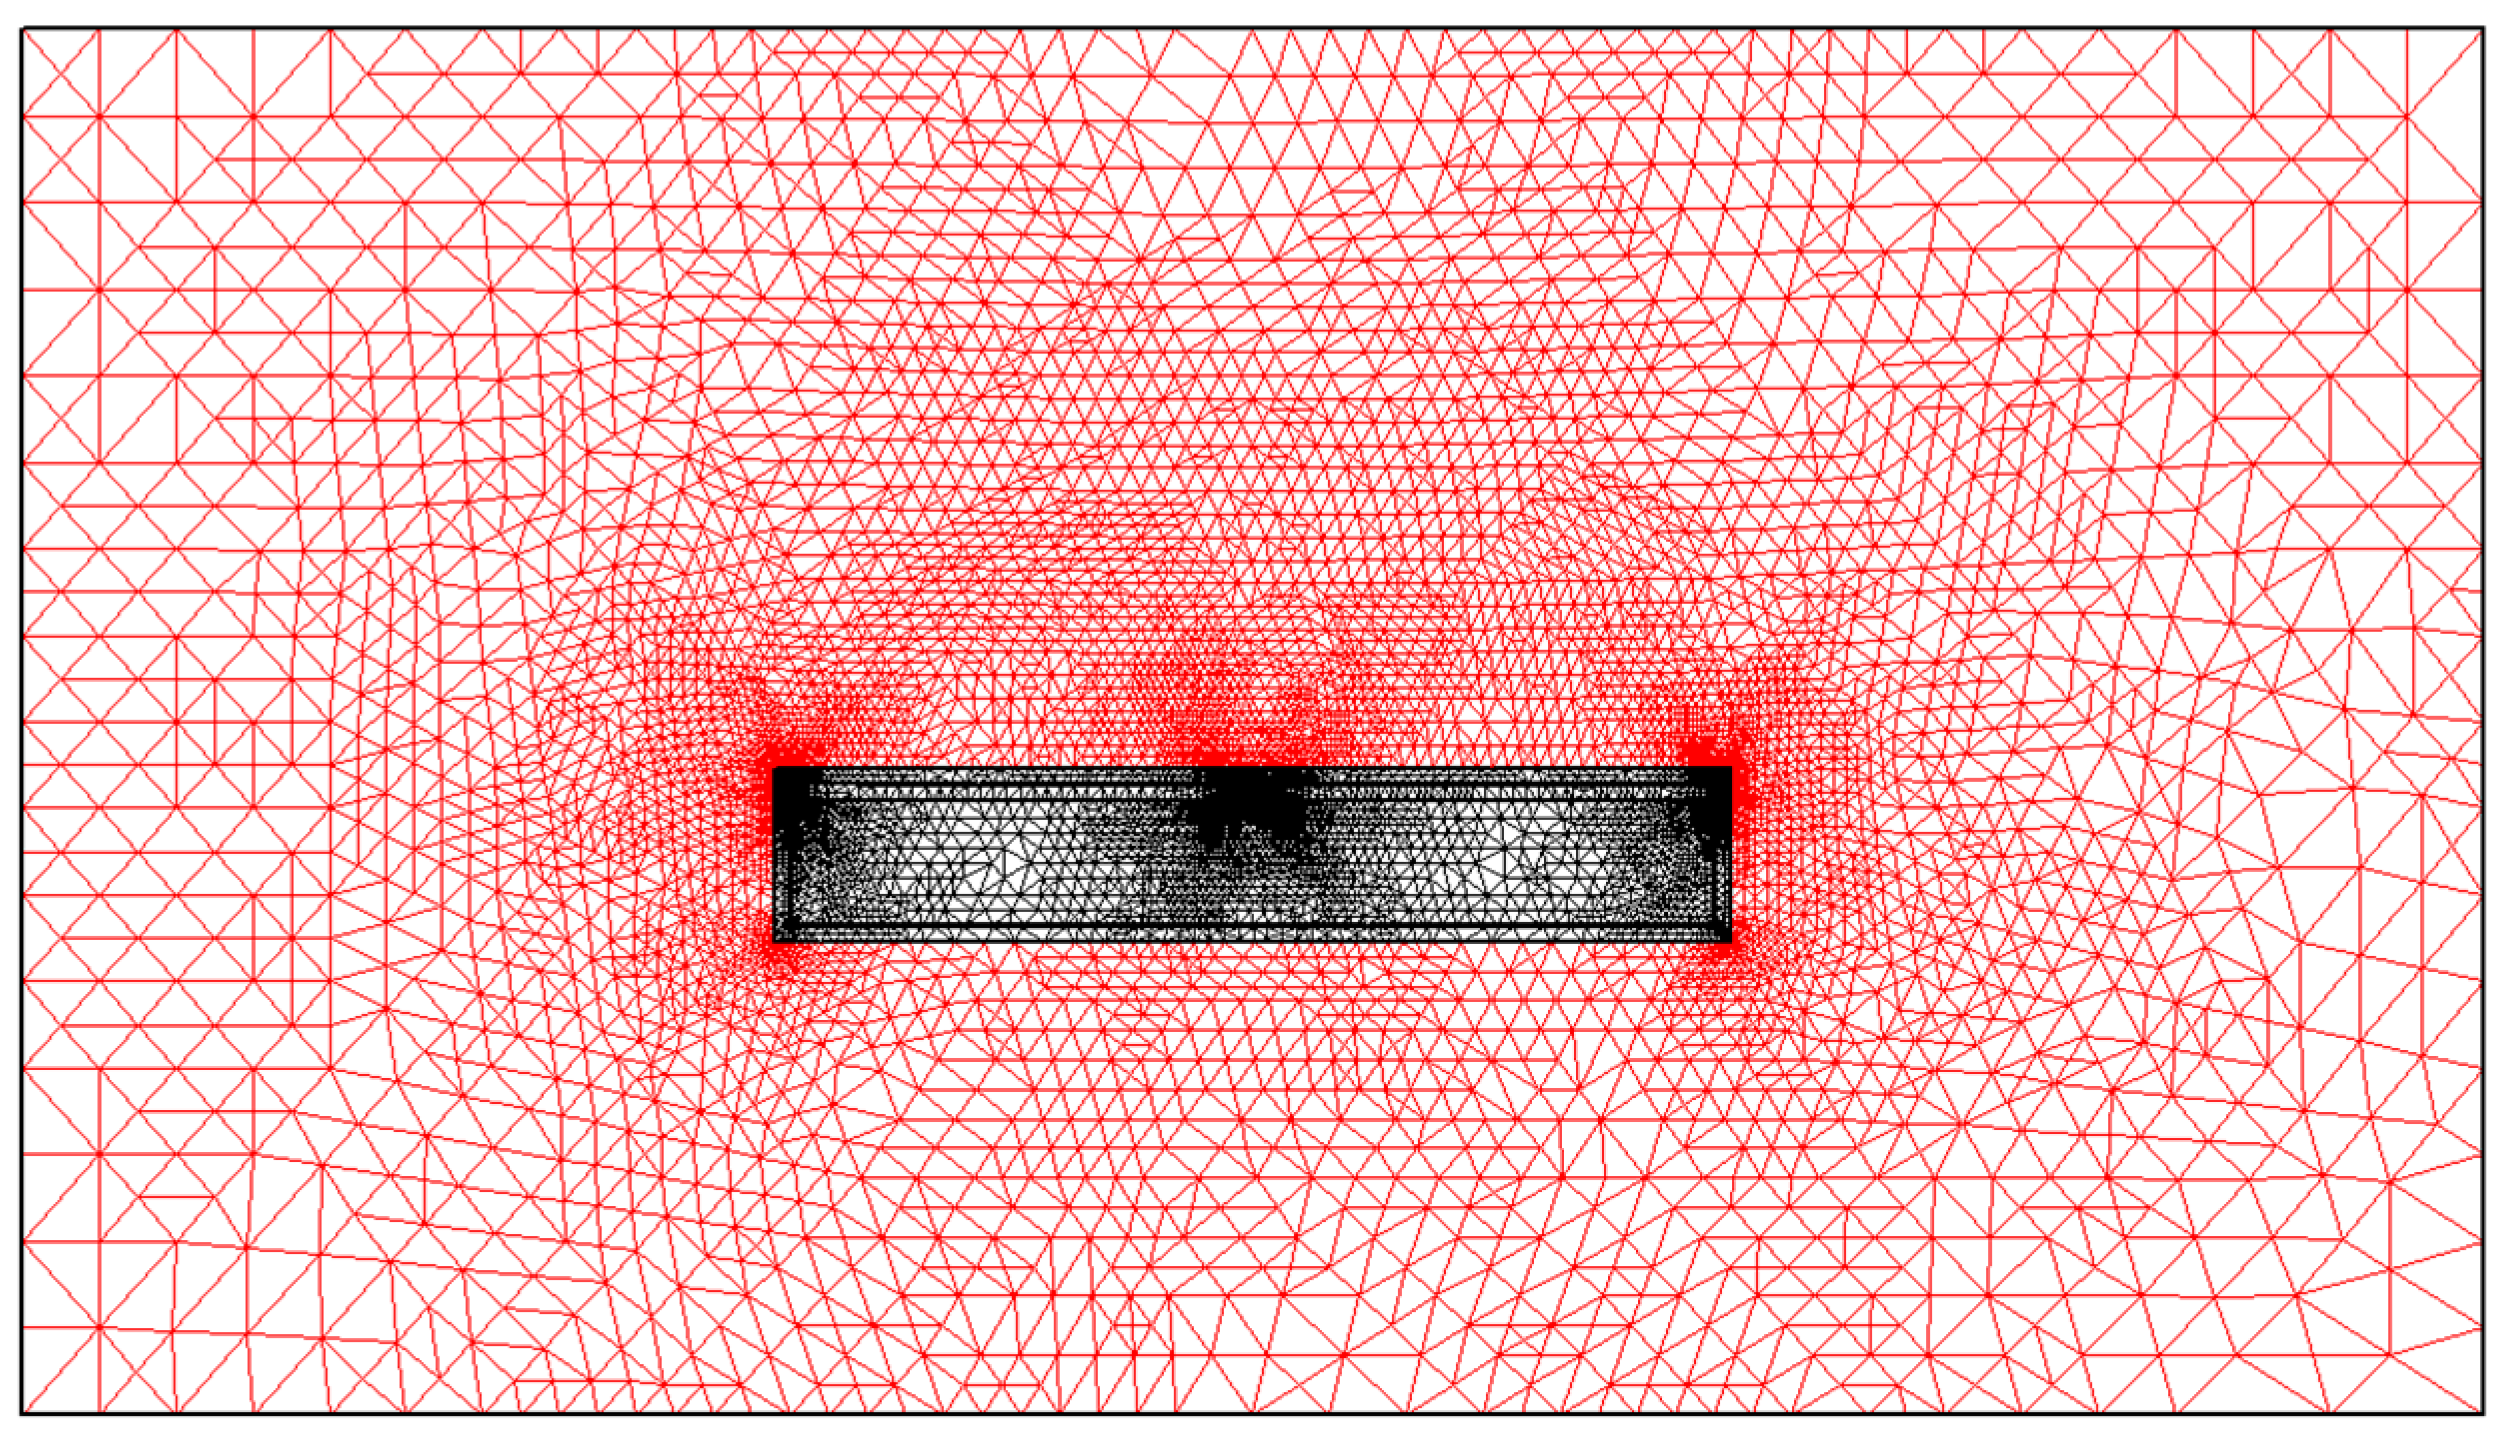
4.2. Analysis and Optimisation of the Sensor Using FEM

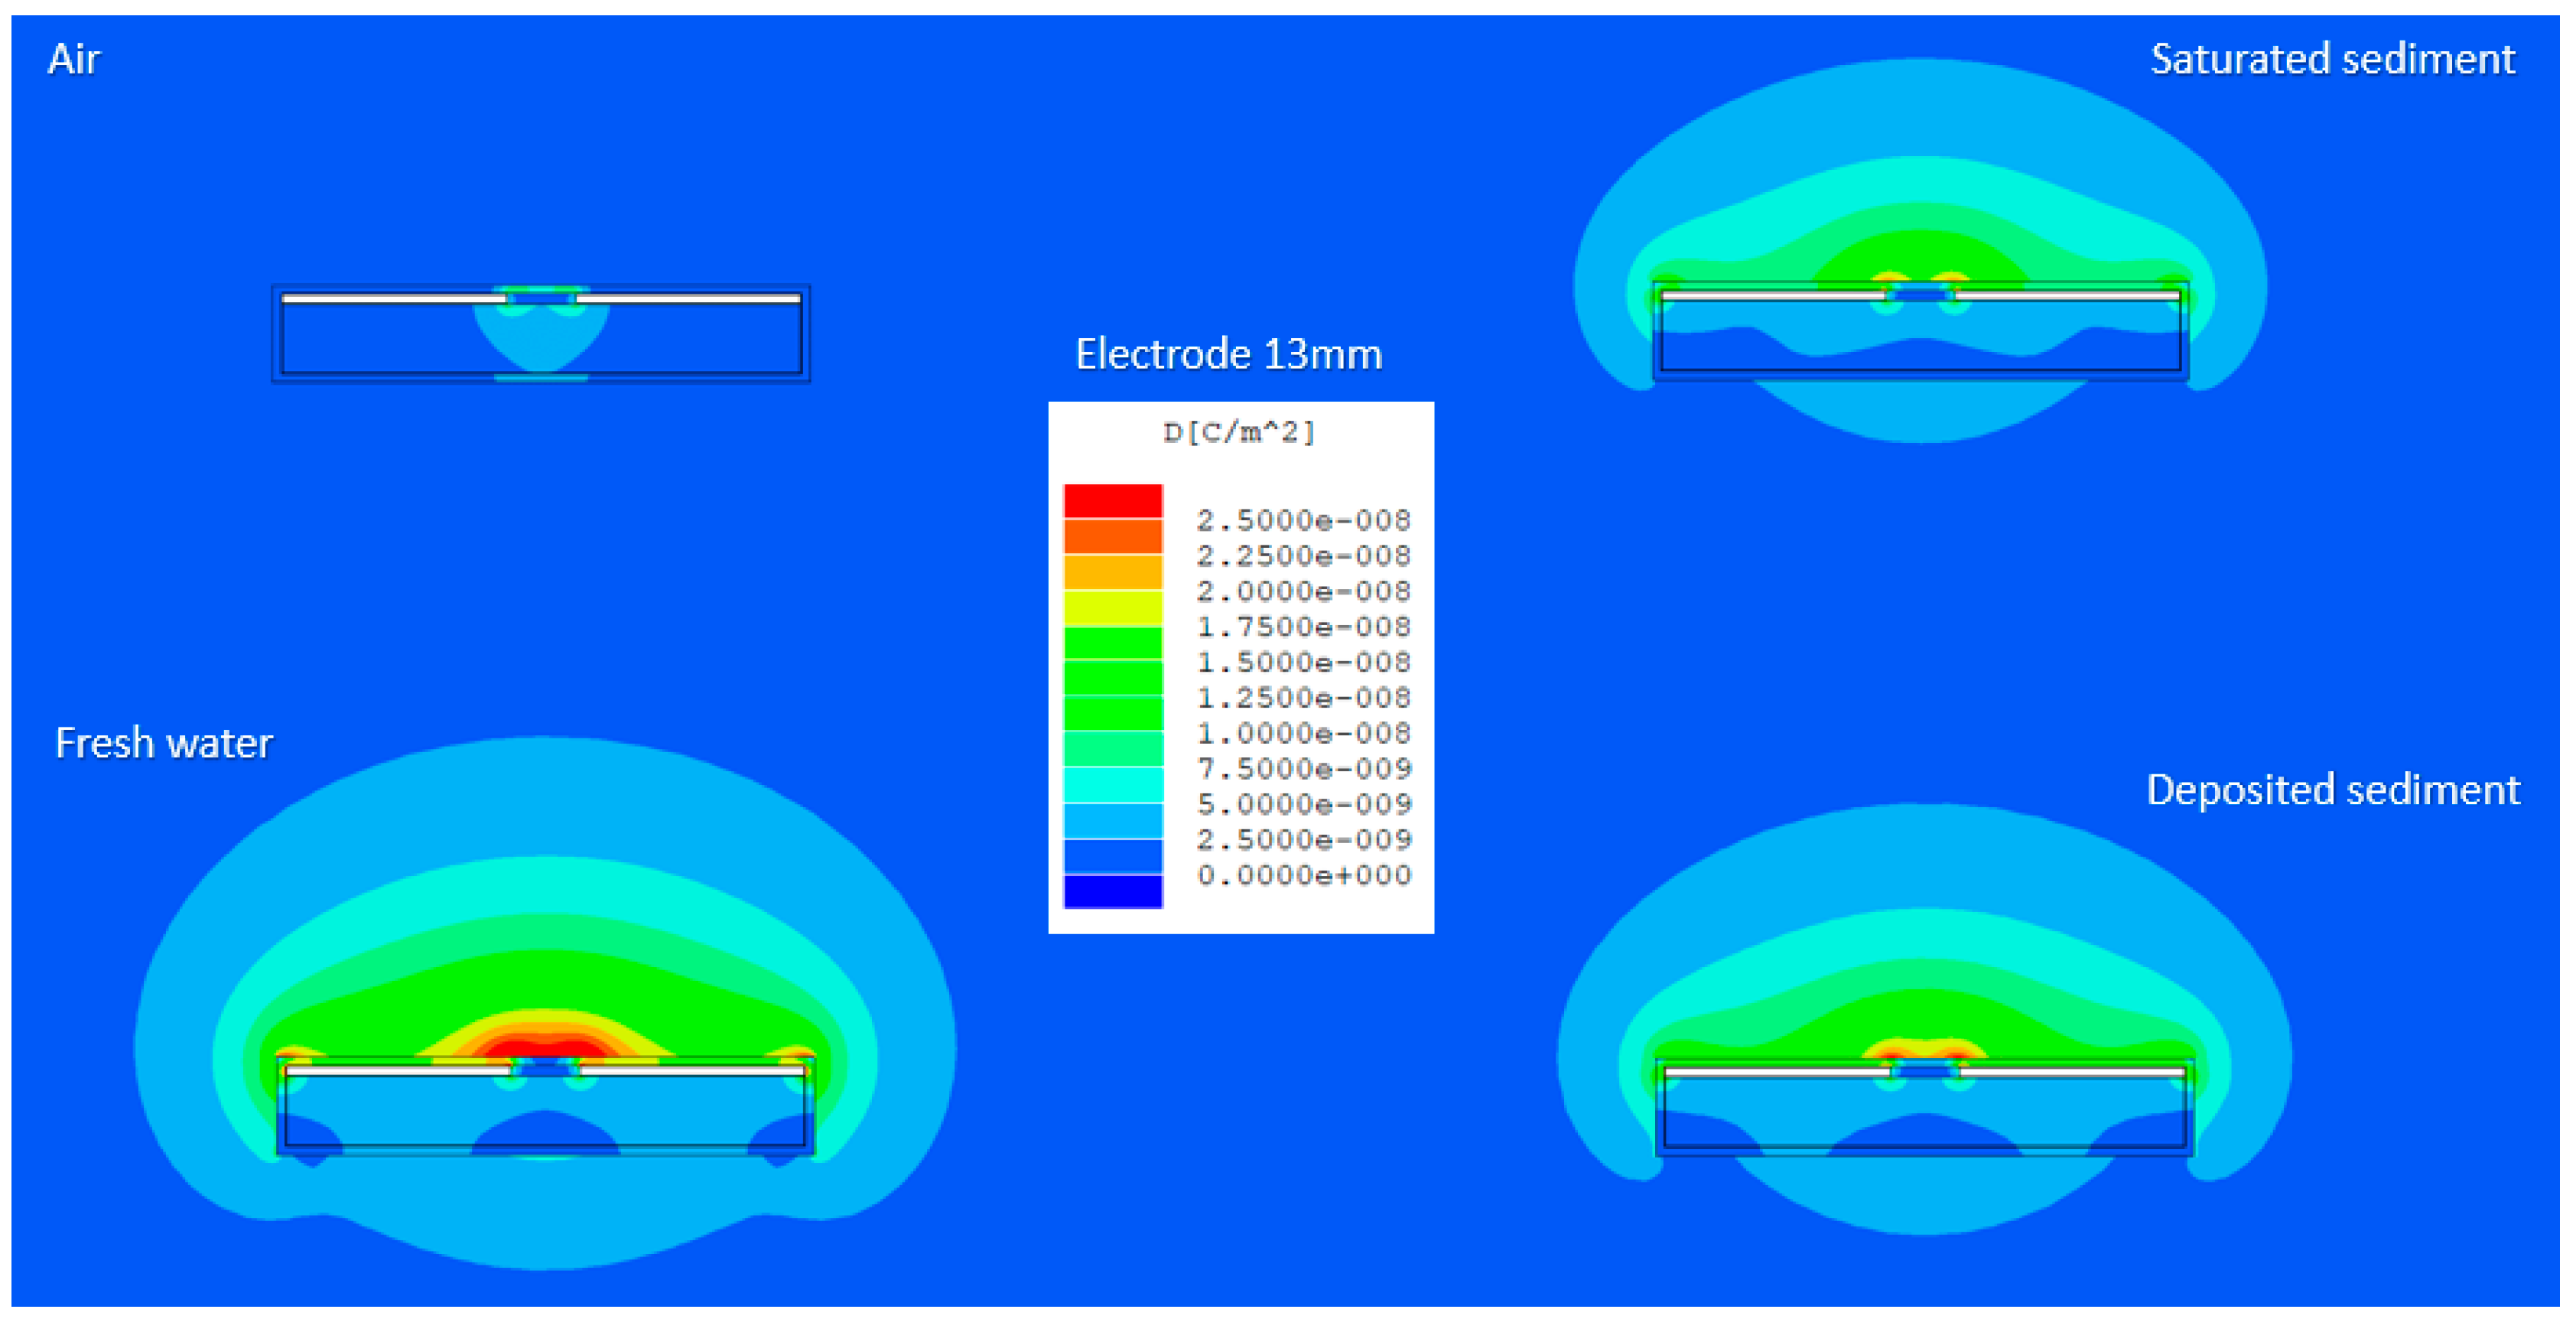
4.2.1. Field Magnitude in Different Environmental Conditions

The effect of increased electrode length on the obtained capacitance, the magD of the electric flux density, is of main importance for the sensitivity of the sensor to external simulated environmental conditions. The simulations were carried out with the electrodes of various lengths of 11 mm, 12 mm, 13 mm and 14 mm.
Typical magD values obtained for an electrode length of 13 mm and different simulated environmental conditions are presented in Figure 6. It is observed that in air condition, the electrostatic field that is generated between the sensor electrodes passes more readily through the dielectric material of the inner cross section and hardly penetrates the medium outside the access tube. This is attributed to the greater permittivity value of the plexiglass structure when compared to external simulated air environment. The magD and penetration area are significantly increased in the other simulated conditions with an electric field that has a good circular symmetry being generated between the sensor electrodes. The maximum magD is obtained in water environment, while greater strength of electric field is also recorded in deposited sediment compared to saturated sediment conditions. For all simulated models, the maximum magD that is generated between the transmitter and receiver electrodes was observed for the region that corresponds to the edge of the electrodes.
Figure 7a,b show the variation of the magD obtained for different simulated electrode lengths in water conditions and saturated soil conditions, respectively. The obtained results also indicate that an increase in the electrode length resulted to an increase in both magnitude of the electric flux density and penetration area of the field into the surrounding external medium. Greater magD is obtained for increased electrode size with a maximum value of 2.5 × 10⁻⁸ C/m2 recorded for electrode length of 14 mm in water conditions (see Figure 7a). The maximum strength of the electric flux density in the simulated saturated soil environment is also obtained for the maximum electrode arc length of 14 mm, which corresponds to 2.25 × 10⁻⁸ C/m2 (see Figure 7b). Maximum penetration of the simulated electric field is also observed to be achieved for the conditions that corresponded to water environment and for increased electrode lengths.

4.2.2. Computed Capacitance in Various Environmental Conditions

The effect of increased electrode length on the computed capacitance was also investigated and presented in this section. A distinct difference between the capacitance values obtained at different environmental conditions will enable a sensing system to differentiate between scour, saturated soil and deposited soil conditions. The computed capacitance for different electrode lengths and simulated conditions is presented in Figure 8. In all simulated conditions, increased electrode arc length resulted in greater capacitance, with the maximum value obtained in simulated water conditions and for electrode length of 14 mm.
The maximum capacitance value of 340 pF/m corresponded to water conditions for electrodes with length of 14 mm, following a decrease to 256 pF/m and 221 pF/m in deposited and saturated soil conditions, respectively.
Figure 9 presents the predicted capacitance difference between water and saturated soil conditions for increased electrode length. The capacitance difference for 11 mm electrode arc length is recorded at 99.01 pF/m and further increases almost linearly by 8.6%, 14.8% and 20.4% for electrode sizes of 12 mm, 13 mm and 14 mm, respectively.
The capacitance difference between deposited and saturated soil is presented in Figure 10. A nearly linear increase is also observed with the capacitance different for electrode length of 11 mm to be recorded at 28.95 pF/m and to further increase by 7.3%, 14% and 20.1% for electrode sizes of 12 mm, 13 mm, and 14 mm, respectively.
The obtained results indicate that greater electrode sizes maximise the sensitivity of the sensor to the various simulated external environmental conditions. An increase of electrode length (from 11 mm to 14 mm) results in a corresponding increase in computed capacitance. Greater capacitance values were recorded for the maximum electrode length of 14 mm. Maximum capacitance difference is also achieved for electrode length of 14 mm which indicates enhanced capability of the sensor to detect scour conditions (i.e., difference between water and saturated soil conditions) and to differentiate deposited soil and saturated soil conditions, which will enable to sense the backfilled soil sediment processes. This is due to the increased electrode area and the near proximity of the two electrodes that increased the overall capacitance.
Greater electrode length also led to a significant rise in the strength and penetration area of the electric flux density. The overall electric flux density was observed to be increased in water when compared to saturated sediment and deposited soil conditions for all simulated electrode lengths. This is due to the large difference of the relative permittivity of water as compared to saturated sediment, which results in a greater magnitude of electric field and in increased capacitance values in simulated water environment. The strength of the electric field extending into the medium was found to be significantly decreased after the penetration distance of 22 mm. The same electrode arrangement also provided the maximum difference between saturated sediment and water conditions.
For electrode length of 14 mm, the capacitance, magD and field penetration area are increased and appear to be the optimum compared to other simulated electrode sizes. This geometric configuration is expected to provide increased sensitivity of the sensor to changes to medium permittivity and, thus, to scour and sediment deposition processes. The final design of the proposed sensor comprises of two mirrored strips generating a symmetrical electric field, which enables satisfactory penetration into the medium outside the access tube.

5. Recommendations and Future Research

The lessons learnt from previous scour monitoring applications indicate that despite the numerous efforts to provide a sensing method for scour monitoring, a one-instrument-fits-all-bridges solution does not currently exist [50]. New research efforts on monitoring scour processes have therefore the potential to fulfil a useful role for cost-effective management of scour susceptible structures. In this direction, the current study focused on the optimisation of the characteristics of a new sensor in a simulated environment using FEM.
Future steps are required towards the experimental validation and field application of the sensor. This will involve the fabrication of a small-scale prototype to experimentally assess and calibrate the sensing device in various scour depths under different soil, water salinity and temperature conditions that are expected to occur in field environment. The durability of the sensor and its protective access tube to the representative environment needs also to be investigated with FEM simulations and then in operational conditions by installing a mock-up instrument on a bridge site.
In existing structures, the sensor is proposed to be used as a permanent monitoring instrument, which is fully driven into the riverbed and completely submerged at a certain distance for the water surface, so that debris has the minimum possible impact. In new bridge structures, the proposed monitoring method can potentially provide a ‘plug & sense’ option and can be incorporated into the outer skin of the foundation, which is in contact with the riverbed. Future research is required to evaluate the aforementioned application options, considering a number of site conditions (e.g., geomorphological and foundation conditions).

6. Conclusions

Scour action is a challenge for critical infrastructure systems, due to the changing climate bringing more active weather systems. Bed level conditions at underwater foundations have proved very difficult to monitor, considering that scour holes are often re-filled by deposited loose material that is easily eroded during subsequent smaller-scale events. The evaluation of scour and sediment deposition processes is also becoming more critical, taking into account the deterioration of infrastructure and the issues arising from the rehabilitation of hydraulic and marine structures.
This study initially reviewed parameters that amplify the growing infrastructure crisis, with particular focus on limitations of existing scour assessment procedures. An analysis of the advantages and limitations of existing monitoring instruments is also carried out in an effort to assess characteristics that hamper their widespread application to assess scour process. Main bridge failures on the European continent due to scour process are also presented, highlighting the need for more reliable scour monitoring.
The investigation then focuses on introducing a new monitoring concept and the conceptual characteristics and application of a new scour sensor. The development and optimisation of the components of the new sensor for measuring scour and re-deposited sediment conditions at foundation elements was performed via FEM. The investigation focused on the influence of the geometric components of a two-strip electrode sensor on the computed capacitance, the strength and penetration area of the electric field. Our findings demonstrated that decreased electrode size and increased air gap between electrodes had a decreasing impact on the computed capacitance and the magnitude of the electric flux density. The obtained results indicated that the optimum geometric configuration corresponds to the electrodes of 14 mm length placed at a horizontal distance of 1 mm. This geometric electrode configuration was found to provide the greatest capacitance difference between water and saturated soil conditions and therefore increased sensitivity to scour processes. The optimum sensor components that were defined in this study have the potential to provide a new instrument for monitoring effectively of scour and backfilled sediment processes.

Author Contributions

Conceptualization, P.M.; methodology, P.M.; software, P.M.; validation, P.M.; formal analysis, P.M.; investigation, P.M.; resources, P.M.; data curation, P.M.; writing—original draft preparation, P.M.; writing—review and editing, P.M. and E.V.; visualization, P.M.; supervision, E.V.; project administration, P.M.; funding acquisition, P.M. All authors have read and agreed to the published version of the manuscript.

Funding

This research is co-financed by Greece and the European Union (European Social Fund- ESF) through the Operational Programme “Human Resources Development, Education and Lifelong Learning” in the context of the project “Reinforcement of Postdoctoral Researchers—2nd Cycle” (MIS-5033021), implemented by the State Scholarships Foundation (ΙΚΥ).

Institutional Review Board Statement

Not applicable.

Informed Consent Statement

Not applicable.

Data Availability Statement

Not applicable.

Acknowledgments

The authors would like to thank Tina Katika and the two anonymous reviewers for their insightful suggestions and careful reading of the manuscript.

Conflicts of Interest

The authors declare no conflict of interest.

References

  1. BRIME. Deliverable D14 Final Report. 2001. Available online: https://trimis.ec.europa.eu/sites/default/files/project/documents/brimerep.pdf (accessed on 2 March 2022).
  2. American Society of Civil Engineers (ASCE). 2021 Report Card for America’s Infrastructure. Available online: https://infrastructurereportcard.org/ (accessed on 24 March 2022).
  3. Pregnolato, M. Bridge safety is not for granted—A novel approach to bridge management. Eng. Struct. 2019, 196, 109193. [Google Scholar] [CrossRef]
  4. Santarsiero, G.; Masi, A.; Picciano, V.; Digrisolo, A. The Italian Guidelines on Risk Classification and Management of Bridges: Applications and Remarks on Large Scale Risk Assessments. Infrastructures 2021, 6, 111. [Google Scholar] [CrossRef]
  5. Bekic, D.; Kerin, I.; Cahill, P.; Michalis, P.; Lapthorne, J.; Šolman, H.; Gilja, G.; Potocki, K.; Pakrashi, V.; McKeogh, E. BRIDGE SMS—Innovative Solution for Management of Bridges over Water. In Proceedings of the 5th International Conference on Road and Rail Infrastructure (CETRA 2018), Zadar, Croatia, 17–19 May 2018; pp. 57–63. [Google Scholar]
  6. Gkoumas, K.; Gkoktsi, K.; Bono, F.; Galassi, M.; Tirelli, D. The Way Forward for Indirect Structural Health Monitoring (iSHM) Using Connected and Automated Vehicles in Europe. Infrastructures 2021, 6, 43. [Google Scholar] [CrossRef]
  7. Mitoulis, S.A.; Argyroudis, S.A.; Loli, M.; Imam, B. Restoration models for quantifying flood resilience of bridges. Eng. Struct. 2021, 238, 112180. [Google Scholar] [CrossRef]
  8. Jongman, B.; Hochrainer-Stigler, S.; Feyen, L.; Aerts, J.C.J.H.; Mechler, R.; Botzen, W.J.W.; Bouwer, L.M.; Pflug, G.; Rojas, R.; Ward, P.J. Increasing stress on disaster-risk finance due to large floods. Nat. Clim. Chang. 2014, 4, 264–268. [Google Scholar] [CrossRef]
  9. Forzieri, G.; Feyen, L.; Russo, S.; Vousdoukas, M.; Alfieri, L.; Outten, S.; Migliavacca, M.; Bianchi, A.; Rojas, R.; Cid, A. Multi-hazard assessment in Europe under climate change. Clim. Chang. 2016, 137, 105–119. [Google Scholar] [CrossRef] [Green Version]
  10. Flint, M.M.; Fringer, O.; Billington, S.L.; Freyberg, D.; Diffenbaugh, N. Historical Analysis of Hydraulic Bridge Collapses in the Continental United States. J. Infrastruct. Syst. 2017, 23, 04017005. [Google Scholar] [CrossRef] [Green Version]
  11. Wardhana, K.; Hadipriono, F.C. Analysis of Recent Bridge Failures in the United States. J. Perform. Constr. Facil. 2003, 17, 144–150. [Google Scholar] [CrossRef] [Green Version]
  12. Rojas, R.; Feyen, L.; Watkiss, P. Climate change and river floods in the European Union: Socio-economic consequences and the costs and benefits of adaptation. Glob. Environ. Chang. 2013, 23, 1737–1751. [Google Scholar] [CrossRef]
  13. Michalis, P.; Sentenac, P. Subsurface condition assessment of critical dam infrastructure with non-invasive geophysical sensing. Environ. Earth Sci. 2021, 80, 556. [Google Scholar] [CrossRef]
  14. FHWA (Federal Highway Administration). Evaluating Scour at Bridges; Technical advisory T5140.23; US Department of Transportation: Washington, DC, USA, 1991. [Google Scholar]
  15. Lagasse, P.F.; Richardson, V.E. ASCE Compendium of Stream Stability and Bridge Scour Papers. J. Hydraul. Eng. 2001, 127, 531–533. [Google Scholar] [CrossRef]
  16. Richardson, E.V.; Davis, S.R. Evaluating Scour at Bridges, 4th ed.; FHWA NHI 01-001: Hydraulic Engineering Circular No. 18; US Department of Transportation: Washington, DC, USA, 2001. [Google Scholar]
  17. Dianeosis. Bridges and Infrastructures in Greece. 2019. Available online: https://www.dianeosis.org/2019/09/gefyres/ (accessed on 23 April 2022). (In Greek).
  18. Vardanega, P.J.; Gavriel, G.; Pregnolato, M. Assessing the suitability of bridge-scour monitoring devices. Proc. Inst. Civ. Eng.–Forensic Eng. 2021, 174, 105–117. [Google Scholar] [CrossRef]
  19. Kirby, A.M.; Roca, M.; Kitchen, A. Manual on Scour at Bridges and Other Hydraulic Structures, 2nd ed.; CIRIA: London, UK, 2015. [Google Scholar]
  20. May, R.W.P.; Ackers, J.C.; Kirby, A.M. Manual of Scour at Bridges and Other Hydraulic Structures; Construction Industry Research and Information Association (CIRIA) C551: London, UK, 2002. [Google Scholar]
  21. Pytharouli, S.; Michalis, P.; Raftopoulos, S. From Theory to Field Evidence: Observations on the Evolution of the Settlements of an Earthfill Dam, over Long Time Scales. Infrastructures 2019, 4, 65. [Google Scholar] [CrossRef] [Green Version]
  22. Gorin, S.R.; Haeni, F.P. Use of Surface-Geophysical Methods to Assess Riverbed Scour at Bridge Piers; US Geological Survey Water-Resources Investigations Report No. 88-4212; Federal Highway Administration: Hartford, CT, USA, 1989. [Google Scholar]
  23. Mueller, D.S.; Landers, N.M. Portable Instrumentation for Real-Time Measurement of Scour at Bridges; Federal Highway Administration Report FHWA-RD-99-085; Federal Highway Administration: McLean, VA, USA, 1999. [Google Scholar]
  24. Lasa, I.R.; Hayes, G.H.; Parker, E.T. Remote Monitoring of Bridge Scour Using Echo Sounding Technology, TRB Transportation Research Board Circular 498. In Proceedings of the 8th International Bridge Management Conference, Denver, CO, USA, 26–28 April 1999; Volume 1, pp. 1–9. [Google Scholar]
  25. Yankielun, N.E.; Zabilansky, L. Laboratory Investigation of Time-Domain Reflectometry System for Monitoring Bridge Scour. J. Hydraul. Eng. 1999, 125, 1279–1284. [Google Scholar] [CrossRef]
  26. Yu, X. Time Domain Reflectometry Automatic Bridge Scour Measurement System: Principles and Poten-tials. Struct. Health Monit. 2009, 8, 463–476. [Google Scholar] [CrossRef]
  27. Placzek, G.; Haeni, F.P. Surface-Geophysical Techniques Used to Detect Existing and Infilled Scour Holes Near Bridge Piers; Water Resources Investigations Report 95-4009; US Geological Survey: Storrs, CT, USA, 1995. [Google Scholar]
  28. Michalis, P.; Saafi, M.; Judd, M. Wireless sensor networks for surveillance and monitoring of bridge scour. In Proceedings of the XI International Conference Protection and Restoration of the Environment-PRE XI, Thessaloniki, Greece, 3–6 July 2012; pp. 1345–1354. [Google Scholar]
  29. Prendergast, L.J.; Hester, D.; Gavin, K. Determining the presence of scour around bridge foundations using vehi-cle-induced vibrations. J. Bridge Eng. 2016, 21, 04016065. [Google Scholar] [CrossRef] [Green Version]
  30. Fitzgerald, P.C.; Malekjafarian, A.; Bhowmik, B.; Prendergast, L.J.; Cahill, P.; Kim, C.-W.; Hazra, B.; Pakrashi, V.; Obrien, E.J. Scour Damage Detection and Structural Health Monitoring of a Laboratory-Scaled Bridge Using a Vibration Energy Harvesting Device. Sensors 2019, 19, 2572. [Google Scholar] [CrossRef] [Green Version]
  31. Zarafshan, A.; Iranmanesh, A.; Ansari, F. Vibration-Based Method and Sensor for Monitoring of Bridge Scour. J. Bridg. Eng. 2012, 17, 829–838. [Google Scholar] [CrossRef]
  32. Lin, C.-P.; Wang, K.; Chung, C.-C.; Weng, Y.-W. New types of time domain reflectometry sensing waveguides for bridge scour monitoring. Smart Mater. Struct. 2017, 26, 075014. [Google Scholar] [CrossRef]
  33. Michalis, P.; Tarantino, A.; Tachtatzis, C.; Judd, D.M. Wireless Monitoring of Scour and Re-deposited Sediment Evolution at Bridge Foundations based on Soil Electromagnetic Properties. Smart Mater. Struct. 2015, 24, 125029. [Google Scholar] [CrossRef] [Green Version]
  34. Michalis, P.; Saafi, M.; Judd, M. Capacitive sensors for offshore scour monitoring. Proc. Inst. Civ. Eng.-Energy 2013, 166, 189–197. [Google Scholar] [CrossRef]
  35. Hunt, B.E. Monitoring Scour Critical Bridges; NCHRP synthesis 396; Transportation Research Board: Washington, DC, USA, 2009. [Google Scholar]
  36. Schall, J.D.; Price, G.R. Portable Scour Monitoring Equipment; NCHRP Report 515; Transportation Research Board: Washington, DC, USA, 2004. [Google Scholar]
  37. Lin, Y.B.; Lai, J.S.; Chang, K.C.; Chang, W.Y.; Lee, F.Z.; Tan, Y.C. Using mems sensors in the bridge scour moni-toring system. J. Chin. Inst. Eng. 2010, 33, 25–35. [Google Scholar] [CrossRef]
  38. Lu, J.-Y.; Hong, J.-H.; Su, C.-C.; Wang, C.-Y.; Lai, J.-S. Field Measurements and Simulation of Bridge Scour Depth Variations during Floods. J. Hydraul. Eng. 2008, 134, 810–821. [Google Scholar] [CrossRef] [Green Version]
  39. McCane, K.; Hawrylak, P.J.; Mickle, M.H. Sensor and System to Detect Bridge Scour. US Patent 2011/0012728 A1, 2011. [Google Scholar]
  40. Lin, Y.B.; Lai, J.S.; Chang, K.C.; Li, L.S. Flood scour monitoring system using fibre bragg grating sensors. Smart Mater. Struct. 2006, 15, 1950–1959. [Google Scholar] [CrossRef]
  41. Chen, G.; Pommerenke, D.; Zheng, Y.R.; Radchenko, A.V.; Tang, Y.; Schafer, B.P.; Huang, Y.; Yang, Z.L. Smart Rocks and Wireless Communication System for Real-Time Monitoring and Mitigation of Bridge Scour—A Proof-of-Concept Study; Missouri University of Science and Technology: Rolla, MO, USA, 2013. [Google Scholar]
  42. Lagasse, P.F.; Clopper, P.E.; Pagan-Ortiz, J.E.; Zevenbergen, L.W.; Arneson, L.A.; Schall, J.D.; Girard, L.D. Bridge Scour and Stream Instability Countermeasures: Experience, Selection and Design Guidance, 3rd ed.; Hydraulic Engineering Circular No. 23; FHWA NHI-09-112, Federal Highway Administration: Washington, DC, USA, 2009; Volume 1. [Google Scholar]
  43. Zabilansky, L. Ice Force and Scour Instrumentation for the White River, Vermont; Special Report 96-6; US Army Cold Regions Research and Engineering Laboratory: Hanover, NH, USA, 1996. [Google Scholar]
  44. Mercado, E.J.; O’Neill, M.W. Methods to Measure Scour Depth and the Depth of Unknown Foundations. In Proceedings of the 3rd International Conference on Applied Geophysics, Orlando, FL, USA, 8–12 December 2003. [Google Scholar]
  45. Lueker, M.; Marr, J.; Ellis, C.; Hendrickson, A.; Winsted, V. Bridge Scour Monitoring Technologies: Development of Evaluation and Selection Protocols for Application on River Bridges in Minnesota; Publication MN/RC 2010-14; Minnesota Department of Transportation: St. Paul, MN, USA, 2010. [Google Scholar]
  46. Giordano, P.F.; Prendergast, L.J.; Limongelli, M.P. A framework for assessing the value of information for health monitoring of scoured bridges. J. Civ. Struct. Health Monit. 2020, 10, 485–496. [Google Scholar] [CrossRef]
  47. Highways Agency. BD 21/01. Highway Structures: Inspection and Maintenance. In The Assessment of Highway Bridges and Structures; The Stationery Office: London, UK, 2001; Volume 3, Section 4, Part 3. [Google Scholar]
  48. Iarnród Éireann. Infrastructure Structures Standard–Structural Inspections Standard; I-STR- 6510 Issue 3.0; Iarnród Éireann: Dublin, Ireland, 2009. [Google Scholar]
  49. Chen, G.; Pommerenke, D.; Zheng, R. Wireless Smart Rocks for Real Time Scour Monitoring. ISHMII Monitor Magazine, 2011. [Google Scholar]
  50. Michalis, P.; Xu, Y.; Valyrakis, M. Current practices and future directions of monitoring systems for the assessment of geomorphological conditions at bridge infrastructure. River Flow 2020. In Proceedings of the 10th Conference on Fluvial Hydraulics, Delft, The Netherlands, 7–10 July 2020; pp. 1–6, ISBN 9781003110958. [Google Scholar]
  51. Speight, J.G. 2-The Properties of Water, Natural Water Remediation; James, G., Ed.; Butterworth-Heinemann: Speight, Australia, 2020; pp. 53–89. ISBN 9780128038109. [Google Scholar] [CrossRef]
  52. Ting, F.C.K.; Briaud, J.-L.; Chen, H.C.; Gudavalli, R.; Perugu, S.; Wei, G. Flume Tests for Scour in Clay at Circular Piers. J. Hydraul. Eng. 2001, 127, 969–978. [Google Scholar] [CrossRef]
  53. Mirtskhoulava, T.E. Scouring by flowing water of cohesive and noncohesive beds. J. Hydraul. Res. 1991, 29, 341–354. [Google Scholar] [CrossRef]
Figure 1. Transverse electromagnetic wave characteristics of a transmission line at an instant time for impedance mismatch. The voltage standing wave (VSWR) is formed due to the superposition between the incident (Vinc.) and reflected (Vref.) waves, while the transmitted (Vtran.) wave amplitude is reduced.
Infrastructures 07 00068 g001
Figure 2. Cross section of sensor components and electromagnetic field generated between electrodes. The generated field generated between the two electrodes is expected to penetrate the external medium.
Infrastructures 07 00068 g002
Figure 3. Conceptual monitoring application and anticipated outputs of the scour sensor into a bridge structure. Increased scour depth is expected to lead to a corresponding increase in the sensor output.
Infrastructures 07 00068 g003
Figure 4. Typical top view of sensor model with two strip electrodes attached to a solid plexiglass structure enclosed by an access tube. The electrodes are separated in horizontal distance by a simulated air gap.
Infrastructures 07 00068 g004
Figure 5. Typical mesh generated in simulated water conditions. Increased mesh density is observed to be generated between the transmitter and receiver electrodes and on the region that corresponds to the edge of the electrodes.
Infrastructures 07 00068 g005
Figure 6. Typical magD and penetration of electric field obtained in air, saturated sediment, water and deposited soil simulated conditions for electrode length of 13 mm. The magD and penetration area of the generated field are increased and maximized for the simulated condition that corresponds to water environment.
Infrastructures 07 00068 g006
Figure 7. MagD and field penetration area obtained in (a) water, and (b) saturated soil conditions for various electrode lengths of 11 mm, 12 mm, 13 mm and 14 mm. In both simulated conditions, the maximum magD and field penetration are obtained for the electrode length of 14 mm.
Infrastructures 07 00068 g007
Figure 8. Capacitance values obtained for various simulated media for electrode lengths of 11 mm (rectangular mark), 12 mm (triangle mark), 13 mm (node mark) and 14 mm (filled dot mark).
Infrastructures 07 00068 g008
Figure 9. Capacitance difference obtained between water and saturated soil conditions for various electrode lengths of 11, 12, 13 and 14 mm. Increased electrodes lengths resulted in a corresponding increase in the capacitance difference computed between the two simulated conditions.
Infrastructures 07 00068 g009
Figure 10. Capacitance difference obtained between deposited and saturated soil conditions for various electrode lengths of 11, 12, 13 and 14 mm. Increased electrodes lengths resulted in a corresponding increase in the capacitance difference computed between the two simulated conditions.
Infrastructures 07 00068 g010
Table 1. Overview of main monitoring methods employed to detect both scour and backfill processes.
Scour MethodAssessment AdvantagesLimitations
Physical probes [36] DirectEffective in fast and shallow waterLimited use by depth, velocity—Debris/Ice impact—Personnel required
Sonar devices [36] DirectContinuous scour monitoringDebris/Ice impact—Transducer frequency—Beam width
Ground Penetrating Radar (GPR) [27] DirectContinuous record of riverbedIssues with clays/saltwater conditions—High cost/complex equipment—Trained personnel
MEMS sensors [37] DirectReal-time monitoring of scour and deposition height.Not yet tested in the field (Results based on laboratory environment)
Magnetic Collar [20] DirectEasy to operate—Low costHigh maintenance cost—Not able to detect deposition—Excavation of riverbed
Steel Rod [20]DirectEasy to operate—Low costNot real-time application—High maintenance cost—Excavation of riverbed
Numbered Brick Column [38] IndirectCommercially available—Applicable during high floodsNot able to detect deposition—Not real-time application—Excavation of riverbed
Buried Orientation Sensors [39] IndirectLow cost—Automatic transmission of wireless signalsNo continuous field data—Sensor battery life—Debris impact when floating—Excavation of riverbed
Optical-Fibre-based Sensors [40] DirectReal-time monitoring—Resistance to environmental corrosionInstallation issues—More field tests required
Time Domain Reflectometry (TDR) [25] DirectReal-time application—Continuous data during high floodsComplicated signal interpretation—Cable length—Expensive system
Smart Rocks [41] DirectCost effective and robust method—Can be deployed easily to structuresReduction in the signal over distance—Sensor battery life
Diving [42] IndirectN/ANot reliable method—Safety considerations
Amplitude Domain Reflectometry (ADR) sensor [33,34] DirectDetection of both scour and sediment deposition processes—Soil density information—Real-time applicationNot monitoring of scour along the probe length but at predetermined locations—Debris impact
Passive Scour Chain System [43] IndirectNo maintenance requiredCannot provide continuous data—Excavation of riverbed—Not reliable method
Brisco System [43] DirectCommercially availableNot able to detect deposition—Need to attach the device on the structure
Tell-Tail System [20]DirectCommercially available—Continuous monitoring of scour and deposition Difficult to be installed at existing structures–Durability of the sensors
Seismic Survey (PSS, RPSS) [44] IndirectDetermination of both scour and foundation depth—Low costNot real-time monitoring—Cannot be used during flood events—Trained personnel
Pneumatic Detection System [44] IndirectCan be implemented under extreme flood events-Real-time applicationNot yet tested in the field
Piezoelectric Film devices [45] DirectCost effectiveDebris/Ice impact—Unreliable measurements due to sensor sensitivity
Vibration based methods [29,30,46]IndirectNo need for underwater installation—Relatively cost-effective methodBridge specific calibration required
Publisher’s Note: MDPI stays neutral with regard to jurisdictional claims in published maps and institutional affiliations.

