Article

Dynamics of Embankment Slope Stability under Combination of Operating Water Levels and Drawdown Conditions

by
Yelbek Bakhitovich Utepov
1,2,
Aliya Kairatovna Aldungarova
2,3,
Timoth Mkilima
1,2,*,
Ignacio Menéndez Pidal
4,
Assel Serikovna Tulebekova
1,2,
Shyngys Zharassovich Zharassov
1,2 and
Assem Kairatovna Abisheva
1
1
Department of Civil Engineering, L.N. Gumilyov Eurasian National University, Nur-Sultan 010008, Kazakhstan
2
CSI Research & Lab (LLP), Nur-Sultan 010000, Kazakhstan
3
School of Architecture and Construction, D. Serikbayev East Kazakhstan Technical University, Ust-Kamenogorsk 070000, Kazakhstan
4
Departamento de Ingeniería y Morfología del Terreno, Escuela Técnica Superior de Ingenieros de Caminos, Canales y Puertos, Universidad Politécnica de Madrid, 28040 Madrid, Spain
*
Author to whom correspondence should be addressed.
Infrastructures 2022, 7(5), 65; https://doi.org/10.3390/infrastructures7050065
Submission received: 3 April 2022 / Revised: 27 April 2022 / Accepted: 28 April 2022 / Published: 29 April 2022

Abstract

:
This study investigated the potential influence of operating water levels and loading conditions on the slope stability of an embankment dam. Four different operating reservoir levels (normal, reduced, embankment height, and overflow) were considered in the study. Numerical modeling was used to investigate the problem in the case of the Chardara dam within the Syrdarya catchment in Kazakhstan. Based on the drawdown rates and operating conditions, minimum factor of safety values ranging from 0.56 (total failure) to 2.5 were retrieved. Furthermore, a very high correlation was observed between drawdown days, the minimum factor of safety values, the maximum factor of safety values, and pore-water pressures, with correlation coefficients ranging from 0.561 to 0.997 (strong to very strong correlation). On the other hand, the highest negative correlation of 0.997 was observed between the minimum factor of safety values and pore-water pressures. Additionally, based on the results from the analysis of variance, three reservoir operating levels (normal, embankment height, and overflow) resulted in p-values less than 0.05, indicating that the variations in the factor of safety values from the drawdown rates were statistically significant. The findings of this study demonstrated that, not only may the drawdown rate be detrimental to the embankments, but that different operating levels can also affect slope stability in different ways.

1. Introduction

Preferably, dams are located in areas that are less occupied within a catchment and are characterized by natural landscapes. However, globally, the trend of land demand has continuously been increasing, resulting from population growth and development activities; according to Lanz et al., [1], the world population has been steadily expanding, and it is estimated that, by 2100, the global population will be around 12.4 billion people. This phenomenon has been significantly impacting the natural landscape of catchments. Rapid urbanization is a popular term describing a scenario in which less developed areas are invaded and subjected to development activities [2,3]. According to Fiscal et al. [4], this type of urbanization remains one of the crucial environmental challenges in developing countries. Therefore, with time, dams located within less-developed landscapes are finding themselves within a highly developed and crowded environment. When the natural landscape is developed into structures such as parking lots, tarmac roads, rooftops, as well as compacted grounds, the areas of impervious surfaces also increase [5]. These impervious surfaces affect how the runoff is either absorbed or runs on the ground’s surface, where it becomes difficult for precipitation to infiltrate the ground, leading to more runoff [6]. It becomes even more challenging when the impervious surfaces are combined with extreme events, such as extreme precipitation [7]. With more runoff running on the ground’s surface, more water reaches nearby streams, exceeding the carrying capacity, and eventually causing flooding [8,9]. This also means that more water reaches nearby dams, which are located downstream, surpassing the flow rate employed during the design phase of the structure, putting it at risk of failure [10,11]. There are already many cases where dams have failed due to an increase in the runoff, including the Bilberry reservoir [12], which failed in 1852 in Holme Valley, West Yorkshire, England; Hauser Dam in the United States, which failed in 1908 [13]; Lower Otay Dam in the United States, which failed in 1916 [14,15]; as well as the Banqiao and Shimantan Dams in China failed in 1975 [16]. In such cases, embankment dams are more prone to failure compared to concrete dams.
In certain cases, however, the failure does not occur immediately and is delayed by a change in the long-term design maximum water level [17]. Furthermore, it is only a matter of fact that, during its lifetime, any embankment can be subjected to different operating water levels due to the changes in flow conditions in the particular catchment as influenced by factors such as land surface cover and climatic changes. Due to all of these challenges, the application of modeling for the risk analysis of dam failures has been a topic of interest in the recent past [18]. Despite the fact that slope stability under rapid drawdown conditions has been a subject of interest in the recent past [19,20], unfortunately, to date, the design and analysis of embankment dams have completely ignored the risk posed by the combination of rapid drawdown and changing operating water levels. The looming danger becomes more significant when the aspect of the operating water level is combined with rapid drawdown loading conditions.
It should also be highlighted that, when the long-term maximum water level changes, the pattern of seepage within the embankment changes, resulting in a new pattern that was not addressed during the design process [21]. Moreover, when the hydrological pattern in the catchment changes, the dam receives a new long-term water level that was not anticipated when the dam was designed. The dam may be subjected to progressive failure as a result of the new type of loading condition. The worst-case scenario is when the dam is rapidly drained while the long-term water level has changed [22]. It is also important to note that, when an earth embankment has kept a reservoir with a relatively consistent water surface height for a long time, the seepage conditions within the embankment are likely to have stabilized. If the reservoir must be drained quickly, the pore-water pressures within the embankment may remain relatively high while the reservoir’s weight along the upstream side of the embankment acts as a stabilizing force. This is sometimes referred to as ‘rapid drawdown,’ and it might result in embankment instability on the upstream face [23]. As a result, investigating all of these variables during the design phase of an embankment dam is crucial.
In addition, numerical modeling is useful in determining the slope stability of embankment dams under various loading situations. In geotechnical engineering, numerical modeling is a popular technique that employs computer simulation to tackle complex problems [24]. This method has been utilized to analyze difficult embankment dam problems for many years [25,26,27]. In general, the investigation of how changes in land surface cover might pose a serious threat to a dam in an urbanizing catchment will assist future dam designers in constructing highly sustainable dams. Unfortunately, past studies have not adequately captured the effects of land-use changes and extreme events on embankment dam slope stability, making it impossible to consider these elements during the design process effectively. Dams are often erected in less developed areas of a catchment, as previously indicated, but, as a result of causes such as population growth, these catchments are becoming increasingly urbanized, affecting the natural environment. All of these factors have an impact on a catchment’s hydrological pattern, posing a serious threat to dams. Furthermore, combining all of these aspects during the design phase of a dam, particularly an embankment dam, has always been a challenge.
This study investigates the potential influence of operating water levels and loading conditions on the slope stability of an embankment dam. Numerical modeling is used to investigate the problem in the case of the Chardara dam within the Syrdarya catchment in Kazakhstan. Four different cases were taken into consideration, as follows:
  • Modeling based on the current reservoir operating level;
  • Modeling with the long-term water level at half of the embankment height;
  • Modeling based on the embankment’s maximum height;
  • Modeling based on the overflowing reservoir level.
Analysis of variance and correlation matrices are among the methods used to evaluate the results.

2. Materials and Methods

2.1. Case Study Description

The Chardara dam is located in Kazakhstan’s South-Kazakh area, at the end of the middle stream of the Syrdariya river, to the north of the Turkestan mountains, and it covers the Golodniy steppe, the Arnasay depression, and the Syrdariya valley. The dam supplies agricultural water to the Kyzyl-Kum waterway. The dam’s reservoir has a maximum storage capacity of 5.7 billion m3 and a 900 km2 surface area. The dam was designed in 1955–1967 by the Central Asia department of “The Hydroproject” Institute in Tashkent. Construction works were completed in October 1967, and, in 1968, the full reservoir level was impounded. Chardara dam consists of a hydraulic fill embankment, channel-type power station combined in one building with two sluices at the left- and right-hand sides of the power station, and a Kyzylkum regulator on the left bank of the river. The dam was constructed by placing the hydraulic fill on two sides. The upstream slope of the embankment is strengthened by reinforced concrete slabs that were placed on a gravel–sandy bed. At the joints of the concrete facing, a double layer of the inverted filter was placed. The downstream slope is strengthened by local silty–gravel material. A pipe drain with a triple-layered inverted filter was constructed at the toe of the downstream slope. There are relief wells and a drainage water conduit at the downstream toe. There is a 6 m-wide asphalt road at the dam crest.
A silty–sandy layer 1.5 m to 2.5 m deep underpins a layer of fine sands 12 m to 17 m thick in the flood plain river portion, where the embankment axis is located. The intake construction is built on siltstones, marly clay, sand, and sandstone with conglomerate as bedrock. The base of the Chardara embankment is made up of a silty sand layer 8 to 10 m deep, which is overlain by a clay layer 2 to 5 m thick or a thick layer of fine silty sand. The groundwater table lies between 0.5 and 2 m below the surface in these places. The dam is situated in earthquake zone VI. However, the embankment and its buildings, on the other hand, were designed considering an earthquake intensity of VII [28]. Table 1 lists the physical and mechanical characteristics of the construction materials used in the embankment foundations. The slope of the embankment is approximately 1:4 (V:H) or 4:1 (H:V).

2.2. Water Level Cases Investigated

Table 2 presents the different cases investigated in this study. In general, four (4) different cases were investigated based on the reservoir operating level. It has to be noted that one of the significant effects of the land use/land cover and climatic changes in the catchments is the changes in the reservoir’s operating levels. The streams receive more surface runoff than the underground flow when the catchment becomes more impervious. In such a phenomenon, there is a higher chance that the catchment will receive highly varied flows (high flows and low flows) while increasing the risk of the reservoir being subjected to long-term reduced operating water levels and long-term increased operating water levels.
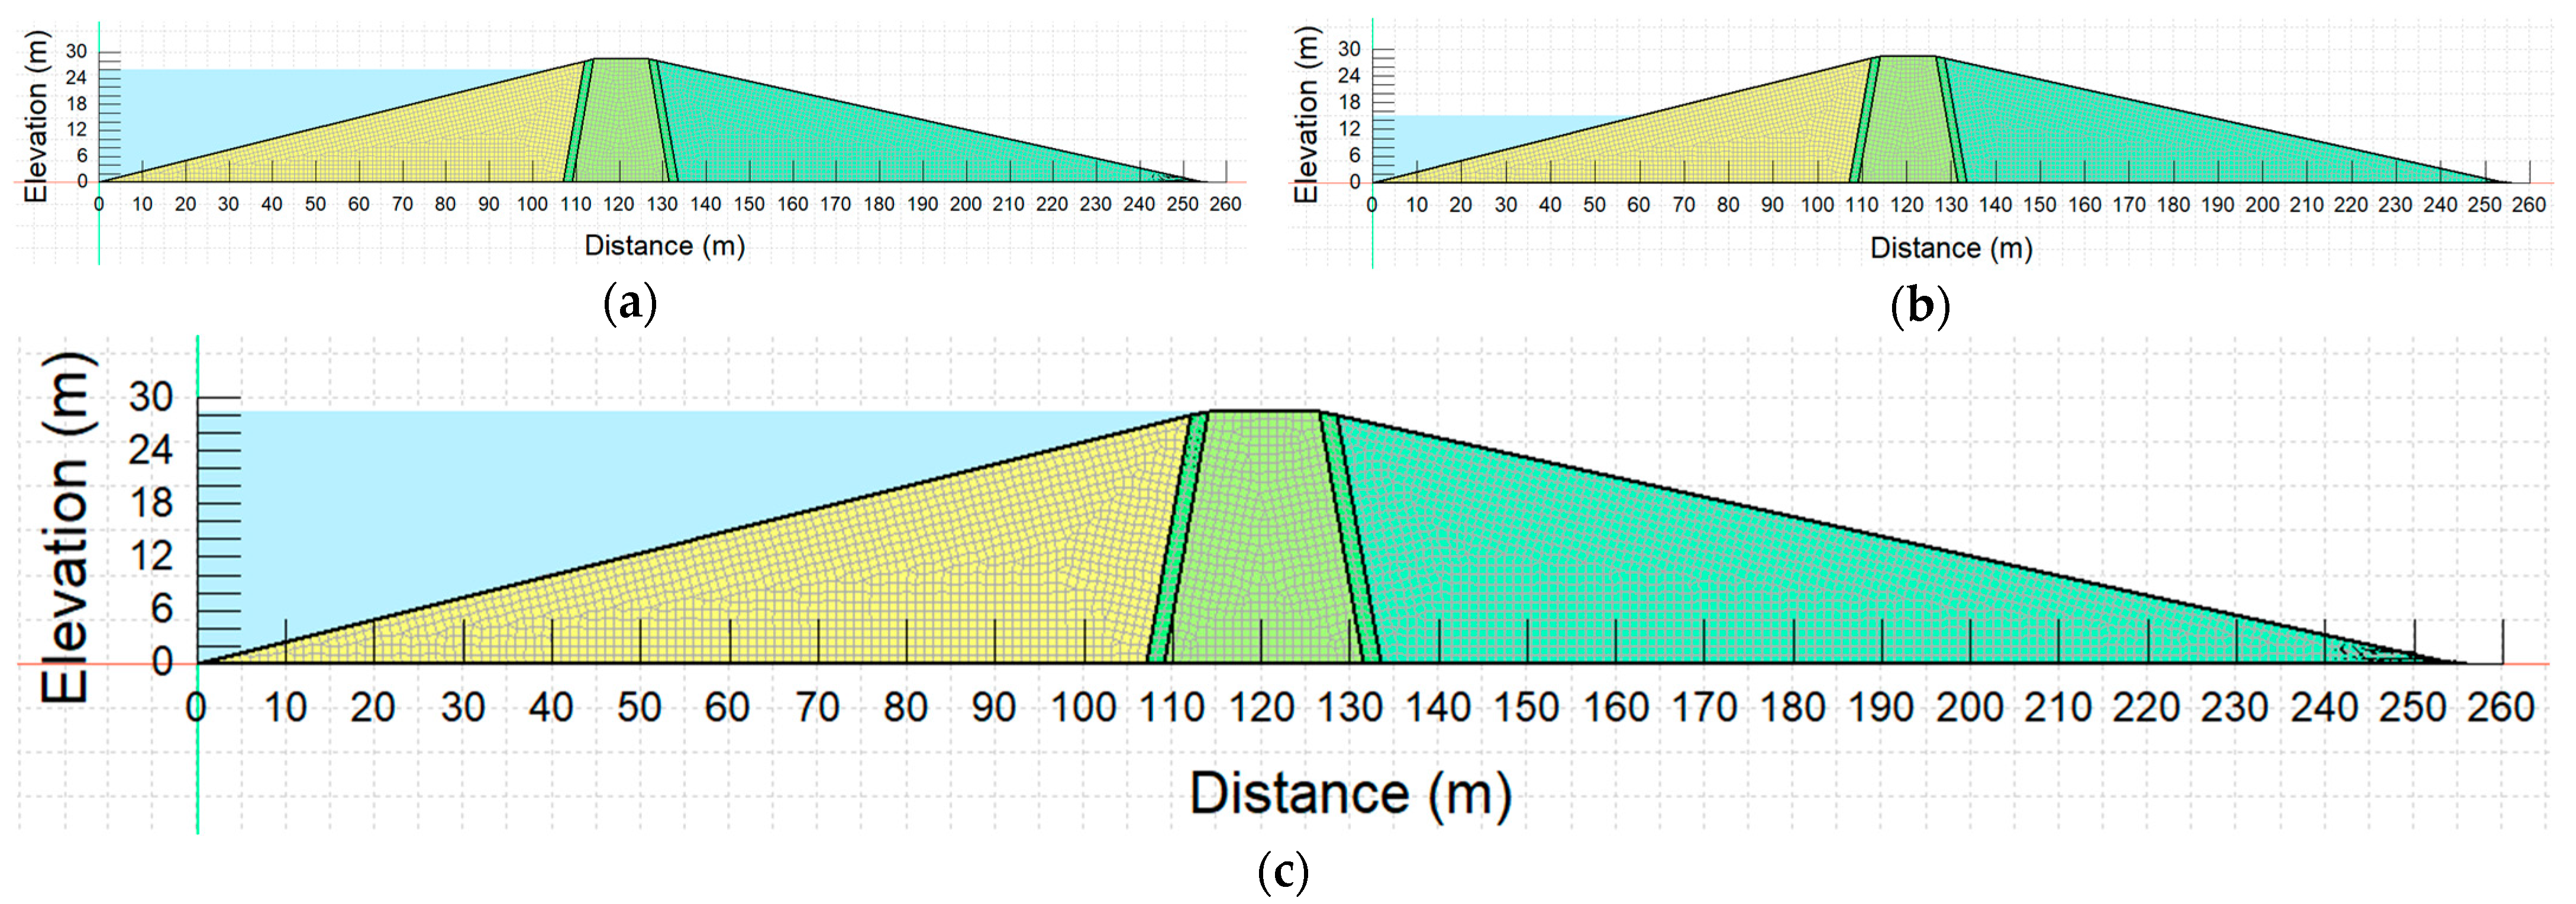
Figure 1 further highlights some of the reservoir operating levels investigated in the study with a meshed embankment.

2.3. General Modeling Procedures and Embankment Material Properties

The embankment geometry (Table 3 and Figure 2) is divided into five zones, with zones 2a and 2b having similar material characteristics. Each zone of the embankment was assigned distinct material properties, with zone 1 primarily consisting of coarse material mixed with fine materials (silt and clay fraction), with saturated hydraulic conductivity (ksat) and a liquid limit (wL) of 45%. Cohesive material, fine-grained material, and clay characterize Zone 3. Zones 2a and 2b are distinguished by non-cohesive soil and filter material (sand and gravel), whereas Zone 4 is distinguished by coarse material with a low fine material concentration (Table 3). More parameters of the material properties used in this study are summarized in Table 3.
As previously highlighted, the dam embankment geometry is divided into four main zones (Figure 2).
The finite element technique investigated the potential influence of the reservoir’s rapid drawdown on the embankment’s slope stability with different soil parameters. The steady-state, instantaneous drawdown, 5-day drawdown, 10-day drawdown, and 1 m per day drawdown rate to half of the maximum water level were investigated. Firstly, the embankment was subjected to long-term steady-state analysis, followed by the rapid drawdown rates (instantaneous, 5 days, 10 days, and 1 m per day) for each operating reservoir level. In the instantaneous drawdown case, it was assumed that the water in the dam or reservoir was drained instantly. In this case, the extreme situation or worst-case scenario was represented by the instantaneous drawdown case. The seepage analyses were conducted concurrently with the slope stability analyses.
In general, the study problems were investigated using the combination of GeoStudio sub-software SEEP/W [29] and SLOPE/W [30]. SEEP/W, which is based on FEM, was utilized for the seepage analysis in two-dimensional sections.

2.4. Seepage Analysis Procedures

As previously mentioned, the simulation of a slope’s drawdown behavior began with the establishment of a long-term steady state utilizing the steady-state analysis method in GeoStudio. The established long-term steady-state conditions were then employed as parents to the transient flow analyses, whereby the transient flow analyses utilized seepage-induced pore pressures generated from the long-term steady-state analysis. Throughout the transient seepage analyses, the variation in the water level during the drawdown process was modeled using a linear function that was given as a boundary condition on the upstream face of the embankment.

2.5. Slope Stability Analysis Procedures

To be more specific, the slope stability analysis was achieved using the Morgenstern–Price [31] method under the general limit equilibrium (GLE) [32] to define a distinct analysis for each of the slope stability analyses.
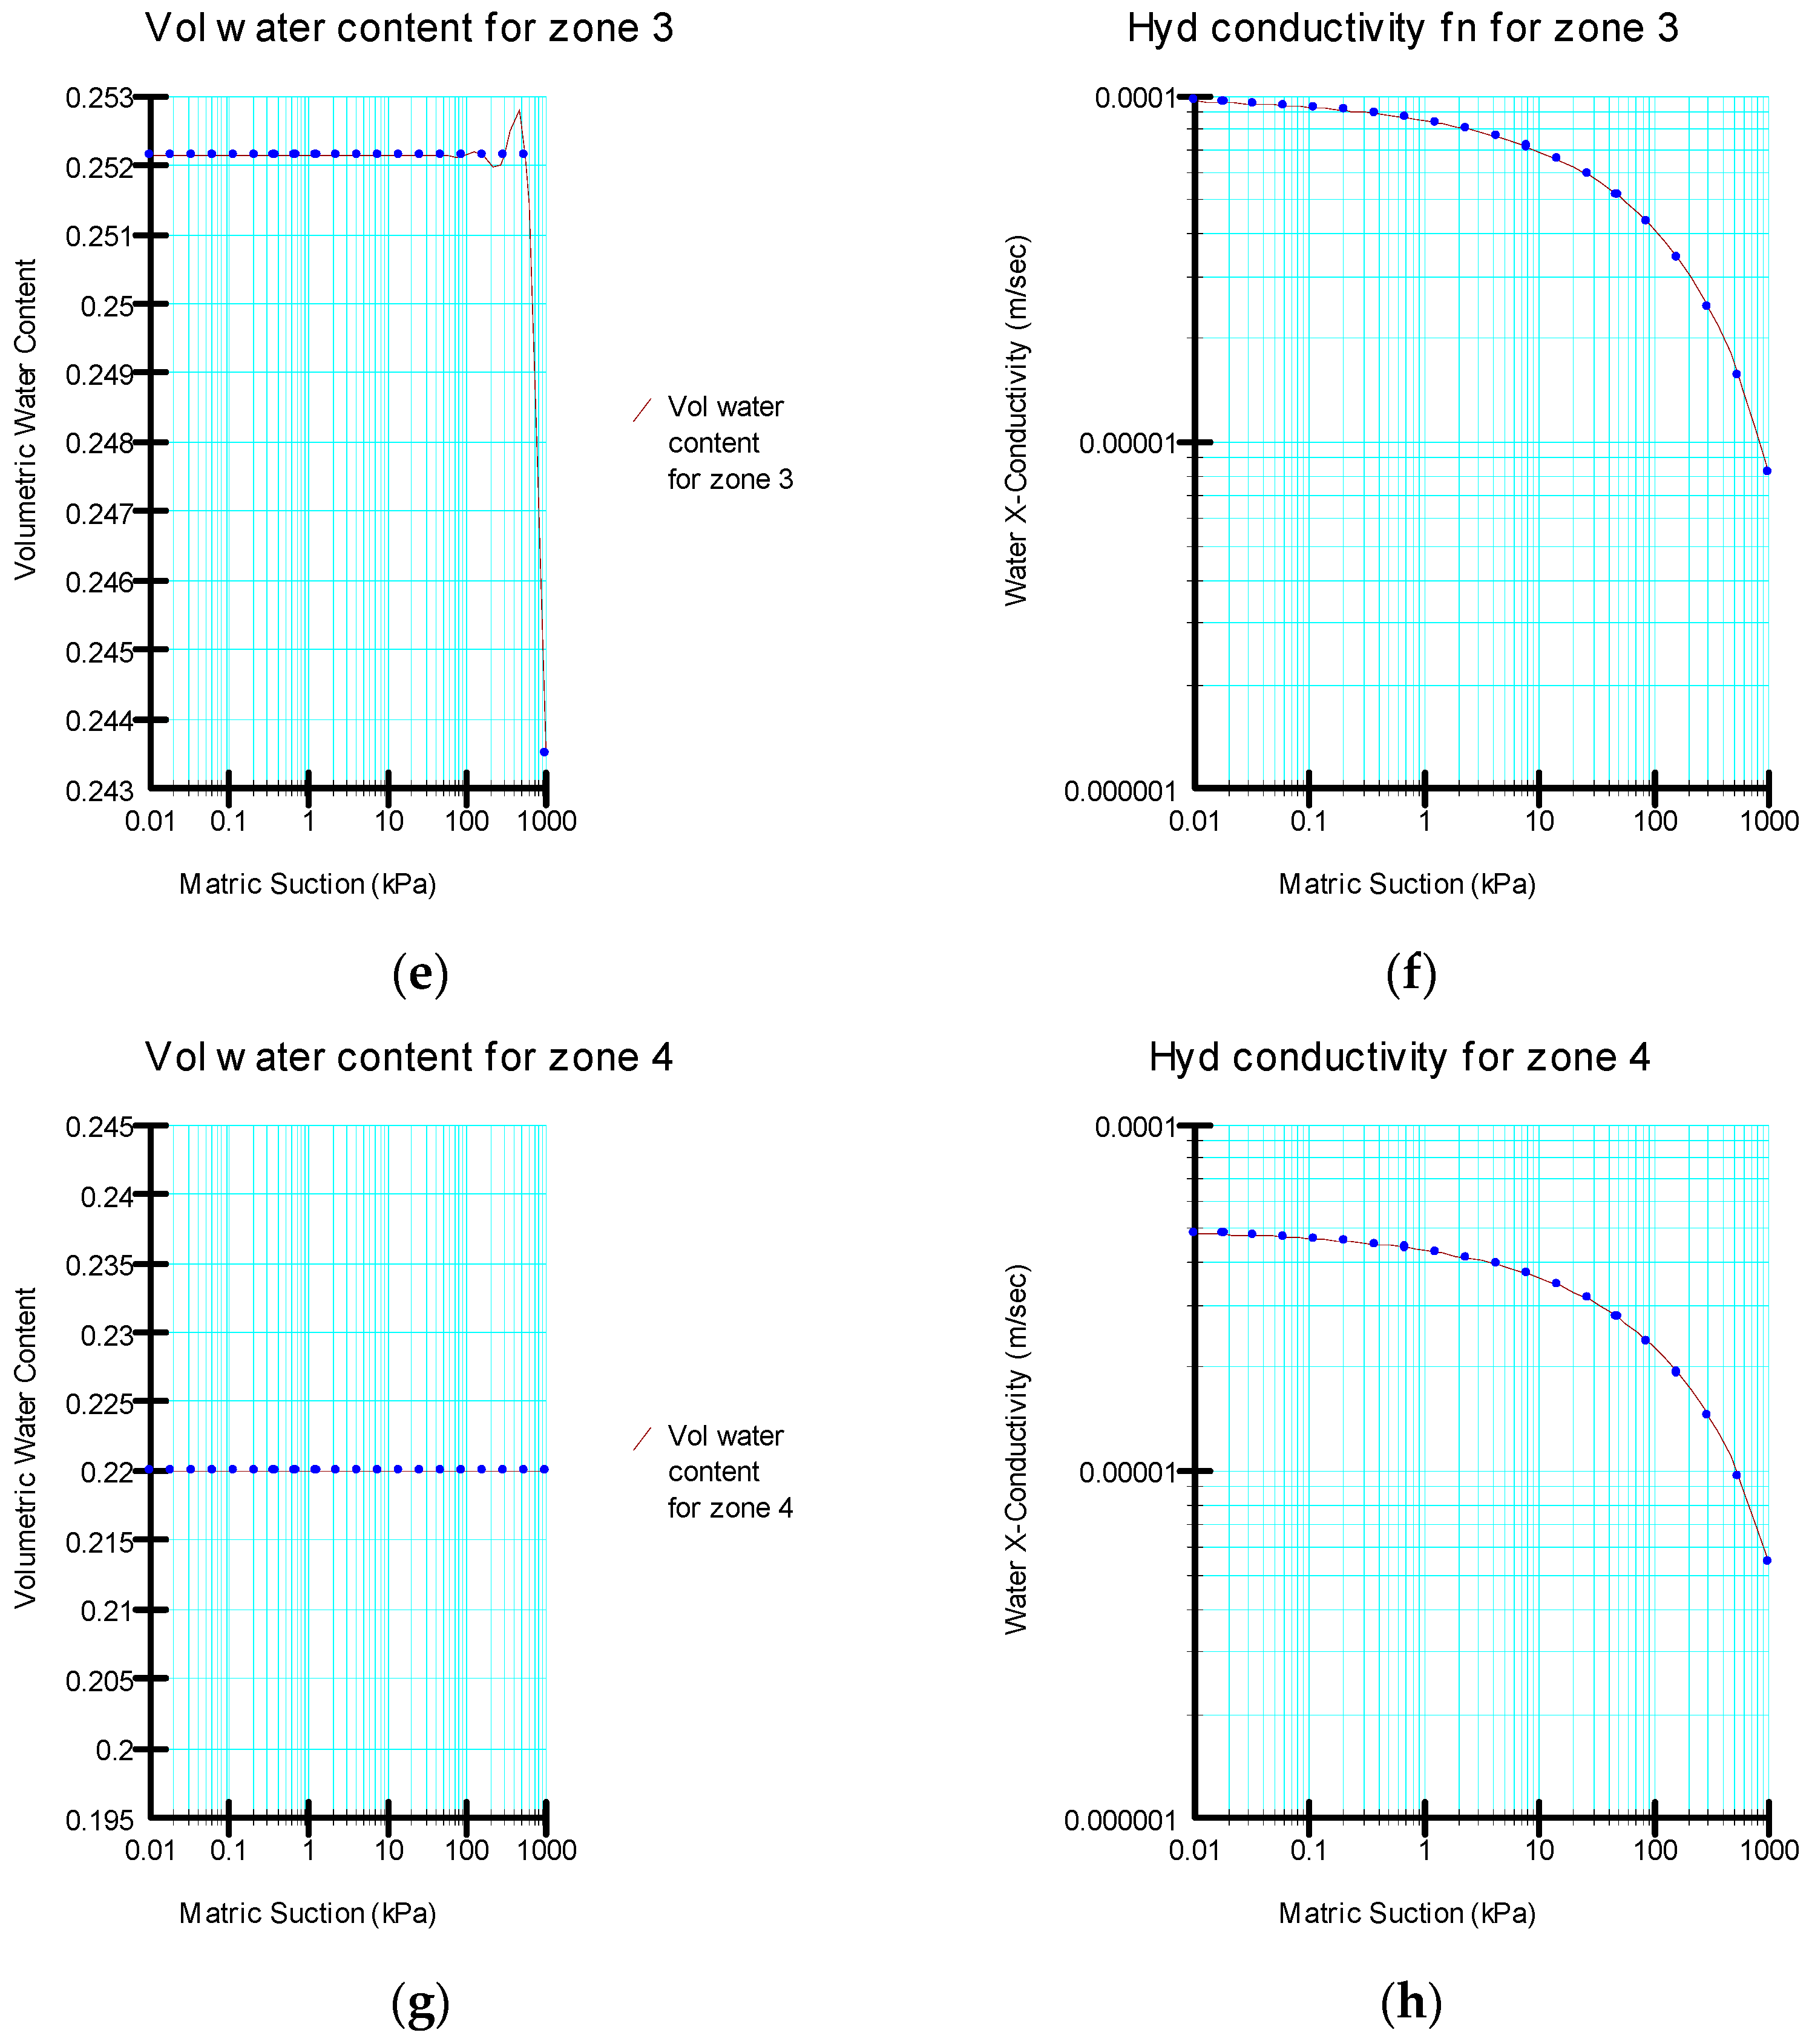
Figure 3 presents the summary of the volumetric water content and hydraulic conductivity functions from the first two zones of the study embankment generated based on the material characteristics assigned to the embankment.

2.6. Statistical Methods

One of the approaches used for assessing the research outcomes was the use of correlation matrices. These matrices were critical in assessing the strength of the relationship between the investigated parameters based on the factor of safety values. A high correlation in the matrices indicated a strong relationship between two or more variables, where the variables were not closely related if the correlation coefficient was low; the interpretation of the correlation coefficients was as follows:
  • 0 to 0.29: weak correlation;
  • 0.3 to 0.4: moderate correlation;
  • 0.5 to 0.69: strong correlation;
  • 0.7 to 1: very strong correlation.
Moreover, to determine whether the differences between the groups of data were statistically significant, a single-factor analysis of variance (ANOVA) was performed. This statistical analysis approach analyzes the levels of variance within the groups by taking samples from each of them.

3. Results and Discussion

3.1. Seepage Analysis

3.1.1. Steady State

From Figure 4, it can be observed that the seepage lines were relatively low in zone 4 as a result of the proper arrangement of materials in the embankment. Apart from the seepage analysis based on the current (normal) operating reservoir level, the embankment was also subjected to a long-term seepage analysis with the reservoir level operating at approximately half of the embankment (Figure 4b). From Figure 4b it can also be observed that the first three zones of the embankment were able to lower the seepage line to the bottom of zone 4. It is important to note that the importance of investigating the nature of seepage within an embankment is always exacerbated by the fact that, if not properly investigated and controlled, seepage can lead to significant stability issues, including piping failure [33]. This is due to the fact that intergranular pressure in earth fill material and seepage water below the phreatic line lowers the effective weight of the soil, which in turn reduces its shear strength [34].

3.1.2. Rapid Drawdown (1 m Per Day)

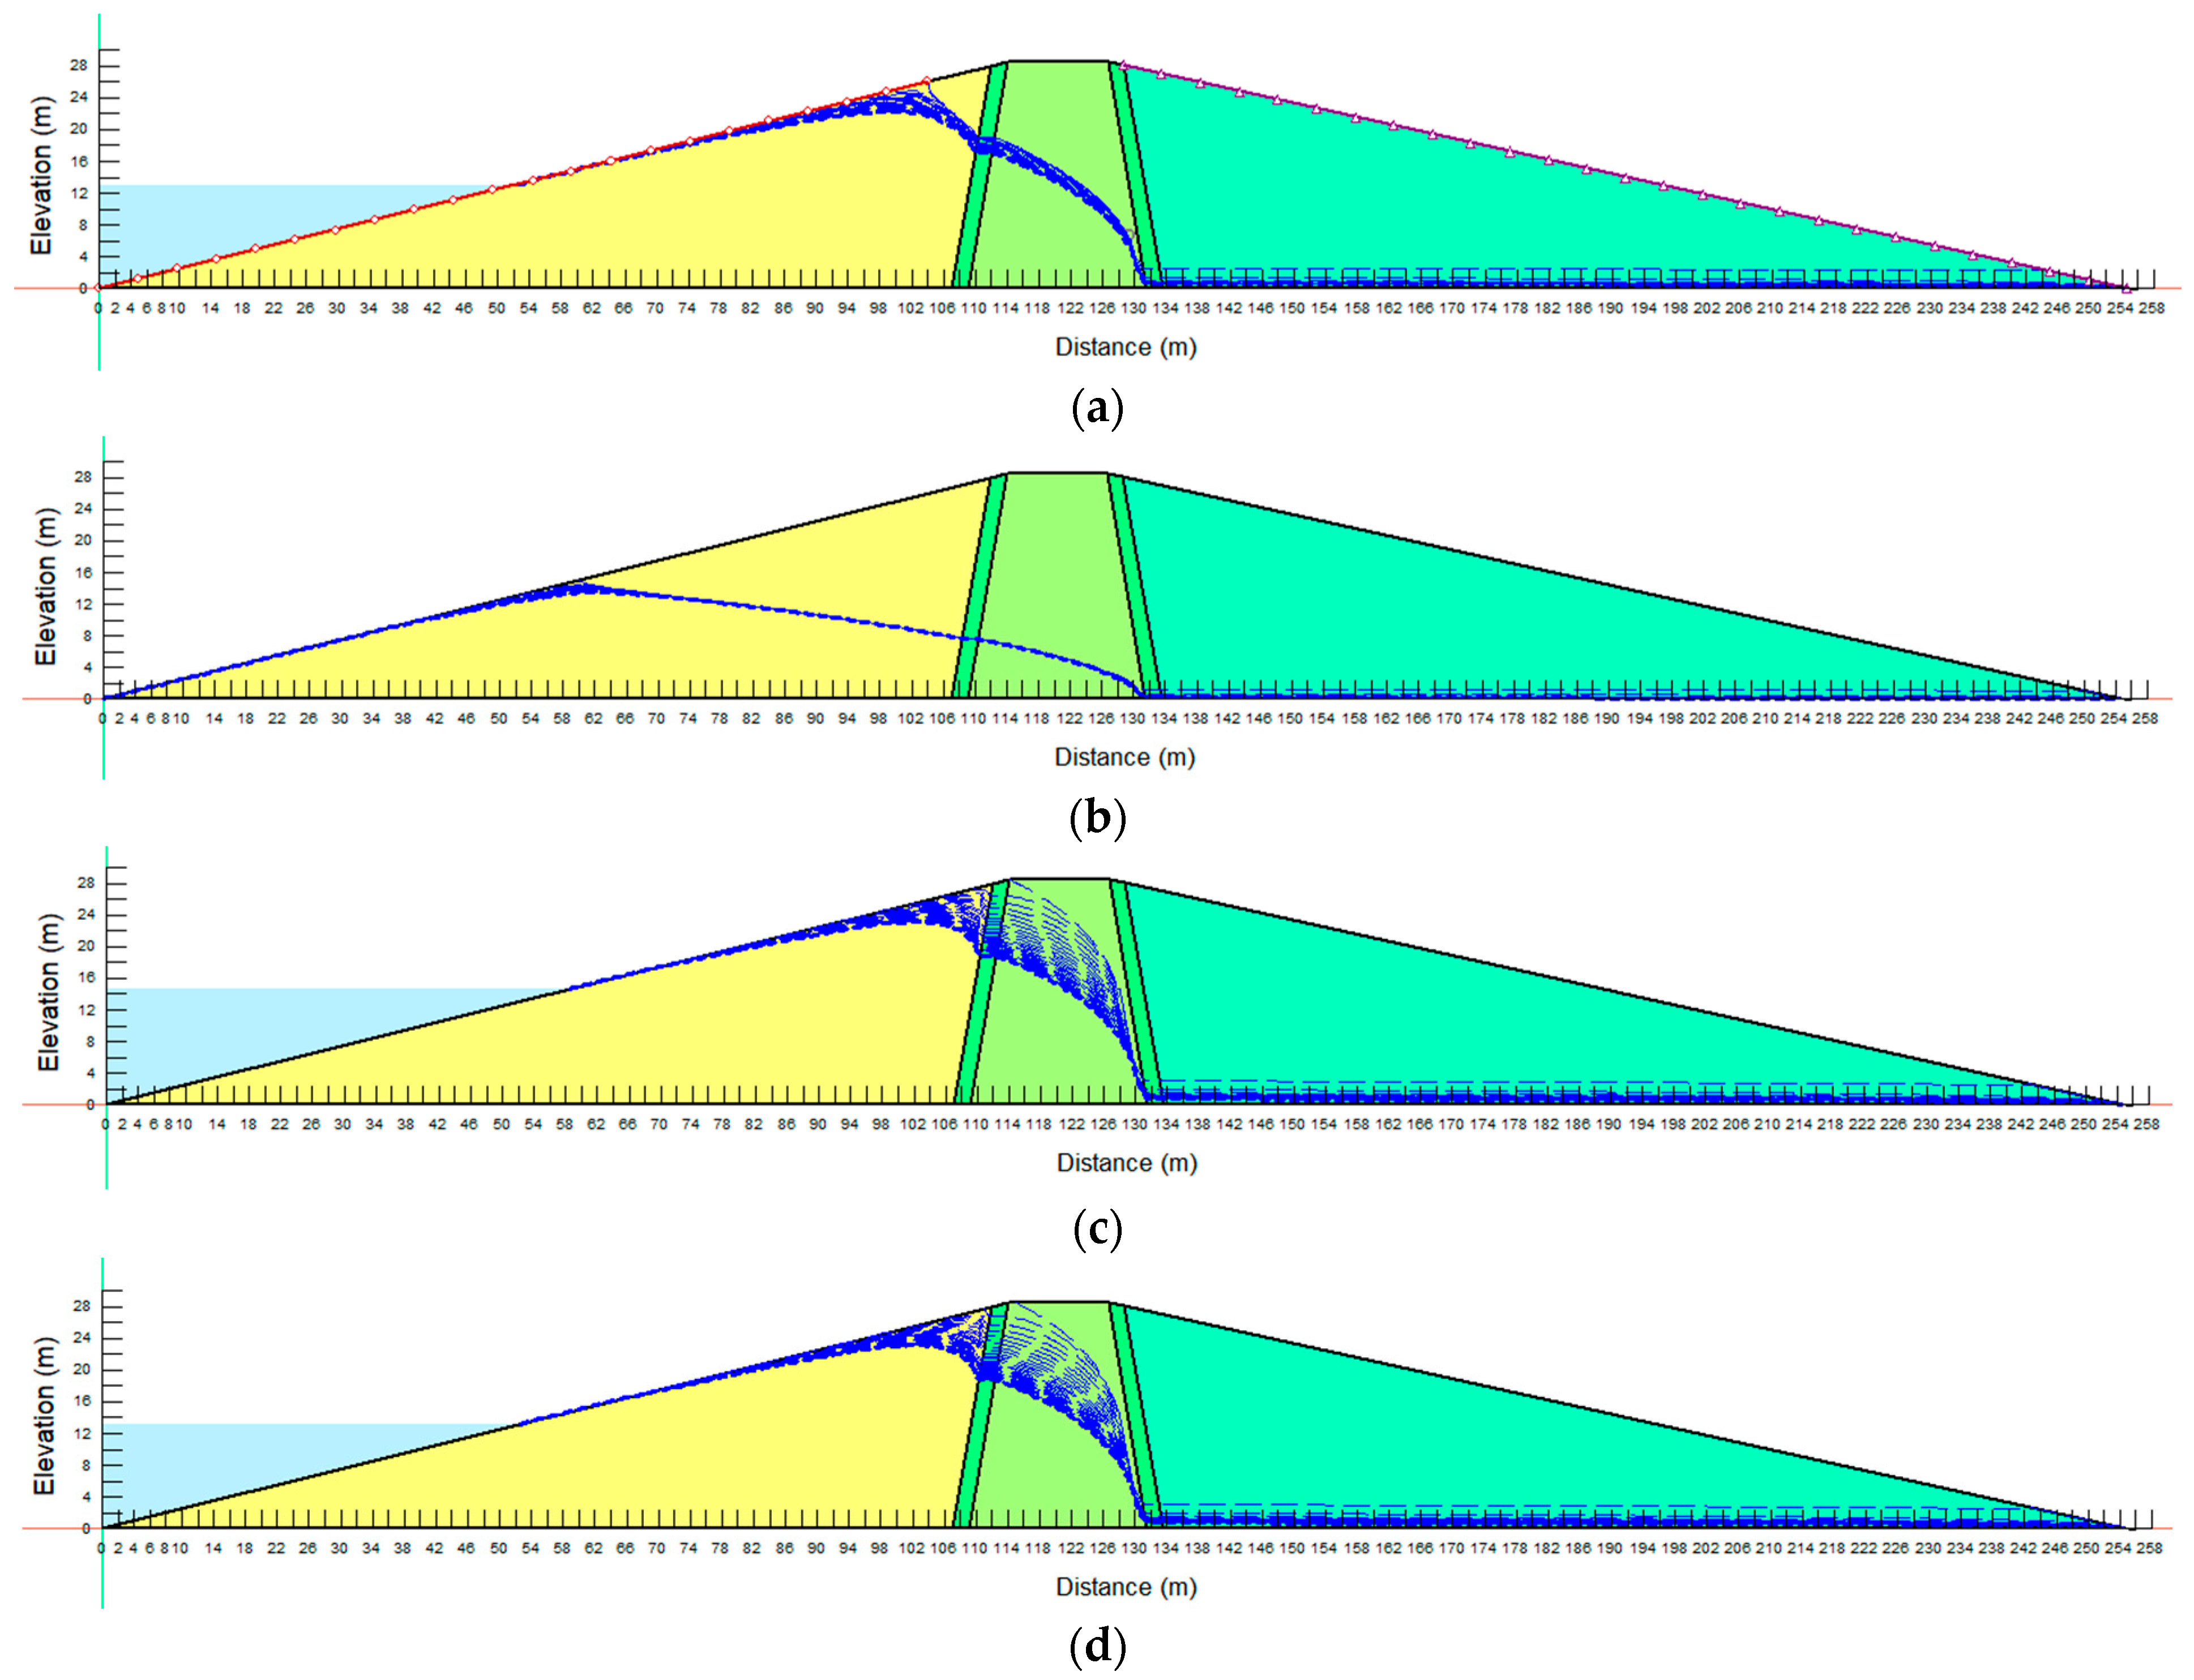
In this section of the study, a 1 m per day head function boundary condition was used to determine the changing water level of the reservoir. This boundary condition was applied to the embankment’s upstream slope until the reservoir’s maximum level was attained. To allow flow to leave the upstream side of the embankment, the potential seepage face review option was also enabled. Figure 5a depicts the seepage results when the embankment was exposed to a reservoir with a 1 m per day drawdown rate and the normal operational reservoir level. Furthermore, the figure demonstrates that, when the reservoir was drained using a 1 m per day drawdown rate, there was a significant struggle in terms of pore-water pressure dissipation. In this scenario, it is also worth noting that the first three zones of the embankment were unable to dissipate pore pressures in a timely manner. Under the 1 m per day drawdown rate, the second case was to subject the embankment to a reduced operating reservoir level. Figure 5b depicts the seepage results after the embankment was exposed to a reservoir with a 1 m per day drawdown rate and reduced operational reservoir level. From the results, it can be seen that the structure of the embankment and material characteristics were able to lower the seepage lines to the bottom of zone 4, despite the relatively high pore-water pressures in the first three zones of the embankment, as indicated by the phreatic lines following the drawdown. Under the 1 m per day drawdown rate, the third case was to subject the embankment to an operating reservoir level similar to the embankment height (Figure 5c), where a similar scenario in terms of pore-water pressure dissipation can be observed. This phenomenon can be thought to be linked to changes in the permeability rates between embankment zones. Under the 1 m per day drawdown rate, the fourth case was to subject the embankment to an overflow operating reservoir level. Figure 5d shows that the embankment did not have enough time to dissipate pore-water pressures from the embankment after the drawdown appropriately.

3.2. Slope Stability

3.2.1. Steady State

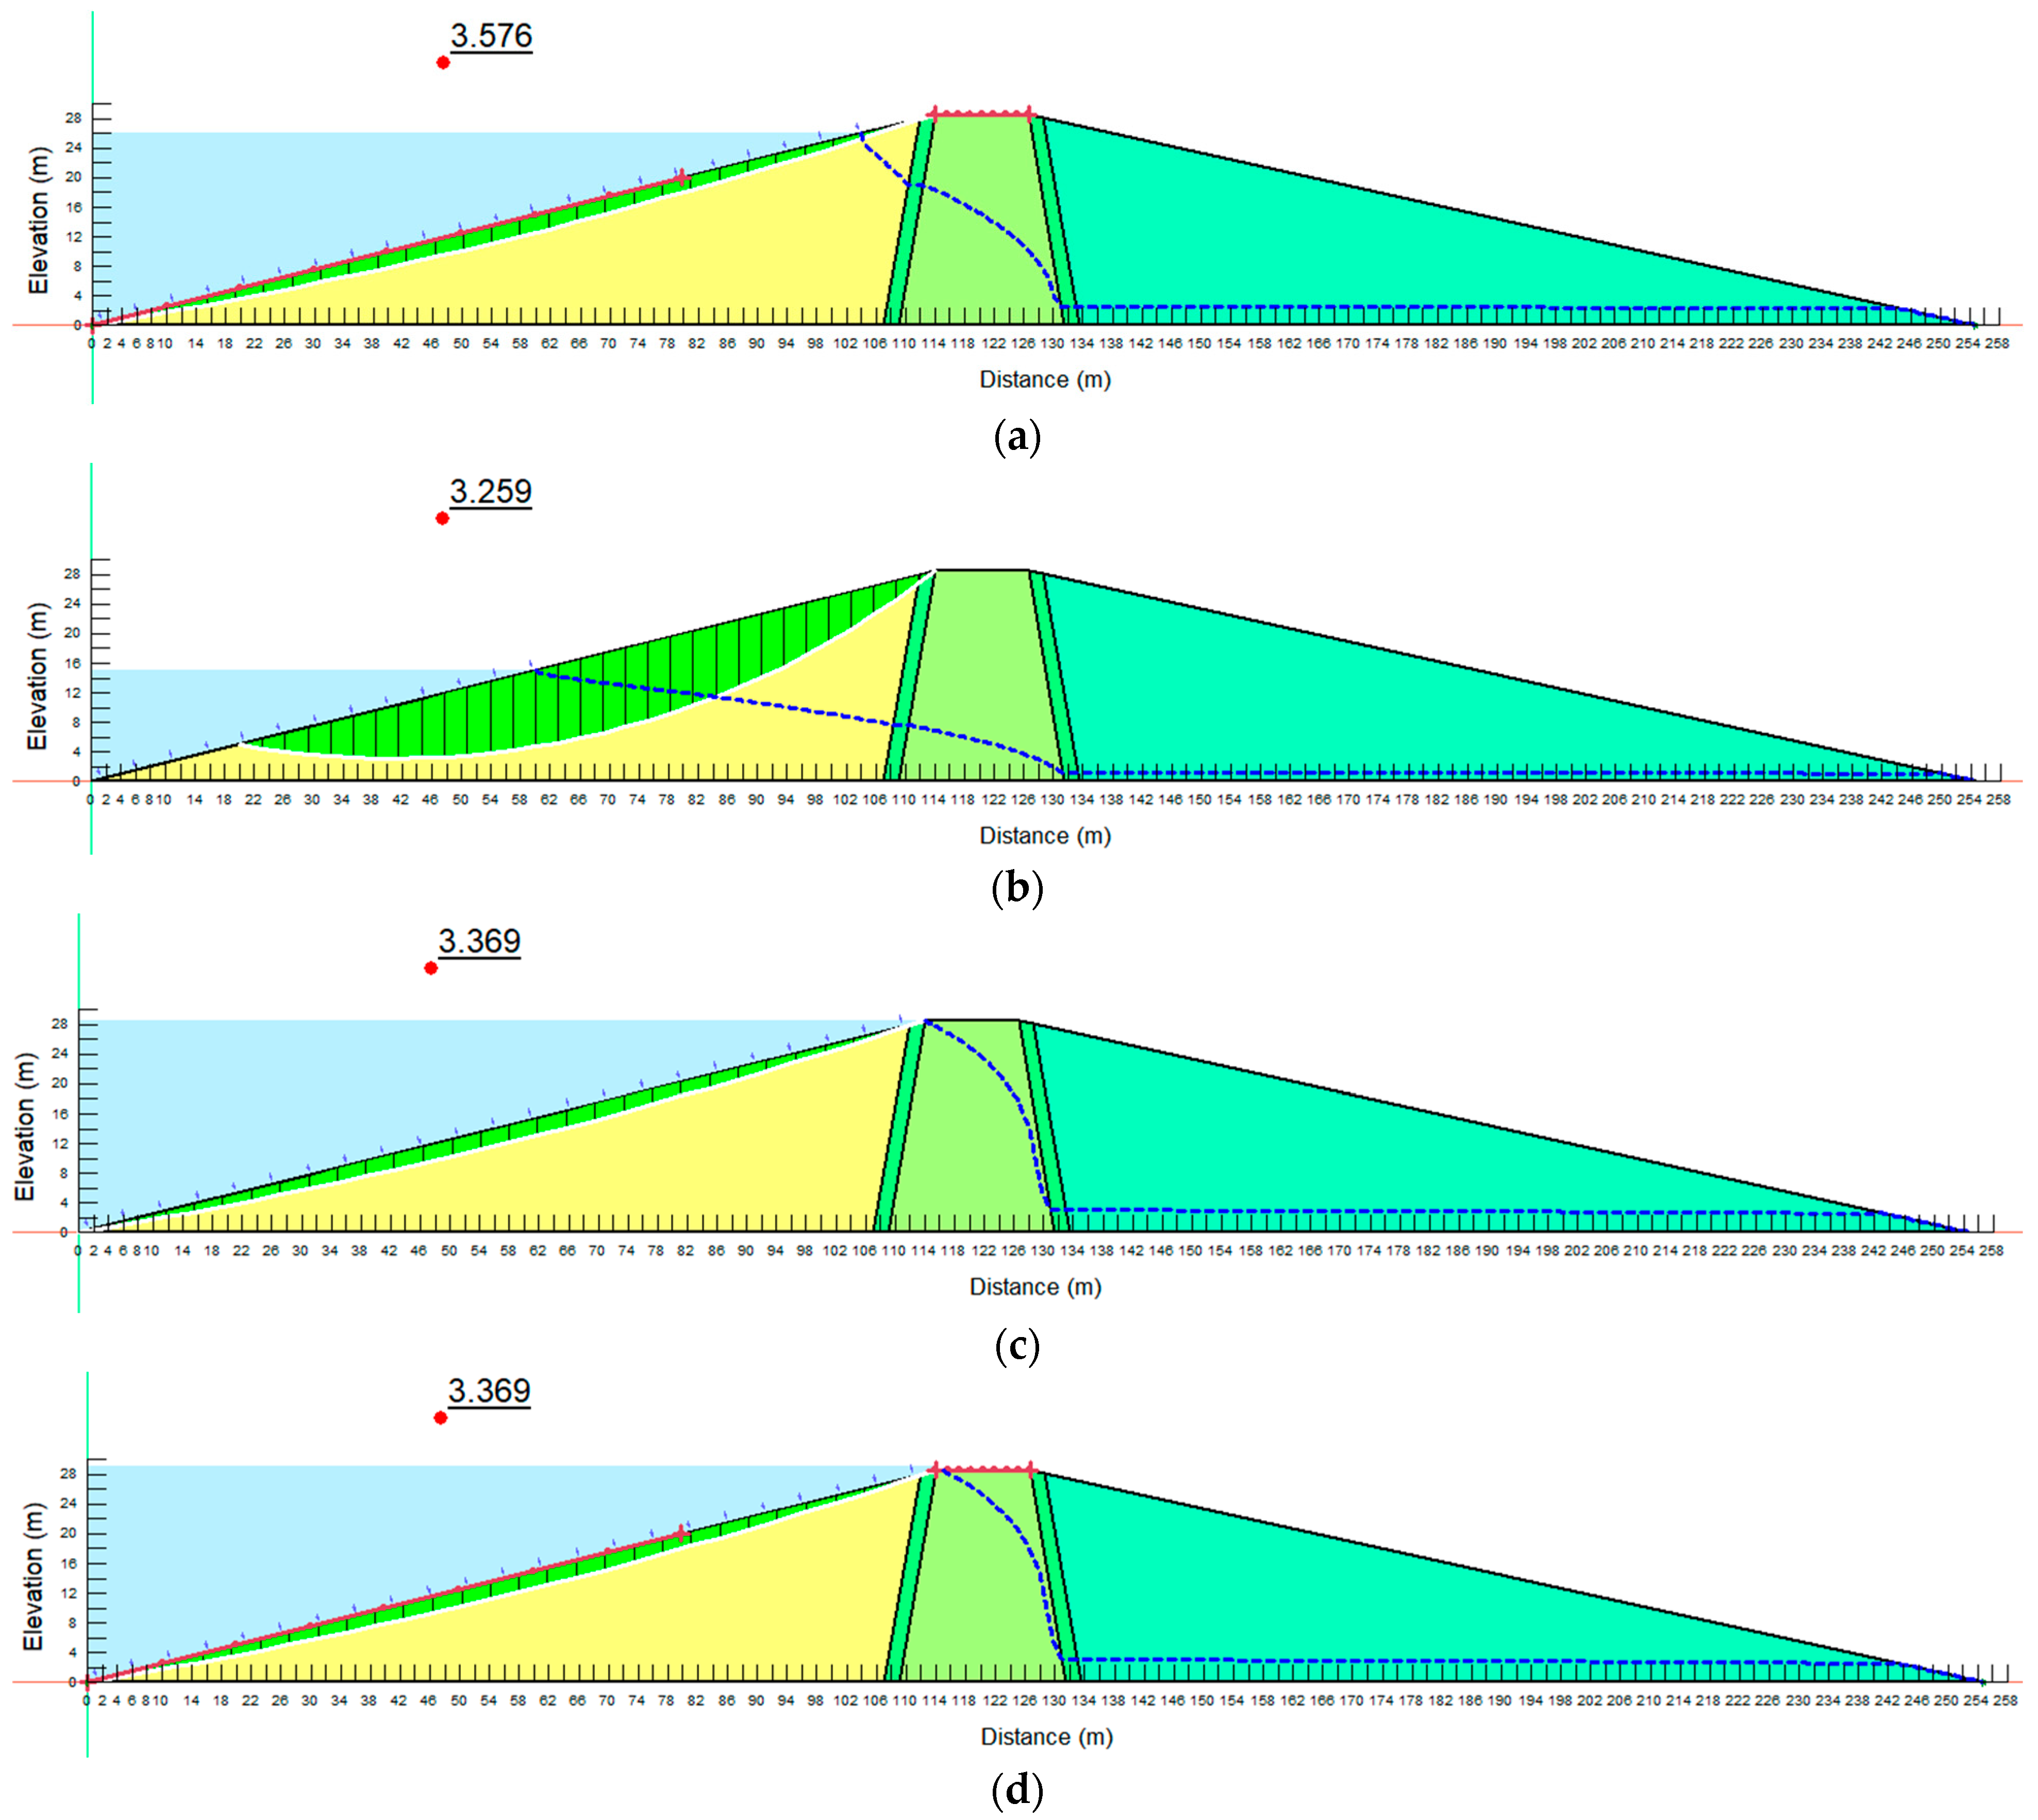
In this part of the study, the embankment slope stability analysis was carried out under long-term steady-state conditions at different operating levels of the reservoir (normal or current level, reduced level, embankment height level, as well as the overflow level) (Figure 6). Based on the steady-state-condition slope stability analysis under the normal operating reservoir level (Figure 6a), it can be observed that a factor of safety value of 3.576 was achieved. The retrieved factor of safety value suggests that, under steady-state and normal water level operating conditions, the embankment is relatively safe from potential slope failure. It is worth highlighting that many standards would require a minimum factor of safety value of 1.5 to ensure that the embankment is safe from probable failure [35,36]. However, when the reservoir’s long-term water level was reduced to half of the embankment; it resulted in a 3.259 factor of safety value (Figure 6b). The retrieved safety factor from the reduced water level was approximately 8.9% less than that achieved from the normal operating water level. These results further reveal that, when the reservoir long-term water level reduces, the factor of safety value under long-term steady-state conditions also reduces.
Then, the reservoir water level was increased to match the embankment height and investigate the state of slope stability under the long-term steady-state condition. Figure 6c shows that a 3.369 factor of safety value was retrieved from the long-term steady-state conditions. The retrieved factor of safety value was equivalent to 5.8% less than the 3.576 retrieved from the normal operating reservoir level. Again, based on the retrieved factor of safety values, we understand that, if the operating reservoir level changes, the design factor of safety value never remains the same, even from long-term steady-state conditions.
The reservoir water level was then adjusted to an overflow level, and the state of slope stability was investigated under a long-term steady-state condition. Figure 6d shows that the long-term steady-state conditions yielded a factor of safety value of 3.369. Additionally, the retrieved factor of safety value was 5.8% lower than the 3.576 obtained from the normal operational reservoir level.

3.2.2. Transient Flow Conditions

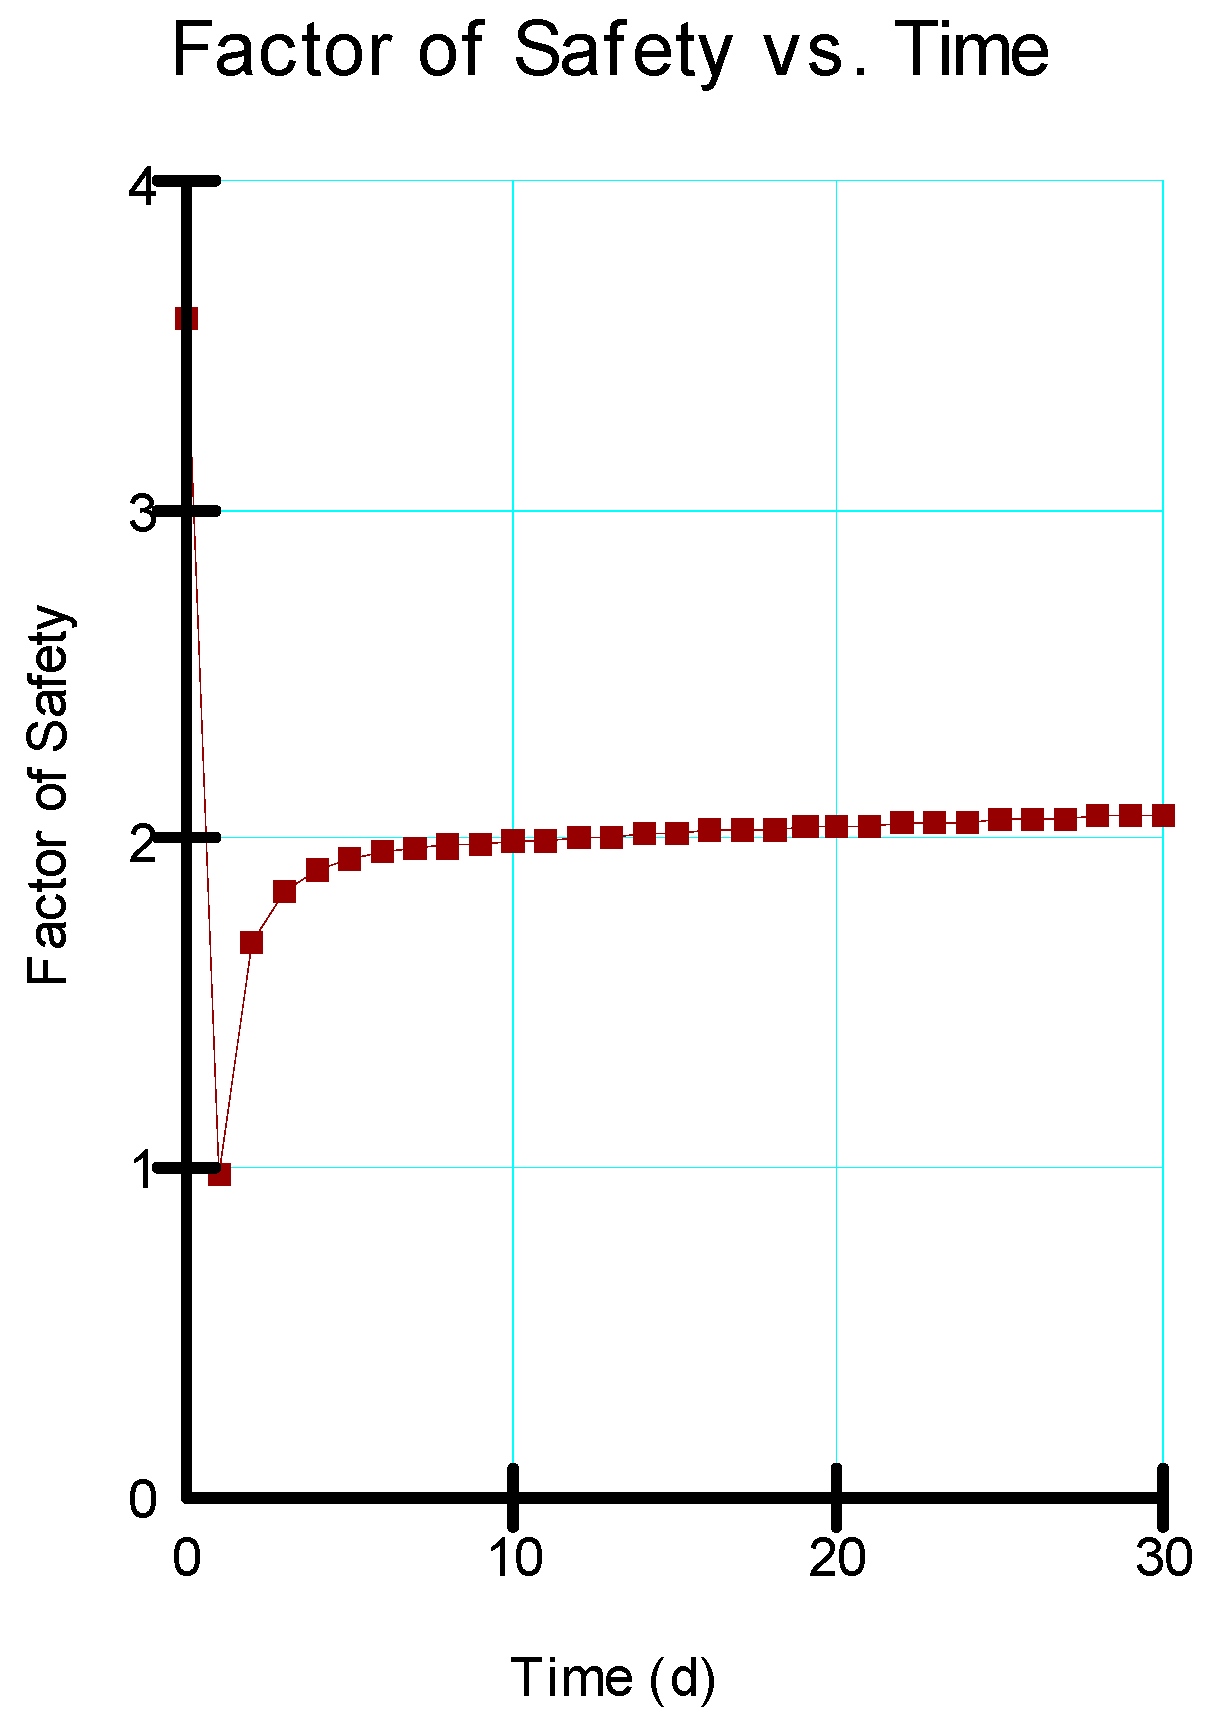
From Figure 7 and Table 4, it can be observed that a minimum factor of safety value of 0.979 was retrieved from the combination of instantaneous drawdown and normal operating reservoir level. From the minimum factor of safety value, it is definite that the embankment would totally fail after drawdown. However, the combination of an instantaneous drawdown rate and reduced operational water level resulted in a minimal factor of safety value of 2.318, which was roughly 28.9% lower than the 3.259 factor of safety value obtained from the combination of the steady-state condition and reduced reservoir water operating level. Moreover, the combination of instantaneous drawdown and embankment height operating reservoir level yielded a minimum factor of safety value of 0.612 (potential failure). Nevertheless, the combination of instantaneous drawdown and reservoir operation under overflow conditions generated a minimal factor of safety value of 0.56 (potential failure). Additionally, the retrieved factor of safety is 8.5% less than the minimum factor of safety obtained from the reservoir operating at the embankment height.
Additionally, the five (5)-day drawdown rate was subjected to different water levels. From Figure 8a and Table 4, it can be observed that a minimum factor of safety value of 1.876 was achieved from the combination of the five (5)-day drawdown rate and normal operating reservoir level. The factor of safety value recovered from the 5-day rapid drawdown rate under the normal operating reservoir level was approximately 47.54% less than the factor of safety value retrieved from the long-term steady-state condition under the normal operating reservoir level. However, on the other hand, the minimum factor of safety value obtained from the combination of the five (5)-day drawdown rate and reduced reservoir water operating level was 2.519 (Figure 8b and Table 4). The factor of safety value was roughly 22.7% lower than the 3.259 factor of safety value obtained from the combination of steady-state conditions and reduced reservoir water operating level.
The combination of the five (5)-day drawdown rate and embankment height operating reservoir level generated a minimum factor of safety value of 0.521 (Figure 8c and Table 4). Additionally, based on the minimum factor of safety value, it is a sign of a potential failure after the drawdown. Meanwhile, the minimum factor of safety value obtained from the combination of the five (5)-day drawdown rate and overflow water operating level was 1.536 (Figure 8b and Table 4). The factor of safety value was 54.4% less than the 3.369 factor of safety value obtained from the combination of steady-state conditions and overflow reservoir water operating level.
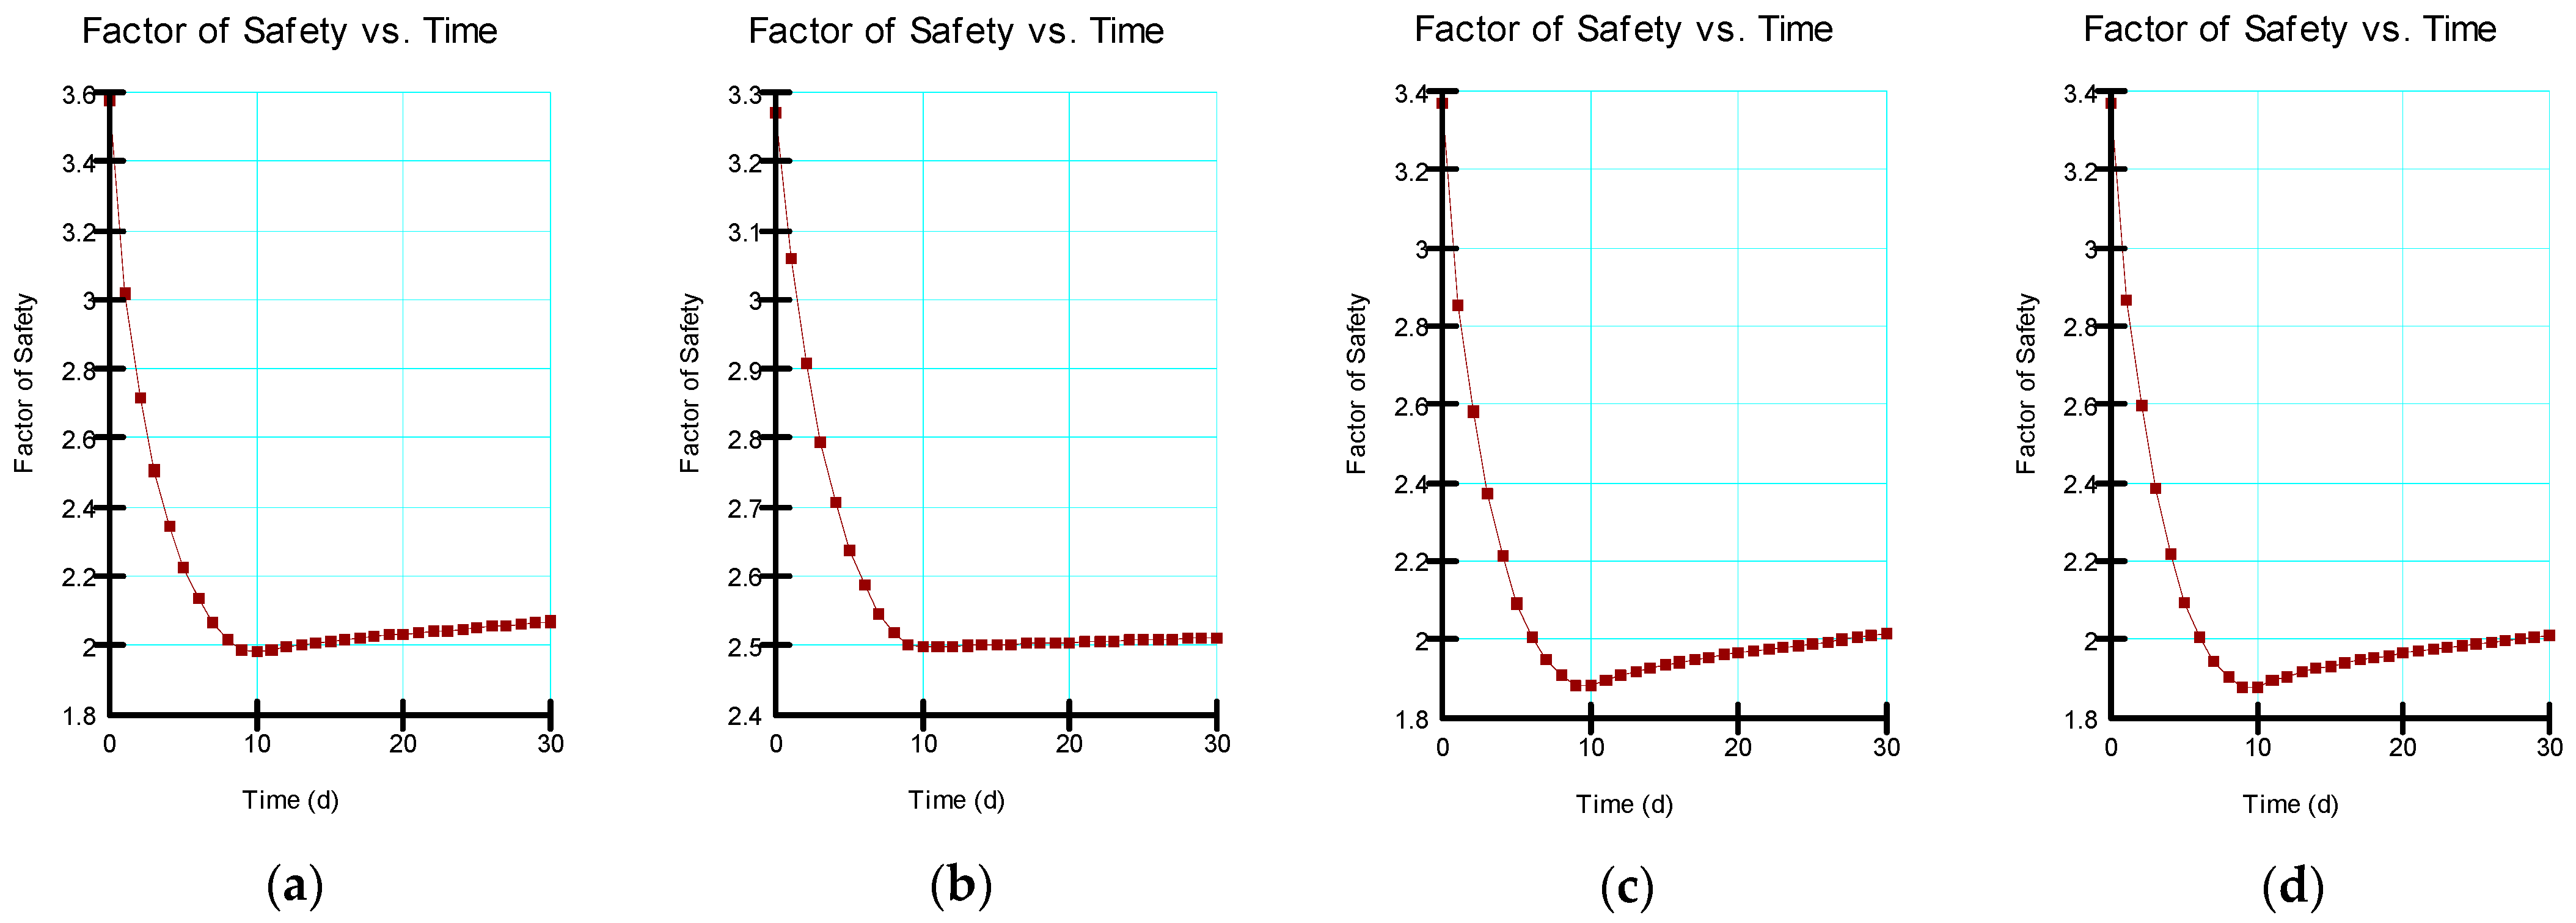
Furthermore, the embankment was subjected to a 10-day drawdown rate under different operating reservoir levels, a modest drawdown rate compared to the instantaneous and 5-day drawdown rates. Therefore, the combination of the ten (10)-day drawdown rate and the normal operational reservoir level resulted in a minimal factor of safety value of 1.986, as shown in Figure 9a. Therefore, the factor of safety value recovered from the 10-day rapid drawdown at the normal operational reservoir level was around 44.5% less than the factor of safety value recovered from the long-term steady-state condition at the normal operating reservoir level. In contrast, the minimum factor of safety value obtained from the combination of the 10-day drawdown rate and reduced reservoir water operating level was 2.497 (Figure 9b). Consequently, the retrieved safety factor was approximately 23.4% lower than the 3.259 factor of safety value obtained under steady-state conditions and a reduced operating reservoir water level.
Moreover, the combination of the ten (10)-day drawdown rate and the operating reservoir level at embankment height resulted in a minimal factor of safety value of 1.881 (Figure 9c). The safety factor was 44.2% less than the 3.369 factor of safety value obtained from the combination of steady-state conditions and a reservoir operating at embankment height.
The minimum factor of safety value obtained from the combination of the ten (10)-day drawdown rate and overflow water operating level was 1.878 (Figure 9d). The safety factor was 44.3% less than the 3.369 factor of safety value obtained from steady-state conditions and the overflow reservoir water operating level.
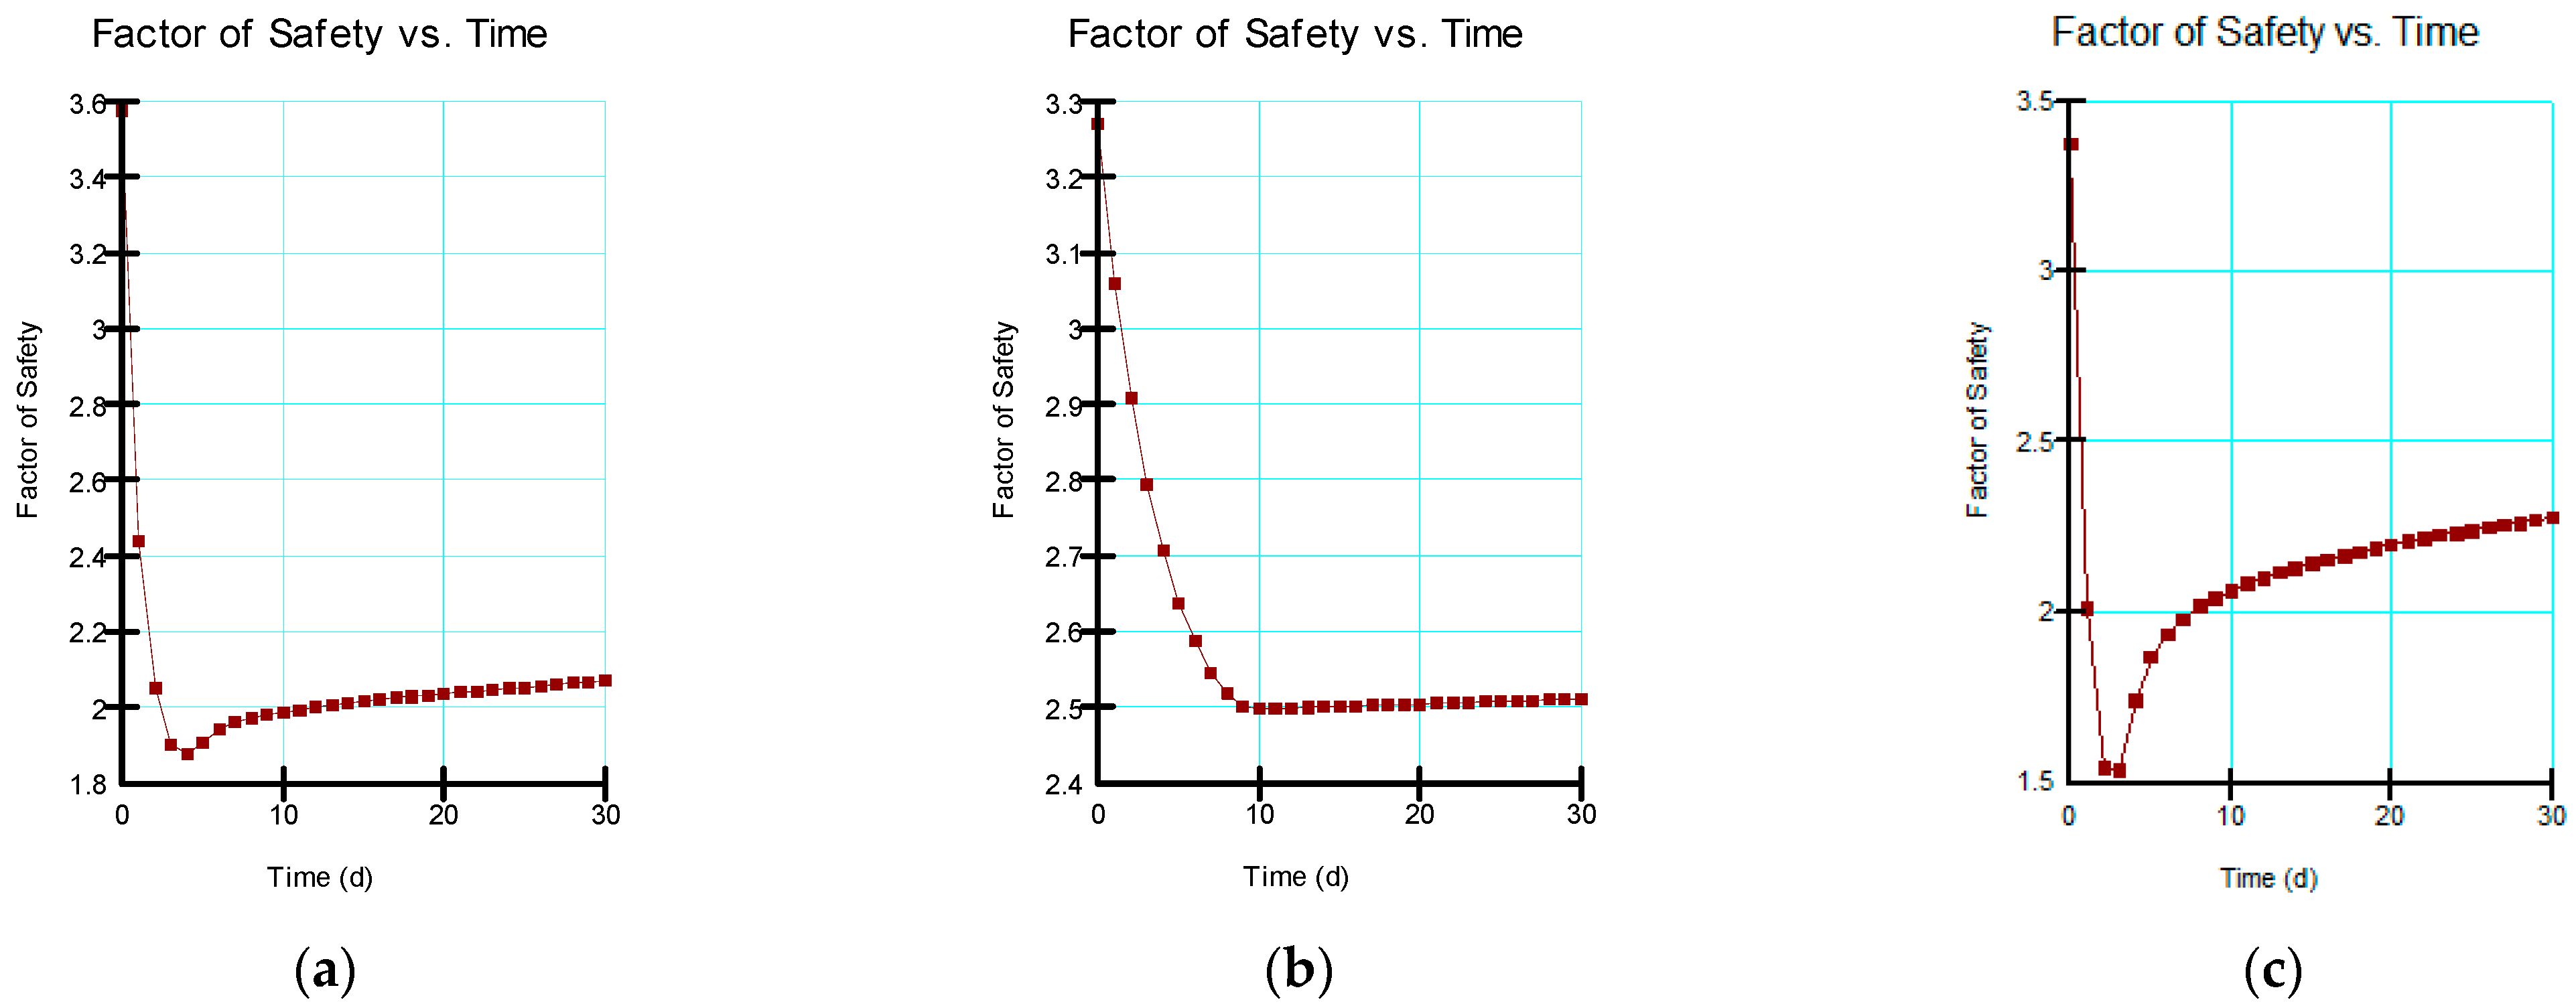
The embankment was also subjected to a 1 m per day drawdown rate, slightly reducing the instantaneous, 5-day, and 10-day drawdown rates. A minimum factor of safety value of 2.221 was obtained from the combination of the 1 m per day drawdown rate and the normal operational reservoir level, as shown in Figure 10a and Table 4. The factor of safety value recovered from the 1 m per day rapid drawdown at the normal operational reservoir level was approximately 37.9% lower than the factor of safety value recovered from the long-term steady-state condition at the normal operational reservoir level. The minimum factor of safety value obtained from the combination of the 1 m per day drawdown rate and reduced reservoir water operating level was 2.5 (Figure 10b and Table 4). The factor of safety value was about 23.3% less than the 3.259 factor of safety value obtained from the combination of steady-state conditions and reduced reservoir water operating level.
The combination of 1 m per day drawdown rate and operational reservoir level at embankment height resulted in a minimal factor of safety value of 2.133 (Figure 10c and Table 4). The minimum factor of safety value obtained was approximately 36.7% less than the 3.369 factor of safety value obtained from the combination of the steady-state condition and reservoir operating at embankment height. Moreover, the minimum factor of safety value obtained from the combination of the 1 m per day drawdown rate and overflow water operating level was 2.09 (Figure 10d and Table 4), approximately 38% lower than the 3.369 factor of safety value obtained from the combination of the steady-state condition and reduced reservoir water operating level.
Table 4 provides a summary of the factor of safety values in terms of the minimum (min), maximum (max), median, mean, as well as standard deviation (STD). It has to be noted that, when the reservoir level drops rapidly, it leads to no discernible change in the water level inside the dam body, especially when the embankment is characterized by soil material with low permeability. Moreover, as the water pressure working on the slope as a balance has been abruptly withdrawn from the reservoir, the weight of water still present in the soil slope tends to cause the wedge to slide. Additionally, the soil’s shear strength is greatly reduced due to pore pressure created in the soil, while the destabilizing force due to the saturated weight of the soil stays the same [37,38].

3.3. Correlation Analysis

Correlation analysis was conducted based on four slope stability factors (drawdown days, minimum factor of safety values, maximum factor of safety values, and pore-water pressures). From Table 5, it can be seen that there was a very high correlation among the investigated factors, with correlation coefficients ranging from 0.561 to 0.997. The combination of drawdown days and minimum factor of safety values yielded a correlation coefficient of 0.943, falling under the “very strong correlation” category. Additionally, the combination of the minimum factor of safety values and maximum factor of safety values resulted in a 0.561 correlation coefficient, falling under the “strong correlation” category. However, the correlation coefficient between the minimum factor of safety values and the maximum factor of safety values was slightly less than the combination of drawdown days and the minimum factor of safety values. This phenomenon can be linked to the fact that the maximum factor of safety values are highly determined by the long-term steady-state conditions. In contrast, the drawdown days determine the minimum factor of safety values.
The highest correlation of −0.997 was observed between the minimum factor of safety values and pore-water pressures; this phenomenon could be linked to the fact that the extent of pore-water pressure dissipation within the embankment plays a great role in the embankment stability. The phenomenon is reinforced by some results observed in the literature, whereby, according to the study conducted by Mukhlisin and Naam [39], it was observed that the slope becomes less stable when the pore-water pressure rises. The negative correlation is an indication that, when the other factors increase, the pore-water pressures in the embankment decrease and vice versa.

3.4. Analysis of Variance (ANOVA)

In order to further justify whether differences in the retrieved factor of safety values from the investigated operating levels and drawdown rates were significant, ANOVA was conducted. A total of 31 factors of safety values from day 0 (determined by the long-term steady-state condition) to day 30 of rapid drawdown were considered.
A single-factor ANOVA with an alpha value of 0.05 was performed on the investigated operational water levels under an instantaneous drawdown rate; the findings of the ANOVA are summarized in Table 6. From Table 6, it can be seen that the factor of safety values based on the investigated operational water levels yielded a p-value of 6.81 × 10⁻¹³. The obtained p-value (alpha value) under the instantaneous drawdown case was less than 0.05, indicating that the differences in the list of the factor of safety values from the investigated operating water levels were statistically significant. This was an important component of the research, since it allowed assessing if the differences in factor of safety values throughout the operational water levels studied were significant [40].
Additionally, apart from the instantaneous drawdown, a single-factor ANOVA was performed on the investigated operating water levels under a 5-day drawdown rate; the findings of the ANOVA are summarized in Table 7. From Table 7, it can be seen that the factor of safety values based on the investigated operational water levels yielded a p-value of 6.56 × 10⁻¹⁴. The obtained p-value (alpha value) was less than 0.05, indicating that the differences in the list of the factor of safety values from the investigated operating water levels under a 5-day drawdown rate were statistically significant. The differences could also be observed based on the ANOVA summary (sum, average, and variance). These results suggest that, when the embankment is subjected to a five (5)-day drawdown rate, there will be a significant difference in terms of the slope stability response under different reservoir operating levels.
In addition, the analyzed operating water levels were subjected to a single-factor ANOVA with an alpha value of 0.05 and a 10-day drawdown rate; the results of the ANOVA are described in Table 8. The factor of safety values based on the investigated operational water levels generated a p-value of 1.06 × 10⁻¹⁰, as shown in the table. Moreover, the retrieved p-value (alpha value) was also less than 0.05, as observed from the instantaneous and 5-day drawdown rates, showing the statistical significance of the differences in terms of the factor of safety values. Therefore, it is significantly important to investigate the potential responses of the embankment slope stability under a combination of different operating levels and drawdown rates.
Furthermore, a single-factor ANOVA was also performed for the 1 m per day drawdown rate; the results are summarized in Table 9. As indicated in the table, the factor of safety values from the investigated operational water levels gave a p-value of 0.309. The resulting p-value (alpha value) was higher than 0.05, indicating that the differences were not statistically significant. It can also be stated that the same embankment might respond differently depending on the operational levels and drawdown rates used. To be more specific, from the results in Table 9, when the embankment was subjected to the 1 m per day drawdown rate, the influence of the operating water levels on the retrieved factor of safety values with time decreased significantly. This means that the factor of safety values with time from the normal operating level, embankment height, overflow, and reduced levels were relatively close from one operating level to another.
Table 9 shows that, despite the p-value being larger than the stated alpha value, there were some changes in the sum, average, and variance. The results, on the whole, highlight the need to monitor the drawdown rates during planned reservoir draining. However, it is important to note that controlling the drawdown rate during disasters is also a feat that cannot be easily accomplished [41].
The factor of safety values from the drawdown rates, on the other hand, were subjected to a single factor (Table 10). In this part of the study, the factor of safety values from each drawdown rate were grouped according to the operating reservoir levels. For instance, the normal operating reservoir level factor of safety values from all of the investigated drawdown rates were grouped together and then analyzed using ANOVA. The recovered p-values were then assessed against the alpha value of 0.05 to determine if they were smaller than the alpha value. The normal operating reservoir level, maximum operating reservoir level at embankment height, and maximum operating reservoir level at overflow level all showed p-values less than 0.05. This phenomenon indicates that the variations in the factor of safety values from the drawdown rates were statistically significant. However, the p-value obtained from the reduced operating reservoir level was higher than the alpha value, indicating that the differences were not statistically significant. It is clear from the results that, as the reservoir drawdown rate slows, the impact of the operating reservoir level on slope stability decreases. In this case, it may be stated that both the reservoir drawdown rate and operating reservoir level have a crucial impact on the slope stability of an embankment dam.

4. Conclusions

The impact of land-use changes, extreme events, and loading conditions on the slope stability of an embankment dam was explored in this study. The problem was investigated using numerical modeling in the case of the Chardara dam in Kazakhstan’s Syrdarya basin. Numerical modeling was performed to explore the impact of flow conditions on embankment slope stability. The results revealed that the operating reservoir levels could substantially affect even the long-term steady-state conditions. For instance, the steady-state factor of safety from the reduced water level was approximately 8.9% less than that achieved from the normal operating water level. The transient flow analyses retrieved correlation coefficients ranging from 0.561 to 0.997 from drawdown days, the minimum factor of safety values, the maximum factor of safety values, and pore-water pressures. The highest correlation was found between the minimum factor of safety values and pore-water pressures, which was −0.997. Based on the p-values retrieved from ANOVA, it was observed that the differences in the factor of safety values from the normal, embankment height, and overflow operating water levels were statistically significant. The p-value for the reduced operating reservoir level, on the other hand, was higher than the alpha value, indicating that the differences in the factor of safety values were not statistically significant. In view of the results, it is reasonable to conclude that, despite the fact that both the reservoir rapid drawdown and reservoir operating water levels have a significant impact on the embankment slope stability, the operating reservoir level becomes an issue of significant concern when the drawdown rate is higher. From this study, we understand that it is of critical importance to investigate an embankment under different potential operating levels during the design phase toward achieving more sustainable embankment dams.
Author Contributions

Conceptualization, T.M. and Y.B.U.; methodology, T.M. and A.S.T.; software, S.Z.Z.; validation, A.S.T.; formal analysis, I.M.P. and A.S.T.; investigation, T.M., Y.B.U. and A.K.A. (Assem Kairatovna Abisheva); resources, A.K.A. (Aliya Kairatovna Aldungarova); data curation, S.Z.Z.; writing—original draft preparation, T.M.; writing—review and editing, I.M.P.; visualization, A.K.A. (Assem Kairatovna Abisheva); supervision, Y.B.U.; project administration, A.K.A. (Aliya Kairatovna Aldungarova); funding acquisition, A.K.A. (Aliya Kairatovna Aldungarova). All authors have read and agreed to the published version of the manuscript.

Funding

This research was funded by the Science Committee of the Ministry of Education and Science of the Republic of Kazakhstan (Grant No. AP09258790).

Institutional Review Board Statement

Not applicable.

Informed Consent Statement

Not applicable.

Data Availability Statement

The data supporting reported results are available on reasonable request from the corresponding author.

Conflicts of Interest

The authors declare no conflict of interest.

References

  1. Lanz, B.; Dietz, S.; Swanson, T. Global population growth, technology, and malthusian constraints: A quantitative growth theoretic perspective. Int. Econ. Rev. 2017, 58, 973–1006. [Google Scholar] [CrossRef] [Green Version]
  2. Wang, Y.; Li, X.; Zhang, F.; Wang, W.; Xiao, R. Effects of rapid urbanization on ecological functional vulnerability of the land system in Wuhan, China: A flow and stock perspective. J. Clean. Prod. 2020, 248, 119284. [Google Scholar] [CrossRef]
  3. Zhang, X.; Chen, L.; Shen, Z. Impacts of rapid urbanization on characteristics, sources and variation of fecal coliform at watershed scale. J. Environ. Manag. 2021, 286, 112195. [Google Scholar] [CrossRef] [PubMed]
  4. Fiscal, P.R.; Taratori, R.; Pacho, M.A.; Ioakimidis, C.S.; Koutra, S. A Strategic and Smart Environmental Assessment of Rapid Urbanization in Beijing. Energies 2021, 14, 5138. [Google Scholar] [CrossRef]
  5. Li, H.; Li, L.; Chen, L.; Zhou, X.; Cui, Y.; Liu, Y.; Liu, W. Mapping and Characterizing Spatiotemporal Dynamics of Impervious Surfaces Using Landsat Images: A Case Study of Xuzhou, East China from 1995 to 2018. Sustainability 2019, 11, 1224. [Google Scholar] [CrossRef] [Green Version]
  6. Hamilton, B.; Coops, N.C.; Lokman, K. Time series monitoring of impervious surfaces and runoff impacts in Metro Vancouver. Sci. Total Environ. 2021, 760, 143873. [Google Scholar] [CrossRef]
  7. Hamdi, R.; Termonia, P.; Baguis, P. Effects of urbanization and climate change on surface runoff of the Brussels Capital Region: A case study using an urban soil-vegetation-atmosphere-transfer model. Int. J. Climatol. 2011, 31, 1959–1974. [Google Scholar] [CrossRef]
  8. Wang, Y.; Meng, F.; Liu, H.; Zhang, C.; Fu, G. Assessing catchment scale flood resilience of urban areas using a grid cell based metric. Water Res. 2019, 163, 114–852. [Google Scholar] [CrossRef]
  9. Aniskin, A.; Mkilima, T.; Shakhmov, Z.; Kozina, G. Potential Impact of Land-Use Changes on River Basin Hydraulic Parameters Subjected to Rapid Urbanization. Teh. Vjesn. Tech. Gaz. 2021, 28, 1519–1525. [Google Scholar] [CrossRef]
  10. Li, M.-H.; Sung, R.-T.; Dong, J.-J.; Lee, C.-T.; Chen, C.-C. The formation and breaching of a short-lived landslide dam at Hsiaolin Village, Taiwan—Part II: Simulation of debris flow with landslide dam breach. Eng. Geol. 2011, 123, 60–71. [Google Scholar] [CrossRef]
  11. Rybnikov, P.; Smirnov, A. Quality analysis of the Earth remote sensing data in the surface runoff modeling for failure prediction at the tailing dumps. E3S Web Conf. 2020, 177, 06002. [Google Scholar] [CrossRef]
  12. Charles, J.A. A historical perspective on reservoir safety legislation in the United Kingdom. In Reservoirs in a Changing World; Thomas Telford Publishing: London, UK, 2002; pp. 494–509. [Google Scholar]
  13. Tanaka, T.; Nagai, S. A Case Study on Seepage Failure of Hauser Lake Dam. J. Groundw. Hydrol. 1998, 40, 33–42. [Google Scholar] [CrossRef] [Green Version]
  14. Schuyler, J.D. The Construction of the Sweetwater Dam. Trans. Am. Soc. Civ. Eng. 1888, 19, 201–218. [Google Scholar] [CrossRef]
  15. Hansen, B. Stemming the Flow: The Sweetwater Dam. Civ. Eng. Mag. Arch. 2007, 77, 36–37. [Google Scholar] [CrossRef]
  16. Xu, Y.; Zhang, L.; Jia, J. Lessons from Catastrophic Dam Failures in August 1975 in Zhumadian, China. In Proceedings of the GeoCongress 2008, New Orleans, LA, USA, 9–12 March 2008; American Society of Civil Engineers: Reston, VA, USA, 2008; pp. 162–169. [Google Scholar]
  17. Xu, J.; Wei, W.; Bao, H.; Zhang, K.; Lan, H.; Yan, C.; Sun, W. Failure models of a loess stacked dam: A case study in the Ansai Area (China). Bull. Eng. Geol. Environ. 2020, 79, 1009–1021. [Google Scholar] [CrossRef]
  18. Gaagai, A.; Aouissi, H.A.; Krauklis, A.E.; Burlakovs, J.; Athamena, A.; Zekker, I.; Boudoukha, A.; Benaabidate, L.; Chenchouni, H. Modeling and Risk Analysis of Dam-Break Flooding in a Semi-Arid Montane Watershed: A Case Study of the Yabous Dam, Northeastern Algeria. Water 2022, 14, 767. [Google Scholar] [CrossRef]
  19. Tung, S.; Mukherjee, S.; Bhandari, G. Stability of Earthen Embankment with Clay Core Under Tidal Fluctuation. In Geotechnical Applications; Lecture Notes in Civil Engineering; Springer: Singapore, 2019; pp. 199–207. [Google Scholar]
  20. Noshin, S.; Alam, M.; Sadiq, S.; Mandokhail, S.J. Stability Analysis of Flood Bunds: A Study on Geotechnical Health Evaluation of Embankments. IOP Conf. Ser. Mater. Sci. Eng. 2018, 414, 012035. [Google Scholar] [CrossRef]
  21. Sjödahl, P.; Dahlin, T.; Johansson, S. Embankment dam seepage evaluation from resistivity monitoring data. Near Surf. Geophys. 2009, 7, 463–474. [Google Scholar] [CrossRef] [Green Version]
  22. Llanque Ayala, G.R.; Chagas da Silva Filho, F.; Ferreira Leme, R.; Do Carmo Reis Cavalcanti, M.; Fernando Mahler, C. Rapid Drawdown in Homogeneous Earth Dam Considering Transient Flow and Suction. Ing. Investig. 2020, 40, 17–26. [Google Scholar] [CrossRef]
  23. GEO-SLOPE International Ltd. Rapid Drawdown; GEO-SLOPE Int. Ltd.: Calgary, AB, Canada, 2002; pp. 1–7. [Google Scholar]
  24. Roache, B.; Johnstone, A. Engineering geology investigation and numerical modelling design of the Ramp 12 highwall. In Slope Stability 2020, Proceedings of the 2020 International Symposium on Slope Stability in Open Pit Mining and Civil Engineering, Perth, Australia, 12 May 2020; Australian Centre for Geomechanics: Perth, Australia, 2020. [Google Scholar]
  25. Lee, K.Z.-Z.; Jensen, N.; Gillette, D.R.; Wittwer, D.T. Seismic Deformation Analysis of Embankment Dams Using Simplified Total-Stress Approach. J. Geotech. Geoenviron. Eng. 2019, 145, 04019076. [Google Scholar] [CrossRef]
  26. He, K.; Song, C.; Fell, R. Numerical modelling of transverse cracking in embankment dams. Comput. Geotech. 2021, 132, 104028. [Google Scholar] [CrossRef]
  27. Mkilima, T. Toe drain size and slope stability of homogeneous embankment dam under rapid drawdown. Technobius 2021, 1, 0001. [Google Scholar] [CrossRef]
  28. GIBB. IFAS Agency for the GEF Project, Aral Sea Basin Program Water & Environmental Management Project, Component C: Dam Safety and Reservoir Management Chardara Dam Safety Assessment Report; CAWater-Info: Almaty, Kazakhstan, 2000; Volume 46. [Google Scholar]
  29. Arshad, I.; Babar, M.M.; Javed, N. Numerical Analysis of Drawdown in an Unconfined Aquifer due to Pumping Well by SIGMA/W and SEEP/W Simulations. Adv. Sci. Technol. Eng. Syst. J. 2016, 1, 11–18. [Google Scholar] [CrossRef]
  30. Omar, R.; Baharuddin, I.; Taha, H.; Roslan, R.; NK, H.; MF, M. Slope Stability Analysis of Granitic Residual Soil Using SLOPE/W, Resistivity and Seismic. Int. J. Eng. Technol. 2018, 7, 172. [Google Scholar] [CrossRef]
  31. El-Ramly, H.; Morgenstern, N.R.; Cruden, D.M. Probabilistic slope stability analysis for practice. Can. Geotech. J. 2002, 39, 665–683. [Google Scholar] [CrossRef]
  32. Lam, L.; Fredlund, D.G. A general limit equilibrium model for three-dimensional slope stability analysis. Can. Geotech. J. 1993, 30, 905–919. [Google Scholar] [CrossRef]
  33. Omofunmi, O.; Kolo, J.; Oladipo, A.; Diabana, P.; Ojo, A. A Review on Effects and Control of Seepage through Earth-fill Dam. Curr. J. Appl. Sci. Technol. 2017, 22, 1–11. [Google Scholar] [CrossRef]
  34. Calamak, M.; Yilmaz, A.N.; Yanmaz, A.M. Performance Evaluation of Internal Drains of Earthen Dams. J. Perform. Constr. Facil. 2018, 32, 04018085. [Google Scholar] [CrossRef]
  35. Chen, Z.-Y.; Shao, C.-M. Evaluation of minimum factor of safety in slope stability analysis. Can. Geotech. J. 1988, 25, 735–748. [Google Scholar] [CrossRef]
  36. Chen, Z.Y.; Shao, C.M. Evaluation of minimum factor of safety in slope stability analysis. Int. J. Rock Mech. Min. Sci. Geomech. Abstr. 1989, 26, A205. [Google Scholar] [CrossRef]
  37. Xu, J.; Yang, X. Effects of Seismic Force and Pore Water Pressure on Three Dimensional Slope Stability in Nonhomogeneous and Anisotropic Soil. KSCE J. Civ. Eng. 2018, 22, 1720–1729. [Google Scholar] [CrossRef]
  38. Wulandari, S.N.; Li, A.J.; Wahyudi, H. Effects of pore water pressure on cohesive-frictional slope stability by limit analysis. IOP Conf. Ser. Earth Environ. Sci. 2019, 351, 012015. [Google Scholar] [CrossRef]
  39. Mukhlisin, M.; Naam, S.I. Effect of rock fragments on pore water pressure and slope stability at a hillslope. J. Geol. Soc. India 2015, 86, 337–343. [Google Scholar] [CrossRef]
  40. Pujar, P.M.; Kenchannavar, H.H.; Kulkarni, R.M.; Kulkarni, U.P. Real-time water quality monitoring through Internet of Things and ANOVA-based analysis: A case study on river Krishna. Appl. Water Sci. 2020, 10, 22. [Google Scholar] [CrossRef] [Green Version]
  41. Eshiet, K.I.-I.; Yang, D.; Sheng, Y. Computational study of reservoir sand production mechanisms. Geotech. Res. 2019, 6, 177–204. [Google Scholar] [CrossRef] [Green Version]
Figure 1. Some of the operating levels investigated in the study: (a) normal operating level, (b) reduced operating level, (c) embankment height operating level.
Infrastructures 07 00065 g001
Figure 2. Embankment geometry.
Infrastructures 07 00065 g002
Figure 3. Volumetric water content and hydraulic conductivity functions: (a) volumetric water content from the first zone, (b) hydraulic conductivity function from the first zone, (c) volumetric water content from the second zone, (d) hydraulic conductivity function from the second zone, (e) volumetric water content for zone 3, (f) hydraulic conductivity function for zone 3, (g) volumetric water content for zone 4, (h) hydraulic conductivity function for zone 4.
Infrastructures 07 00065 g003aInfrastructures 07 00065 g003b
Figure 4. Steady-state seepage: (a) normal operating reservoir level, (b) reduced operating level, (c) embankment height level, (d) overflow level.
Infrastructures 07 00065 g004
Figure 5. Rapid drawdown (1 m per day) seepage: (a) normal operating level, (b) rapid drawdown (1 m per day) seepage under reduced reservoir operating level, (c) embankment-height reservoir operating level, (d) overflow reservoir operating level.
Infrastructures 07 00065 g005
Figure 6. Steady-state slope stability: (a) normal operating reservoir level, (b) reduced reservoir operating level, (c) embankment height reservoir level, (d) overflow reservoir level.
Infrastructures 07 00065 g006
Figure 7. Instantaneous drawdown under the normal operating reservoir level.
Infrastructures 07 00065 g007
Figure 8. Drawdown over 5 days: (a) normal operating reservoir level, (b) reduced operating reservoir level, (c) overflow operating reservoir level.
Infrastructures 07 00065 g008
Figure 9. Drawdown over 10 days: (a) normal operating reservoir level, (b) reduced operating reservoir level, (c) embankment height operating reservoir level, (d) overflow operating reservoir level.
Infrastructures 07 00065 g009
Figure 10. Drawdown of 1 m per day: (a) normal operating reservoir level, (b) reduced operating reservoir level, (c) embankment height operating reservoir level, (d) overflow operating reservoir level.
Infrastructures 07 00065 g010
Table 1. General foundation and construction materials properties.
MaterialDry Density t/m3Strength Parameters
Tan φCohesive Strength (kg/cm2)
Foundations
Clay1.50.510.15
Silt1.50.510.03
Sand1.60.560.158
Construction material
River Bed1.390.5470.122
Floodplain area1.390.5440.124
Lacustrine area1.500.5360.117
Table 2. Cases used in the investigation process.
Case NumberNameDescription
1Normal operating levelModeling is conducted based on the current reservoir operating level
2Reduced operating level Modeling is conducted with the long-term water level at half of the embankment height
3Embankment height operating levelModeling is conducted based on the embankment’s maximum height
4Overflow operating levelModeling is conducted based on the overflowing reservoir level
Table 3. Embankment material properties.
ParameterZone
Zone 1Zone 2a, bZone 3Zone 4
Saturated hydraulic conductivity (ksat), m/s4.6 × 10−51.2 × 10−41.4 × 10−85.2 × 10⁻⁵
Diameter at passing 10% (mm)0.10.20.0020.1
Diameter at passing 60% (mm)400.80.0540
Liquid limit (%)45 50
Unit weight (kN/m3)20.518.52020.5
Saturated water content (%)29.640.136.829.6
Internal angle of friction (degree)40382840
Cohesion (kPa)--15-
Table 4. Summary of the factor of safety values retrieved from different cases.
Operating LevelDrawdown RateMinMaxMedianMeanSTD
NormalInstantaneous0.9793.5762.0202.0170.345
5 days1.8763.5762.0292.0740.289
10 days1.9803.5762.0432.1680.342
1 m per day2.2214.0162.3012.5430.470
Maximum embankment heightInstantaneous0.6123.3701.9971.9580.373
5 days0.9843.6312.4782.4000.389
10 days1.8813.3691.9752.0770.313
1 m per day2.1333.6382.2762.4740.425
Overflow Instantaneous0.5603.3701.9961.9540.380
5 days1.6023.3702.0022.0050.279
10 days1.8783.3691.9742.0770.316
1 m per day2.0903.6362.2202.4400.444
Reduced water levelInstantaneous2.3183.3482.5622.5760.149
5 days2.5303.2612.5432.6090.167
10 days2.4973.2712.5072.5840.181
1 m per day2.5003.2712.5102.6220.202
Table 5. Correlation coefficients among different slope stability factors.
Drawdown DaysMinimum FOSMaximum FOSPore-Water Pressures
Drawdown days1
Minimum FOS0.9431
Maximum FOS0.7940.5611
Pore-water pressures−0.807−0.997−0.5701
FOS = factor of safety.
Table 6. Summary of ANOVA results from instantaneous drawdown.
ANOVA: Single Factor
Summary
GroupsCountSumAverageVariance
NORL3162.5132.0170.123
MORL-EH3160.7081.9580.144
MORL-OF3160.5761.9540.149
RORL3179.8692.5760.023
ANOVA
Source of VariationSSdfMSFp-valueF crit
Between Groups8.44832.81625.6546.81 × 10−132.680
Within Groups13.1731200.110
Total21.621123
NORL = normal operating reservoir level; MORL-EH = maximum operating reservoir level at embankment height; MORL-OF = maximum operating reservoir level at overflow level; RORL = reduced operating reservoir level.
Table 7. Summary of ANOVA results from the 5-day drawdown rate.
ANOVA: Single Factor
Summary
GroupsCountSumAverageVariance
NORL3164.3052.0740.086
MORL-EH3174.3882.40.156
MORL-OF3162.1492.0050.080
RORL3180.8942.6090.029
ANOVA
Source of VariationSSdfMSFp-valueF crit
Between Groups7.46032.48728.2986.56 × 10−142.680
Within Groups10.5451200.088
Total18.005123
NORL = normal operating reservoir level; MORL-EH = maximum operating reservoir level at embankment height; MORL-OF = maximum operating reservoir level at overflow level; RORL = reduced operating reservoir level.
Table 8. Summary of ANOVA results from the 10-day drawdown rate.
ANOVA: Single Factor
Summary
GroupsCountSumAverageVariance
NORL3167.2172.1680.121
MORL-EH3164.3732.0770.101
MORL-OF3164.3762.0770.103
RORL3180.1172.5840.034
ANOVA
Source of VariationSSdfMSFp-valueF crit
Between Groups5.46931.82320.2851.06 × 10−102.680
Within Groups10.7851200.090
Total16.255123
NORL = normal operating reservoir level; MORL-EH = maximum operating reservoir level at embankment height; MORL-OF = maximum operating reservoir level at overflow level; RORL = reduced operating reservoir level.
Table 9. Summary of the ANOVA results from the 1 m per day drawdown rate.
ANOVA: Single Factor
Summary
GroupsCountSumAverageVariance
NORL3178.8392.5430.228
MORL-EH3176.6932.4740.187
MORL-OF3175.6542.4400.204
RORL3181.2782.6220.042
ANOVA
Source of VariationSSdfMSFp-valueF crit
Between Groups0.60030.2001.2100.3092.680
Within Groups19.8371200.165
Total20.437123
NORL = normal operating reservoir level; MORL-EH = maximum operating reservoir level at embankment height; MORL-OF = maximum operating reservoir level at overflow level; RORL = reduced operating reservoir level.
Table 10. Summary of the ANOVA results from the investigated operating water levels (instantaneous, 5 days, 10 days, and 1 m per day).
Operating LevelSource of VariationSSMSFp-ValueF CritStatus (Is p-Value < 0.05)
NORLBetween Groups5.2151.73812.4443.84 × 10−72.680TRUE
MORL-EHBetween Groups5.7541.91813.0501.96 × 10−72.680TRUE
MORL-OFBetween Groups4.5061.50211.1921.58 × 10−62.680TRUE
RORLBetween Groups0.0420.0140.4370.7272.680FALSE
NORL = normal operating reservoir level; MORL-EH = maximum operating reservoir level at embankment height; MORL-OF = maximum operating reservoir level at overflow level; RORL = reduced operating reservoir level.
Publisher’s Note: MDPI stays neutral with regard to jurisdictional claims in published maps and institutional affiliations.