Article

Coupling Coordination of “Urban Rail Transit—Social Economy” Composite System

1
School of Earth Sciences and Engineering, Nanjing University, Nanjing 210023, China
2
State Key Laboratory for Geomechanics and Deep Underground Engineering, CUMT, Xuzhou 221116, China
3
Institute of Earth Sciences, Saint Petersburg State University, 7-9 Universitetskaya Embankment, 199034 Saint Petersburg, Russia
*
Author to whom correspondence should be addressed.
Infrastructures 2022, 7(4), 56; https://doi.org/10.3390/infrastructures7040056
Submission received: 14 March 2022 / Revised: 7 April 2022 / Accepted: 9 April 2022 / Published: 11 April 2022
(This article belongs to the Special Issue Underground Infrastructure Engineering)

Abstract

:
The harmonious development of urban rail transit, underground space engineering, and social economy is the key to regional sustainable development. Based on synergetic theory, this paper constructs the coupling coordination evaluation system of “rail transport-social economy” composite system at the scale of a city cluster. With this system, the coupling and coordinated development pattern and characteristics of “rail transit-social economy” in the Yangtze River Delta city cluster from 2002 to 2020 were analyzed. The paper makes a horizontal comparison with the Beijing-Tianjin-Hebei city cluster and the Pearl River Delta city cluster, as well as analyzes the differences in development and existing problems, and puts forward policy suggestions for rail and urban underground space development. The results show that: (1) The rail transit of 11 cities in the Yangtze River Delta shows a “step by step” development pattern. That is “national central city, provincial city, second-tier city, third-tier city, etc.”, accompanied by periodic changes of coupling and coordination degree. In addition, there is also the phenomenon of unbalanced development within the region; (2) From 2002 to 2020, the development of rail transit in the three city clusters shows a situation of “the overall supply is lacking and lags behind the social economy for a long time”. Among them, the Pearl River Delta city cluster has the most serious lags. Multi-channel financing, speeding up the construction of the rail transit scale according to local conditions, and improving operating efficiency are considered to be the keys to solve this problem; (3) In general, the coupling between rail transit and the social economy in the Yangtze River Delta city cluster is better than that in the Beijing-Tianjin-Hebei city cluster and the Pearl River Delta city cluster, but the coordination is at a slight disadvantage.

1. Introduction

With the acceleration of China’s urbanization process, it also brings a series of “urban disease” problems. For example, the shortage of urban land resources and space resources caused by the population boom, the difficulty of traveling caused by traffic congestion, the heat island effect and environmental pollution. The development and utilization of urban underground space is considered to be an effective measure to solve the contradiction between urban land shortage and urban population growth. It is very beneficial for expanding urban space development and urban sustainable development [1,2]. Based on this, underground space development in many cities has been rapidly developed [3]. Among them, rail transit, as the most common way of urban underground space development, plays a very important role. Rail transit can optimize urban spatial structure, alleviate urban traffic congestion, reduce carbon emissions, improve the urban environment and promote the growth of the urban economy [4,5].
By the end of 2020, the total length of operational lines of global urban rail transit was about 33,346 km, covering 538 cities in 77 countries and regions [6], among which 45 cities in Mainland China (excluding Hong Kong, Macao and Taiwan) have opened urban rail transit. The total length of their operational lines is 7969.7 km, accounting for 24% of the total length in the world [7]. Today, China has become the largest country for underground space development and rail transit construction in the world. However, at present, the development and utilization of urban underground space in China presents a situation of “insufficient overall supply and aggressive development coexisting” [8]. From 2016 to 2017, subway construction in Baotou, Hohhot, Xianyang and other cities was suspended by the government. The high investment and low benefit of rail transit construction have resulted in excessive financial pressure, high leverage ratio, great debt risk and great waste of resources [9]. The reason for this problem is that the scale of rail transit development does not match the actual demand, and the pace of construction does not match the social and economic support capacity of the city. Government decision makers are also very upset about this problem. They can only issue more stringent policies to ensure the quality of rail transit development. Therefore, in 2018, the General Office of the State Council issued the “Opinions on Further Strengthening the Planning, Construction and Management of Urban Rail Transit”, which raised the indicative requirements for the adaptability of urban rail transit construction and socio-economic development. In addition, the development of rail transit involves the utilization of underground space resources. Underground space resources are considered as non-renewable and irreversible, and should be considered in planning [10,11]. Therefore, it is particularly important to control the development and construction of rail transit reasonably, so as to realize the rationalization and sustainable utilization of underground space resources [12,13]. To explore the law of coordination and balance between rail transit and social and economic factors can also provide a judgment and reference for the decision makers of rail transit construction, which is beneficial to the regional economy and high-quality development of rail transit.
The relationship between urban rail transit and socio-economic development has always been a hot topic for scholars at home and abroad. The research content mainly focuses on rail transit and population, economy, housing price, land use and so on. Bhattacharjee studied the relationship between the Denver rail transit system and surrounding land use, and believed that the change of land use is the result of a combination of rail transit, population and other factors [14]. Cervero believes that rail transit contributes to the development of regional population, commerce and economy through his research on rail transit in the United States [15]. Chang-Hee studied the relationship between rail transit and housing prices by taking the case of Line 5 in Seoul, South Korea, and found that the impact of the opening of the line on housing prices was time-bound, that is, the promotion effect on housing prices gradually weakened with the in time [16]. Jun et al. evaluated the impact of rail transit on population distribution in South Korea, and found that urban population connected with rail transit increased, while urban population far away suffered serious loss [17]. Mallikarjun et al. proposed a method to measure the performance of the rail transit system. At the same time, the relationship between public subsidy and operational performance is analyzed, and the conclusion that subsidy is inversely proportional to efficiency is drawn [18]. Grube-Cavers et al. analyzed the relationship between rapid rail transit and the middle-class population in Canadian cities, and believed that rail transit was related to the beginning of gentrification of the census areas [19]. Lee et al. analyzed the impact of light rail transit and the local real estate market, and the results showed that “UI light rail” had a significant impact on housing prices within 500 m, but not within 500 m~1 km [20]. Baker et al. compared 20 light rail communities and non-light rail communities in the United States. The study found an overall decline in discretionary income, but a positive impact on discretionary income for the light rail communities. The findings suggest that light rail communities can provide a greater affordability advantage than non-light rail communities [21]. Sekar, Yun, Meng, Tan, Pan and other scholars have completed relevant studies on the relationship between rail transit and surrounding land [22,23,24,25,26]. Han, Li et al. studied the relationship between rail transit and regional economy and found that rail transit can drive economic growth [27,28].
From the perspective of research methods, due to the detailed data of the selected research objects, the methods adopted are also different. Guo Jianmin combined a Data Envelopment Analysis (DEA) model and principal component analysis to construct an evaluation model of rail transit and economic and social development to discuss the level of rail transit construction [29]. Based on the Haken model, Shang explored the dynamic co-evolution of the “urban rail transit and economy” complex system from the perspective of time and space [30]. Liu proposed a new evaluation index system to analyze the relationship between rail transit and land use, and conducted a comprehensive analysis of the rail transit and land use system in Shanghai [31]. Xue used the grey correlation degree method to explore the coupling degree types of the Tangshan rail transit industry and social and economic development at the present stage [32]. Based on the micro simulation of passenger gathering and dispersing behavior, Li reproduced the movement characteristics of people inside the rail transit hub and the space utilization of the hubs [33]. Ji combined a principal component analysis model and comprehensive function model to calculate the development level index of transportation and economic system in the Beijing-Tianjin-Hebei region [34].
However, studies on the relationship between rail transit and the social economy are mainly limited to a certain city or line, and there are few studies on a large regional scale. The rule between rail transit and the social economy at city cluster scale remains to be revealed. So, based on synergetic theory, this paper constructs a composite system of urban rail transit and social economy. In order to evaluate the development of rail transit and the social economy in the Yangtze River Delta city cluster, this paper analyzes the coevolution law of the composite system in the Yangtze River Delta city cluster. At the same time, it makes a comparative analysis with the Beijing-Tianjin-Hebei city cluster and Pearl River Delta city cluster, analyzes their “rail transit and socio-economic development” differences and existing problems, and puts forward constructive suggestions.

2. Data and Methods

2.1. Data Sources and Data Processing

The Beijing-Tianjin-Hebei region, the Yangtze River Delta and the Pearl River Delta are China’s three core city cluster, which are the centers of social and economic development in the north, east and south of China (Figure 1). Among them, the Yangtze River Delta city cluster covers Jiangsu, Zhejiang, Anhui and Shanghai, with 41 cities in total. In 2020, the GDP of the city cluster in the Yangtze River Delta accounted for 24.3% of the national total, and the number of cities with urban rail transit and the length of operational lines accounted for 24.4% and 28.2% of the national total (excluding Hong Kong, Macao and Taiwan), ranking first among all the city clusters (Figure 2). Therefore, this paper takes the Yangtze River Delta as the main research object and selects 21 index data from 2002 to 2020 for analysis.
Before the design of the index system, this paper has extensively sorted out the relevant literature and research results [28,29,35,36,37,38]. On this basis, the urban rail transit system and socio-economic system are divided into first-level indicators and second-level indicators, making the evaluation system more hierarchical. Because there are many evaluation indexes, we selected and chose them regularly. The selection was based on the following principles:
  • Scientific principle;
  • Objectivity principle;
  • System integrity principle;
  • Operability principle;
  • Principle of universal representation.
Referring to the above principles, two first-level indicators of the rail transit system, such as the development scale of line network and operation status, are determined, and eight second-level indicators are set under the first-level indicators. There are three first-level indicators of city clusters’ social development, economic development and infrastructure status in the socio-economic system, and 13 s-level indicators are set below. Thus, the evaluation index system of urban rail transit and socio-economic development is constructed (Table 1).
The research data are mainly from the statistical yearbook of urban construction from 2002 to 2020 of the Ministry of Housing and Urban-Rural Development of the People’s Republic of China, the statistical yearbook of various provinces and cities, and the bulletin of National Economic and Social Development from 2002 to 2020. Among them, the data of 11 cities in Yangtze River Delta that have opened urban rail transit in 2020 come from the statistical and analytical report of China Urban Rail Transit Association in 2020.

2.2. Methods

2.2.1. Method Selection

At present, most researchers use coupling degree and coordination degree to measure the coupling and coordination relationship between systems. Before calculating the coupling degree and coordination degree between the urban rail transit system and the socio-economic system, it is necessary to assign weights to each index first, and then calculate the evaluation scores of the two systems, respectively. There are two methods of index weighting: subjective weighting and objective weighting. Subjective weighting methods include the Delphi method, analytic hierarchy process, etc., which mainly rely on subjective experience judgment. Objective weight assignment methods include principal component analysis, multi-objective programming, entropy weight method and so on. These methods mainly rely on the correlation between sample data for analysis, which is objective and accurate.
The analysis in this paper has the following characteristics:
  • There are many evaluation indexes involved and the calculation is complicated;
  • Evaluation indexes should avoid subjective qualitative judgment as far as possible, and need to objectively quantify the data;
  • Indicators are not completely independent.
Therefore, referring to the above three characteristics, objective weighting should be considered in the selection of methods. At the same time, it is necessary to ensure that the original data information is lost as little as possible, and easy to calculate. Principal component analysis, as an objective weighting method, can meet the above three requirements. Therefore, it is reasonable to use it to deal with the weight assignment of indicators.

2.2.2. Principal Component Analysis (PCA)

The basic idea of principal component analysis is dimensionality reduction. By means of orthogonal transformation, multiple variables that may be related in the original sample are transformed into a group of variables that are unrelated to each other. At the same time, several comprehensive variables are extracted according to actual needs to reflect the information from the variables in the original sample, which can simplify complex research and improve efficiency on the premise of ensuring accuracy. PCA is mainly applicable to a large amount of data, data redundancy or data that are not independent and may be correlated. It is not suitable for situations where data are independent or where there are requirements on the dimensional level of the data. The specific calculation steps are as follows:
(1) Before principal component analysis, it is necessary to test the applicability of the sample data. The KMO test and Bartlett’s sphericity test are used to determine partial correlations and correlations between variables. PCA is suitable when the following conditions are met:
KMO test: quantity of KMO sampling suitability > 0.7
Bartlett’s sphericity test: Sig < 0.05
(2) Since the original data involve multiple dimensions and the units are inconsistent, the original data should be standardized (Z-Score), and the correlation coefficient matrix R should be calculated to judge the correlation between variables:
R   =   ( r i j ) m × m
(3) The eigenvalue λ i and corresponding eigenvector a i of the correlation coefficient matrix R are calculated:
a i   =   ( a 1 i , a 2 i , , a m i ) T ( i   =   1 , 2 , , m )
(4) Principal components F i ( i = 1 , 2 , , m ) are calculated, and the top p principal components are extracted according to the cumulative variance contribution rate G ( p ) . It is generally believed that when G ( p ) 80 % , the obtained components can represent the data information in the original sample:
F i   =   a 1 i x 1 + a 2 i x 2 + + a p i x m G ( p )   =   ( i = 1 p λ i n = 1 m λ n ) ,   p     m
(5) The linear combination of principal components is calculated:
S   =   ( λ 1 k = 1 p λ k ) F 1 + + ( λ p k = 1 p λ k ) F m
In the formula, m is the number of evaluation indexes and F i is the evaluation score of each principal component.

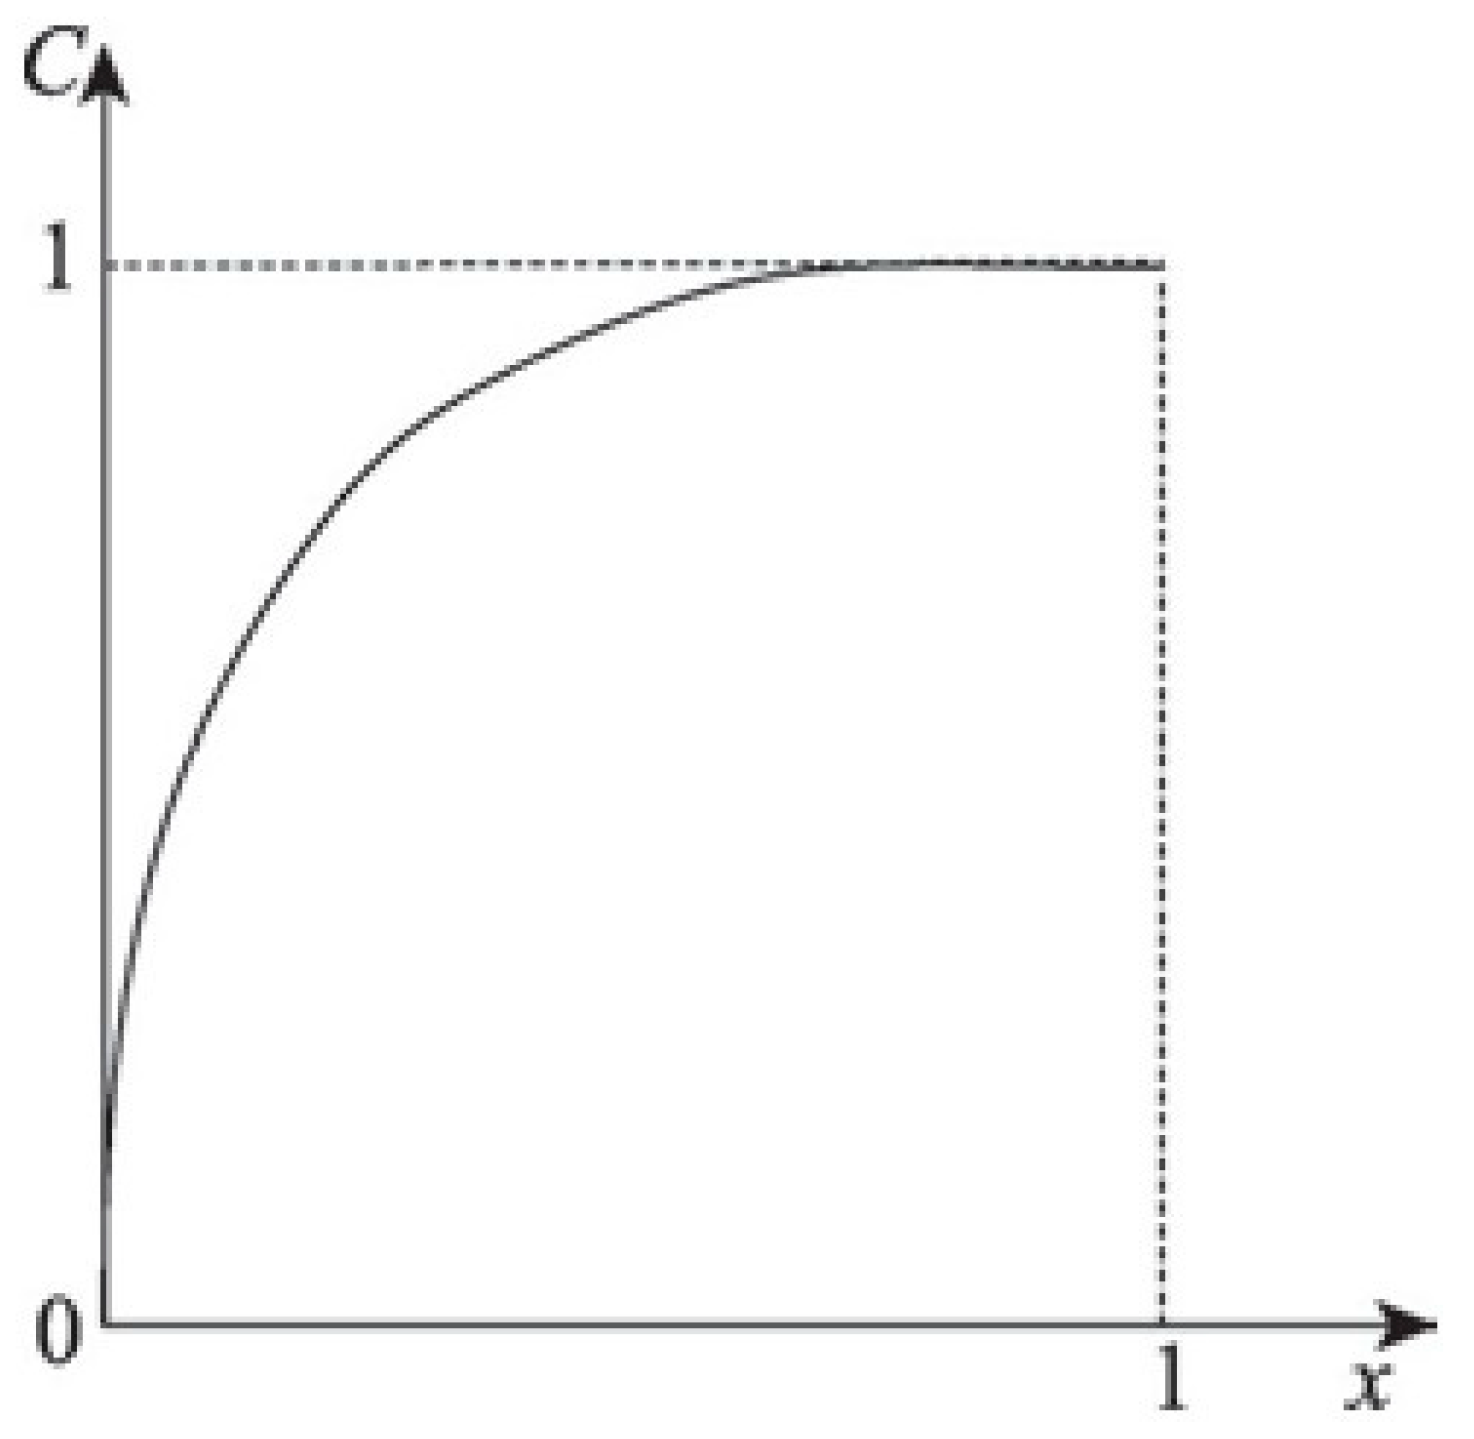
2.2.3. Coupling Coordination Theory Model

Coupling refers to the phenomenon that two or more systems affect each other to achieve synergy through interaction. The urban rail transit system and socio-economic system interact and influence each other. Therefore, on the basis of reference to relevant literature, the traditional coupling degree model of urban rail transit system and socio-economic system is constructed as follows:
C   =   i = 1 n X i ( 1 n i = 1 n X i ) n n
where, n is the number of subsystems, n = 2 in this paper; X i is the value of each subsystem, and its distribution interval is [0, 1], so the coupling degree C value interval is [0, 1]. There are only two subsystems involved in this paper. Therefore, n = 2 can simplify the traditional model function as:
C   =   2 x x + 1   =   2 x + 1 x ,      x   =   min ( X 1 , X 2 ) max ( X 1 , X 2 ) ,      x ( 0 , 1 ]
As can be seen from Figure 3, the distribution of coupling degree C value in its range [0, 1] is not equal, and the probability range tends to one end of extreme value 1. This means that the uneven distribution of C values in the traditional calculation model of coupling degree will have a great impact on the evaluation results. In addition, in the use of traditional models people have different classification standards for coupling levels, leading to problems in the use validity of C. Therefore, referring to relevant scholars [39,40], the original calculation formula of coupling degree is revised as follows:
C   =   [ 1 i > j , j = 1 n ( X i X j ) 2 λ = 1 n λ ]   ×   ( i = 1 n X i max X i ) n 1
In the formula, X i [ 0 ,   1 ] , C [ 0 ,   1 ] . When the subsystems are more discrete, the C value is lower and conversely, the higher C is. Compared with the original traditional model, the distribution of the C value is as scattered as possible in [0, 1], and the C value distinction is more obvious, which is more suitable for the study of the two systems in this paper and has a higher efficiency.
Considering that coupling degree C cannot effectively evaluate the coordination degree of the two systems, it is necessary to introduce coupling coordination degree D to construct the coordination model as follows:
D   =   C × T T   =   α υ 1   +   β υ 2
where, D is the coupling coordination degree (coordination degree), T is the comprehensive evaluation index of the two systems, α and β are the undetermined coefficient. In this paper, it is considered that rail transit and the social economy are equally important in this evaluation system, so α = β = 0.5 , C , D [0, 1]. The specific classification standards of coupling and coordination states are shown in Table 2.

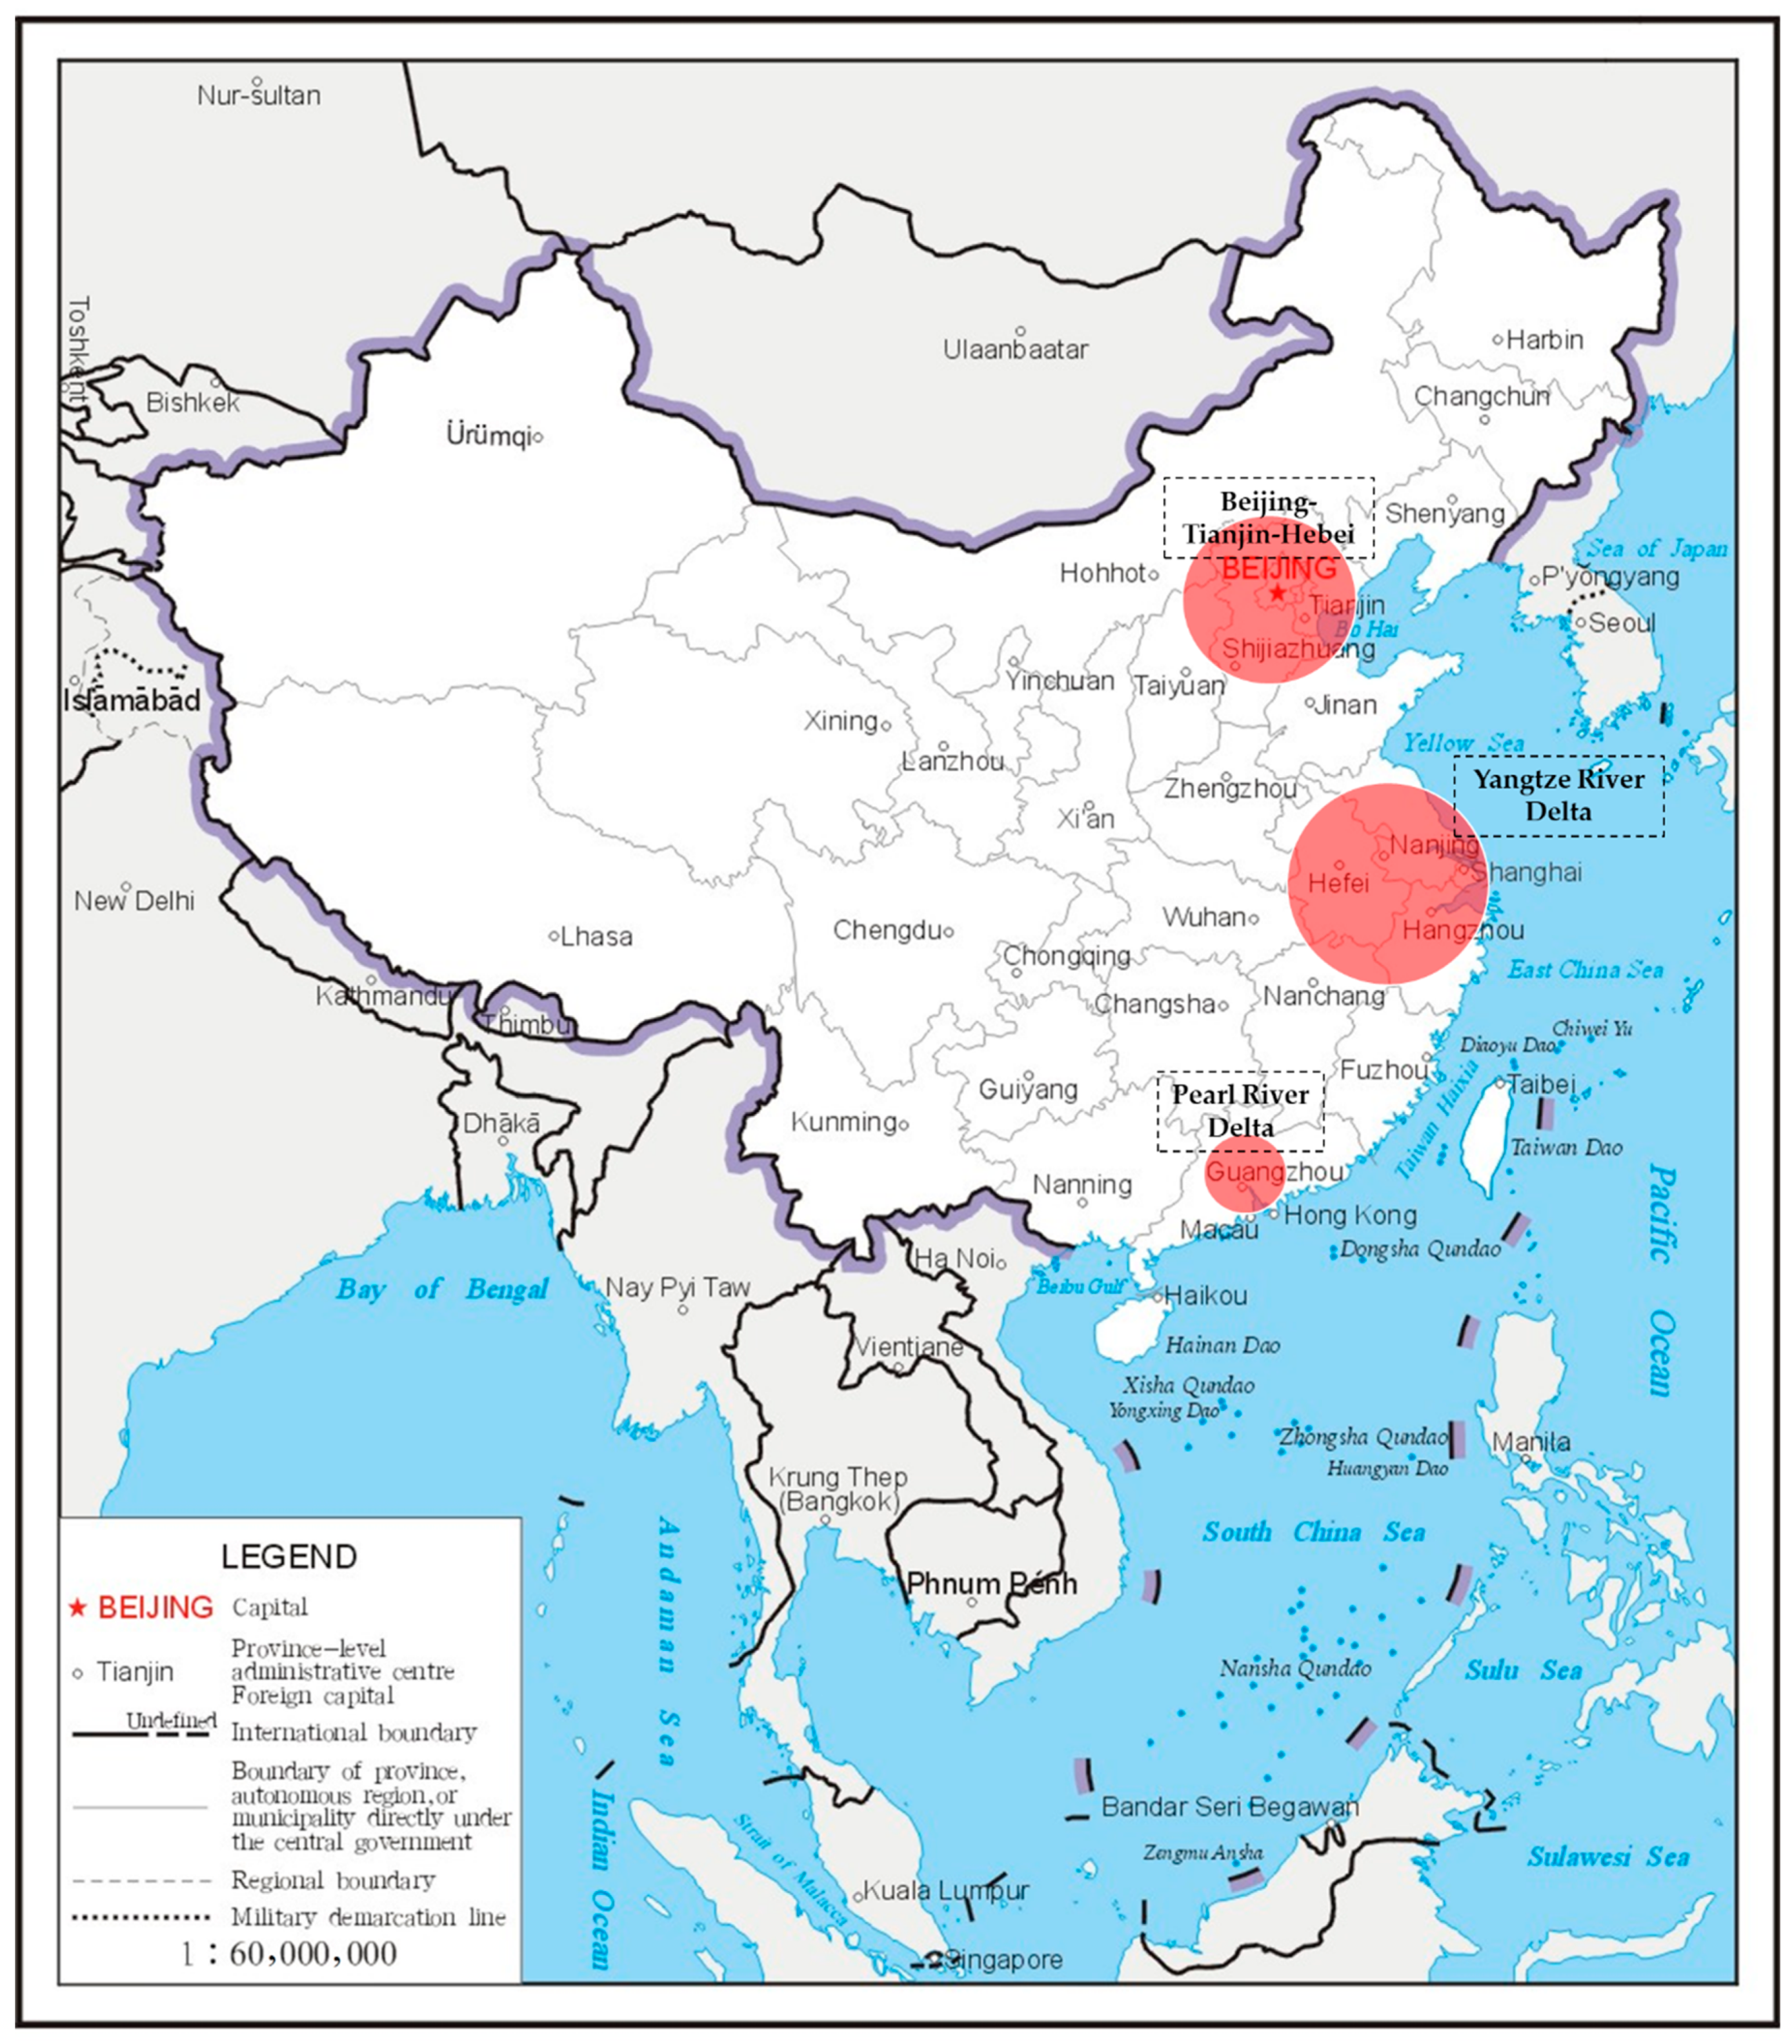
3. Coupling Coordination Analysis of City Cluster in Yangtze River Delta

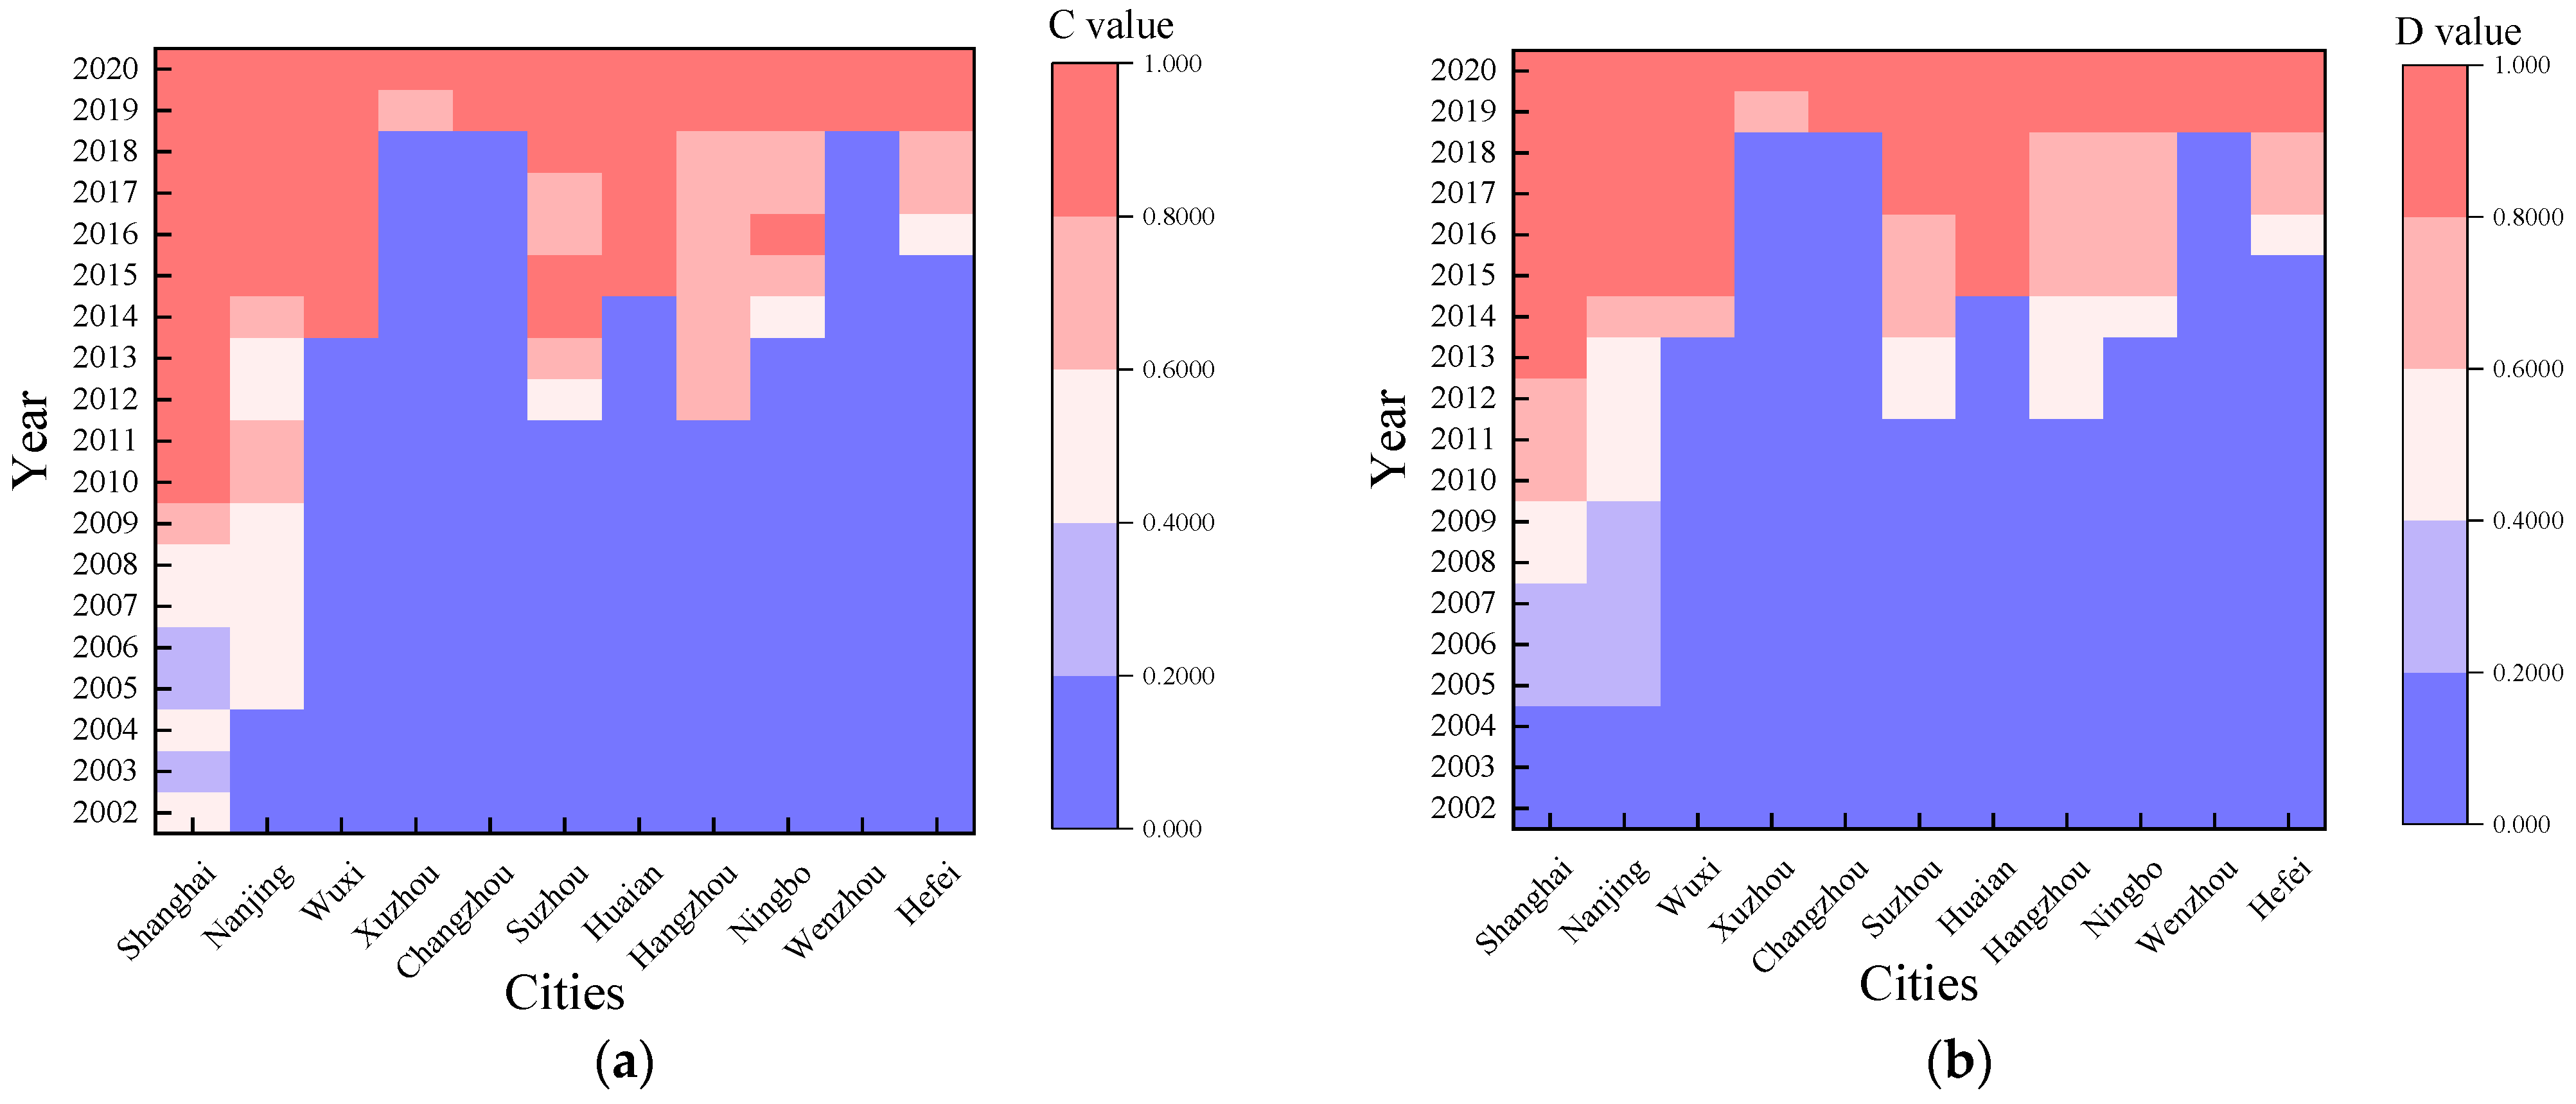
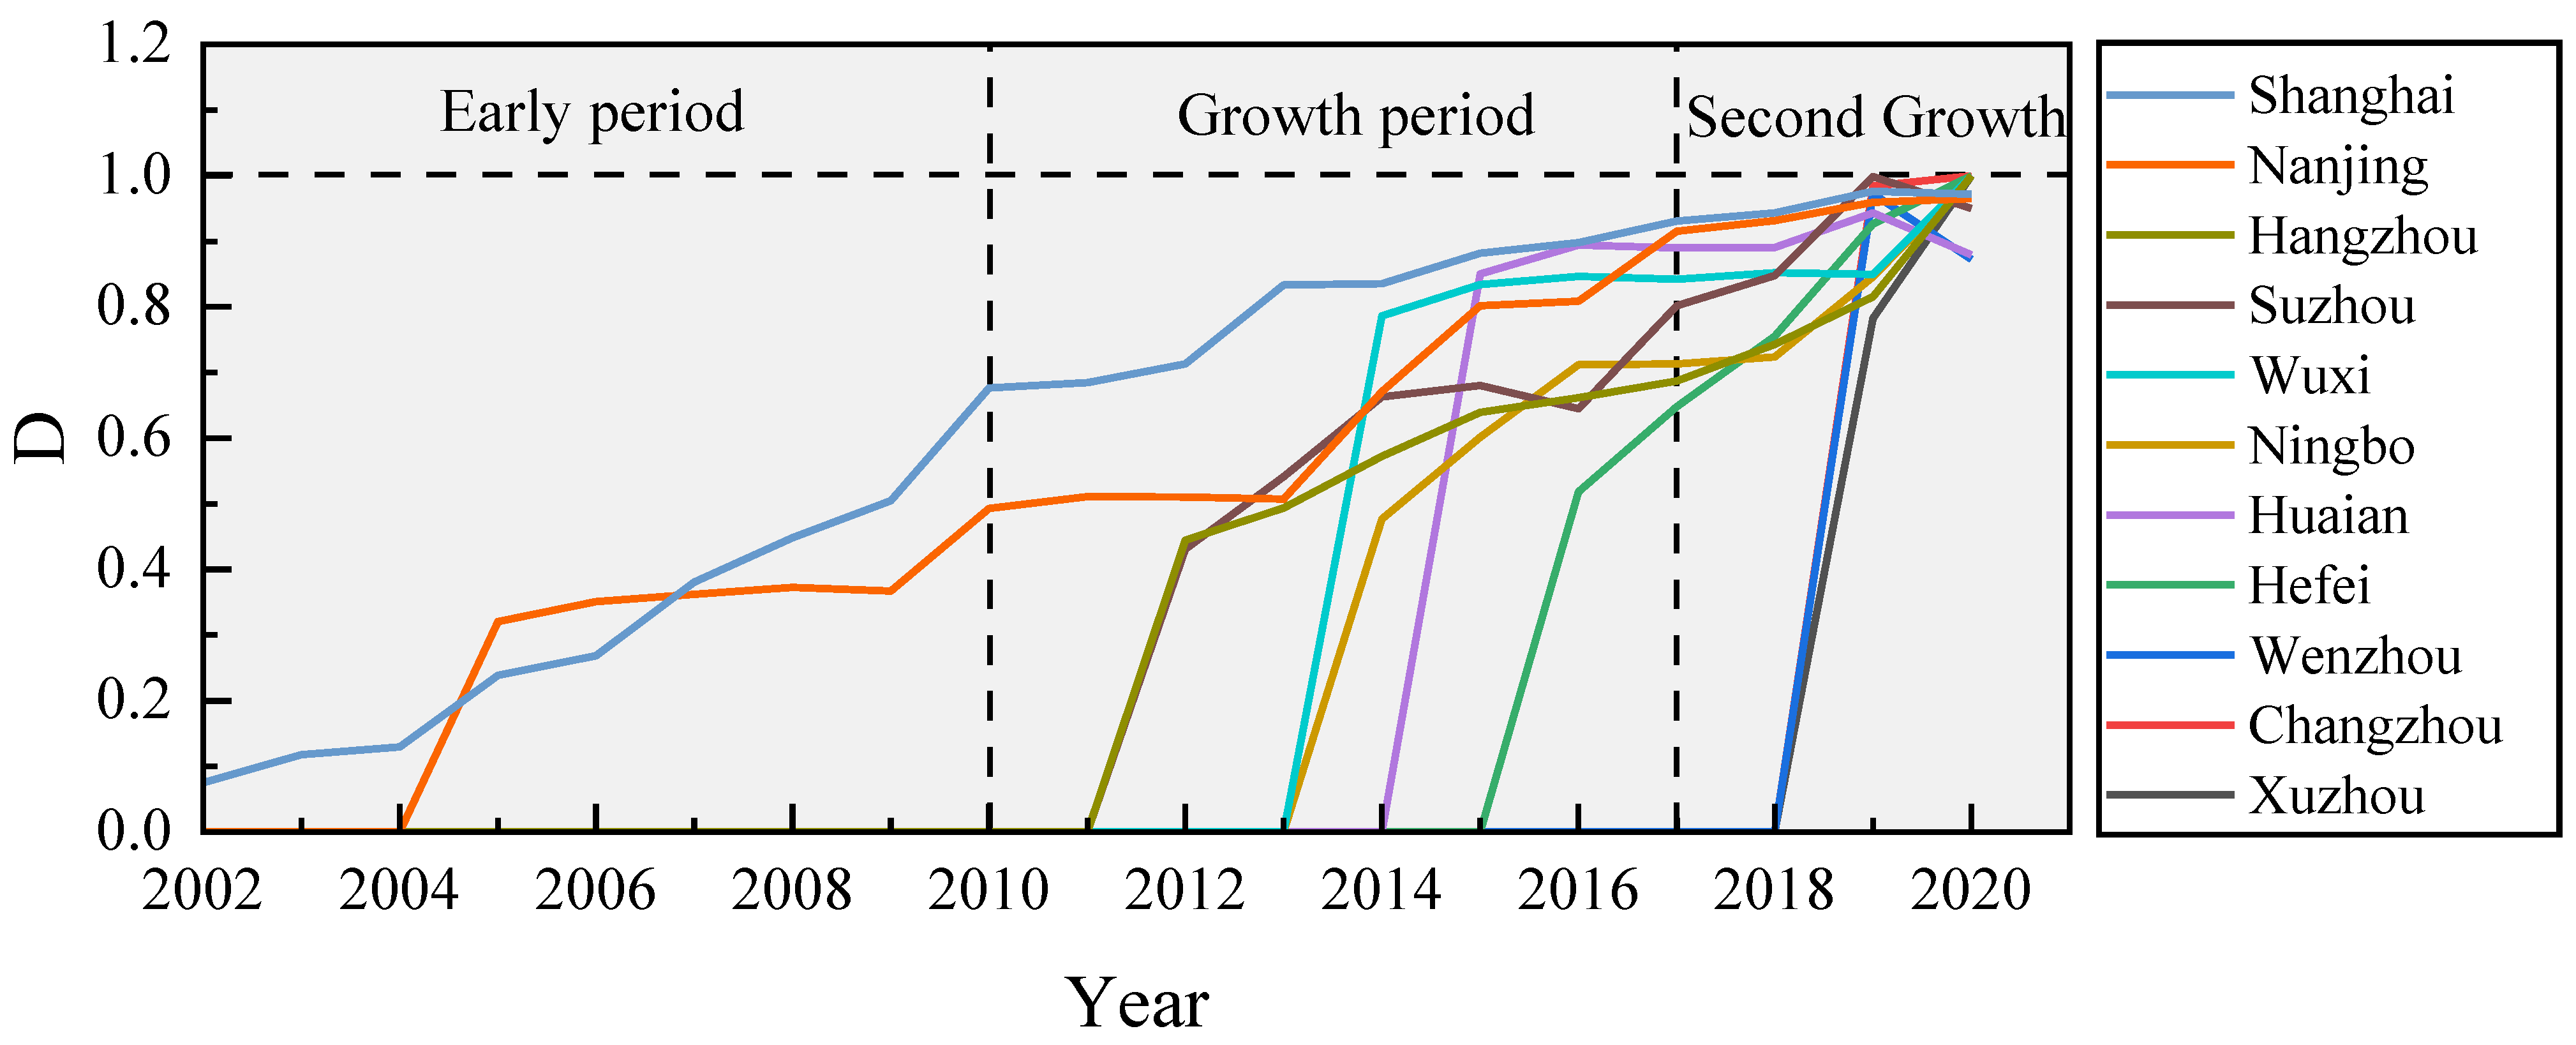
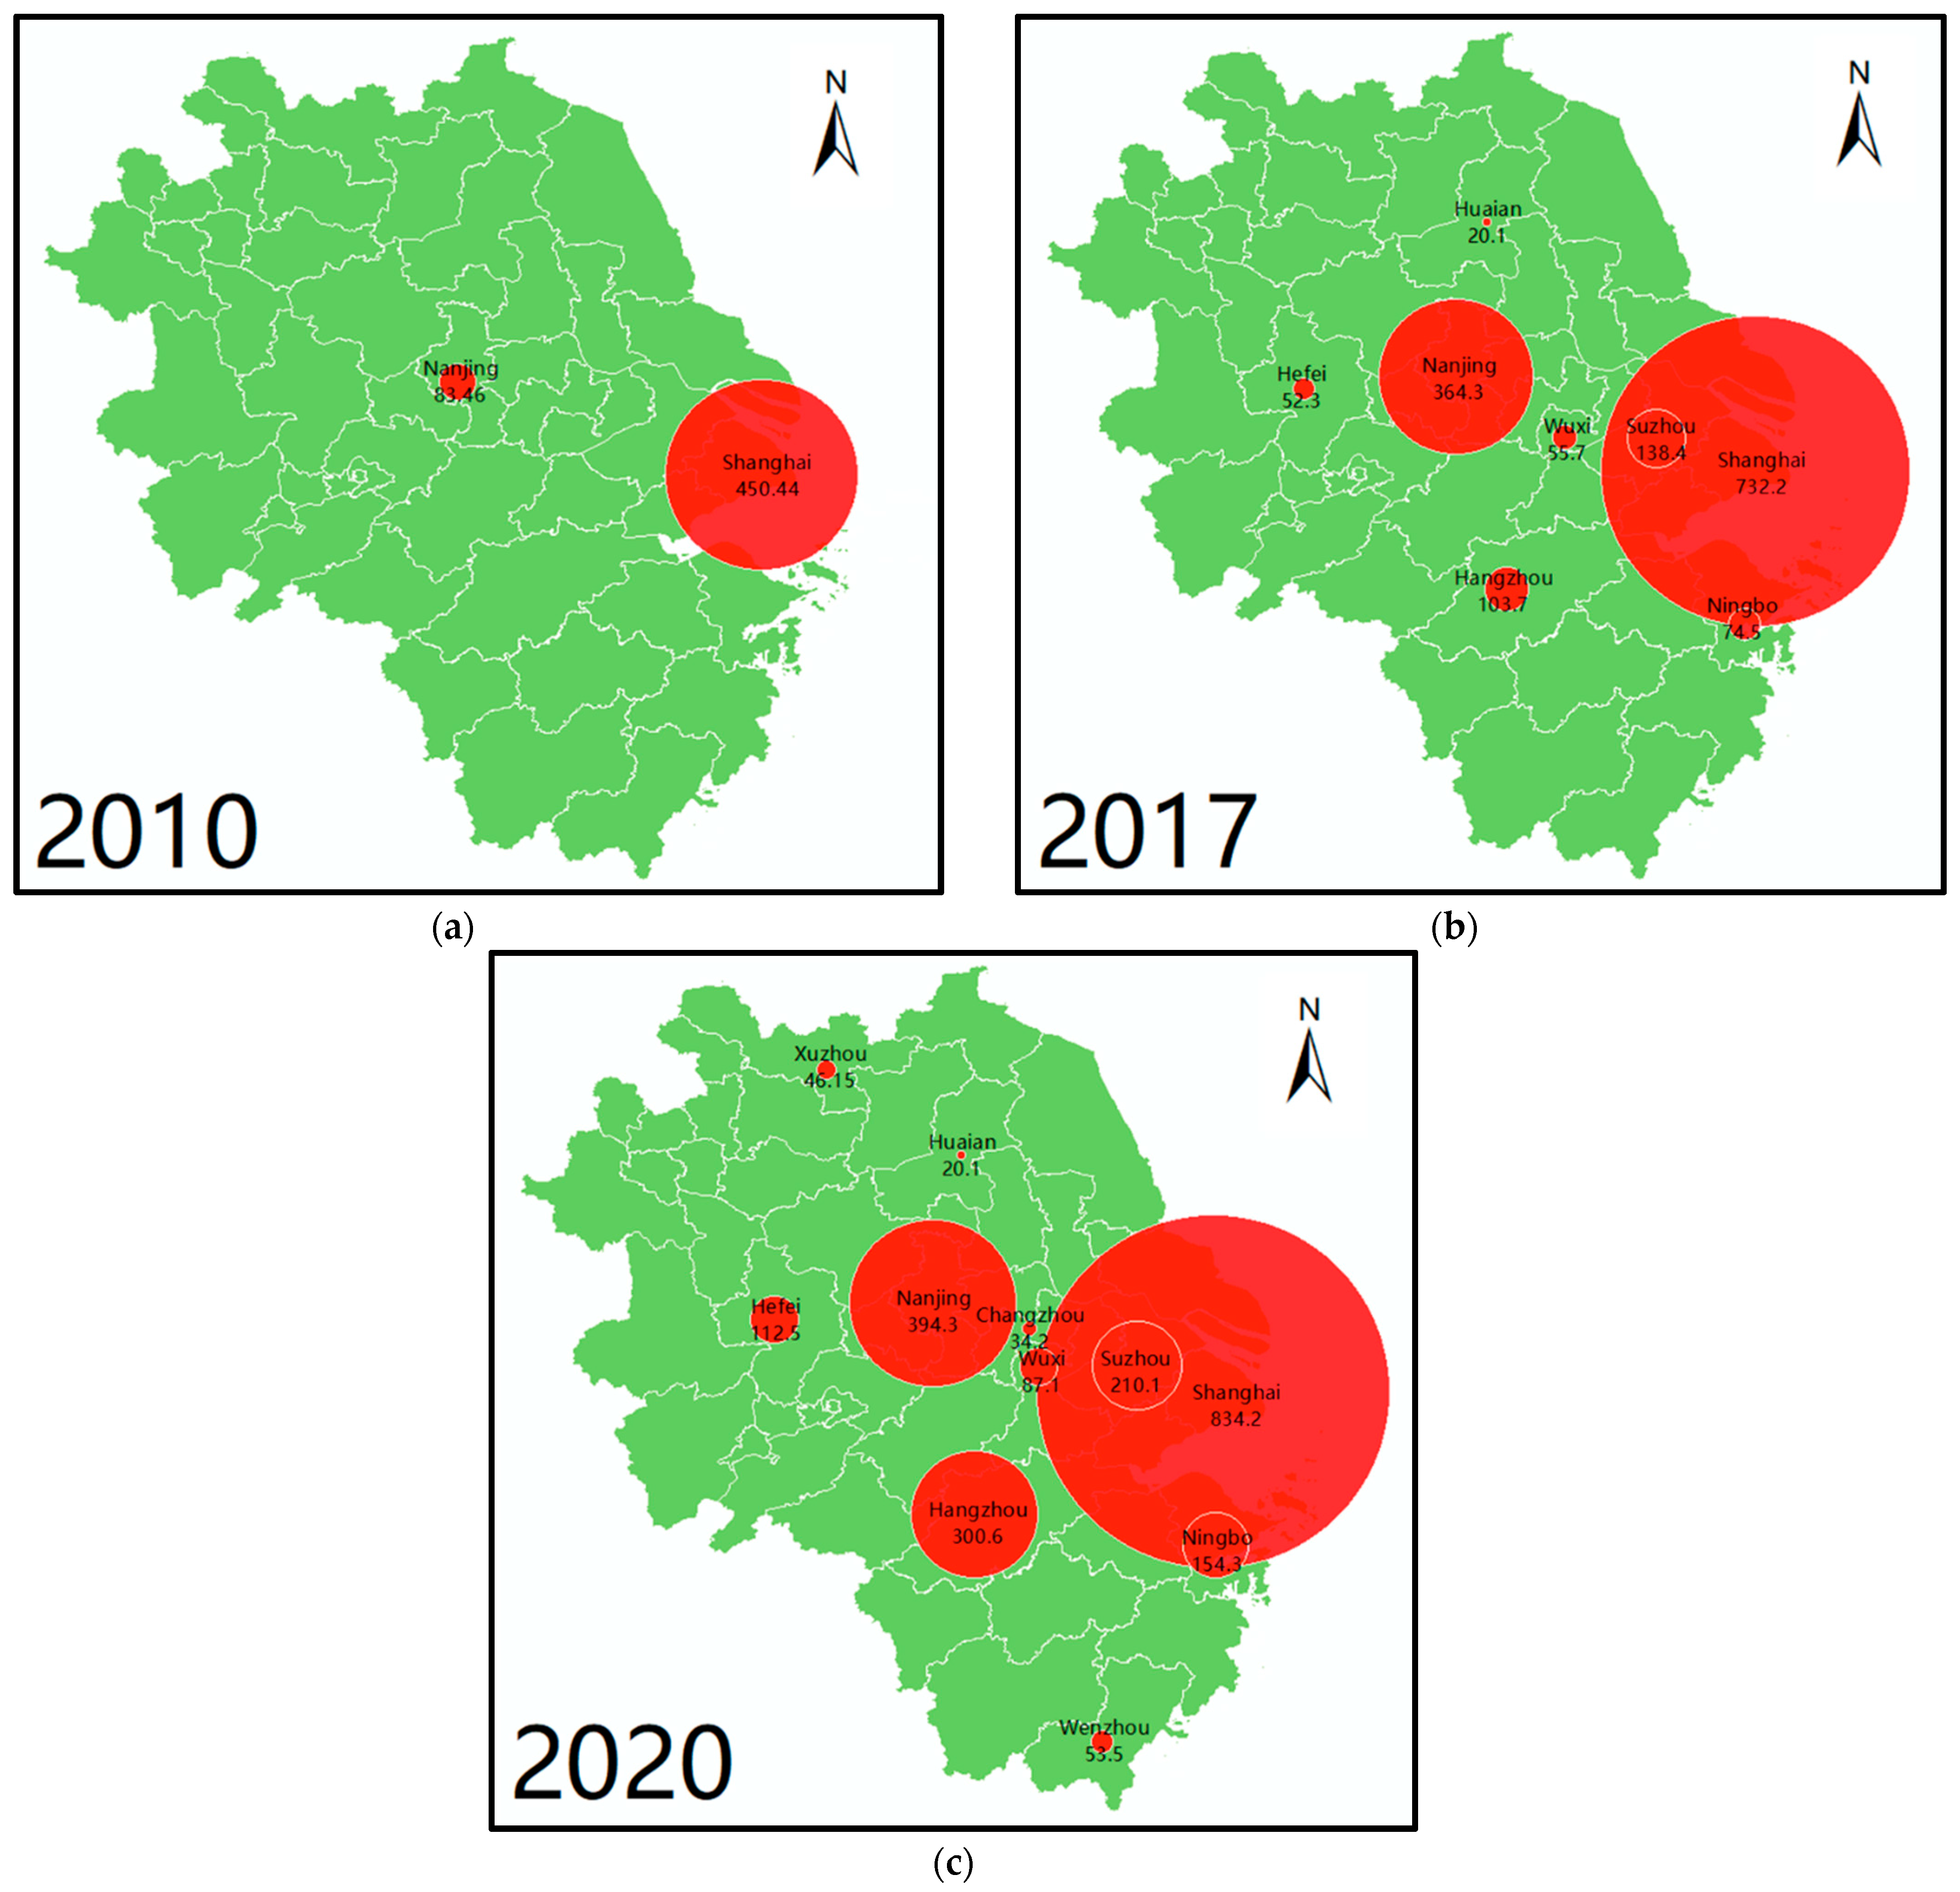
3.1. The Coordinated Development Level of Rail Transit and Socio-Economy System in 11 Cities of Yangtze River Delta

By the end of 2020, 11 cities in the Yangtze River Delta urban agglomeration have opened rail transit, namely Shanghai, Nanjing, Wuxi, Changzhou, Suzhou, Huai’an, Hangzhou, Ningbo, Wenzhou and Hefei. By substituting the relevant data of these cities into the coupling coordination model of principal component analysis (refer to Section 2.2 Method for detailed steps), the coupling coordination development level of rail transit and social economy of 11 cities from 2002 to 2020 is obtained. The specific analysis is shown in Figure 4, Figure 5 and Figure 6.
As can be seen from Figure 4, in the past nearly 20 years, the rail transit and social economy of most cities in the Yangtze River Delta (except Shanghai and Nanjing) have been at a narrow coupling level for a long time, with serious coordination imbalance. In other words, the interaction between rail transit and social economy is weak and there is basically no synergistic effect. In the last ten years, with the rapid development of the social economy, rail transit has also been built on a large scale. They promote each other and gradually improve their coupling. Rail transit and social economic systems also step onto the track of coordinated development.
Figure 5 and Figure 6 show that, by the end of 2020, the coordinated development of the rail transit and social economy in 11 cities of Yangtze River Delta can be divided into three stages.
Early period (2002–2010): At the beginning of this stage, Shanghai, as the national central city, became the first and only city in the region to open rail transit. After that, it gradually developed into a double-core pattern with Shanghai and Nanjing (capital of Jiangsu Province) as the core, while other cities were in the planning or construction period. Driven by Nanjing and Shanghai, the rail transit system and the social economic system of the Yangtze River Delta city cluster show a state of “low coupling and coordination disorder”;
Growth period (2011–2017): During this period, a multi-city high-speed development pattern was formed with Shanghai-Nanjing and Hangzhou as the leading cities, and the coordinated development of the rail transit system and social economy was greatly improved. Following the policy in 2010 that the Yangtze River Delta is defined as Jiangsu, Zhejiang and Shanghai, Hangzhou, as the capital of the Zhejiang Province, has become another growth pole of rail transit in the Yangtze River Delta. During this period, “Shanghai-Nanjing-Hangzhou” formed a tripartite coalition. At the same time, as the development engine of their respective provinces, it drove the rapid development of rail transit in Suzhou-Wuxi-Changzhou, Ningbo and other second-tier cities in the province with strong social economies. In addition, at the end of this period (2014), Hefei had also defined its strategic positioning and participated in the integrated development process of the Yangtze River Delta;
Second Growth Period (2018-present): After seven years of rapid development, the rail transit development of urban agglomeration in Yangtze River Delta has entered the second growth period. In this period, Xuzhou, Changzhou, Wenzhou and other second-tier cities were the main growth points, and the regional integration of the Yangtze River Delta formally entered the era of “Jiangsu, Zhejiang, Shanghai and Anhui”. In the Yangtze River Delta, the rail transit-socio-economic systems of the cities with rail transit have stepped into a state of coordinated development. According to this development expectation, rail transit in third-tier cities will also develop when the social economy reaches a certain level in the future.
From the analysis of the development of the above three periods, it can be found that the rail transit development of the Yangtze River Delta urban agglomeration shows the law of “step by step” development. That is, “national central city, provincial capital city, second-tier city, third-tier city, etc.”. Its coupling and coordination are gradually improved and optimized. In addition, we also found that rail transit construction in the Yangtze River Delta also exists as unbalanced development. Compared with Jiangsu, Zhejiang and Shanghai, Anhui province started late and developed backwards. The main reason for this phenomenon is that the construction of rail transit in Anhui province is limited by its economic level. Anhui’s socio-economic conditions are always inferior to those of the other three regions.

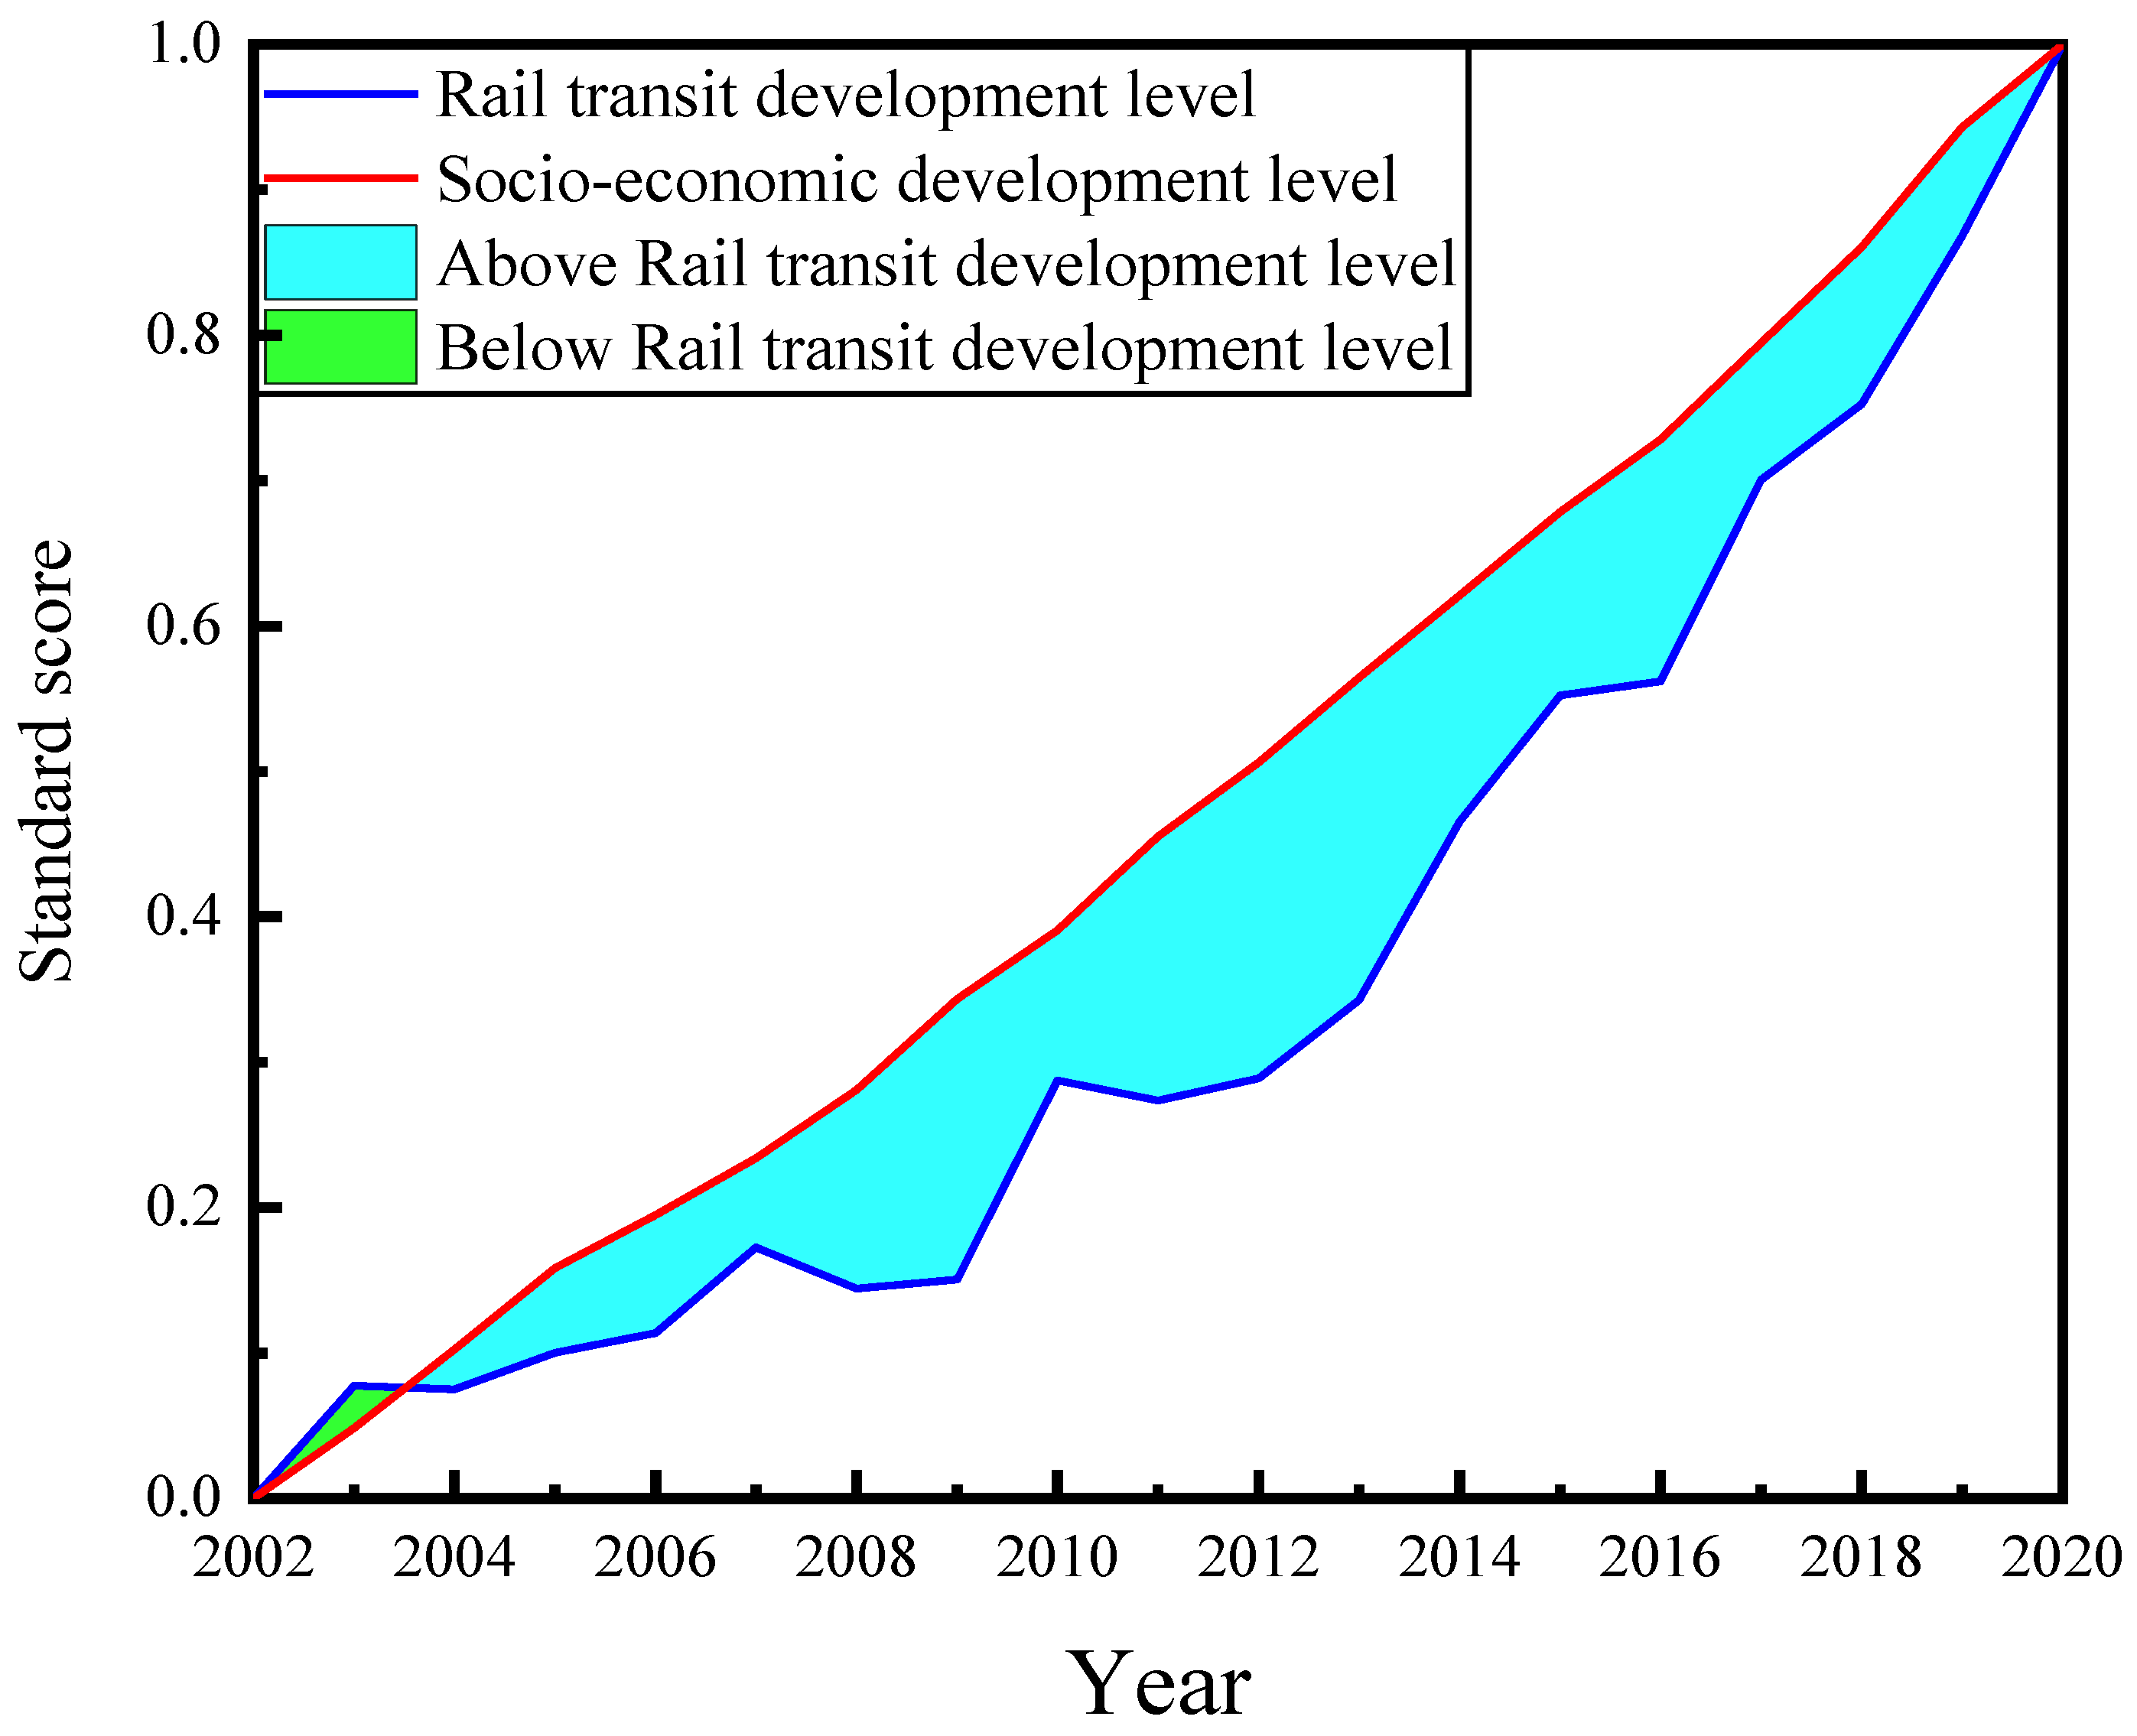
3.2. The Coordinated Development Level of Rail Transit and Social Economy System in the Yangtze River Delta City Cluster

It is considered that the social and economic development of rail transit in 11 cities of the Yangtze River Delta has certain differences and cannot represent the overall development status of the city cluster, and some inner regulation cannot be obtained quantitatively. Therefore, 41 cities in the Yangtze River Delta are considered as a whole, and the coupling and coordination development level of rail transit and the social economy in the Yangtze River Delta city cluster from 2002 to 2020 is obtained by substituting the coupling and coordination model of principal component analysis. The specific results and data are shown in Table A1 of Appendix A, and the analysis is shown in Figure 7 and Figure 8.
It can be seen from Figure 7 that the city cluster in the Yangtze River Delta has been in a long-term situation where the social and economic development has been ahead of the rail transit construction. In other words, for a long period of time, the construction scale of rail transit in the Yangtze River Delta urban agglomeration cannot meet the demand of passenger flow in the same period of time, and the traffic congestion problem is very serious. The development speed of urban rail transit is slower than the rapid development of urbanization, which also restricts the development of cities to a certain extent. Although the economic development lagged briefly from 2002 to 2004, within the acceptable error range, it can be considered that the construction of rail transit and socio-economic development in the early stage are both low level and have a certain instability. The development of rail transit in this period was in an advanced state, which may be related to the government’s sudden increase in the construction of urban rail transit. The investment in urban rail transit in that year was more than three times that of the previous year, the highest growth rate of investment. After 2017, the rail transit construction and socio-economic development of the Yangtze River Delta city cluster basically maintained a coordinated state of development, reflecting that the rail transit construction and transportation capacity at this stage can basically meet the development and passenger transport needs of the city cluster.
According to the coupling degree evaluation index in Figure 8, the development of the “rail transit-social economy” system in the Yangtze River Delta city cluster can be divided into three stages:
Stage I (2002–2009): The coupling degree fluctuated greatly, dropping from 0.9996 to 0.5945. The coupling type experienced high coupling; good coupling dropped to the middle coupling stage. At this stage, the rail transit construction is at a low level and the construction pace is slow, while the socio-economic development shows a trend of rapid growth. Therefore, the coupling state of this stage is very unstable;
Stage II (2009–2014): In this stage, the coupling degree increased from 0.5945 to 0.7955, and the coupling type changed from moderate to good. During these five years, the intensity of rail transit construction has gradually increased, and its socio-economic coupling has gradually improved, showing a trend of fluctuating growth;
Stage III (2014–2020): The coupling degree increases rapidly, and the coupling type rises from good to high coupling stage. In the middle of this period, the coupling decreased slightly, but gradually recovered to a stable growth. This may be due to the large-scale fast pace of rail transit construction in this stage, resulting in a temporary decline in the coupling between rail transit and the social economy. Combined with the coupling and coordination of this period, it can be seen that the high coupling of stage III is inseparable from the coordinated development of rail transit construction and its socio-economic development.
According to the evaluation index of coupling coordination degree in Figure 8, the overall development trend of the “rail transport-social economy” system in the Urban agglomeration of the Yangtze River Delta shows a transition from “maladjustment” to “coordination”. Among them, after 2009, with the acceleration of rail transit construction, the “rail transport-social economy” system also entered the state of coordinated development.

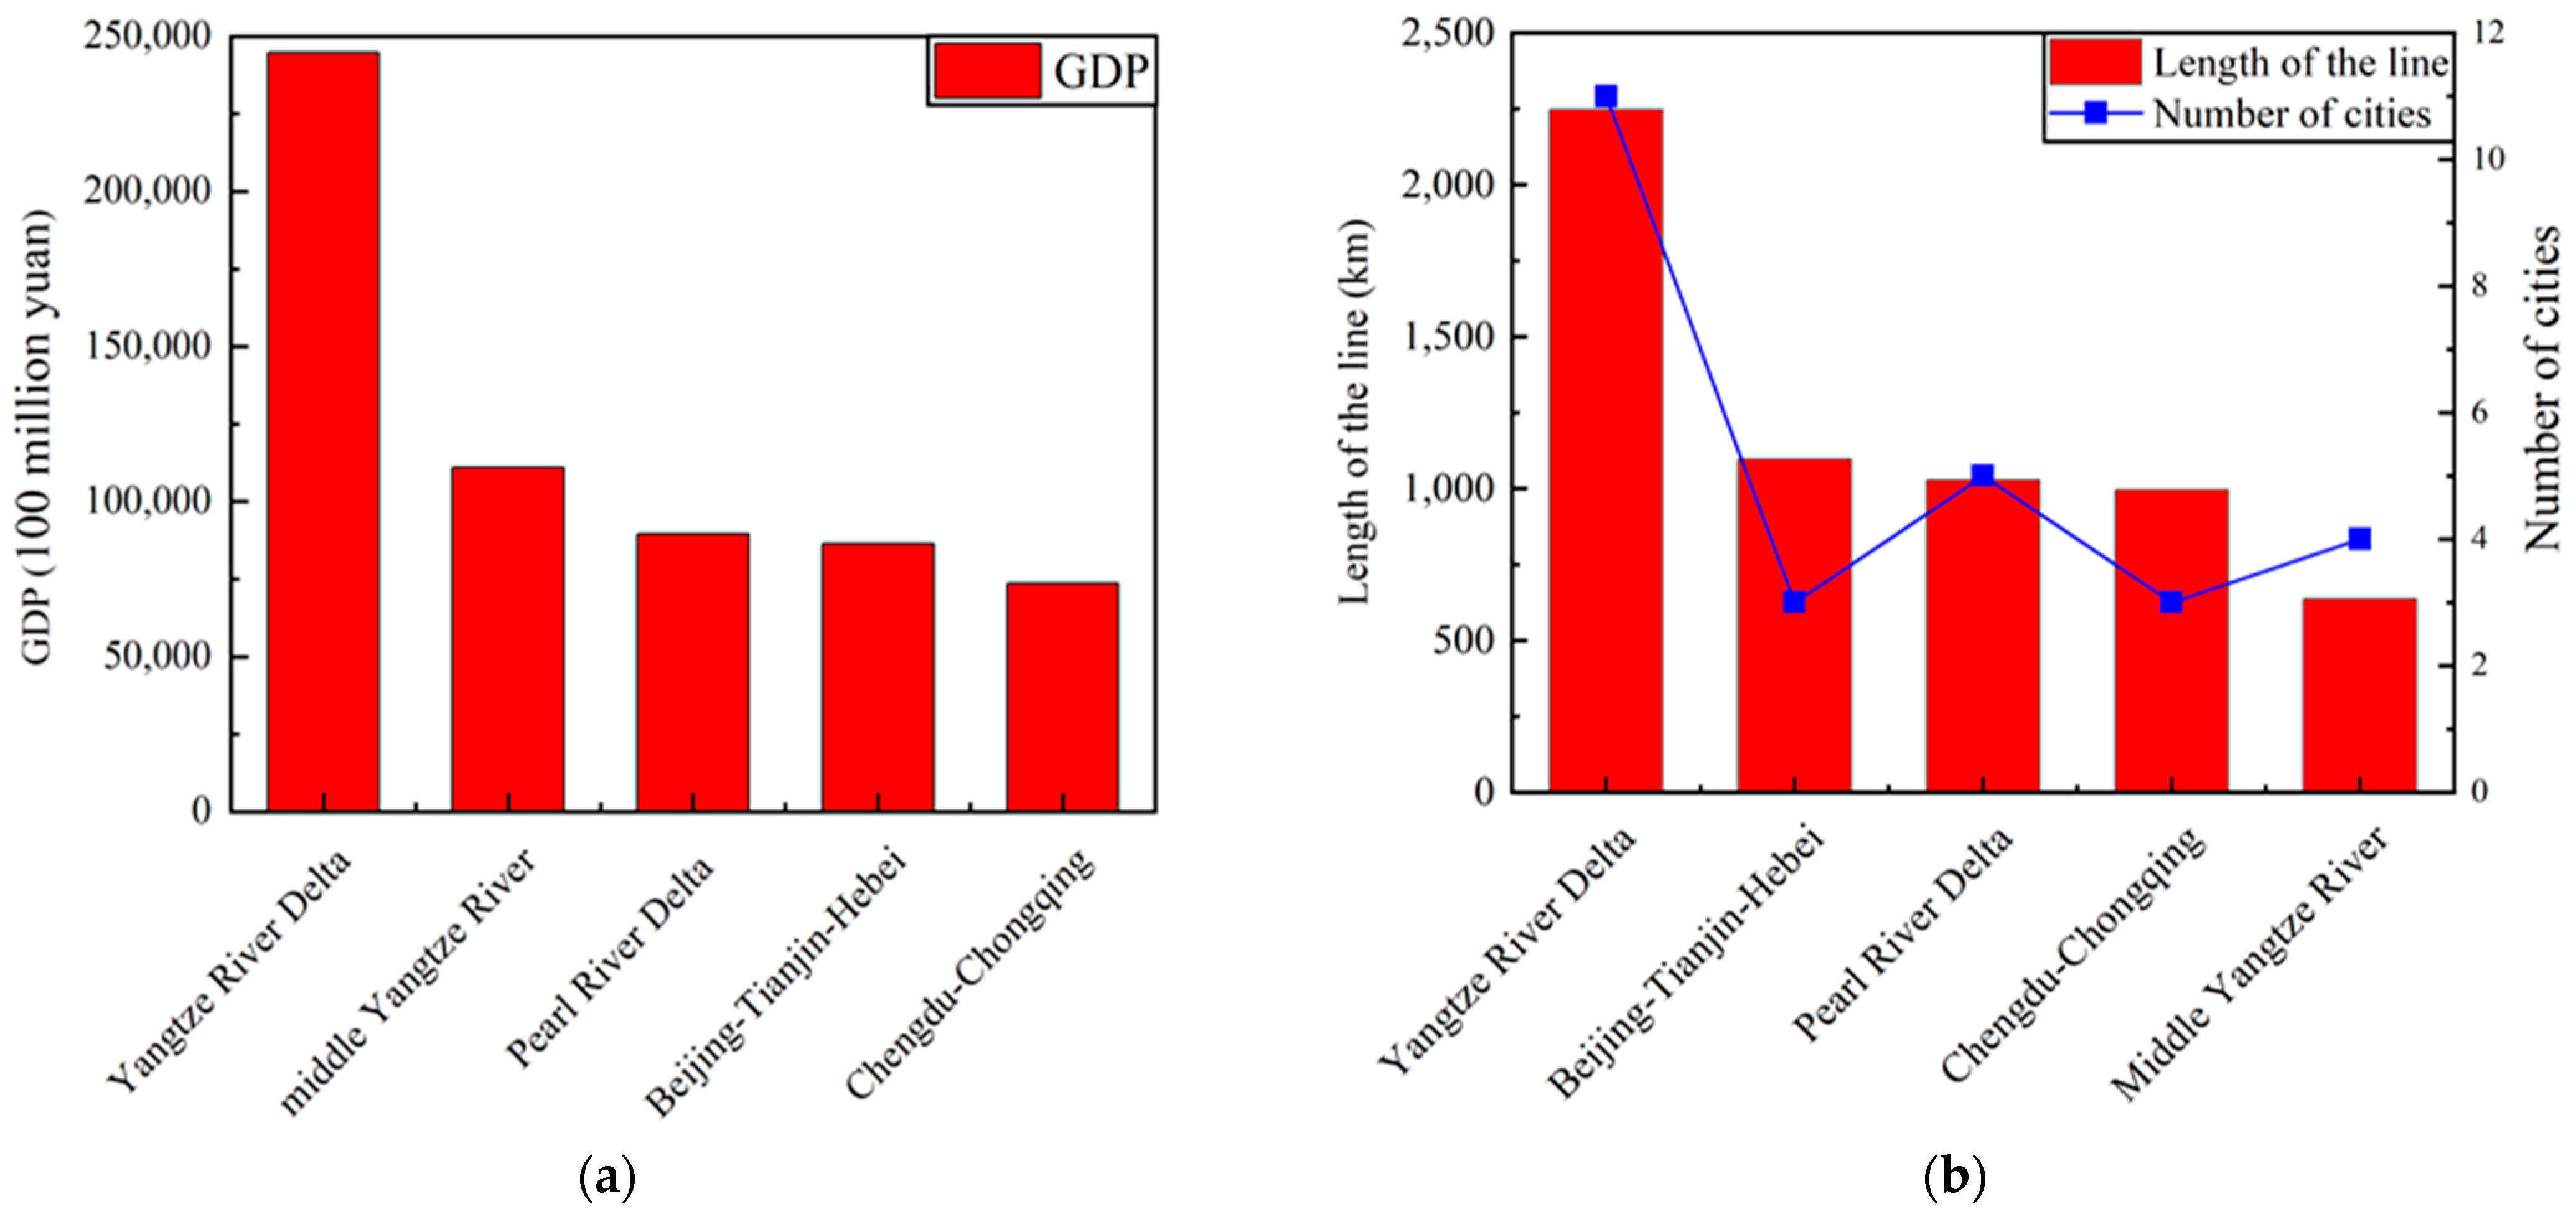
4. The Development Level of “Rail Transport-Social Economy” System in Different City Clusters

The Beijing-Tianjin-Hebei, Yangtze River Delta and Pearl River Delta city clusters represent the highest level of economic, social and urban development in the north, east and south of China, respectively, and are also the main growth areas of rail transit lines. Compared with single urban agglomerations, the comparative analysis between different city clusters is more objective and universal. Therefore, further correlation analysis is made on the relationship between rail transit and the social and economic development of the three city clusters. The specific results and data are shown in Table A1, Table A2 and Table A3 of Appendix A, and the analysis is shown in Figure 9 and Figure 10.

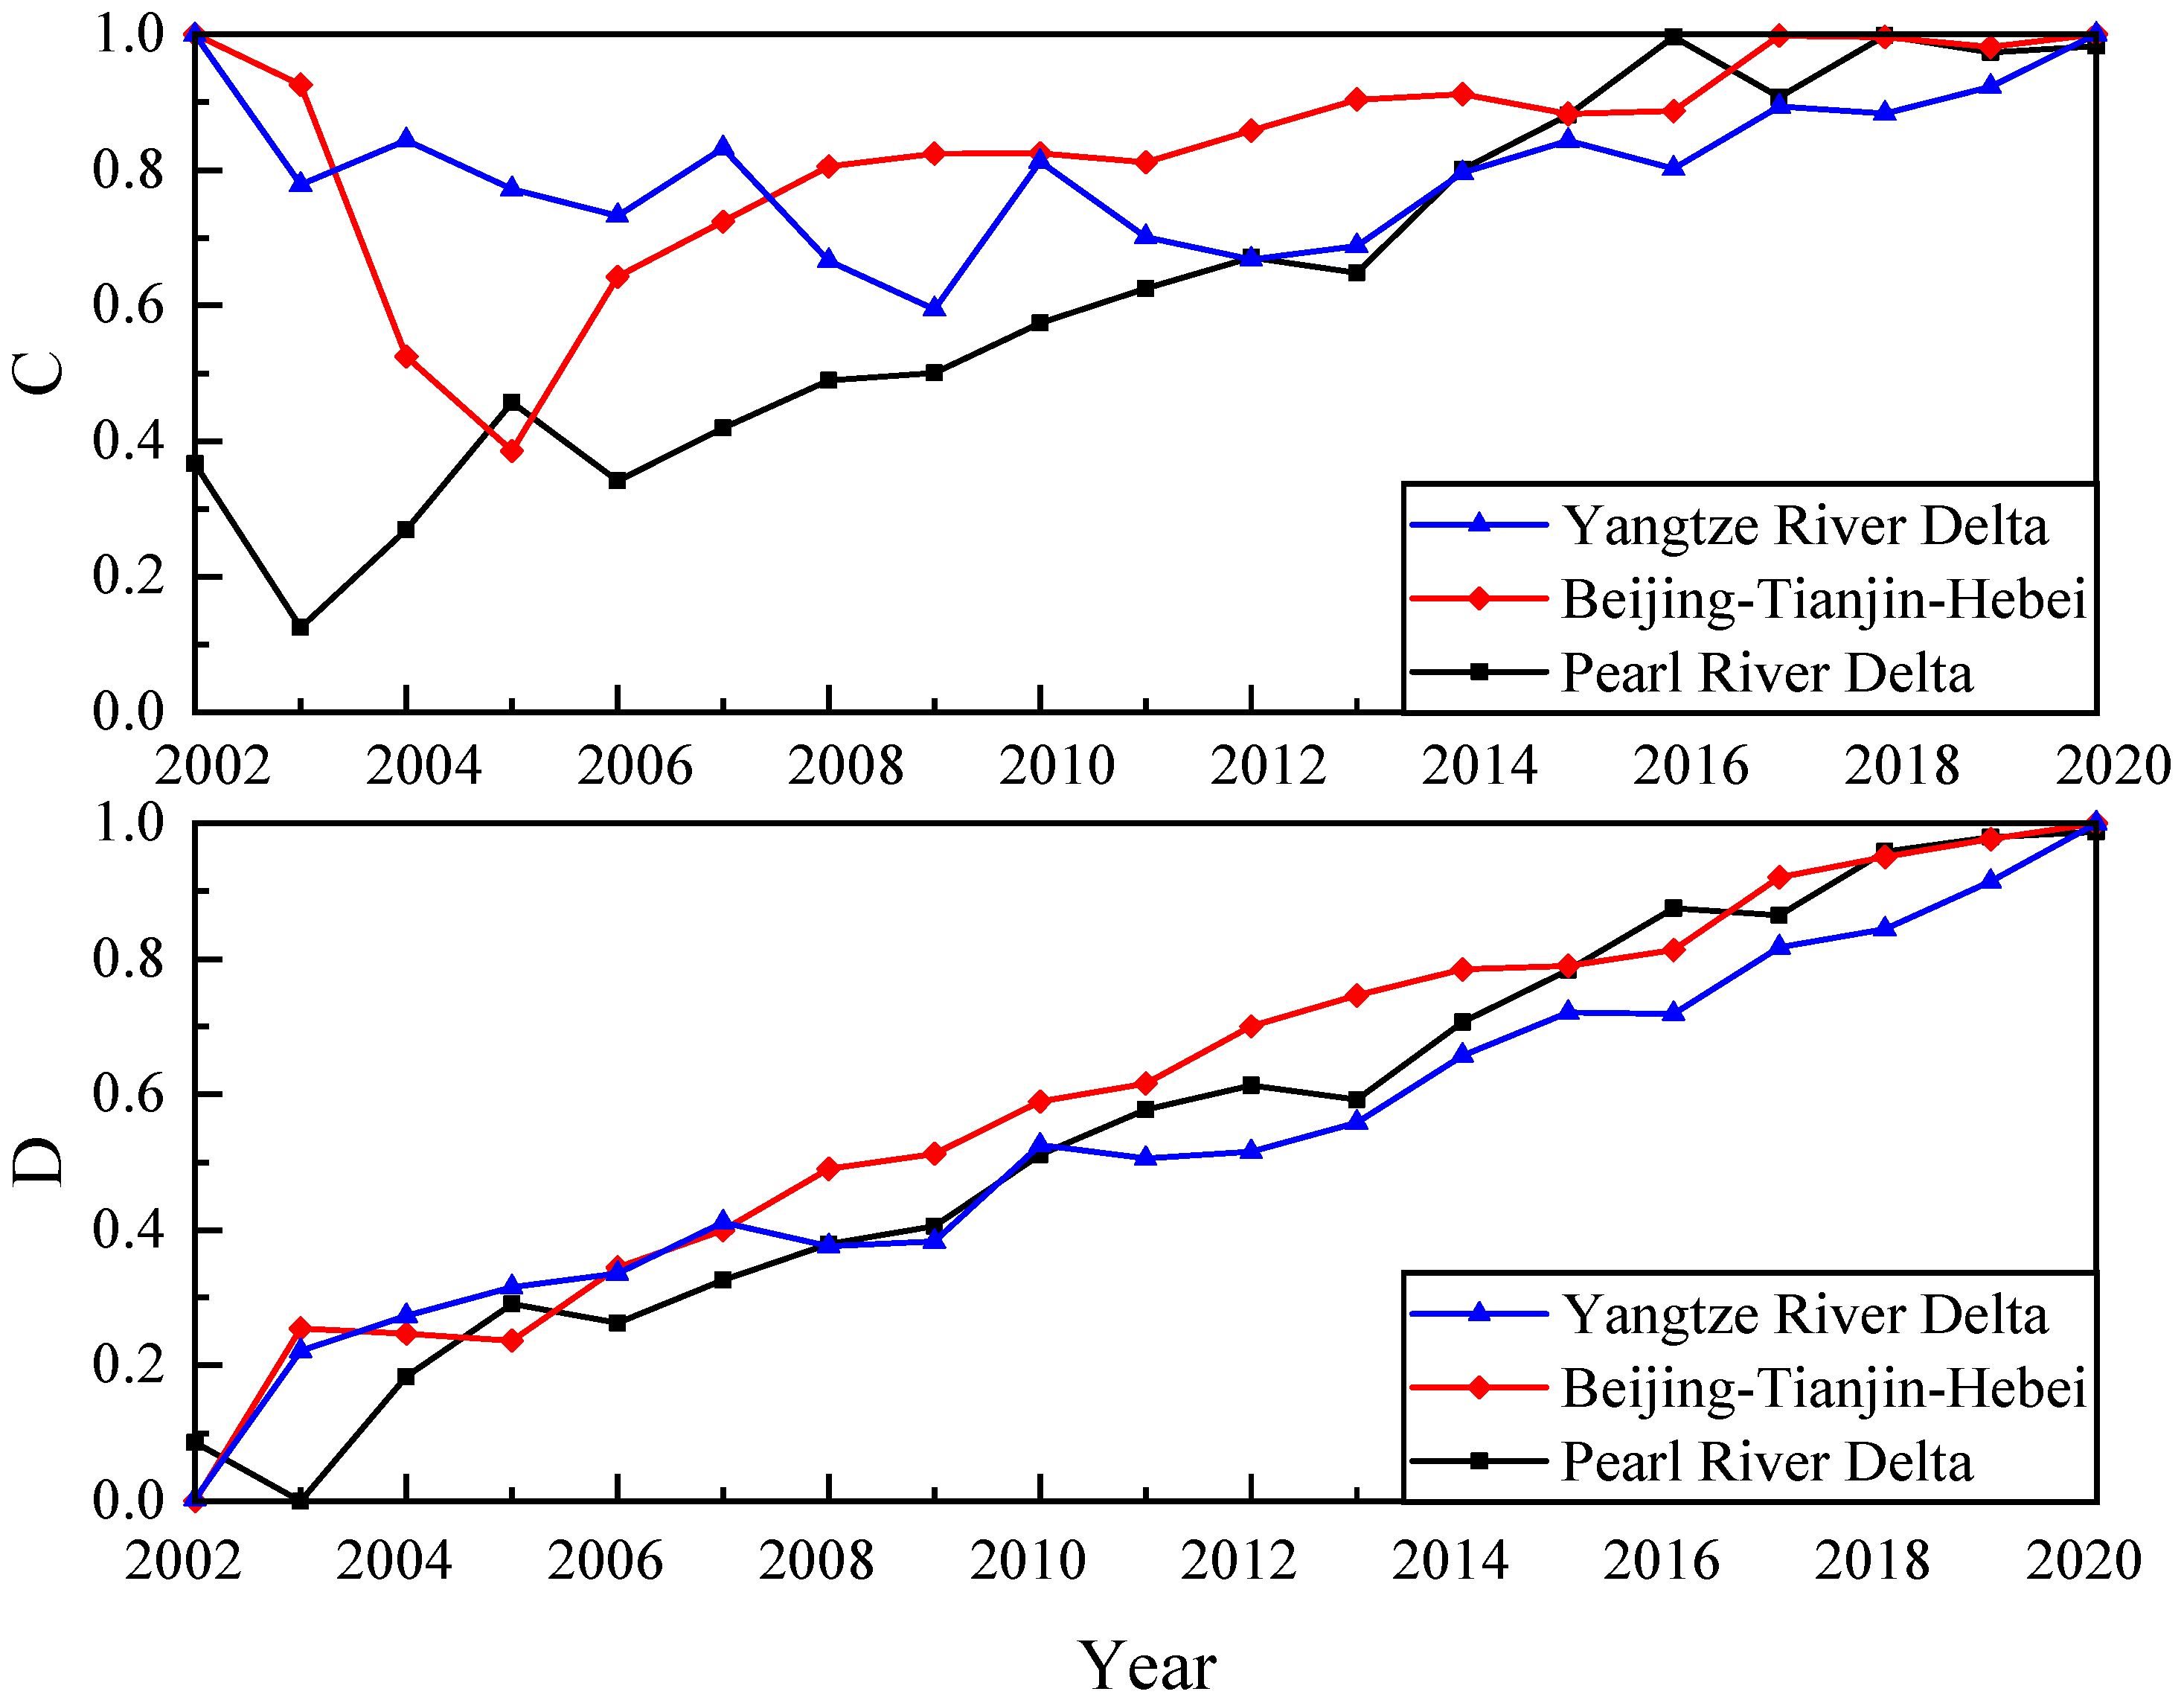
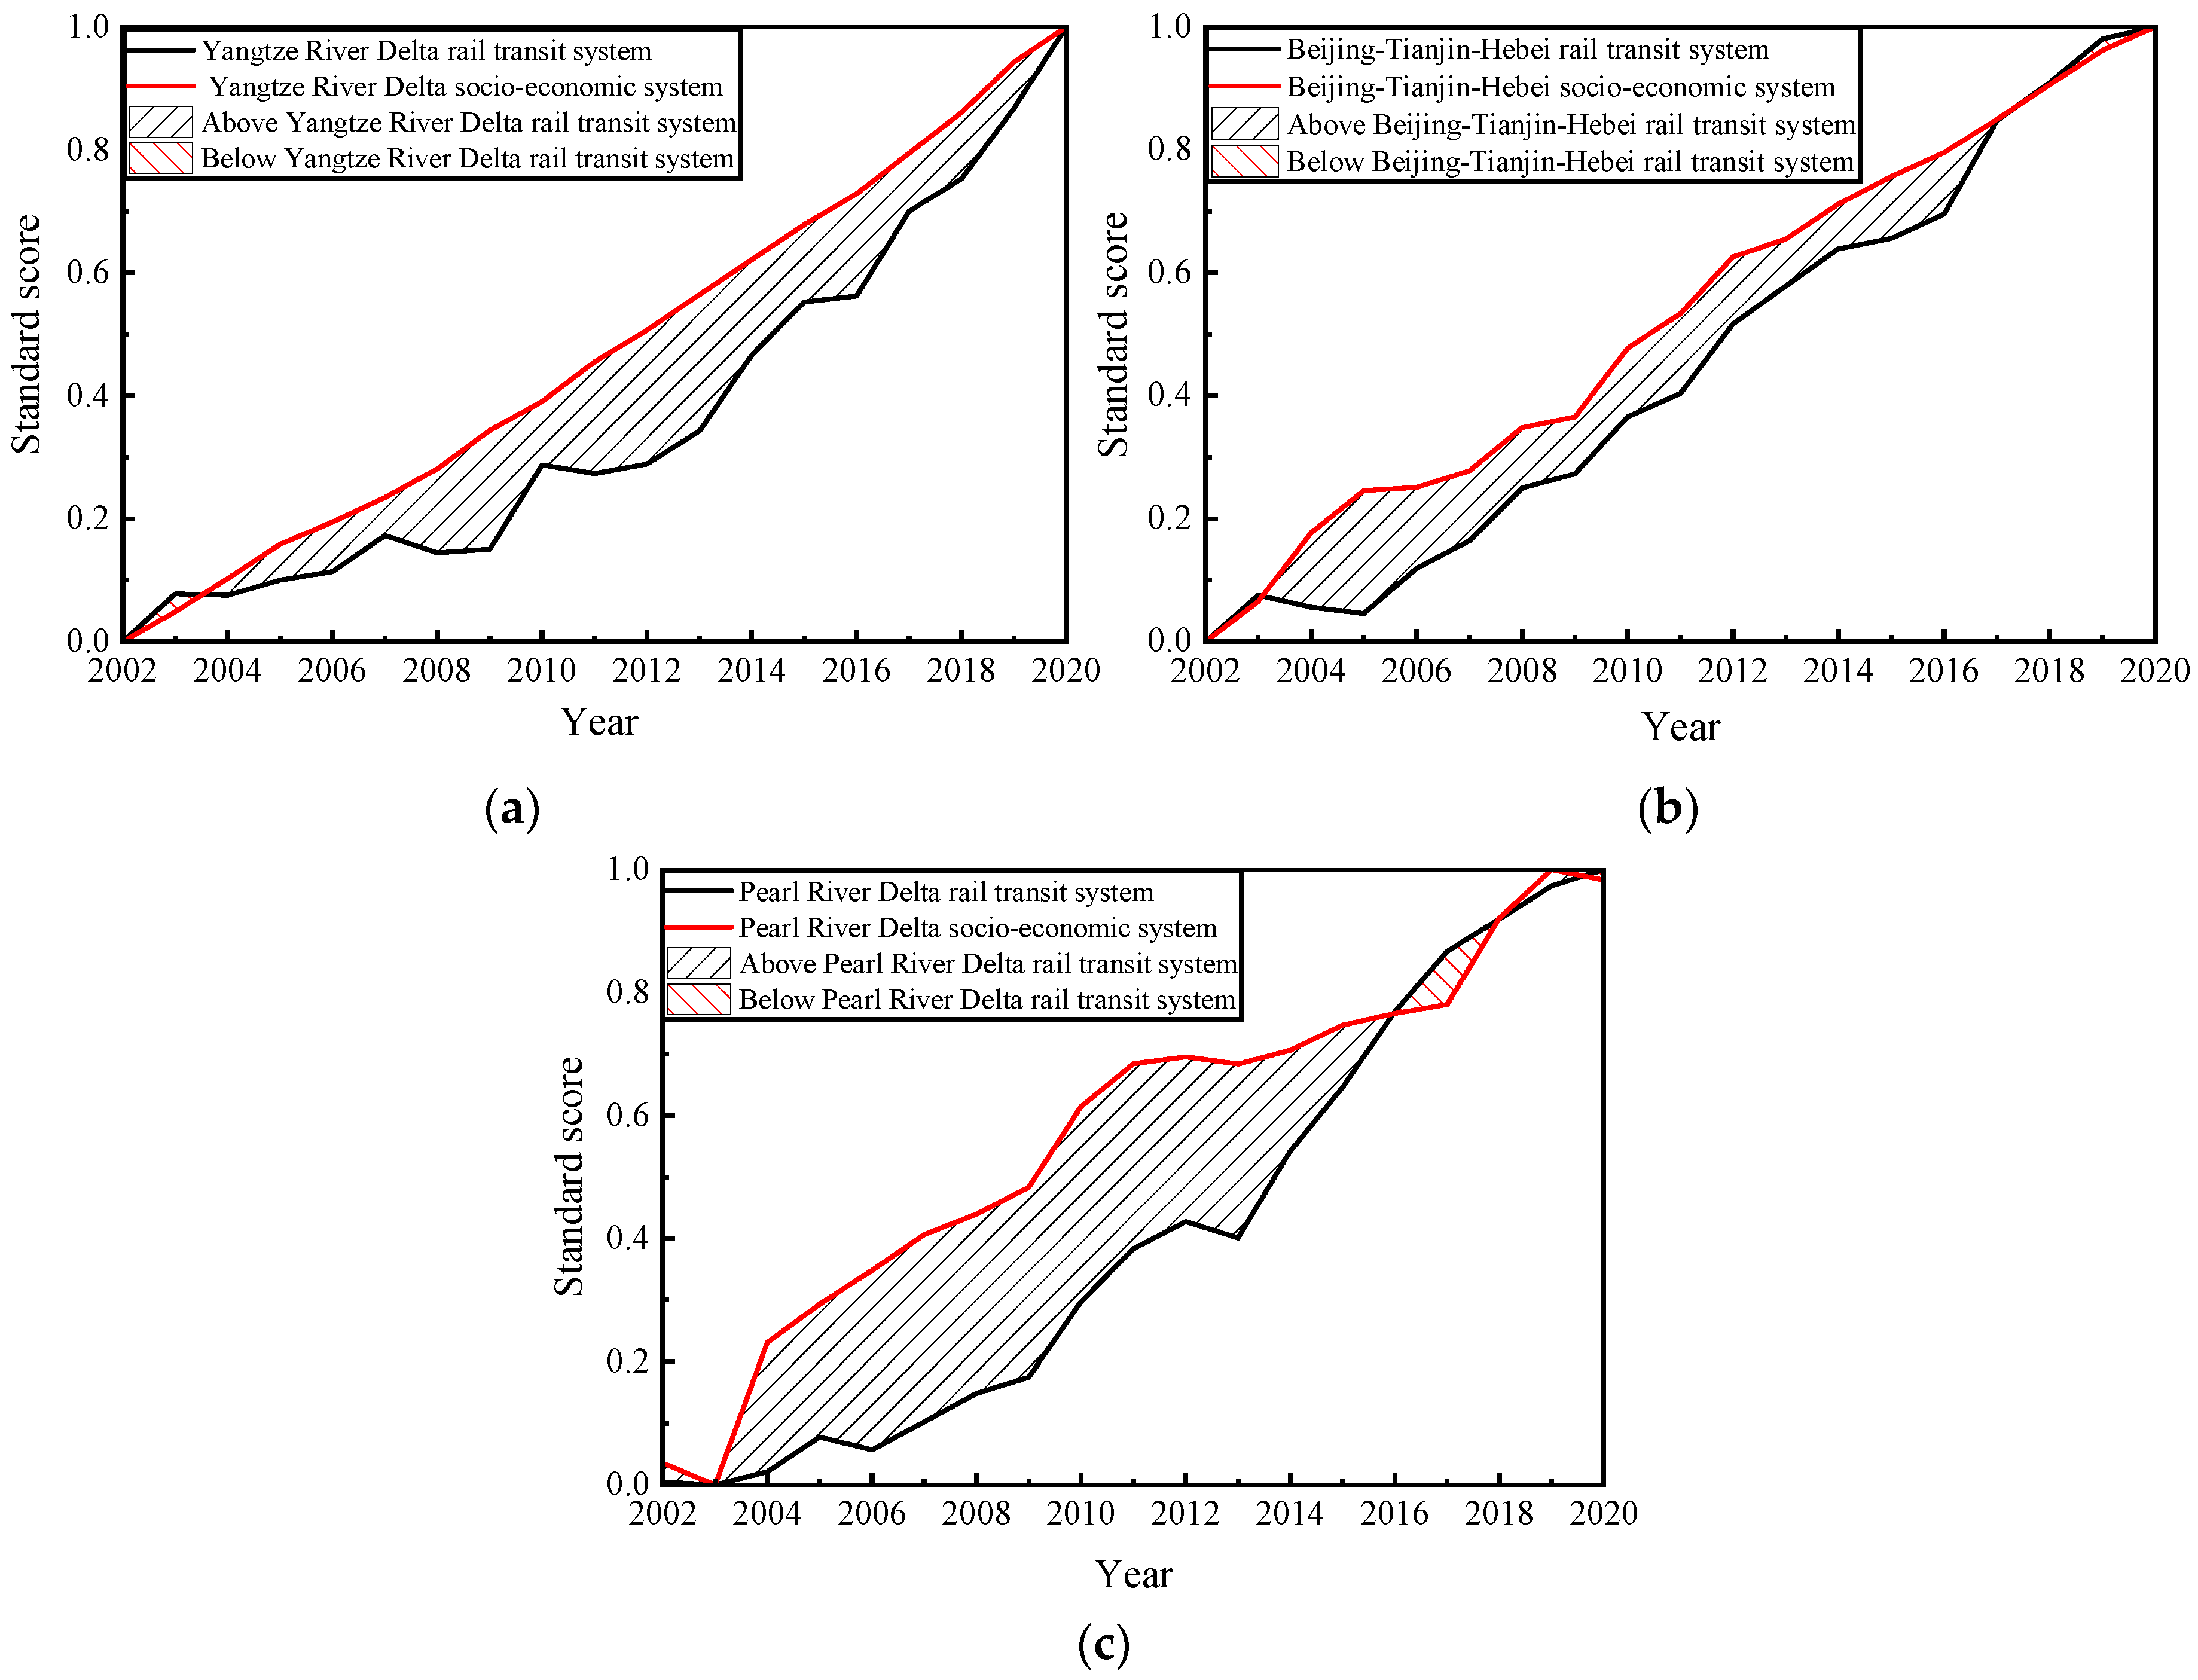
4.1. Rail Transit and Social Economic Development Level Analysis of the Three City Clusters

As can be seen from Figure 9, from the overall trend in the past nearly 20 years, urban rail transit development in the Yangtze River Delta, Beijing-Tianjin-Hebei and Pearl River Delta city clusters has lagged behind socio-economic development for a long time. In the research period, although there is a situation in which the rail transit system develops ahead of the socio-economic system, it is basically within the acceptable error range. As rail transit construction intensity is also affected by policy, time limit and human factors, there is a great instability. In contrast, socio-economic development is relatively stable, so the acceleration of construction intensity in a short period of time can also be accepted as the reason to explain this phenomenon.
From the point of view of supply and demand, rail transit lags behind socio-economic development for a long time. It shows that the construction of rail transit cannot meet the travel demands of the population in a city cluster for a long period of time, that is, the state of “overall insufficient supply” continues to exist. The transient phenomenon that rail transit is ahead of the social and economic development shows that there is also “radical development and construction” in rail transit construction in the short term.
The lag degree of rail transit is measured by the shadow area difference Δ S ( Δ S = black shadow area—red shadow area) in Figure 8. By integrating the absolute area of polygons, the lag degree of rail transit in city clusters can be obtained as follows:
  • Δ S   (Yangtze River Delta) = 2.57;
  • ∆S (Beijing-Tianjin-Hebei) = 1.39;
  • ∆S (Pearl River Delta) = 2.82.
According to the above results, the lagging degree of rail transit construction in the three city clusters can be ranked, from highest to lowest: Pearl River Delta, Yangtze River Delta and Beijing-Tianjin-Hebei. The rail transit construction of the Pearl River Delta city cluster lags behind the social economy most seriously, mainly because the scale of its city cluster is the smallest, and the rail transit construction starts the latest.

4.2. The “Rail Transit—Social Economy” Coupling and Coordinated Development Level of the Three City Clusters

From the overall coupling trend of the three city clusters in Figure 10, the coupling degree of the Yangtze River Delta city cluster is better than that of the Beijing-Tianjin-Hebei city cluster, and the Pearl River Delta city cluster is the worst. Among them, the coupling between the rail transit and socio-economic system in the Yangtze River Delta city cluster is relatively stable, while the fluctuation of the Beijing-Tianjin-Hebei Pearl River Delta city cluster is more serious. The reasons for this phenomenon may be as follows: (1) The difference of city cluster development scale. Among the three city clusters, the Yangtze River Delta city cluster covers 41 cities in three provinces and one city, and its socio-economic size is much larger than that of the Beijing-Tianjin-Hebei region and the Pearl River Delta region; (2) The scale of urban rail transit development. The Yangtze River Delta rail transit construction scale and development speed are the first.
The degree of coordination can also be divided into three stages:
Stage I (2002–2006): The coordinated development of the “rail transport-social economy” system of the three city clusters is in a state of disorder, and the coordination degree of the three city clusters in this period is unstable, with fluctuations and great changes;
Stage II (2006–2015): The coordinated state of the “rail-transport-social economy” system of the three city clusters changed from maladjustment to coordination, and the Beijing-Tianjin-Hebei region was better than the Pearl River Delta, and the Pearl River Delta was better than the Yangtze River Delta;
Stage III (2015–2020): The three city clusters step into a highly coordinated state. The Beijing-Tianjin-Hebei region and the Pearl River Delta are in fierce competition, and their coordinated development status is better than that of the Yangtze River Delta city cluster.

5. Discussion

5.1. Problems Existing in the Development of “Rail Transit and Social-Economy” System

5.1.1. The Overall Supply of Rail Transit Is Lacking and Lags behind the Socio-Economic Development

The Beijing-Tianjin-Hebei, Yangtze River Delta and Pearl River Delta have long been in the situation that rail transit construction lags behind the social and economic development. In other words, in the past 20 years, the supply of rail transit construction is insufficient to meet the travel demand of residents in urban built-up area. Public transport cannot meet the large passenger flow, the number of private cars will increase and the urban congestion index will increase. The low road area per capita in the urban built-up area and low rail transit density in the core area are concrete manifestations of insufficient rail transit supply. Take Beijing and Shanghai, for example, although rail transit has become large and relatively mature, construction and planning are still in full swing, and urban congestion still occurs continuously. Through in-depth analysis, we find that although the scale is large, it takes a long time for each person to travel, so the overall situation is still “insufficient supply”.
For the phenomenon that rail transit construction is ahead of socio-economic development in the short term, it may be due to the sudden increase in rail transit construction intensity caused by policy-oriented, construction schedule or artificial factors. It may also be that some cities fail to measure their own financial resources and support abilities. Decision makers attach importance to investment and neglect planning, blindly pursuing rail transit, resulting in radical development. Three city clusters were evaluated from 2002 to 2020. It can be found that the coupling degree and coordination degree between rail transit and social economy were weak on the whole. It shows that socio-economic development is better than rail transit, and rail transit does not match socio-economic development.

5.1.2. Regional Development Is Unbalanced and There Is a Big Gap in Development

By the end of 2020, 45 cities nationwide had rail transit services, including 11 in the Yangtze River Delta. Its line length accounts for nearly 28% of the country’s total. From the perspective of the three urban agglomerations, the Yangtze River Delta is far ahead in terms of route size, which is more than the Beijing-Tianjin-Hebei region and the Pearl River Delta combined, showing a dominant state.
Analyzing it from the inside of the urban agglomeration, and taking the urban agglomeration of The Yangtze River Delta as an example, there are 41 cities in the Yangtze River Delta city cluster, but only 11 cities have urban rail transit. A large number of them are concentrated in Jiangsu and Zhejiang provinces. In Anhui province, only Hefei, the provincial capital, operates rail transit. Therefore, the distribution within the urban agglomeration is also very unbalanced.

5.1.3. Rail Transit Relies on Government Subsidies and Suffers Heavy Losses

Rail transit construction has high investment, low profit and excessive dependence on local government. Lack of funds often becomes the core problem that restrains the development of rail transit. The construction cost of rail transit is very high, and the construction is led by the government. Therefore, the financial capacity of local government is also the key to measure the development of rail transit in a region. The operation efficiency of rail transit has always been a difficult problem. Most of the rail transit construction in China is operated at a loss, with huge investment and maintenance costs and only relying on ticket prices, advertising and other revenue methods. Therefore, government subsidies have become the main source of funds for most rail transit operations. It can be seen that the construction of rail transit may also bring great pressure to the finance of some local governments, resulting in a high leverage ratio and great debt risk.

5.2. Suggestions and Measures for Improvement

5.2.1. Multi-Channel Financing Goes Hand in Hand with Planning

The development of urban rail transit shows a situation of “the overall supply is short and lags behind the social economy for a long time”. From the perspective of supply, increasing rail transit investment is an urgent problem to be solved. The construction of rail transit has high investment, low profit, excessive dependence on local government, and lack of funds often becomes the core problem that constrains the development of rail transit.
Traditionally, rail transit construction mainly relies on government funds or financial allocations, which is undoubtedly a huge pressure for cities or governments with insufficient financial resources. It may be a reasonable way to improve investment policies and increase the participation of private capital. Take the rail transit of other countries as an example. In Japan, the UK and other countries, besides the government, there is also social capital, such as local public organizations and enterprises in the investment subjects of rail transit construction [41,42,43,44]. Therefore, we should expand the multi-channel financing mode and adopt multi-channel financing such as bonds, debts, loans, foreign investors, enterprises and social groups to further promote rail transit construction.
At the same time, we should: adjust measures to local conditions and combine short-term and long-term planning; measure the city’s economic, financial and other financial capacity, population, passenger flow, location and other social support capacity; judge whether rail transit construction can match with its corresponding social and economic capacity, and plan the line reasonably; evaluate the strength of the city and advance the construction process in an orderly manner.
Recent planning focuses on solving congestion and considers the impact of travel demands, passenger flow in core areas and the construction period on urban traffic, environment, life and other aspects [45]. Long-term planning needs to consider the urban population flow, urban space expansion direction, economic growth points, multi-regional linkage and other factors.

5.2.2. Technology-Oriented, Common Development of a Variety of Systems

It is important to measure urban traffic demand and develop different types of systems as needed.
  • The core areas of first-tier cities have the following characteristics: shortage of land resources and large permanent population flow. A metro system suitable for underground operation with large volume, fast speed and no occupation of ground land can be adopted;
  • Urban fast rail and light rail which are suitable for long distance and moderate carrying capacity can be used between urban core areas and suburbs or cities within city clusters;
  • In the non-core areas of big cities or small and medium-sized cities, land resources are not tight. Trams are suitable, they run on the ground, they are low cost and they are flexible;
  • For specific road operations, such as an airport line or long-distance high-speed railway station line, the customized system of magnetic levitation can be used. It is fast and carries medium to large volumes, but costs more to build and maintain.
At the same time, advanced technologies such as modern control, communications, 5G networks, unmanned driving and artificial intelligence will be introduced to improve the role and service levels of rail transit in urban transportation. In general, according to the technical development and transport characteristics of rail transit, a variety of systems develop together to meet the traffic needs of cities.

5.2.3. Reduce Costs and Increase Efficiency to Improve Operating Efficiency

The improvement of the operation efficiency of rail transit and maximizing the economic effect of rail transit is the core of solving the problem of loss of rail transit operation. Hong Kong is one of the few places where rail operations are profitable. The MTR operates on commercial principles. When building the subway, the MTR corporation and the developer jointly develop the space on the station yard, and simultaneously construct large residential and commercial properties, manage existing properties and retain some commercial properties for investment purposes. Hong Kong’s “metro + property” development model has also brought great profits to Hong Kong’s Rail Transit Corporation [46,47,48]. The commercial mode of rail transit in Hong Kong is of great reference significance to economically developed areas. Take Shanghai, Beijing, Shenzhen and other cities, for example. Their economic capacity is excellent, and the commercial model of the subway is well accepted and has good prerequisites. So, to break the dilemma of loss of rail transit operation, learn from the “Hong Kong model”; seek for the Internet, business, real estate, property, transportation and other diversified business plans to reduce costs and increase efficiency and improve the operation benefit of rail transit and maximize the economic effect of rail transit. It is beneficial to promote the coordinated development of rail transit and the social economy complex system.

5.3. Shortcomings and Prospects

This paper explores the coupling coordination law between rail transit and the social economy from the perspective of urban agglomeration. It provides some reference and thinking for the related research, but there are still some deficiencies.
(1) This paper only analyzes the coupling coordination relations of the three representative urban agglomerations within a specific time period. When the research time period or the research area changes, the coupling degree and coordination degree of the research area will change. The reason is that, in the process of principal component analysis, the weight of evaluation indicators will depend on the extreme value in the original data. As a result, the evaluation results of a certain region will change due to time and space. Therefore, the applicability is relatively limited, and further discussion is needed;
(2) Compared with the traditional model, although the coupling theoretical model has been modified, the coupling results may vary due to the subjectivity in the construction of the index system. Therefore, it is very important to put forward a widely applicable evaluation system construction standard and model. There is still much work to be completed in the future.

6. Conclusions

This paper focuses on the perspective of the city cluster. On the basis of summarizing the existing evaluation indexes and analysis methods, the evaluation index system of rail transit-social economy composite system suitable for city cluster scale is constructed. Combining principal component analysis and modified coupling and coordination theory model, this paper calculates and analyzes the coupling and coordination degree of the Yangtze River Delta city cluster and its 11 cities. In addition, the coupling and coordinated development laws and differences of the three national key city clusters in Beijing, Tianjin and Hebei, the Yangtze River Delta and the Pearl River Delta are compared. After analyzing and studying the above main contents, the following conclusions are drawn:
(1) The rail transit of 11 cities in the Yangtze River Delta presents a stepped development pattern. In other words, there are “national central cities, provincial capitals, second-tier cities, third-tier cities”, and the coupling and synergy of the “rail transport-social economy” composite system also presents periodic changes. At the same time, there is regional imbalance in rail transit construction in the Yangtze River Delta;
(2) In the past 20 years, the rail transit development in the Beijing-Tianjin-Hebei region, the Yangtze River Delta and the Pearl River Delta presents a situation of “the overall supply is short and lags behind the social economy for a long time “. Among them, the Pearl River Delta city group lags behind the most serious. The main reason may be attributed to the relatively small scale of city cluster and rail transit construction started late. By comparison, the Beijing-Tianjin-Hebei city cluster lags the least and has better coordination;
(3) From 2002 to 2020, the coupling status of the “rail transport-social economy” composite system in the Yangtze River Delta city clusters remained above good coupling (including good coupling), which was better than that in the Beijing-Tianjin-Hebei and Pearl River Delta city clusters. While, the coordinated state of the “rail transit-social economy” composite system of the three city clusters also experienced a development from serious maladjustment to highly coordinated development. On the whole, the coordinated development of Beijing-Tianjin-Hebei is better than that of the Pearl River Delta, while the coordination of the Yangtze River Delta is slightly inferior;
(4) Based on the research results, it is suggested that the government improves the investment policy and adopts the method of multi-channel financing to accelerate the investment in rail transit construction, so as to solve the problem of insufficient supply. In accordance with local conditions, the government should promote the development of a variety of systems. On this basis, it also needs to draw lessons from foreign and Hong Kong models, to seek diversified investment and operation schemes to improve the operation efficiency of rail transit and to maximize the economic effect of rail transit and break the dilemma of loss of rail transit.

Author Contributions

The authors’ contributions are as follows: writing—original draft preparation, Z.W.; review and editing, X.L., N.B.; funding acquisition, X.L.; supervision, S.L., J.L. All the authors have made contributions to conceptualization, methodology, validation, investigation, etc. All authors have read and agreed to the published version of the manuscript.

Funding

This study was supported by the Key R&D Program of Jiangsu, China, grant number BE2020038.

Acknowledgments

The authors would like to thank Dongming Yuan from Nanjing University for his technical support of ARCGIS in this paper.

Conflicts of Interest

The authors declare no conflict of interest.

Appendix A

Table A1. Calculation results of coupling degree and coordination degree in Yangtze River Delta city cluster.
YearRail Transit System ScoreSocio-Economic System ScoreCoupling Degree CCoordination Degree D
20020.00000.00001.00000.0026
20030.07760.04840.77830.2215
20040.07500.10240.84390.2736
20050.10020.15840.77180.3159
20060.11370.19480.73240.3362
20070.17270.23410.83220.4114
20080.14430.28110.66550.3762
20090.15050.34360.59450.3832
20100.28760.39080.81240.5250
20110.27360.45520.70140.5056
20120.28890.50630.66830.5155
20130.34280.56450.68750.5584
20140.46550.62120.79550.6574
20150.55250.67860.84350.7206
20160.56200.72840.80200.7193
20170.70050.79470.89360.8174
20180.75280.86080.88320.8441
20190.86810.94320.92260.9141
20201.00001.00001.00001.0000
Table A2. Calculation results of coupling degree and coordination degree in Beijing-Tianjin-Hebei city cluster.
YearRail Transit System ScoreSocio-Economic System ScoreCoupling Degree CCoordination Degree D
20020.00000.00001.00000.0000
20030.07540.06520.92550.2550
20040.05550.17720.52480.2471
20050.04550.24540.38530.2367
20060.11920.25090.64240.3448
20070.16410.27770.72370.3998
20080.25000.34800.80490.4906
20090.27280.36480.82390.5125
20100.36540.47730.82460.5894
20110.40350.53360.81110.6164
20120.51730.62610.85810.7004
20130.57890.65500.90360.7467
20140.63890.71210.91180.7848
20150.65610.75700.88270.7897
20160.69530.79570.88670.8130
20170.84770.84940.99820.9203
20180.90960.90590.99620.9509
20190.98050.96240.98170.9766
20201.00001.00001.00001.0000
Table A3. Calculation results of coupling degree and coordination degree in Pearl River Delta city cluster.
YearRail Transit System ScoreSocio-Economic System ScoreCoupling Degree CCoordination Degree D
20020.00490.03560.36650.0862
20030.00000.00000.00000.0000
20040.02110.23050.26930.1841
20050.07770.29260.45660.2908
20060.05710.34770.34130.2628
20070.10220.40560.41880.3261
20080.14860.43960.48950.3794
20090.17500.48350.50030.4059
20100.29660.61440.57380.5112
20110.38270.68420.62500.5774
20120.42750.69530.67100.6137
20130.40070.68350.64840.5928
20140.54150.70580.80080.7067
20150.64560.74700.88130.7834
20160.76840.76560.99680.8744
20170.86670.78050.90720.8643
20180.91930.92120.99800.9583
20190.97311.00000.97310.9798
20201.00000.98280.98280.9871

References

  1. Bobylev, N. Underground space as an urban indicator: Measuring use of subsurface. Tunn. Undergr. Space Technol. 2016, 55, 40–51. [Google Scholar] [CrossRef] [Green Version]
  2. Sterling, R.; Admiraal, H.; Bobylev, N.; Parker, H.; Godard, J.-P.; Vähäaho, I.; Rogers, C.D.F.; Shi, X.; Hanamura, T. Sustainability issues for underground space in urban areas. Proc. Inst. Civ. Eng.-Urban Des. Plan. 2012, 165, 241–254. [Google Scholar] [CrossRef]
  3. Admiraal, J.B.M. A bottom-up approach to the planning of underground space. Tunn. Undergr. Space Technol. 2005, 21, 464–465. [Google Scholar] [CrossRef]
  4. Amirhossein, S. Development of Subsurface Spaces by Sustainable Urban Development Approach. QUID Investig. Cienc. Tecnol. 2017, 1, 1679–1687. [Google Scholar]
  5. Ferbrache, F.; Knowles, R.D. City boosterism and place-making with light rail transit: A critical review of light rail impacts on city image and quality. Geoforum 2017, 80, 103–113. [Google Scholar] [CrossRef]
  6. Han, B.; Yang, Z.; Yu, Y.; Qian, L.; Chen, J.; Ran, J.; Sun, Y.; Xi, Z.; Lu, F. Statistical Analysis of Urban Rail Transit Operation in the World in 2020: A Review. Urban Rapid Rail Transit 2021, 34, 5–11. [Google Scholar]
  7. Hou, X.F.; Mei, J.P.; Zuo, C.; Liu, G.Y. Statistics and Analysis of Urban Rail Transit in 2020. Urban Rapid Rail Transit 2021, 34, 1–9. [Google Scholar]
  8. Li, X.; Wang, R.; Gu, Q.; Zhou, D.; Xin, Y. Prediction of strategic demand of urban underground space development. Earth Sci. Front. 2019, 26, 32–38. [Google Scholar]
  9. Quan, Y.S.; Yang, T.; Zhao, Y.X.; Jing, G.S.; Chen, B.Z.; Zhang, X.D.; Yang, Z.G.; Yin, G.T.; Zong, C.L.; Chen, Y.Y.; et al. Discussion on the Guidance of the General Office of the State Council for Further Enhancing the Administration of Planning & Construction of Urban Rail Transit. Urban Transp. China 2018, 16, 10–18. [Google Scholar]
  10. Bobylev, N. Mainstreaming sustainable development into a city’s Master plan: A case of Urban Underground Space use. Land Use Policy 2009, 26, 1128–1137. [Google Scholar] [CrossRef]
  11. Volchko, Y.; Norrman, J.; Ericsson, L.O.; Nilsson, K.L.; Markstedt, A.; Oberg, M.; Mossmark, F.; Bobylev, N.; Tengborg, P. Subsurface planning: Towards a common understanding of the subsurface as a multifunctional resource. Land Use Policy 2020, 90, 104316. [Google Scholar] [CrossRef]
  12. Li, X.Z.; Li, C.C.; Aurele, P.; Wu, W.B.; Li, H.Q.; Sun, L.P.; Li, C. Multiple resources and their sustainable development in Urban Underground Space. Tunn. Undergr. Space Technol. 2016, 55, 59–66. [Google Scholar] [CrossRef]
  13. Bobylev, N.; Sterling, R. Urban underground space: A growing imperative Perspectives and current research in planning and design for underground space use. Tunn. Undergr. Space Technol. 2016, 55, 1–4. [Google Scholar] [CrossRef]
  14. Bhattacharjee, S.; Goetz, A.R. The rail transit system and land use change in the Denver metro region. J. Transp. Geogr. 2016, 54, 440–450. [Google Scholar] [CrossRef]
  15. Cervero, R. Mixed land-uses and commuting: Evidence from the American housing survey. Transp. Res. Part A Policy Pract. 1996, 30, 361–377. [Google Scholar] [CrossRef]
  16. Bae, C.-H.C.; Jun, M.-J.; Park, H. The impact of Seoul’s subway Line 5 on residential property values. Transp. Policy 2003, 10, 85–94. [Google Scholar] [CrossRef]
  17. Jun, E.; Lee, S. The Effects of Rapid Rail Transit on Balanced Regional Development. Seoul Stud. 2007, 8, 73–87. [Google Scholar]
  18. Mallikarjun, S.; Lewis, H.F.; Sexton, T.R. Operational performance of US public rail transit and implications for public policy. Socio-Econ. Plan. Sci. 2014, 48, 74–88. [Google Scholar] [CrossRef]
  19. Grube-Cavers, A.; Patterson, Z. Urban rapid rail transit and gentrification in Canadian urban centres: A survival analysis approach. Urban Stud. 2015, 52, 178–194. [Google Scholar] [CrossRef]
  20. Lee, Y.H.; Jin, J. The Effects of Public Transit on Housing Prices: Focused on UI Light Rail Transit. J. Real Estate Policy Res. 2018, 19, 175–197. [Google Scholar]
  21. Baker, D.M.; Kim, S. What remains? The influence of light rail transit on discretionary income. J. Transp. Geogr. 2020, 85, 102709. [Google Scholar] [CrossRef]
  22. Sekar, S.P.; Gangopadhyay, D. Impact of Rail Transit on Land Use and Development: Case Study of Suburban Rail in Chennai. J. Urban Plan. Dev. 2017, 143, 04016038. [Google Scholar] [CrossRef]
  23. Yun, D.S. Analyzing the Relationship between Rail Transit Ridership and Land Use Characteristics in Access Areas of Urban Rail Stations—Focused on Temporal Variations of Rail Transit Ridership at Daegu Urban Rail Stations. J. Transp. Res. 2015, 22, 25–41. [Google Scholar]
  24. Meng, L. Study on the Interaction between Transit and Urban Land Use. Ph.D. Thesis, Southwest Jiaotong University, Chengdu, China, 2003. [Google Scholar]
  25. Tan, Z.Z.; Li, S.Y.; Li, X.; Liu, X.P.; Chen, Y.M.; Li, W.X. Spatio-temporal effects of urban rail transit on complex land-use change. Acta Geogr. Sin. 2017, 72, 850–862. [Google Scholar]
  26. Pan, H.X.; Ren, C.Y.; Yang, T.Y. An empirical study on the impact of Shanghai rail transit on land use in station area. Urban Plan. Forum 2007, 4, 92–97. [Google Scholar]
  27. Han, S.M.; Han, F.; Zhang, S.J.; Li, Y.; Zhang, J.C. Analysis on the coupling effect of Xi’an-Yinchuan high speed railway and economy development in Shanxi-Gansu-Ningxia District railway and economy development in Shanxi-Gansu-Ningxia District. IOP Conf. Ser. Earth Environ. Sci. 2021, 693, 012131. [Google Scholar] [CrossRef]
  28. Li, M.M. Analysis of coupling coordination between urban rail transit operation scale and economic development. J. Math. Pract. Theory 2021, 51, 302–308. [Google Scholar]
  29. Guo, J.M.; Han, L.F.; Ma, L.L. Research of Urban Rail Transit Construction level based on the principal component analysis from the perspective of DEA. J. Beijing Jiaotong Univ. 2015, 39, 90–94. [Google Scholar]
  30. Shang, K.Q.; Shuai, B.; Huang, W.C.; Zuo, B.R. Research on the Collaborative Development of “Urban Rail Transit-Economy” Composite System. J. Transp. Eng. Inf. 2021, 19, 84–90. [Google Scholar]
  31. Liu, W.W.; Wang, J. Evaluation of coupling coordination degree between urban rail transit and land use. Int. J. Commun. Syst. 2021, 34, e4015. [Google Scholar] [CrossRef]
  32. Xue, F.; Zou, B.; Dai, W.T. Correlation Analysis of Tanshan Rail Transit Industry and Regional Development. China Transp. Rev. 2018, 40, 107–110. [Google Scholar]
  33. Li, D.W. Modeling and Simulation of Microscopic Pedestrian Flow in MTR Hubs. Ph.D. Thesis, Beijing Jiaotong University, Beijing, China, 2007. [Google Scholar]
  34. Ji, Y.P. Research on Evaluation of Coordinated Development between Beijing-Tianjin-Hebei’s Transportation and Economy at the Context of Integration. Ph.D. Thesis, Beijing Jiaotong University, Beijing, China, 2016. [Google Scholar]
  35. Guo, Y.Y.; Liu, P.; Wu, Y. Development of a Method for the Construction Schedule of Urban Rail Transit Lines. J. Wuhan Univ. Technol. 2013, 35, 75–80. [Google Scholar]
  36. Duan, Z. The Coordination Research between Urban Rail Transit Construction and Economic and Social Development. Master’s Thesis, Huazhong University of Science & Technology, Wuhan, China, 2016. [Google Scholar]
  37. Wang, G.B. Analysis of Coupling Coordination Degree between Urban Rail Transit and Social Economic Development. Master’s Thesis, Chongqing University, Chongqing, China, 2018. [Google Scholar]
  38. Xue, L.; Zhao, S.C. Study on the coupling coordination degree of urban rail transit operation system. Sci. -Technol. Manag. 2020, 22, 67–73. [Google Scholar]
  39. Wang, S.J.; Kong, W.; Ren, L.; Zhi, D.D.; Dai, B.T. Research on misuses and modification of coupling coordination degree model in China. J. Nat. Resour. 2021, 36, 793–810. [Google Scholar] [CrossRef]
  40. Liu, C.L. Analysis of common errors in coupling degree calculation. J. Huaiyin Teach. Coll. (Nat. Sci. Ed.) 2017, 16, 18–22. [Google Scholar]
  41. Zheng, Y. Research on Investment and Financing Mode of Rail Transit from the Perspective of PPP. Master’s Thesis, Xiamen University, Xiamen, China, 2017. [Google Scholar]
  42. Bai, N. A Comparison of Different UMT Investment and Operational Modes. Urban Mass Transit 2003, 4, 25–27. [Google Scholar]
  43. Zhang, X.T.; Li, M.Y.; Liu, L.Q. Business related to urban rail transit in Japan and its implications in China. Urban Mass Transit 2021, 34, 160–165. [Google Scholar]
  44. Sheng, L.F.; Rong, C.H.; Song, Y. The Implementation Mode of Urban Rail Based Transit Joint Development-Experiences from United States, Japan and Hong Kong. In Applied Mechanics and Materials; Li, S., Ed.; Trans Tech Publications Ltd.: Zurich, Switzerland, 2012; Volume 97–98, p. 1149. [Google Scholar]
  45. Shi, Z.H. Planning for the Construction of urban rail transit. Urban Mass Transit 2004, 2, 12–15. [Google Scholar]
  46. Yuan, Y.; Lou, S. Research on Urban Rail Transit Financing Operation Modes. In Proceedings of the International Conference on Management Science and Engineering 18th Conference Proceedings, Rome, Italy, 13–15 September 2011; Lan, H., Yang, Y.H., Eds.; IEEE: New York, NY, USA, 2011; p. 1174. [Google Scholar]
  47. Zheng, J.F.; Liu, H.Y. Comprehensive Development of Rail Transport and Land Resources in Hong Kong. China Railw. Sci. 2002, 23, 1–5. [Google Scholar]
  48. He, S.Y.; Tao, S.; Hou, Y.T.; Jiang, W.H. Mass Transit Railway, transit-oriented development and spatial justice: The competition for prime residential locations in Hong Kong since the 1980s. Town Plan. Rev. 2018, 89, 467–493. [Google Scholar] [CrossRef]
Figure 1. Geographical location and distribution of three city clusters.
Infrastructures 07 00056 g001
Figure 2. GDP and rail transit of the five city clusters in 2020: (a) GDP status of city clusters; (b) The status of rail transit in city clusters.
Infrastructures 07 00056 g002
Figure 3. Function image of C value of coupling degree.
Infrastructures 07 00056 g003
Figure 4. Coupling degree C and coordination degree D of “rail transport-social economy” system in 11 cities of Yangtze River Delta: (a) coupling degree C; and (b) coordination degree D.
Infrastructures 07 00056 g004
Figure 5. Development stages of “rail transit-social economy” system in 11 cities of Yangtze River Delta.
Infrastructures 07 00056 g005
Figure 6. Three key periods of rail transit construction length (km) in 11 cities of Yangtze River Delta: (a) 2010; (b) 2017 and (c) 2020.
Infrastructures 07 00056 g006
Figure 7. Rail transit and socio-economic development of city cluster in Yangtze River Delta.
Infrastructures 07 00056 g007
Figure 8. Coupling and coordinated development of “rail transport-social economy” in city cluster of Yangtze River Delta.
Infrastructures 07 00056 g008
Figure 9. Rail transit and socio-economic development of three city cluster: (a) Yangtze River Delta city cluster; (b) Beijing-Tianjin-Hebei city cluster and (c) Pearl River Delta city cluster.
Infrastructures 07 00056 g009
Figure 10. Coupling and coordination level of “rail transit-social economy” system in three city clusters.
Infrastructures 07 00056 g010
Table 1. Evaluation index system of coupling coordination between urban rail transit and socio-economic system.
SubsystemFirst-Level IndicatorSecondary Index+/−Unit
Urban rail transit
system
Line network development scaleLength of the line+km
Number of lines+-
Number of stations+-
Number of assigned trains+-
Rail transit density+km/km2
Network operation statusNumber of system types+-
Annual passenger volume+10,000 times
Average daily passenger transport intensity10,000 times /km
Social and economic development systemUrban social developmentConstruction land area+km2
Number of resident population+10,000 persons
Urbanization rate+%
Urban economic developmentGeneral public finance budget revenue+108 yuan
GDP+108 yuan
GDP per capita+Yuan
Urban disposable per capita income+Yuan
Gross fixed asset formation+108 yuan
Urban infrastructure constructionRail transit investment+108 yuan
Urban road area+10,000 m2
Road area per capita+m2
Length of urban road+km
Density of road network in built-up areakm/km2
Table 2. Classification standard of coupling state and coordination state grade.
Value[0, 0.2)[0.2, 04)[0.4, 0.6)[0.6, 0.8)[0.8, 1.0]
CNarrow couplingLow couplingMiddle couplingGood couplingHigh coupling
DSerious-imbalanceGeneral-imbalanceNarrow-coordinationGeneral-coordinationHigh-coordination
Color- classification Infrastructures 07 00056 i001
Publisher’s Note: MDPI stays neutral with regard to jurisdictional claims in published maps and institutional affiliations.

