
Analytical Modeling of Crack Widths and Cracking Loads in Structural RC Members


Abstract
:1. Introduction
1.1. Reinforced Concrete Cracking
1.2. Cracking Problem—A Key Issue in Bridge Performance
1.3. Tension-Stiffening
2. New Approach
3. Proposed Model
3.1. Model Description
3.2. Mathematical Derivation of the Basic Model
3.2.1. Definitions and Derivation of the Governing Equation
3.2.2. Solution of the Governing Equation
- a.
- Symmetry at x = 0:
- b.
- Rebar loading at x = L:
- c.
- Free concrete surface at x = L:
3.3. Features of the Proposed Model
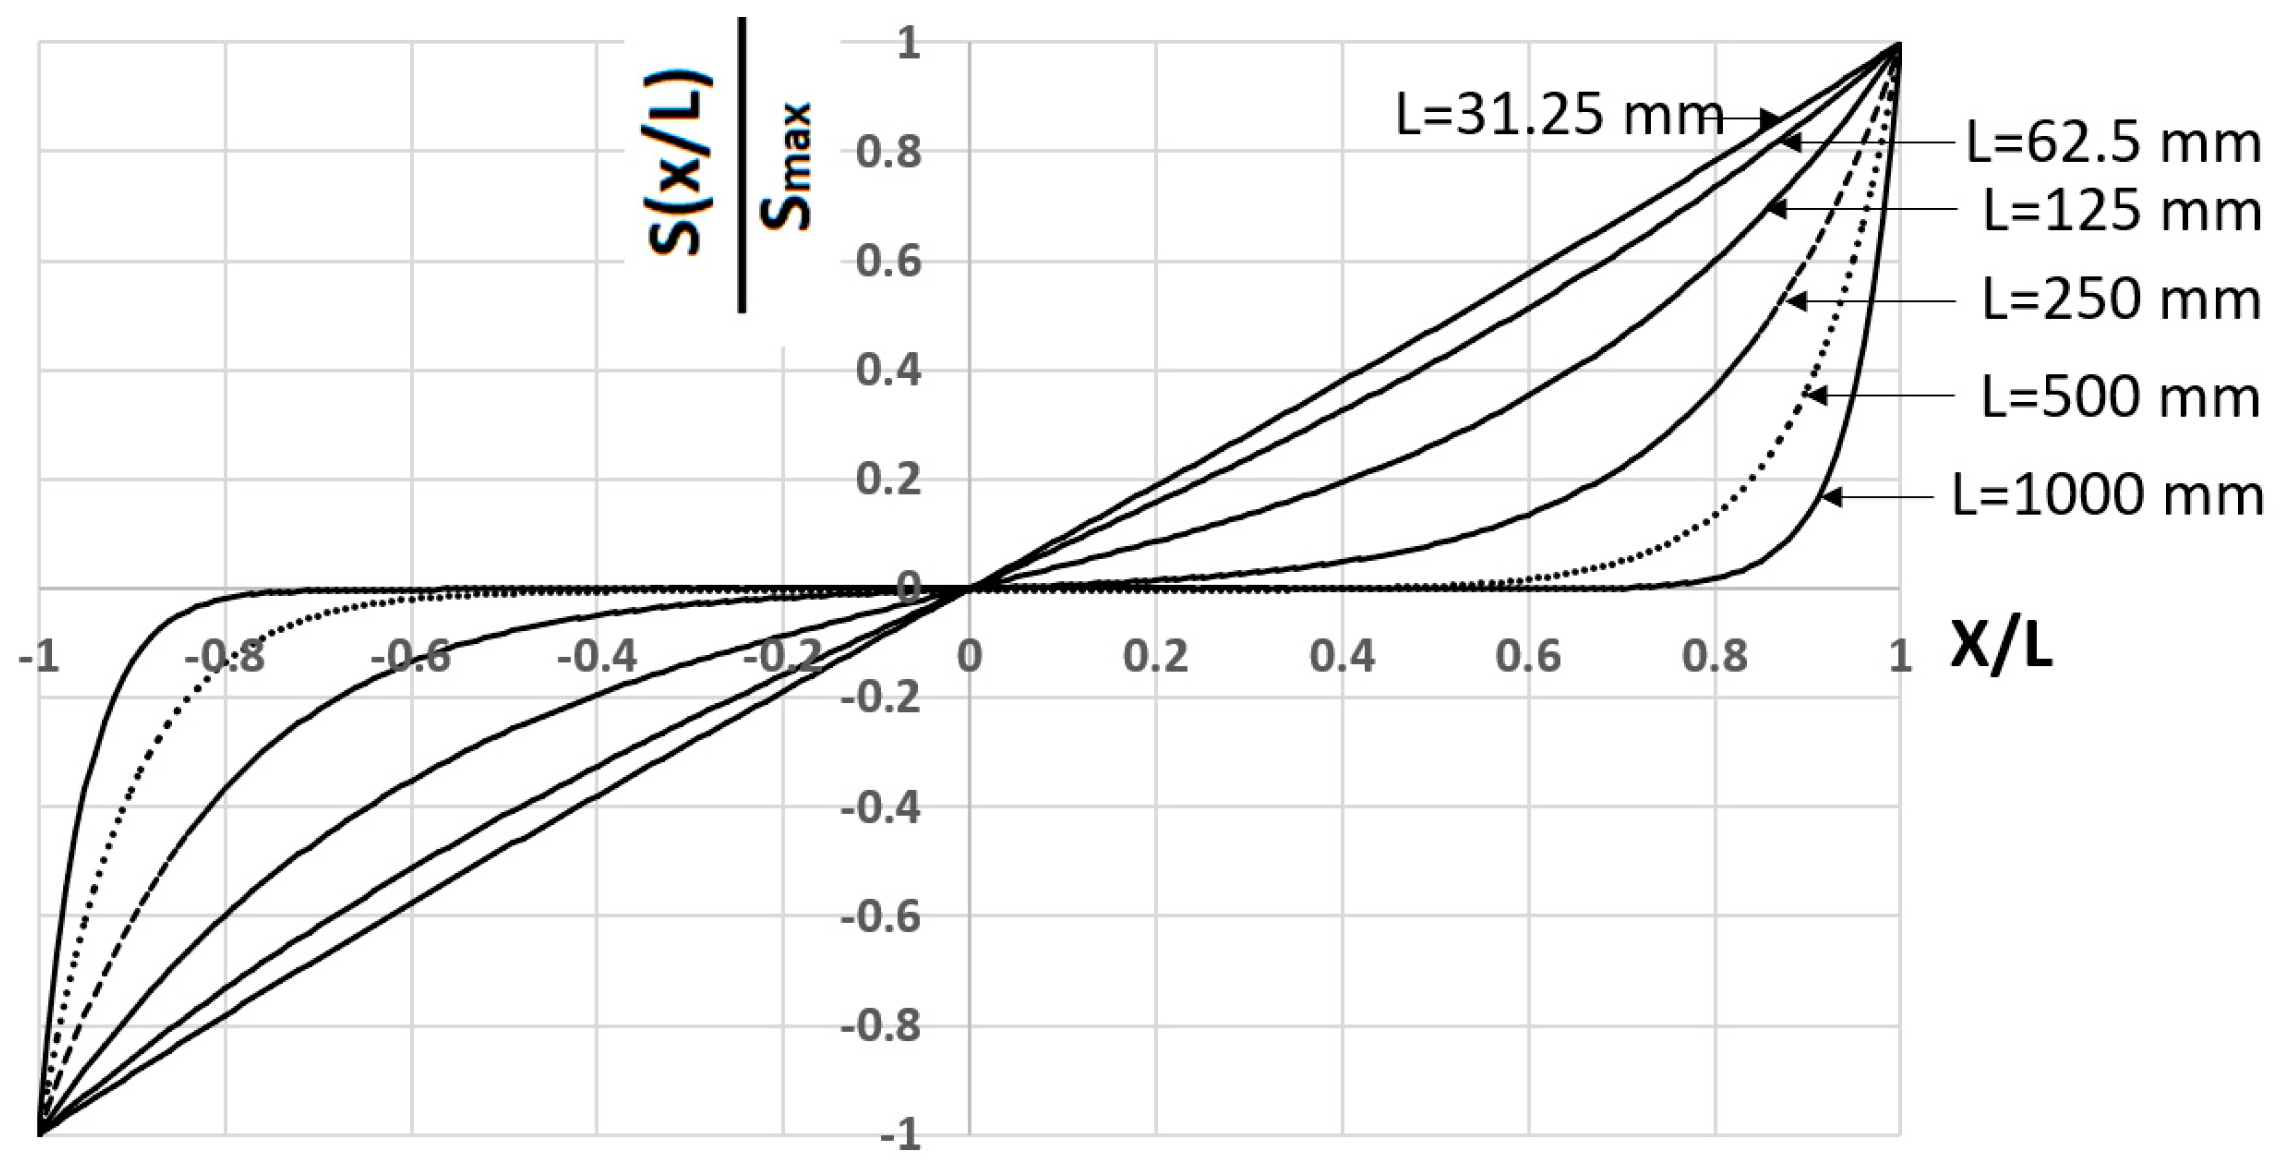
3.3.1. Variation of Major Parameters along the URCE
- a.
- Slip function (Equation (32))
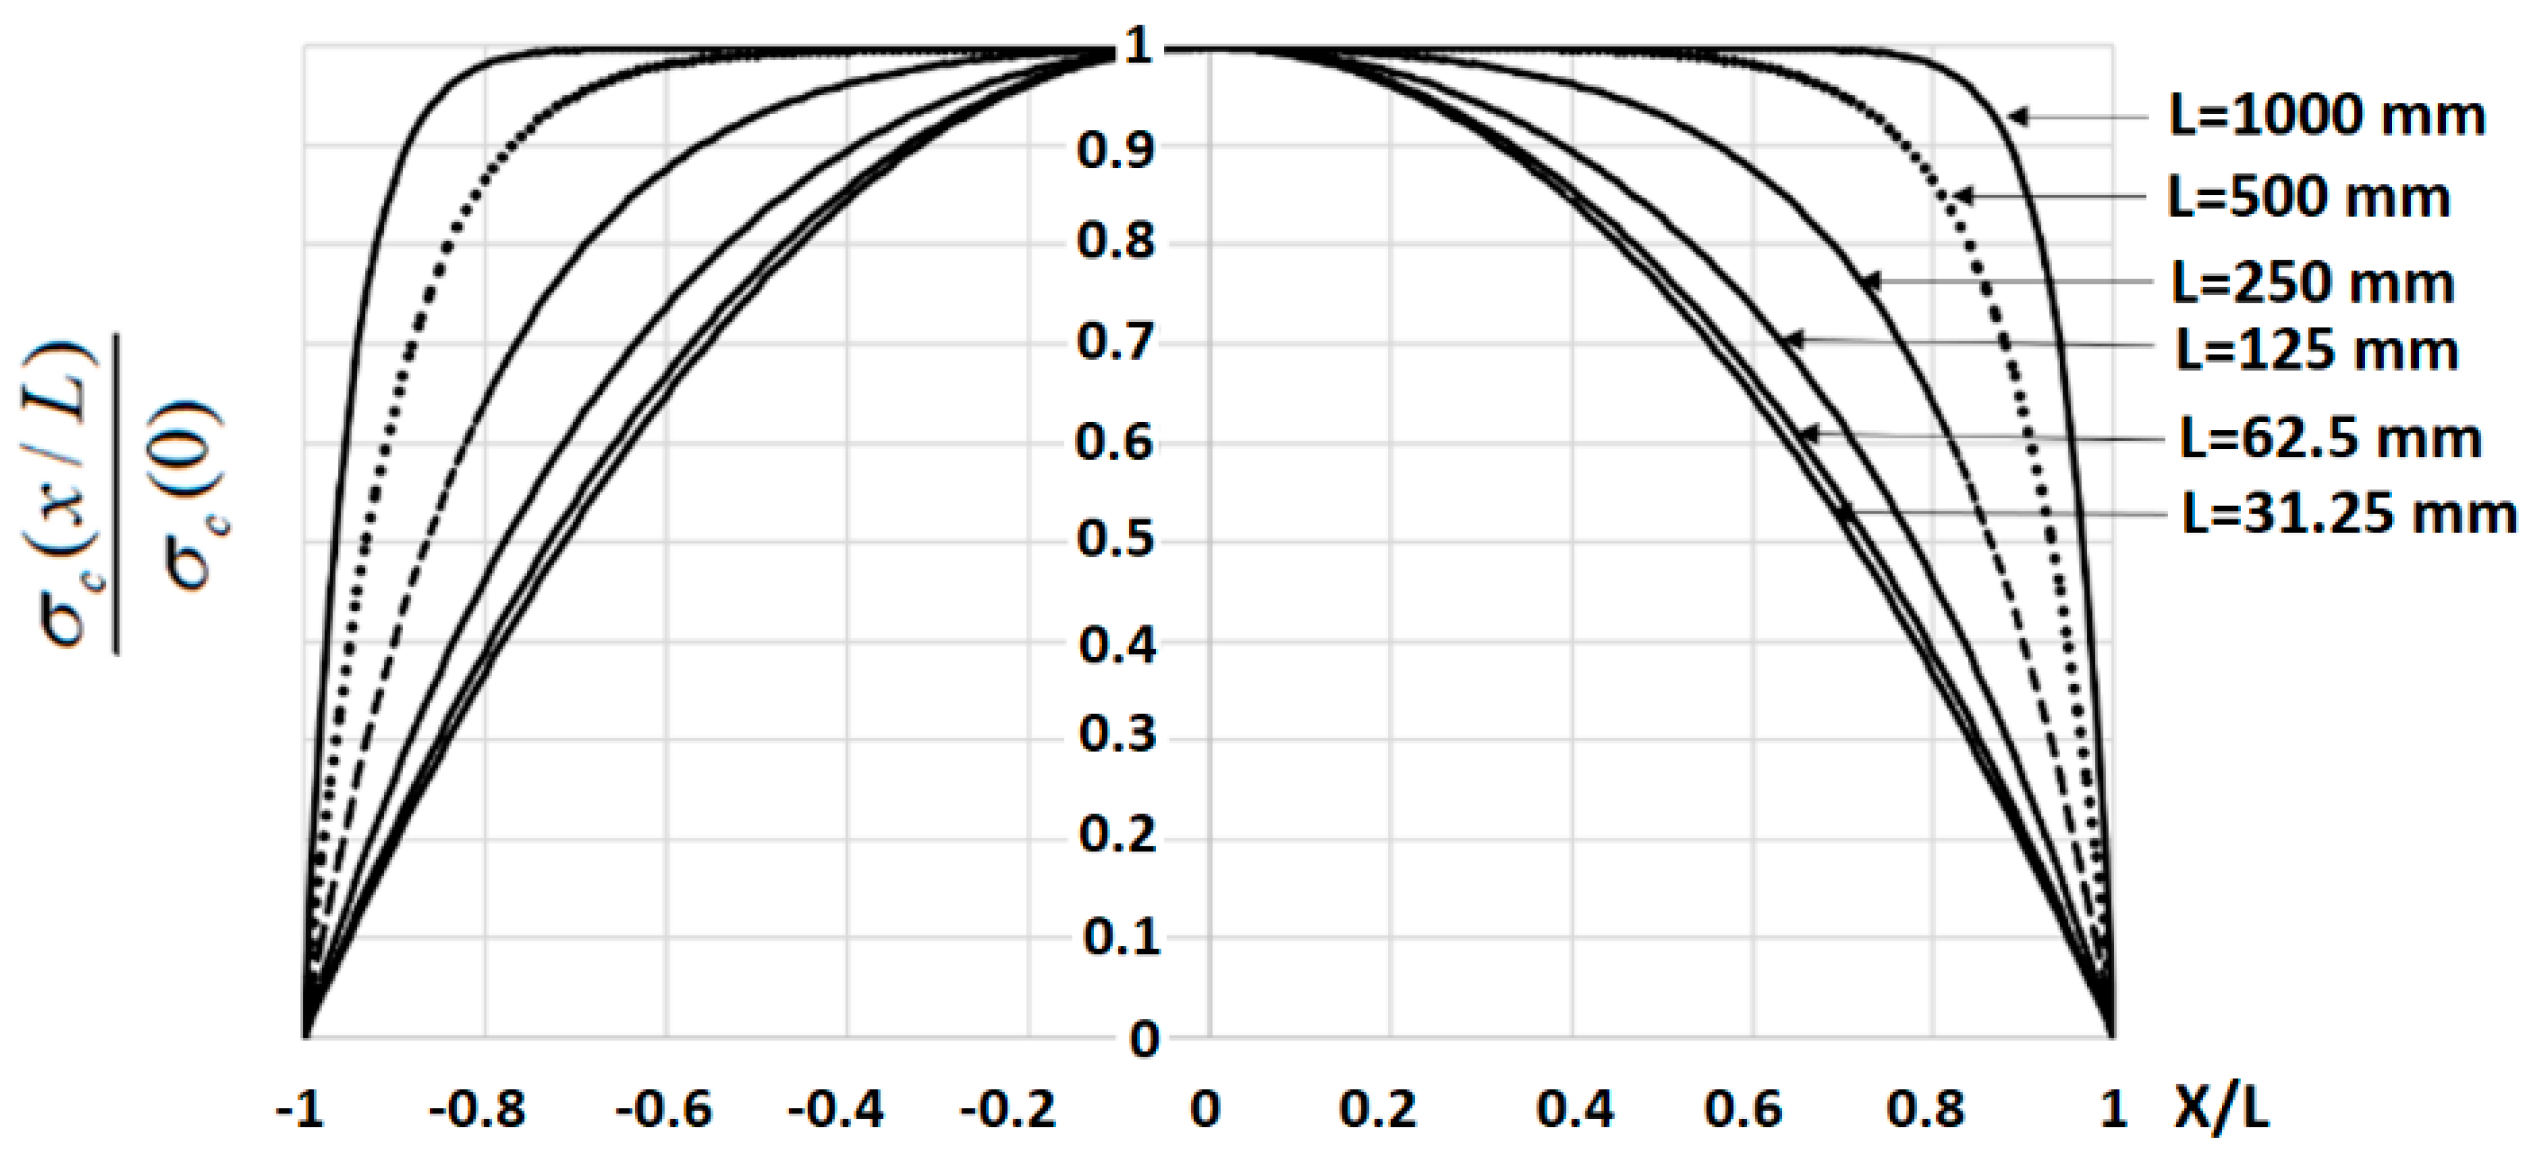
- b.
- Tensile stress in concrete (Equation (35))
3.3.2. Investigation of Governing Parameters
- a.
- Nonlinear bond–slip relationship:
- b.
- Validity of a linear bond–slip model for the present tension stiffening problem:
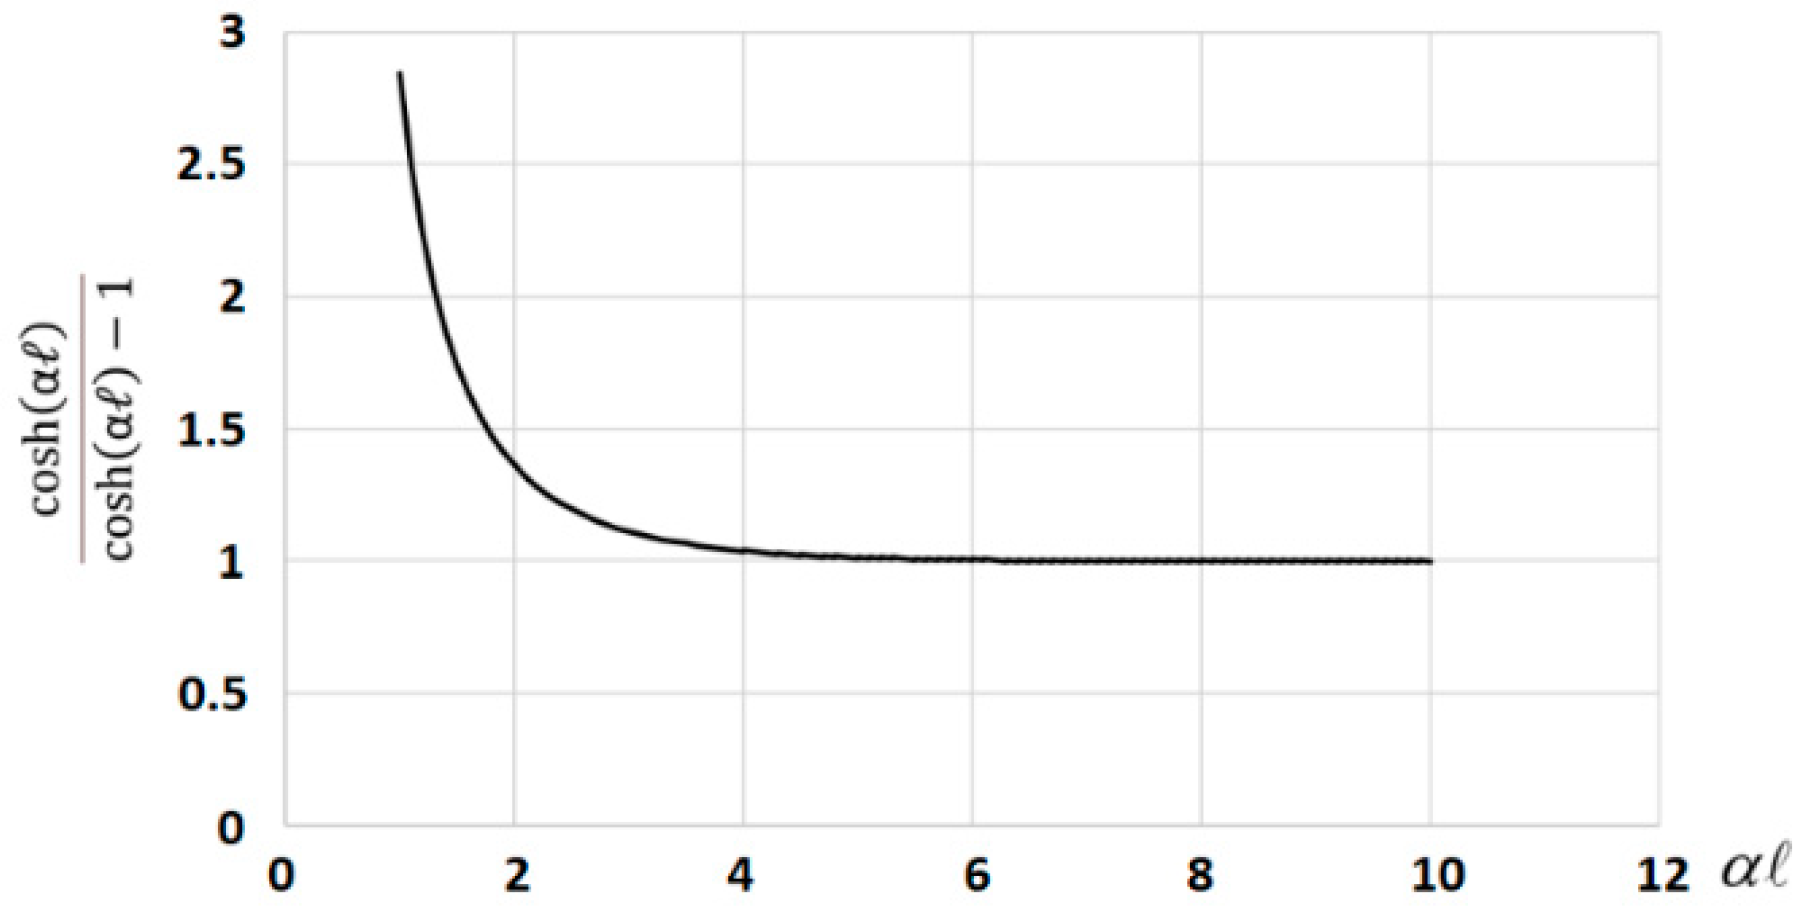
- c.
- Characteristic length α:
3.3.3. Major Characteristics of The tension-Stiffening Problem
- a.
- Shortest distance between cracks:
- b.
- Cracking Load Pcr:
- c.
- Crack widths at the cracking load levels Pcri:
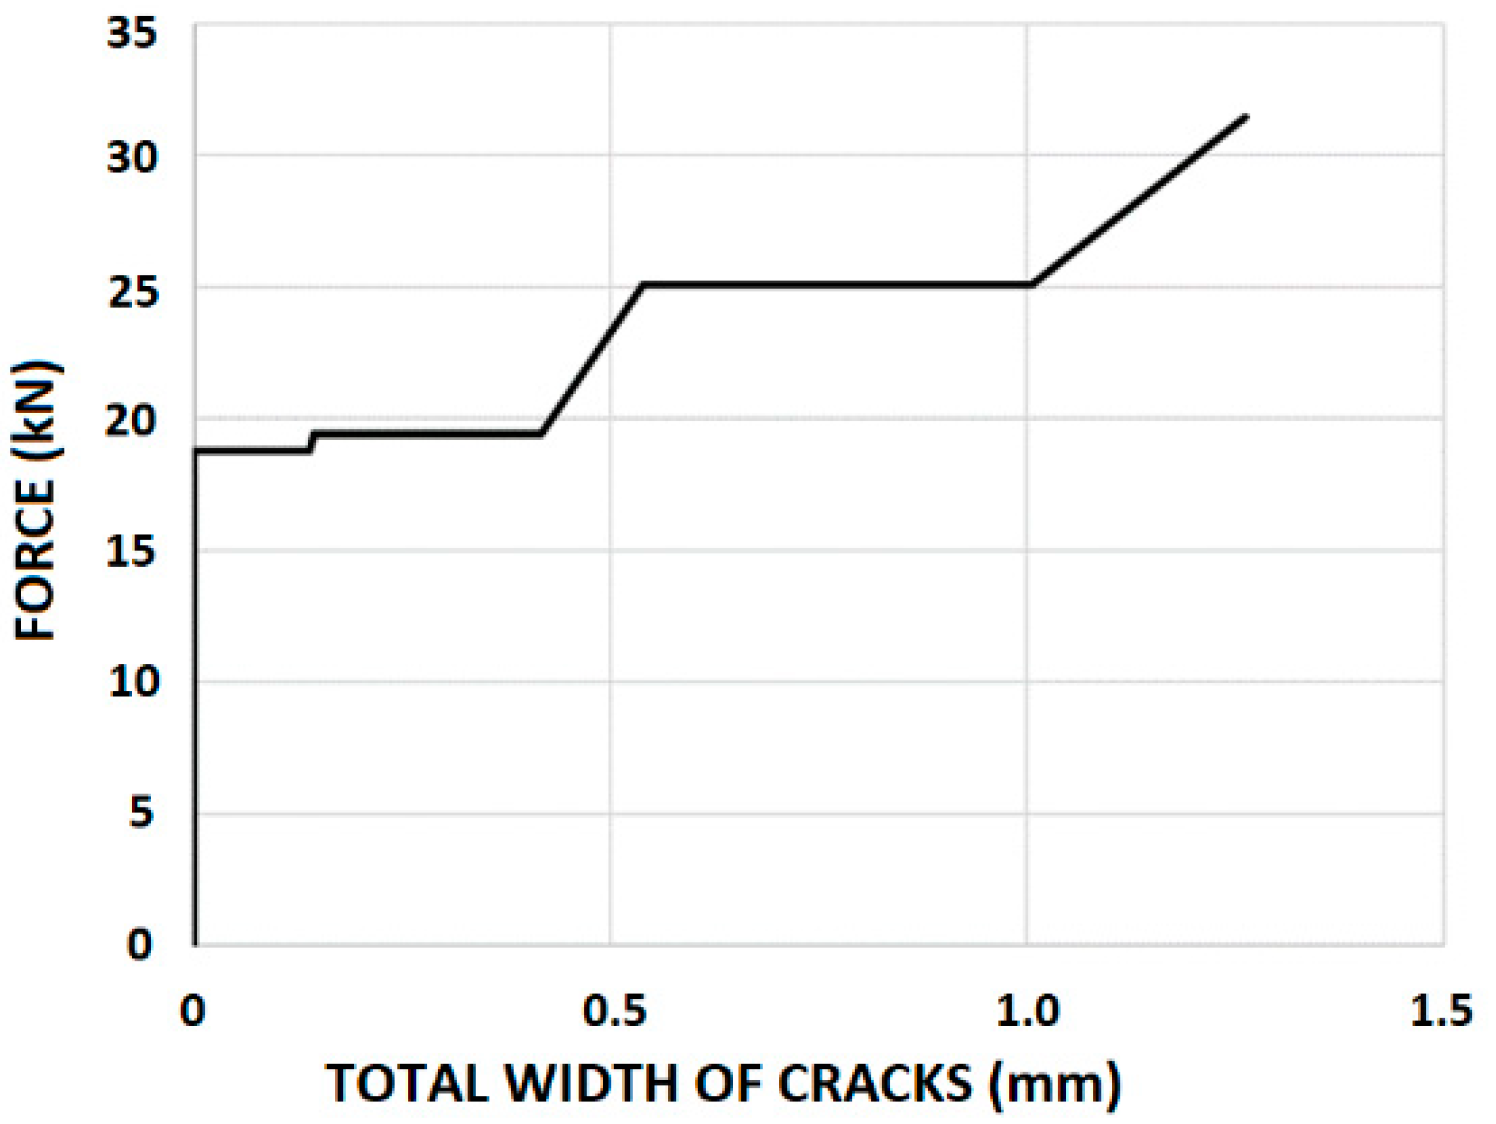
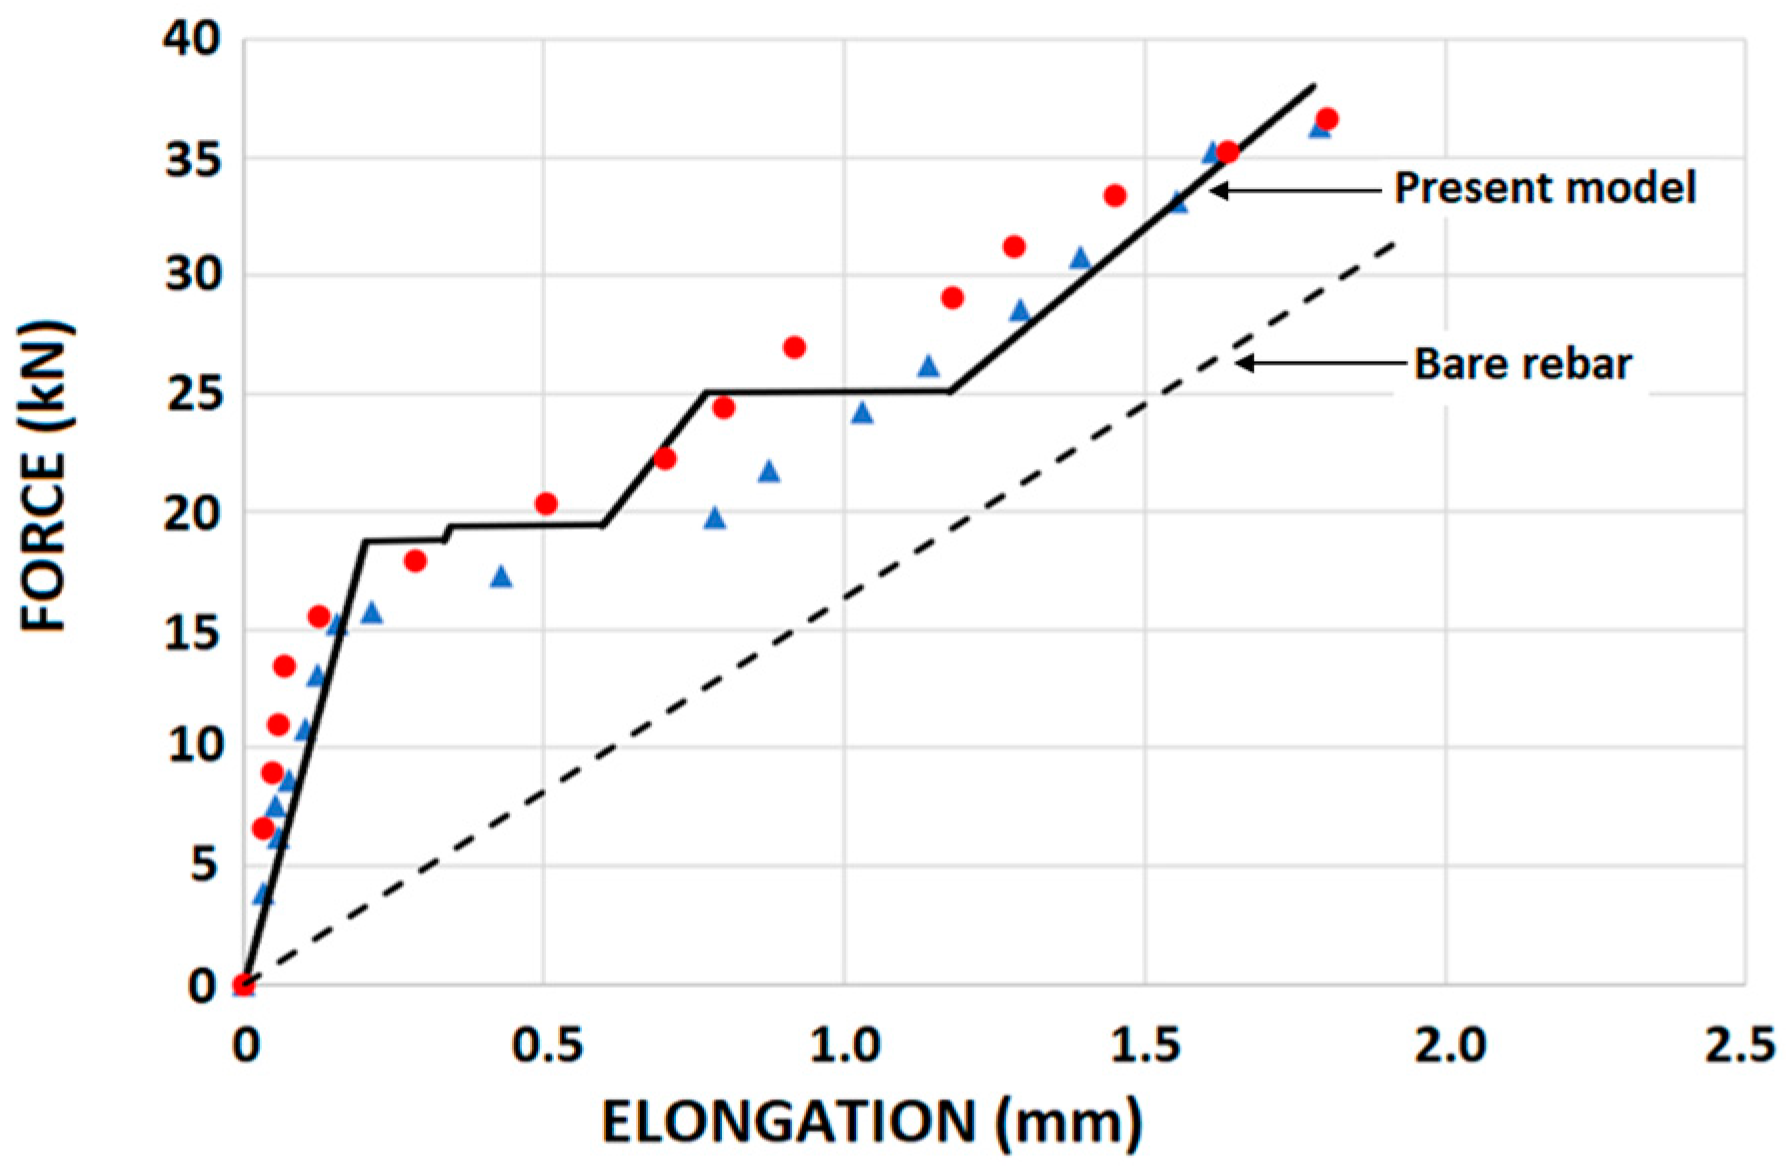
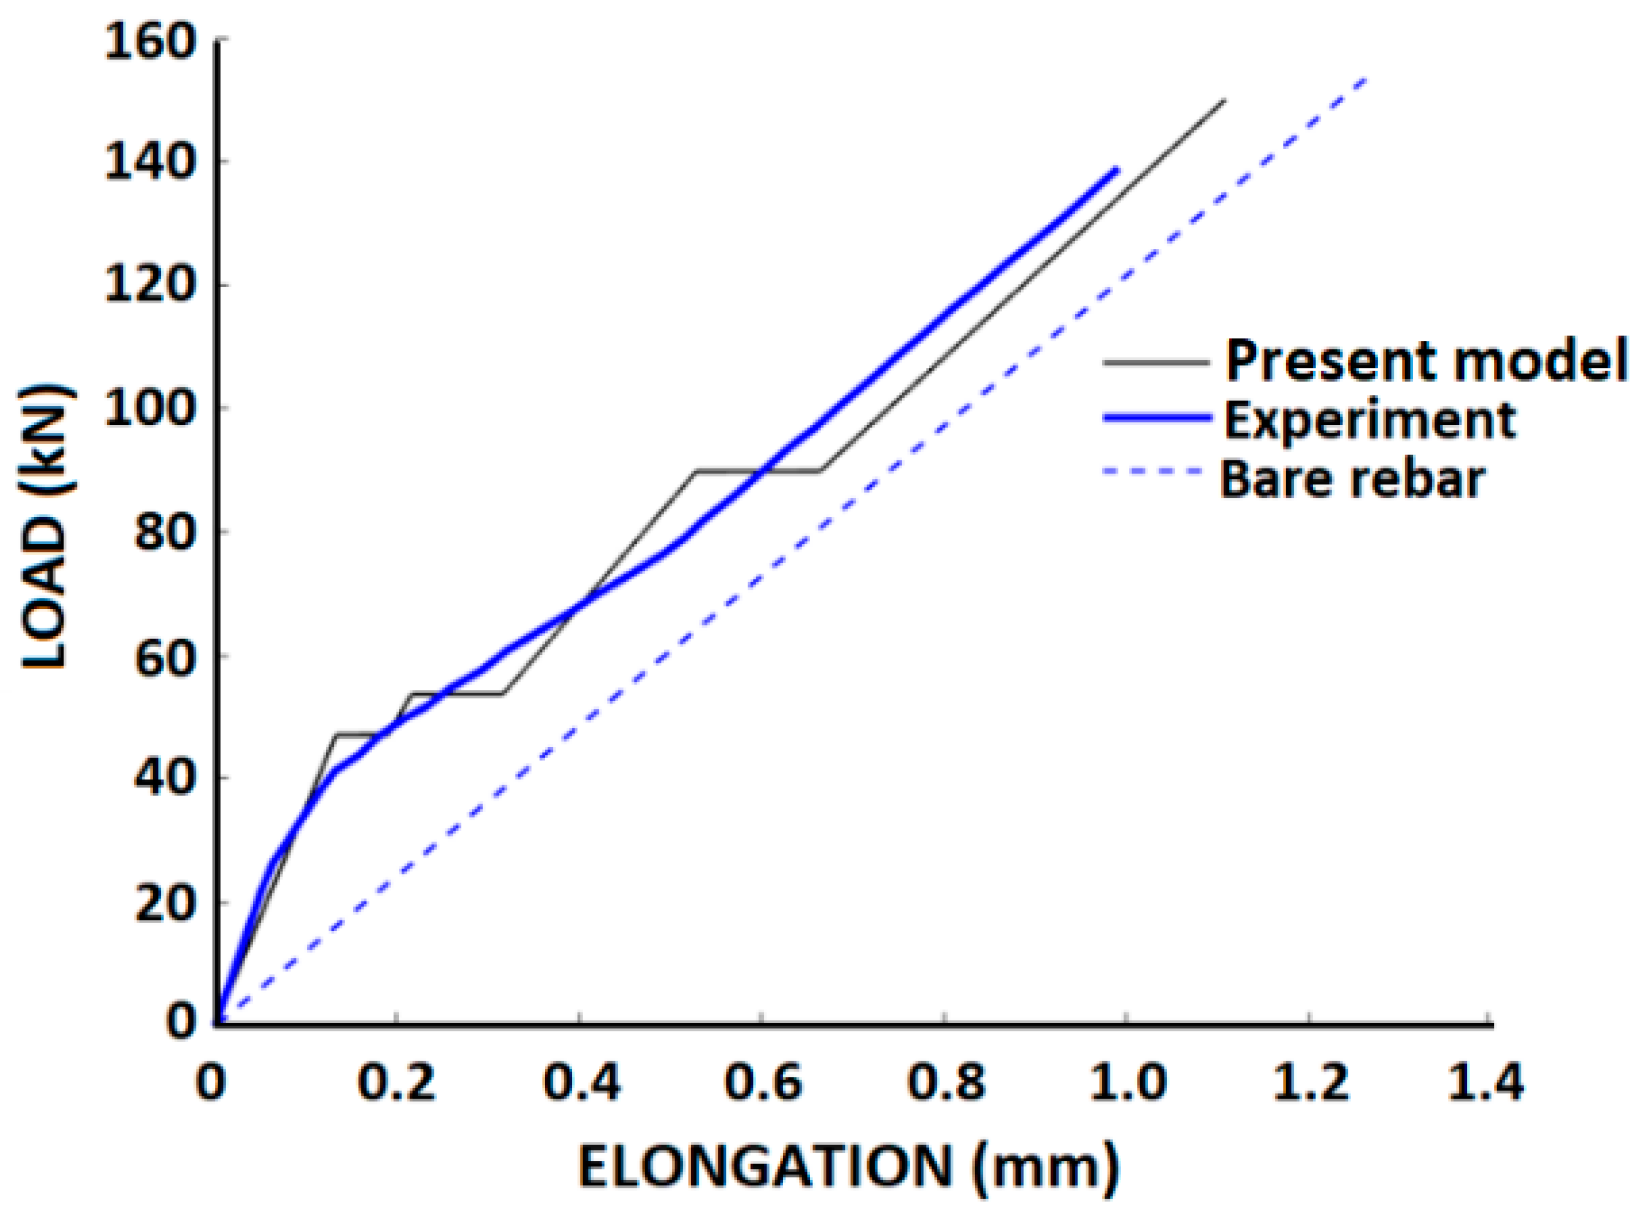
3.3.4. The Force–Elongation Relationship
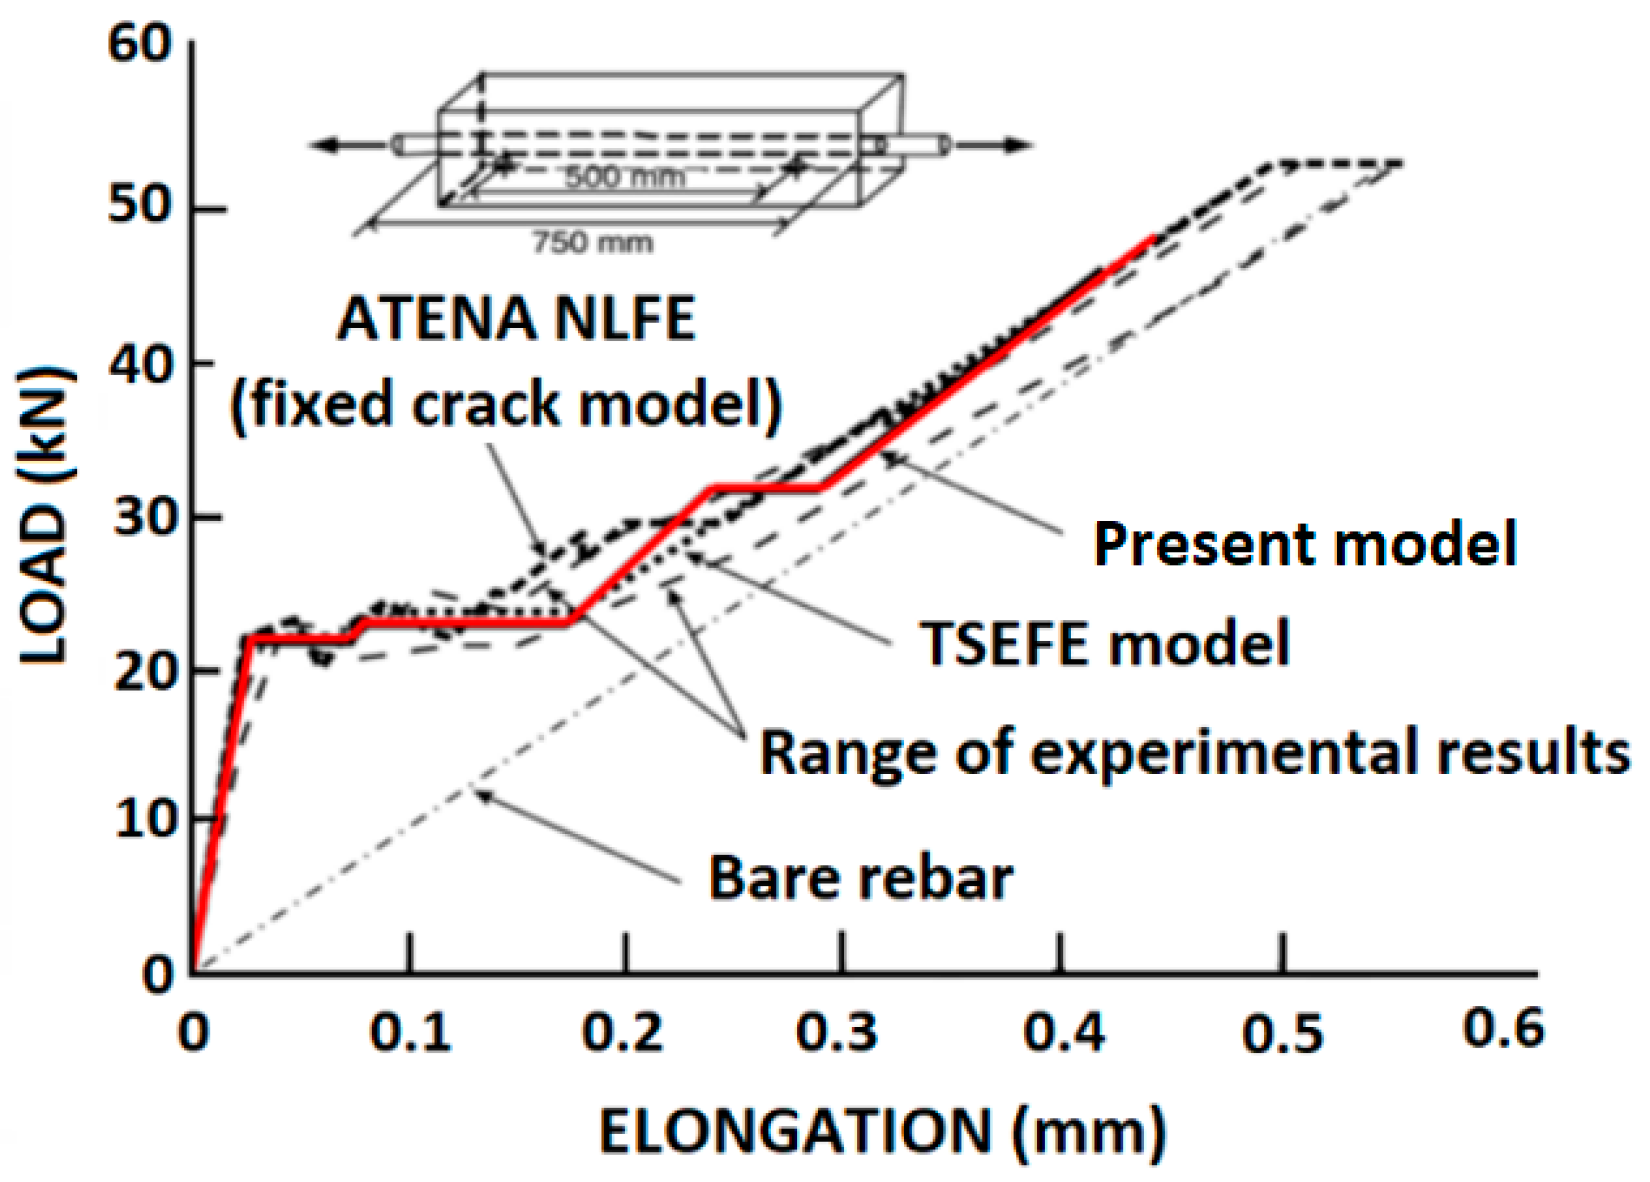
4. Comparisons with Test Data and Analytical Results
4.1. Comparison with Computer Software
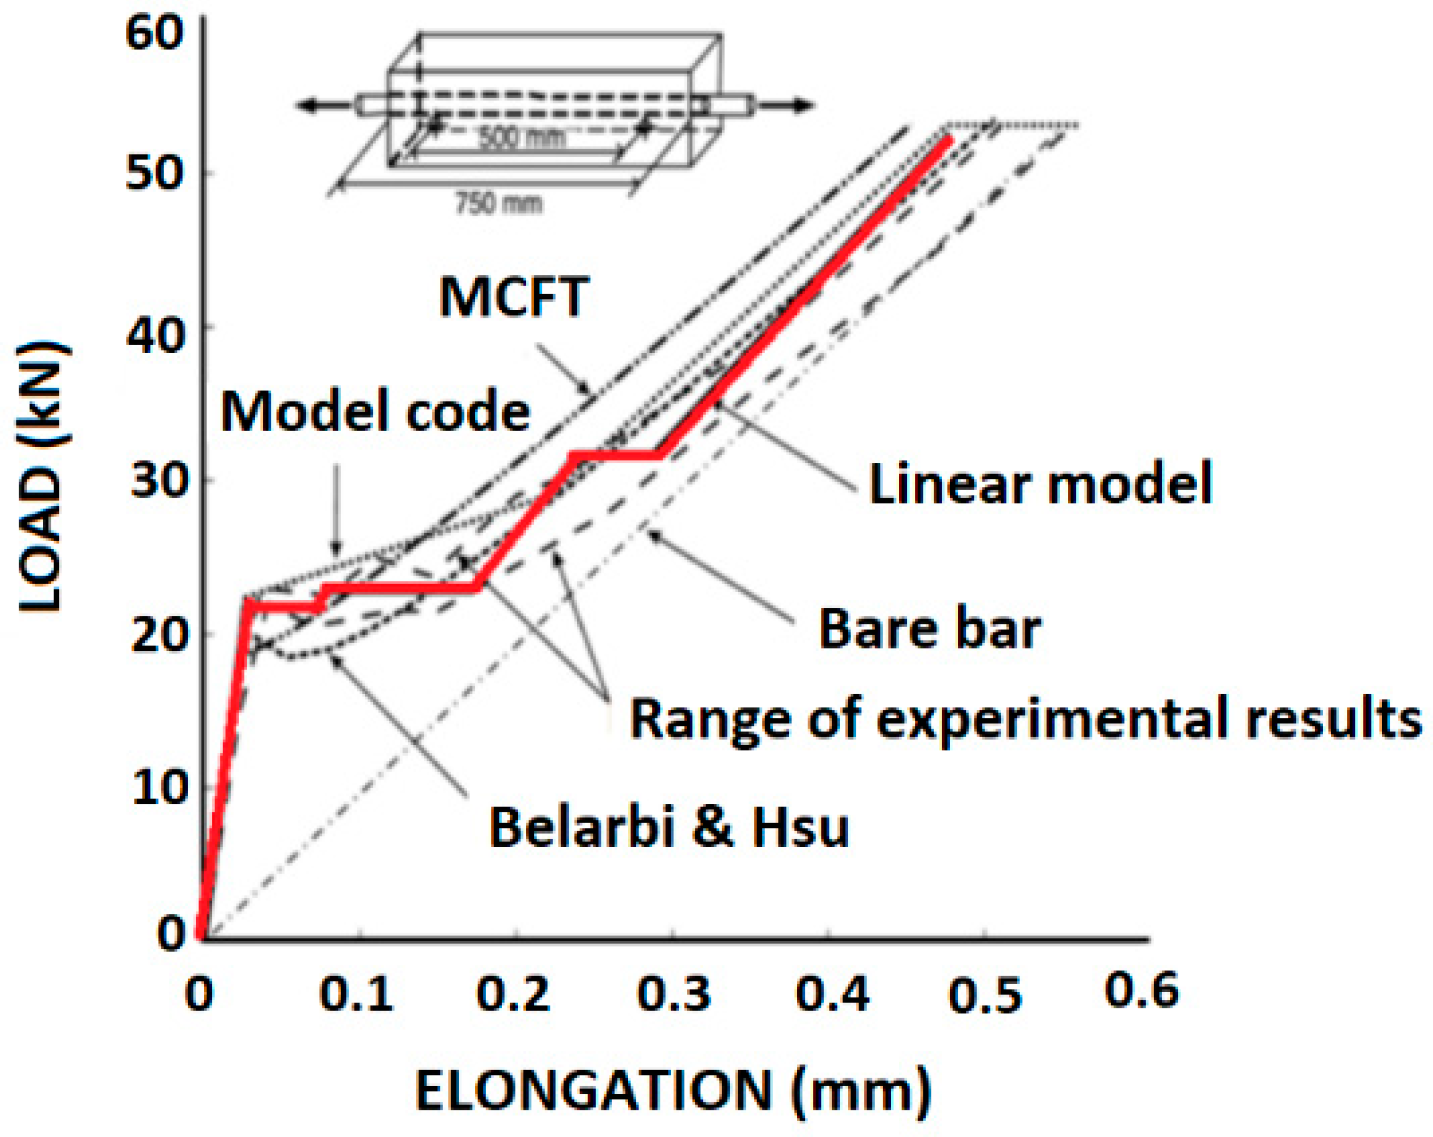
4.2. Concrete Elongation—Comparison with Analytical Methods and Empirical Expressions
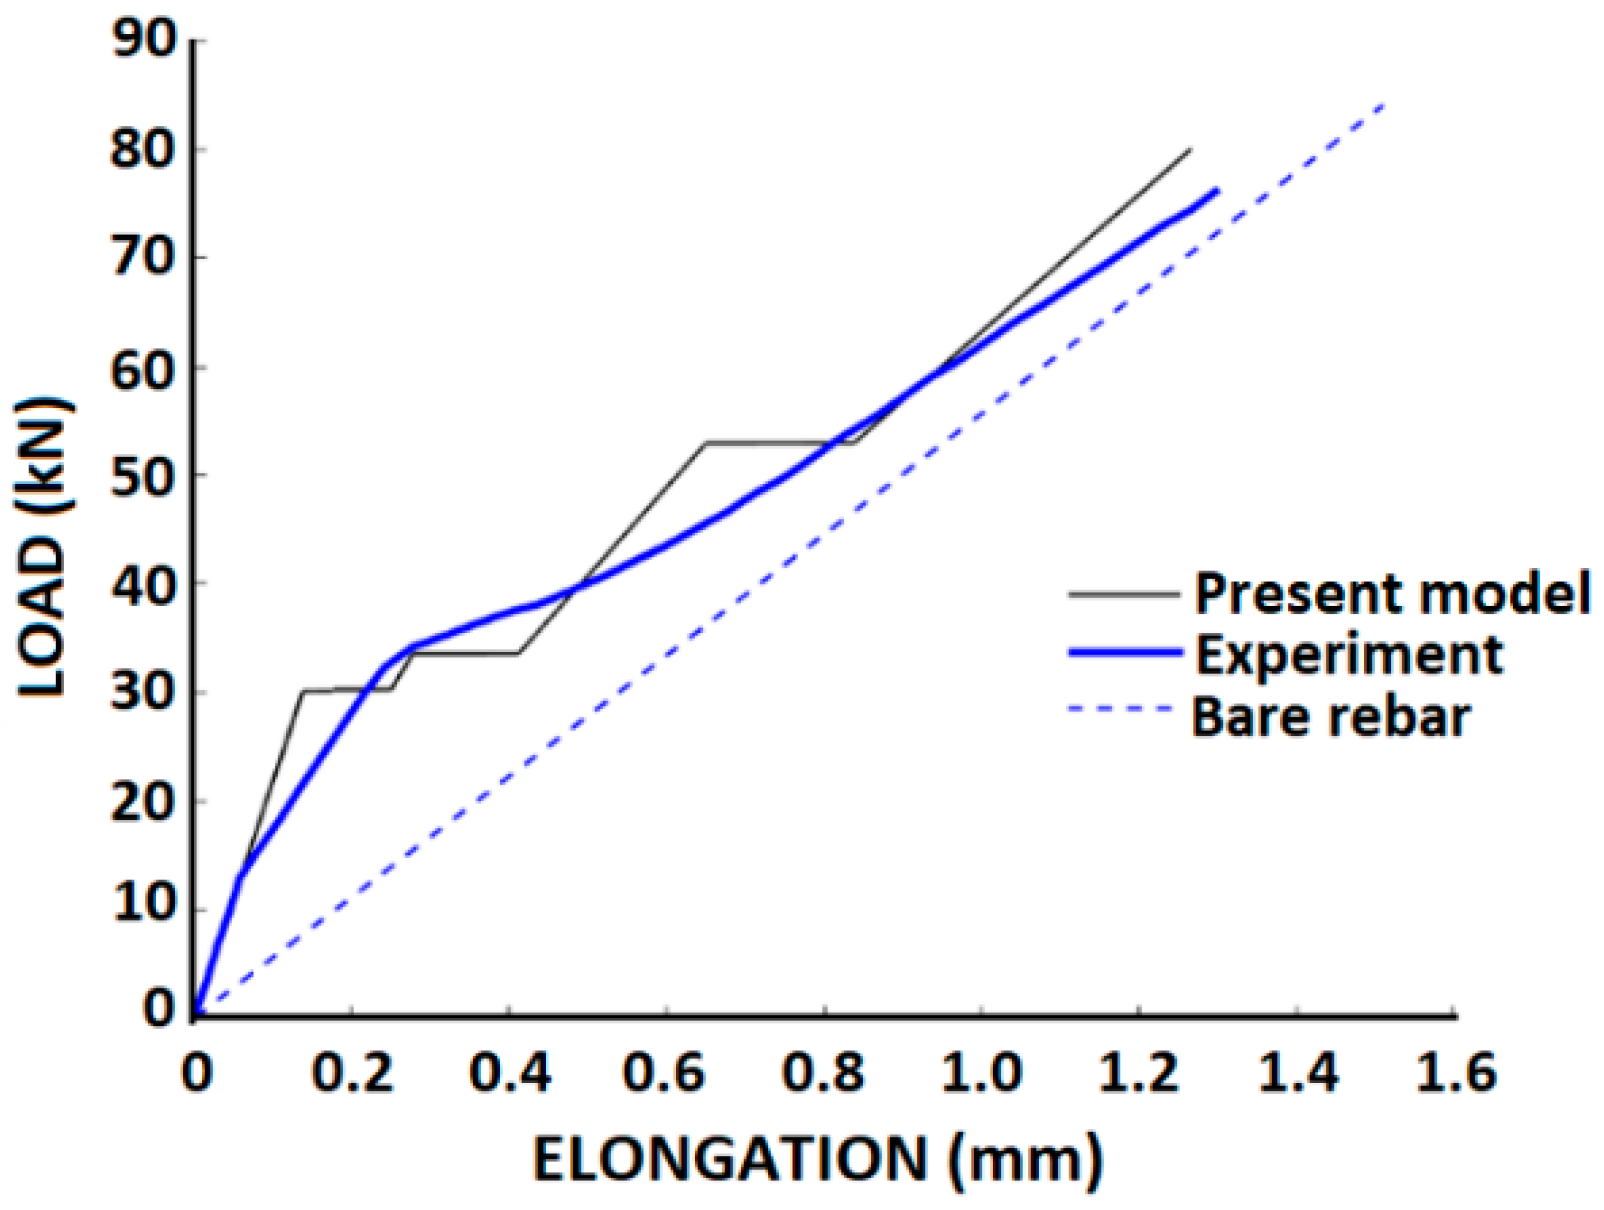
4.3. Comparisons with Tests by Houde and Mirza
5. Summary and Conclusions
Author Contributions
Funding
Institutional Review Board Statement
Informed Consent Statement
Data Availability Statement
Acknowledgments
Conflicts of Interest
References
- Cracking of Concrete Members in Direct Tension. Reported by ACI Committee 224. ACI 224.2R-92. Available online: http://dl.mycivil.ir/dozanani/ACI/ACI%20224.2R-92%20Cracking%20of%20Concrete%20Members%20in%20Direct%20Tension_MyCivil.ir.pdf (accessed on 12 February 2022).
- Fib Model Code for Concrete Structures 2010; Federation International du Beton, Ernst Sohn and Sons: Lausanne, Switzerland, 2013; Available online: https://biblio.ugent.be/publication/4255771 (accessed on 12 February 2022).
- Muttoni, M.; Fernández, R. Concrete Cracking in Tension Members and Application to Deck Slabs of Bridges. J. Bridge Eng. 2007, 12, 646–653. [Google Scholar] [CrossRef] [Green Version]
- Al-Sabah, S.; Sourav, S.N.A.; McNally, C. The post-installed screw pull-out test: Development of a method for assessing in-situ concrete compressive strength. J. Build. Eng. 2021, 33, 101658. [Google Scholar] [CrossRef]
- De Lorenzis, L.; Rizzo, A.; La Tegola, A. A modified pull-out test for bond of near-surface mounted FRP rods in concrete. Compos. Part B Eng. 2002, 33, 589–603. [Google Scholar] [CrossRef]
- Semendary, A.A.; Hamid, W.; Khoury, I.; Steinberg, E.P.; Walsh, K.K. Experimental Investigation of Direct Tension Bond Performance of High-Strength Concrete and Ultrahigh-Performance Concrete Connections. J. Mater. Civ. Eng. 2019, 31, 04019171. [Google Scholar] [CrossRef]
- Yu, X.; Robuschi, S.; Fernandez, I.; Lundgren, K. Numerical assessment of bond-slip relationships for naturally corroded plain reinforcement bars in concrete beams. Eng. Struct. 2021, 239, 112309. [Google Scholar] [CrossRef]
- Kwak, H.-G.; Hwang, J.-W. FE model to simulate bond-slip behavior in composite concrete beam bridges. Comput. Struct. 2010, 88, 973–984. [Google Scholar] [CrossRef]
- Roy, S.; Thiagarajan, G. Nonlinear Finite-Element Analysis of Reinforced Concrete Bridge Approach Slab. J. Bridge Eng. 2007, 12, 801–806. [Google Scholar] [CrossRef]
- Leonhardt, F. Crack Control in Concrete Structures; IABSE Surveys No. S-4/77; International Association for Bridge and Structural Engineering: Zurich, Switzerland, 1977; p. 26. [Google Scholar]
- Cusick, R.W.; Kesler, C.E. Interim Report-Phase 3: Behavior of Shrinkage-Compensating Concretes Suitable for Use in Bridge Decks; T. & A.M. Report No. 409; Department of Theoretical and Applied Mechanics, University of Illinois: Urbana, IL, USA, 1976; p. 41. [Google Scholar]
- United States Department of Transportation. Tensile Bond Strength of a High Performance Concrete Bridge Deck Overlay I-90; United States Department of Transportation: Sturgis, SD, USA, 1999; FHWA MCL Project # 9904.
- Trejo, D.; Aguiniga, F.; Buth, C.E.; Yuan, R.; James, R.W.; Keating, P.B. FRP Reinforcing Bars in Bridge Decks: State of the Art Review; Report No. HWA-01/1520-2; Texas Transportation Institute: Bryan, TX, USA, 2000; pp. 1520–1522. Available online: https://static.tti.tamu.edu/tti.tamu.edu/documents/1520-2.pdf (accessed on 12 February 2022).
- Collins, M.P.; Mitchell, D. Prestressed Concrete Structures; Prentice Hall: Hoboken, NJ, USA, 1991. [Google Scholar]
- Favre, R.; Koprna, M.; Putallaz, J.C. Deformation of Concrete Structures: Theoretical Basis for the Calculation; No. S-16/81; International Association for Bridge and Structural Engineering: Zurich, Switzerland, 1981. [Google Scholar]
- Menegon, S.J.; Wilson, J.L.; Lam, N.T.K.; Gad, E.F. Tension stiffening model for lightly confined reinforced concrete elements. Mag. Concr. Res. 2021, 73, 366–378. [Google Scholar] [CrossRef]
- Russo, G.; Romano, F. Cracking response of RC members subjected to uniaxial tension. J. Struct. Eng. ASCE 1992, 118, 1172–1190. [Google Scholar] [CrossRef]
- Homayoun, H.; Abrishami, H.; Mitchell, D. Influence of splitting cracks on tension stiffening. J. Am. Concr. Inst. ACI 1996, 93, 703–710. [Google Scholar]
- Seema, A.K.T.; Zandonini, R. Finite Element Modeling of Tension Stiffening and Cracking of Reinforced Concrete Components: State of Art. IOP Conf. Ser. Earth Environ. Sci. 2021, 889, 012082. [Google Scholar] [CrossRef]
- Marti, P.; Alvarez, M.; Kaufmann, W.; Sigrist, V. Tension chord model for structural concrete. Struct. Eng. Int. 1998, 8, 287–298. [Google Scholar] [CrossRef]
- Gerstle, W.; Ingraffea, A.R.; Gergely, P. Tension Stiffening: A fracture Mechanics Approach. In Proceedings, International Conference on Bond in Concrete; Applied Science Publishers: London, UK, 1982; pp. 97–106. [Google Scholar]
- Miglietta, P.C.; Grasselli, G.; Bentz, E.C. Finite/discrete element model of tension stiffening in GFRP reinforced concrete. Eng. Struct. 2016, 111, 494–504. [Google Scholar] [CrossRef]
- Kaklauskas, G.; Ramanauskas, R.; Jakubovskis, R. Mean crack spacing modelling for RC tension elements. Eng. Struct. 2017, 150, 843–851. [Google Scholar] [CrossRef]
- Xu, L.Y.; Nie, X.; Zhou, M.; Tao, M.X. Whole-process crack width prediction of reinforced concrete structures considering bonding deterioration. Eng. Struct. 2017, 142, 240–254. [Google Scholar] [CrossRef]
- Stramandinolia, R.S.B.; La Rovereb, H.L. An efficient tension-stiffening model for nonlinear analysis of reinforced concrete members. Eng. Struct. 2008, 30, 2069–2080. [Google Scholar] [CrossRef]
- Kaklauskas, G.; Tamulenas, V.; Bado, M.F.; Bacinskas, D. Shrinkage-free tension stiffening law for various concrete grades. Constr. Build. Mater. 2018, 189, 736–744. [Google Scholar] [CrossRef]
- Bentz, E.C. Explaining the Riddle of Tension Stiffening Models for Shear Panel Experiments. J. Struct. Eng. 2005, 131, 1422–1425. [Google Scholar] [CrossRef]
- Vilanova, I.; Torres, L.; Baena, M.; Llorens, M. Numerical simulation of bond-slip interface and tension stiffening in GFRP RC tensile elements. Compos. Struct. 2016, 153, 504–513. [Google Scholar] [CrossRef]
- Yankelevsky, D.Z. New Finite Element for Bond-Slip Analysis. ASCE J. Struct. Eng. 1984, 11, 1533–1542. [Google Scholar] [CrossRef]
- Yankelevsky, D.Z. A two-phase one-dimensional model for steel concrete interaction. Comput. Struct. 1994, 65, 781–794. [Google Scholar] [CrossRef]
- Yankelevsky, D.Z.; Jabareen, M.; Abutbul, A.D. One-dimensional analysis of tension stiffening in reinforced concrete with discrete cracks. Eng. Struct. 2008, 30, 206–217. [Google Scholar] [CrossRef]
- Yankelevsky, D.Z.; Reinhardt, H.W. Uniaxial behavior of concrete in cyclic tension. ASCE J. Struct. Eng. 1989, 115, 166–182. [Google Scholar] [CrossRef]
- Yankelevsky, D.Z.; Reinhardt, H.W. Response of Plain concrete to cyclic tension. ACI Mater. J. 1987, 84, 365–373. [Google Scholar]
- Leonhardt, F. Cracks and crack control in concrete structures. PCI J. 1988, 33, 124–145. [Google Scholar] [CrossRef]
- Leibovich, O.; Yankelevsky, D.Z.; Dancygier, A.N. Role of internal damage mechanisms in controlling bond-slip behavior in pullout tests in concrete. J. Mater. Civ. Eng. ASCE 2019, 31, 04019284. [Google Scholar] [CrossRef]
- Viwathanatepa, S.; Popov, E.P.; Bertero, V.V. Effect of Generalized Loading on Bond of Reinforcing Bar Embedded in Confined Concrete; Rep. No. UCB/EERC-79/22; Earthquake Engineering Research Centre, University of California: Berkeley, CA, USA, 1979. [Google Scholar]
- Soroushian, P.; Choi, K.B.; Park, G.H.; Aslani, F. Bond of deform bars to concrete: Effects of confinement and strength of concrete. ACI Mater. J. 1991, 88, 227–232. [Google Scholar]
- Leibovich, O.; Yankelevsky, D.Z. Nonlinear features of the bond-slip ascending branch. ASCE J. Mater. Civ. Eng. 2020, 32, 4020279. [Google Scholar] [CrossRef]
- Wollrab, E.; Kulkarni, S.M.; Ouyang, C.; Shah, S.P. Response of reinforced concrete panels under uniaxial tension. ACI Struct. J. 1996, 93, 648–657. [Google Scholar]
- Rizkalla, S.H.; Hwang, L.S.; Shahawi, M.E. Transverse reinforcement effect on cracking behaviour of R.C. members. Can. J. Civ. Eng. 1983, 10, 566–581. [Google Scholar] [CrossRef]
- Hartl, G. Die Arbeitlinie Eingebetete Staehle Bei Erst und Kurz-Belastung. Ph.D. Thesis, Innsbruck University, Innsbruck, Austria, 1977. [Google Scholar]
- ATENA Program Documentation-Part 3-1; Example Manual; Cervenka Consulting: Prague, Czech Republic, 2020.
- Vecchio, F.J.; Collins, M.P. The Modified compression field theory for reinforced concrete elements subjected to shear. ACI J. 1986, 83, 219–231. [Google Scholar]
- Belarbi, A.; Hsu, T.T.C. Constitutive laws of softened concrete in biaxial tension-compression. ACI Struct. J. 1995, 92, 562–573. [Google Scholar]
- Chan, H.C.; Cheung, Y.K.; Huang, Y.P. Crack analysis of reinforced concrete tension members. J. Struct. Eng. ASCE 1992, 118, 2118–2132. [Google Scholar] [CrossRef]


| A [MPa/mm] | 50 | 100 | 150 | 200 |
|---|---|---|---|---|
| Ds [mm] | ||||
| 8 | 0.011 | 0.016 | 0.019 | 0.027 |
| 10 | 0.010 | 0.014 | 0.017 | 0.020 |
| 12 | 0.009 | 0.013 | 0.016 | 0.018 |
| 14 | 0.008 | 0.012 | 0.015 | 0.017 |
| 16 | 0.008 | 0.011 | 0.014 | 0.016 |
| 18 | 0.007 | 0.010 | 0.013 | 0.015 |
| 20 | 0.007 | 0.010 | 0.012 | 0.014 |
| Cracking Load Level i | Pcri (kN) | |||
|---|---|---|---|---|
| (1) | (2) | (3) | (4) | (5) |
| 1 | L | 381 | 1.0005 | 18.78 |
| 2 | L/2 | 190.5 | 1.0337 | 19.40 |
| 3 | L/4 | 95.25 | 1.3357 | 25.07 |
| Stage | Length ℓ | Scheme | |
|---|---|---|---|
| 1 | 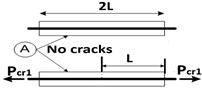 | ||
| 2 | ℓ = L | ||
| 3 | ℓ = L/2 | 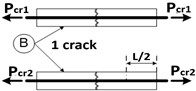 | |
| 4 | ℓ = L/2 | ||
| 5 | ℓ = L/4 |  | |
| 6 | ℓ = L/4 | ||
| 7 | ℓ = L/8 | 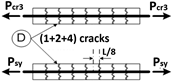 | |
| 8 | ℓ = L/8 |
Publisher’s Note: MDPI stays neutral with regard to jurisdictional claims in published maps and institutional affiliations. |
© 2022 by the authors. Licensee MDPI, Basel, Switzerland. This article is an open access article distributed under the terms and conditions of the Creative Commons Attribution (CC BY) license (https://creativecommons.org/licenses/by/4.0/).
Share and Cite
Yankelevsky, D.Z.; Karinski, Y.S.; Feldgun, V.R. Analytical Modeling of Crack Widths and Cracking Loads in Structural RC Members. Infrastructures 2022, 7, 40. https://doi.org/10.3390/infrastructures7030040
Yankelevsky DZ, Karinski YS, Feldgun VR. Analytical Modeling of Crack Widths and Cracking Loads in Structural RC Members. Infrastructures. 2022; 7(3):40. https://doi.org/10.3390/infrastructures7030040
Chicago/Turabian StyleYankelevsky, David Z., Yuri S. Karinski, and Vladimir R. Feldgun. 2022. "Analytical Modeling of Crack Widths and Cracking Loads in Structural RC Members" Infrastructures 7, no. 3: 40. https://doi.org/10.3390/infrastructures7030040
APA StyleYankelevsky, D. Z., Karinski, Y. S., & Feldgun, V. R. (2022). Analytical Modeling of Crack Widths and Cracking Loads in Structural RC Members. Infrastructures, 7(3), 40. https://doi.org/10.3390/infrastructures7030040