Article

Application of a Non-Invasive Technique for the Preservation of a Fortified Masonry Tower

by
Ersilia Giordano
1,*,
Laura Marcheggiani
2,
Antonio Formisano
3 and
Francesco Clementi
1
1
Department of Civil and Building Engineering, and Architecture, Polytechnic University of Marche, Via Brecce Bianche 12, 60131 Ancona, Italy
2
Enea—Italian National Agency for New Technologies, Energy and Sustainable Economic Development, Bologna Research Centre, Via Martiri di Monte Sole 4, 40129 Bologna, Italy
3
Department of Structures for Engineering and Architecture, University of Naples Federico II, Piazzale Tecchio 80, 80125 Naples, Italy
*
Author to whom correspondence should be addressed.
Infrastructures 2022, 7(3), 30; https://doi.org/10.3390/infrastructures7030030
Submission received: 26 January 2022 / Revised: 16 February 2022 / Accepted: 23 February 2022 / Published: 24 February 2022

Abstract

:
The Cultural heritage spread all over the World needs to be preserved with systems that do not compromise its architectural and historical value. Nowadays, the most advanced technology available is the ambient vibration test. It allows to obtain the current frequencies, modal shapes, and damping of structures, without being invasive. The comparison between different monitoring campaigns and their use in combination with Finite Element models can give an insight into the state of structures’ health. This paper presents two ambient vibration tests performed on a fortified masonry tower in the Marche region of Italy, carried out after one year each other, with different temperature and humidity conditions. To extract the structure’s dynamic parameters both a time and a frequency domain approaches were used. The comparison between the parameters obtained during the two experimental campaigns showed similar frequencies and modal shapes underlining that no damage occurred and that the dynamic response of the tower does not suffer temperature and humidity variations. In addition, the steps carried out for a first attempt manual calibration of the tower’s Finite Element model are shown. The match between the numerical model and the experimental data is evaluated through the absolute frequencies’ errors and the Modal Assurance Criteria between the modal vectors. The calibrated numerical model can be used for future and accurate assessment of the tower’s structural capacity.

1. Introduction

The conservation of heritage constructions is at day one of the most debated topics in scientific literature. These structures represent a legacy, but also an issue, for the Countries that own them. Indeed, since their preservation requires a large amount of money, many of them are in a state of abandonment.
The first studies on heritage buildings concerned the identification of the best numerical models capable to catch their structural response [1,2]. These structures often have complex geometry that cannot be simplified with the conventional models, such as equivalent frames. The currently most adopted approach is the macro-modeling one with the Finite Element Method (FEM), where their geometry is accurately reproduced and discretized with 3D elements [3,4,5,6]. In the FEM the material is considered isotropic and homogeneous, and the nonlinear behaviour is simulated with Total Strain Crack (TSC) [7] or Concrete Damage Plasticity (CDP) [8,9] models. Another modeling technique that caught on is the Discrete Element Method (DEM) [10,11,12]. In the DEM the structural geometry is reproduced as an assembly of blocks. The blocks can be deformable or rigid [13] and their interactions are ruled by contact laws [14,15]. The FEM and DEM used jointly allow to have an overview of both global and local mechanisms that can develop on these structures [16,17,18].
Even if these are sophisticated approaches, they often overestimate or underestimate the structures’ capacity, since there are many uncertainties on the material composition, state of degradation, and historical evolution. To fill these gaps, invasive and extensive tests are commonly employed. However, the historical and architectural value of cultural heritage encourages investing in fewer invasive techniques. The best approach available nowadays is the Structural Health Monitoring (SHM) [19,20,21]. It consists on the evaluation of possible damage in structures controlling periodical or in real-time various parameters, such as stress, strain, temperatures and humidity [22]. It is performed using wired or not wired sensors, acquisition systems and personal computers. It needs an initial observation to compare any changes. In the structural field the SHM is normally performed under the operation condition using accelerometric and environmental sensors. The data recorded by the accelerometers, after being cleaned and processed, give back the dynamic parameters of the structures, like frequencies, modal shapes, and damping. Being the dynamic parameters strictly connected to the actual behaviour of the structure, any change of them can underline a loss of stiffness or mass representative of damage [23,24,25,26]. Ambient sensors are instead used to remove frequencies oscillation connected with humidity and temperature variations. This latter is the parameter that produces the greater frequencies variation. Researchers found that in masonry structures the increase of temperature produces an increment of frequencies since the thermal material expansion closes the micro-cracks [27]. An inverse behavior was observed when structures are reinforced with metallic elements. The high temperature extends them reducing their confinement effect [28].
The collected data may be used to implement numerical models coherent with the real behaviour. The procedure concerns updating the materials’ parameters, the boundary conditions, and the soil-structure interaction of the FEM until the results of the eigenvalue analysis do not match the recorded data. This operation can be done manually [29,30] or automatically [31,32,33]. When the studies concern large structures the second method is preferred. The automatic approach allows the management of several uncertain parameters thus obtaining a better match between numerical and real data. The automatic updating is carried out using objective functions. Since these can have several local minima to find the correct solution global minimization methods, such as Genetic Algorithms, Couple Local Minimizer, and simulated annealing, are necessary [34,35].
The updated FEM model can be used to perform accurate analyses, to identify the more vulnerable zones, or as a starting scenario for future monitoring.
This paper shows the short-term SHM and the FEM update of a fortified Tower in the Marche Region, central Italy (Figure 1a). The tower, which represents the symbol of Cagli village, is proof of the XIV century military architecture (Figure 1b). For these reasons is important to find a system able to control its health state.
The paper is organized as follows. Section 2 shows the historical, geometrical, and material surveys of the case study. In Section 3 the two ambient vibration tests with the procedure to obtain the dynamic parameters are presented. The two monitoring tests were carried out to identify possible variations in the tower’s dynamic. At last, Section 4 describes the steps that allowed to obtain a numerical model able to match the experimental data. In the end, specific conclusions are deduced.

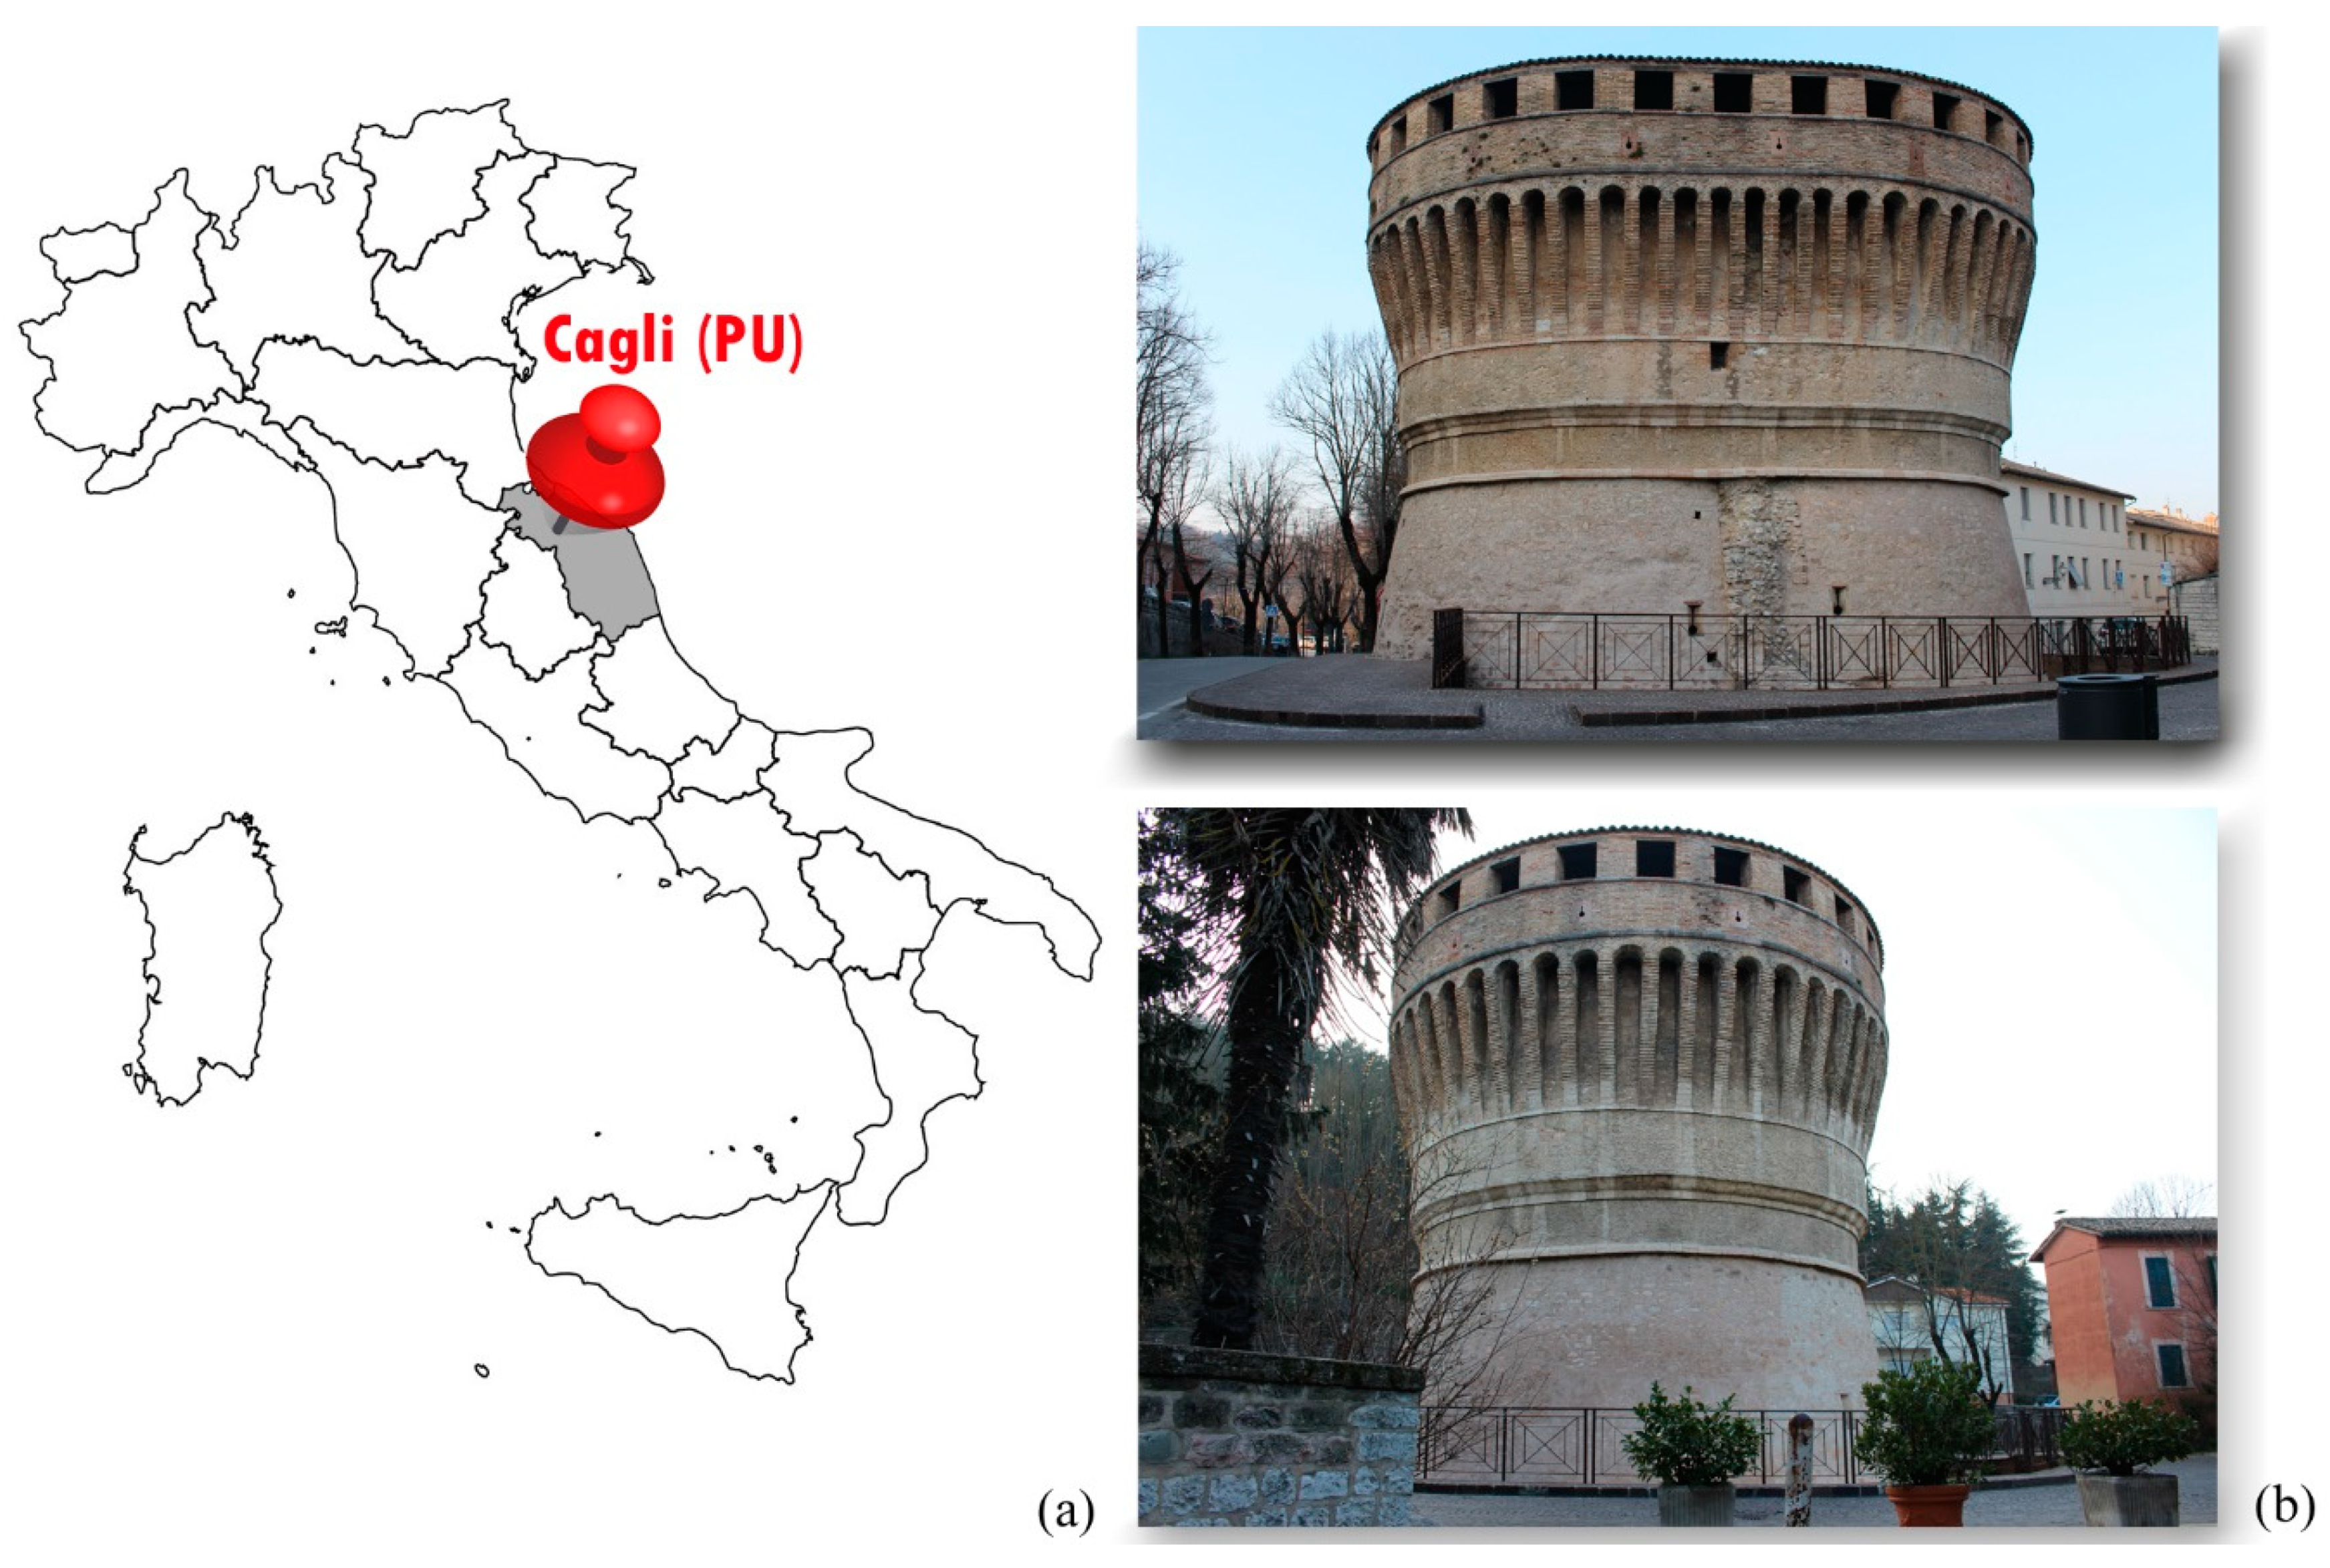
2. The Fortified Tower of Cagli

2.1. Historical Survey

Based on the information collected by historical documents, the erection of the tower took place between 1481 and 1487. The construction arose from the will of Francesco di Montefeltro to build fortresses to defend his duchy from his enemies. He commissioned the architect Francesco di Giorgio Martini to design a tower to protect Cagli’s territory. The architect designed a defensive system composed of protective walls, a fortress, and a fortified tower. The stronghold placed on the Capuccini’s hill allowed to control the village and the valleys all around. The tower, that was built at the hill base near the village, was incorporated in the defensive walls and connected to the fortress with a secret tunnel. During the years, it attended the succession of different wartime events. The most important one occurred between 1516–1519 when the Medici invaded the Urbino duchy. Throughout its life, the structure changed its functions several times. In 1662 it was used as a washhouse. In the first years of the XVII century, the moat that enclosed the tower was buried and many structures were built around it, including a slaughterhouse. During this period the tower was used as storage for drying leather. For this purpose, four rooms were created on the last floor, building radial partition walls, and new openings on central walls were created. In 1897, it was proposed to use the tower as a prison. However, this last change of use was never realized due to the opposition of the Regional office for the heritage construction conservation. In the XX Century, the washhouse, the slaughterhouse, and the four rooms on the last floor were demolished. In 1973 started the restoration interventions with the cleaning of the inner rooms. In 1985 consolidation interventions of the north-west side were done under the project of Stefano Marchegiani. Between 1987 and 1989 the roof and the tunnel that connects the tower with the fortress were also restored. The most recent interventions occurred in 2002 and 2008. To date, the tower is used as a contemporary sculpture museum.

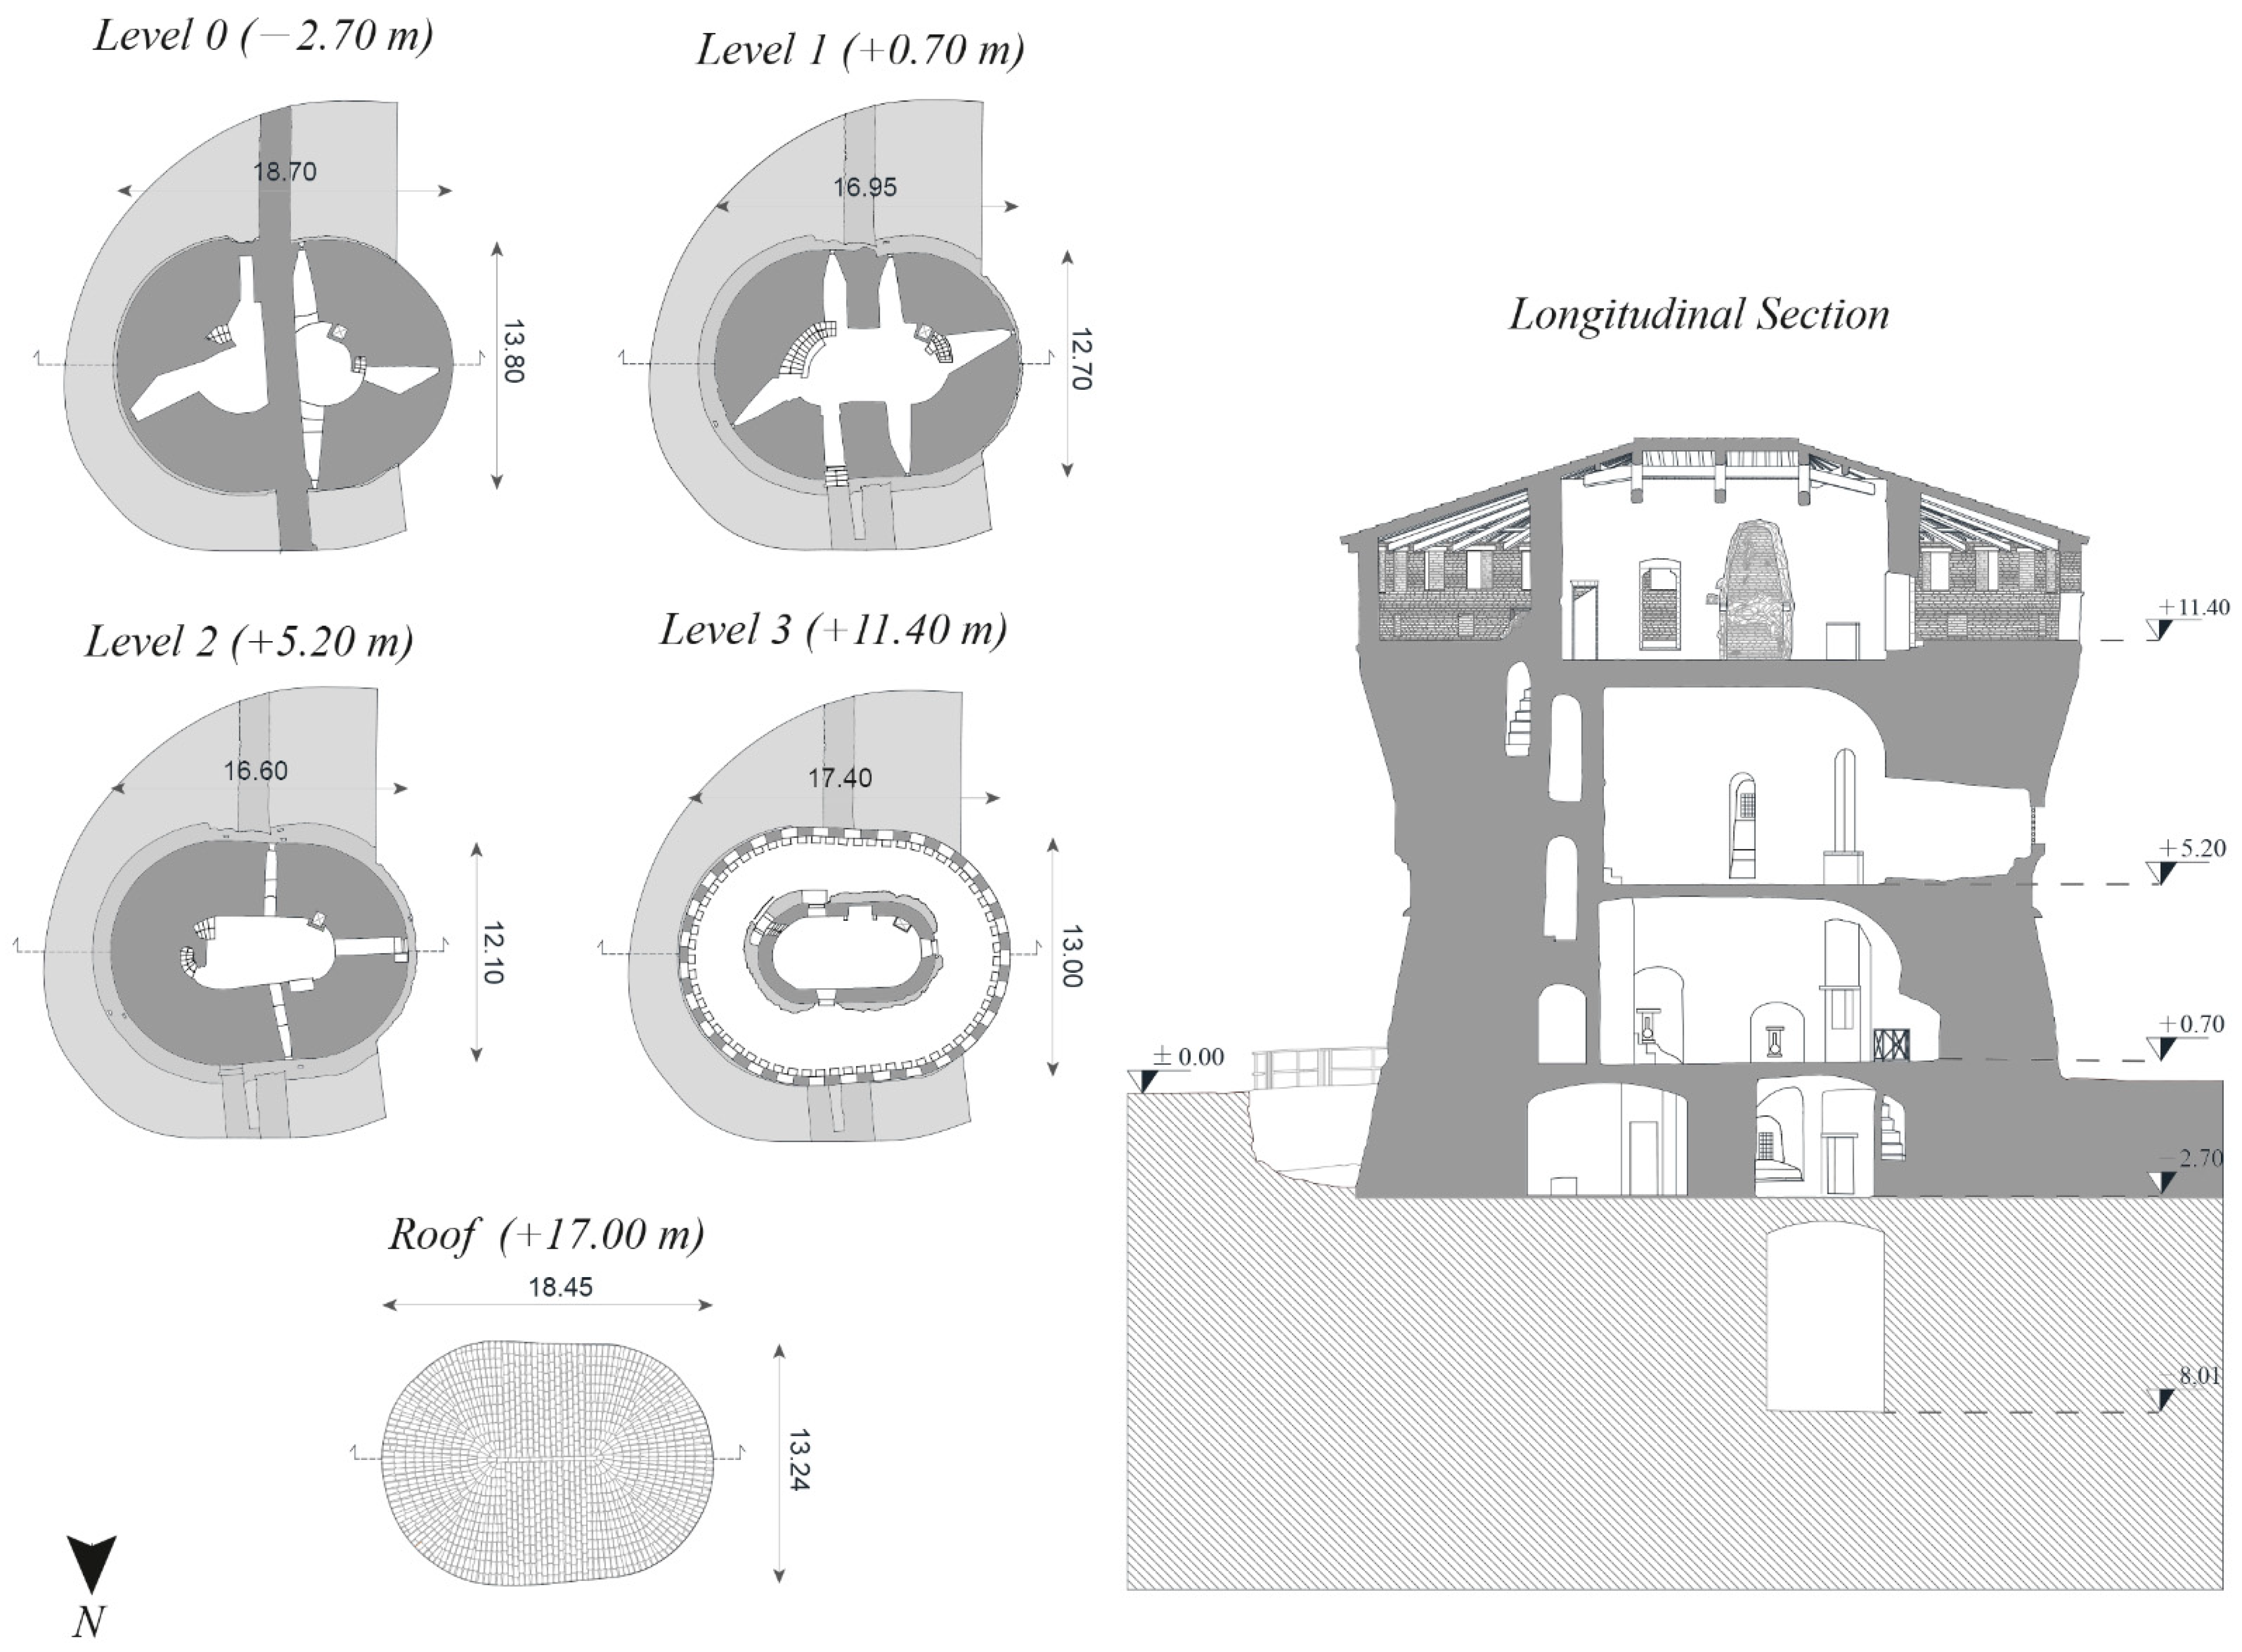
2.2. Geometrical Survey

The structure has an hourglass shape with an elliptical horizontal cross-section (Figure 2). The extremity plans have the major and the minor axis sized about 18.50 m and 13.50 m, respectively, whereas the minor and the major axis of the central section measure 16.60 m and 12.10 m, respectively. The tower consists of four floors connected with circular masonry stairs, for a total height of 17 m. The lower floor, partially underground, has two circular rooms (Figure 2). The east room has three army posts, meanwhile, in the other, there is the hidden tunnel that linked the structure to the fortress. Under the first room, there is a water tank dig on the rock. The ground level has a single room with five army posts and a little door for entrance. The second floor has an elliptic plan shape, as the ground story, and three narrow openings. The last floor has a perimeter gallery formed by twenty-nine windows. All the rooms are covered with masonry vaults except for the last floor, which has a wooden roof. This roof is supported in the central room by three wooden trusses and in the gallery by joists. Externally is visible a masonry realized with rough stones until a quote of +7.36 m followed by the remaining height by solid clay bricks masonry (Figure 1b).

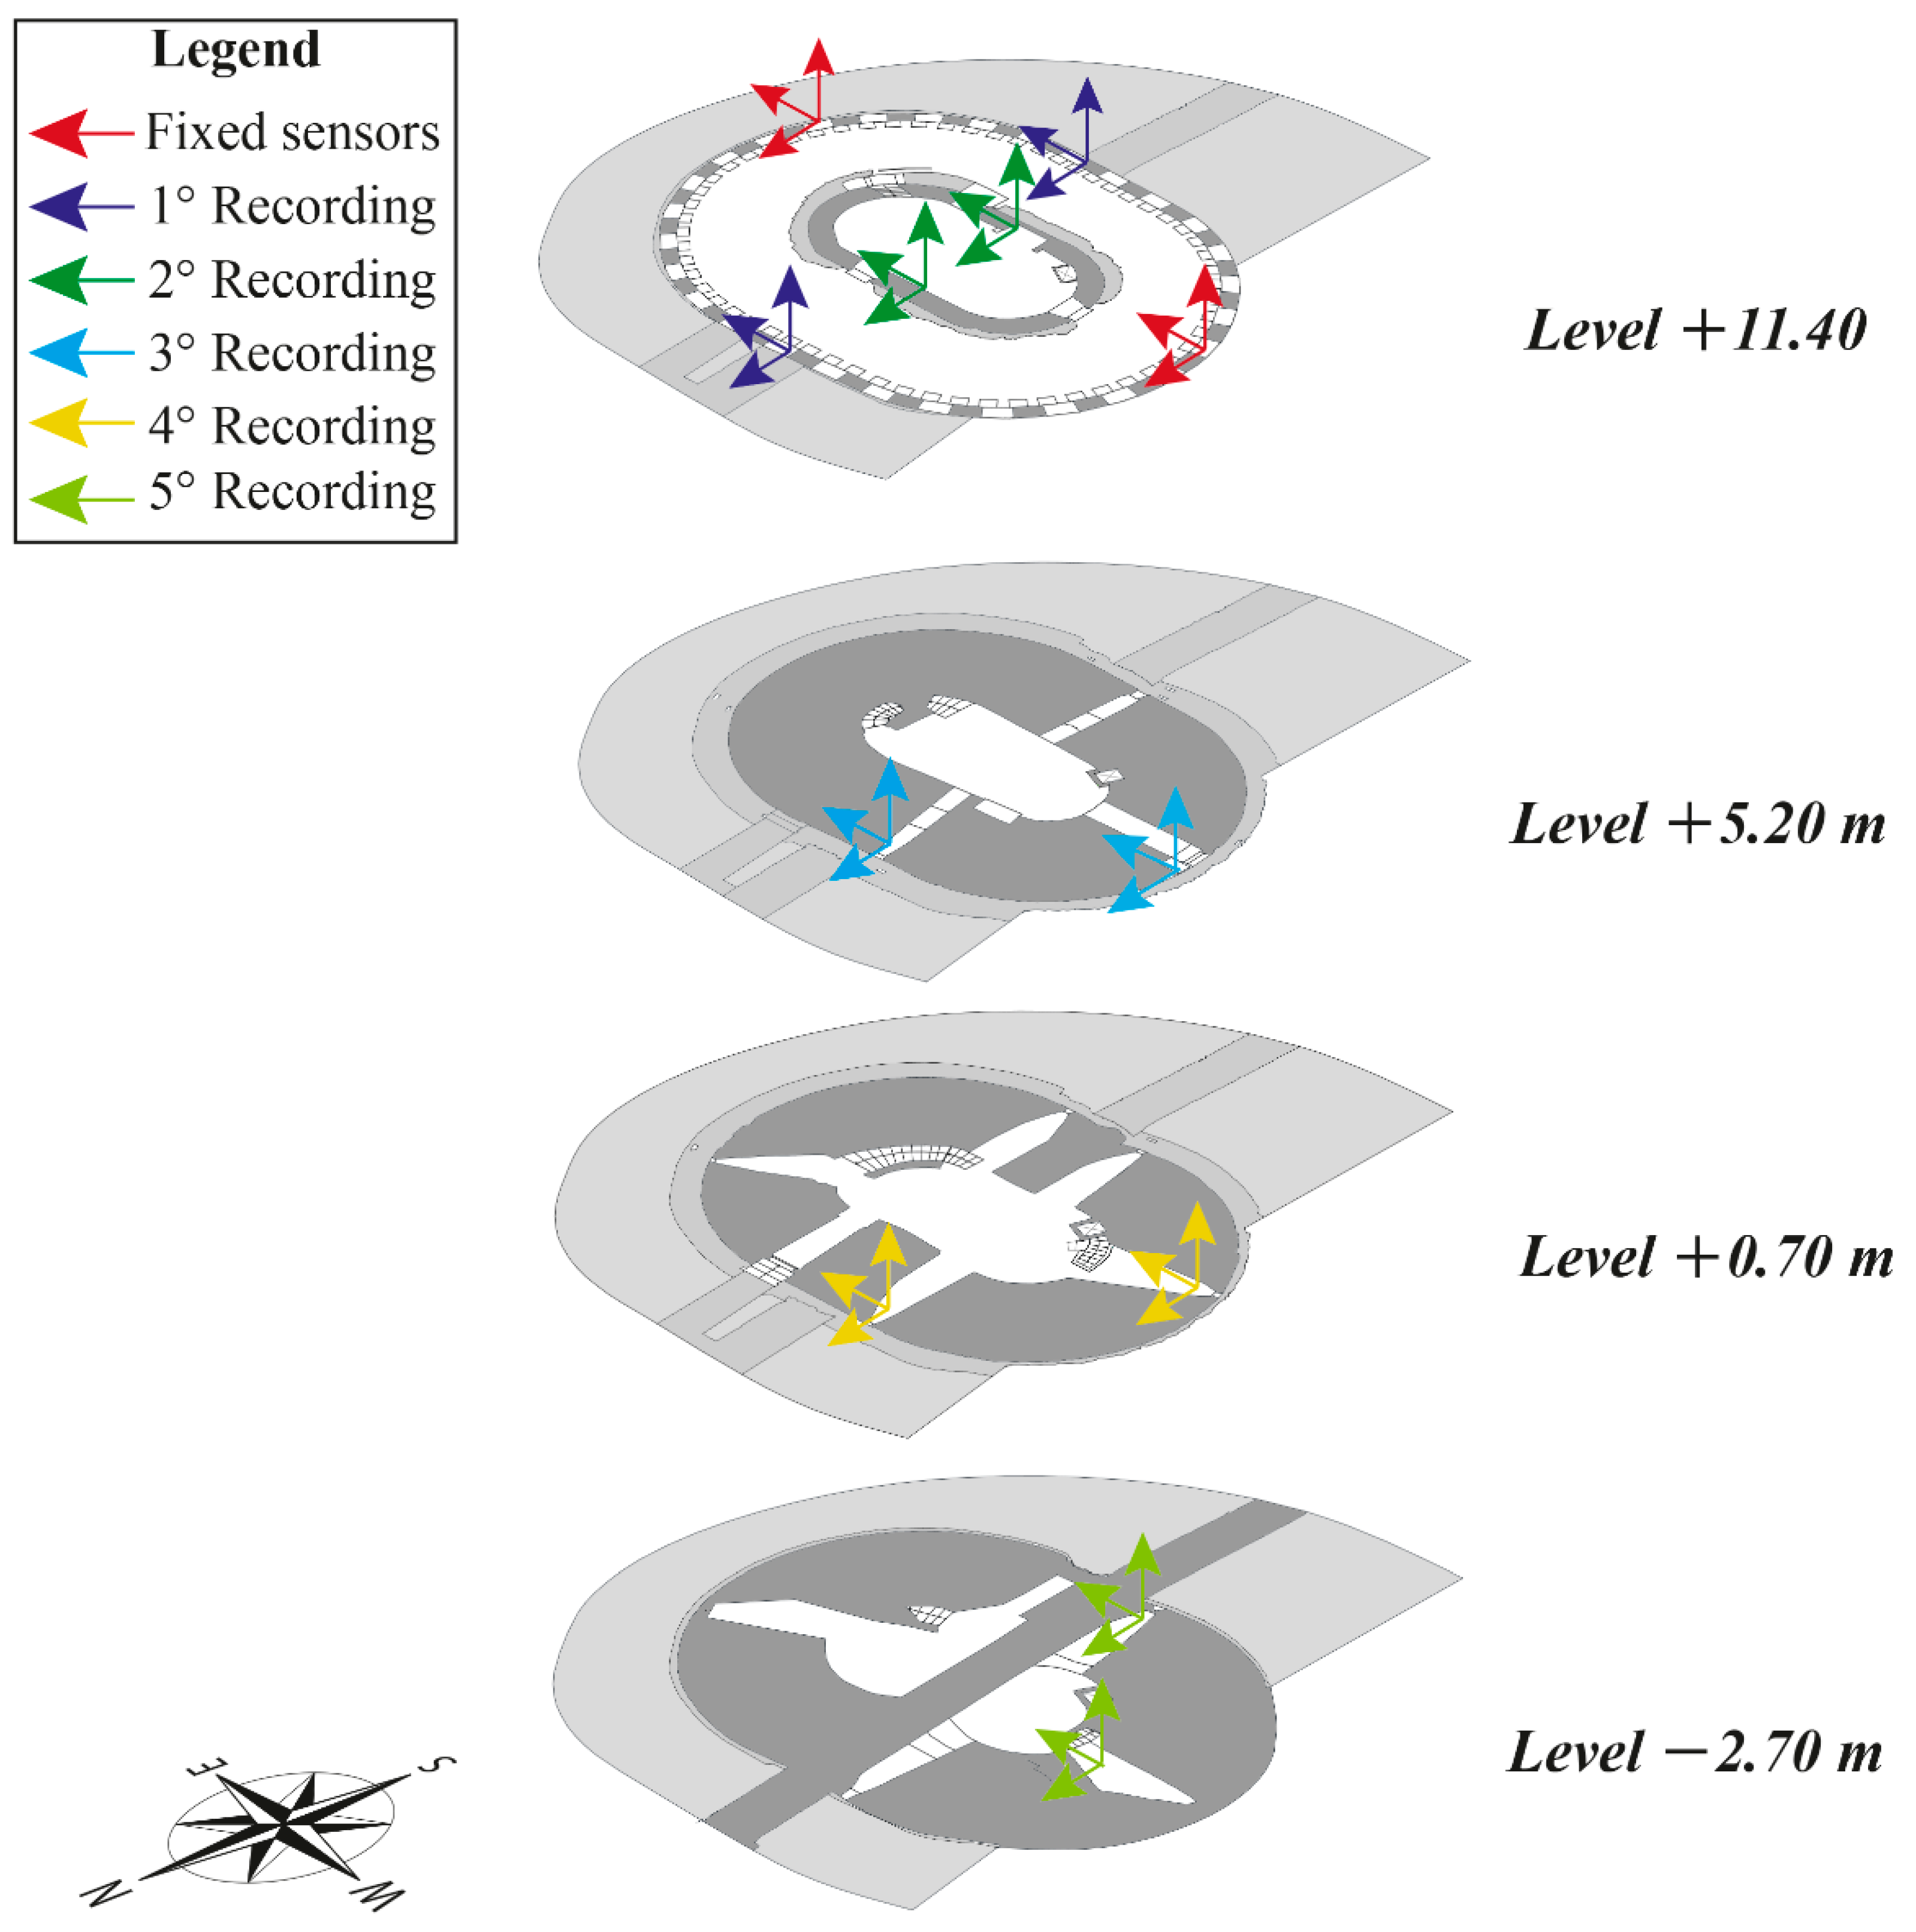
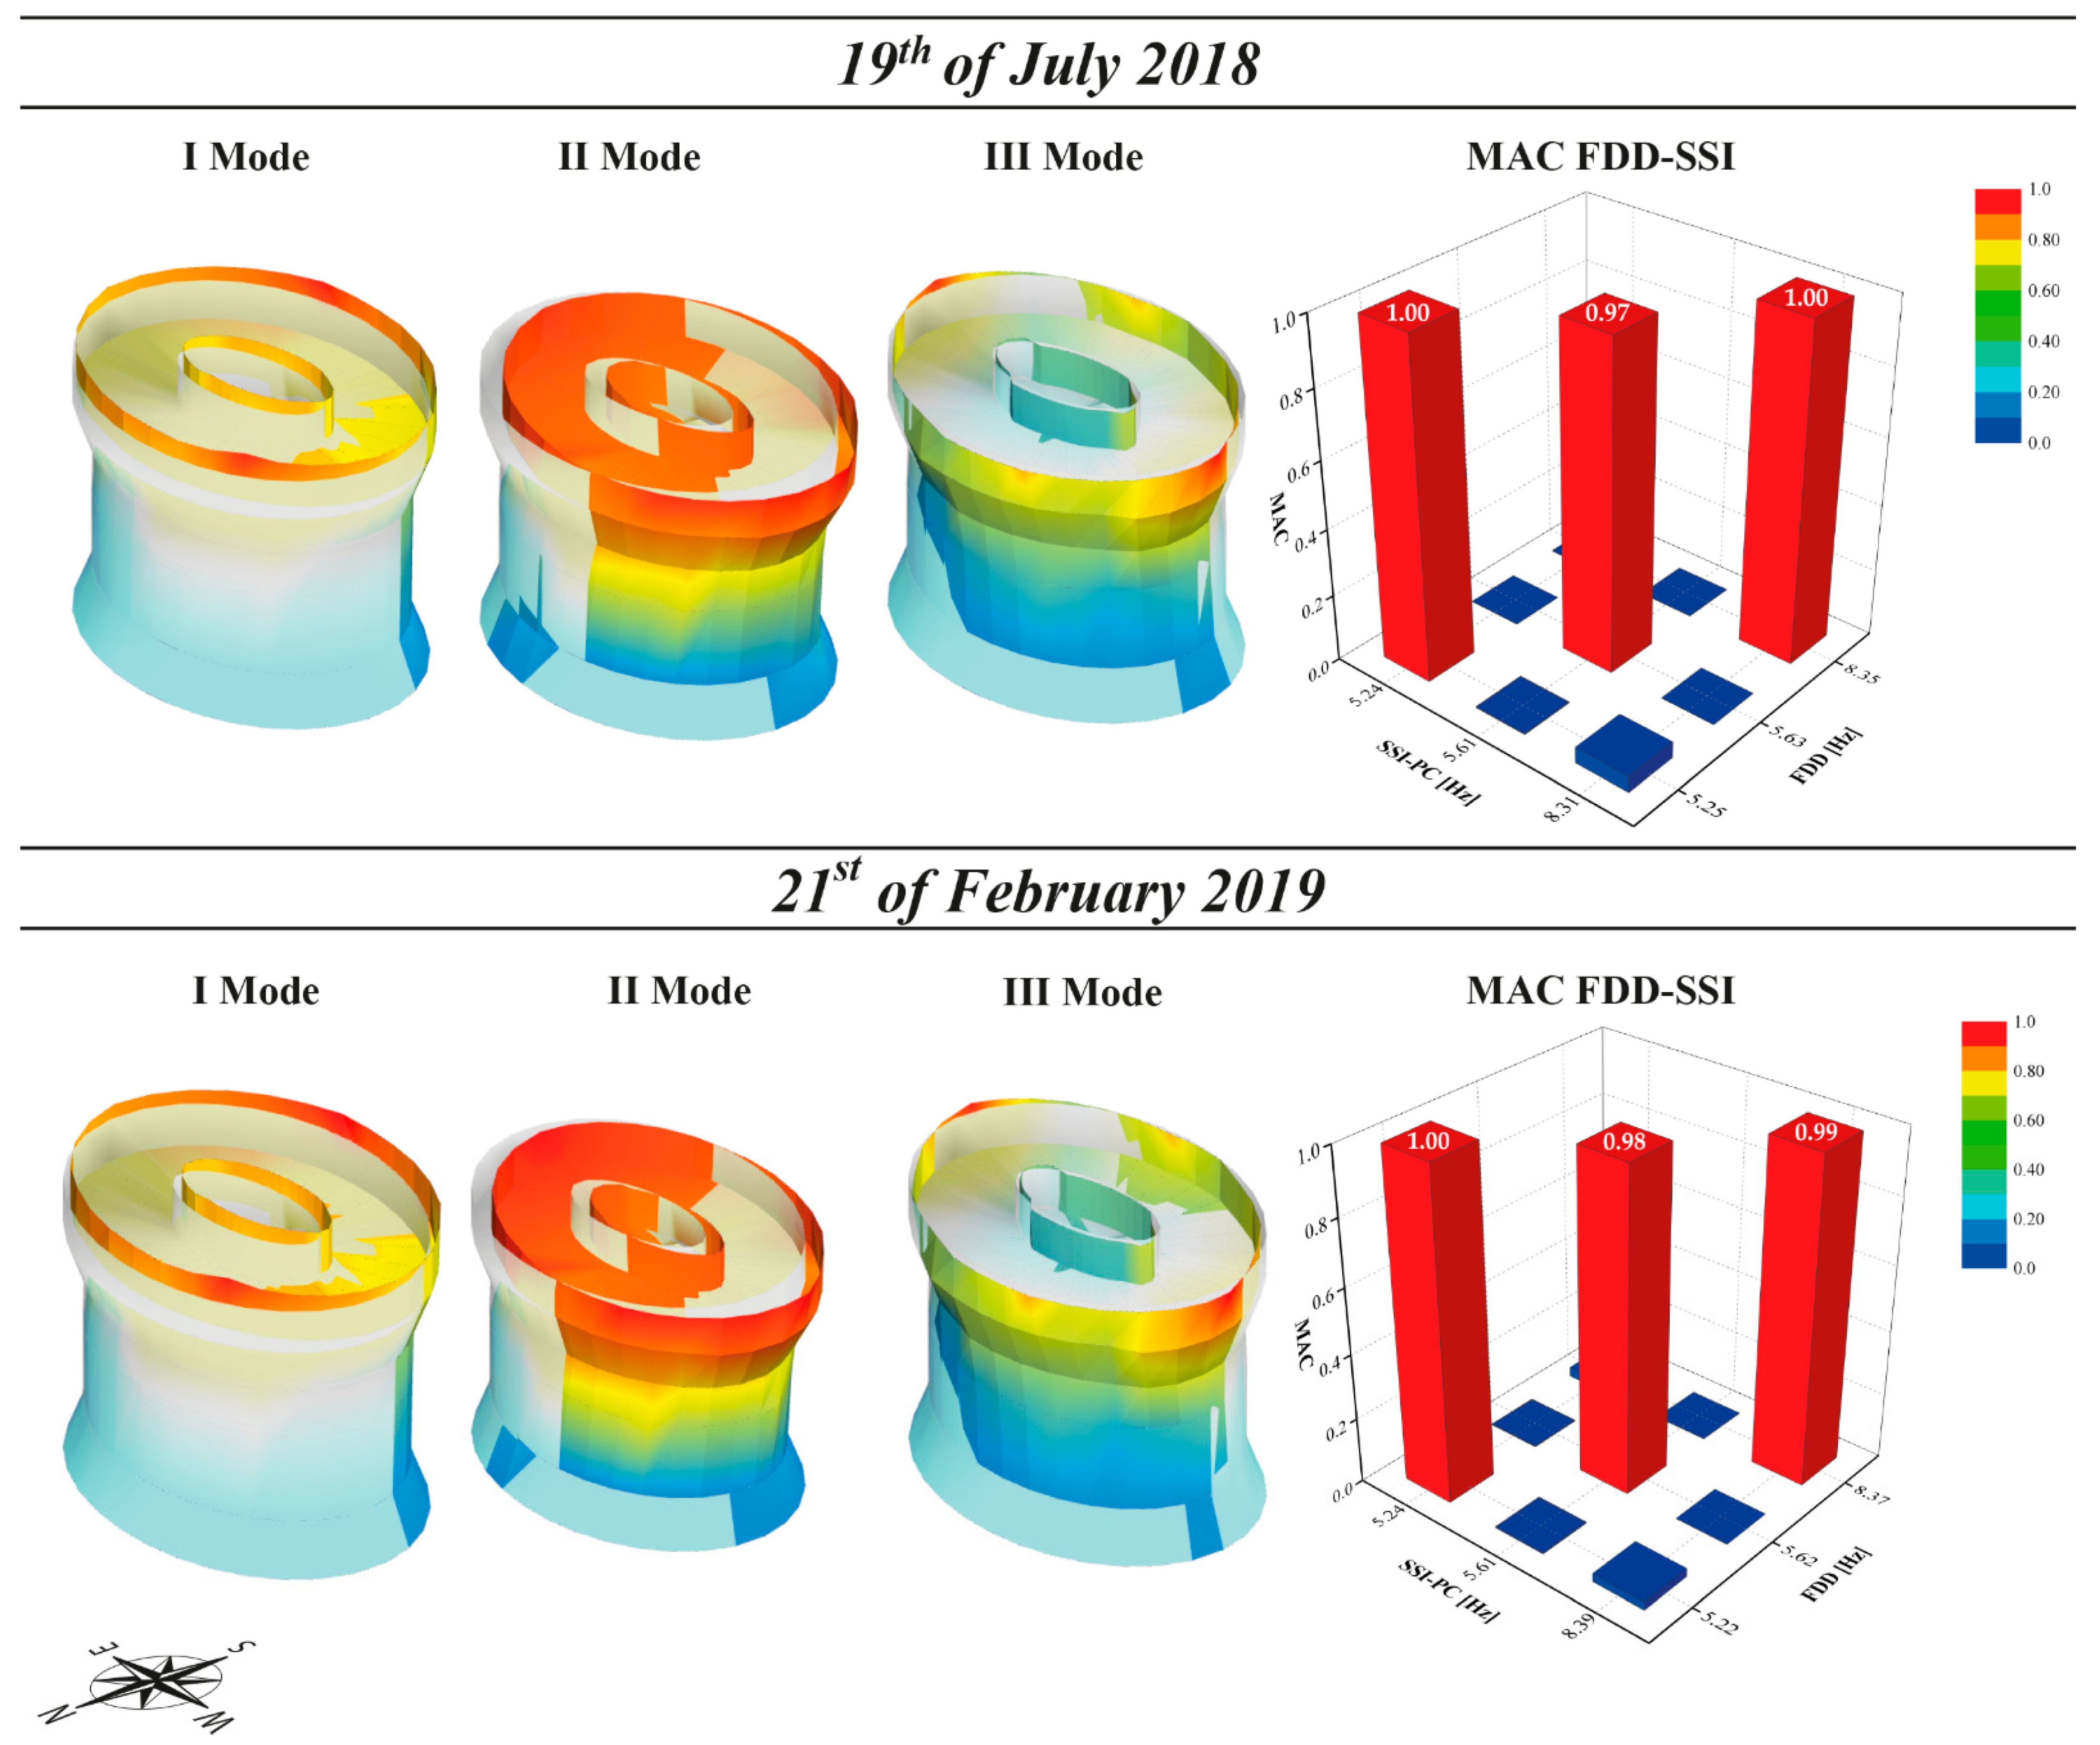
3. Ambient Vibration Tests

The tower dynamic characteristics were extracted using short-term ambient vibration tests (AVT). During the monitoring campaign, four wired triaxial Piezo-MEMS accelerometers (bandwidth ranging from 0.8 to 100 Hz, a dynamic range of 120 dB, a sensitivity of 1 V/g, and a mass of 0.60 kg) were used. They were connected to a sync-hub, that send the accelerometric time histories to a personal computer. To collect as much information as possible on modal shapes, five recordings were done leaving fixed two sensors on the last floor (the blue ones in Figure 3), moving the others on the lower floors at each recording, as shown in Figure 3. Each measure lasted forty minutes with a sampling frequency of 1024 Hz. The monitoring was carried out on 19 July 2018 (mean external temperature and humidity equal to 31° and 27%, respectively) and it was repeated, with the same sensors’ layout, on 21 February 2019 (mean external temperature and humidity equal to 13° and 42%, respectively). The second campaign was done to identify possible changes in the dynamic behaviour of the tower.

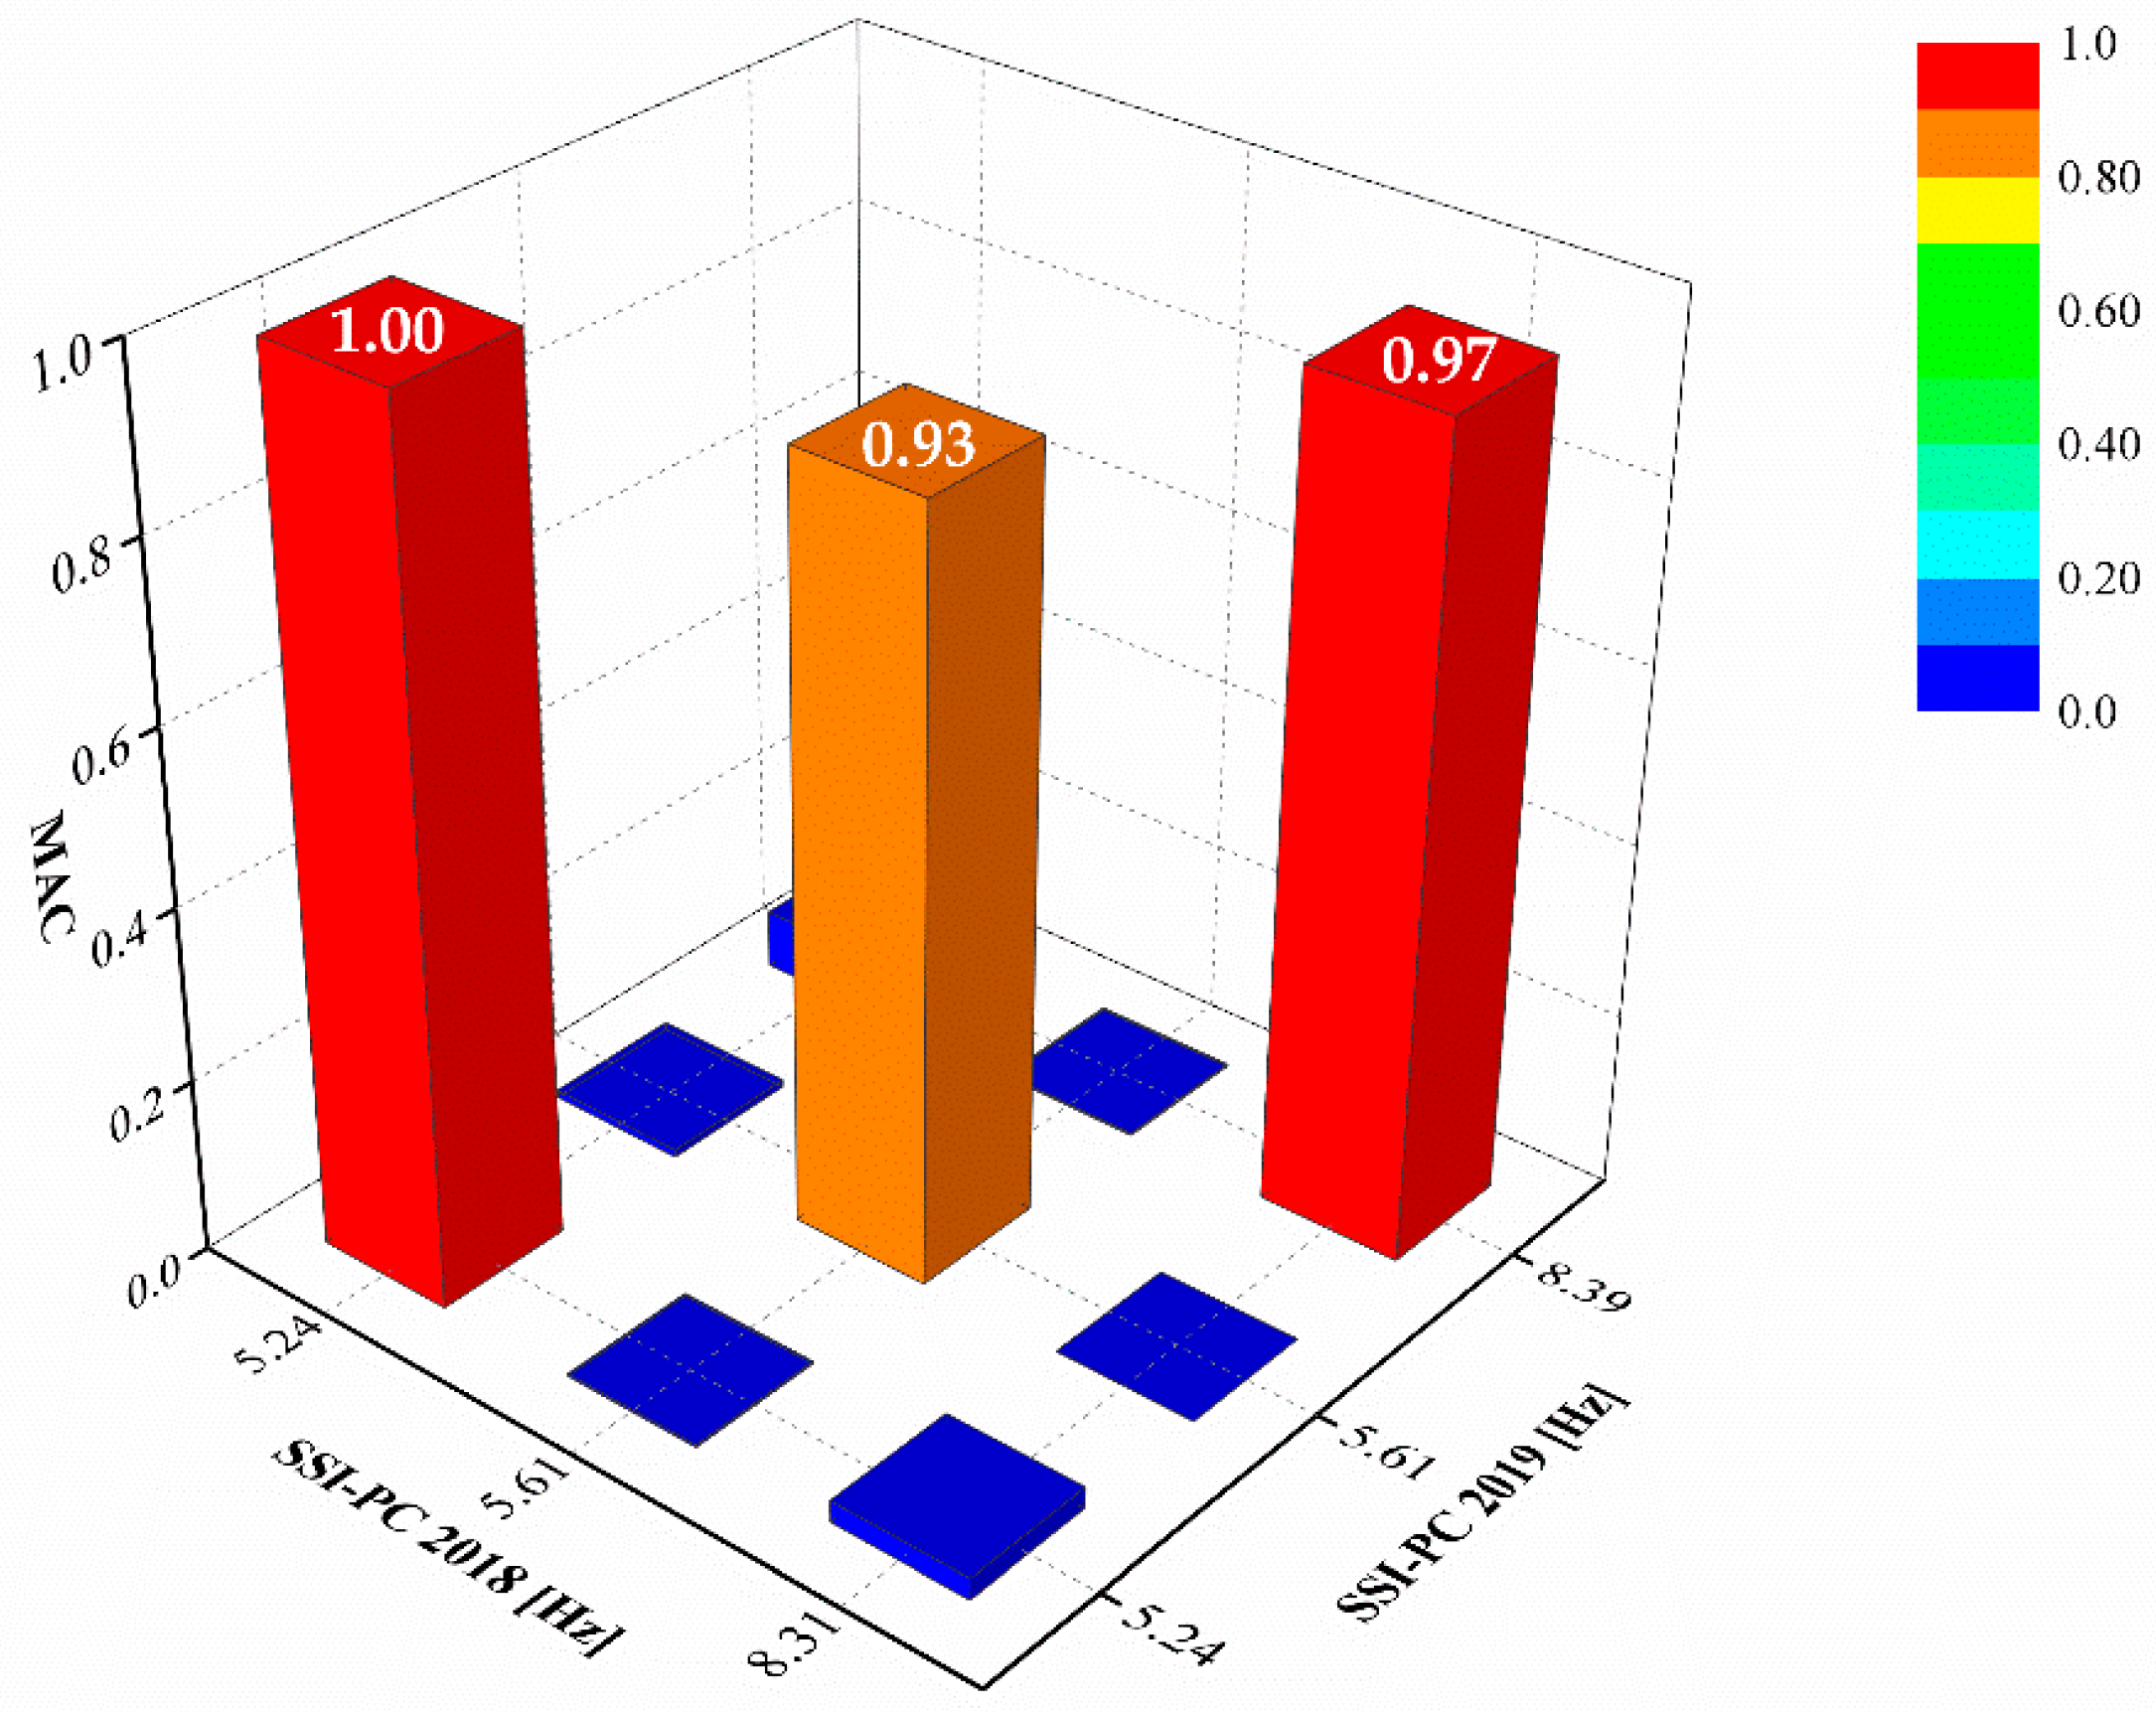
4. Operation Modal Analysis

The time histories recorded were imported in the Artemis software [36] to extract the characteristics of the tower, such as frequencies ( f i ), modal shapes ( ω i ), and damping ( ξ i ) for the i-modes identified. At first, the structure was schematized in the software with nodes, lines and shell elements, and the recordings were assigned to the appropriate nodes. The signals were decimated in a range between 0 and 17.70 Hz, in accordance with the values found on similar structures [33]. The Operation Modal Analysis was performed using two different approaches, the Frequencies Domain Decomposition (FDD) [37] and the Subsequence Space Identification of Principal Component (SSI-PC) [38]. The difference between the two approaches is that the FDD works in the frequency domain, while the SSI-PC in the time domain. The frequencies are identified in the FDD with the peak picking in the spectral density diagram. Instead, the SSI-PC uses the stabilization diagram to identify the stable modes.
The modal shapes and the frequencies between these two approaches were compared using, respectively, the Modal Assurance Criteria (MAC) [39] reported in Equation (1), and absolute frequencies errors reported in Equation (2):
M A C ( { ψ r } , { ψ s } ) = | { ψ r } T · { ψ s } | 2 ( { ψ r } T · { ψ r } ) · ( { ψ s } T · { ψ s } )
Δ f = | f r f s f r | * 100
In the formulas, the subscripts r and s indicate the two sets of data to be compared to each other. The MAC reveals a good match when it assumes values near the unit; instead, frequencies’ error must have values close to zero percent.
The first three modes were identified in a frequency range between 5.29 Hz and 8.39 Hz (Figure 4). As often happens in tower structures, the first two modes are translational (north-south and east-west direction, respectively, in this case) and the third is torsional. In both the AVTs, the absolute frequency errors between the FDD and SSI-PC are lower than 0.4% (Table 1). The MAC matrixes underline a good correlation between the methods for both the experimental campaigns. Indeed, they have diagonal values close to the unit value (Figure 4).
Comparing the 2018 and 2019 AVTs, no significant parameters’ variations are observed. The frequencies remain the same except for the third mode, which shows an increase of about 1%. Moreover, also, the modal shapes appeared similar in Figure 4. This is confirmed by the MAC-matrix between them, taking into consideration the SSI-PC data (Figure 5). It has diagonal values between 1, for the first mode, and 0.87, for the second mode.

5. Numerical Model and Model Updating

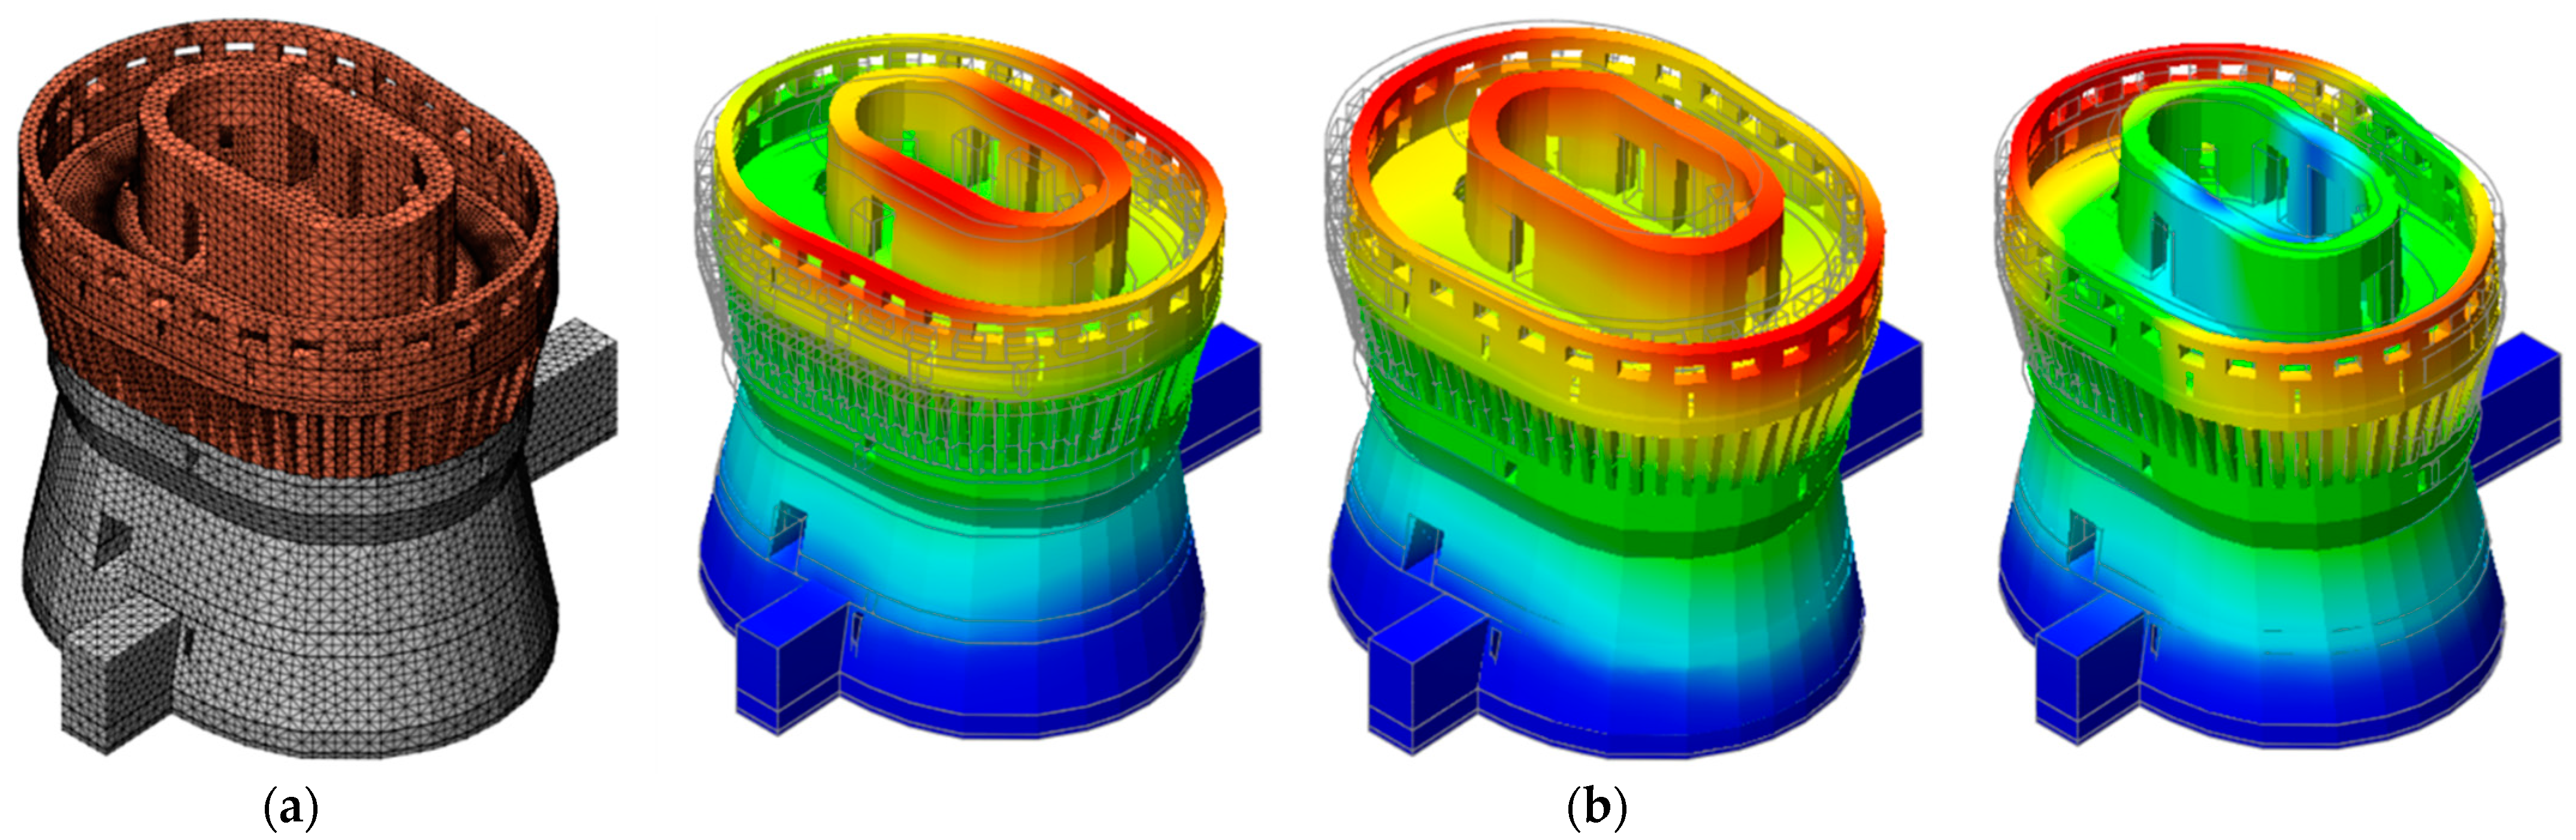
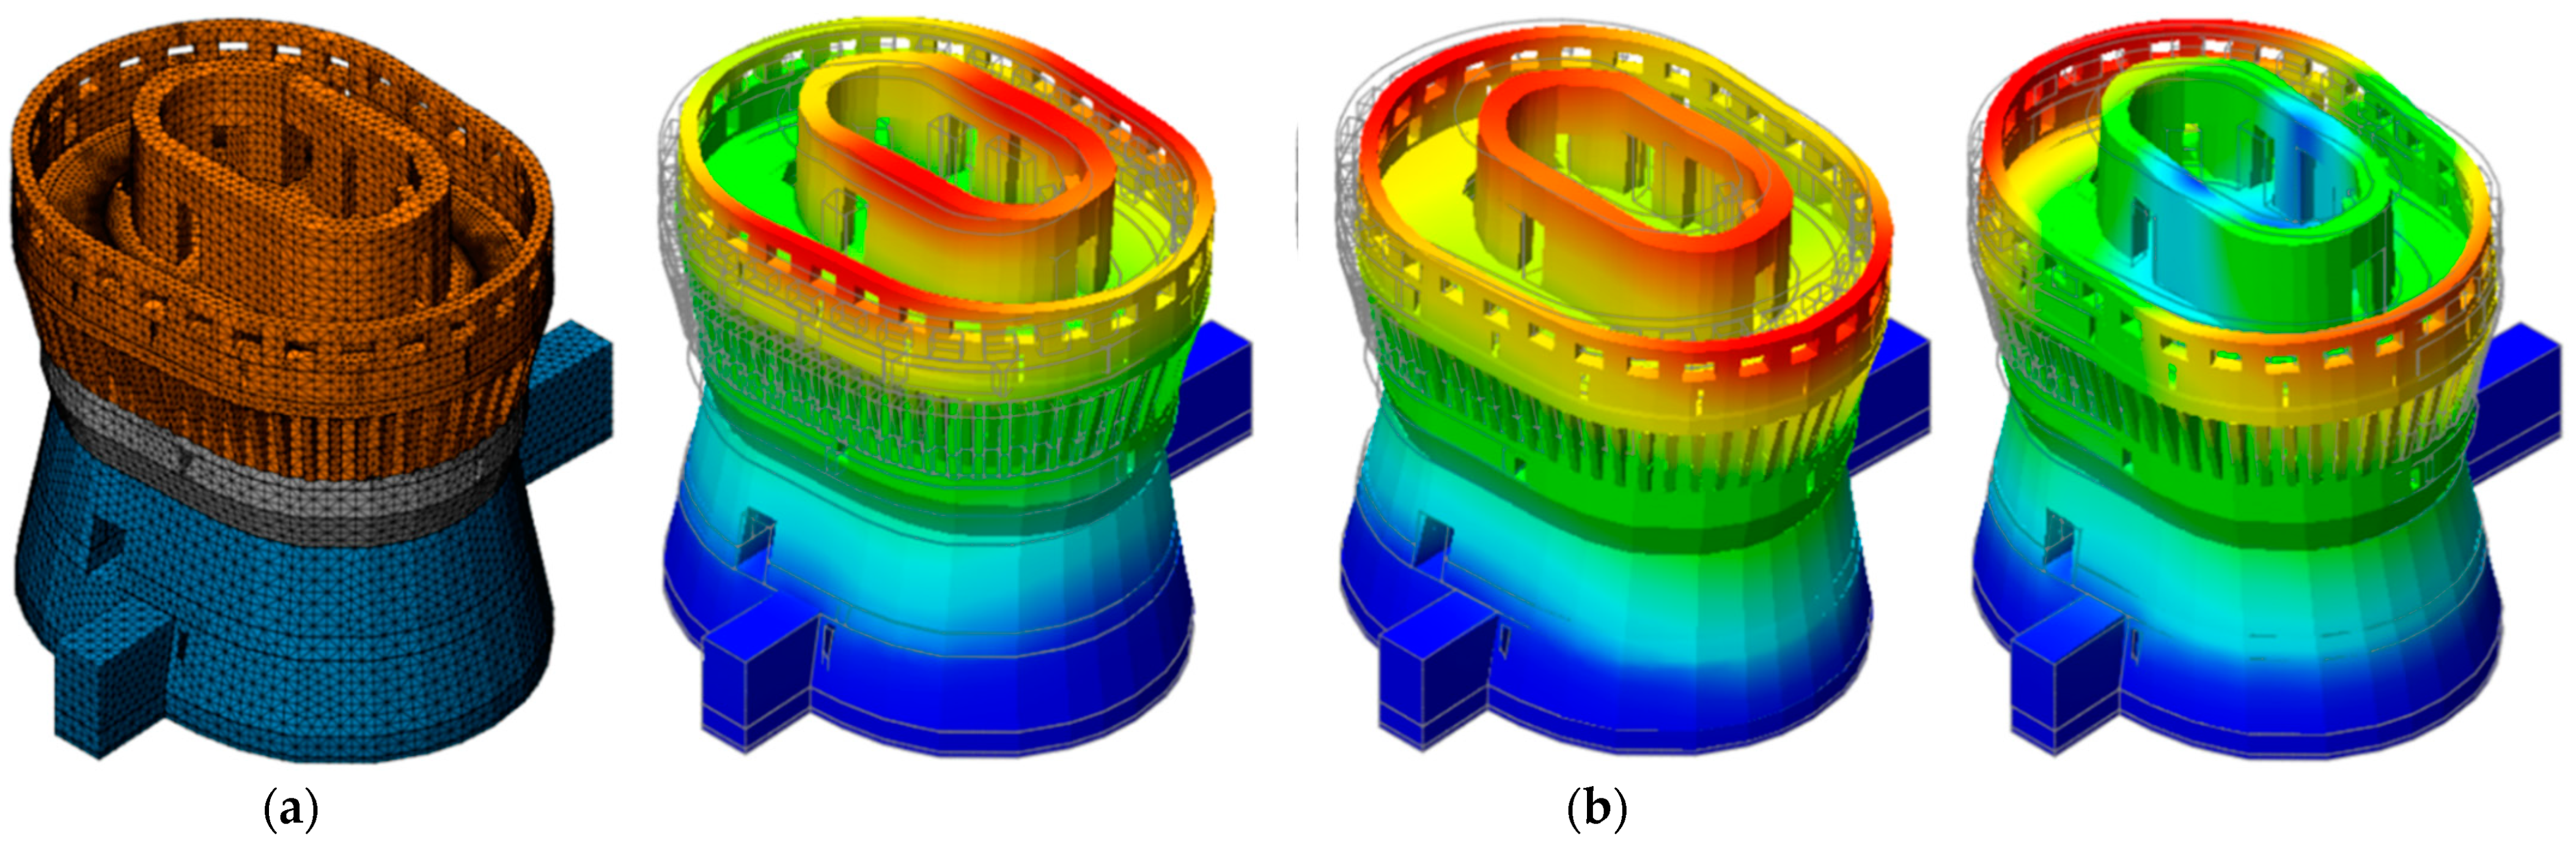
5.1. The Finite Element Model
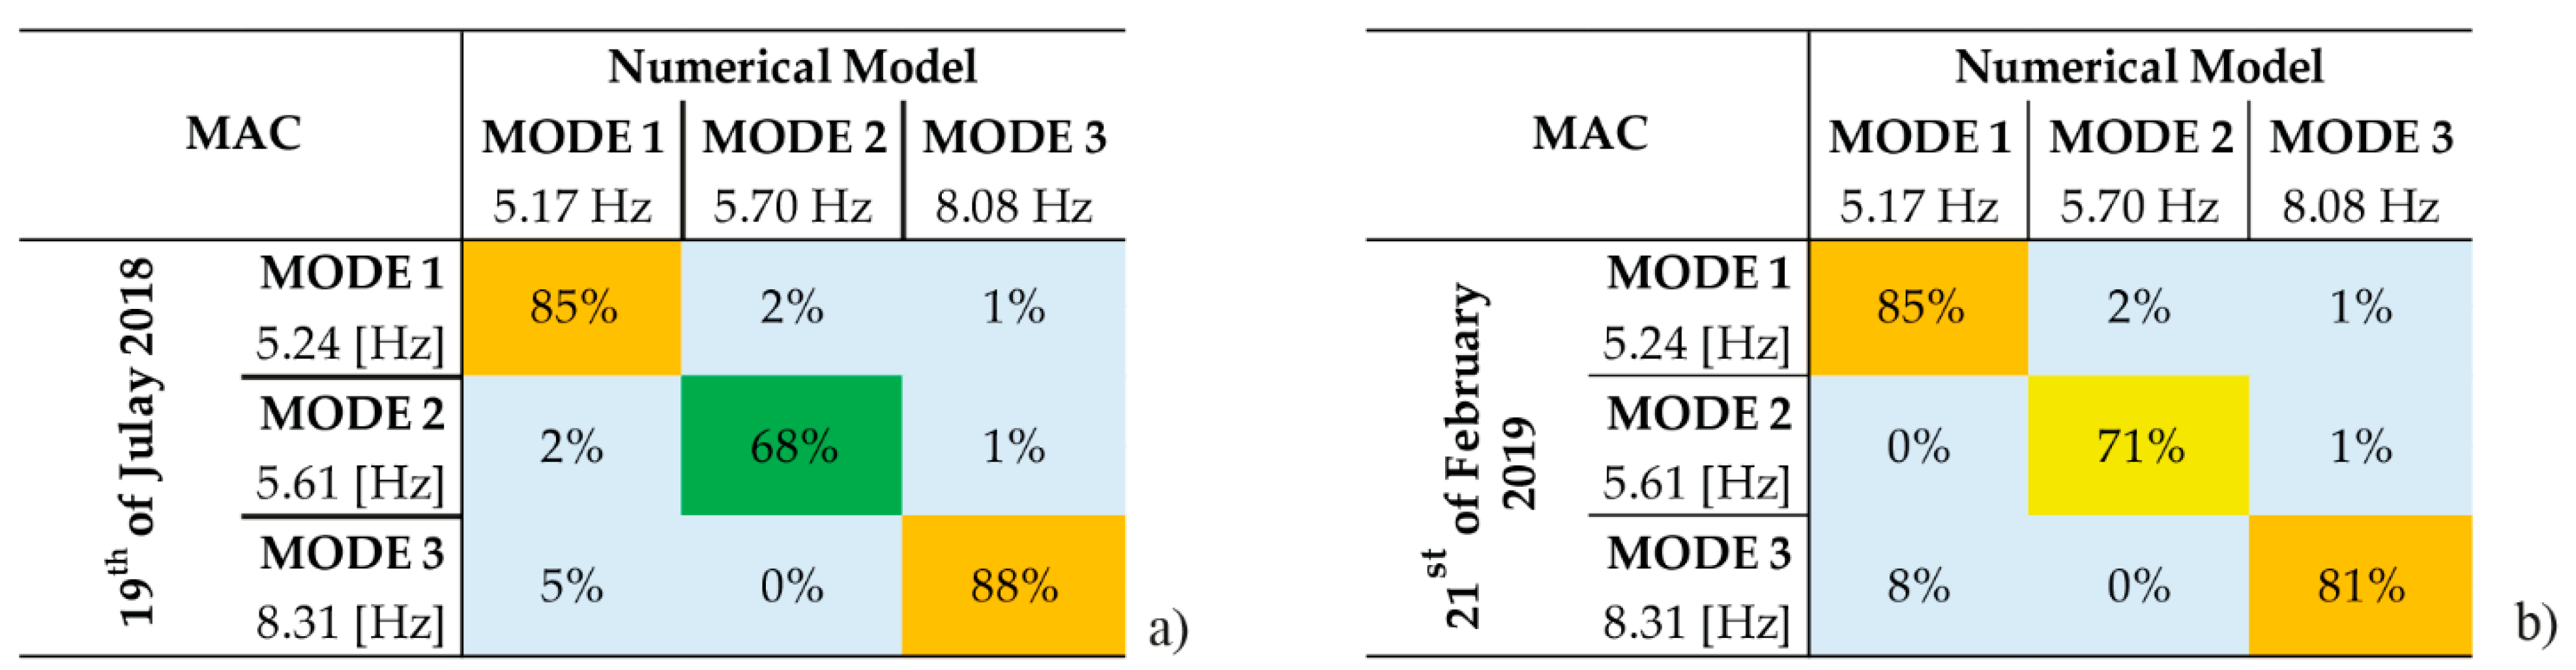
The 3D tower geometry was sketched and meshed in the software Midas FEA [40]. Since the complexity of the structure, a macro-modeling approach was employed. The geometry discretization was obtained by using 4-nodes tetrahedral blocks elements, which are the most appropriate to approximate complex shapes, such as arches and vaults. The FEM model (see Figure 6a) was composed of 282,890 elements, 61,624 nodes and 179,925 degrees of freedom. The foundation fixed all the degrees of freedom of the base nodes.
Based on the materials’ survey, two masonry types were assigned to the numerical model: full bricks with lime mortar and cut stones with good bonding among them. The materials parameters used were chosen following the Italian Code [41,42], considering a limited knowledge level (KL1), as shown in Table 2.

5.2. Model Updating

The FEM model was used to perform modal analysis and to extract the numerical characteristics to be compared with the experimental data, starting from the 2018 AVT, and with the SSI-PC technique. The assessment was done according to both the modal shapes and the frequencies using the parameters defined in Equations (1) and (2).
The starting model showed the frequencies and the modal shapes reported in Table 3 and Figure 6b. Comparing the numerical data, the frequencies appear close to reality, with a maximum difference of 4.93% for the third mode. The MAC values also revealed a good match between the numerical and real modal shapes, having minimum values in the range between 0.68 and 0.88.
The frequencies show an underestimation of the structural stiffness. For this reason, the second step of the model updating was carried out increasing the elastic modulus of the cut stones at the underground and first floors from 1740 MPa to 1850 MPa. The FEM, at this step, had the materials’ configuration reported in Figure 7a. The results obtained from the modal analysis in terms of modal shapes and frequencies are reported in Figure 7b and Table 4. This operation allowed us to get closer to the first and third frequencies without changes in the modal shapes. The absolute errors between the frequencies for all the modes after this operation went down under 4%. Instead, the MAC values remained unchanged except for the first mode, which had a small improvement going from 0.83 to 0.85, as visible in Table 4.
The updated model was lastly compared with the dynamic data recorded during the 2019 field testing. The frequencies recorded were the same as those of 2018, except for that of the third mode. Therefore, the frequencies errors are the same for the first two modes and are equal to 3.69% for the third, as shown in Table 5. The MAC values underline an improvement in the fitting of the second mode and a small divergence for the third one (Figure 8). The lower MAC values for the second mode observed in both the AVTs can be provoked by its inaccurate estimation, as suggested by the comparison of SSI between the 2018 and 2019 monitoring (Figure 5). This could be due to the difficulty to excite this mode for the squat shape of the tower.

6. Discussion and Conclusions

This work analyses the dynamic behaviour and the structural health of a fortified masonry tower in the Marche region, central Italy. At first, the structure was analyzed by two AVTs carried out on 19 July 2018 and on 21 February 2019, to extract its frequencies and modal shapes and to observe possible changes in the dynamic behaviour. To correctly define the dynamic characteristics, the raw data were processed with two distinct approaches, such as FDD and SSI-PC.
For both the AVTs similar frequencies and modal shapes are extracted. The maximum frequency difference between the FDD and SSI was equal to 0.4% for the first modes, meanwhile, the MAC had a minimum value of 0.97 for the second mode of 2018. The comparison between the data obtained in the 2018 and 2019 monitoring revealed that the structure did not change its behaviour. The maximum frequency difference recorded was 1% for the third mode. This underlines that, as expected, since no extreme events happened, the structure did not suffer damages compared to the first monitoring. In contrast to other studies on slender masonry towers, the variation of temperature and humidity does not produce frequencies variations. This can be linked to the high stiffness and mass of the fortified tower.
Subsequently, the tower’s FEM was implemented. The assigned parameters were chosen based on the visual surveys by using the data suggested by the Italian Code for the starting model. The dynamic analysis of the tower revealed a good correspondence between modal shapes (minimum MAC = 68%) and frequencies (maximum Δf = 4.93%). However, to further reduce the differences, an updating of the numerical model was performed. To have frequencies’ differences below the 4% for all modes, it was enough to act on the Young’s Modulus assigned to the lower part of the structure.
In conclusion, this work outlined how the ambient vibration test is a useful tool to also control the health of massive and stiff structures. The use of highly sensitive sensors allowed the extraction of the main modes of the fortified masonry tower. With those data, it was possible to obtain a more realistic FEM model. The model will be used in the future for an accurate structural assessment. The manual updating of the structures will be also compared with an automatic updating using genetic algorithms [31,32].

Author Contributions

Conceptualization, E.G., L.M., F.C. and A.F.; methodology, E.G., F.C.; software, E.G., F.C.; validation, L.M., A.F.; formal analysis, E.G.; investigation, E.G., F.C.; resources, E.G., F.C., L.M. and A.F.; data curation, E.G., F.C.; writing—original draft preparation, E.G., F.C.; writing—review and editing, E.G., L.M., F.C. and A.F.; supervision, L.M., A.F. and F.C. All authors have read and agreed to the published version of the manuscript.

Funding

This research received no external funding.

Institutional Review Board Statement

Not applicable.

Informed Consent Statement

Not applicable.

Data Availability Statement

Not applicable.

Acknowledgments

The authors gratefully acknowledge the support of the Italian Ministry of University (Italy), under the program “Dipartimento di Eccellenza” of the Department of Civil and Building Engineering, and Architecture—Polytechnic University of Marche (Ancona, Italy).

Conflicts of Interest

The authors declare no conflict of interest.

References

  1. D’Altri, A.M.; Sarhosis, V.; Milani, G.; Rots, J.; Cattari, S.; Lagomarsino, S.; Sacco, E.; Tralli, A.; Castellazzi, G.; de Miranda, S. A review of numerical models for masonry structures. In Numerical Modeling of Masonry and Historical Structures; Elsevier: Amsterdam, The Netherlands, 2019; pp. 3–53. [Google Scholar]
  2. Lourenço, P.B.; Mendes, N.; Ramos, L.F.; Oliveira, D.V. Analysis of Masonry Structures Without Box Behavior. Int. J. Archit. Herit. 2011, 5, 369–382. [Google Scholar] [CrossRef]
  3. Clementi, F. Failure Analysis of Apennine Masonry Churches Severely Damaged during the 2016 Central Italy Seismic Sequence. Buildings 2021, 11, 58. [Google Scholar] [CrossRef]
  4. Zizi, M.; Corlito, V.; Lourenço, P.B.; De Matteis, G. Seismic vulnerability of masonry churches in Abruzzi region, Italy. Structures 2021, 32, 662–680. [Google Scholar] [CrossRef]
  5. Giordano, E.; Clementi, F.; Nespeca, A.; Lenci, S. Damage Assessment by Numerical Modeling of Sant’Agostino’s Sanctuary in Offida During the Central Italy 2016–2017 Seismic Sequence. Front. Built Environ. 2019, 4, 87. [Google Scholar] [CrossRef] [Green Version]
  6. Formisano, A.; Di Lorenzo, G.; Krstevska, L.; Landolfo, R. Fem Model Calibration of Experimental Environmental Vibration Tests on Two Churches Hit by L’Aquila Earthquake. Int. J. Archit. Herit. 2021, 15, 113–131. [Google Scholar] [CrossRef]
  7. Rots, J.G. Smeared and discrete representations of localized fracture. Int. J. Fract. 1991, 51, 45–59. [Google Scholar] [CrossRef]
  8. Lubliner, J.; Oliver, J.; Oller, S.; Oñate, E. A plastic-damage model for concrete. Int. J. Solids Struct. 1989, 25, 299–326. [Google Scholar] [CrossRef]
  9. Lee, J.; Fenves, G.L. Plastic-Damage Model for Cyclic Loading of Concrete Structures. J. Eng. Mech. 1998, 124, 892–900. [Google Scholar] [CrossRef]
  10. Ferrante, A.; Loverdos, D.; Clementi, F.; Milani, G.; Formisano, A.; Lenci, S.; Sarhosis, V. Discontinuous approaches for nonlinear dynamic analyses of an ancient masonry tower. Eng. Struct. 2021, 230, 111626. [Google Scholar] [CrossRef]
  11. Ferrante, A.; Schiavoni, M.; Bianconi, F.; Milani, G.; Clementi, F. Influence of Stereotomy on Discrete Approaches Applied to an Ancient Church in Muccia, Italy. J. Eng. Mech. 2021, 147, 04021103. [Google Scholar] [CrossRef]
  12. Beatini, V.; Royer-Carfagni, G.; Tasora, A. A non-smooth-contact-dynamics analysis of Brunelleschi’s cupola: An octagonal vault or a circular dome? Meccanica 2019, 54, 525–547. [Google Scholar] [CrossRef] [Green Version]
  13. Cundall, P.A. A computer model for simulating progressive large-scale movements in blocky rock systems. In Proceedings of the Symposio of the International Society of Rock Mechanics, Nancy, France, 4–6 October 1971. [Google Scholar]
  14. Moreau, J.J. Unilateral Contact and Dry Friction in Finite Freedom Dynamics. In Nonsmooth Mechanics and Applications; Springer: Vienna, Austria, 1988; pp. 1–82. [Google Scholar]
  15. Jean, M. The non-smooth contact dynamics method. Comput. Methods Appl. Mech. Eng. 1999, 177, 235–257. [Google Scholar] [CrossRef] [Green Version]
  16. Ferrante, A.; Giordano, E.; Clementi, F.; Milani, G.; Formisano, A. FE vs. DE Modeling for the Nonlinear Dynamics of a Historic Church in Central Italy. Geosciences 2021, 11, 189. [Google Scholar] [CrossRef]
  17. Mendes, N.; Lourenço, P.B. Seismic assessment of historic masonry structures: Out-of-plane effects. In Numerical Modeling of Masonry and Historical Structures; Elsevier: Amsterdam, The Netherlands, 2019; pp. 141–162. [Google Scholar]
  18. Malena, M.; Portioli, F.; Gagliardo, R.; Tomaselli, G.; Cascini, L.; de Felice, G. Collapse mechanism analysis of historic masonry structures subjected to lateral loads: A comparison between continuous and discrete models. Comput. Struct. 2019, 220, 14–31. [Google Scholar] [CrossRef]
  19. Jiang, W.; Zhang, F.; Lin, Q.; Li, Q. Application of Sensing Technology in the Protection of Architectural Heritage: A Review. In Proceedings of the 2021 IEEE International Conference on Artificial Intelligence and Computer Applications (ICAICA), Dalian, China, 28–30 June 2021; pp. 654–658. [Google Scholar]
  20. De Stefano, A.; Matta, E.; Clemente, P. Structural health monitoring of historical heritage in Italy: Some relevant experiences. J. Civ. Struct. Heal. Monit. 2016, 6, 83–106. [Google Scholar] [CrossRef]
  21. Giordano, P.F.; Ubertini, F.; Cavalagli, N.; Kita, A.; Masciotta, M.G. Four years of structural health monitoring of the San Pietro bell tower in Perugia, Italy: Two years before the earthquake versus two years after. Int. J. Mason. Res. Innov. 2020, 5, 445. [Google Scholar] [CrossRef]
  22. Pallarés, F.J.; Betti, M.; Bartoli, G.; Pallarés, L. Structural health monitoring (SHM) and Nondestructive testing (NDT) of slender masonry structures: A practical review. Constr. Build. Mater. 2021, 297, 123768. [Google Scholar] [CrossRef]
  23. Giordano, E.; Mendes, N.; Masciotta, M.G.; Clementi, F.; Sadeghi, N.H.; Silva, R.A.; Oliveira, D.V. Expeditious damage index for arched structures based on dynamic identification testing. Constr. Build. Mater. 2020, 265, 120236. [Google Scholar] [CrossRef]
  24. Cawley, P.; Adams, R.D. The location of defects in structures from measurements of natural frequencies. J. Strain Anal. Eng. Des. 1979, 14, 49–57. [Google Scholar] [CrossRef]
  25. Pepi, C.; Cavalagli, N.; Gusella, V.; Gioffrè, M. Damage detection via modal analysis of masonry structures using shaking table tests. Earthq. Eng. Struct. Dyn. 2021, 50, 2077–2097. [Google Scholar] [CrossRef]
  26. Giordano, E.; Bertolesi, E.; Clementi, F.; Buitrago, M.; Adam, J.M.; Ivorra, S. Unreinforced and TRM-Reinforced Masonry Building Subjected to Pseudodynamic Excitations: Numerical and Experimental Insights. J. Eng. Mech. 2021, 147, 04021107. [Google Scholar] [CrossRef]
  27. Gentile, C.; Guidobaldi, M.; Saisi, A. One-year dynamic monitoring of a historic tower: Damage detection under changing environment. Meccanica 2016, 51, 2873–2889. [Google Scholar] [CrossRef] [Green Version]
  28. Kita, A.; Cavalagli, N.; Ubertini, F. Temperature effects on static and dynamic behavior of Consoli Palace in Gubbio, Italy. Mech. Syst. Signal Processing 2019, 120, 180–202. [Google Scholar] [CrossRef]
  29. Venanzi, I.; Kita, A.; Cavalagli, N.; Ierimonti, L.; Ubertini, F. Earthquake-induced damage localization in an historic masonry tower through long-term dynamic monitoring and FE model calibration. Bull. Earthq. Eng. 2020, 18, 2247–2274. [Google Scholar] [CrossRef]
  30. Clementi, F.; Pierdicca, A.; Milani, G.; Gazzani, V.; Poiani, M.; Lenci, S. Numerical model upgrading of ancient bell towers monitored with a wired sensors network. In Proceedings of the 10th International Masonry Conference (IMC_10), Milano, Italy, 9–11 July 2018; Milani, G., Taliercio, A., Garrity, S., Eds.; pp. 1–11. [Google Scholar]
  31. Standoli, G.; Salachoris, G.P.; Masciotta, M.G.; Clementi, F. Modal-based FE model updating via genetic algorithms: Exploiting artificial intelligence to build realistic numerical models of historical structures. Constr. Build. Mater. 2021, 303, 124393. [Google Scholar] [CrossRef]
  32. Bianconi, F.; Salachoris, G.P.; Clementi, F.; Lenci, S. A Genetic Algorithm Procedure for the Automatic Updating of FEM Based on Ambient Vibration Tests. Sensors 2020, 20, 3315. [Google Scholar] [CrossRef]
  33. Altunişik, A.C.; Okur, F.Y.; Genç, A.F.; Günaydin, M.; Adanur, S. Automated Model Updating of Historical Masonry Structures Based on Ambient Vibration Measurements. J. Perform. Constr. Facil. 2018, 32, 04017126. [Google Scholar] [CrossRef]
  34. Bakir, P.G.; Reynders, E.; Roeck, G. De An improved finite element model updating method by the global optimization technique ‘Coupled Local Minimizers’. Comput. Struct. 2008, 86, 1339–1352. [Google Scholar] [CrossRef]
  35. Levin, R.I.; Lieven, N.A.J. Dynamic finite element model updating using simulated annealing and genetic algorithms. Mech. Syst. Signal Processing 1998, 12, 91–120. [Google Scholar] [CrossRef] [Green Version]
  36. ARTeMIS Modal Structural Vibration Solutions A/S. 2021. Available online: https://svibs.com/ (accessed on 25 January 2022).
  37. Brincker, R.; Zhang, L.; Andersen, P. Modal identification from ambient responses using frequency domain decomposition. Smart Mater. Struct. 2001, 10, 441. [Google Scholar] [CrossRef] [Green Version]
  38. Systems, M.; Leuven, K.U.; Peeters, B.; De Roeck, G. Reference-Based Stochastic Subspace Identification for Output-Only Modal Analysis. Mech. Syst. Signal Processing 1999, 13, 855–878. [Google Scholar] [CrossRef] [Green Version]
  39. Ewins, D.J. Modal Testing: Theory and Practice; Research Studies Press: Hertfordshire, UK, 1984. [Google Scholar]
  40. Midas FEA Analysis and Algorithm Manual. 2016. Available online: https://www.midasoft.com/ (accessed on 25 January 2022).
  41. GU Serie Generale, n. 42 del 20-02-2018—Suppl. Ordinario n. 8; Decreto Ministeriale 17/01/2018—Aggiornamento delle “Norme Tecniche per le Costruzioni”; Ministero delle Infrastrutture e dei Trasporti: Rome, Italy, 2018; pp. 1–198. (In Italian) [Google Scholar]
  42. GU Serie Generale, n. 35 del 11-02-2019—Suppl. Ordinario n. 5; Circolare 21 gennaio 2019 n. 7 C.S.LL.PP—Istruzioni per l’applicazione dell’Aggiornamento delle “Norme Tecniche per le Costruzioni” di cui al D.M. 17/01/2018; Ministero delle Infrastrutture e dei Trasporti: Rome, Italy, 2019; pp. 1–337. (In Italian) [Google Scholar]
Figure 1. Geo-localization of Cagli village (Marche region, Central Italy) (a), and external views of the fortified tower (b).
Infrastructures 07 00030 g001
Figure 2. Horizontal and longitudinal cross-sections of the fortified tower (dimensions are in meters).
Infrastructures 07 00030 g002
Figure 3. Accelerometers’ set-up used in the Cagli Tower during the ambient vibration tests.
Infrastructures 07 00030 g003
Figure 4. Cagli Tower’s modal shapes detected on 19 July 2018 and 21 February 2019 and comparison between FDD and SSI techniques with MAC-matrixes.
Infrastructures 07 00030 g004
Figure 5. MAC between the modal vectors extracted by the 2018 and 2019 experimental campaigns with the SSI-PC method.
Infrastructures 07 00030 g005
Figure 6. Starting numerical model discretization (a) and the corresponding first three modal shapes (b).
Infrastructures 07 00030 g006
Figure 7. Numerical model discretization at the final step (a) and the corresponding first three modal shapes (b).
Infrastructures 07 00030 g007
Figure 8. MAC-matrix between the updated FEM and experimental data collected on 19 July 2018 (a) and on 21 February 2019 (b).
Infrastructures 07 00030 g008
Table 1. Frequencies, complexities and dampings estimated by FDD and SSI-PC methods (the percentage in brackets indicates the absolute error taking as reference the results of the SSI-PC method).
19 July 2018
SSI-PCFDD
ModeFrequencies [Hz]Complexity [%]Damping [%]Frequencies [Hz]Complexity [%]
I5.240.200.945.22 (0.4%)0.70
II5.614.591.375.62 (0.2%)3.18
III8.310.630.518.30 (0.1%)1.04
21 February 2019
SSI-PCFDD
ModeFrequencies [Hz]Complexity [%]Damping [%]Frequencies [Hz]Complexity [%]
I5.240.091.045.22 (0.4%)0.40
II5.611.461.365.63 (0.2%)4.75
III8.390.330.558.40 (0.1%)2.23
Table 2. Materials parameters used for the starting FE model.
MaterialElastic Modulus [MPa]Poisson’s Ratio
[-]
Density
[kN/m3]
Full bricks and lime mortar 15000.418
Cut stones with good bonding 17400.421
Table 3. Comparison of the modal frequencies and shapes between the starting FEM and the OMA results.
Modefnum [Hz] Δ f   2018   [ % ] MAC 2018Numerical Modal Shapes
I5.054.00%0.83Translational on North direction
II5.560.89%0.68Translational on East direction
III7.904.93%0.88Torsional
Table 4. Comparison of the modal frequencies and shapes between the final FEM and the OMA results.
Modefnum [Hz] Δ f   2018   [ % ] MAC 2018Numerical Modal Shapes
I5.171.34%0.85Translational on North direction
II5.701.60%0.68Translational on East direction
III8.082.77%0.88Torsional
Table 5. Comparison of the modal frequencies and shapes between the final FEM realized and the OMA results obtained by the 2019 field testing.
Modefnum [Hz] Δ f   2019   MAC 2019Numerical Modal Shapes
I5.171.34%0.85Translational on North direction
II5.701.60%0.71Translational on East direction
III8.083.69%0.81Torsional
Publisher’s Note: MDPI stays neutral with regard to jurisdictional claims in published maps and institutional affiliations.

