Article

Long-Term Behaviour of Padded Concrete Sleepers on Reduced Ballast Bed Thickness

Institute of Railway Engineering and Transport Economy, Graz University of Technology, 8010 Graz, Austria
*
Author to whom correspondence should be addressed.
Infrastructures 2022, 7(10), 132; https://doi.org/10.3390/infrastructures7100132
Submission received: 5 September 2022 / Revised: 28 September 2022 / Accepted: 30 September 2022 / Published: 4 October 2022

Abstract

:
The positive effects of under sleeper pads have already been proven by track and laboratory tests worldwide. In Austria, padded concrete sleepers reduce track deterioration by 50 percent and have therefore been used as standard components since 2010. As the pads increase material costs, many infrastructure managers have discussed the idea of covering costs by reducing the ballast bed thickness. Technically, this approach (less ballast) is feasible, as the pads increase the track elasticity and protect the ballast. Further, pads lead to higher rail deflection and distribution of the load to more sleepers, and the stresses in sleepers are therefore relieved. Here, we compared Austrian test sections with padded and unpadded concrete sleepers and with a difference in the ballast bed thickness: standard thickness of 30 cm against 20 cm below the sleeper. Fractal analyses and standard deviations of the track’s longitudinal level provided information about the sections’ long-term track behaviour over 20 years. We found that the standard solution with 30 cm ballast performed better in the long term compared to 20 cm. Additionally, the test section with padded sleepers on a reduced ballast bed thickness showed a lower maintenance demand than the unpadded concrete sleeper track on a 30 cm ballast bed.

1. Introduction

Concrete sleepers are widely used as standard components in modern ballasted railway tracks. While wooden sleepers still form the majority of installed sleepers worldwide, with the exception of the networks in the US, Australia, and Brazil, concrete sleepers are the choice for sleeper replacement and for new lines, especially in Europe, reaching 80% [1,2]. The durability is the major aspect of concrete sleepers compared to previously used wooden sleepers, even though the latter are chemically treated in order to withstand environmental impacts. The higher weight of concrete sleepers provides more stability, especially in the lateral direction, providing more side resistance [3] and thus allowing for higher speeds on a straight track. Nowadays, concrete sleepers are fabricated in a long-bed procedure, leading to lower production costs and consequently prices compared to wooden sleepers. There is one major disadvantage in the change from wooden to concrete sleepers: timber acts as an elastoplastic material in the sleeper–ballast interface, such that ballast stones may press into the sleeper surface. This increases the area of contact, reduces the stresses, and consequently protects the edges of the ballast stones. The stiff interface in the case of concrete sleepers reduces the area of contact between the sleeper and ballast to one-third, transferring the load to a very limited number of stones [4,5,6,7]. The overloaded edges of the stones can break. This leads to both high initial settlements of the track grid and the moving of fines down the ballast bed. The high initial settlements cause a rough longitudinal level, and the fines change the sieve curve distribution. Both effects are maintained over the entire service life as the process is repeated with every tamping action. As the ballast is the weaker partner in this interface (except in the case of magmatic/metamorphic materials with Los Angeles abrasion values lower than 12) [5], the high durability of concrete sleepers may only result in a long service life of the entire track by replacing or cleaning the ballast. This measure is costly and requires long track possession times that reduce the track availability.
Consequently, research and development has been aimed at improving concrete sleepers to overcome the issues with the stiff sleeper–ballast interface. The technology of an elastic layer on the bottom of the concrete sleeper has been applied [4,5,6,7,8,9,10,11,12,13,14]. The so-called under sleeper pads (USPs) provide elastoplastic behaviour, protecting the topmost ballast layer. Different materials are in use and different processes of applying the footings to the concrete sleeper are utilised. As the track service life reach 30 to 50 years in the case of concrete sleepers, the material properties need to remain constant over time and loading cycles. The long-term behaviour of USPs was investigated in laboratory tests [11,15]. Depending on the USP material and thickness and deformation characteristics, different material behaviours were observed under the influence of heat, frost, and cyclic loads. However, elastic USPs made from urethane showed a good long-term performance under the mentioned influences [11]. Numerous tests in the field and laboratory, research projects, and, in some countries, long-term experience have proved the improved track behaviour from the use of USPs. The track settlements are reduced, the tamping cycles are prolonged, and the ballast is protected, especially when soft pads are used [16].
The additional costs for this (sub-)component are recovered in the relatively short amortisation periods for tracks; life cycle costs are reduced by up to one-third [9]. However, there is discussion on whether the additional costs might be covered by a reduction in the ballast bed thickness, thus saving ballast material and associated costs (material, transport). The Austrian infrastructure manager ÖBB-Infrastruktur AG has been using USP concrete sleepers as a standard solution since 2010, having already equipped hundreds of track kilometres. ÖBB installed padded sleepers in a test section, in 2001, investigating the technical performance of USPs on 30 (standard solution) and 20 cm ballast below the sleepers’ lower edge. Therefore, the investigations described in this paper include track measurement data over a period of 20 years. This paper provides an evaluation of the track’s longitudinal level behaviour using time series analyses of the moving standard deviation during the mentioned period. Furthermore, fractal analysis was done to describe the ballast condition in the test section over time.

2. Methodology

2.1. Description of the Test Section

The test section is located on the western line of the Austrian Federal Railways ÖBB in a straight track section. The maximum permissible line speed is 200 km/h. Due to the location of the test section, the track experiences a conforming traffic load of about 55,000 gross-tonnes per day (as of 2020), with an almost unchanged traffic mix over the entire observation period. In addition, it can be assumed that the subsoil condition is good and constant for the entire test section. According to documentation, a soil replacement of 20 cm was carried out within relaying of the track. A frost protection layer with a total thickness of 45 cm and an overlying 8 cm bituminous asphalt layer form the upper part of the substructure. The superstructure is composed of padded concrete sleepers and 60E1 rails. The pads are based on polyurethane, with both elastic and cushioning properties.
According to the formerly applied test method DIN 45673-1 [17], the installed pads feature a static bedding modulus Cstat,DIN of 0.13 N/mm3. Considering Schilder’s [18] classification of USP stiffnesses, the pads of the test section can therefore be identified as ‘type soft’. Today, the testing standard of EN 16730 [19] is applied for identification of the static bedding modulus Cstat,EN, which for the pad in question delivers 0.075 N/mm3 (track category 3: main lines, high-speed lines). Thus, the pads of the test section are softer than those used by ÖBB-Infrastruktur AG nowadays [5]. Schilder [18] additionally specified the pads’ main fields of application depending on their stiffness: softer USPs have more impact on reducing ground-borne vibrations, whereas stiffer USPs mainly protect the track quality (ballast). However, in this paper, we focus on the influence of varying ballast bed thicknesses rather than the issues of vibration insulation, such as the research carried out by Zakeri [20] or Kraśkiewicz [21], for example.
Featuring sleepers with identical under sleeper pads, the test section differs merely in ballast bed thickness, which is 30 cm in subsection 1 and 20 cm in subsection 2. Since the relaying of track in 2001, there has been no change in both the substructure and superstructure. In the course of the investigations, not only the test section was investigated but also the adjacent track. Except for the sleeper pads, the track components of the adjacent areas are similar to the test section, as unpadded standard concrete sleepers were installed. Table 1 gives a detailed overview of the sub- and superstructures of the two subsections and the adjacent track.
Both the structural (track components) and temporal (observation period of 20 years) boundary conditions and the equal traffic load and thus stress allowed a well-founded comparison between subsections 1 and 2.
The point infrastructure such as bridges, pipe culverts, and turnouts is present in the adjacent track while the test section is an undisturbed through-going track. Figure 1 shows an overview of the test section with the adjacent track.
The 440-m-long subsection 1 is marked in light red, the 380-m-long subsection 2 is marked in light blue, and the adjacent areas are highlighted in light grey. The kilometre marking is set to 0 at the beginning of the subsection (km 0.00) and does not correspond to the original line kilometrage. Subsection 2 begins at km 0.44 and stretches to km 0.82. It should be emphasised that the main direction of traffic goes against the kilometre markings.
As the investigation focused on the track geometry, the ballast bed maintenance was of major importance. Line tamping was executed four times during the 20-year observation period: in 2005, 2013, 2017, and 2021. Additionally, subsection 2 was partly tamped in 2004.

2.2. Track Quality Assessment

The long-term behaviour of the reduced ballast bed thickness of the USP concrete sleepers was primarily examined using the longitudinal level. The track recording car EM 250 measures the longitudinal level every 25 cm at ÖBB-Infrastruktur AG, in addition to many other measurements. The longitudinal level is assessed by three wavelengths: short-, mid-, and long-waved. Table 2 gives an overview of the wavelength range.
The mid- and long-waved longitudinal level correspond to the definition in the European standard EN 13848-1 [22]. In this standard, the mid-waved (3–25 m) longitudinal level is specified as D1 while the long-waved level (25–70 m) is defined as D2. As the line speed is limited to 200 km/h, D3 (70–150 m) was not considered.
A precise positioning of the track recording car’s raw data allowed in-depth data analysis. For this purpose, Fellinger’s [23] algorithm was applied. Based on the post-positioned raw signal, two quality indices provided the foundation of the investigations. The standard deviation (SD) describes the condition of the track’s longitudinal level, whereas the fractal values of the mid-waved range evaluate the condition of the ballast bed.

2.2.1. Standard Deviation of the Longitudinal Level

The standard deviation of the mid-waved longitudinal level (3–25 m) was calculated using a moving influence. Neuhold [24] classified the “moving standard deviation” as a valid track quality index that describes track quality problems within the chosen influence length steadily in contrast to discretely calculated standard deviations. Furthermore, he recommended this method of calculation, particularly for time series analyses of the longitudinal level, to obtain reliable results. This paper comprises two different influence lengths. The influence length of 100 m shows the through-going quality while the 10 m influence length gives more details on the singularities in the longitudinal level. For this reason, the standard deviation of the mid-waved longitudinal level was calculated twice using an influence length of 10 and 100 m. Before the calculation steps of the standard deviations are described, an overview and explanation of the utilized abbreviations are given in Table 3.
In the first instance, the moving standard deviation was calculated for the longitudinal level 3–25 m of both the left and right rail. For every ith data point, the longitudinal level’s moving standard deviation SDi_le belonging to the left rail and SDi_ri for the right rail was calculated as depicted in Equation (1)
S D i _ l e / r i = 1 N 1 i = 1 N ( x i _ l e / r i x i _ m e a n _ l e / r i ) 2
SDi_le—moving standard deviation of the left rail at the ith data point in mm.
SDi_ri—moving standard deviation of the right rail at the ith data point in mm.
xi_le/ri—value of the ith data point in the data set of the left or right rail’s longitudinal level.
xi_mean_le/ri—mean value of all data points considered at the ith data point of the left or right rail.
N—number of data points considered (41 at 10 m and 401 at 100 m influence length).
Equation (1) describes the calculation for the left and right rail and both influence lengths (10 and 100 m). The calculation results of the depicted equation were four standard deviations at every data point i: SDi_le(10 m), SDi_ri(10 m), SDi_le(100 m), and SDi_ri(100 m). As the longitudinal level provides data every 25 cm, 20 data points (5 m) before and after the viewing point i were considered for the calculation of the moving standard deviation at an influence length of 10 m. In total, 41 data points were used to determine SDi_le(10 m) and SDi_ri(10 m) at every ith data point. This applies analogously to the influence length of 100 m, using, in total, 401 and 200 data points (50 m) before and after the viewing point i.
Subsequently, the mean values of both rails’ moving standard deviations SDi_le and SDi_ri at every ith data point were obtained to consider both rails’ longitudinal level in the investigations. The calculation result of Equation (2) was one mean standard deviation at every data point i, and, therefore, every 25 cm for each influence length: SDi(10 m) and SDi(100 m):
S D i = S D i l e + S D i r i 2
SDi—mean value of the left and right rail’s standard deviation at the ith data point in mm.
SDi_le/ri—standard deviation of the left/right rail at the ith data point in mm.
To obtain the average track quality of a section (and not just at one cross-section), the arithmetic mean standard deviation SDmean was calculated over all standard deviations SDi in each subsection in the last step. Equation (3) leads to one arithmetic mean standard deviation for each subsection:
S D m e a n = 1 j S D i _ j j
SDmean—arithmetic mean of all SDi in a subsection in mm.
SDi_j—mean value of the left and right rail’s standard deviation at the ith data point in mm.
j—number of SDi in a subsection (1080 for subsection 1 and 720 for subsection 2).
In determining SDmean for each subsection, the transition zones were removed to exclude the influence of isolated defects. For this reason, only 270 m (instead of 440 m) of subsection 1 and 180 m (instead of 380 m) of subsection 2 were considered. As SDi was present for every data point i and every 25 cm, 1080 SDi values were added up in subsection 1 and 720 SDi values in subsection 2.
The determination of SDi(10 m), SDi(100 m), and SDmean(100 m) for each measurement run over time allowed capturing of SDi(10 m) and SDi(100 m) in waterfall diagrams and SDmean(100 m) in time series analyses. This is discussed in Section 3.

2.2.2. Time Series Analyses

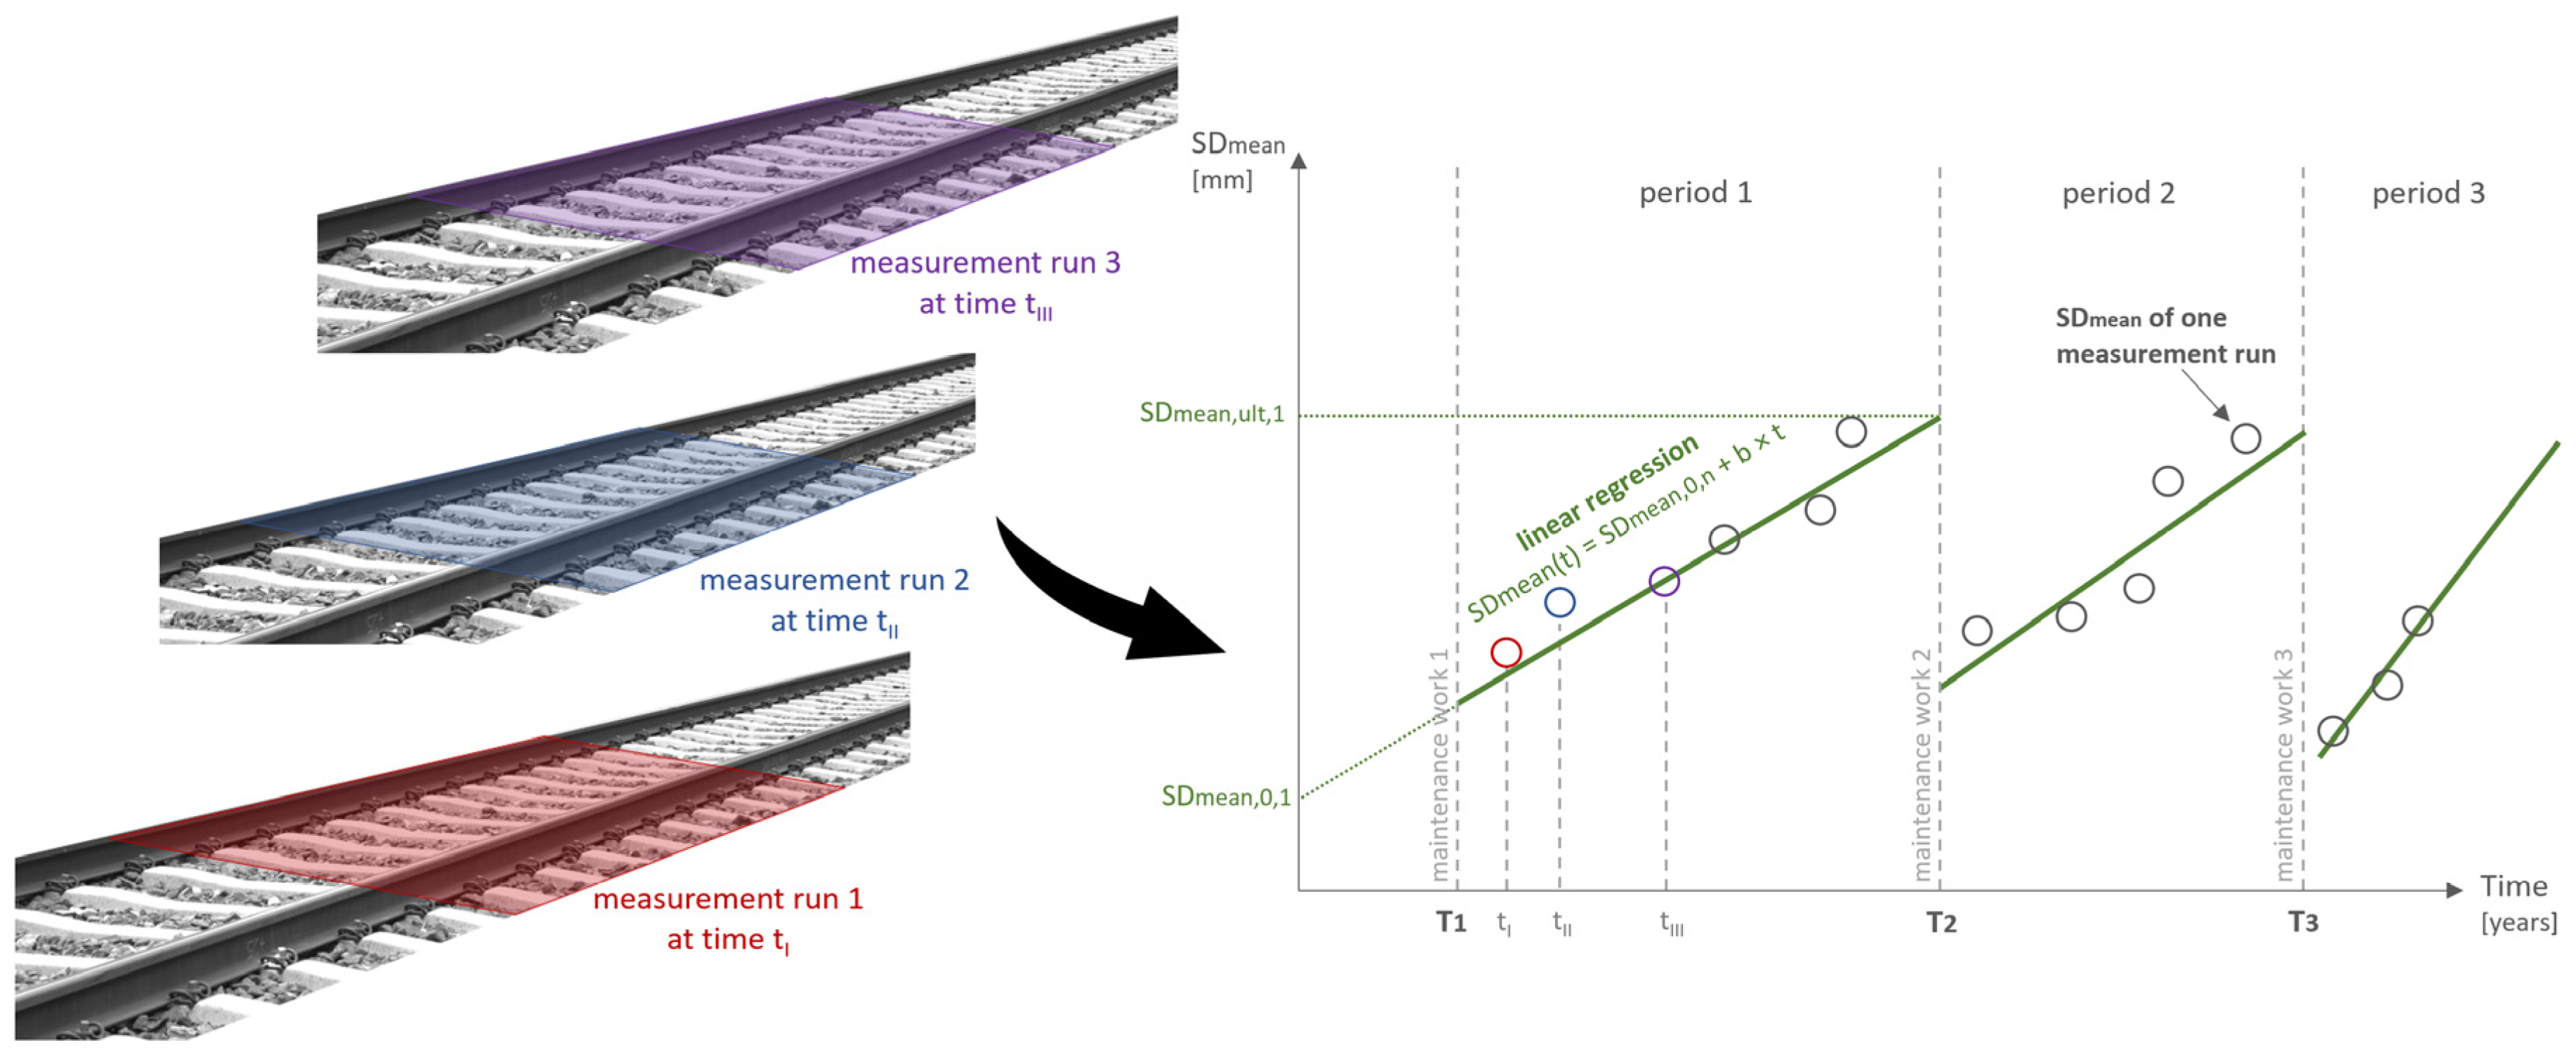
Time series analysis enables an analysis of track behaviour over time. It can be carried out either for cross-sections or for selected sections using the SDmean values. To ensure the comparison of both subsections, the latter method was chosen. By applying Equations (1)–(3) for every measurement run between the years 2001 and 2021, a time series analyses for the investigated sections was possible. Figure 2 shows an example of such a time series. The first SDmean value, shown as a red circle, describes the track quality of the longitudinal level in the reddish track area at the time tI. The second SDmean value, coloured in blue, stands for the track quality in the same track area but at the time tII. The same applies to the third (violet circle in Figure 2) at the time tIII and the other SDmean values at a later time, coloured in grey. High mean standard deviation values SDmean indicate a worse longitudinal track quality.
As tamping actions achieve the recovery of track quality and thus significantly decrease the standard deviation, one deterioration period is limited by two tamping actions, named maintenance work in Figure 2. Therefore, each tamping action starts a new deterioration period in a certain time T. A series of deterioration periods present a track deterioration time series for a certain section (or, in general, a cross-section). Figure 2 shows such a time series analysis of a section for the first three deterioration periods.
To identify the longitudinal track deterioration rate and hereafter the track quality behaviour, a linear regression function was used as depicted in Equation (4). Neuhold [24] investigated the most suitable regression function for describing the Austrian track quality behaviour. Therefore, he took the logarithmic, exponential, and linear functions into consideration. Comparison of R2, the proportion of explained variation, and the total variation between the three approaches was carried out to assess the linear function for the best fitting model to describe the real track deterioration behaviour over time (although the other two functions showed high R2 values too).
Applying the linear regression function, the track quality at a specific time SDmean(t) is specified by means of the initial track quality SDmean,0,n, the deterioration rate b, and time t. This is shown in Equation (4):
S D m e a n ( t ) = S D m e a n , 0 , n + b × t
SDmean(t)—track quality at the time t after the last invention.
SDmean,0,n—theoretical track quality of the nth deterioration period at time 0 (intersection with y-axis).
b—deterioration rate.
t—Time.
For the investigated section, a linear regression function SDmean(t) was determined by the SDmean values for each deterioration period and depicted as a green line in Figure 2 in an exemplary manner.

2.2.3. Fractal Analysis

The quality behaviour of the ballast bed over the 20-year observation period was evaluated using mid-waved fractal values. Fractal analysis is a methodology used to describe the roughness of signals using polygons. This methodology belongs to research and development that occurred in 1967, when Mandelbrot [25] examined the coastline paradox by taking the example of Great Britain’s coast. Landgraf and Hansmann [26] described a procedure in which the polygons are divided into shorter and shorter subsegments, whereby the polygons become longer and longer. Thereby, the signal is described more precisely. If the total lengths of the polygons are plotted against the segment lengths for all iterations in a logarithmic scale, a linear regression can be calculated over the data points. The slope of the linear regression was used to infer the fractal dimensions. The fractal analysis distinguishes between three dimensions: short-, medium-, and long-waved. The mid-waved dimension is decisive for the ballast quality while the long-waved dimension indicates substructure issues. The analysed test section consisted of a bituminous asphalt layer, so this paper merely presents the mid-waved dimension as the long-waved dimension is inconspicuous.
The fractal values are always negative values. Areas with low negative fractal values indicate a better condition than strongly negative fractal values. The fractal analysis was executed for both the left and right rail. This paper includes only the mid-waved fractal dimension of the left rail since the data of the right and left rail hardly differ and lead to the same conclusion.

3. Results

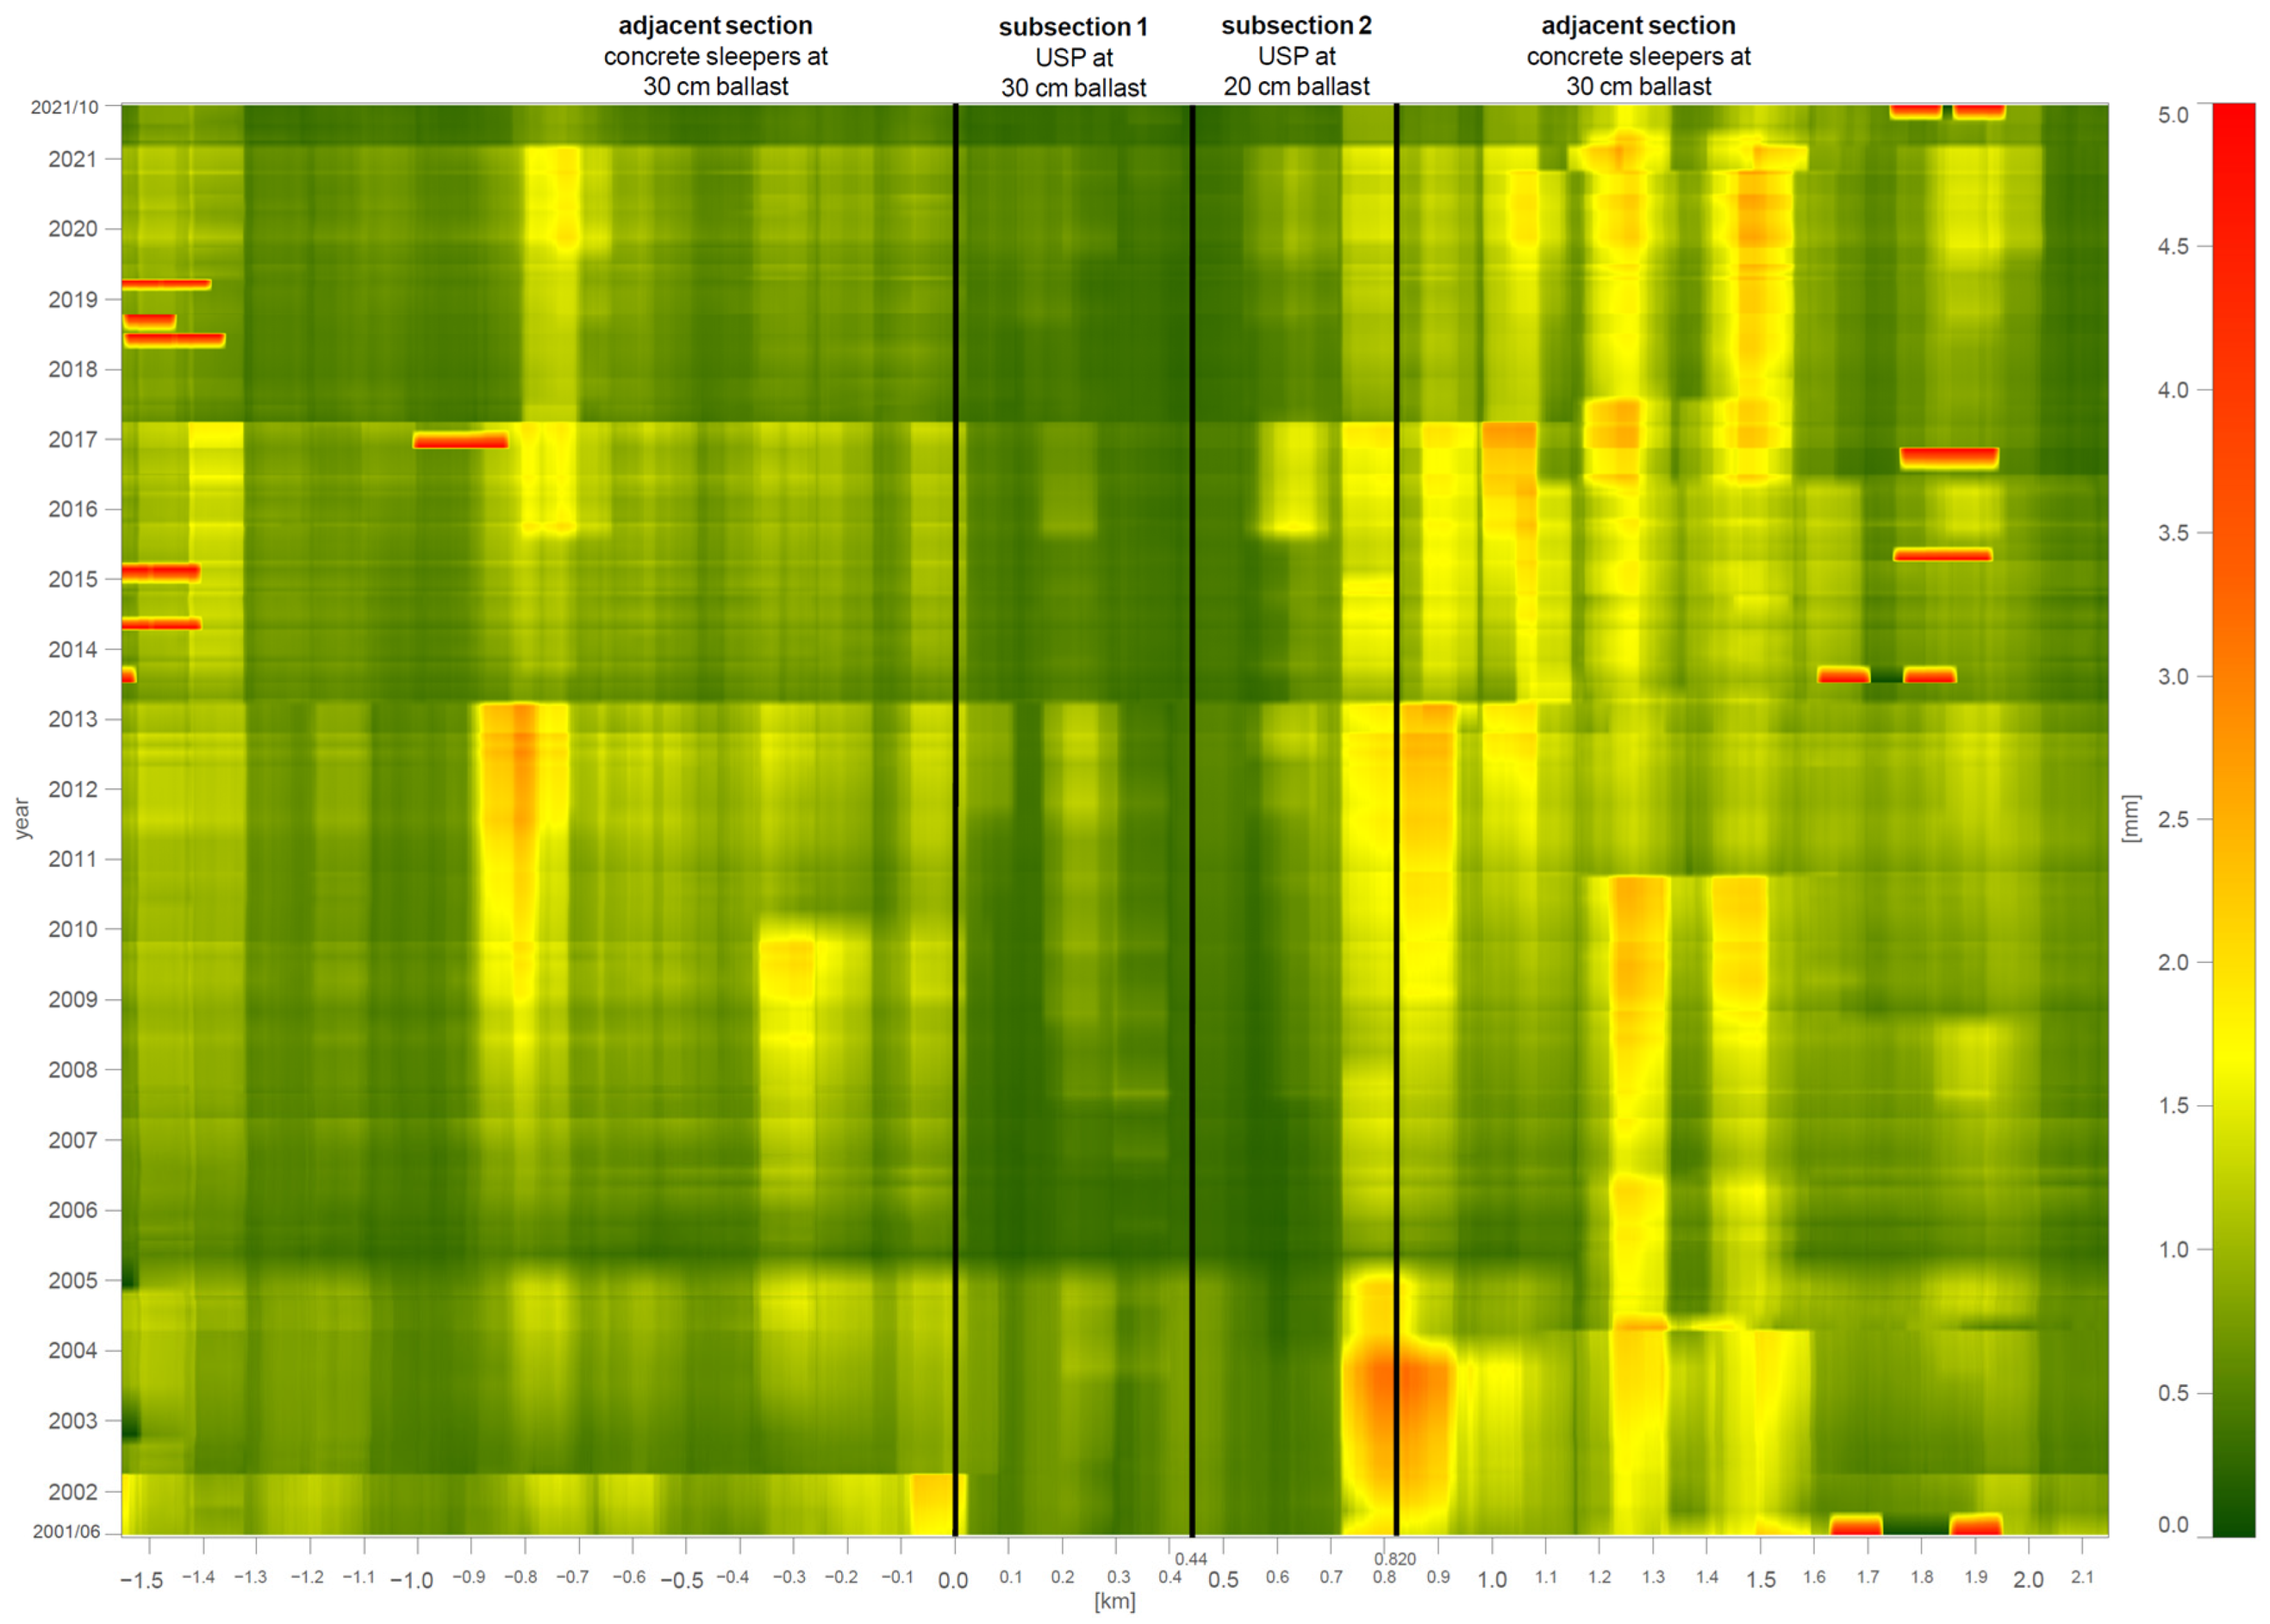
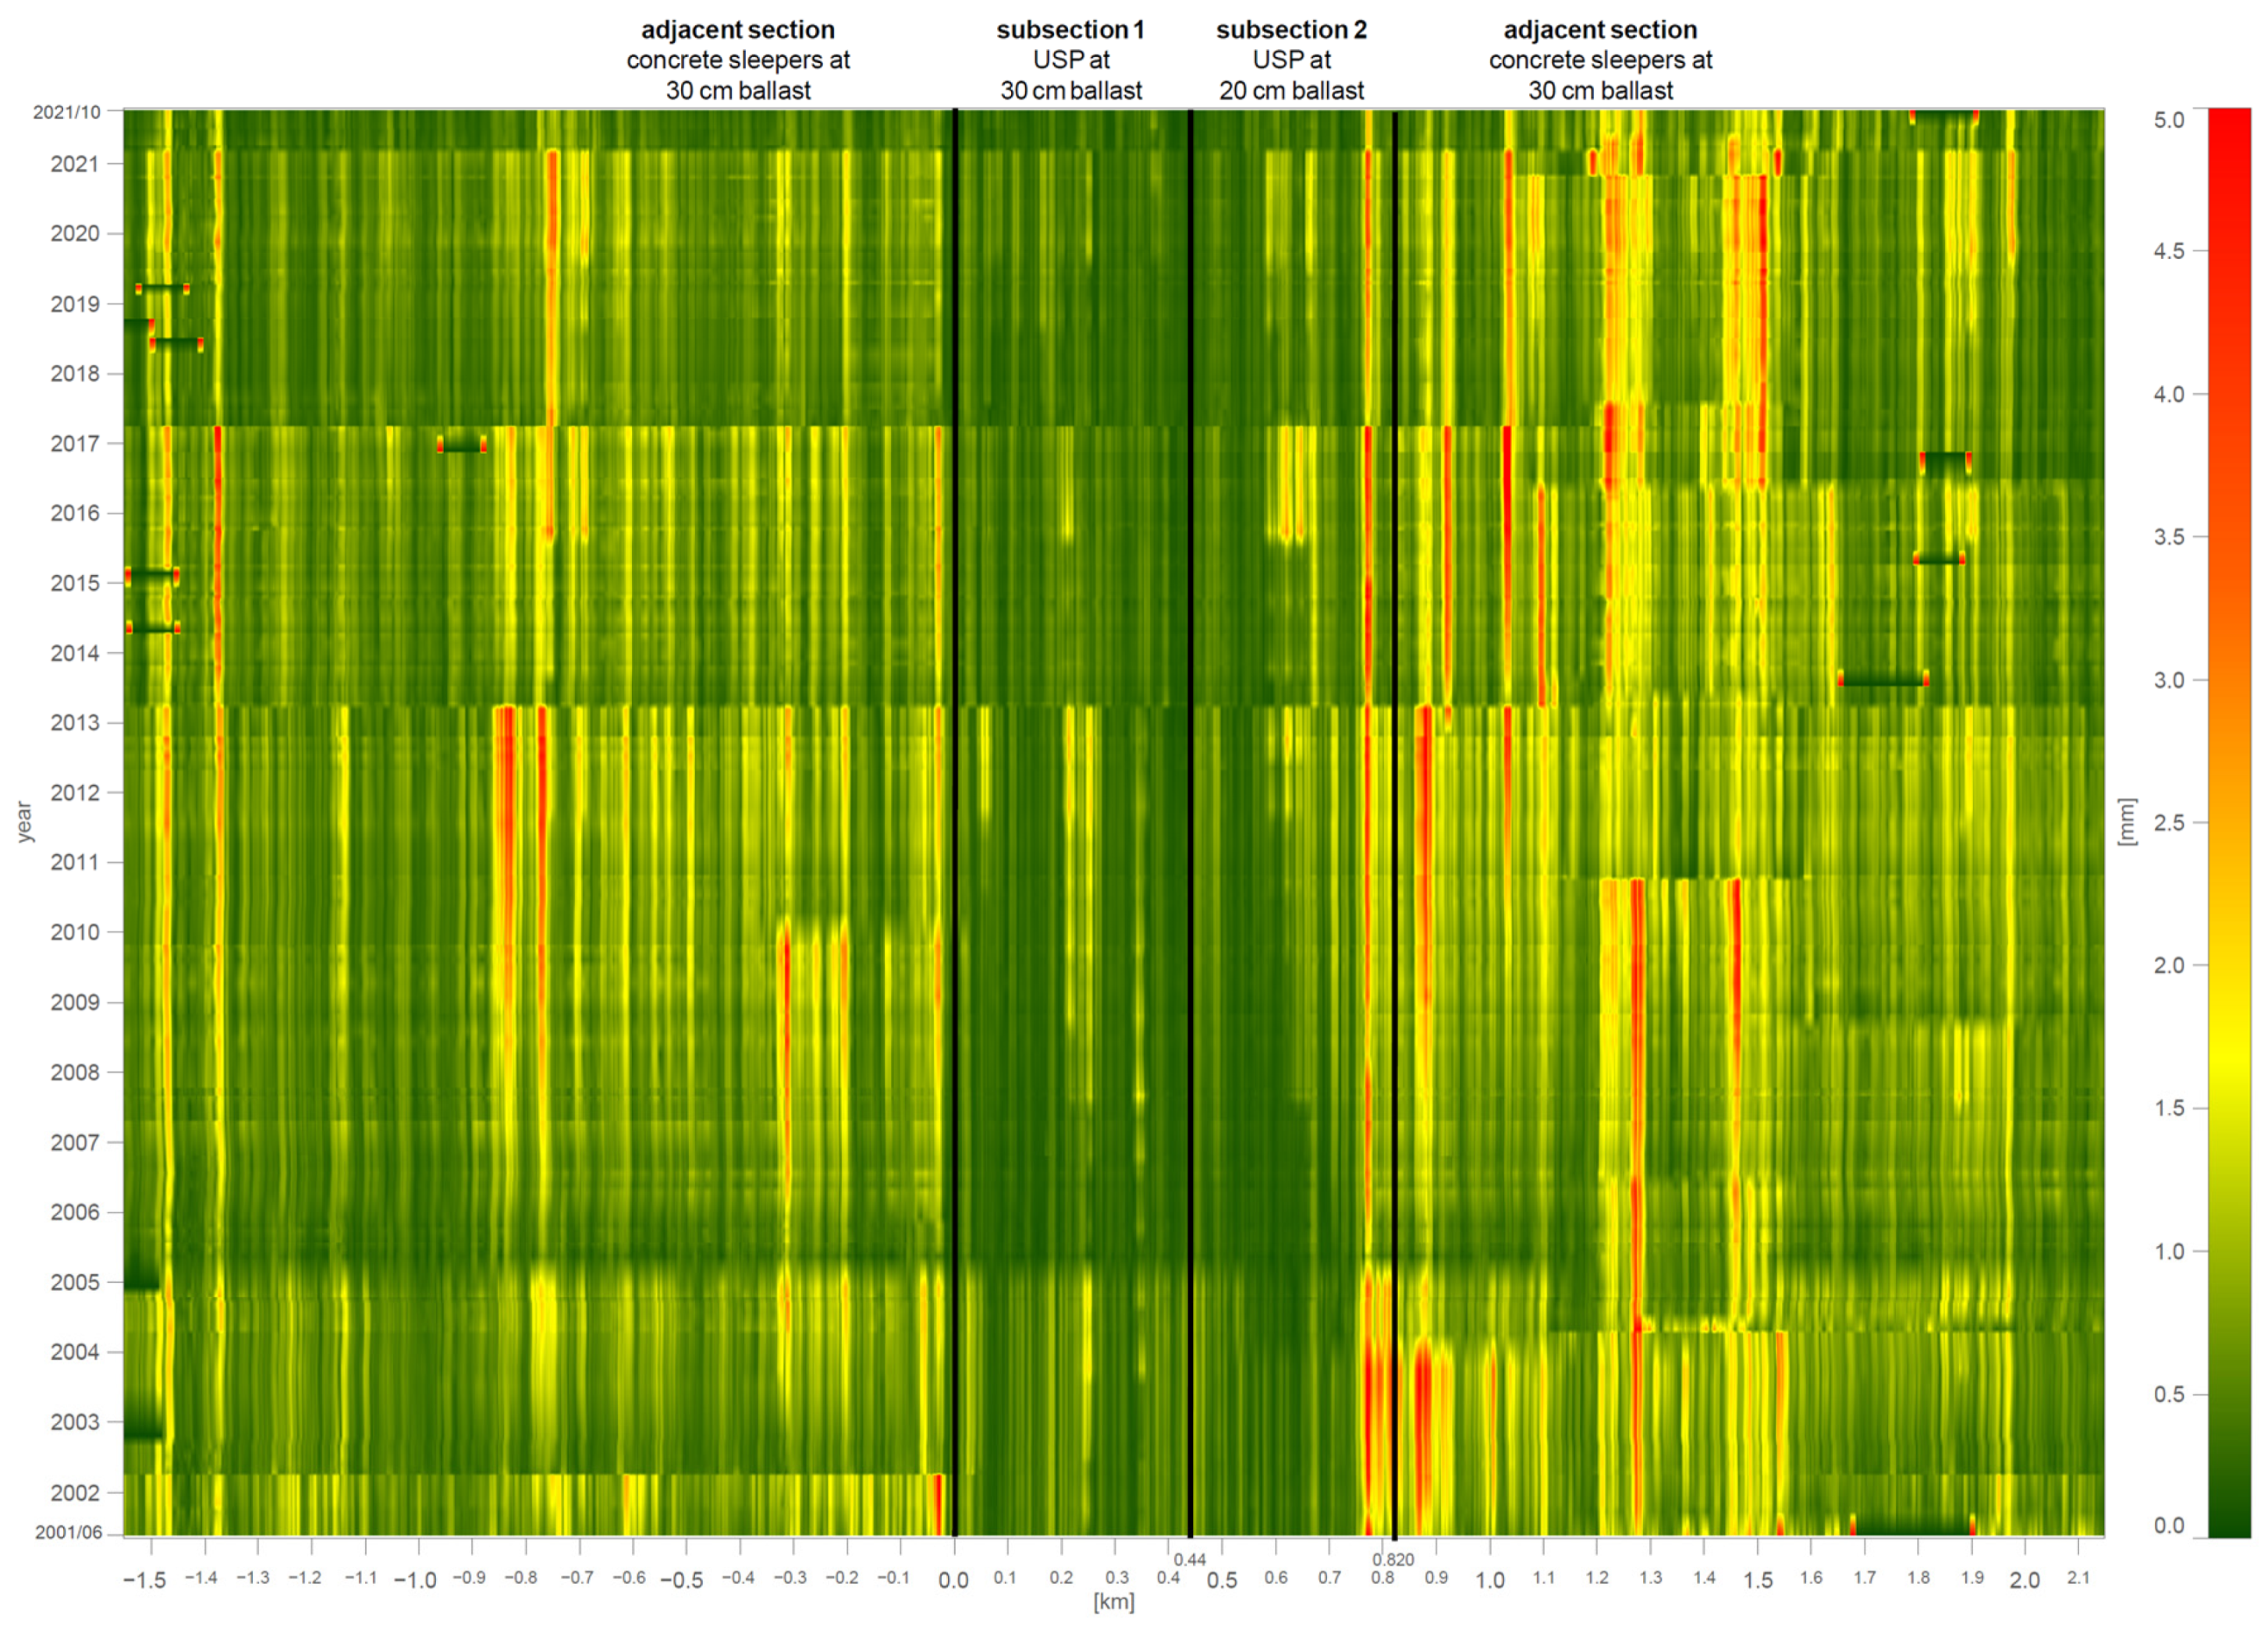
Figure 3 depicts a waterfall diagram of the standard deviation with an influence length of 100 m calculated according to Equation (2) (SDi,(100 m)). The time span is 2001 to 2021. The green colour signifies good track quality (low standard deviation) while the yellowish and reddish colours indicate increasingly poor track quality. The same applies to Figure 4; however, in Figure 4, the influence length is shortened to 10 m, which allowed a more detailed investigation of the isolated defects.
Both waterfall plots, SDi(100 m) and SDi(10 m), indicate a better geometrical track quality in the two test sections compared to the adjacent track segments (higher share of green colour, i.e., lower standard deviation). Omitting the transition zones and focusing on the centre areas of the test sections, subsection 2 (20 cm ballast) showed a higher geometry deterioration than subsection 1 from 2013 onwards, 12 years after installation (Figure 3). At the transition zones between the individual sections where the sleeper type and/or ballast thickness change, the track geometry deteriorated faster than in the undisturbed areas. The most pronounced track geometry defect was observed around km 0.82, where both the sleeper type and ballast thickness change (Figure 4).
Analysis of the track quality in a time sequence ensured a quantitative comparison of the subsections in addition to the qualitative one (waterfall plots). In addition to the absolute values of the standard deviation, the loss of quality, or deterioration, was also of importance in assessing the long-term behaviour of the track.
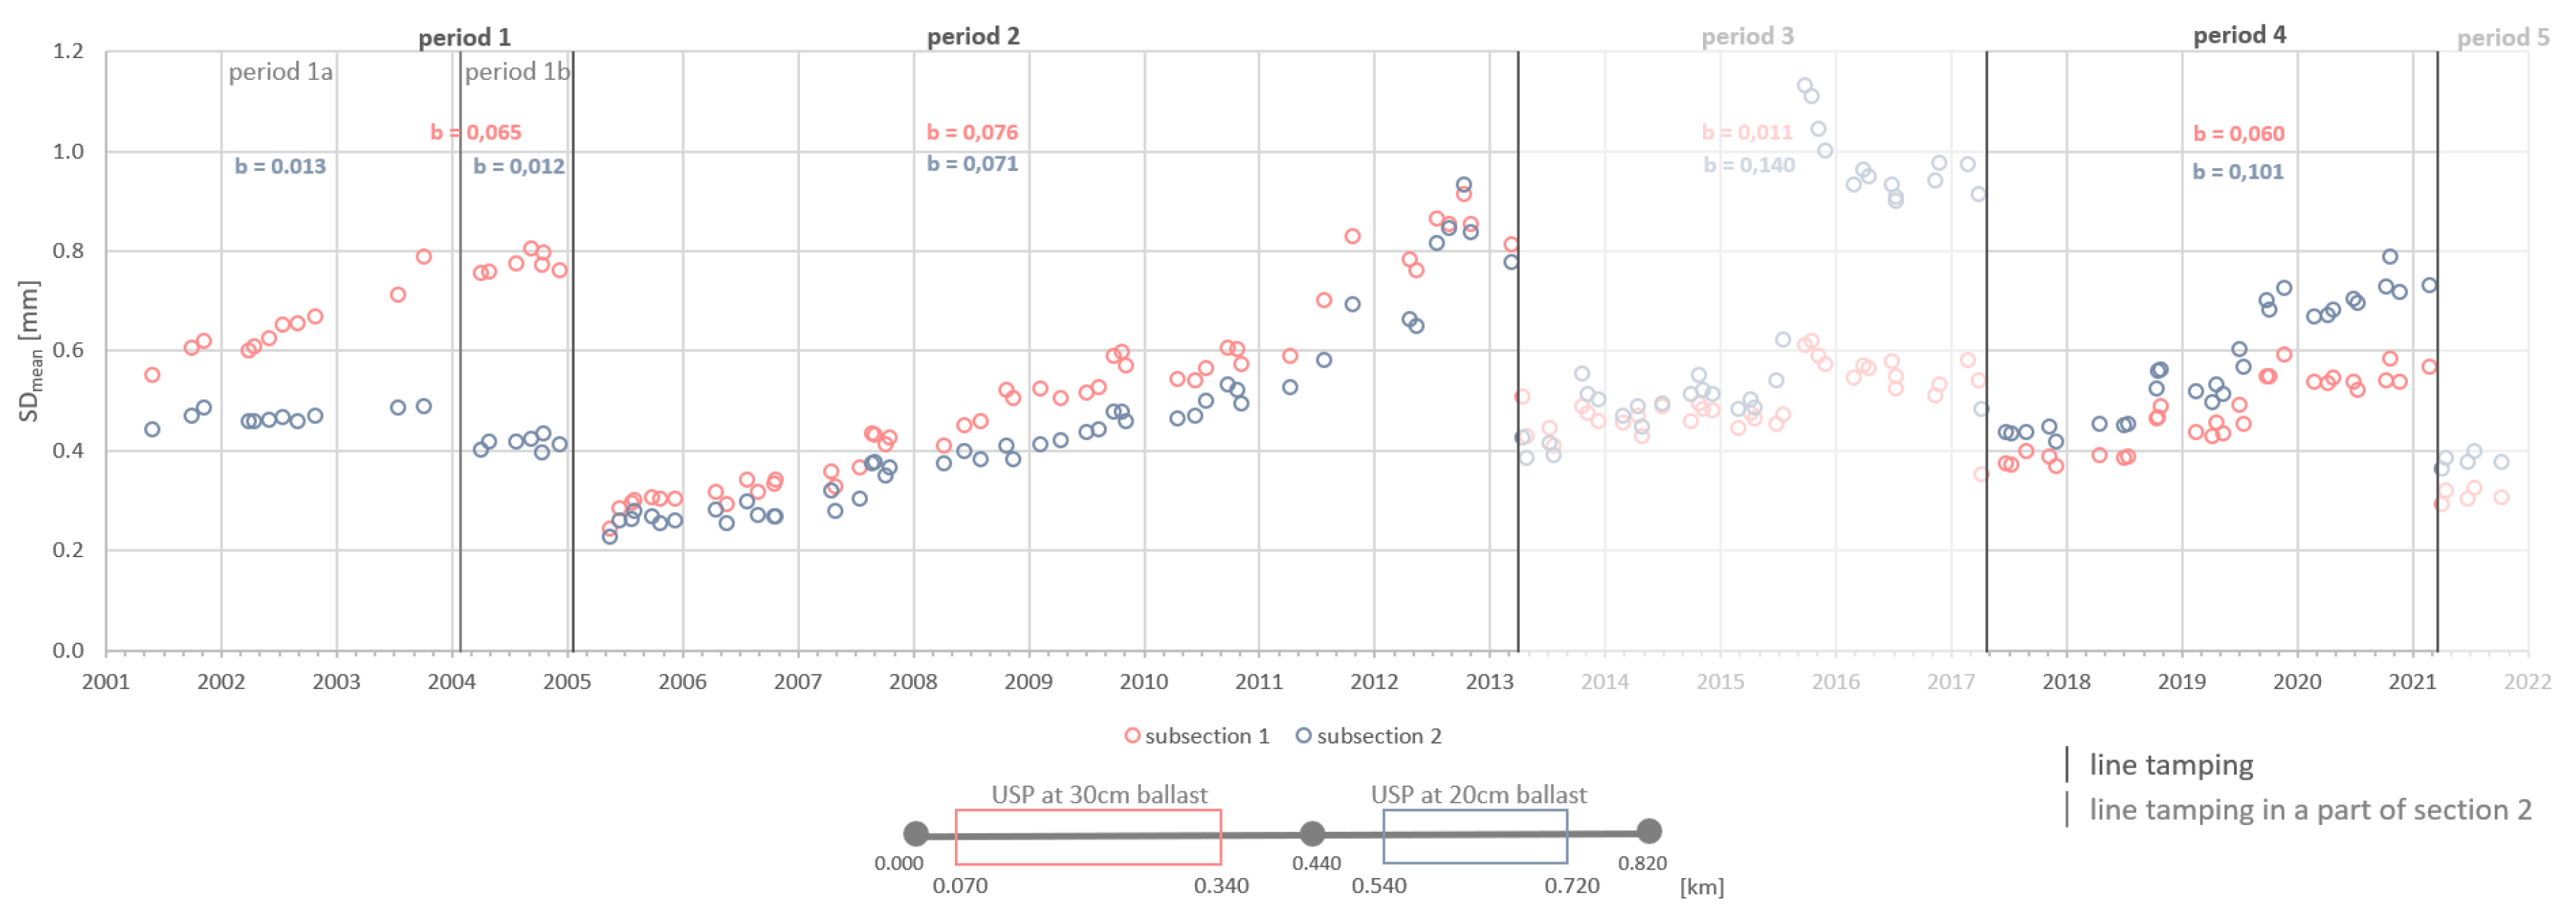
Figure 5 shows the mean standard deviation with an influence length of 100 m (SDmean(100 m)) of subsection 1 (red) and 2 (blue) according to Equation 3. For both subsections, the transition zones were removed, enabling investigations of the general track behaviour while excluding the influence of isolated defects.
Deterioration period 1 begins with track construction in 2001 and ends with the first through-going tamping operation in 2005. During this period, subsection 2 (USP, 20 cm ballast) showed a better overall performance than subsection 1 (USP, 30 cm ballast). Both the initial track geometry quality, expressed by the mean standard deviation of the longitudinal level over 100 m, and the rate of geometry deterioration were lower in subsection 2. As a result, the final track quality at the beginning of 2005 was considerably better in subsection 2, with a mean standard deviation of ~0.4 [mm] compared to ~0.8 [mm] in subsection 1. In 2004, a tamping operation was conducted in subsection 2 only. However, even without this maintenance measure, subsection 2 would have exhibited a better track geometry than subsection 1 at the end of the deterioration period, assuming continuous progress of the track deterioration. Deterioration period 2 begins with the first through-going tamping operation in 2005. This tamping operation harmonized the absolute level and the deterioration rate of the track geometry. The established track quality was almost identical in both sections, with average standard deviation values of approximately 0.23 [mm]. Furthermore, the subsequent rate of geometry deterioration was also similar at 0.076 [mm/year] and 0.071 [mm/year] for subsections 1 and 2, respectively. Consequently, the final track quality of deterioration period 2 was comparable in both subsections. Deterioration period 3 was characterised by an abrupt increase in the standard deviation in subsection 2 in 2015. This was caused by the emergence of severe geometry issues around km 0.60 to 0.65. Due to this non-representative discontinuity in the track geometry deterioration, period 3 was not considered in the investigations of the long-term track quality behaviour. Deterioration period 4, beginning with a through-going tamping operation in the first quarter of 2017, was marked by a reversed trend compared to deterioration period 1. The standard deviation right after tamping showed a better track quality in subsection 1 (30 cm ballast). Furthermore, the track geometry deterioration rate of subsection 1 was also considerably lower than in subsection 2 (0.060 [mm/year] vs. 0.101 [mm/year]). As a result, subsection 1 featured a better track geometry quality at the end of the deterioration period. The trend of deterioration period 4 seems to be prolonged in period 5. However, there were not enough data points to calculate reliable results for this period.
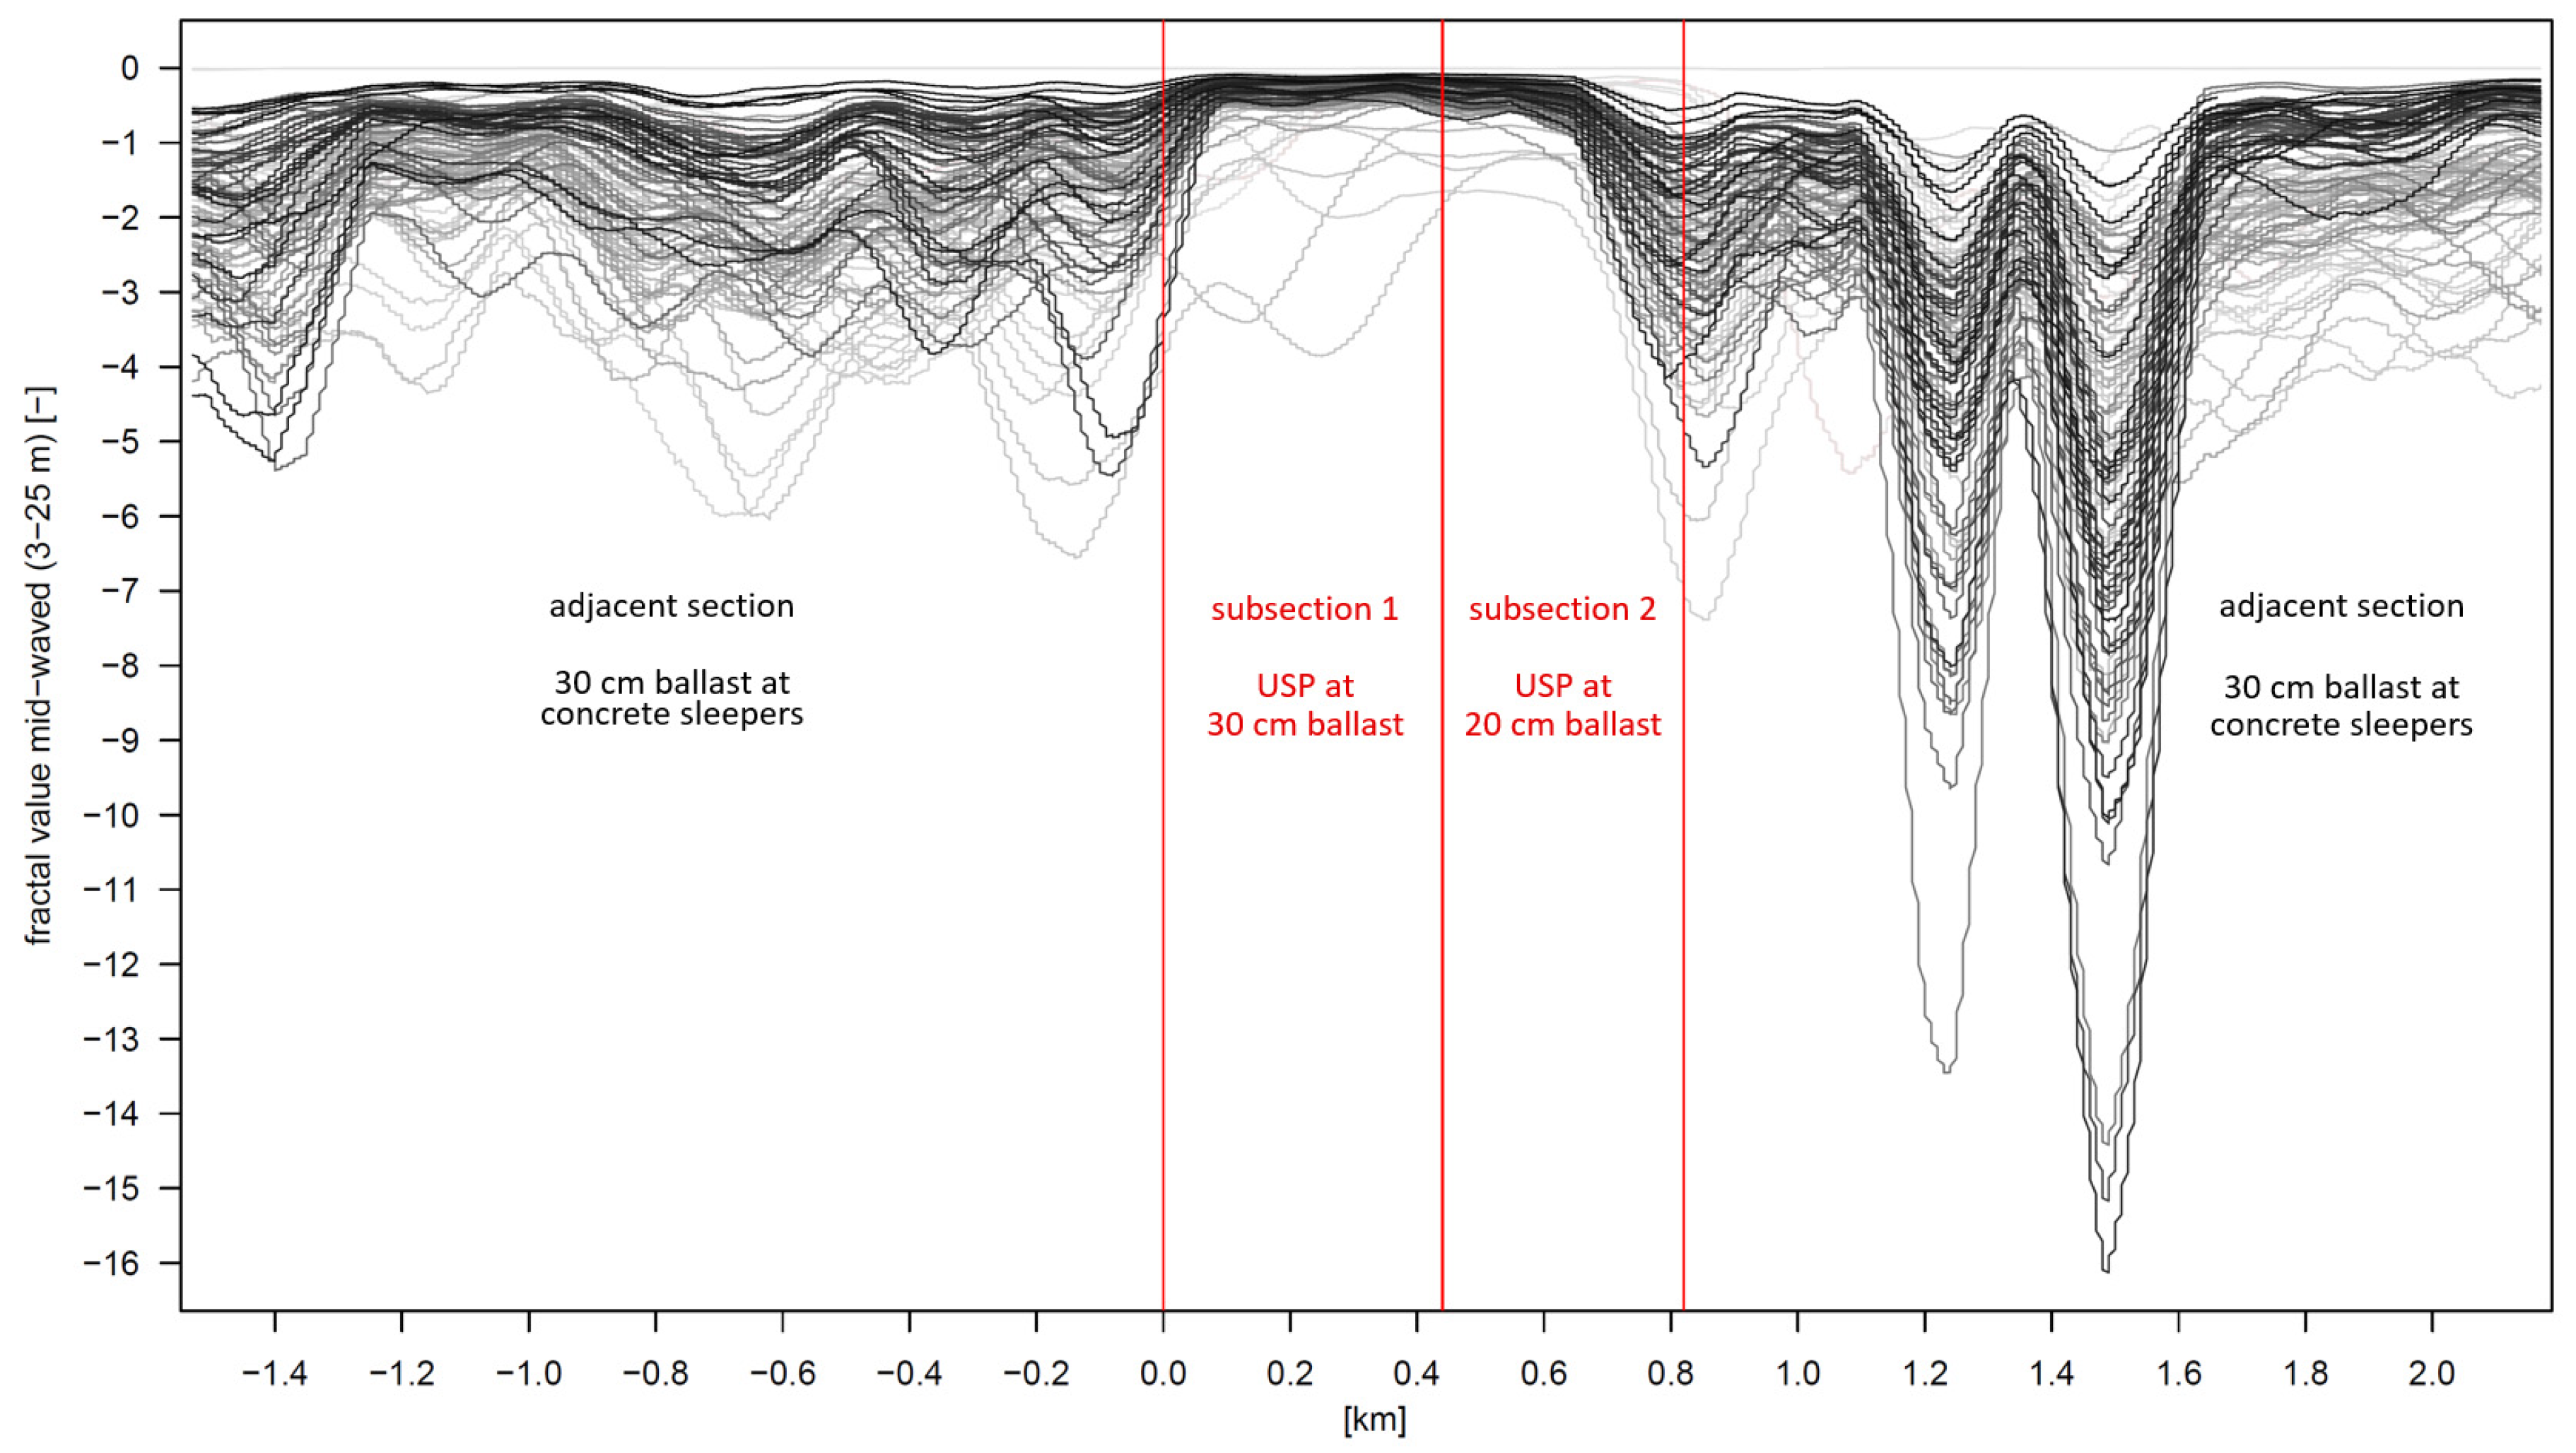
In addition to the track geometry behaviour analyses, the condition of the track ballast along the two test sections and the adjacent track areas was also evaluated. Fractal analyses of the mid-waved dimension (Figure 6) revealed a very good ballast condition in both test sections, with the values being close to zero (zero equals optimum conditions). Focusing on the centre areas of the two test sections (approximately km 0.20 and km 0.60), subsection 1 featured a marginally better ballast condition than subsection 2. However, the ballast condition of both test sections, equipped with concrete sleepers with under sleeper pads, was superior to the neighbouring track areas with conventional concrete sleepers (significantly lower, i.e., worse, fractal values).

4. Discussion

The entire analysed track stretch—the two test sections and the adjacent track segments—featured continuous parameters apart from the sleeper type and ballast bed thickness. The track age, track load, line speed, rail type, curvature, and substructure were identical. Therefore, several conclusions can be drawn regarding the behaviour of the padded concrete sleepers and the effects of a reduced ballast bed height.
The waterfall diagrams in Figure 3 and Figure 4 demonstrate the positive effects of padded concrete sleepers in comparison with conventional concrete sleepers. Over the entire life span of the track, areas with concrete USP sleepers showed a lower standard deviation, i.e., a better track quality. This behaviour is attributed to the better load distribution from the bottom of the sleeper to the ballast and is in accordance with published results [27,28]. Transition zones between different sleeper types with changing track stiffness are prone to the emergence of track geometry defects. This can be observed at the beginning of subsection 1 and at the end of subsection 2.
The quantitative comparison of the two test sections (Figure 5) shows that subsection 2 (20 cm ballast) performed better early in the service life than subsection 1 (30 cm ballast). This may be explained by the better compaction of the ballast during track construction. The tines of the tamping machine that establishes the track geometry reach approximately 10 cm below the sleeper. In the case of a 20 cm ballast bed, 50% of the ballast height beneath each sleeper is compacted while this number shrinks to 33% in the case of a 30 cm ballast bed. Thus, tracks with a higher ballast bed must feature higher initial settlements after construction, i.e., a higher standard deviation and a higher deterioration rate. However, the difference in the track behaviour between the two test sections with different ballast thicknesses is levelled with the first through-going tamping operation. More importantly, over time, the test section with the conventional structure (30 cm ballast) increasingly outperforms the track segment with the shallower ballast bed. Presumably, the better load distribution and dampening effects of the higher ballast bed have a full effect in the later stages of the track service life.
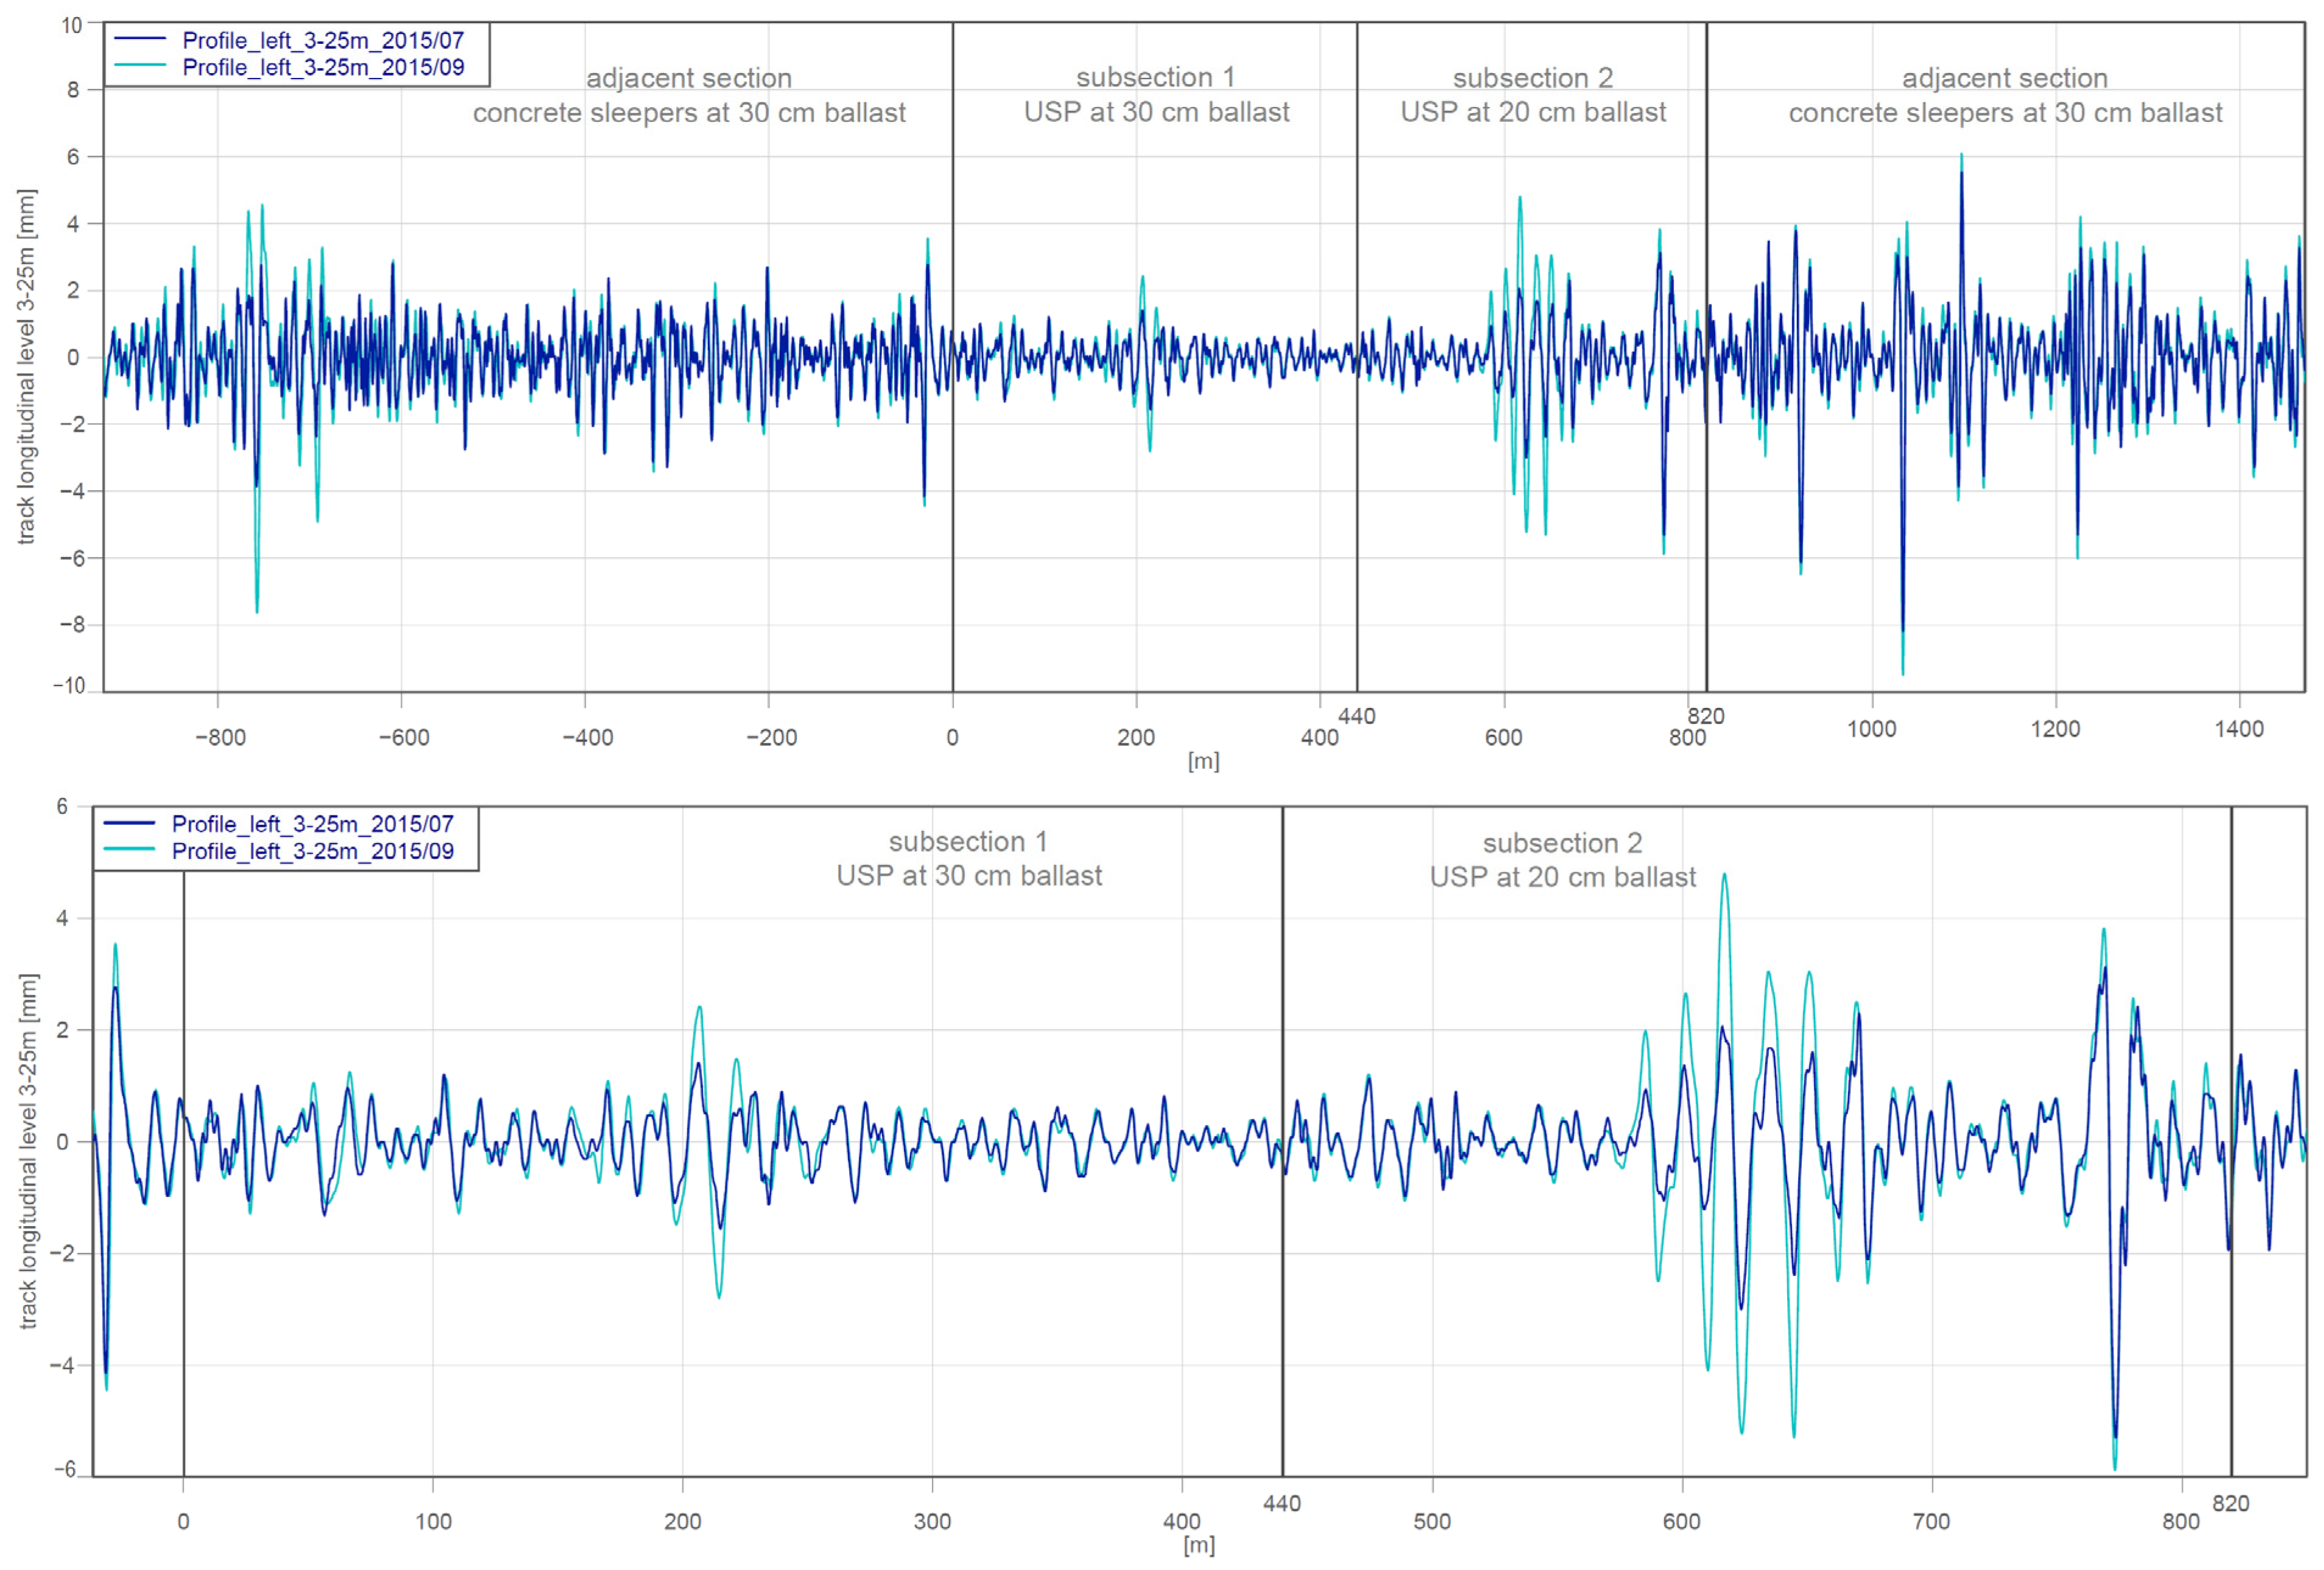
In addition to the disadvantageous behaviour of the reduced ballast bed in the long term, it also seems to be more sensitive to the initiation of isolated defects. Figure 7 shows the growth of isolated defects in subsection 1 and subsection 2 at km 0.20 and km 0.62, respectively. The defect in subsection 2 is particularly pronounced. The lower ballast bed thickness and thus lower elasticity of the track might play a significant role in this behaviour. However, as the root cause of this specific geometry irregularity is unknown, an attribution of this defect to the low bedding height is not definitively possible (measurement errors can be excluded as the signal characteristics of two consecutive measurement runs are almost identical).
The high fractal values (i.e., good ballast condition) in the two test sections (Figure 6) confirm prior analyses regarding the positive effects of under sleeper pads [27]. These elastic pads increase the area of contact between the sleepers and ballast, which leads to lower stress in the stones and a better overall load distribution. As a result, the track quality is improved (Figure 4 and Figure 5), the ballast is conserved, and the track service life is prolonged.
Regarding the economic consequences, a reduction in the ballast bed thickness of 10 cm helps to save 650 m3 of ballast per kilometre in reinvestment. This is about the same amount of money needed for the equipment of the concrete sleepers with under sleeper pads. Considering the doubled deterioration of the track geometry in the 20 cm section from the year 16 onwards, the track tamping needs will consequently double. This is why we expect less expansion of the service life (23%) compared to unpadded tracks instead of plus 40% in the case of padded sleepers and 30 cm of ballast. Calculating the life cycle costs (LCCs) based on the average annual costs, savings of less than 5% in renewal costs due to reduced ballast requirements lead to reduced savings over the entire service life, at 22% compared to 28%. In total, the increasing LCCs are more than twice the initial savings. Thus, economically reducing the ballast bed thickness also does not lead to a better result.

5. Summary and Conclusions

In the analysis of this single test section, once again, we proved that under sleeper pads perform as intended, improving the track quality, and decreasing track deterioration. These results are in line with the results gathered from netwide analyses [28] and international experience. The expectation of reducing maintenance costs due to a reduction in tamping demands is manifested. This effect is also true in the long term as track deterioration rates did not increase even after 20 years of operation. Moreover, the assumption of achieving longer service lives due to reduced ballast deterioration seems to be plausible based on the fractal values. However, a reduced ballast bed thickness decreases the positive effects of under sleeper pads as the performance in the second half of the service life was lower compared to the track on 30 cm of ballast, an effect that was now possible to analyse as the investigated section has been in operation for 20 years. Thus, the conclusion drawn from the first years of operation need to be reconsidered. Still, under sleeper pads improve track behaviour compared to standard concrete sleeper pads, but the reduced ballast bed thickness has a counterproductive effect. The track geometry deterioration doubled in the second half of the service life according to the results of the test section. Looking at the total costs, the savings achieved due to the use of less ballast during relaying are relatively low at less than 5% compared to the reduced savings in maintenance and depreciation. In summary, there is no point economically or technically in adjusting the ballast bed to lower thicknesses.
The test section also showed that padded sleepers on 20 cm ballast still perform better than tracks with conventional unpadded concrete sleepers. Therefore, under sleeper pads are suitable in the case of a low ballast bed thickness triggered by external boundary conditions such as bridges or tunnels. Generally, under sleeper pads for concrete sleepers are assumed to prolong the service life of a ballast track by reducing stresses in the ballast. Fractal analysis of the longitudinal level provides a method for assessment of the ballast quality in investigating the mid-waved dimension. Continuous monitoring of this quality figure will help to support the expected benefits in the future.

Author Contributions

Conceptualization, S.M. and U.E.; methodology, S.M.; validation, S.M., U.E. and S.O.; formal analysis, U.E. and S.O.; writing—original draft preparation, S.M. and U.E.; writing—review and editing, S.M., U.E. and S.O.; visualization, U.E.; supervision, S.M.; funding acquisition, S.M. All authors have read and agreed to the published version of the manuscript.

Funding

This paper is supported by TU Graz Open Access Publishing Fund. Research was funded by Getzner Werkstoffe GmbH, data have been provided by ÖBB-Infrastruktur AG.

Institutional Review Board Statement

Not applicable.

Informed Consent Statement

Not applicable.

Data Availability Statement

Not applicable.

Conflicts of Interest

The authors declare no conflict of interest.

References

  1. Ferdous, W.; Manalo, A. Failures of mainline railway sleepers and suggested remedies—Review of current practice. Eng. Fail. Anal. 2014, 44, 17–35. [Google Scholar] [CrossRef]
  2. El-sayed, H.M.; Fayed, M.N.; Riad, H.S.; Zohny, H.N. A review of the structural performance of prestressed monoblock concrete sleepers in ballasted railway tracks. Eng. Fail. Anal. 2022, 140, 106522. [Google Scholar] [CrossRef]
  3. Koyama, E.; Ito, K.; Hayano, K.; Momoya, Y. A new approach for evaluating lateral resistance of railway ballast associated with extended sleeper spacing. Soils Found. 2021, 61, 1565–1580. [Google Scholar] [CrossRef]
  4. Monaco, V. Untersuchungen zu Schwellenbesohlungen im Oberbau. Ph.D. Thesis, Graz University of Technology, Graz, Austria, 2003. [Google Scholar]
  5. Berghold, A. Behaviour of different types of ballasted track with and without under sleeper pads. ZEVRail 2016, 140. [Google Scholar]
  6. Abadi, T.; le Pen, L.; Zervos, A.; Powrie, W. Measuring the area and number of ballast particle contacts at sleeper/ballast and ballast/subgrade interfaces. IJRT 2015, 4, 45–72. [Google Scholar] [CrossRef]
  7. Kumar, N.; Suhr, B.; Marschnig, S.; Dietmaier, P.; Marte, C.; Six, K. Micro-mechanical investigation of railway ballast behavior under cyclic loading in a box test using DEM: Effects of elastic layers and ballast types. Granul. Matter 2019, 21, 106. [Google Scholar] [CrossRef] [Green Version]
  8. Auer, F.; Schilder, R. Technische und wirtschaftliche Aspekte zum Thema Schwellenbesohlungen—Teil 1: Langzeiterfahrungen im Netz der ÖBB (Technical and economical aspects to under sleeper pads—Part 1: Long-term experiences in the Oebb-network). ZEVRail 2009, 133, 180–193. (In German) [Google Scholar]
  9. Marschnig; Veit, P. Technische und wirtschaftliche Aspekte zum Thema Schwellenbesohlungen – Teil 2: Wirtschaftlichkeit im Netz der ÖBB (Technical and economical aspects to Under Sleeper Pads—Part 2: Economic efficiency in the OeBB-network). ZEVRail 2009, 133, 436–443. (In German) [Google Scholar]
  10. Jayasuriya, C.; Indraratna, B.; Ferreira, F.B. The Use of Under Sleeper Pads to Improve the Performance of Rail Tracks. Indian Geotech. J. 2020, 50, 204–212. [Google Scholar] [CrossRef]
  11. Omodaka, A.; Kumakura, T.; Konishi, T. Maintenance Reduction by the Development of Resilient Sleepers for Ballasted Track with Optimal Under-sleeper Pads. Procedia Cirp 2017, 59, 53–56. [Google Scholar] [CrossRef]
  12. Schneider, P.; Bolmsvik, R.; Nielsen, J. In situ performance of a ballasted railway track with under sleeper pads. Proc. Inst. Mech. Eng. Part F J. Rail Rapid Transit. 2011, 225, 299–309. [Google Scholar] [CrossRef]
  13. Gräbe, P.J.; Mtshotana, B.F.; Sebati, M.M.; Thünemann, E.Q. The effects of under-sleeper pads on sleeper–ballast interaction. J. S. Afr. Inst. Civ. Eng. 2016, 58, 35–41. [Google Scholar] [CrossRef] [Green Version]
  14. Pospischil, F.; Loy, H. Sustainable superstructure with Under Sleeper Pads. In Proceedings of the 7th Transport Research Arena TRA 2018, Vienna, Austria, 16–19 April 2018. [Google Scholar]
  15. Sánchez, M.S.; Navar, F.M.; Gámez, M.C.R. The Use of Deconstructed Tires as Elastic Elements in Railway Tracks. Materials 2014, 7, 5903–5919. [Google Scholar] [CrossRef]
  16. Johansson, A.; Nielsen, J.; Bolmsvik, R.; Karlström, A.; Lundén, R. Roger Under sleeper pads—Influence on dynamic train–track interaction. Wear 2008, 265, 1479–1487. [Google Scholar] [CrossRef]
  17. DIN 45673-1:2010-08; Mechanical Vibration—Resilient Elements Used in Railway Tracks—Part1: Terms and Definitions, Classification, Test Procedures. Deutsches Institut für Normung (German Institute for Standardisation Registered Association): Berlin, Germany, 2010.
  18. Schilder, R. USP (Under Sleeper Pads)—A Contribution to Save Money in Track Maintenance; AusRAIL PLUS: Sydney, Australia, 2013. [Google Scholar]
  19. EN 16730:2016-09; Railway Applications—Track—Concrete Sleepers and Bearers with under Sleeper Pads. European Standards: Dublin, Ireland, 2016.
  20. Zakeri, J.A.; Esmaeili, M.; Heydari, H. A field investigation into the effect of under sleeper pads on the reduction of railway-induced ground-borne vibrations. Proc. Inst. Mech. Eng. Part F J. Rail Rapid Transit 2015, 230, 999–1005. [Google Scholar] [CrossRef]
  21. Kraśkiewicz, C.; Zbiciak, A.; Sabouni-Zawadzka, A.A.; Piotrowski, A. Experimental Research on Fatigue Strength of Prototype under Sleeper Pads Used in the Ballasted Rail Track Systems. Arch. Civ. Eng. 2020, 67, 241–255. [Google Scholar] [CrossRef]
  22. CEN-EN 13848-1; Railway Applications—Track—Track Geometry Quality—Part 1. BSI Standards Publication: London, UK, 2019.
  23. Fellinger, M. Sustainable Asset Management for Turnouts: From Measurement Data Analysis to Behaviour and Maintenance Prediction; Railway Research, No. 4; Verlag der Technischen Universität Graz: Graz, Austria, 2020. [Google Scholar] [CrossRef]
  24. Neuhold, J.; Vidovic, I.; Marschnig, S. Preparing Track Geometry Data for Automated Maintenance Planning. J. Transp. Eng. Part A Syst. 2020, 146, 04020032. [Google Scholar] [CrossRef]
  25. Mandelbrot, B.B. How long is the coast of Great Britain? Statistical self-similarity and fractional dimension. Science 1967, 156, 636–638. [Google Scholar] [CrossRef] [PubMed] [Green Version]
  26. Landgraf, M.; Hansmann, F. Fractal analysis as an innovative approach for evaluating the condition of railway tracks. Proc. Inst. Mech. Eng. Part F J. Rail Rapid Transit 2019, 233, 596–605. [Google Scholar] [CrossRef]
  27. Landgraf, M. Smart Data for Sustainable Railway Asset Management; Verlag der Technischen Universität Graz: Graz, Austria, 2018. [Google Scholar] [CrossRef]
  28. Neuhold, J.; Landgraf, M.; Neuper, G. Effekte von Schwellenbesohlungen auf das langfristige Qualitätsverhalten des Gleises (Effects of Under-Sleeper-Pads on long-term track quality behaviour). ZEVrail 2018, 142, 276–281. (In German) [Google Scholar]
Figure 1. Overview of the test section with the surrounding track.
Infrastructures 07 00132 g001
Figure 2. Time series of the longitudinal track quality SDmean and track deterioration behaviour at a specific track area (shaded in red, blue, and violet for three exemplary measurement runs).
Infrastructures 07 00132 g002
Figure 3. Waterfall diagram of SDi(100 m): arithmetic mean of the left and right rail’s standard deviation with an influence length of 100 m.
Infrastructures 07 00132 g003
Figure 4. Waterfall diagram of SDi(10 m): arithmetic mean of the left and right rail’s mean standard deviation with an influence length of 10 m.
Infrastructures 07 00132 g004
Figure 5. Moving mean standard deviation SDmean with an influence length of 100 m.
Infrastructures 07 00132 g005
Figure 6. Fractal analysis of the mid-waved dimension, indicating the ballast condition of the test section and the adjacent track segments.
Infrastructures 07 00132 g006
Figure 7. Longitudinal level D1 of two consecutive measurement runs showing the emergence of distinct track geometry defects.
Infrastructures 07 00132 g007
Table 1. Track components of the test sections and the adjacent track.
Subsection 1Subsection 2Adjacent Sections
Superstructure60E1 rails60E1 rails60E1 rails
concrete sleepersconcrete sleepersunsoled concrete sleepers
8 mm USP *8 mm USP *-
20 cm ballast **30 cm ballast **30 cm ballast **
Substructure8 cm bituminous asphalt layer8 cm bituminous asphalt layer8 cm bituminous asphalt layer
45 cm frost protection layer45 cm frost protection layer45 cm frost protection layer
20 cm soil replacement20 cm soil replacement20 cm soil replacement
Subsoilnatural groundnatural groundnatural ground
* The installed under sleeper pads (USPs) on the test sections are based on polyurethane and show relatively soft material properties compared with other pad types. ** The ballast bed thickness was measured between the lower edge of the sleeper and the upper edge of the formation protection layer.
Table 2. Wavelength of the longitudinal level.
Short-WavedMid-WavedLong-Waved
wavelength due to EM 2501–3 m3–25 m25–70 m
Table 3. Meaning of abbreviations.
AbbreviationExplanation
SDstandard deviation
le/rileft/right rail
xvalue of the longitudinal level
iindex for the ith data point (25 cm spacing)
Nnumber of considered data points (depending on the moving influence length)
jnumber of calculated mean standard deviations SDi
meanarithmetic mean
(10 m)moving influence length of 10 m
(100 m)moving influence length of 100 m
Publisher’s Note: MDPI stays neutral with regard to jurisdictional claims in published maps and institutional affiliations.