Abstract
One of the important aspects of highway design is aggregates. Aggregates strength and consistency has an effect on pavement structure’s overall performance. The consistency of the base material near the site of the construction doesn’t always match the requirements of pavement construction and carrying quality aggregate raises the cost of construction. Stabilizing agents such as asphalt cement, lime, fly ash were used to improve the strength of these materials in order to make greater use of locally available materials. Layer materials present in the pavements and the structure of them influence pavement performance. The compressive strain and the tensile strain in the layer of subgrade and asphalt layer respectively are influenced by the stiffness of the base layer. The important aspects causing rutting and fatigue cracking are compressive strain in the top region of the subgrade layer and tensile strain at the bottom of the asphalt layer, respectively. In this research study, field performance (cracking, rutting, and surface roughness) of pavement sections with untreated and treated bases were collated to assess the impact of the stabilizing agents. The treated sections performed well significantly compared to the untreated sections in terms of pavement surface roughness and fatigue cracking. The treated sections performed higher than the untreated sections in terms of the cumulative average values of all 3 distresses with fatigue cracking averaging 5 times lower than the untreated sections. The combined IRI and rutting of treated sections averaged about 1.5 times and 0.11 inches smaller, respectively than those of untreated sections.
Keywords:
aggregates; stabilizing agents; lime; asphalt cement; cement; HMA; fatigue cracking; rutting; surface roughness 1. Introduction
In general, traffic volume has expanded massively throughout Texas and United States of America which has led to a rise in the volume of the vehicle on the roads. The steady rise in traffic has emerged in more construction of roadways with well-built structural base layers to withstand heavy loadings. As an outcome of the surge in highway construction, the market for high-quality aggregates has risen. Transporting high-quality aggregates from various sources will directly raise construction costs. In total, the aggregate consumption over a period of a year has now reached about 1.5 billion tons, with a growth of up to 50% expected over the next decade. Many appropriate aggregate reserves are being depleted as a result of the rate of usage and the constant push for higher quality materials. Few places across the country have started facing scarcity of definite types or a complete lack of suitable local aggregates [1]. Most of the time, the base materials accessible close to the construction site often lack the necessary strength to sustain the heavy loads. A base course must be strong and rigid enough to withstand high unit pressure without overmuch distortion, consolidation, or lateral flow. Due to the surface course becoming thinner, durability and strength qualities must be present in the base course [2]. Various treatment methods are utilized to treat the aggregates present close to the construction area in order to achieve the optimal strength needed to withstand the heavy traffic loading. Materials Stabilization may be chemical or mechanical stabilization and often done by cement, asphalt cement, fly ash, and lime for flexible pavements.
Pavement structure and the properties of its respective layers, environmental conditions, and traffic loading influences pavement performance. The vertical deformation in each of the layers or/and horizontal tensile strains at the bottom of the surface layer surpasses certain criterion than it leads to structural failure in the pavement. The compressive strains at the top of the subgrade layer and the tensile strains in the asphalt layers of flexible pavements are influenced by the stiffness of the base layer.
The comprehensive performance of flexible pavements is influenced by the kind of base layer used because the stiffness of the base layer depends on the material properties of that layer. Generally, Stabilized bases and unbound bases are the two kinds of base layers utilized in flexible pavements. All the base layers have the same functions which are to give support to the HMA (Hot mix asphalt) layers and to effectively spread the traffic loadings to the subbase or the subgrade pavement layers [3].
2. Literature Review
In the Texas state, the stabilized bases have been widely used for flexible pavements, and lime, cement, fly ash, asphalt cement were used to stabilize the bases. Since the stabilization improves aggregate interlock and enables effective load transfer, these treatment agents have increased the base layer’s strength [2]. Moisture Resistance, deformation, cracking, etc., can be improved by the usage of stabilizing agents in base layers as per the previous studies [4].
Ogundipe [4] did a study to analyze the compaction and strength characteristics of the bitumen stabilized granular soils. 2%, 4%, and 6% bitumen contents were taken in the study. High bitumen content in soil filled the voids which resulted in the weakening of aggregates was observed. Four percent bitumen content was considered to be the optimum bitumen content in order to achieve the supreme California Bearing Ratio and Maximum Dry Density. Altogether, it was discovered that stabilizing granular soils with cutback bitumen increased their properties.
A research was conducted by Pundir and Prakash [5] to analyze how the soil stabilizers affected the flexible pavements in reference to the structural design. According to the test results, it was understood that the cement treatment and lime were the effectivel options. The addition of cement and lime to a certain extent raised the strength to a certain point but after that limit, the strength started decreasing despite furthermore addition of stabilizers did not help.
A study was conducted by Kirchner et al. [6] to examine the laboratory performance of the reclaimed base courses stabilized with Cacl2. To collate the performance of the Cacl2 stabilized and untreated bases. It was documented that the strengthening of moisture film in stabilized bases, improved lubrication between the base layer aggregates, allowing for higher densities to gain with lesser compaction. Since compaction typically improves base layer stability and increases the bearing capacity and shear strength of base layer aggregate, calcium chloride stabilization was found to enhance the bearing capacity and shear strength of aggregate base layers.
The stiffness of the layer was increased due to the usage of different stabilizers in the bases. Further, the field performance of the treated sections increased due to increased stiffness. The permanent deformation was also lowered due to increased stiffness [7,8].
A study by Abu-Farsakh et al. [9] utilized the cyclic plate load testing to evaluate the laboratory performance of flexible pavements with geogrid reinforced bases. The overall performance of the stabilized base was improved when geogrids were used in the upper one-third of the base layer. It was concluded that the applied loads over a wider area on top of the subgrade were redistributed with the help of geogrids. This redistribution of loads caused a reduction in the overall rut depths of the pavement and less permanent deformation to accumulate in the subgrade.
A study was conducted by Wu et al. [10] and the field performance of foamed asphalt base materials was evaluated. The three identical and full-scale test sections were studied by performing accelerated pavement testing on the sections. The control test section in the study consisted of crushed stone in the base layer and the other two test sections consisted of a foamed asphalt blend in the base layers. In the base layer of one test section, a 50% reclaimed asphalt pavement (RAP) and a 50% recycled soil cement foamed asphalt blend was utilized. In the base layer of the other test section, a 100% RAP foamed asphalt blend was utilized. Under an initial load level of 43.4 kN, the foamed asphalt bases performed similarly, and this performance turned out to be great when compared to that of the crushed stone base. However, both foamed asphalt bases had rutting rates which were higher when compared to that of the crushed stone base under higher load conditions. The water susceptibility and weak aggregate skeleton of the foamed asphalt base were responsible for the high rutting rates on the (50% RAP and 50% recycled soil cement) foamed asphalt base test section. It was determined by the researchers that over asphalting and the poor water-resistance of the foamed asphalt base were responsible for the high rutting rates on the (100% RAP) foamed asphalt base test section.
In a study conducted by Lane et al. [11], a flexible pavement that underwent a full depth reclamation with expanded asphalt was considered and its long-term performance was evaluated. In this study, which was performed on the Tans Canada Highway between the cities of Sault Sainte Marie and Wawa, in Northern Ontario, Canada involved the construction of a full depth reclamation with an expanded asphalt stabilization. The objective of this study was to select three highway sections, constructed with different expanded asphalt mix designs, and to evaluate them along with a control section, constructed with HMA. An ARAN which stands for Automated Road Analyzer that measures IRI and rutting was used by the researchers to monitor the field sections annually for ten years. It was noted that, after 10 years, the pavement on the expanded asphalt sections remained smooth as the IRI was less than 1. Moreover, the researchers also reported that after the 10-year evaluation period, the Pavement Condition Index (PCI) was greater than 85, and hence the condition of the expanded asphalt sections was excellent. It was concluded that during the 10-year study period, the expanded asphalt stabilized pavement sections deteriorated at a much slower rate than the control section.
Researchers have previously shown the role of stabilizing agents in the base and various pavement systems. Although numerous studies have demonstrated the laboratory performance of these stabilizers, only a few have demonstrated their effect on the field performance of in-service pavement systems. This study shows the effect of stabilizers on the field performance of the structure of pavement. Since that the field performance is the principal tool for classifying the materials in terms of quality. An in depth study was needed as an effort to utilize the field performance as an assessment tool for the usefulness of different types of stabilizer applications.
3. Study Objective
To enhance the performance and strength of the complete pavement structure base stabilization has become a key part of the construction of pavement. Comparison of Flexible pavements performance constructed using treated and untreated aggregate base layers. Three various performance indicators (rutting, fatigue cracking, and surface roughness) were used as an overall field performance assessment tool for chosen flexible pavements in the states of Texas, Arizona, Arkansas, and Alabama.
4. Data Collection
Three performance indicators (rutting, fatigue cracking, and surface roughness) were utilized to contrast the performance of pavement sections with treated and untreated base layers. LTPP which stands for Long Term Pavement Performance database was used to select the pavement sections [12]. Treated and untreated sections were selected to have identical characteristics in order to compare them. Highway, functional class, and climate were the same for the selected pavements to analyze. The levels of traffic and pavement structure in the regions being compared were quite close.
To analyze the impact of stabilizers, flexible pavement sections from four different states were selected. The location of the sections that were used in the analysis are visible in Figure 1. The total number of pavement sections selected were 37 consisting of 19 treated bases and 18 untreated bases so that all three distresses data was known. The red and green stars in the figure indicate treated and untreated sections respectively. The number within the star denotes the number of those sections utilized in the analysis. With 11 sections both for treated and untreated bases, Arizona has the most sections in the study. Untreated bases are divided into three parts in Texas, while treated bases are divided into three sections. For the study, Arkansas has two untreated sections and three treated sections. Alabama has two sections each for untreated and treated bases.
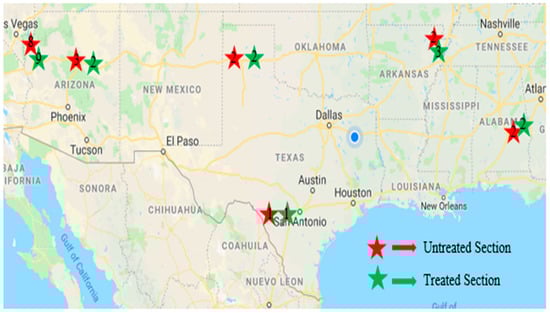
Figure 1.
Map Showing the Location of the Treated and Untreated Sections Considered in the Study.
The thickness of the section and the location under consideration are shown in Table 1. Six and seven inches is the average asphalt layer for treated and untreated sections respectively. The comprehensive average base layer thickness for the treated section is 9 inches and the untreated base layer thickness is 7 inches. An increase in the base thickness for the treated section is accompanied by a decrease in asphalt layer thickness. In Table 2, traffic level, functional class, and percent of stabilizing agents of the considered untreated and treated sections of all four states. The amount of daily traffic on both the untreated and treated sections is almost similar. The sections were chosen such that both the untreated and treated sections were on the same highway with alike layer materials. The conditions of the climate were alike and the sections under contrast underwent nearly the same volume of traffic over the years. Table 3 displays the data of distresses of all the sections under study which were utilized to contrast the untreated and treated sections.

Table 1.
Location and Layer Thickness of Treated and Untreated Sections.
Table 2.
Functional Class, AADT and Stabilizing Agent of Treated and Untreated Sections Considered in the Study.
Table 3.
Distress Data of Treated and Untreated Sections Considered in the Study.
5. Results
5.1. Fatigue Crack Analysis
A series of interconnected cracks formed due to fatigue failure of the HMA surface (or stabilized base) under frequent traffic loading is known as fatigue cracking. In thin pavements, cracking initiates in the layer where the tensile stress is the highest, i.e., at the bottom of the HMA, and then propagates to the surface as one or more longitudinal cracks [13]. Figure 2 shows the average fatigue cracking percentage (y-axis) of treated and untreated sections in the considered four different States.
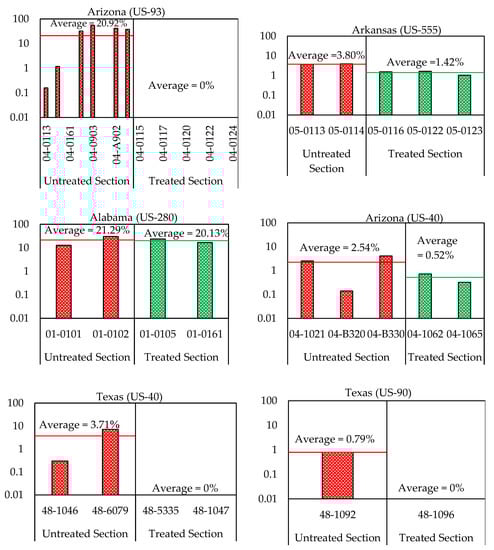
Figure 2.
Average Fatigue Cracking Comparison between Treated and Untreated Sections in the Considered 4 Different States.
Figure 2 indicates the mean fatigues of acted and unacted parts in the four different states having footway parts on the similar highroad and subjected to the similar horizon of traffic & State of weather. For all States, the acted parts do excellent than the unacted parts. The mean slackness of acted parts for all four States were less than the untreated sections. The high achievement of the acted part has been noticed in Arizona state of US-93 highway which had 0% fatigue fracturing for an acted part and 20.92% mean fatigue cracking for the unacted parts. From Figure 3 we can observe that the united mean fatigue cracking of the treated sections is five times better than the untreated sections. The average fatigue cracking of the unacted part is 12.91% while, the mean fatigue fracturing of the unacted part is 2.40%. To sum up, the bases assist in the fine achievement of the footways in terms of fatigue.
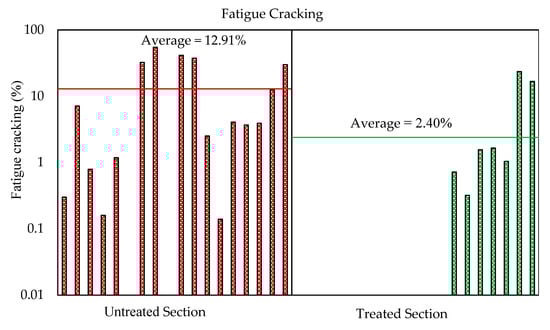
Figure 3.
Combined Average Fatigue Cracking of Treated and Untreated Sections.
5.2. Pavement Surface Rutting Analysis
One of the most significant load-associated distresses in the flexible footway process is Rutting. Rutting generally occurs by the accumulation of permanent deformation in all the layers within the footway structure. Rutting appears as longitudinal depressions along the roadway causing roughness, hydroplaning, and other security sections [13,14]. Figure 4 shows the mean rutting in inches (y-axis) of the treated and the untreated parts in each four states, with both the treated and untreated parts on similar roadways and subjected to the same climatic states and the similar level of traffic.
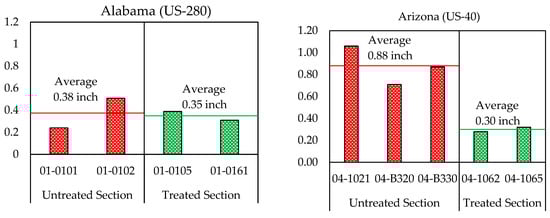
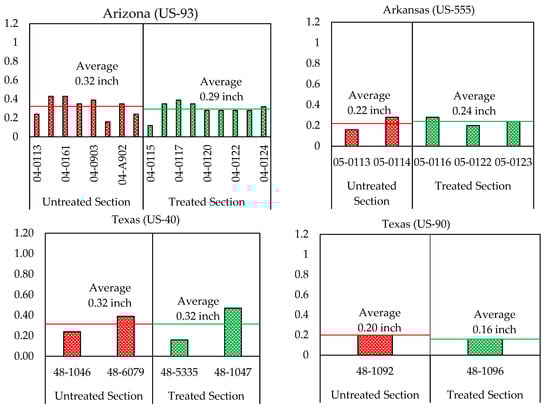
Figure 4.
Average Pavement Surface Rutting Comparison between the Treated and the Untreated Sections in the Four Different States.
Figure 4 indicates the mean face rutting of the treated and the untreated flexible pavement parts in all of the four States. The practical action of the acted sections in terms of rutting seems to be better in most of the cases except for the state of Texas (US-40) and the state of Arkansas (US-555) highway. For the state of Texas (US-40) highway, both parts of treated and untreated have the same mean rutting of 0.32 inch and for the state of Arkansas (US-555) highway, the mean rutting of the treated or acted section is 0.02 inch higher than that of the untreated or unacted section. In all of the other cases, the treated section has done well with a mean rutting inferior than the acted parts. In the state of Arizona US-40 highway, it has been noticed the best result of the treatment. Here, the mean rutting of the unacted part is 0.88 inch, and the mean rutting section is 0.30 inches.
In the case of Arkansas (US-555) highway, Section 05-116 has a high amount of rutting than the other two sections. The number of stabilizers used in this section was found to be 2.9% HMA. The optimum amount of HMA stabilizers from the overall study was observed to 4 to 5%. Higher or lower than 4 to 5% of stabilizers resulted in a lower performance of the sections. For Texas (US-40) the section with high rutting used a 3% lime stabilizer. The section with the best performance had a lime stabilizer of 5%. The sections under comparison were on the interstate, with the sections handling a high amount of traffic every day, a high percent of stabilizers resulted in a better performance. In addition, the average amount of traffic handled by treated sections were more than the untreated section for this highway. An in depth study can be conducted with a greater number of sections for the optimum amount of lime stabilizers for the various functional classes of the highway. The cumulative average rutting of the treated and untreated parts from all four States is shown in Figure 5. The average rutting of the treated portion is 0.11 inches smaller than that of the untreated sections, as can be seen. This demonstrates that the treated parts are also less rutted.
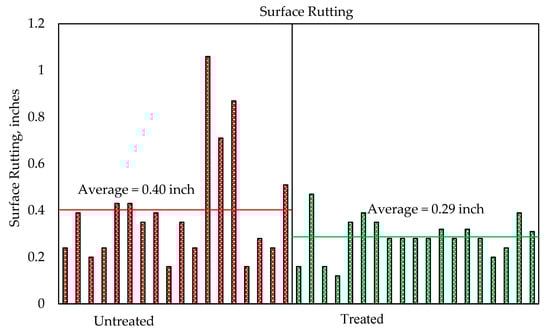
Figure 5.
Combined Average Surface Rutting of Treated and Untreated sections.
5.3. Pavment Surface Roughness Analysis (IRI)
The roughness of the road surface has long been regarded as a significant indicator of its efficiency. Safety, ride comfort, and vehicle wear is all directly influenced by the roughness. It also raises the dynamic loading exerted on the pavement by cars, hastening the degradation of the pavement system [14]. Mean roughness, measured in terms of the international roughness index (IRI), of the treated and untreated sections in the four selected various States, with both the untreated and treated sections on a similar highway and subjected to the similar traffic level and conditions of climate is shown in Figure 6 (y-axis is IRI in inches/mile).
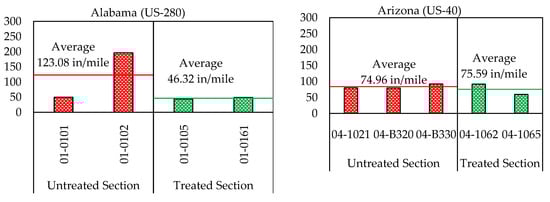
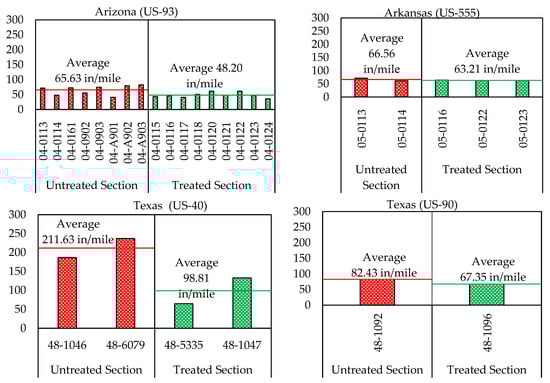
Figure 6.
Average IRI Comparison between the Treated and the Untreated Sections in the Four Considered Different States.
As shown in Figure 6, the average IRI of the treated sections is lower than the untreated sections in all of the four considered States. The base treatment had helped in the better performance of the pavement sections. The high performance of the sections had been observed in the state of Alabama (US-280) highway, with the treated section having an average IRI of 46.32 in/mile and the untreated sections having an average IRI of 123.08 in/mile. Figure 7 shows the combined average IRI of the treated and the untreated sections from all of the four States. The average IRI of the treated and the untreated sections are 59.59 in/mile and 92.32 in/mile, respectively. It can be concluded that the pavement sections with the treated bases are better in terms of IRI.
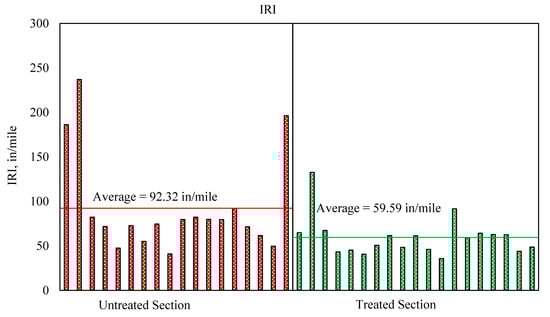
Figure 7.
Combined Average IRI of Treated and Untreated sections.
5.4. Stablizers Performance
Table 4 compares the efficiency of various stabilizers in various highway grades. It can be concluded that for the interstate functional class, 5 to 6 percent of lime stabilizer has resulted in a high field performance for all three distresses. As only one section was found for HMA stabilizers in the interstate, more sections are needed for an in-depth understanding of the effect of the HMA stabilizers in the field performance of an interstate highway. For the Principal Arterial highway, the HMA stabilizer with a percent of 4 to 5 resulted in a better performance for surface rutting and surface roughness. As for the fatigue cracking, HMA percent with (3 to 4)% and (5 to 6)% resulted in a better performance.
Table 4.
Performance Evaluation of Different Treatment Methods.
6. Conclusions and Recommendations
The objective of this case study was to assess and compare the in-field performance parameters like fatigue cracking, roughness, and rutting of the flexible pavement sections with untreated and lime or HMA treated base layers across four states of the USA including Texas. The selected sections (both treated and untreated) in each of the states were subjected to the same climatic and traffic conditions and on the same highway location. The following conclusions were made based on the overall analysis:
- In terms of fatigue cracking, base treatment (irrespective of the treatment agent) was observed to be quite effective for all of four considered States. The average value of fatigue cracking for the untreated sections was higher than that of the treated sections in all four States. The combined average fatigue cracking of the untreated sections was five times higher than the treated sections.
- The treated sections performed better in most of the cases, with an average surface rutting for the treated sections being lower in four out of the six considered highways within the four Sates. For sections on the state of Texas (US-40) highway, the average rutting of the treated and the untreated sections were both equal. The optimum number of stabilizers for this highway was observed to be 5%. The treated section with high rutting had a lime percent of 3%. This resulted in a lower average performance of the treated section. For sections on the state of Arkansas (US-555) highway, the average rutting of the treated sections was 0.02 inches higher than that of the untreated sections. The section with the high rutting had a HMA stabilizer percent of 2.9%. The optimum HMA stabilizer for the Arkansas highway was observed to be 4 to 5%. The combined average surface rutting showed a better performance for the treated sections, with the average rutting of the treated sections 0.11 inches lower than of the untreated sections.
- In terms of IRI, the average value of the treated sections was lower for all of the States. The average IRI value of the treated sections was almost 1.1 to 1.7 times less than that of the untreated sections. The combined average showed a high difference in IRI between the treated and the untreated sections. The average rutting of the treated sections is almost 1.7 times lower than the untreated sections.
- As an overall observation, it can be concluded that the treated sections performed better in terms of fatigue cracking and IRI. Significant performance improvement in the rutting of the treated sections was not observed. The treated sections performed better for most of the cases, except for one in which a treated section had higher rutting than an untreated section.
- Optimum percent of stabilizers for different highways resulted in a better performance of treated section. For interstate highways, the optimum lime stabilizer percent was observed to be 5 to 6%. For the Principal arterial highway, the optimum HMA stabilizer percent was observed to be 4 to 5%.
- The overall combined average demonstrated that the treated sections had better field performance in terms of all the considered three distresses. This paper focused on the base treatment, however, the instability base caused cracking is not considered and will be considered in future studies.
Lastly, it can be concluded that the strength of the base layer can be increased as well as the overall performance of the pavement section can be improved with the help of flexible pavement base stabilization. As per the fatigue cracking and IRI, the pavement performance was increased. Therefore, better use of the local materials can be achieved with the use of stabilizing agents. Additionally, there will be a decrease in the logistic or transportation cost of the high-quality aggregates to the construction site by using the stabilizing agents. However, more in-depth research relating to the field performance to the optimum stabilizer concentrations for various classes of highway and in detail cost analysis effort to evaluate the cost-effectiveness of these stabilization mechanisms should be performed as another element of this study.
Author Contributions
Conceptualization, M.I.S. and H.G.; methodology, M.I.S., H.G.; software, M.I.S. and H.G.; validation, M.I.S., H.G. and Z.M.; formal analysis, M.I.S. and H.G.; investigation, M.I.S. and H.G.; resources, M.I.S. and H.G.; data curation, M.I.S. and H.G.; writing—original draft preparation, M.I.S., H.G. and Z.M.; writing—review and editing, M.I.S., H.G. and Z.M.; visualization, M.I.S., H.G. and Z.M.; supervision, M.I.S., H.G. and Z.M.; project administration, M.I.S., H.G. and Z.M.; funding acquisition, M.I.S. All authors have read and agreed to the published version of the manuscript.
Funding
This research received no external funding.
Institutional Review Board Statement
The study was conducted according to the guidelines of the Declaration of Helsinki, and approved by the Institutional Review Board.
Informed Consent Statement
Not applicable.
Data Availability Statement
Data were extracted from the InfoPave website at https://infopave.fhwa.dot.gov/ (accessed on 1 June 2021).
Conflicts of Interest
The authors declare no conflict of interest.
References
- Fondriest, F.F.; Snyder, M.J. Synthetic Aggregates for Highway Construction; NCHRP Report; Transportation Research Board: Washington, DC, USA, 1964. [Google Scholar]
- Little, D.N.; Scullion, T.; Kota, P.B.V.S.; Bhuiyan, J. Identification of the Structural Benefits of Base and Subgrade Stabilization; Federal Highway Administration: Washington, DC, USA, 1995. [Google Scholar]
- Francois, A.A. Evaluating the Impact of Different Types of Stabilized Bases on the Overall Performance of Flexible Pavements; Rowan University: Glassboro, NJ, USA, 2016. [Google Scholar]
- Ogundipe, O.M. Strength and Compaction Characteristics of Bitumen Stabilized Granular Soil. Int. J. Sci. Technol. Res. 2014, 3, 218–221. [Google Scholar]
- Pundir, V.; Prakash, V. Effect of Soil Stabilizers on the structural design of flexible pavements. J. Adv. Appl. Sci. Res. 2015, 6, 134–147. [Google Scholar]
- Kirchner, H.; Gail, J.A. Liquid Calcium Chloride Dust Control and Base Stabilization of Unpaved Road Systems. Transp. Res. Rec. J. Transp. Res. Board 1991, 1291, 173–178. [Google Scholar]
- Shon, C.S.; Saylak, D.; Mishra, S. Combined Use of Calcium Chloride and Fly Ash in Road Base Stabilization. Transp. Res. Rec. J. Transp. Res. Board 2010, 2186, 120–129. [Google Scholar] [CrossRef]
- Jones, D.; Wu, R.; Louw, S. Comparison of Full-Depth reclamation with Portland Cement and Full Depth reclamation with No Stabilizer in Accelerated Loading Test. Transp. Res. Rec. J. Transp. Res. Board 2015, 2524, 133–142. [Google Scholar] [CrossRef]
- Abu-Farsakh, M.Y.; Chen, Q. Evaluation of Geogrid Base Reinforcement in Flexible Pavements using Cyclic Plate Load Testing. Int. J. Pavement Eng. 2011, 12, 275–288. [Google Scholar] [CrossRef]
- Wu, Z.; Mohammad, L.; Zhang, Z. Accelerated Pavement Testing on Foamed Asphalt Base Materials; Louisiana Transportation Research Center: Baton Rouge, LA, USA, 2010. [Google Scholar]
- Lane, B.; Kazmierowski, T. Long Term Performance of Full Depth Reclamation with Expanded Asphalt on the Trans-Canada Highway near Wawa, Ontario. In Proceedings of the Conference and Exhibition of the Transportation Association of Canada-Transportation: Innovations and Oportunities, Fredericton, NB, Canada, 14–18 October 2012; p. 12. [Google Scholar]
- Elkins, G.E.; Ostrom, B. Long Term Pavement Performance, Information Management System User Guide; U.S. Department of Transportation, Federal Highway Administration: Washington, DC, USA, 2017. [Google Scholar]
- Souliman, M.; Mamlouk, M.; El-Basyouny, M.; Zapata, C.E. Calibration of the AASHTO MEPDG for Flexible Pavement for Arizona Conditions. Transp. Res. Board J. Transp. Res. Board 2010, 22, 243–286. [Google Scholar]
- Coelho, N.F.C. Calibration of MEPDG Performance Models for Flexible Pavement Distresses to Local conditions in Ontario. Master’s Thesis, The University of Texas at Arlington, Arlingtonl, TX, USA, 2016. [Google Scholar]
Publisher’s Note: MDPI stays neutral with regard to jurisdictional claims in published maps and institutional affiliations. |
© 2021 by the authors. Licensee MDPI, Basel, Switzerland. This article is an open access article distributed under the terms and conditions of the Creative Commons Attribution (CC BY) license (https://creativecommons.org/licenses/by/4.0/).