Article

Performance Evaluation of Electric Trolley Bus Routes. A Series Two-Stage DEA Approach

School of Applied Mathematics and Physics, National Technical University of Athens, 15780 Athens, Greece
Infrastructures 2021, 6(3), 44; https://doi.org/10.3390/infrastructures6030044
Submission received: 24 February 2021 / Revised: 10 March 2021 / Accepted: 12 March 2021 / Published: 15 March 2021
(This article belongs to the Special Issue Transport Systems: Safety Modeling, Visions and Strategies)

Abstract

:
A common concern for bus operators is efficiency measurement in order to monitor transit performance. The purpose of this paper is to propose a series two-stage data envelopment analysis (DEA) approach integrated with bootstrapping in order to evaluate the performance of electric trolley bus routes of Athens and Piraeus, Greece. Production and sales efficiency were measured in the first and second stages, respectively. In the light of the results, the routes assessed have a comparable higher DEA-based efficiency in both stages when compared to the perfect possible performance, but production and sales efficiency are not associated. Nevertheless, arterial bus routes have a marginally better performance in the production process on average, whereas the feeder–local bus routes produce a slightly better sales performance. The proposed modeling approach is an addition to the current literature, and can be employed by managers and operators.

1. Introduction

The need to measure and assess the efficiency of the transit system has led to the development of several performance metrics [1,2,3,4]. Two primary indicator-based assessment methods are key performance indicator (KPI) analysis and composite score analysis. KPI analysis sets indicator targets or thresholds to achieve a composite score, whereas composite score analysis normalizes and weights indicators. In KPI analysis and composite score analysis, however, the thresholds and weights are often subjectively determined [5]. In addition, individual performance measures do not yield consistent results on transit performance [6,7,8] and this implies the need for a composite indicator or a smaller set of more detailed indicators to describe the transit system.
Competitive methods are used to evaluate the performance of transit systems in terms of efficiency, such as parametric stochastic frontier analysis (SFA) [9,10] and non-parametric data envelopment analysis (DEA) [11]. SFA involves the selection of an econometrically calculated functional form for output or cost frontier function using two error term components, namely statistical noise and inefficiency. For these terms, the normal and half-normal assumptions for noise and inefficiency are typically made respectively.
DEA, published by Charnes et al. [11] in the literature, is a mathematical programming technique that is a non-parametric frontier-based approach. It is used to derive the efficiency of a group of decision-making units (DMUs), e.g., bus routes, by defining a best practicing frontier from the data set. DEA-based efficiency is measured relative to that frontier and the efficiency ratings take values between zero and unity (i.e., perfect efficiency for units located on the frontier); units located off the frontier are considered inefficient. DEA has been applied to ports, railways, airlines, urban transit, and airports. For recent reviews the reader is referred to Lozano and Gutiérrez [12].
In general terms, efficiency can be defined as output-oriented by achieving the maximum possible output with a given amount of input, or as input-oriented by producing a given level of output at the lowest cost possible. A distinction should be made between supply-related measures and demand-related measures (i.e., operator-oriented outputs and user-oriented outputs, respectively) in the calculation of public transport efficiency; the former is typically vehicle-kilometers, seat-kilometers, or vehicle-hours, whereas the latter consists of passenger-kilometers, passenger-trips, or revenues. Practical issues such as data accessibility or method choice often determine the choice of the output variable(s) in practice [13].
In the modeling approach, the transport service rendered by the operator and ultimately used by the customer must be considered sequentially by simultaneously reflecting the operator’s and user’s outputs. One way to address this problem is to use a series of two-stage DEA model to devise both production and sales (consumption) operations, because they can provide more detailed information on a DMU’s performance than the conventional single black box DEA model. This modeling approach makes it possible to investigate the inner workings of the entire process in more detail, ultimately leading to a deeper understanding of it [14].
The current study focuses on DEA because it is more versatile than SFA and can also be used to analyze the production and sales process of the transit system. There are few studies that analyze the DEA-based efficiency of the urban transit system with an emphasis on the production and sales process. In this context, the current research aims to improve on the DEA single-stage black box [15] and to evaluate the performance of a group of electric bus routes in Greece using the series two-stage DEA.
The purpose of this paper is to provide a series two-stage DEA framework to assess the efficiency of public trolley bus transit. The case study concerns an electric (trolley) bus network of twenty routes that mainly serve the Athens and Piraeus city centers. The network today is operated by Road Transport S.A. (Odikes Sygkoinonies S.A. (OSY S.A.)) which is a subsidiary of Athens Area Urban Transport Organization S.A. (OASA S.A). Relevant studies for the performance assessment of trolley bus transit that serve Athens and Piraeus are the single-stage DEA and SFA works by Kagiantalidis [16] and Michaelides et al. [17], respectively.
This study contributes in many respects to the current literature. Firstly, it fills the gap created for bus routes by the single DEA black-box model, using a series two-stage DEA model to measure both production and sales performance. For a group of Greek bus routes, it decides to what degree, given the inputs, the operator should increase the services produced and whether the efficiency of the routes could be enhanced in the sales process by reducing the chosen inputs given the output. In addition, it follows a bootstrapping approach, unlike most previous related DEA studies that have lacked estimates of the uncertainties concerning individual efficiencies.
The remainder of this paper is structured as follows. Section 2 provides a review of the use of DEA in transit system efficiency measurement. In Section 3, the problem to be solved for the case of bus route efficiency assessment is stated. Section 4 deals with methods and the dataset for the analysis. In Section 5, the results are presented and discussed. The final section concludes.

2. Literature Review

There are numerous publications on DEA-based transit system efficiency measurement that are divided into single, two-stage, and serial two-stage works. In the works reviewed below, bus routes are defined as DMUs. The typical single-stage DEA studies evaluate transit networks without throwing light on their function within a black-box background in which they are viewed as a whole (i.e., black box) system [15].
There are several DEA applications in transit systems to establish a single measure of the system’s effectiveness [18,19,20,21]; some of the first studies are those of Chu et al. [18], Odeck and Alkadi [19], Nolan et al. [20], and Viton [21]. The reader is directed to Mahmoudi et al. [22] for a recent review. Model construction is based on the series two-stage DEA in another research strand. A series two-stage DEA structure distinguishes sub-processes and aims at measuring their efficiency [15], unlike the single DEA black-box model. In this strand lies the work of Yu [23], Yu and Fan [24], Sheth et al. [25], Lao and Liu [26], and Hahn et al. [14,27].
The efficiency of a multi-mode bus transit system is measured by DEA by identifying as sub-processes: (i) highway bus and urban bus service [23] and (ii) highway bus, urban bus service, and consumption process [24]. Sheth et al. [25] uses network DEA combined with goal programming to analyze the efficiency of the bus route from two separate perspectives: the point of view of the providers and customers. Two DEA models are used by Lao and Liu [26] to analyze the operational performance and spatial effectiveness of bus lines. Hahn et al. [14,27] employ a network DEA model to assess the performance of arterial bus routes and bus companies, respectively, in the city of Seoul.
Li et al. [28] implemented a bootstrap super-data-envelopment analysis model for route-level transit operational efficiency assessment with respect to DEA-bootstrap modeling, and Hahn et al. [27] used a double bootstrap (DEA-bootstrap and truncated bootstrap regression) to test the performance of arterial bus routes. Other approaches, such as SFA [29] and multi-objective programming [30], can also be combined with DEA. It should be noted that the multi-stage DEA approach, such as the three-stage DEA approach, has also appeared in the related literature [5].
The following gaps have been identified based on the above review of literature: there are few studies in the context of transit efficiency that use the series two-stage DEA, and DEA is subject to uncertainty, which can lead to skewed estimates and misleading conclusions. The current study fills the gaps described above by combining DEA with bootstrapping and using a two-stage DEA model.

3. Problem Statement

The current study aims to address the performance assessment of electric bus routes by means of a series two-stage DEA. Data analysis and benchmarks are the basis for an examination of the performance of electric bus transit. Benchmarks (i.e., best-in-class routes) for production and sales processes can be identified by means of DEA and, moreover, their use as reference points is important for the preparation of appropriate performance improvement measures. Corrective steps to enhance efficiency should focus not only on improving production, but also on meeting demand through the sales process. Thus, benchmarks for the production and sales phase should be developed for bus routes.
To produce the efficiency metric representing the relationship between inputs and outputs, classic single-stage DEA modeling only uses input and output information, i.e., the maximum output provided to fixed inputs or the minimum input given to a fixed output [31]. In the case of electric bus transit, each route is seen as a system with two sub-processes: the production and sales process. Instead of evaluating the performance of each route as a whole, without understanding its internal structure (i.e., production and sales process), the system is divided into these two sub-processes and assessed separately for each of them. Thus, two DEA efficiency metrics are involved in the success of each bus route: efficiency of production and efficiency of sales. A DEA with a two-stage structure is proposed in the current study: In the first stage (production sub-process) the number of vehicle-km and trips are considered as outputs that are produced using production factors. In the second stage (sales sub-process) the outputs of the first stage are considered to be the inputs, and the number of tickets is the considered output.

4. Methods—Data Set

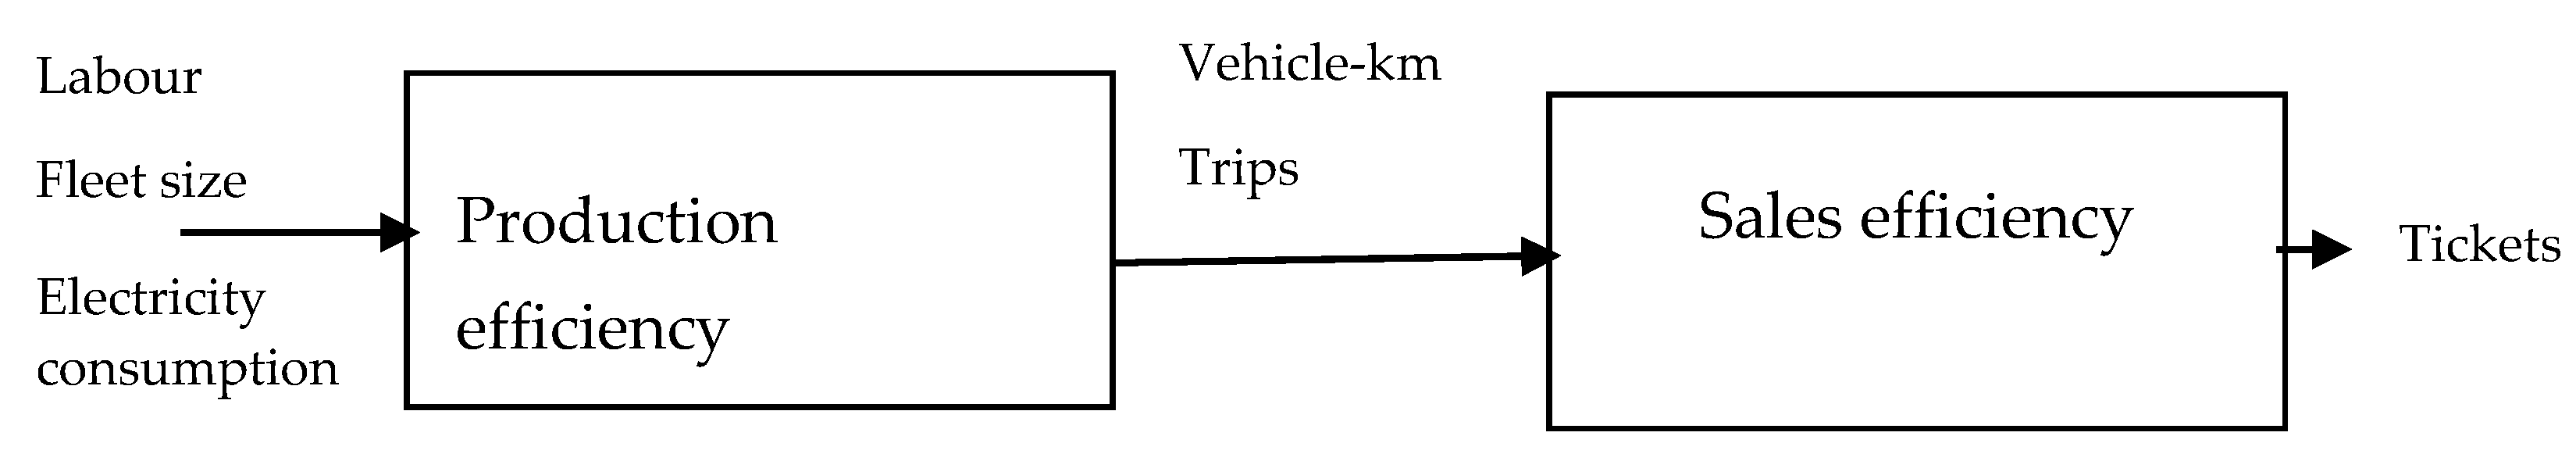
4.1. Series Two-Stage DEA Structure

The current study uses the series two-stage DEA model to derive bus route efficiency scores in both the production and consumption (as measured by sales) phases, taking into account the availability of data. Bus routes are considered to be entities engaging in similar activities that generate comparable results and offer similar services per length of the route. However, deficits have increased the need for government subsidies, resulting in inefficiencies [32]. Due to unavailability of data, subsidized and non-subsidized routes are not differentiated in the current study.
The independent approach [33] is used to assess the bus routes (i.e., each stage is treated separately and their common feature is that the outputs of the first stage are inputs for the second stage), and the efficiency of each stage is calculated separately. Figure 1 demonstrates the two-stage layout of the DEA sequence used to assess sampled bus routes. The selected variables are discussed in detail in Section 4.3.

4.2. Model Building

The main idea of DEA is measuring the relative efficiency of a homogeneous set of decision-making units (DMUs). Indeed, DEA believes that the performance of a DMU should be evaluated in the presence of competitors (other DMUs). CCR (Charles, Cooper and Rhodes) [7], BCC (Banker, Charles and Cooper) [34], and SBM (Slacks-Based Measure) [35] are the most popular models used in the literature [22].
The category of bus routes evaluated in the current research comprises routes of various fleet sizes, and the BCC model was therefore chosen to take account of the impact of economies of scale. Input minimizing models calculate the input decrease that could be achieved with the current output level in relation to the model orientation, whereas output maximization models indicate the maximum possible output increase for the given input number.
In stage 1 (production process), the optimization of performance is aimed at maximum output in terms of vehicle-km and trips per route given the inputs and, thus, the output-oriented version of the BCC model was used. There is no direct control over demand by bus route operators in stage 2 (sales process) and thus input orientation (i.e., BCC input-oriented model) was chosen. In the case study application, it was sought to determine to what degree the efficiency of bus routes could be improved during the production process by increasing the produced outputs given the input factors and, moreover, to determine whether the operator could be successful by reducing the number of vehicle-km and trips per route, given the demand as expressed by the number of tickets.
Assuming that there is a group of n bus routes, j = 1, …, n using inputs X Î Âm+ to generate outputs Y Î Âk+, the following BCC (envelopment form) or variable returns to scale (VRS) output-oriented Model (1) and input-oriented Model (2) [36] were selected to assess the production and sales efficiency of bus routes, respectively:
M a x ϕ subject   to j = 1 n λ j x i j x i j 0 j = 1 n λ j y r j ϕ y r j 0 j = 1 n λ j = 1 λ j , s r + , s i 0 , j = 1 , 2 , , n , i = 1 , 2 , m , r = 1 , 2 , , k
M i n θ subject   to j = 1 n λ j x i j θ x i j 0 j = 1 n λ j y r j y r j 0 j = 1 n λ j = 1 λ j , s r + , s i 0 , j = 1 , 2 , , n , i = 1 , 2 , m , l = 1 , , p , r = 1 , 2 , , k
where xij is the ith input used by the jth bus route; yrj is the rth output produced by the jth route; 1 / ϕ and θ denote the efficiency score of route “0” derived from Models (1) and (2), respectively; “0” denotes the route under assessment; and λ j is the intensity factor indicating the contribution of route j in the derivation of efficiency of route “0”.
The production efficiency of route “0” is defined by q = 1 / ϕ * , where ϕ * is the optimal solution of Model (1). The efficiency of route “0” deals with the route that has inputs x i j 0 and outputs y r j 0 , respectively. The model looks for a group of routes that are generated by weighting each route j by a coefficient λ j so that they do not use more inputs than the evaluated route and maximize outputs compared to the evaluated route. For each route, the solving process is repeated. Routes for which, respectively, q = 1 and q < 1 are considered efficient and inefficient, respectively.
For the route “0”, the optimal solution θ * of Model (2) yields a sales efficiency score. The model searches for a group of routes generated by weighting each route j by a coefficient λ j so that they do not produce more outputs than route “0” and reduce inputs compared to route “0”. Routes for which, respectively, θ * = 1 and θ * < 1 , are considered efficient and inefficient.
Without taking into account the ambiguity surrounding estimates of DEA ratings, it is presumed that any deviation from the frontier is due to inefficiency in traditional DEA applications. Uncertainty is present in DEA through sampling variability or the uncertainty arising from the estimation of the frontier and may lead to biased DEA (point) estimates and thus to misleading conclusions. The bootstrap, developed by Efron [37] and Efron and Tibshirani [38], was advocated as a way of analyzing the sensitivity to the sampling variance of calculated efficiency scores [39,40,41] and evaluating the robustness of DEA point estimates through confidence interval construction [39,42,43].
The proposed modeling approach can be expanded to include undesirable outputs, such as air pollution in the case of non-electric buses or accidents [14,44], which are components of the transportation cost [45]. Moreover, bootstrapped truncated regression can also be used to identify the drivers of performance. The bootstrapped bias-corrected DEA efficiency ratings should be regressed on explanatory variables using bootstrapped truncated regression [46].

4.3. Data Set

A group of twenty electric bus routes was examined for the purpose of the present paper. They are considered homogeneous because they use the same production technology and can therefore be compared with the DEA in terms of their performance.
In the evaluation of the trolley bus transit system in Greece in this paper, the unit of analysis or the DMU is the provision of the transportation services along a trolley bus route. The basic principle behind the DEA performance appraisal is that the DMU being measured uses limited resources (inputs) (in this case fleet size, man-hours, electricity) and generates output, i.e., goods (vehicle-km, trips) and services (tickets) for society; see [47] for a similar discussion.
Fleet size, man-hours, and electricity are considered as route inputs and the number of vehicle-km and trips as the route output variables during a particular year in the production sub-process. Labor is measured by the number of man-hours per year working on each route. The capital is measured by the size of the fleet, which is the available number of vehicles working on a route annually. Electricity is determined by the overall consumption of electricity. The sales sub-process deals with the optimization of ticket sales on each route and, as a result, the number of ticket validations is set as an output variable, whereas the (intermediate) outputs of the first sub-process (vehicle-km, trips) are considered as inputs. Other factors that reflect attractiveness, such as the number of stops, punctuality, and spatial design of bus routes, may also affect the consumption phase (sales) but these factors were not considered due to unavailability of data.
The selection of input and output variables in the DEA evaluations is justified by two isotonicity tests [48] for the production and sales process. To investigate whether input increases lead to higher outputs, these tests were carried out by measuring all inter-correlations among all variables. Tests were passed for the two processes and the selection of variables was therefore justified. The twenty routes selected comply with the Cooper et al. thumb rule criteria [36].
With the exception of the average number of trips per length of route, which was calculated in this paper, data on variables in the production and sales process were collected from a previous study [16]. Table 1 displays the descriptive statistics of the bus route variables used. An Internet-based map [49] provides a geospatial representation of the existing multimodal transport network, including the electric (trolley) bus network that serves the city centers of Athens and Piraeus. A previously developed map of a similar nature is also mentioned in the literature [50].

5. Results

5.1. Production and Sales Efficiency

The DEA point estimates, the bias-corrected estimates, and the estimated 95 percent confidence bounds are shown in Table 2. The results were created using 2000 bootstrap replications.
Taking into account the results provided by the BCC output-oriented Model (1), 10 (50 percent) of the 20 routes were found to be relatively productive efficient; mean production efficiency: 0.94. The median production efficiency was around 0.99. The efficiency score of 0.94 means that by generating more outputs by around 6 percent (= (1/0.94) − 1) while retaining the same input level, performance can be improved. The BCC input-oriented Model (2) results indicate that 10 (50 percent) of the 20 routes were found to be relatively efficient; mean sales efficiency: 0.94. In addition, by reducing the current input level by 6% (= 1 − 0.94) while retaining the same output level, performance in the sales process can be increased.
The output-oriented bootstrap results of the bias-corrected BCC boost the discriminating power of the output-oriented BCC model because the BCC estimates seem to be skewed upwards. Because all routes are inefficient, according to bootstrap estimates, there is scope for improvement in production efficiency by generating more outputs by about 9 percent (= (1/0.92) − 1). The median of the bias-corrected efficiency is around 0.95. The bias-corrected BCC input-oriented bootstrap results also enhance the BCC input-oriented model’s discriminating power, because the BCC estimates tend to be skewed upwards. There is space for improvement in sales efficiency by minimizing inputs by about 9 percent, according to bootstrap estimates. The median of the bias-corrected efficiency is approximately 95 percent.
There is no connection between production and sales efficiency, i.e., a bus route that performs well in the production process does not appear to also perform well in the sales process.

5.2. Arterial vs. Feeder–Local Bus Routes

Two types of bus routes were classified: arterial and feeder–local. Suburban areas and downtown Athens are connected by arterial buses. In downtown Athens and Piraeus, feeder buses connect major subway stations or bus terminals, and local buses operate on circular routes in downtown Athens and Piraeus, especially for access to major shopping and business areas.
In view of the results of the current analysis (Table 3), the average performance of arterial bus routes in the production process is marginally better (point estimate: 96 percent; bootstrapping biased corrected: 93 percent), relative to feeder–local bus routes (point estimate: 93 percent; bootstrapping biased corrected: 90 percent). On average, the feeder–local bus routes achieve a marginally better sales performance (point estimate: 0.96; bootstrapping biased corrected: 0.93), compared to arterial bus routes (point estimate: 91 percent; bootstrapping biased corrected: 89 percent).
It should be noted that arterial buses, because they have the highest speed in the suburban area, achieve an average higher speed and thus perform better in the production process. The feeder–local buses carry high passenger loads and more easily meet the increased demand for short trips, especially in downtown Athens, compared to the arterial buses that should concentrate on meeting the long-trip demand. As a result, feeder–local buses show greater results in sales efficiency because all electric bus routes have an equal fare. The length of a bus route may influence its relative efficiency, but the bootstrapped truncated regression [46] does not support this.

6. Conclusions and Implications

Several enhancements to transit performance assessment were suggested by the current study. The first enhancement lies in the implementation of a series two-stage DEA approach to evaluate the efficiency of electric bus routes in the sub-processes of production and sales. The series two-stage DEA model was used in order to overcome the limitation of single DEA model that cannot accommodate an internal structure and interrelationships between the variables of the sub-processes. The second development is that, by combining DEA with bootstrapping, the current study provides new empirical evidence on the performance of electric bus routes. In addition, bootstrapping in the current research serves as a tool to fully rank the assessed routes, thus overcoming the limitations of conventional DEA models.
The current research is a first step towards deriving DEA-based production and sales efficiency scores for a sample of electric bus routes. The assessed routes display a comparable efficiency in both processes, i.e., production and consumption, but production and sales efficiency are not associated. In the light of the results, the arterial buses perform better in the production process, whereas the feeder–local buses show greater performance in sales efficiency. From these findings, some policy implications can be obtained. In particular, more focus should be given to sales efficiency for arterial bus routes, while production efficiency should be concerned for the feeder–local bus routes.
The modeling approach used in this research may be useful to managers and operators because it can help them to identify best-in-class and lagging bus routes in both production and sales sub-process. Policy makers could employ it to monitor both production and sales performance, select the best-in-class routes that can use the as benchmarks, and develop necessary interventions to improve the performance.
The results derived are sample specific, so future researches can use the proposed framework to appraise other bus routes, in order to quantify performance and investigate whether their findings are similar with those of the current study. As more data become available, the number of bus stops and waiting time can be used as explanatory variables to further examine the drivers of performance. Moreover, although the current analysis involved only static DEA models, future research can be based on dynamic analysis. If a long-time series of data is made available, DEA can provide a dynamic evaluation of transit performance.

Funding

This research received no external funding.

Conflicts of Interest

The author declares no conflict of interest.

References

  1. Tomazinis, A.R. Productivity, Efficiency, and Quality in Urban Transportation Systems; Heath and Company: Lexington, MA, USA, 1975. [Google Scholar]
  2. Tomazinis, A.R. A Study of Efficiency Indicators of Urban Public Transportation Systems; Final Report DOT-TST-77-47; USDOT: Washington, DC, USA, 1977.
  3. Fielding, G.L.; Glauthier, R.E.; Lave, C.A. Performance indicators for transit management. Transportation 1978, 7, 365–379. [Google Scholar] [CrossRef]
  4. Fielding, G.L.; Glauthier, R.E.; Lave, C.A. Distribution and Allocation of Transit Subsidies in California. Transit Management Program; School of Sciences and Institute of Transportation Studies, University of California: Irvine, CA, USA, 1976. [Google Scholar]
  5. Deng, Y.; Yan, Y. Evaluating route and frequency design of bus lines based on data envelopment analysis with network epsilon-based measures. J. Adv. Transp. 2019, 12. [Google Scholar] [CrossRef]
  6. Karlaftis, M.G.; McCarthy, P.S. Subsidy and public transit performance: A factor analytic approach. Transportation 1997, 24, 253–270. [Google Scholar] [CrossRef]
  7. Benjamin, J.; Obeng, K. The effect of policy and background variables on total factor productivity for public transit. Transp. Res. 1990, 24B, 1–14. [Google Scholar] [CrossRef]
  8. Stokes, B.R. The need for and use of performance indicators in transit. Transit J. 1979, 1, 3–10. [Google Scholar]
  9. Aigner, D.J.; Lovell, C.A.K.; Schmidt, P.J. Formulation and estimation of stochastic frontier production function models. J. Econom. 1977, 6, 21–37. [Google Scholar] [CrossRef]
  10. Meeusen, W.; van den Broeck, J. Efficiency estimation from Cobb-Douglas production functions with composed error. Int. Econ. Rev. 1977, 18, 435–444. [Google Scholar] [CrossRef]
  11. Charnes, A.; Cooper, W.W.; Rhodes, E. Measuring the efficiency of decision making units. Eur. J. Oper. Res. 1978, 2, 429–444. [Google Scholar] [CrossRef]
  12. Lozano, S.; Gutiérrez, E. A slacks-based network DEA efficiency analysis of European airlines. Transp. Plan. Technol. 2014, 37, 623–637. [Google Scholar] [CrossRef]
  13. Holmgren, J. The effects of using different output measures in efficiency analysis of public transport operations. Res. Transp. Bus. Manag. 2018, 28, 12–22. [Google Scholar] [CrossRef]
  14. Hahn, J.-S.; Kim, D.-K.; Kim, H.-C.; Lee, C. Efficiency analysis on bus companies in Seoul city using a network DEA model. KSCE J. Civ. Eng. 2013, 17, 1480–1488. [Google Scholar] [CrossRef]
  15. Kao, C. Network data envelopment analysis: A review. Eur. J. Oper. Res. 2014, 239, 1–16. [Google Scholar] [CrossRef]
  16. Kagiantalidis, N. Measurement of Technical Efficiency. Case Study: The Routes of ILPAP S.A. Diploma Thesis, National Technical University of Athens, Athens, Greece, 2004. [Google Scholar]
  17. Michaelides, P.G.; Belegri-Roboli, A.; Marinos, T. Evaluating the Technical Efficiency of Trolley Buses in Athens, Greece. J. Public Transp. 2010, 13, 93–109. [Google Scholar] [CrossRef]
  18. Chu, X.; Fielding, G.J.; Lamar, B.W. Measuring transit performance using data envelopment analysis. Transp. Res. 1992, 26A, 223–230. [Google Scholar] [CrossRef]
  19. Odeck, J.; Alkadi, A. Evaluating efficiency in the Norwegian bus industry using data envelopment analysis. Transportation 2001, 28, 211–232. [Google Scholar] [CrossRef]
  20. Nolan, J.F.; Ritchie, P.C.; Rowcroft, J.E. Identifying and measuring public policy goals: ISTEA and the US bus transit industry. J. Econ. Behav. Organ. 2002, 48, 291–304. [Google Scholar] [CrossRef]
  21. Viton, P.A. Changes in multi-mode bus transit efficiency, 1998–1992. Transportation 1998, 25, 1–21. [Google Scholar] [CrossRef]
  22. Mahmoudi, R.; Emrouznejad, A.; Shetab-Boushehri, S.N.; Hejazi, S.R. The origins, development and future directions of Data Envelopment Analysis approach. Transp. Syst. Socio-Econ. Plan. Sci. 2020, 69, 100762. [Google Scholar]
  23. Yu, M.M. Measuring the efficiency and return to scale status of multi-mode bus transit—Evidence from Taiwan’s bus system. Appl. Econ. Lett. 2008, 15, 647–653. [Google Scholar] [CrossRef]
  24. Yu, M.M.; Fan, C.K. Measuring the performance of multimode bus transit. A mixed structure network DEA model. Transp. Res. Part E 2009, 45, 501–515. [Google Scholar] [CrossRef]
  25. Sheth, C.; Triantis, K.; Teodorović, D. Performance evaluation of bus routes: A provider and passenger perspective. Transp. Res. Part E 2007, 43, 453–478. [Google Scholar] [CrossRef]
  26. Lao, Y.; Liu, L. Performance evaluation of bus lines with Data Envelopment Analysis and Geographic Information Systems. Comput. Environ. Urban Syst. 2009, 33, 247–255. [Google Scholar] [CrossRef]
  27. Hahn, J.S.; Kim, H.R.; Kho, S.Y. Analysis of the efficiency of Seoul arterial bus routes and its determinant factors. KSCE J. Civ. Eng. 2011, 15, 1115–1123. [Google Scholar] [CrossRef]
  28. Li, X.; Yu, J.; Shaw, J.; Wang, Y. Route-level transit operational-efficiency assessment with a bootstrap super-data-envelopment analysis model. J. Urban Plan. Dev. 2017, 143, 04017007. [Google Scholar] [CrossRef]
  29. Zhang, K.; Xu, Y.; Sun, D. A mixed frontier model for urban bus performance evaluation. Proc. Inst. Civ. Eng. Transp. 2018, 171, 65–74. [Google Scholar] [CrossRef]
  30. Wei, R.; Liu, X.; Mu, Y.; Wang, L.; Golub, A.; Farber, S. Evaluating public transit services for operational efficiency and access equity. J. Transp. Geogr. 2017, 65, 70–79. [Google Scholar] [CrossRef]
  31. Farrell, M.J. The measurement of productive efficiency. J. R. Stat. Soc. Ser. A 1957, 120, 253–290. [Google Scholar] [CrossRef]
  32. Boame, K.A.; Obeng, K. Sources of productivity change: A Malmquist total factor productivity approach. Transp. Rev. 2005, 25, 103–116. [Google Scholar] [CrossRef]
  33. Koronakos, G. A taxonomy and review of the network data envelopment analysis literature. In Machine Learning Paradigms. Learning and Analytics in Intelligent Systems; Tsihrintzis, G., Virvou, M., Sakkopoulos, E., Jain, L., Eds.; Springer: Cham, Switzerland, 2019; Volume 1, pp. 255–311. [Google Scholar] [CrossRef]
  34. Banker, R.D.; Charnes, A.; Cooper, W.W. Models for estimating technical and scale efficiencies in Data Envelopment Analysis. Manag. Sci. 1984, 30, 1078–1092. [Google Scholar] [CrossRef] [Green Version]
  35. Tone, K. A slacks-based measure of efficiency in data envelopment analysis. Eur. J. Oper. Res. 2001, 130, 498–509. [Google Scholar] [CrossRef] [Green Version]
  36. Cooper, W.W.; Seiford, L.M.; Tone, T. Data Envelopment Analysis: A Comprehensive Text with Models, Applications, References and DEA-Solver Software; Springer Science + Business Media, Inc.: New York, NY, USA, 2007. [Google Scholar]
  37. Efron, B. The Jackknife, the Bootstrap, and Other Resampling Plans; Society for Industrial and Applied Mathematics Philadelphia: Philadelphia, PA, USA, 1982. [Google Scholar]
  38. Efron, B.; Tibshirani, R.J. An Introduction to the Bootstrap; Chapman & Hall: New York, NY, USA, 1993. [Google Scholar]
  39. Simar, L.; Wilson, P.W. Sensitivity analysis of efficiency scores: How to bootstrap in nonparametric frontier models. Manag. Sci. 1998, 44, 49–61. [Google Scholar] [CrossRef] [Green Version]
  40. Ferrier, G.D.; Hirschberg, J.G. Bootstrapping confidence intervals for linear programming efficiency scores: With an illustration using Italian banking data. J. Product. Anal. 1997, 8, 19–33. [Google Scholar] [CrossRef]
  41. Löthgren, M.; Tambour, M. Bootstrapping DEA-based efficiency measures and Malmquist productivity indices. A study of Swedish eye-care service provision. Appl. Econ. 1999, 31, 417–425. [Google Scholar]
  42. Simar, L.; Wilson, P.W. Statistical inference in nonparametric frontier models: The state of the art. J. Product. Anal. 2000, 13, 49–78. [Google Scholar] [CrossRef]
  43. Simar, L.; Wilson, P.W. A general methodology for bootstrapping in nonparametric frontier models. J. Appl. Stat. 2000, 27, 779–802. [Google Scholar] [CrossRef]
  44. Hahn, J.-S.; Kho, S.-Y.; Choi, K.; Kim, D.-K. Sustainability evaluation of rapid routes for buses with a network DEA model. Int. J. Sustain. Transp. 2017, 11, 659–669. [Google Scholar] [CrossRef]
  45. Polyzos, S.; Tsiotas, D. The contribution of transport infrastructures to the economic and regional development: A review of the conceptual framework. Theor. Empir. Res. Urban Manag. 2020, 15, 5–23. [Google Scholar]
  46. Simar, L.; Wilson, P.W. Estimation and inference in two-stage, semi-parametric models of productive processes. J. Econom. 2007, 136, 31–64. [Google Scholar] [CrossRef]
  47. Graham, D.J. Productivity and Efficiency in Urban Railways: Parametric and Non-Parametric Estimates. Transp. Res. Part E: Logist. Transp. Rev. 2008, 44, 84–99. [Google Scholar] [CrossRef]
  48. Mostafa, M.M. Modeling the competitive market efficiency of Egyptian companies: A probabilistic neural network analysis. Expert Syst. Appl. 2009, 36, 8839–8848. [Google Scholar] [CrossRef]
  49. Athens Live Bus Map. Available online: https://oasa.live/ (accessed on 9 March 2021).
  50. Stathopoulos, A.; Tsekeris, T. The Athens dynamic traffic map for multimodal travel information services. J. Maps 2008, 4, 119–133. [Google Scholar] [CrossRef]
Figure 1. Series two-stage data envelopment analysis (DEA) approach.
Infrastructures 06 00044 g001
Table 1. Electric bus routes: Descriptive statistics.
Descriptive StatisticsMan-HoursFleet Size (Number of Vehicles)Electricity Consumed (kWh)Vehicle-kmTrips per Legth RouteTickets
Mean21,2263361,489,200548,8221091,647,906
Standard deviation8595130676,716244,11140924,663
Median20,5113591,523,294511,144911,652,333
Min7749119385,181157,02473470,973
Max38,5595942,472,323955,6291893,839,893
Table 2. Bus route efficiency measures for production and sales process and descriptive statistics.
Sub-Process Efficiency/Bus Routes (BR)Production EfficiencySales Efficiency
DEA estimatesBCC-O point estimatesBCC-O
bias-corrected
BCC-O
L
BCC-O
U
BCC-I point estimatesBCC-I
bias-corrected
BCC-I
L
BCC-I
U
BR10.960.950.890.960.960.940.900.96
BR20.770.760.740.771.000.960.911.00
BR31.000.960.891.001.000.940.781.00
BR40.820.810.790.821.000.980.931.00
BR51.000.950.881.001.000.970.911.00
BR60.920.910.870.920.910.900.870.91
BR71.000.940.811.001.000.950.821.00
BR81.000.960.861.001.000.980.881.00
BR90.880.860.840.871.000.970.911.00
BR100.840.830.810.840.970.950.890.97
BR110.930.910.880.920.840.830.810.84
BR121.000.970.901.001.000.980.921.00
BR130.950.940.910.951.000.970.931.00
BR140.810.800.760.810.970.960.930.97
BR151.000.970.911.000.930.910.880.92
BR161.000.960.891.000.750.730.700.75
BR170.970.950.900.970.780.770.730.78
BR181.000.970.921.000.720.710.680.72
BR191.000.970.931.001.000.960.871.00
BR201.000.970.931.000.9360.920.890.94
Mean0.940.920.870.940.940.910.860.94
Standard deviation0.080.070.060.080.090.080.080.09
Median0.990.950.880.980.980.950.890.98
Min0.770.760.740.770.720.710.680.72
Max1.000.970.931.001.000.980.931.00
BCC-O: BCC output-oriented model; BCC-I: BCC input-oriented model; L: Lower bound; U: Upper bound.
Table 3. Descriptive statistics of arterial vs. feeder–local bus route efficiency measures for production and sales process.
Bus Route TypeArterial Bus RoutesFeeder–Local Bus Routes
Sub-Process EfficiencyProduction EfficiencySales EfficiencyProduction EfficiencySales Efficiency
DEA estimatesBCC-O point estimatesBCC-O
bias-corrected
BCC-I point estimatesBCC-I
bias-corrected
BCC-O point estima-tesBCC-O
bias-corrected
BCC-I point estimatesBCC-I
bias-corrected
Mean0.960.930.910.890.930.900.960.93
Standard deviation0.050.040.100.090.100.080.080.07
Median0.970.950.950.931.000.951.000.96
Min0.840.830.720.710.770.760.750.73
Max1.000.971.000.981.000.971.000.98
BCC-O: BCC output-oriented model; BCC-I: BCC input-oriented model.
Publisher’s Note: MDPI stays neutral with regard to jurisdictional claims in published maps and institutional affiliations.

