
Developing Evaluation Framework for Intelligent Transport System on Public Transportation in Bangkok Metropolitan Regions Using Fuzzy AHP


Abstract
1. Introduction
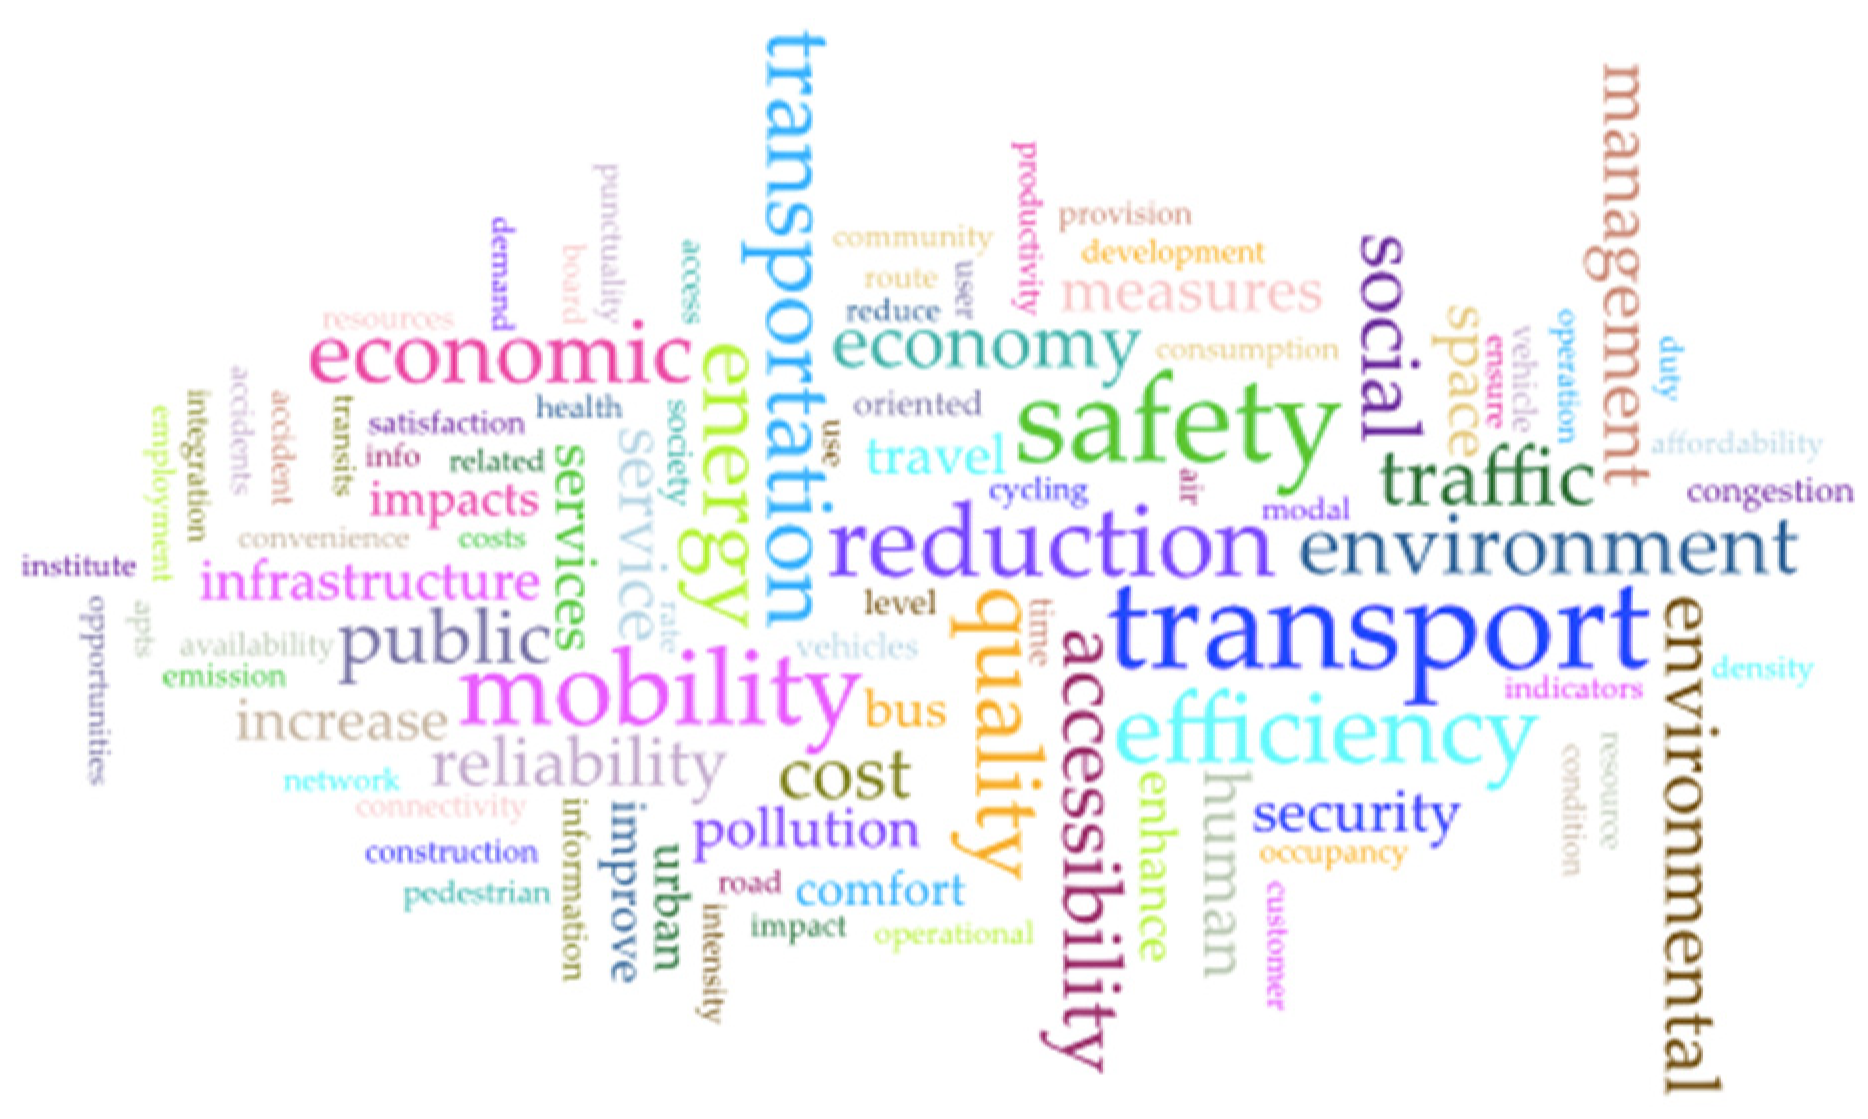
2. Literature Review
2.1. ITS and APTS Assessment Framework Subsection
2.2. AHP, and Fuzzy AHP of Transportation, ITS, and Public Transportation
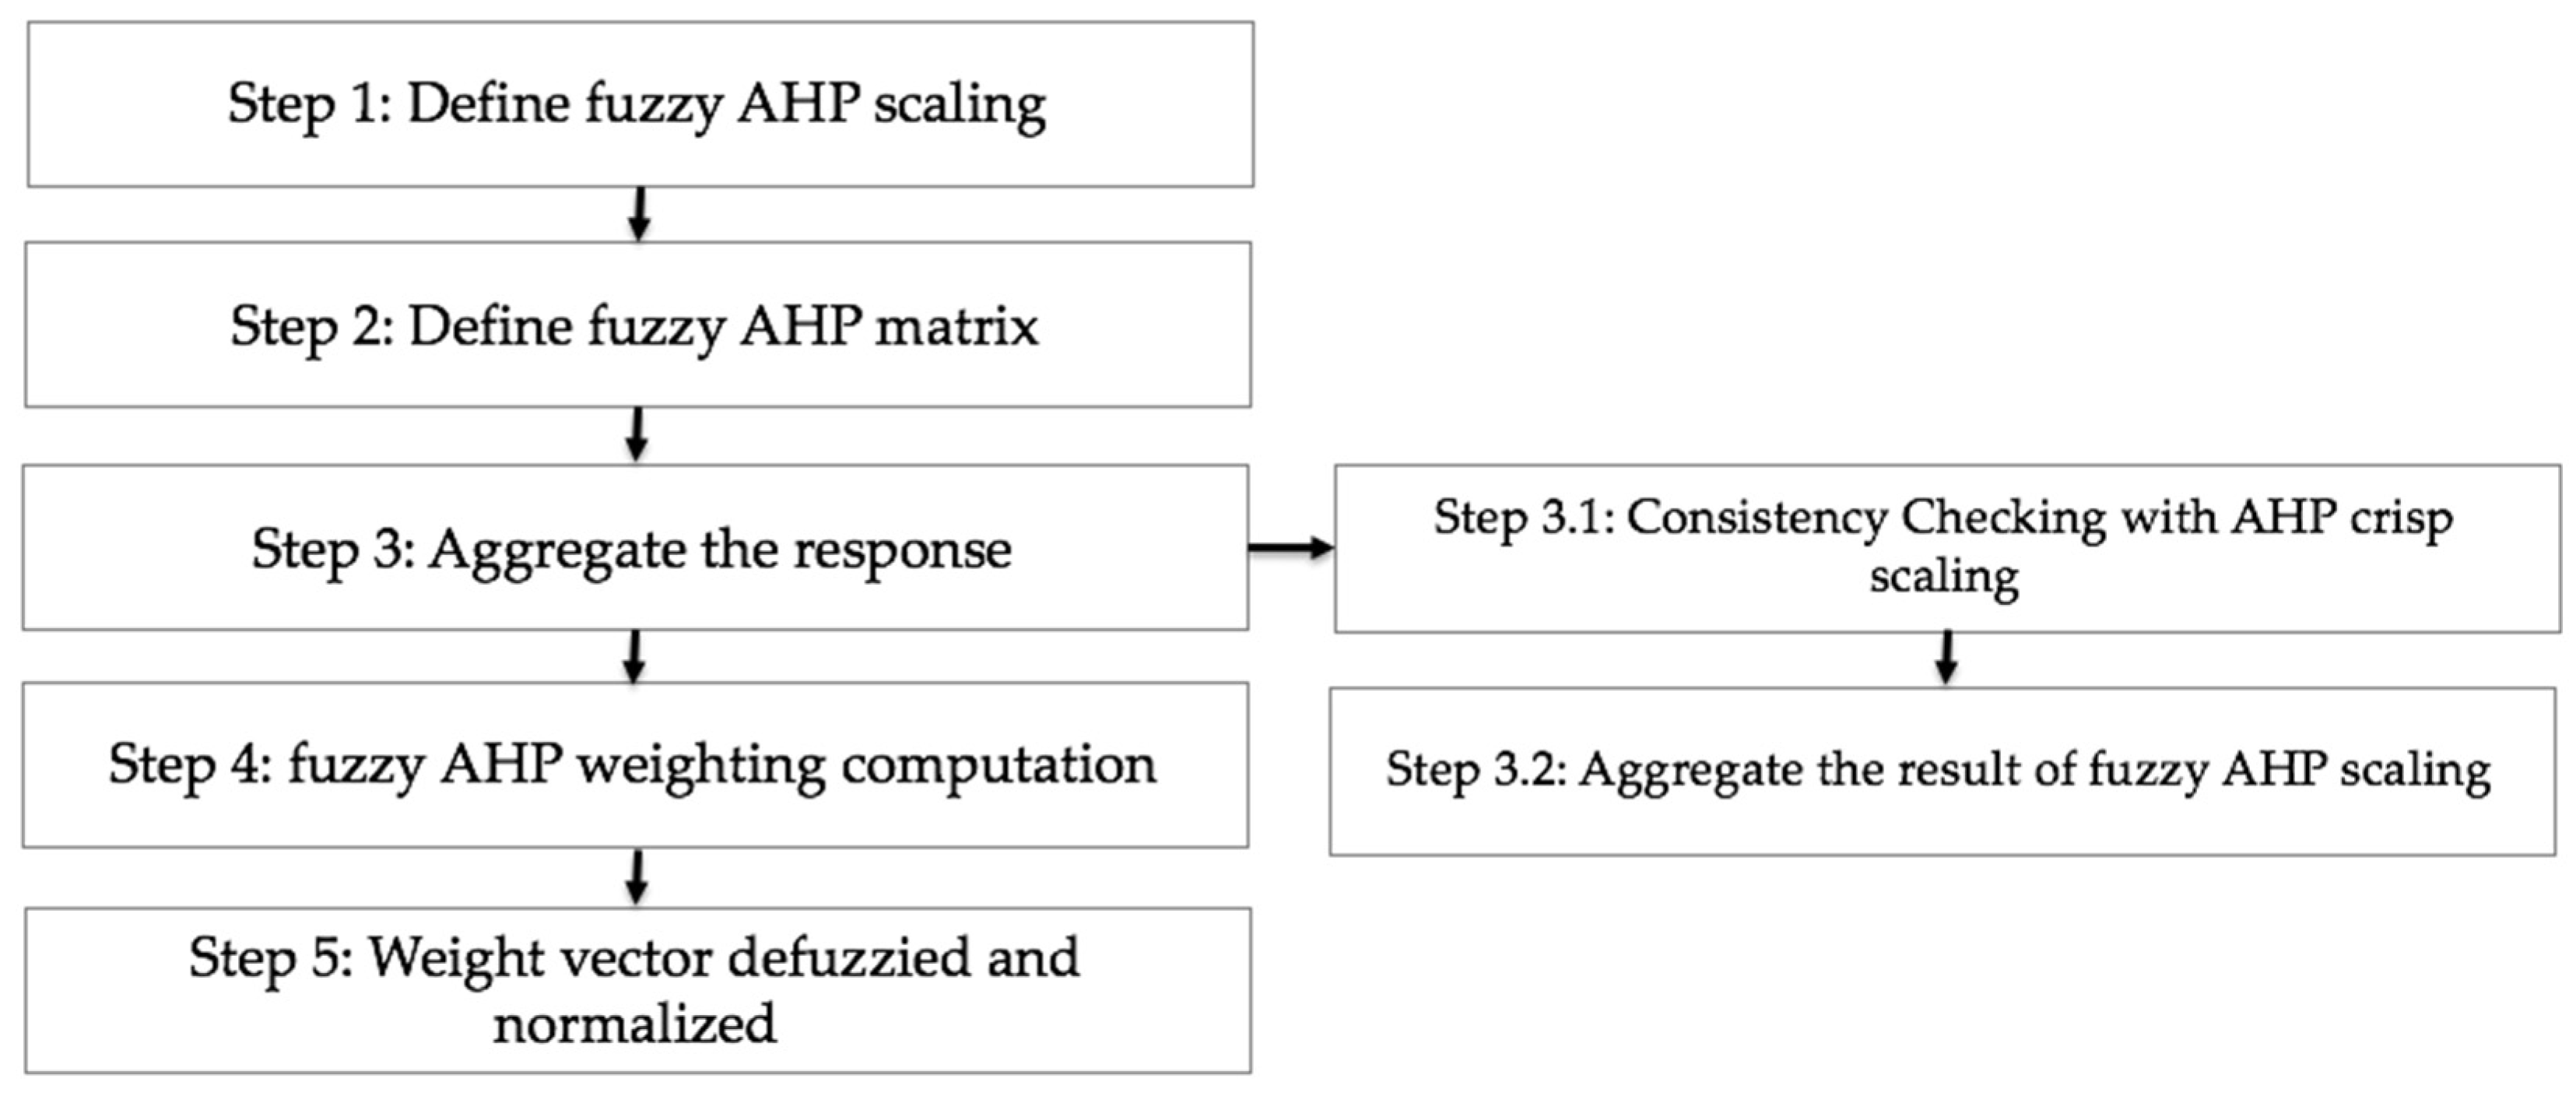
3. Research Methodology and Materials
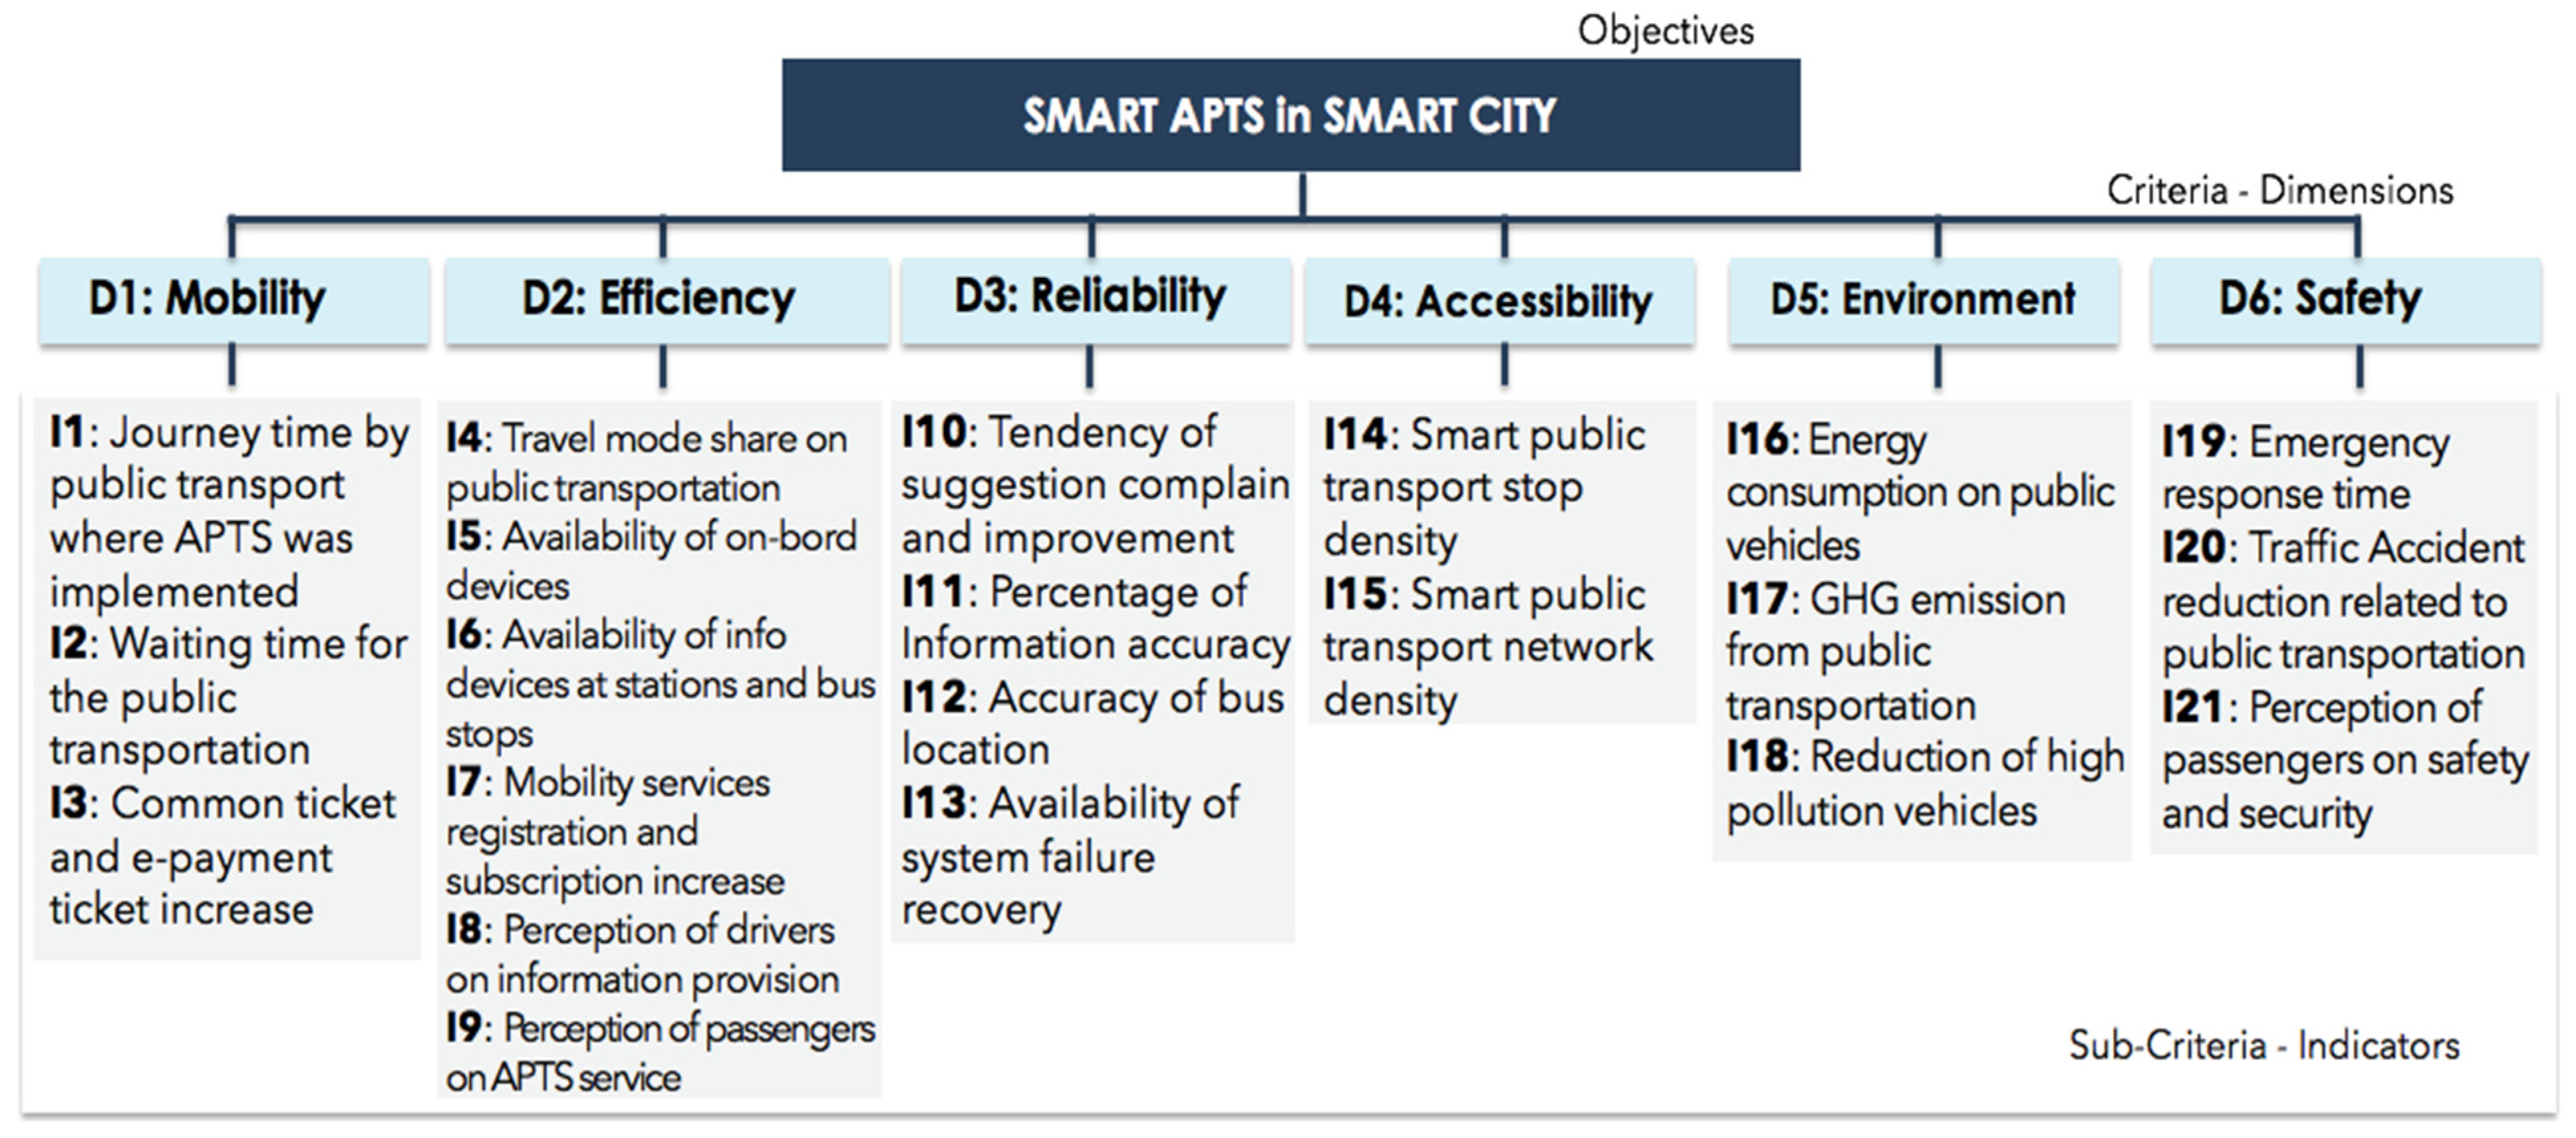
3.1. Dimension and Indicator Determination
3.1.1. Dimension Determination
3.1.2. Indicator Determination
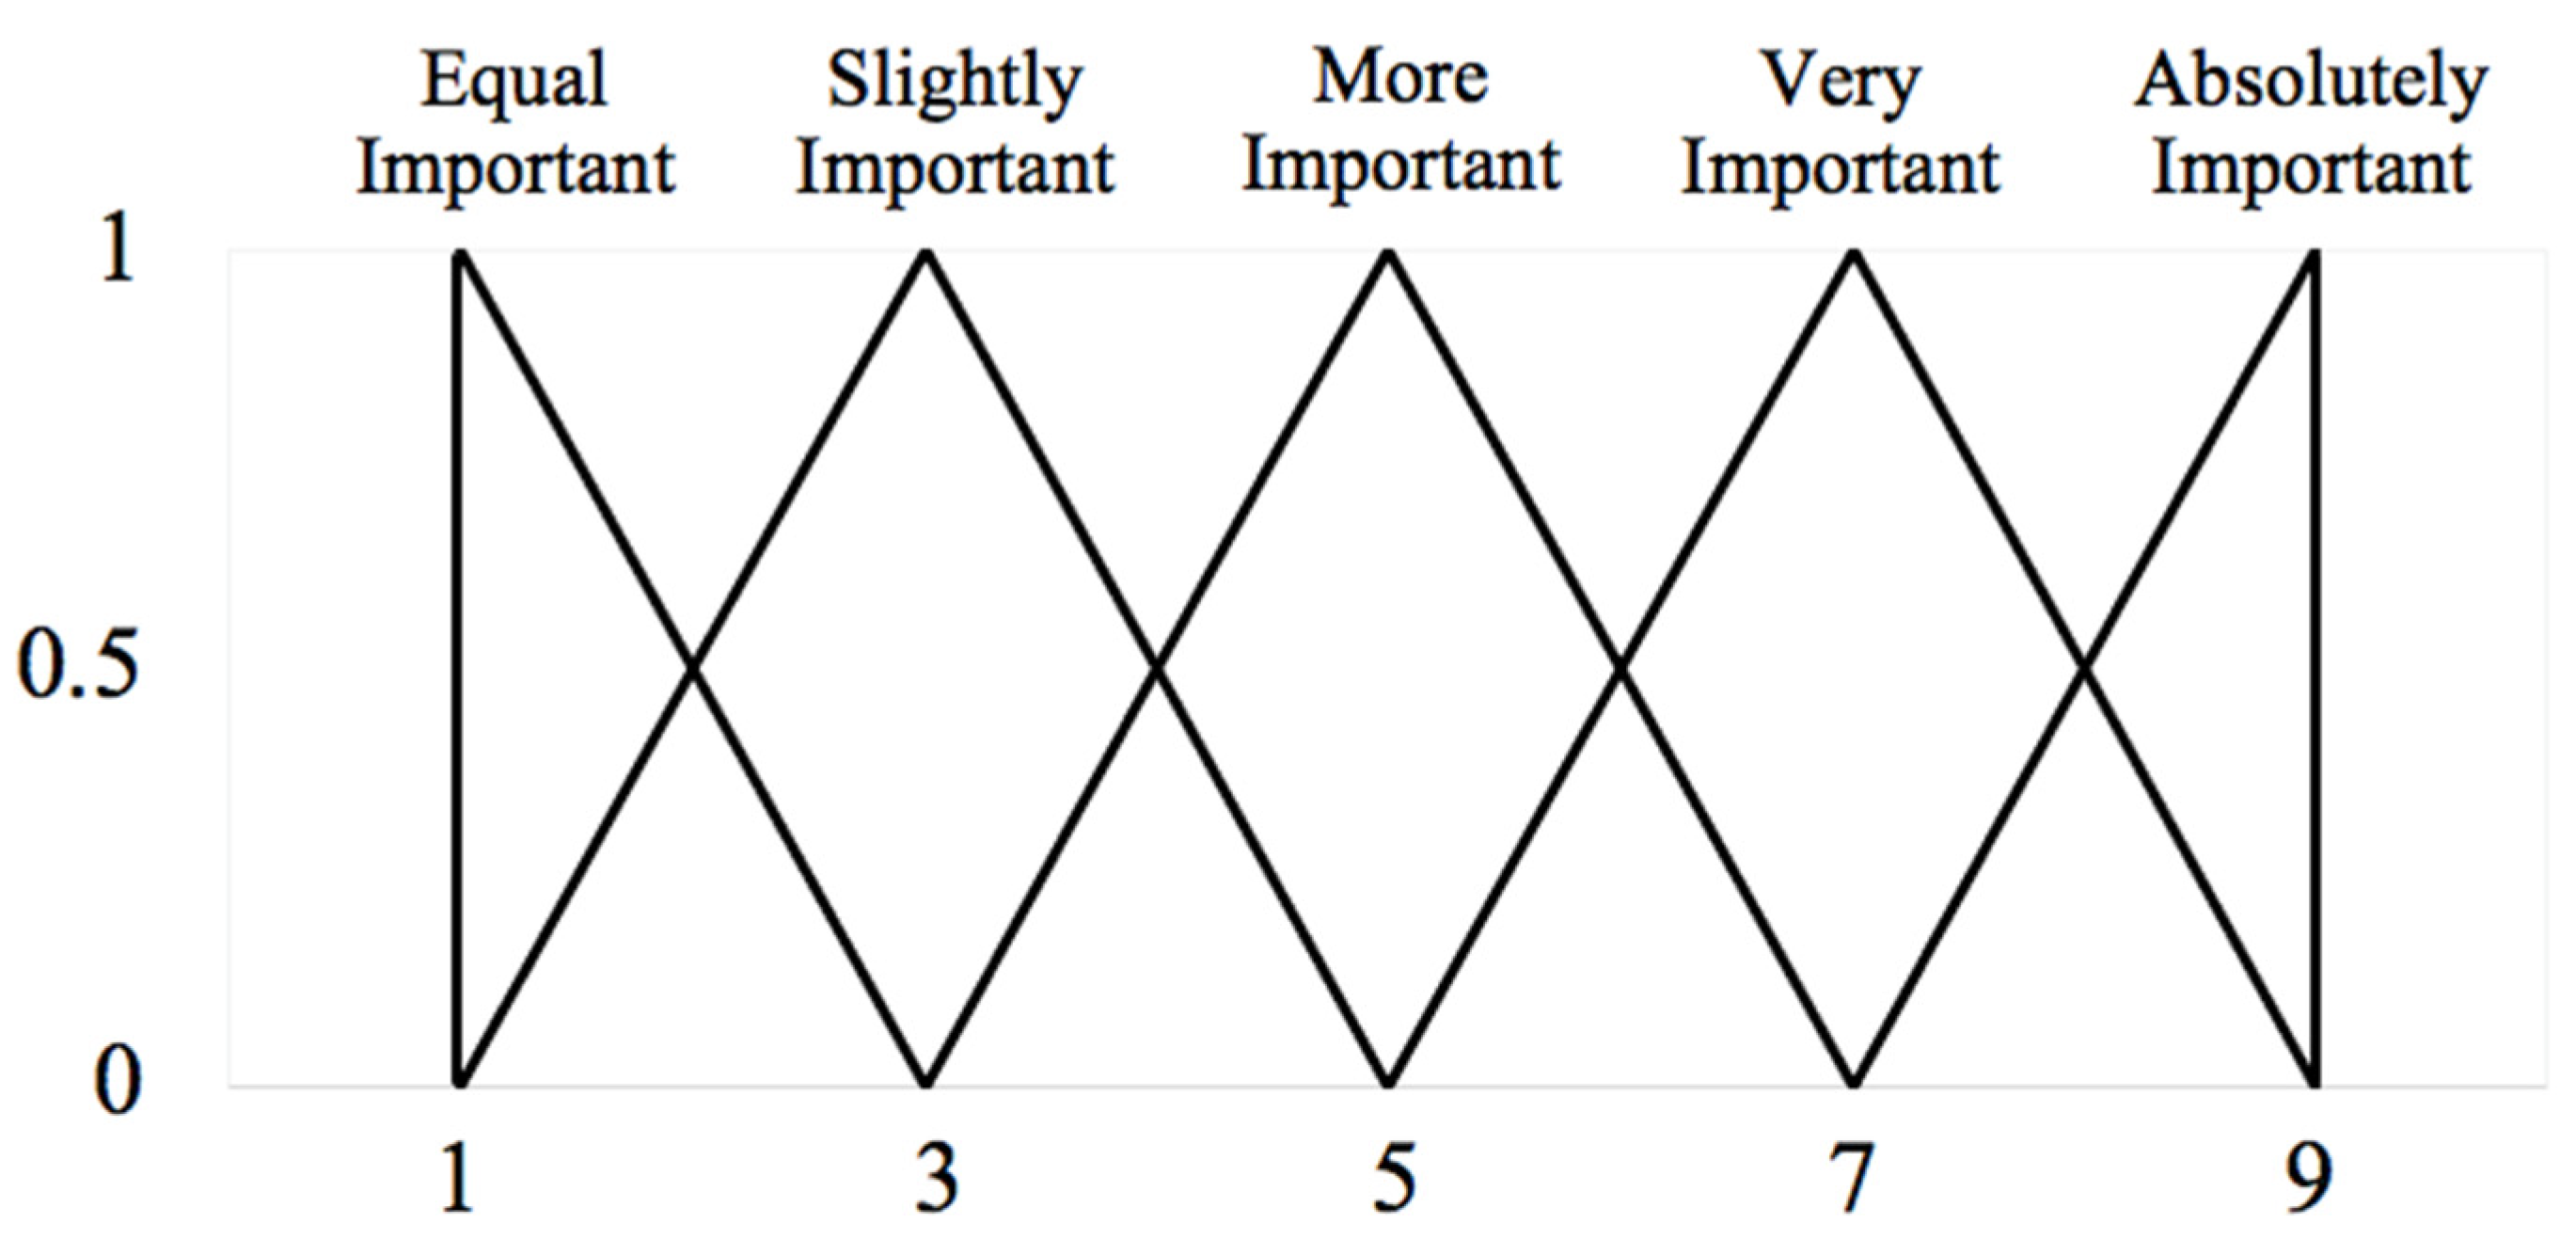
3.2. Dimension and Indicator Weighting Analysis by Fuzzy AHP
3.3. Opinion Survey Analysis
- What is the most important for APTS development in Thailand?
- What is the most challenge of APTS development in Thailand?
- How can the responsible agencies improve the planning process of APTS in Thailand?
- What is the biggest challenge of system evaluation in Thailand?
- How can the responsible agencies improve the evaluation process?
4. Result of Questionnaires and Discussion
4.1. Fuzzy AHP Weighting of APTS
4.2. Experts’ Perspective Analysis
4.3. Correlation of Fuzzy AHP and Experts’ Perspective Analysis
5. Conclusions
- It is important to eradicate the restriction of integrated and collaborated procedures of data and information among stakeholders, especially in the public and private sectors.
- The agreement of open data platform should be brought out for discussion in order to implement, which has a result in fluent data integration implementation.
- The appropriate central agency should be assigned to respond to an assessment of project development with legal stated roles and responsibilities while the committee or executive board can be applied to be a channel of regulation.
- The plan and action plan should be elaborated to stakeholders with definite goals, objectives, directions, procedures, and evaluated indicators of impacts of project development under the plan.
- The continual project development and maintenance should be identified for a reliable and sustainable system that can serve an effective information integration and big data analysis.
- Lastly, the service should be designed to serve users’ satisfaction which leads to user participation for both planning and evaluation of the result of development.
6. Recommendation
Author Contributions
Funding
Institutional Review Board Statement
Informed Consent Statement
Conflicts of Interest
References
- Shaheen, S.A.; Finson, R. Intelligent transportation systems. In Reference Module in Earth Systems and Environmental Sciences; Elsevier Encyclopedia of Energy; Elsevier: Amsterdam, The Netherlands, 2013. [Google Scholar]
- Office Transport and Traffic Policy and Planning. Executive Summary Report: Study of Intelligent Transport System Development Master Plan in Bangkok Metropolitan Region; Office Transport and Traffic Policy and Planning: Bangkok, Thailand, 2017. [Google Scholar]
- Memorandum of Understanding between BMTA and ViaBus. Available online: http://www.bmta.co.th/th/content/พิธีลงนามบันทึกข้อตกลง-ความร่วมมือสนับสนุนการใช้งานนวัตกรรม-viabus-application (accessed on 6 May 2021).
- Plan B Media. Plan B Receivs the Smart Bus Shelter Right from Bangkok, Emphasizing Being the Most Comprehensive Out of Home Media Network in the Region, Ready to Expanding Content Towards Multi-Channel Marketing. Available online: https://investor.planbmedia.co.th/news.html/id/785778/group/newsroom_press (accessed on 6 May 2021).
- Narupiti, S. Exploring the possibility of MaaS service in Thailand, implications from the existing conditions and experts’ opinions on “Who should be the MaaS provider in Bangkok? ” IATSS Res. 2019, 43, 226–234. [Google Scholar] [CrossRef]
- Office Transport and Traffic Policy and Planning. Evaluation Report of ITS Action Plan Short Term (3 Years: 2018–2020); Office Transport and Traffic Policy and Planning: Bangkok, Thailand, 2020. [Google Scholar]
- Antolin, J.; Torre, C.D.; Garcia-Fuentes, M.A.; Perez, A.; Tome, I.; Mirantes, M.L.; Hoyos, E. Development of an evaluation framework for smartness and sustainability in cities. Sustainability 2020, 12, 5193. [Google Scholar] [CrossRef]
- Newman-Askins, R.; Ferreira, L.; Bunker, J. Intelligent Transport System Evaluation: From theory to practice. In Proceedings of the 21st ARRB and 11th REAAA Conference, Cairns, QLD, Australia, 18–23 May 2003; Cairns, Australia, Jaeger, V., Ed.; [Google Scholar]
- Ishizaka, A.; Labib, A. Review of the main developments in the Analytic Hierarchy Process. Expert Syst. Appl. 2011, 38, 14336–14345. [Google Scholar] [CrossRef]
- Chen, L.; Deng, X.A. Modified method for evaluating sustainable transport solutions based on AHP and Dempster–Shafer Evidence Theory. Appl. Sci. 2018, 8, 563. [Google Scholar] [CrossRef]
- Vaidya, O.; Kumar, S. Analytic Hierarchy Process: An overview of applications. Eur. J. Oper. Res. 2006, 169, 1–29. [Google Scholar] [CrossRef]
- Yeh, C.H.; Deng, H.; Chang, Y.H. Fuzzy multicriteria analysis for performance evaluation of bus companies. Eur. J. Oper. Res. 2000, 126, 59–473. [Google Scholar] [CrossRef]
- Pedrycz, W.; Ekel, P.; Parreiras, R. Fuzzy Multicriteria Decision-Making: Model, Methods and Applications; John Wiley & Sons: Hoboken, NJ, USA, 2010; pp. 14–17. [Google Scholar]
- Kabir, G.; Hasin, M.A.A. Comparative analysis of AHP and fuzzy AHP models for multicriteria inventory classification. Int. J. Fuzzy Log. Syst. 2011, 1, 1–16. [Google Scholar]
- Kolosz, A.W.; Grant-Muller, A. Appraisal and evaluation of interurban ITS: A European survey. IEEE Trans. Intell. Transp. Syst. 2014, 16, 1070–1087. [Google Scholar] [CrossRef]
- Advanced Public Transportation Systems: Evaluation Guidelines. Available online: https://rosap.ntl.bts.gov/view/dot/5479/dot_5479_DS1.pdf? (accessed on 18 March 2021).
- Guideline for Developing and Maintaining for Sustainable Urban Mobility, Second Edition. Available online: https://www.eltis.org/mobility-plans/sump-online-guidelines (accessed on 16 December 2021).
- Bae, S. An advanced public transportation system application: Feasibility study of bus passenger information systems operational test in the town of Blacksburg. In Proceedings of the 1995 Vehicle Navigation and Information Systems Conference, 6th International VNIS. A Ride into the Future, Seattle, WA, USA, 30 July–2 August 1995; pp. 408–413. [Google Scholar]
- Piao, J.; McDonald, M.; Henry, A.; Vaa, T.; Tviet, Ø. An assessment of user acceptance of intelligent speed adaption systems. In Proceedings of the 8th International IEEE Conference on Intelligent Transportation Systems, Vienna, Austria, 13–16 September 2005. [Google Scholar]
- Rafiyan, E. Acceptability of Intelligent Transportation System (ITS) to Various Group of Drivers. Master’s Thesis, University of Gothenburg, Gothenburg, Sweden, May 2013. [Google Scholar]
- Hassn, H.A.A.; Ismail, A.; Borhan, M.N.; Syamsunur, D. The impact of Intelligent Transport System quality: Drivers’ acceptance perspective. Int. J. Technol. 2016, 4, 553–561. [Google Scholar] [CrossRef]
- Jeong, H.S. A Study on the Effect Analysis System According to the Introduction of Advanced Traffic Management System (ATMS). Master’s Thesis, Kongju National University, Chungcheongnam-do, Korea, 24 February 2021; pp. 64–65. [Google Scholar]
- Yang, L.; Dam, K.H.; Zhang, L. Developing goals and indicators for the design of sustainable and integrated transport infrastructure and urban spaces. Sustainability 2020, 12, 9677. [Google Scholar] [CrossRef]
- Guerrero-Ibáñez, J.; Zeadally, S.; Contreras-Castillo, J. Sensor Technologies for Intelligent Transportation Systems. Sensors 2018, 18, 1212. [Google Scholar] [CrossRef] [PubMed]
- Fedele, R.; Praticò, F.G. Monitoring infrastructure asset through its acoustic signature. In Proceedings of the Internoise 2019, Marid, Spain, 16–19 June 2019. [Google Scholar]
- Dobranskyte-Niskota, A.; Perujo, A.; Jesinghaus, J.; Jensen, P. Indicators to Assess Sustainability of Transport Activities–Part 2: Measurement and Evaluation of Transport Sustainability Performance in the EU27. EUR 23041 EN/2; European Commission: Luxembourg, 2009. [Google Scholar]
- Shiau, T.A.; Liu, J.S. Developing an indicators system for local government to evaluate transport sustainability strategies. Ecol. Indic. 2013, 34, 361–371. [Google Scholar] [CrossRef]
- Niglio, R.; Comitale, P.P. Cities, energy and built environment. TeMA J. Land Use Mobil. Environ. 2015, 8. [Google Scholar] [CrossRef]
- Mitropoulos, K.L.; Prevedouros, P.D. Incorporating sustainability assessment in transportation planning: An urban transportation vehicle-based approach. Transp. Plan. Technol. 2016, 39, 439–463. [Google Scholar] [CrossRef]
- Wengler, M. Mobility as a Service (MaaS) as an Instrument for Transport Policy. Master’s Thesis, Vienna University of Technology, Vienna, Austria, 8 May 2017. [Google Scholar]
- Chen, C.T.; Lin, C.T.; Huang, S.F. A fuzzy approach for supplier evaluation and selection in supply chain management. Int. J. Prod. Econ. 2005, 102, 289–301. [Google Scholar] [CrossRef]
- Lopez-Carreiro, I.; Monzon, A. Evaluating sustainability and innovation of mobility patterns in Spanish cities. Analysis by size and urban typology. Sustain. Cities Soc. 2018, 38, 684–696. [Google Scholar] [CrossRef]
- Environmental Equity Mobility Equity Framework: How to Make Transport Work for People. Available online: https://greenlining.org/wp-content/uploads/2018/03/Mobility-Equity-Framework-Final.pdf (accessed on 3 May 2021).
- Zapolskyte, S.; Burinskiene, M.; Trepanier, M. Evaluation criteria of smart city mobility system using MCDM method. Balt. J. Road Bridge Eng. 2020, 15, 196–224. [Google Scholar] [CrossRef]
- Othaman, M.; Ku-Mahamud, K.R. Fuzzy multi criteria evaluation for performance of bus companies. Comput. Inf. Sci. 2010, 3, 252–262. [Google Scholar] [CrossRef][Green Version]
- Suwardo. Assessment of Bus System Service and Performance for Public Transport Improvement. Ph.D. Thesis, University of Teknologi Petronas, Perak, Malaysia, August 2010. [Google Scholar]
- Ambrosino, G.; Finn, B.; Gini, S.; Mussone, L. A method to assess and plan applications of ITS technology in public transport services with reference to some possible case study. Case Stud. Transp. Policy 2015, 3, 421–430. [Google Scholar] [CrossRef]
- Lee, D.J. A multi-criteria approach for prioritizing advanced public transport modes (APTM) considering urban type in Korea. Transp. Res. Part A Policy Pract. 2018, 111, 148–161. [Google Scholar] [CrossRef]
- Longo, A.; Zappatore, M.; Navathe, S.B. The unified chart of mobility services: Towards a systemic approach to analyze service quality in smart mobility ecosystem. J. Parallel Distrib. Comput. 2019, 127, 118–133. [Google Scholar] [CrossRef]
- Levine, J.; Underwood, S.E. A multiattribute analysis of goals for Intelligent Transportation System planning. Transp. Res. Part C Emerg. Technol. 1996, 4, 97–111. [Google Scholar] [CrossRef]
- Evaluating Intelligent Transportation System Impacts: A Framework for Border Analyses. Available online: https://static.tti.tamu.edu/tti.tamu.edu/documents/TTI-2000-ID15289.pdf (accessed on 28 March 2021).
- Hanaoka, S.; Kunadhamraks, P. Multiple criteria and fuzzy based evaluation of logistics performance for intermodal transportation. J. Adv. Transp. 2008, 43, 123–153. [Google Scholar] [CrossRef]
- Zou, L.; Dai, H.; Yao, E.; Jiang, T.; Gou, H. Research on assessment methods for urban public transport development in China. Comput. Intell. Neurosci. 2014, 2014, 941347. [Google Scholar] [CrossRef] [PubMed]
- Final Report of the Study on Key Performance Indicators for Intelligent Transport System. Available online: https://ec.europa.eu/transport/sites/default/files/themes/its/studies/doc/its-kpi-final_report_v7_4.pdf (accessed on 21 April 2021).
- Verseckiene, A.; Palsaitis, R.; Yatskiv, I. Evaluation of alternatives to integrate special transportation service for people with movement disorders. Transp. Telecommun. 2017, 18, 263–274. [Google Scholar] [CrossRef]
- CITY Keys Indicators for Smart City Projects and Smart Cities. Available online: https://nws.eurocities.eu/MediaShell/media/CITYkeystheindicators.pdf (accessed on 20 April 2021).
- Krmac, E.; Djordjevic, B. An evaluation of train control information systems for sustainable railway using the Analytic Hierarchy Process (AHP) model. Eur. Transp. Res. Rev. 2017, 9, 35. [Google Scholar] [CrossRef]
- Krmac, E.; Djordjevic, B. An evaluation of indicators of railway intelligent transportation system using the Group Analytic Hierarchy Process. Electron. Sci. Technol. Appl. 2017, 4. [Google Scholar] [CrossRef]
- Garau, C.; Pavan, V.M. Evaluating urban quality: Indicators and assessment tools for smart sustainable cities. Sustainability 2017, 10, 575. [Google Scholar] [CrossRef]
- Mlinaric, T.J.; Djordjvevic, B.; Krmac, E. Evaluation framework for key performance indicators of railway ITS. Promet–Traffic Transp. 2018, 30, 491–500. [Google Scholar] [CrossRef]
- Weng, J.; Di, X.; Wang, C.; Wang, J.; Mao, L. A bus service vvaluation method from passenger’s perspective based on satisfaction survey: A case study of Beijing, China. Sustainability 2018, 10, 2723. [Google Scholar] [CrossRef]
- Cyril, A.; Mulangi, R.H.; George, V. Performance optimization of public transport using Integrated AHP-GP methodology. Urban Rail Transit 2019, 5, 133–144. [Google Scholar] [CrossRef]
- Buenk, R.; Grobbelaar, S.S.; Meyer, I. A framework for the sustainability assessment of (micro)transis systems. Sustainability 2019, 11, 5929. [Google Scholar] [CrossRef]
- Chao, A.L.; Gallego, A.C.; Lopez-Chao, V. Indicators framework for sustainable urban design. Atmosphere 2020, 11, 1143. [Google Scholar] [CrossRef]
- Chan, W.C.; Ibrahim, W.H.W.; Lo, M.C.; Suaidi, M.K.; Ha, S.T. Sustainability of public transportation: An examination of user behavior to real-time GPS tracking application. Sustainability 2020, 12, 9541. [Google Scholar] [CrossRef]
- Brucker, K.; Verbeke, A.; Macharis, C. The applicability of multicriteria-analysis to the evaluation of Intelligent Transport System (ITS). Res. Transp. Econ. 2004, 8, 151–179. [Google Scholar] [CrossRef]
- Ishizaka, A.; Nemery, P. Multi-Criteria Decision Analysis: Method and Software; Jonh Wiley & Sons, Ltd.: Hoboken, NJ, USA, 2013; pp. 5–7. [Google Scholar]
- Saaty, T.L. Fundamentals of Decision Making and Priority Theory with the Analytic Hierarchy Process; RWS Publications: Pittsburgh, PA, USA, 2001; pp. 5–9, 95. [Google Scholar]
- Chang, D.Y. Applications of the extent analysis method on fuzzy AHP. Eur. J. Oper. Res. 1996, 95, 649–655. [Google Scholar] [CrossRef]
- Lee, S.L.; Chen, P.C.; Chan, W.C.; Hung, S.W. A three-stage decision-making model for selecting electric vehicle battery technology. Transp. Plan. Technol. 2015, 38, 761–776. [Google Scholar] [CrossRef]
- Oguztimur, S. Why Fuzzy Analytic Hierarchy Process approach for transport problem? In Proceedings of the 51st Congress of the European Regional Science Association: “New Challenges for European Regions and Urban Areas in a Globalised World”, Barcelona, Spain, 30 August–3 September 2011. [Google Scholar]
- Nalmpantis, D.; Roukouni, A.; Genitsaris, E.; Stamelou, A.; Naniopoulos, A. Evaluation of innovative ideas for public open access transport proposed by citizens using Multi-criteria decision analysis (MCDA). Eur. Transp. Res. Rev. 2019, 11, 22. [Google Scholar] [CrossRef]
- Salavati, A.; Haghshenas, H.; Ghadirifaraz, B.; Jamshid Laghaei, J.; Eftekhari, G. Applying AHP and clustering approaches for public transportation decision making: A Case Study of Isfahan City. J. Public Transp. 2016, 19, 38–55. [Google Scholar] [CrossRef]
- Janackovic, G.L.; Savic, S.M.; Stankovic, M.S. Selection and ranking of occupational Safety indicators based on Fuzzy AHP: A case study in road construction companies. South Afr. J. Ind. Eng. 2013, 24, 175–189. [Google Scholar] [CrossRef]
- Wibowo, S.; Grandhi, S. A multicriteria analysis approach for benchmarking smart transport cities. In Proceedings of the Science and Information Conference 2015, London, UK, 28 July 2015. [Google Scholar]
- Milosevic, D.; Stanojevic, A.; Milosevic, M. AHP method in the function of logistic in development of smart cities model. In Proceedings of the 6th International Conference: Transport and Logistic, Niš, Serbia, 25–26 May 2017; pp. 287–294. [Google Scholar]
- Ananda, A.; Rufuss, D.D.W.; Rajkumara, V.; Suganthi, L. Evaluation of sustainability indicators in smart cities for India Using MCDM approach. Energy Procedia 2017, 141, 211–215. [Google Scholar] [CrossRef]
- Firouzabadi, S.M.A.K.; Henson, B.; Barnes, C. A multiple stakeholders’ approach to strategic selection decisions. Comput. Ind. Eng. 2008, 54, 851–865. [Google Scholar] [CrossRef]
- Li, X.; Fan, Y.; Shaw, J.W.; Qi, Y. A Fuzzy AHP approach to compare transit system performance in US urbanized areas. J. Public Transp. 2017, 20, 66–89. [Google Scholar] [CrossRef]
- Wang, X.; Ma, X.; Fan, J.; Ye, Q. Design of intelligent logistics drivers evaluation system-based on entropy-AHP method. In Proceedings of the 16th International Conference on Service Systems and Service Management (ICSSSM), Shenzhen, China, 13–15 July 2019; pp. 1–6. [Google Scholar]
- Hamurcu, M.; Eren, T. Strategic planning based on sustainability for urban transportation: An application to decision-making. Sustainability 2020, 12, 3589. [Google Scholar] [CrossRef]
- Kwong, C.K.; Bai, H. Determining the importance weights for the customer requirements in QFD using a fuzzy AHP with an extent analysis approach. IIE Trans. 2003, 35, 619–626. [Google Scholar] [CrossRef]
- Buckley, J.J. Fuzzy hierarchical analysis. Fuzzy Sets Syst. 1985, 17, 233–247. [Google Scholar] [CrossRef]


| Purpose | Strategy | Goals | Indicators | Target | |||
|---|---|---|---|---|---|---|---|
| 3 Years | 5 Years | 10 Years | |||||
| ITS for Green Mobility | Automatic Traffic Management | Assistive Public Transport | Promotion of Public Transport | The proportion of public transport users | 42% | 45% | 53% |
| Interactive Demand Management | Mobility Improvement | Average speed on city streets network during rush hour | 28% | 28% | 28% | ||
| ITS Assistive Solution | Intensive Transport Safety | Safety Increase | Number of road accident (per 100,000 times) | 0.28 | 0.24 | 0.13 | |
| ITS Integrated Center | Integrative Mobility Center | Establishment of an Information Integration Center | ITS integrated center authorities were set up in BMR | - | Set up | Set up | |
| Percentage of units that link data to the center | - | 60% | 100% | ||||
| Percentage of signal junction controlled and commanded by the center | - | - | 100% | ||||
| Percentage of traffic enforcement camera connected to the center | - | - | 100% | ||||
| Authors | Indicator Categories | Ref. |
|---|---|---|
| USDOT (1994) | APTS indicators and objectives | [16] |
| Levine and Underwood (1996) | Outcomes of ITS development and goals | [40] |
| Lomax, Vadali and Eisele (2000) | Performance measurement and ITS goal and objectives within matrices of economic, quality of life and environmental quality | [41] |
| Yeh, Deng and Chang (2000) | To investigate bus company performance | [12] |
| Hanaoko and Kunadhamraks (2008) | To evaluate logistic performance | [42] |
| Dobranskyte-Niskota et al. (2009) | To assess sustainability of transport activities | [26] |
| Othaman and Ku-Mahamud (2010) | To investigate the bus company performance | [35] |
| Suwardo (2010) | To figure out the performance of bus service system for public transport improvement | [36] |
| Shiau and Liu (2013) | To find the goal of measuring transport sustainability at the country or city level | [27] |
| Shaheen and Finson (2013) | Predicted Impacts for each ITS functions to elaborate the impact on energy reduction | [1] |
| Zou et al. (2014) | To evaluate urban public transportation in Kunming, China | [43] |
| Ambrosino et al. (2015) | To assess ITS applications in public transport services | [37] |
| AECOM (2015) | ITS KPIs in terms of deployment and benefit related | [44] |
| Niglio and Comitale (2015) | Indicators of Sustainable Mobility Program | [28] |
| Mitropoulos and Prevedouros (2016) | Indices of urban transportation vehicle-based assessment on sustainable theme | [39] |
| Verseckiene, Palsaitis and Yatskiv (2017) | Indicators of sustainable theme to choose transportation service | [45] |
| Bosch et al. (2017) | Indicators related to mobility for accessibility in smart city | [46] |
| Wengler (2017) | Indicators of Mobility as a Service | [30] |
| Krmac and Djordjevic (2017a) | Proposed indicators for train control information systems for sustainable railway evaluation | [47] |
| Krmac and Djordjevic (2017b) | Proposed indicators for railway ITS evaluation | [48] |
| Garau and Pavan (2017) | Indicators of accessibility under Smart Sustainable Cities | [49] |
| Chen and Deng (2018) | Evaluation Criteria for sustainable transport solution assessment framework | [10] |
| Lopez-Carreiro and Monzon (2018) | Smartness indicators for Sustainability Transportation and Innovation Transportation | [32] |
| Creger, Espino and Sanchez (2018) | Recommended equity indicators in mobility framework | [33] |
| Lee (2018) | Sub-criteria to represent value of APTS, provider, and users to prioritize APTS consideration for urban type | [38] |
| Mlinaric, Djordjvevic and Krmac (2018) | Indicators to formulate evaluation framework for railway ITS | [50] |
| Weng et al. (2108) | Subindexes of Satisfaction Evaluation Index from passenger perspective to bus service | [51] |
| Longo, Zappatore and Navathe (2019) | Indicators for delivered and for perceived to examine Quality of Service of local public transport | [39] |
| Cyril, Mulangi and George (2019) | Performance optimization of public transport consideration by decision Variable of user-oriented and operator oriented | [52] |
| Buenk, Geobbelaar and Meyer (2019) | Indicators to formulate framework for the sustainable assessment of (Micro)transit systems | [53] |
| Zapolskyte, Burinskiene and Trepanier (2020) | Indicators of measurement of smartness level of urban mobility | [34] |
| Antolin et al. (2020) | Sustainable index and smartness index to develop evaluation framework for smartness and sustainability in cities | [7] |
| Chao. Gallego and Lopez-Chao (2020) | Indicators related to mobility and transportation in category under environmental aspects, Mobility and Transport for sustainable urban design | [54] |
| Chan et al. (2020) | Questions to examine the response for 6 dimensions of Sustainability of Public Transportation | [55] |
| Yang, Dam and Zhang (2020) | Indicators of sustainable and integrated transport infrastructure and urban spaces design | [23] |
| Criteria Category | Conditions |
|---|---|
| Inclusion Criteria |
|
| Exclusion Criteria |
|
| Criteria Category | Conditions |
|---|---|
| Inclusion Criteria |
|
| Exclusion Criteria |
|
| Linguistic Scale of Importance | AHP Crisp Scale * | Fuzzy Scale | Fuzzy Triangle Member | Defuzzied Triangle Member |
|---|---|---|---|---|
| EI.: Equal Importance | 1.333 | (1, 1, 3) | (1/3,1,1) | |
| SI.: Slightly Importance | 3 | (1, 3, 5) | (1/5,1/3,1) | |
| MI.: More Importance | 5 | (3, 5, 7) | (1/7,1/5,1/3) | |
| VI.: Very Importance | 7 | (5, 7, 9) | (1/7,1/9,1/5) | |
| AI.: Absolutely Importance | 8.667 | (7, 9, 9) | (1/9,1/9,1/7) |
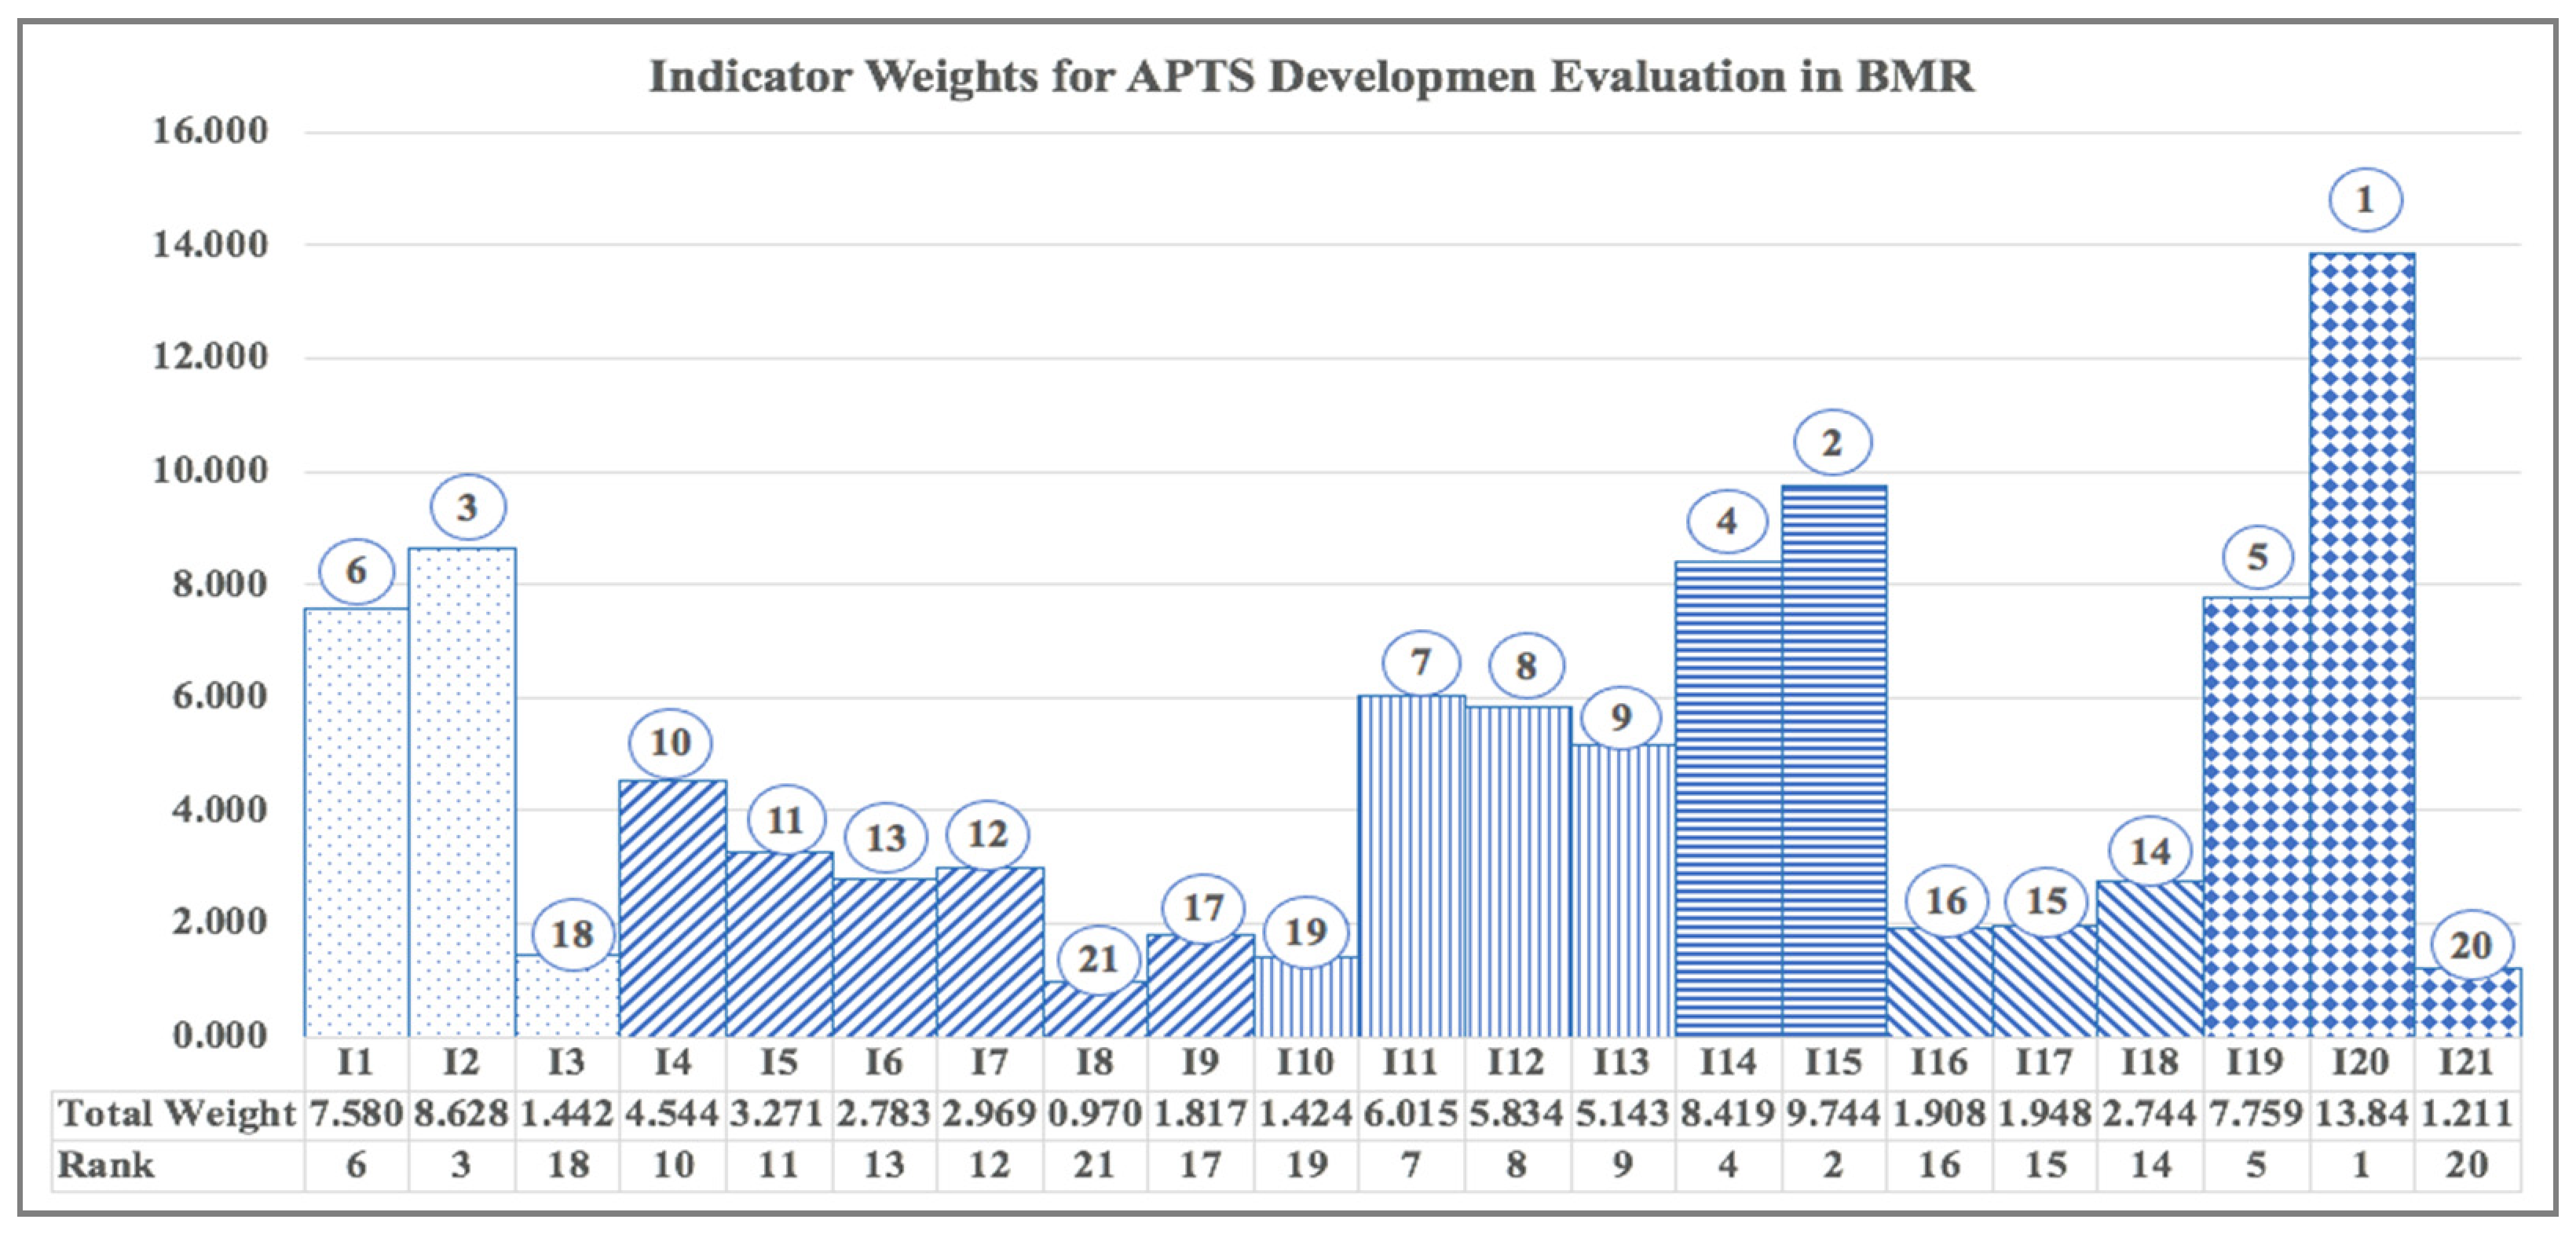
| Dimension | Indicators | Total Weight | Percentage | Rank | ||
|---|---|---|---|---|---|---|
| D1: Mobility | 0.177 | I1: Journey time by public transport where APTS was implemented | 0.429 | 0.0758 | 7.580% | 6 |
| I2: Waiting time for the public transportation | 0.489 | 0.0863 | 8.628% | 3 | ||
| I3: Common ticket and e-payment ticket increase | 0.082 | 0.0144 | 1.442% | 18 | ||
| D2: Efficiency | 0.164 | I4: Travel mode share on public transportation | 0.278 | 0.0454 | 4.544% | 10 |
| I5: Availability of on-board devices | 0.200 | 0.0327 | 3.271% | 11 | ||
| I6: Availability of info devices at stations and bus stops | 0.170 | 0.0278 | 2.783% | 13 | ||
| I7: Mobility services registration and subscription increase | 0.182 | 0.0297 | 2.969% | 12 | ||
| I8: Perception of drivers on information provision | 0.059 | 0.0097 | 0.970% | 21 | ||
| I9: Perception of passengers on APTS service | 0.111 | 0.0182 | 1.817% | 17 | ||
| D3: Reliability | 0.184 | I10: Tendency of suggestion complain and improvement | 0.327 | 0.0602 | 6.015% | 19 |
| I11: Percentage of Information accuracy | 0.317 | 0.0583 | 5.834% | 7 | ||
| I12: Accuracy of bus location | 0.279 | 0.0514 | 5.143% | 8 | ||
| I13: Availability of system failure recovery | 0.464 | 0.0842 | 8.419% | 9 | ||
| D4: Accessibility | 0.182 | I14: Smart public transport stop density | 0.536 | 0.0974 | 9.744% | 4 |
| I15: Smart public transport network density | 0.289 | 0.0191 | 1.908% | 2 | ||
| D5: Environment | 0.066 | I16: Energy consumption on public vehicles | 0.295 | 0.0195 | 1.948% | 16 |
| I17: Green House Gas (GHG) emission from public transportation | 0.416 | 0.0274 | 2.744% | 15 | ||
| I18: Reduction of high pollution vehicles | 0.340 | 0.0776 | 7.759% | 14 | ||
| D6: Safety | 0.228 | I19: Emergency response time | 0.607 | 0.1385 | 13.845% | 5 |
| I20: Traffic Accident reduction related to public transportation | 0.053 | 0.0121 | 1.211% | 1 | ||
| I21: Perception of passengers on safety and security | 0.429 | 0.0758 | 7.580% | 20 |
| Categories | No. of Response |
|---|---|
| Question 1: What is the most important for APTS development in Thailand? | |
| - Law and related regulation | 9 |
| - Policy and action plan | 7 |
| - Technology and adaptation | 5 |
| - Integrated and intermediated organization and cooperation among stakeholders | 4 |
| - Quality of reliability and efficiency of system and service | |
| Question 2: What is the most challenge of APTS development in Thailand? | |
| - Reliability and efficiency of system and services | 9 |
| - Integration among systems and services | |
| - Definite and consecutive policy | 6 |
| - Technology and adaptation | 5 |
| - Law and restriction | 4 |
| - Capacity building and knowledge | |
| Question 3: How can the responsible agencies improve for planning process of APTS in Thailand? | |
| - Integrated and cooperative planning procedure | 9 |
| - Law and restriction adjustment | 3 |
| - System standard and architect formulating | |
| - Definite goals, objectives and action plans | |
| - Evaluation or assessment framework formulating | |
| Question 4: what is the most challenge of system evaluation in Thailand | |
| - Evaluation platform formulating | 7 |
| - Integration and cooperation among stakeholders | 4 |
| - Information presentation of evaluation report | |
| - Outcome and impact of project assessment | |
| - Consonant communication of goals and objectives among stakeholders | 3 |
| Question 5: how can the responsible agencies improve the evaluation process? | |
| - Effective evaluation system including reliable information of measurement | 7 |
| - Evaluation platform and procedure formulation | 6 |
| - Specific organization for evaluation with advocated regulation | 5 |
| - Integration system including open data and data integration with both public and private | |
Publisher’s Note: MDPI stays neutral with regard to jurisdictional claims in published maps and institutional affiliations. |
© 2021 by the authors. Licensee MDPI, Basel, Switzerland. This article is an open access article distributed under the terms and conditions of the Creative Commons Attribution (CC BY) license (https://creativecommons.org/licenses/by/4.0/).
Share and Cite
Choosakun, A.; Yeom, C. Developing Evaluation Framework for Intelligent Transport System on Public Transportation in Bangkok Metropolitan Regions Using Fuzzy AHP. Infrastructures 2021, 6, 182. https://doi.org/10.3390/infrastructures6120182
Choosakun A, Yeom C. Developing Evaluation Framework for Intelligent Transport System on Public Transportation in Bangkok Metropolitan Regions Using Fuzzy AHP. Infrastructures. 2021; 6(12):182. https://doi.org/10.3390/infrastructures6120182
Chicago/Turabian StyleChoosakun, Aoonrot, and Chunho Yeom. 2021. "Developing Evaluation Framework for Intelligent Transport System on Public Transportation in Bangkok Metropolitan Regions Using Fuzzy AHP" Infrastructures 6, no. 12: 182. https://doi.org/10.3390/infrastructures6120182
APA StyleChoosakun, A., & Yeom, C. (2021). Developing Evaluation Framework for Intelligent Transport System on Public Transportation in Bangkok Metropolitan Regions Using Fuzzy AHP. Infrastructures, 6(12), 182. https://doi.org/10.3390/infrastructures6120182