Article

Gene-Expression Programming-Based Model for Estimating the Compressive Strength of Cement-Fly Ash Stabilized Soil and Parametric Study

1
School of Engineering and Built Environment, Griffith University, Gold Coast, QLD 4222, Australia
2
Faculty of Road and Bridge Engineering, The University of Danang—University of Science and Technology, Danang 550000, Vietnam
*
Author to whom correspondence should be addressed.
Infrastructures 2021, 6(12), 181; https://doi.org/10.3390/infrastructures6120181
Submission received: 30 October 2021 / Revised: 13 December 2021 / Accepted: 17 December 2021 / Published: 20 December 2021
(This article belongs to the Section Infrastructures Materials and Constructions)

Abstract

:
The study aims to develop a reliable model using gene-expression programming (GEP) technique for estimating the unconfined compressive strength (UCS) of soil stabilization by cement and fly ash. The model considered the effects of several parameters, including the fly ash characteristics such as calcium oxide (CaO) content, CaO/SiO2 ratio, and loss of ignition. The research results show that the proposed model demonstrates superior performance with a high correlation coefficient (R > 0.955) and low errors. Therefore, the model could be confidently applied in practice for a variety of fly ash qualities. Besides, the parametric study was conducted to examine the effect of fly ash characteristics on the strength of soil stabilization. The study indicates that if the fly ash contains a high amount of calcium oxide, the strength of fly ash stabilized soil is significant. In addition, fly ash could be used in combination with cement to increase the strength of the mixture. A fly ash replacement ratio is suggested from 0.19 to 0.35, corresponding to the total binder used from 10% to 30%. The research findings could help engineers in optimizing the fly ash proportion and estimating the UCS of soil stabilization by cement and fly ash.

1. Introduction

In 2020, the world consumed approximately 7182 million tonnes of coal per year [1]. Australia is one of ten countries consuming a high amount of coal. Currently, energy coming from coal shares 27.82% of energy in Australia [2]. Hence, a large amount of coal waste needs to solve. In the past, most fly ashes (the main waste of coal ash) were released into the atmosphere leading to air pollution. Recently, fly ash (FA) has been reused to reduce disposal volumes and costs and replace non-renewable or expensive resources. Most fly ash utilization has been used as a replacement material in construction [3,4].
In terms of grain size distribution, fly ash is classified as sandy silt to silty sand [5]. The main chemical components of fly ash are silicon dioxide (SiO2), aluminum oxide (Al2O3), and calcium oxide (CaO) [5]. Generally, fly ashes are classified into Class C and Class F (ASTM C618). Besides, there are some off-specification fly ashes in the industry as they do not meet the requirements of the classification. The cementitious components in fly ash could react with water, hydration products, and other construction materials to enhance the strength and stiffness of the mixture. Hence, fly ash has been used as a chemical binder in soil stabilization or as a geopolymer material [6,7].
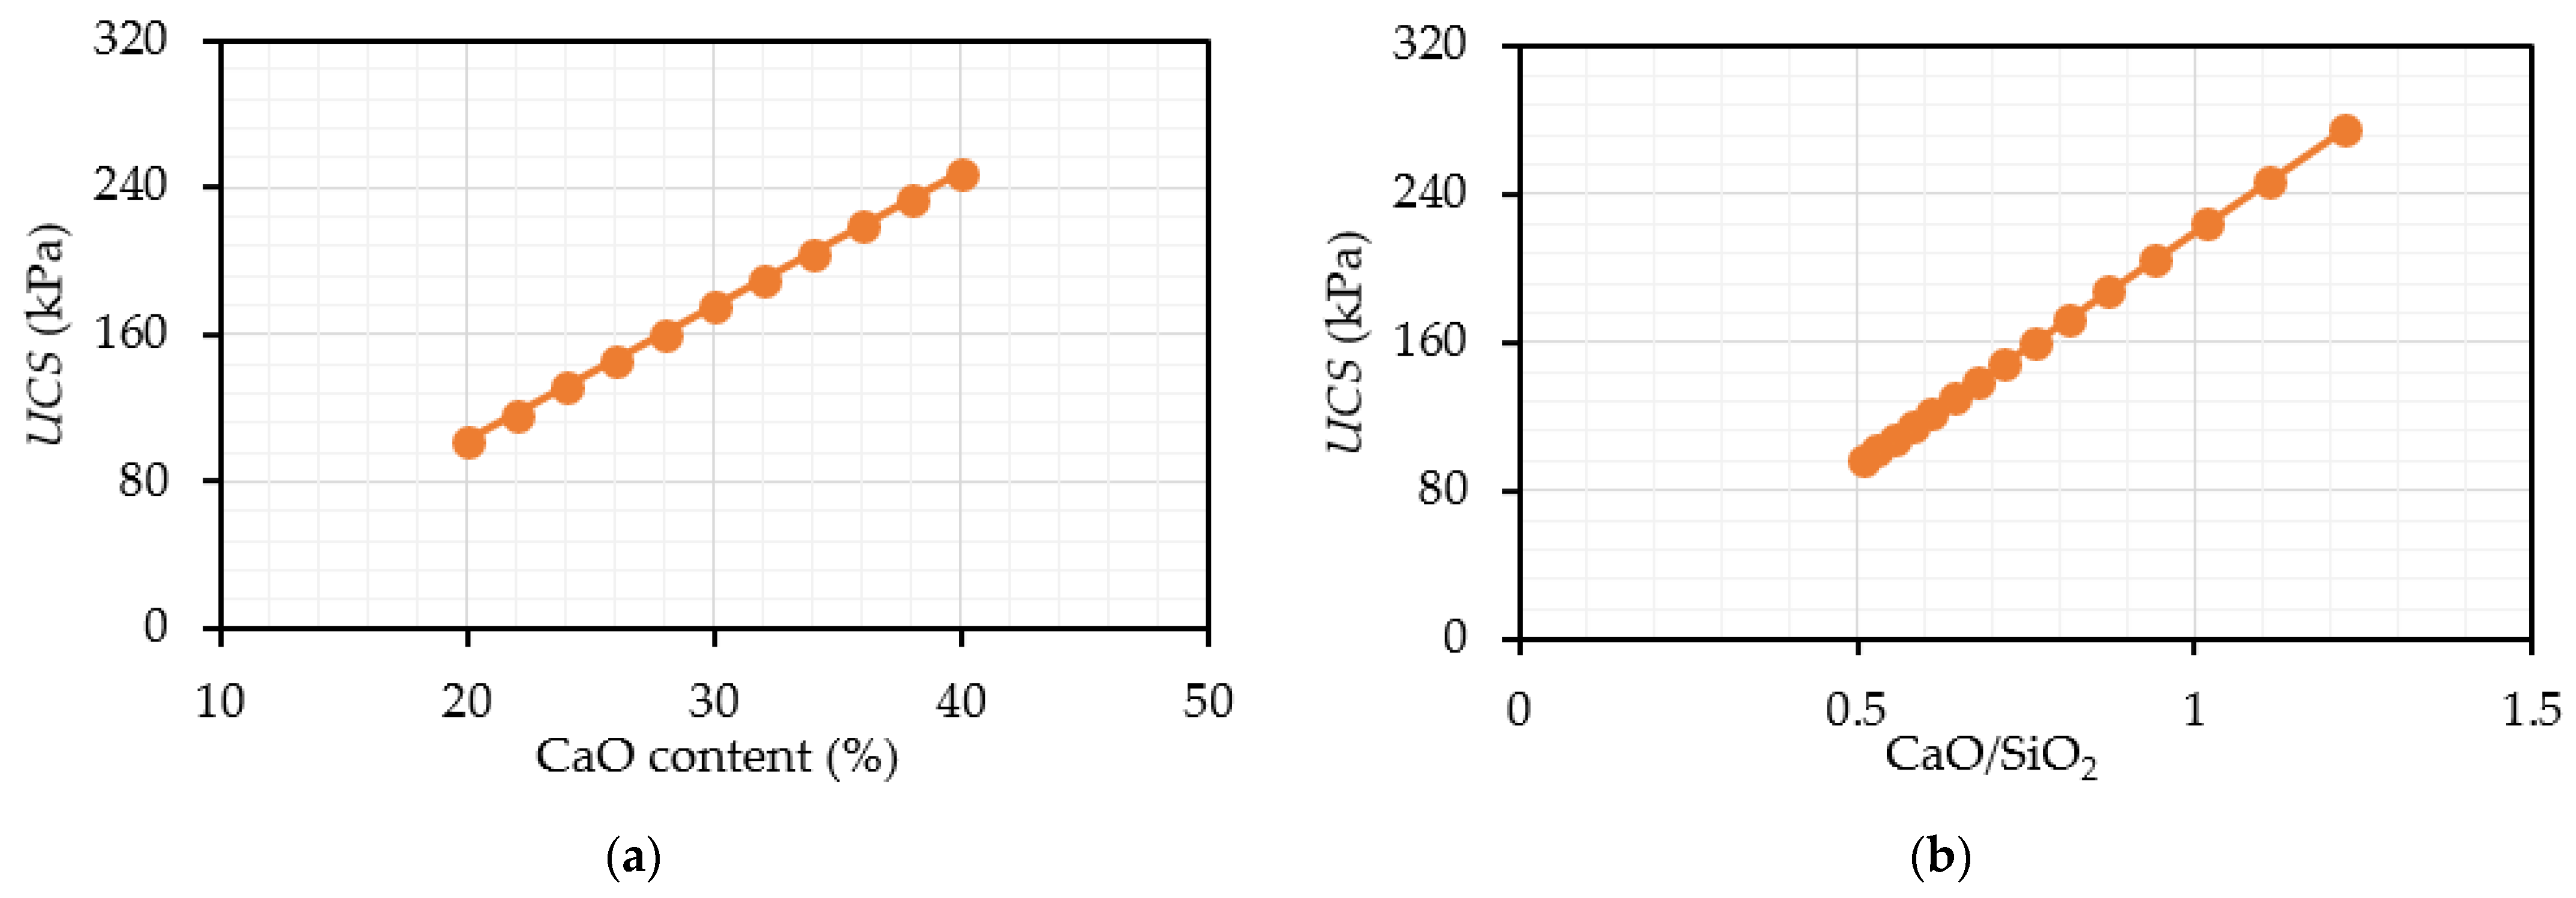
Calcium oxide content and CaO/SiO2 ratio are the two important parameters representing the characteristic of fly ash [8]. Furthermore, the loss of ignition (LoI), which indicates the portion of unburned carbon and metallic oxides in fly ash, should be considered in concrete applications [9].
There have been several studies on the properties of soil stabilization by fly ash. Kolias et al. [10] used high calcium fly ash and cement to stabilize soils for pavement application. Jongpradist et al. [11] conducted a study on cement-fly ash admixed Bangkok clay at high water content. Fly ash Class F was used with and without cement to examine the effect of binder content and water content on the UCS of stabilized soil. Moreover, a proposed empirical prediction model based on modified Abram’s law was also provided. Tastan et al. [8] illustrated the potential application of fly ashes on organic soil stabilization. The effects of fly ash characteristics (CaO content and CaO/SiO2 ratio), soil characteristics, fly ash content, and water content were also evaluated. Wang et al. [12] studied the effect of cement, lime, and fly ash on the strength of dredged sediments, where they provide a linear function between deformation modulus and compressive strength. Besides, the performance of stabilized soil by fly ash was compared with other binders, such as cement, lime, and slag, in the studies of Kwan et al. [13], Horpibulsuk et al. [14], and Abbey et al. [15].
Generally, the strength of soil stabilization by fly ash depends on the properties of soil, the water content, the fly ash content, the added binder (cement or lime), the mixing method, and the curing conditions [16]. When fly ash is used with cement, the fly ash to cement ratio is an important parameter that normalizes the strength of stabilization material and the construction cost. In addition, the quality of fly ash in different regions is varied. Thus, it requires a huge amount of laboratory tests for each case of fly ash application. Previously, some empirical prediction models were suggested for estimating the UCS of soil stabilization by fly ash [11,12]. However, these models were developed based on a small amount of data and considered a limited number of variables, so they could not be applied for other fly ash types. Consequently, developing a reliable model considering the effects of several significant factors, including fly ash characteristics, is urgent.
Gene-Expression Programming (GEP) is a kind of machine learning technique that develops a solution to a problem by a computer program [17]. Recently, the GEP technique has been applied to solve geotechnical engineering problems with high accuracy [18,19]. Many studies demonstrated that the GEP model is more efficient than traditional GP [20,21]. The GEP model is a robust, powerful, and accurate prediction tool. Moreover, the proposed equations formulated from the GEP model are transparent and straightforward to use in practice [20]. As a result, the GEP technique was applied to develop a UCS prediction model and conduct a parametric study in this research.
The study examines the strength of the soil stabilization by cement and fly ash. Ordinary Portland cement (CEM I 42.5N) and fly ash with different characteristics are the main chemical binders. Both wet and dry mixing methods are considered. The research results apply for the UCS of stabilization material in the laboratory condition only. The parametric study is conducted to examine the effect of fly ash characteristics on the UCS of stabilized soil and find a reasonable fly ash replacement ratio. Within the scope of this study, the effect of the chemical composition of the soil, such as the content of CaO and SO42−, and pH of the soil, are excluded. The sample preparation processes, such as the size and shape of the sample, the compaction and curing method, and the UCS testing standard, are assumed to be similar.

2. Data Preparation

The data from reliable published journal articles were collected. Approximately 489 UCS results of soil stabilization by fly ash and cement were selected for generating a GEP model. Table 1 shows the references of selected data. Stabilized soil specimens were prepared following standard ASTM D1632 [22,23,24].
The number of variables was chosen based on prior knowledge and several trials. As a result, thirteen independent variables were considered in the model, including:
Group 1 represents the properties of soil: the plastic limit (PL), the liquid limit (LL), the percentage of clay (Clay), the percentage of silt (Silt), the percentage of sand (Sand), and the percentage of organic materials (Organic); (Note: some studies demonstrate that organic could affect to the strength of fly ash stabilized soil [8]; hence, it was chosen in the model).
Group 2 represents mixing and curing conditions: the total water content (Total water), and the curing period (Age) (The total water content includes the natural water content in the soil and the water used to mix with binders);
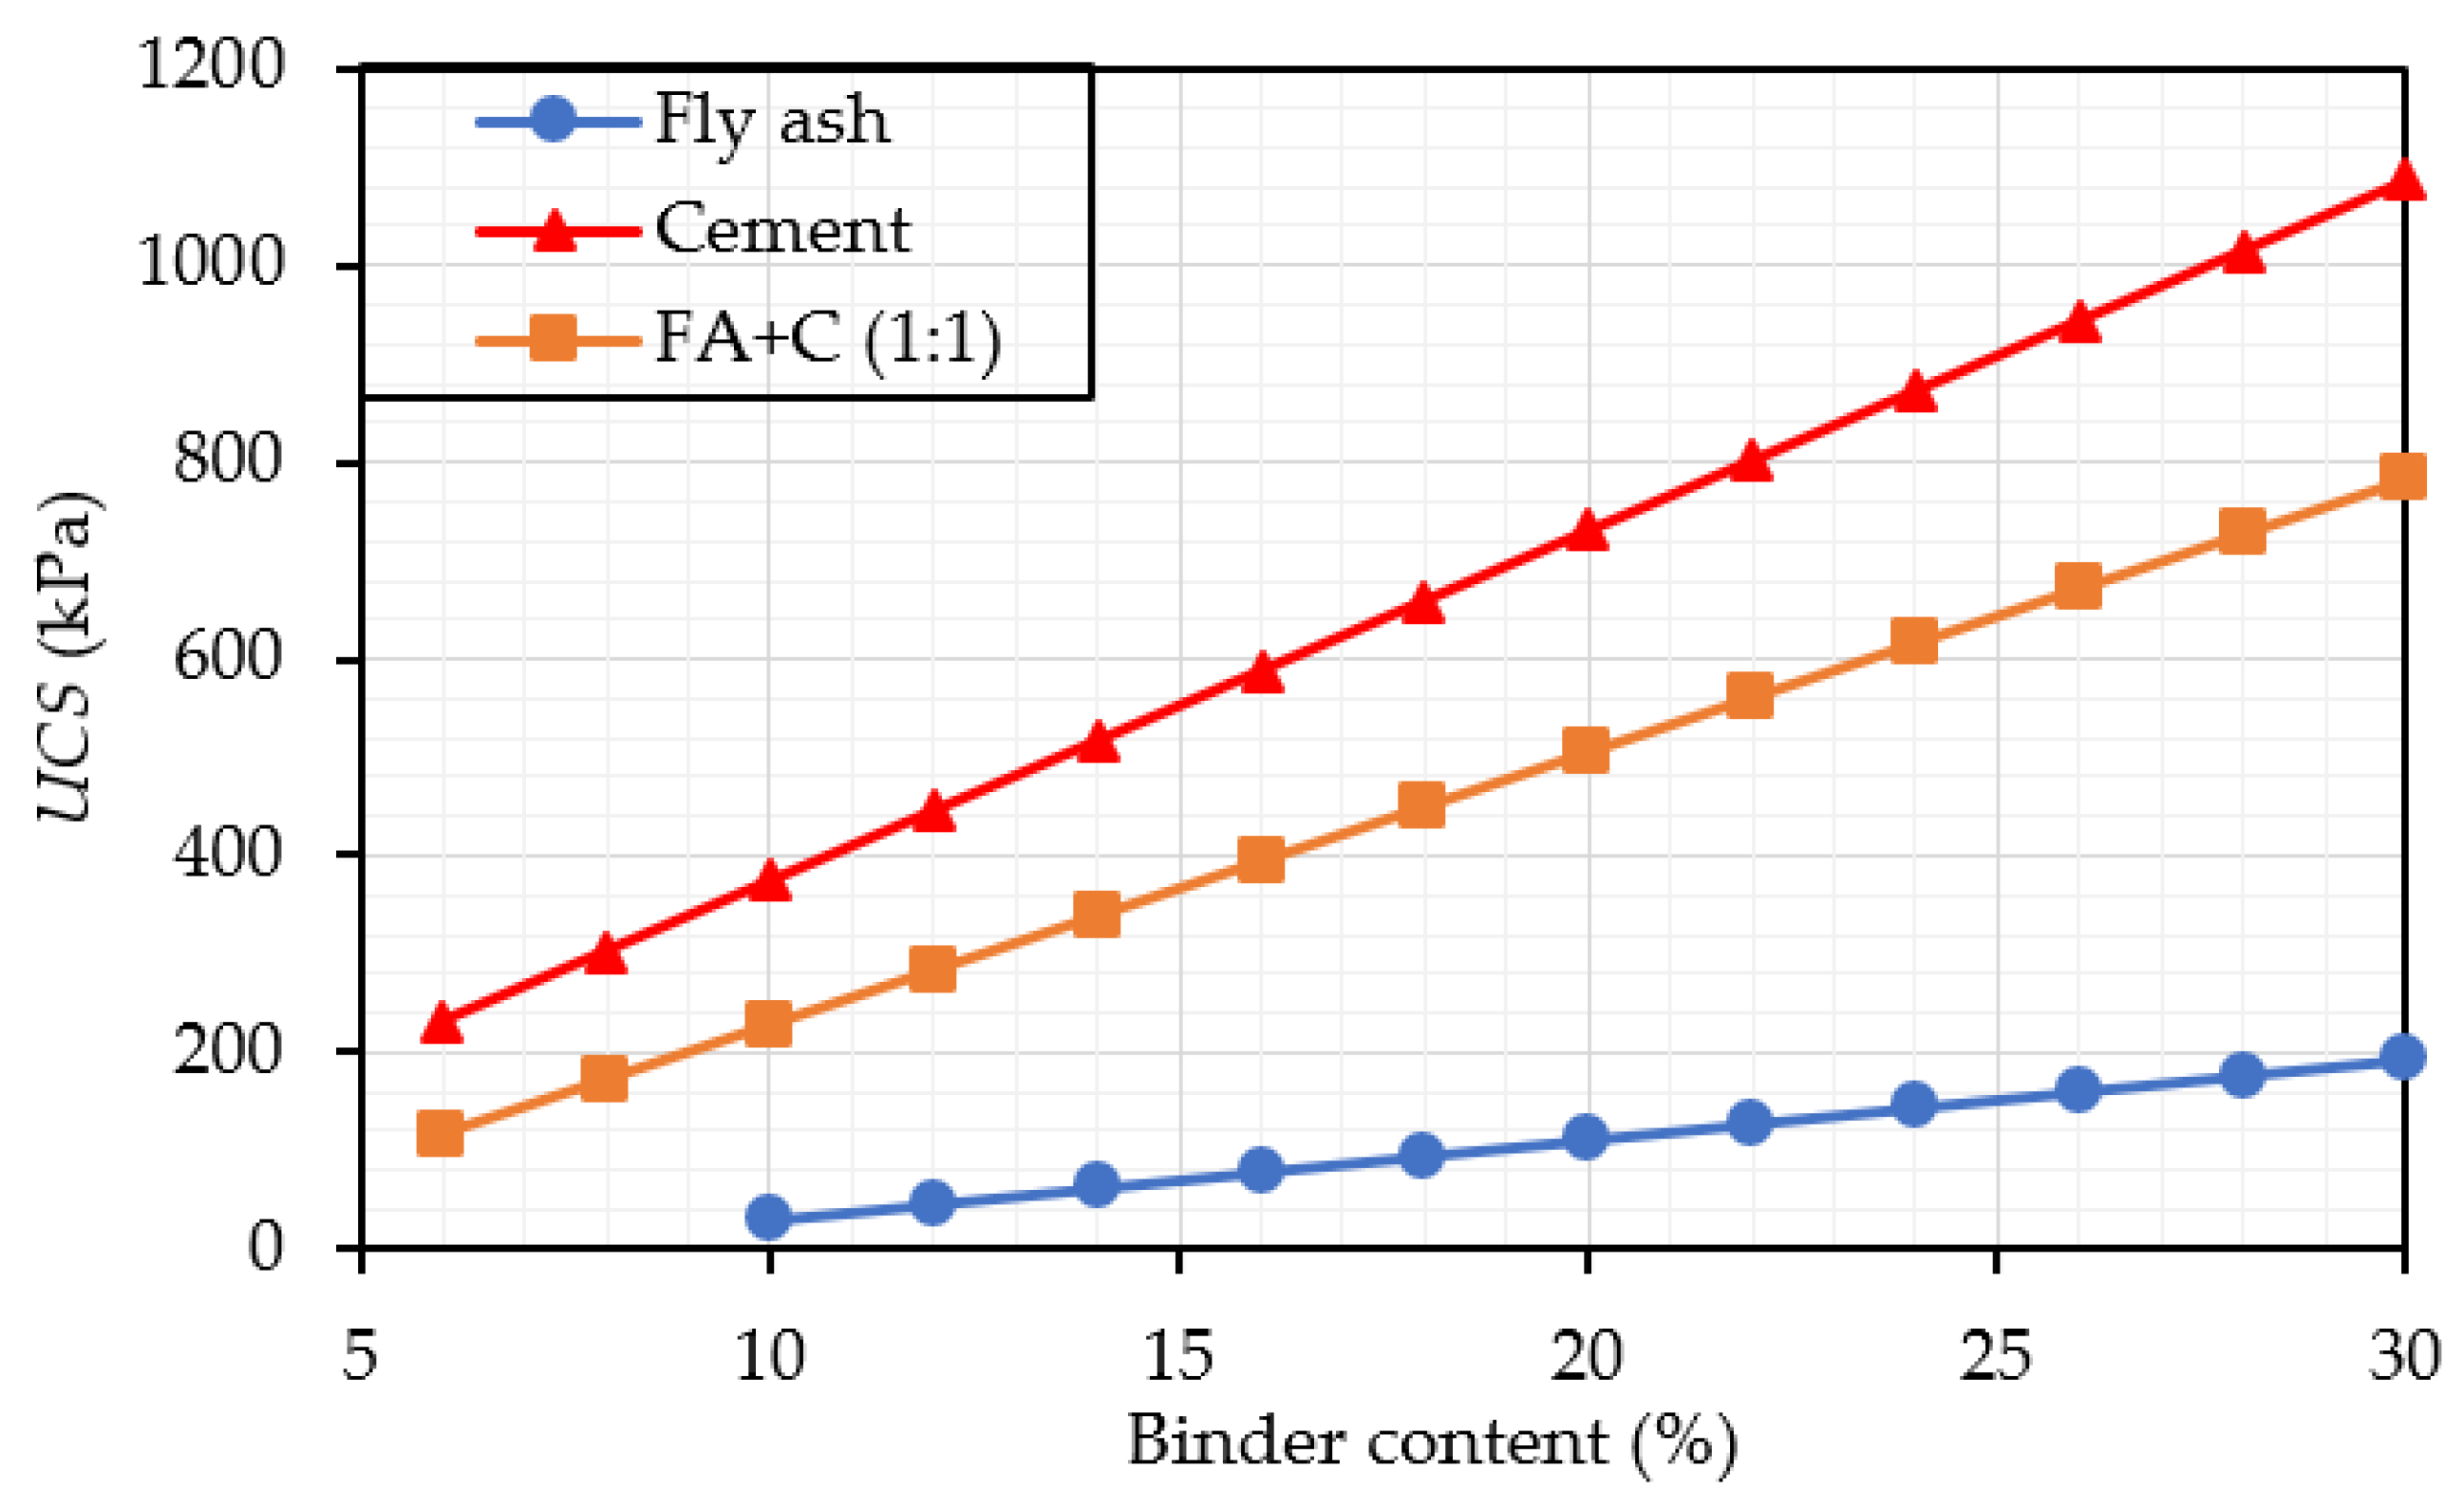
Group 3 represents the binder types and binder contents: the cement content (C) and the fly ash content (FA);
Group 4 represents the characteristics of fly ash: the calcium oxide content in fly ash (CaO), the CaO/SiO2 ratio in fly ash (CaO/SiO2), and the loss of ignition of fly ash (LoI).
Table 2 shows the statistical analysis, including the maximum, minimum, range, mean, and standard deviation (SD) of input and output data. The maximum value of the total water content is 265%, while the longest curing period is 270 days. The percentages of cement and fly ash used are up to 36.8% and 30%, respectively. The highest UCS value is approximately 4500 kPa. Several types of fly ashes are considered with the highest CaO content of approximately 49%. It could be seen that the database represents a wide range of parameters and considers the most influential factors that affect the UCS of stabilized soil.

3. GEP-Based Model

3.1. Gene-Expression Programming

Gene-Expression Programming (GEP) is a branch of Genetic Programming (GP) [25]. GEP solution is expressed by expression trees (ETs). Each sub-ET includes several chromosomes, which are represented as tree-like structures. A linking function (such as addition, subtraction, multiplication, or division) is used to connect sub-ETs [26]. The fitness function (e.g., root mean square error) is used to evaluate each output [27].
The main elements of GEP are chromosomes, genes, and expression trees (ETs). The GEP model is expressed by ET, which includes some sub-ETs (genes). Each gene contains several chromosomes, while each chromosome could be an input variable, constant value, or function [28]. Each GEP gene is composed of a head and a tail. The head of the gene contains mathematical functions and terminal symbols, while the tail contains terminal symbols such as constant values or variables [29]. Constant values are used to adjust the equations in the model.
The main operators of GEP are selection, mutation, transposition, and crossover. These operators are similar to GP; they allow the program to produce the next generation with better fitness scores [27]. The explanation and detail of GEP structure, as well as its operators, could be accessible through the studies of Soleimani et al. [30], Gandomi et al. [31], and Shahmansouri et al. [20].
In this study, the data were randomly divided into training, testing, and verifying subsets by K-Fold Cross Validation (K = 20). Approximately 343 (70%) and 73 (15%) points of data were used for developing a model (training and testing subsets). The remaining 73 (15%) points of data were used for independent verifying purposes.
GeneXpro Tools 5.0 [32] was applied to simulate the GEP model for predicting the UCS of fly ash and cement stabilized soil. The model setting parameters were selected based on the literature and trial runs. Finally, the model was developed with seven sub-ETs and a maximum of 200 chromosomes for each gene. The addition function was used to link sub-ETs. The maximum head length of each gene was 10. The root mean square error (RMSE) was used as the fitness function to evaluate the solutions. Fourteen different mathematical operators, including addition (+), subtraction (−), multiplication (*), division (/), square root (√), natural logarithm (ln), power (x2), inverse (1/x), exponential (exp), addition with three inputs (x1 + x2 + x3), subtraction with three inputs (x1 − x2 − x3), multiplication with three inputs (x1 * x2 * x3), and cube root (3√), were used for GEP modeling. The maximum number of generations was 30,000. In the model, d0, d1, d2, d3, d4, d5, d6, d7, d8, d9, d10, d11, and d12 represent the plastic limit, the liquid limit, the percentage of clay, the percentage of silt, the percentage of sand, the percentage of organic in the soil, the total water content, the curing period, the cement content, the fly ash content, the CaO content in fly ash, the CaO/SiO2 ratio in fly ash, the loss of ignition of fly ash, respectively. Table 3 summarizes the parameter setting in the model.

3.2. Proposed UCS Prediction Model

Figure 1 shows the tree expression of the selected optimal GEP model with seven sub-ETs. The mathematical formula obtained from the proposed GEP model is presented as Equation (1). This formula is transparent and ready to use in practice.
U C S = ( d 0 . d 4 ) 1 / 2 . ( d 7 d 8 c 18 ) 1 / 3 + d 2 . d 11 . [ d 7 . ( d 9 2 c 23 c 28 ) d 3 . c 26 ] 1 / 2 + d 7 . d 12 . ( d 4 1 d 4 ) + d 8 . [ d 2 + c 56 1 / 2 . ( d 7 + d 9 d 8 d 11 ) d 1 d 8 ] d 6 d 4 2 c 70 + d 0 . d 8 . d 5 + 5 d 1 + d 3 d 5 6 d 6 2 d 7 + 3 d 8 + 4 d 9 + d 10 + d 11 6 d 12 + c 74
where: c18 = −17.103; c23 = −6.696; c28 = −3.451; c26 = 6.617; c56 = 477.882; c74 = 8.646; c70 = −11.715; d0: PL (%); d1: LL (%); d2: Clay (%); d3: Silt (%); d4: Sand (%); d5: Organic (%); d6: Total water (%); d7: Age (days); d8: Cement (%); d9: FA (%); d10: CaO (%); d11: CaO/SiO2; d12: LoI (%).
The performance of the model is evaluated through the coefficient correlation (R), root mean square error (RMSE), and mean absolute error (MAE). Figure 2a,b illustrate the performance of the model in the training and testing phases. The coefficient correlations of these phases are close and higher than 0.955. The root mean square error of the model is less than 205 kPa, and the mean absolute error is smaller than 118 kPa. It indicates that the model performs well with training and testing datasets.
The proposed GEP-based model was verified by the independent dataset. Figure 2c demonstrates that the predicted UCS is close to the measured data. The R-value, RMSE, and MAE in the verifying phase are 0.98, 131 kPa, and 91 kPa, respectively. It illustrates that the proposed GEP-based model is reliable and could be used for further application. Table 4 shows the performance of the selected model in training, testing, verifying, and all entire data.
Golbraikh and Tropsha [33] provided some criteria as the external validation models. It is suggested that one of the slopes of regression lines (k or k′) through the origin should be approximately 1.0. Besides, the m and n indexes (performance indexes) should be lower than 0.1. Moreover, the squared correlation of coefficients through the origin between predicted and experimental values (Ro2 or Ro2) are recommended to be close to 1.0 [30,34]. Table 5 presents the results of these criteria. Consequently, the model satisfies the required conditions and shows great performance with accurate predictive capability.
Table 6 illustrates the comparison among several numerical prediction models for UCS of soil stabilization and the proposed GEP-based model in this research. It is obvious that the prediction model in this study was generated based on a large volume of data (489 data points), which were collected from many published test data in different regions. In contrast, other published models were developed based on a small group of testing data from a specific area. Therefore, that advantage brings distinguished results in comparison with other models for predicting the UCS of stabilized soil.
Furthermore, thirteen input variables in the suggested model are the main parameters that affect the UCS result. Especially, the model not only considers the soil properties but also investigates the effect of characteristics of fly ashes. As a result, the novel model is unique and different from other previous models.
In summary, the GEP model yields straightforward formula considering the most influential variables. In addition, the suggested model in this study is generated based on a large database that represents a wide range of input parameters. Besides, the proposed model could predict the target precisely with a high correlation of coefficient and low errors. Hence, this evolutionary numerical equation can be applied confidently in practice.

4. Parametric Study

4.1. Effect of Binder Type and Binder Content

The UCS prediction formula from the GEP-based model (Equation (1)) is used to examine the effect of fly ash characteristics on the UCS of stabilized soil. The examined variable is changed within the range of its input, while the average values are kept constant for other parameters.
The effects of binder type and binder content on the UCS of stabilized soil are illustrated in Figure 3. It can be seen that if the soil is treated by fly ash only, the strength of stabilized soil is insignificant. In contrast, the strength of soil stabilization could be enhanced remarkably by using cement. When combining cement and fly ash at the ratio of 1:1, the strength of the stabilized soil is significant. For instance, when using 15% cement and 15% fly ash, the strength of soil stabilization equals the case of using 21.5% of cement only. It demonstrates that fly ash could be used along with cement to achieve a desirable strength, and it could save a reasonable amount of cement content for soil stabilization purposes.

4.2. Effect of the Characteristics of Fly Ash

In geotechnical engineering applications, the characteristic of fly ash could be evaluated by the CaO content and the CaO/SiO2 ratio [8]. In this section, fly ash is examined as the main binder to stabilize soil (FA = 20% and C = 0%). Figure 4 shows that increasing the CaO content and CaO/SiO2 ratio could improve the strength of stabilized soil.
In soil stabilization product, calcium ion reacts with water, soil silica, and alumina to form pozzolanic products [38]. Thus, a high proportion of CaO in fly ash could provide an adequate cementitious component for pozzolanic reactions to form calcium silicate hydrate and ettringite gels to blend soil particles and create a strong structure. The CaO/SiO2 ratio illustrates the content of CaO and SiO2 in the fly ash. If that ratio is high, the strength of stabilized soil is enhanced [39].

4.3. Effect of Fly Ash Replacement Ratio

Fly ash replacement ratio (r) represents the percentage of cement replaced by fly ash as the binder in the soil stabilization mixture. Figure 5 illustrates the effect of fly ash replacement ratio on the UCS of soil stabilization. Three levels of total binder used (FA + C) are 10%, 20%, and 30% (based on the mass of natural soil). It is evident that the UCS of stabilized soil is decreased at different rates when the fly ash replacement ratio is increased. Each curve could be divided into two phases: the primary phase and the secondary phase. In the first part, the strength reduction is insignificant; while the second part shows the significant strength reduction. The lines “t-t” and “s-s” are the tangent of the curves in the primary phase and the secondary phase. They illustrate the strength reduction trends of stabilized soil. The UCS of stabilized soil could be lower than the designed value if too much cement is replaced by fly ash. Thus, it is significant to find a reasonable fly ash replacement ratio (r*), at which the strength reduction is acceptable.
Table 7 shows the reasonable fly ash replacement ratio for each level of the total binder. For instance, if the total binder used is 30%, the r*-value could be 0.35 (corresponding to the cement content C* = 19.5% and the fly ash content FA* = 10.5%). At that replacement ratio, the strength of stabilized soil could achieve 91% of the case using 30% cement only (r = 0). If more fly ash is used to replace cement (r > 0.35), the strength of the material is decreased significantly. For example, if fly ash is used to replace cement at the ratio of r = 1, the UCS achieves 76% of the case using 30% cement only. The reasonable fly ash replacement ratio and strength reduction (UCS(ri)/UCS(r = 0)) when the total binder used of 20% or 10% are also illustrated in Table 7 and Table 8. As a result, the fly ash replacement ratio is suggested from 0.19 to 0.35 when the total binder is from 10% to 30%. This finding is valuable in practice as it helps consultants to optimize the strength of stabilized soil with reasonable cement and fly ash contents.

5. Conclusions

The study applied the machine learning technique (GEP) to generate a reliable model for estimating the UCS of soil stabilization. Approximately 489 UCS test data from published research data on soil stabilization by cement and several types of FA were selected. The prediction model not only considers the soil properties but also investigates the effect of characteristics of fly ashes. The research results show that the proposed GEP-based model performs well with high correlation coefficients (R > 0.955) and reasonable errors (RMSE < 205 kPa and MAE < 118 kPa). That novel model could help engineers in estimating the strength of soil stabilization by fly ash and cement for specific conditions.
The selected model was used to examine the effects of fly ash characteristics on the UCS of stabilized soil. The parametric study demonstrates that:
  • For soil stabilization, fly ash could be used in combination with cement as a chemical binder. It helps to reduce the amount of fly ash disposed of in the industry and save costs.
  • If the fly ash contains a high amount of CaO and CaO/SiO2 ratio, the strength of stabilized soil is increased.
  • The suggested fly ash replacement ratio is from 0.19 to 0.35, corresponding to the total binder used from 10 to 30%.
These findings are unique and significant. The research results help engineers to choose suitable fly ash and cement contents and optimize the strength of the stabilized soil by improving the characteristics of fly ash.

6. Notations

The following symbols are used in this paper:
C = cement;
ET = expression tree;
FA = fly ash;
GEP = Gene-expression programming;
GP = Genetic programming;
MAE = Mean Absolute Error;
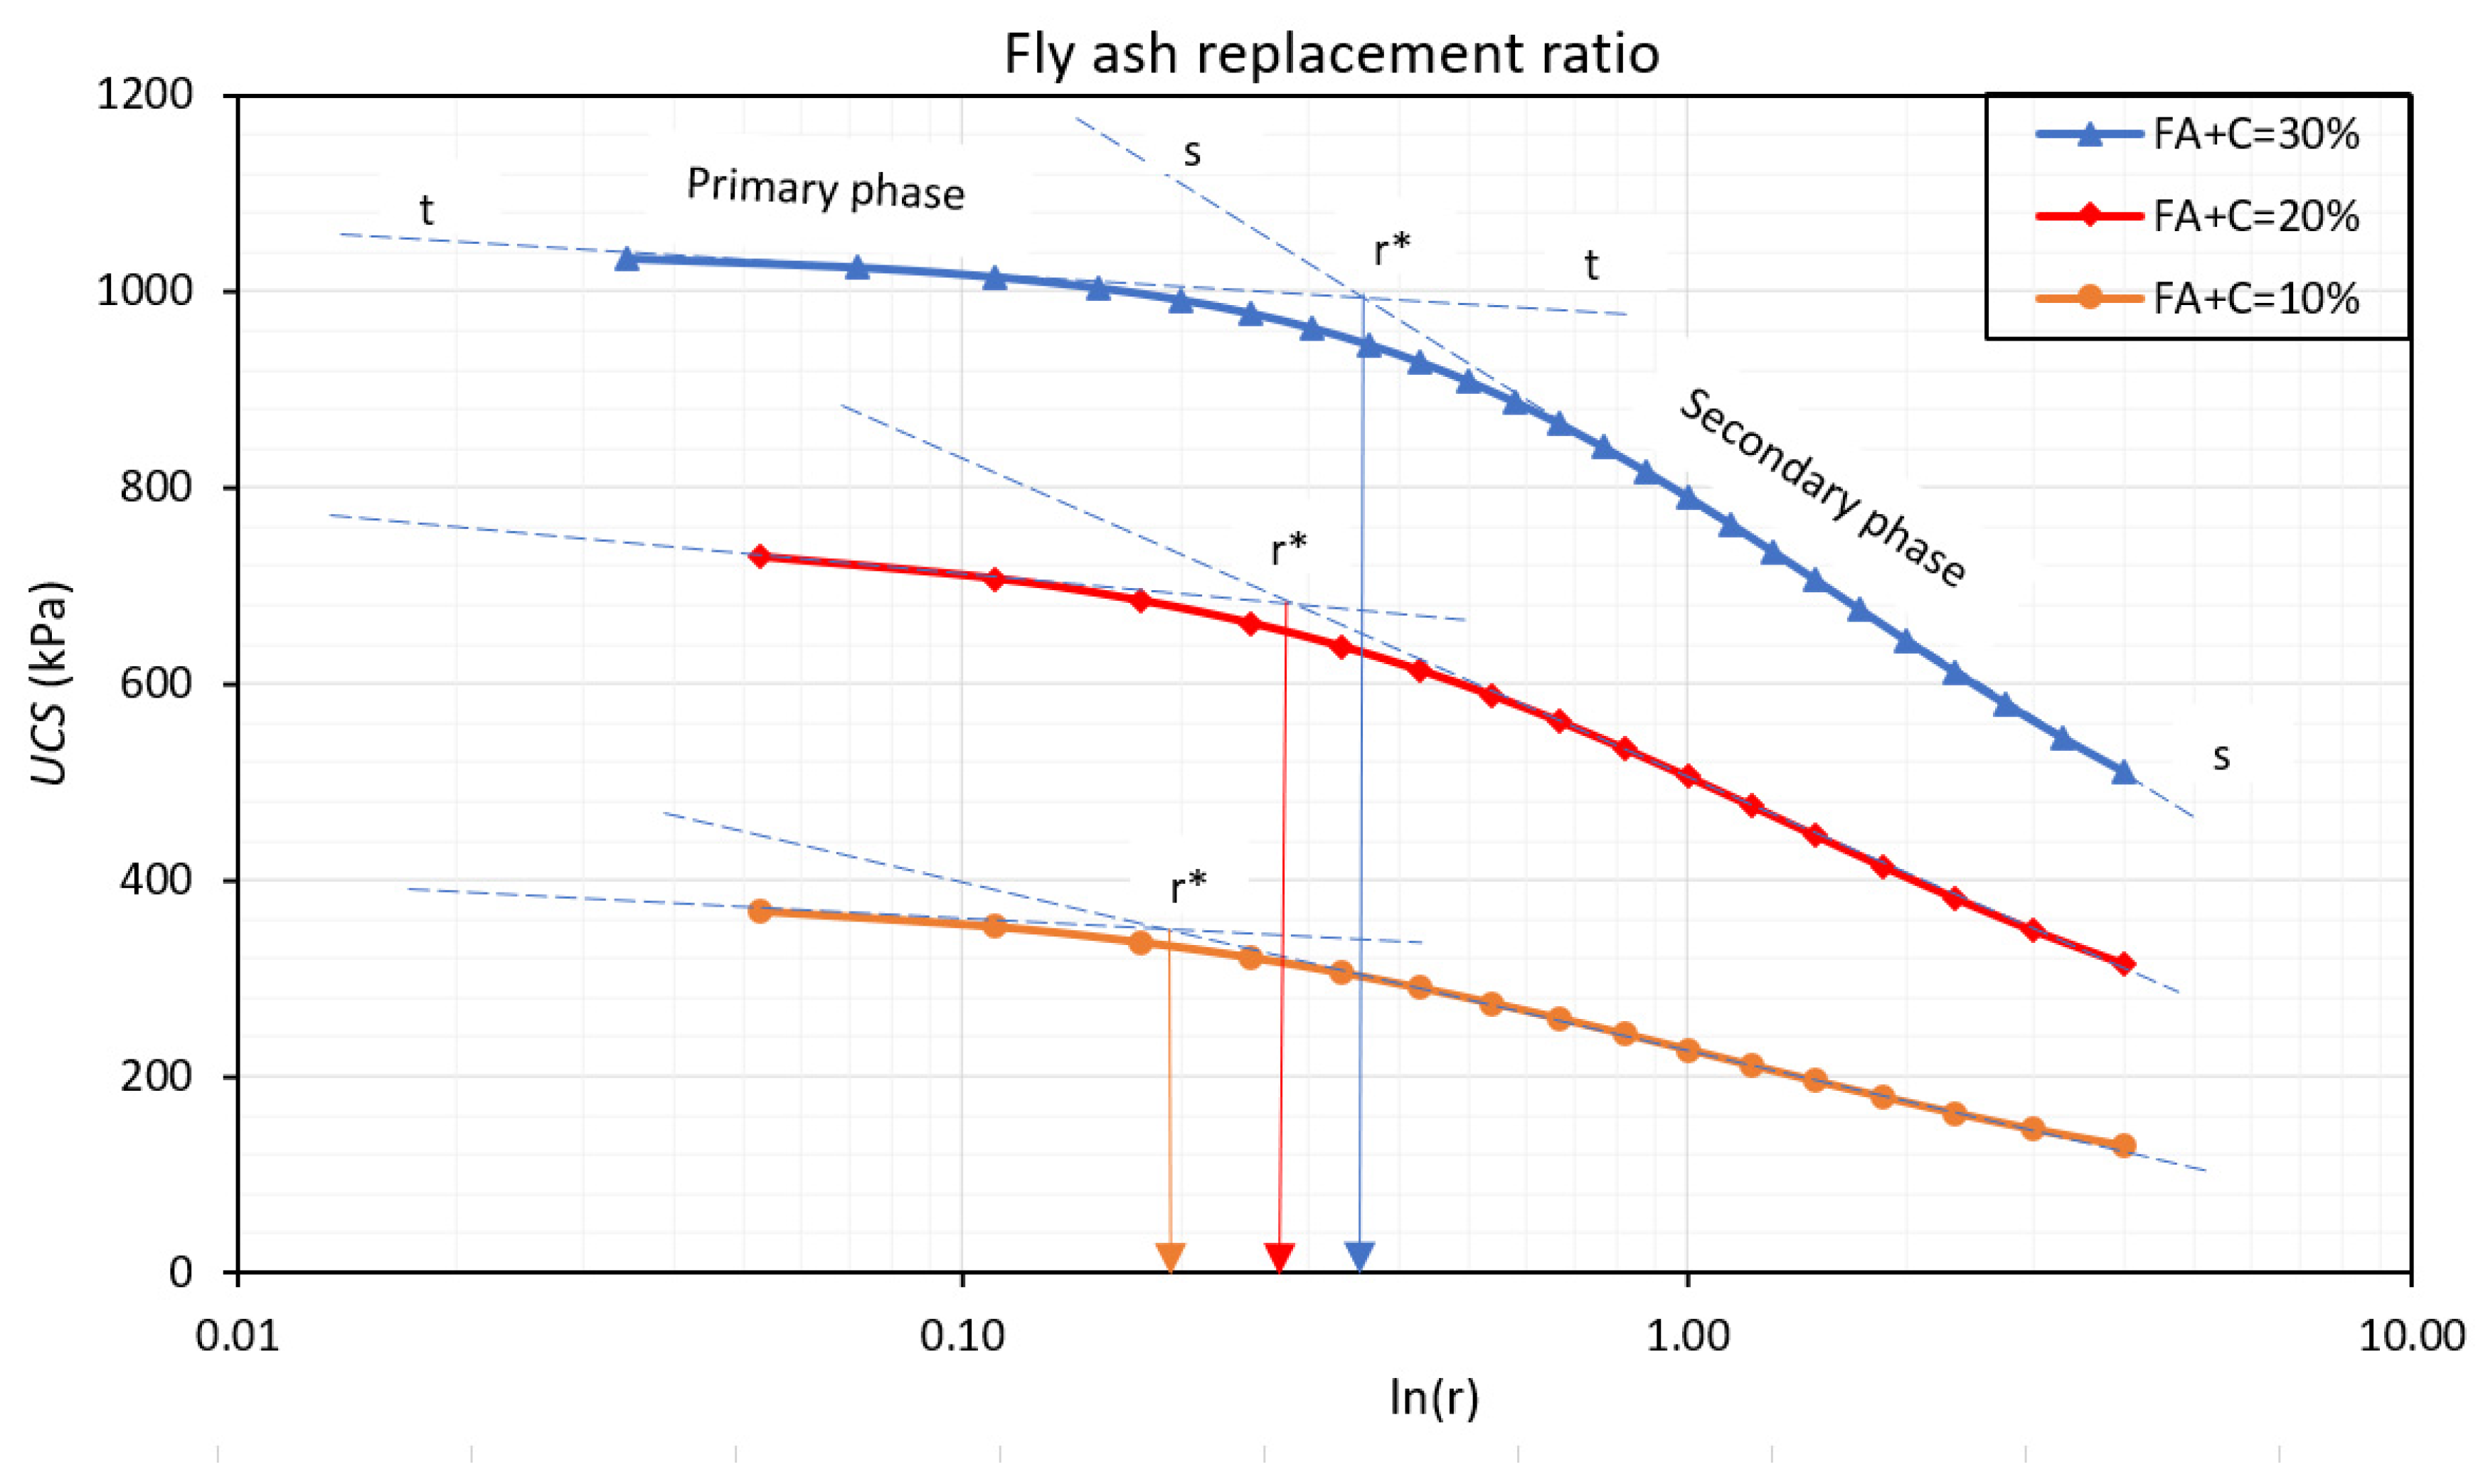
r = fly ash replacement ratio;
R = coefficient correlation;
RMSE = Root Mean Square Error;
SD = standard deviation;
UCS = unconfined compressive strength.

Author Contributions

Conceptualization, V.-N.P.; Data curation, E.O.; Formal analysis, V.-N.P.; Methodology, V.-N.P.; Supervision, E.O. and D.E.L.O.; Writing–original draft, V.-N.P.; Writing–review & editing, E.O. and D.E.L.O. All authors have read and agreed to the published version of the manuscript.

Funding

This research received no external funding.

Data Availability Statement

Some or all data, models, or codes that support the findings of this study are available from the corresponding author upon reasonable request.

Acknowledgments

We appreciate the kind help from Pornkasem Jongpradist from King Mongkut’s University of Technology Thonburi, Thailand, for sharing his raw data.

Conflicts of Interest

The authors declare no conflict of interest.

References

  1. IEA. Global Coal Consumption, 2009–2020; International Energy Agence: Paris, France, 2020.
  2. ABS. Energy Account, Australia, 2018–2019; Australian Bureau of Statistics: Canberra, Australia, 2020. [Google Scholar]
  3. Loya, M.; Rawani, A. A review: Promising applications for utilization of fly ash. Int. J. Adv. Technol. Eng. Sci. 2014, 2, 143–149. [Google Scholar]
  4. Rashad, A.M. A brief on high-volume Class F fly ash as cement replacement—A guide for Civil Engineer. Int. J. Sustain. Built Environ. 2015, 4, 278–306. [Google Scholar] [CrossRef] [Green Version]
  5. Meyers, R.A. Encyclopedia of Sustainability Science and Technology; Springer: Berlin/Heidelberg, Germany, 2012. [Google Scholar]
  6. Bhatt, A.; Priyadarshini, S.; Mohanakrishnan, A.A.; Abri, A.; Sattler, M.; Techapaphawit, S. Physical, chemical, and geotechnical properties of coal fly ash: A global review. Case Stud. Constr. Mater. 2019, 11, e00263. [Google Scholar] [CrossRef]
  7. Rashad, A.M. A comprehensive overview about the influence of different admixtures and additives on the properties of alkali-activated fly ash. Mater. Des. 2014, 53, 1005–1025. [Google Scholar] [CrossRef]
  8. Tastan, E.O.; Edil, T.B.; Benson, C.H.; Aydilek, A.H. Stabilization of organic soils with fly ash. J. Geotech. Geoenviron. 2011, 137, 819–833. [Google Scholar] [CrossRef] [Green Version]
  9. Blissett, R.; Rowson, N. A review of the multi-component utilisation of coal fly ash. Fuel 2012, 97, 1–23. [Google Scholar] [CrossRef]
  10. Kolias, S.; Kasselouri-Rigopoulou, V.; Karahalios, A. Stabilisation of clayey soils with high calcium fly ash and cement. Cem. Concr. Compos. 2005, 27, 301–313. [Google Scholar] [CrossRef]
  11. Jongpradist, P.; Jumlongrach, N.; Youwai, S.; Chucheepsakul, S. Influence of fly ash on unconfined compressive strength of cement-admixed clay at high water content. J. Mater. Civ. Eng. 2010, 22, 49–58. [Google Scholar] [CrossRef]
  12. Wang, D.; Abriak, N.E.; Zentar, R. Strength and deformation properties of Dunkirk marine sediments solidified with cement, lime and fly ash. Eng. Geol. 2013, 166, 90–99. [Google Scholar] [CrossRef]
  13. Kwan, P.S.; Bouazza, A.; Fletcher, P.; Ranjith, P.; Oh, E.Y.; Shuttlewood, K.; Balasubramaniam, A.; Bolton, M. Behaviour of cement treated Melbourne and Southeast Queensland soft clays in deep stabilization works. In Proceedings of the International Conference Deep Mixing Best Practice and Recent Advances, Stockholm, Sweden, 23–25 May 2005; pp. 101–110. [Google Scholar]
  14. Horpibulsuk, S.; Rachan, R.; Suddeepong, A. Assessment of strength development in blended cement admixed Bangkok clay. Constr. Build. Mater. 2011, 25, 1521–1531. [Google Scholar] [CrossRef]
  15. Abbey, S.; Ngambi, S.; Ganjian, E. Development of strength models for prediction of unconfined compressive strength of cement/byproduct material improved soils. Geotech. Test. J. 2017, 40, 928–935. [Google Scholar] [CrossRef]
  16. Hansson, N. Deep Soil Stabilization with Fly Ash. Mater’s Thesis, Department of Earth Sciences, Uppsala University, Uppsala, Sweden, 2008. [Google Scholar]
  17. Johari, A.; Nejad, A.H. Prediction of soil-water characteristic curve using gene expression programming. Iran. J. Sci. Technol. Trans. Civ. Eng. 2015, 39, 143. [Google Scholar] [CrossRef]
  18. Alavi, A.H.; Gandomi, A.H. A robust data mining approach for formulation of geotechnical engineering systems. Eng. Comput. 2011, 28, 242–274. [Google Scholar] [CrossRef]
  19. Tarawneh, B. Predicting standard penetration test N-value from cone penetration test data using artificial neural networks. Geosci. Front. 2017, 8, 199–204. [Google Scholar] [CrossRef] [Green Version]
  20. Shahmansouri, A.A.; Bengar, H.A.; Ghanbari, S. Compressive strength prediction of eco-efficient GGBS-based geopolymer concrete using GEP method. J. Build. Eng. 2020, 31, 101326. [Google Scholar] [CrossRef]
  21. Leong, H.Y.; Ong, D.E.L.; Sanjayan, J.G.; Nazari, A.; Kueh, S.M. Effects of Significant Variables on Compressive Strength of Soil-Fly Ash Geopolymer: Variable Analytical Approach Based on Neural Networks and Genetic Programming. J. Mater. Civ. Eng. 2018, 30, 04018129. [Google Scholar] [CrossRef] [Green Version]
  22. ASTM. Standard Practice for Making and Curing Soil-Cement Compression and Flexure Test Specimens in the Laboratory; ASTM International: West Conshohocken, PA, USA, 2007. [Google Scholar]
  23. ASTM. Standard Practice for Making and Curing Soil-Cement Compression and Flexure Test Specimens in the Laboratory; ASTM International: West Conshohocken, PA, USA, 1996. [Google Scholar]
  24. ASTM. Standard Practice for Making and Curing Soil-Cement Compression and Flexure Test Specimens in the Laboratory; ASTM International: West Conshohocken, PA, USA, 2017. [Google Scholar]
  25. Ferreira, C. Gene Expression Programming: Mathematical Modeling by an Artificial Intelligence; Springer: Berlin, Germany, 2006; Volume 21. [Google Scholar]
  26. Mohammadzadeh, S.; Kazemi, S.-F.; Mosavi, A.; Nasseralshariati, E.; Tah, J.H. Prediction of compression index of fine-grained soils using a gene expression programming model. Infrastructures 2019, 4, 26. [Google Scholar] [CrossRef] [Green Version]
  27. Sadrossadat, E.; Ghorbani, B.; Hamooni, M.; Moradpoor Sheikhkanloo, M.H. Numerical formulation of confined compressive strength and strain of circular reinforced concrete columns using gene expression programming approach. Struct. Concr. 2018, 19, 783–794. [Google Scholar] [CrossRef]
  28. Leong, H.; Ong, D.; Sanjayan, J.; Nazari, A. A genetic programming predictive model for parametric study of factors affecting strength of geopolymers. RSC Adv. 2015, 5, 85630–85639. [Google Scholar] [CrossRef]
  29. Tenpe, A.R.; Patel, A. Application of genetic expression programming and artificial neural network for prediction of CBR. Road Mater. Pavement Des. 2018, 21, 1183–1200. [Google Scholar] [CrossRef]
  30. Soleimani, S.; Rajaei, S.; Jiao, P.; Sabz, A.; Soheilinia, S. New prediction models for unconfined compressive strength of geopolymer stabilized soil using multi-gen genetic programming. Measurement 2018, 113, 99–107. [Google Scholar] [CrossRef]
  31. Gandomi, A.H.; Roke, D.A.; Sett, K. Genetic programming for moment capacity modeling of ferrocement members. Eng. Struct. 2013, 57, 169–176. [Google Scholar] [CrossRef]
  32. GeneXproTools, Version 5.0; GEPSOFT: Washington, DC, USA, 2014.
  33. Golbraikh, A.; Tropsha, A. Beware of q2! J. Mol. Graph. Model. 2002, 20, 269–276. [Google Scholar] [CrossRef]
  34. Alavi, A.H.; Gandomi, A.H.; Mollahasani, A.; Bazaz, J.B.; Talatahari, S. Linear and tree-based genetic programming for solving geotechnical engineering problems. In Metaheuristics in Water, Geotechnical and Transport Engineering; Elsevier: Amsterdam, The Netherlands, 2013; pp. 289–310. [Google Scholar] [CrossRef]
  35. Sunitsakul, J.; Sawatparnich, A.; Sawangsuriya, A. Prediction of unconfined compressive strength of soil–cement at 7 days. Geotech. Geol. Eng. 2012, 30, 263–268. [Google Scholar] [CrossRef]
  36. Saadat, M.; Bayat, M. Prediction of the unconfined compressive strength of stabilised soil by Adaptive Neuro Fuzzy Inference System (ANFIS) and Non-Linear Regression (NLR). Geomech. Geoengin. 2019, 1–12. [Google Scholar] [CrossRef]
  37. Tsuchida, T.; Tang, Y.X. Estimation of compressive strength of cement-treated marine clays with different initial water contents. Soils Found. 2015, 55, 359–374. [Google Scholar] [CrossRef] [Green Version]
  38. Terrel, R.L.; Epps, J.A.; Barenberg, E.J.; Mitchell, J.; Thompson, M.R. Soil Stabilization in Pavement Structures-A User’s Manual Volume 2: Mixture Design Considerations; Federal Highway Administration: Washington, DC, USA, 1979.
  39. Janz, M.; Johansson, S.-E. The Function of Different Binding Agents in Deep Stabilization; Swedish Deep Stabilization Research Centre: Linköping, Sweden, 2002; pp. 1–35. [Google Scholar]
Figure 1. Tree expression of the proposed GEP model.
Infrastructures 06 00181 g001
Figure 2. Performance of the proposed GEP model: (a) Training phase; (b) Testing phase; (c) Verifying phase; (d) Entire data.
Infrastructures 06 00181 g002
Figure 3. Effect of binder type and binder content.
Infrastructures 06 00181 g003
Figure 4. Effect of fly ash characteristics: (a) Effect of CaO content; (b) Effect of CaO/SiO2.
Infrastructures 06 00181 g004
Figure 5. Effect of fly ash replacement ratio.
Infrastructures 06 00181 g005
Table 1. Sources of data.
ReferenceNationSoil TypeBinder TypeDataset
Tastan et al. [8]The United StateCLOff-Specification Fly ash and Cement Type I66
Kolias et al. [10]GreeceCLOff-Specification Fly ash and Cement 24
Jongpradist et al. [11]ThailandCHFly ash Type F and Cement Type I214
Wang et al. [12]FranceMHFly ash Type F and Cement Type I12
Kwan et al. [13]AustraliaCHOff-Specification Fly ash and Cement 30
Horpibulsuk et al. [14]ThailandCHFly ash Type F and Cement Type I63
Abbey et al. [15]The United KingdomCH, ML, MHOff-Specification Fly ash and Cement 80
Note: CL, CH, ML, and MH are lean clay, fat clay, silt, and elastic silt, respectively.
Table 2. Statistical analysis of data.
VariablesPL (%)LL (%)Clay (%)Silt (%)Sand (%)Organic (%)Total Water (%)
Maximum531197074.77527265
Minimum13114.5103022
Range528855.564.77227243
Average33.4088.6537.3035.6027.101.86135.99
SD11.7130.8416.1616.4620.255.7569.10
VariablesAge (day)C (%)FA (%)CaO (%)CaO/SiO2LoI (%)UCS (kPa)
Maximum27136.83048.972.46494522
Minimum30010014.24
Range26836.83047.972.46494508
Average25.7012.0414.3712.820.387.22510.34
SD34.4110.738.7910.120.507.51557.99
Note: SD is the standard deviation.
Table 3. Parameter setting for the GEP modeling.
ParameterValue
Independent variables13
Dependent variables1
Chromosomes200
Genes7
Head size10
Tail size21
Gene size 52
Linking functionAddition
Fitness functionRMSE
Table 4. Performance of the proposed model.
PerformanceTrainingTestingVerifyingEntire Data
R-value0.9550.9630.9800.961
R2-value0.9120.9270.9600.924
RMSE (kPa)156.4204.6131.1161.2
MAE (kPa)102.8118.491.4103.4
Table 5. Statistical parameters for the external validation of the selected GEP model.
Statistical ParameterCriteriaGEP Model
k = i = 1 n ( O i P i ) / i = 1 n O i 2 0.85 < k < 1.150.947
k = i = 1 n ( O i P i ) / i = 1 n P i 2 0.85 < k< 1.151.011
R 0 2 = 1 i = 1 n ( P i O i 0 ) 2 / i = 1 n ( P i P ¯ i ) 2 where   O i 0 = k O i Close to 10.911
R 0 2 = 1 i = 1 n ( O i P i 0 ) 2 / i = 1 n ( O i O ¯ i ) 2 where   P i 0 = k P i Close to 10.917
m = ( R 2 R 0 2 ) / R 2 m < 0.10.0136
n = ( R 2 R 0 2 ) / R 2 n < 0.10.0076
Table 6. Performance comparison of prediction models.
StudyDatasetVariablesMethodR-Value
Abbey et al. [15]3002multiple regression analyses0.959
Shahmansouri et al. [20]3515GEP0.958
Sunitsakul et al. [35]5203nonlinear multi-variable regression 0.867
Saadat and Bayat [36]753non-linear regression0.888
Tsuchida and Tang [37]1604linear regression0.80–0.99
This study48913GEP0.961
Table 7. Fly ash replacement ratio.
Total Binders (%)302010
r* 0.350.280.19
C* (%)19.514.48.1
FA* (%)10.55.61.9
Note: r* is the reasonable fly ash replacement ratio.
Table 8. Strength reduction.
Total Binders (%)302010
r = r*0.910.880.84
r = 10.760.670.59
Publisher’s Note: MDPI stays neutral with regard to jurisdictional claims in published maps and institutional affiliations.

