1. Introduction
The Thames Tunnel is the first tunnel known to have been constructed successfully underneath a navigable river and was built between 1825 and 1843 using the tunneling shield. Many underwater tunnel projects have been constructed and operated all over the world. For example, in Japan, the Kanmon Straits Tunnel was completed in 1944 [
1]. Additionally, in Norway, the Eiksund Undersea Tunnel was completed in 2008. The great Tunnel in China, the Dapu Road Tunnel, was completed in 1971 [
2]. Finally, the Channel Tunnel that connects the U.K. with France was completed in 1994 [
3].
Underwater tunnels represent a challenge for geotechnical engineers to design and construct a cost-effective underwater tunnel with no security risk, despite the significant advances made in underwater tunneling technology in the past several decades [
4,
5,
6,
7,
8,
9].
Most underwater tunneling projects suffer from the same challenges, such as uncertainties of engineering geology and the complexities of fluid–mechanical interaction [
10]. The existence of the water body over the tunnel causes practical difficulties in geological investigations. Moreover, the degree of accuracy of the geological predictions may be lower than that of a land surface. Such challenges lead to high remediation costs and project delays [
11].
Advanced site investigation programming and monitoring technology can be applied [
12,
13,
14,
15]. In addition, the efforts to improve the understanding of fluid–mechanical interaction involved in underwater tunneling are also helpful [
16,
17,
18,
19,
20,
21]. These efforts provide new insights into the hydraulic interaction between an underwater tunnel and groundwater, which are beneficial to ensure optimum design and construction control of underwater tunnels. However, there are many critical aspects to designing underwater tunnels that must be addressed. The minimum cover thickness is one of these aspects.
It is an essential design parameter affecting the stability and the cost of underwater tunneling [
22]. Moreover, the minimum cover thickness of underwater tunnels significantly differs from case to case [
23,
24], and, currently, there is no international standard to estimate its value.
The importance of tunnel cover thickness, among other related factors such as lining joint pattern [
25], tunnel face lagging distance [
26], soil permeability [
27], dynamic disturbance [
28,
29], and time effect [
30], has an essential effect on the tunnel stability.
The tunnel structure with surrounding ground responses at various cover thicknesses must be critically estimated as they significantly affect optimum design in terms of minimizing cost and disturbance to surrounding infrastructures. Based on F.E. analysis, [
31] found that the axial force and bending moment of the tunnel lining increased with the increase of tunnel cover thickness.
Considering the effects of tunnel cover thickness, modeling of tunneling-induced ground surface and subsurface settlements was implemented by several investigators [
32,
33,
34,
35,
36,
37]. Based on numerical simulations, Kasper and Meschke [
38] reported that lower uplift of the tunnel lining was achieved at a higher tunnel cover thickness. The results of 3D centrifuge tests performed by Boonyarak and Ng [
39] demonstrated that the settlement of an existing tunnel induced by a new tunnel excavation underneath was reduced by a simultaneous increase in the cover thickness of the two tunnels.
However, the cover thickness effects on tunnel and ground responses were not critically understood for the underwater tunneling cases due to a lack of investigation. Therefore, a different mechanism of the cover thickness effects may arise compared to the tunneling cases on land. Moreover, in analyzing the cover thickness effects of an underwater tunnel, the seepage–stress coupling must be considered for a realistic simulation.
2. The Greater Cairo Metro, Line 2
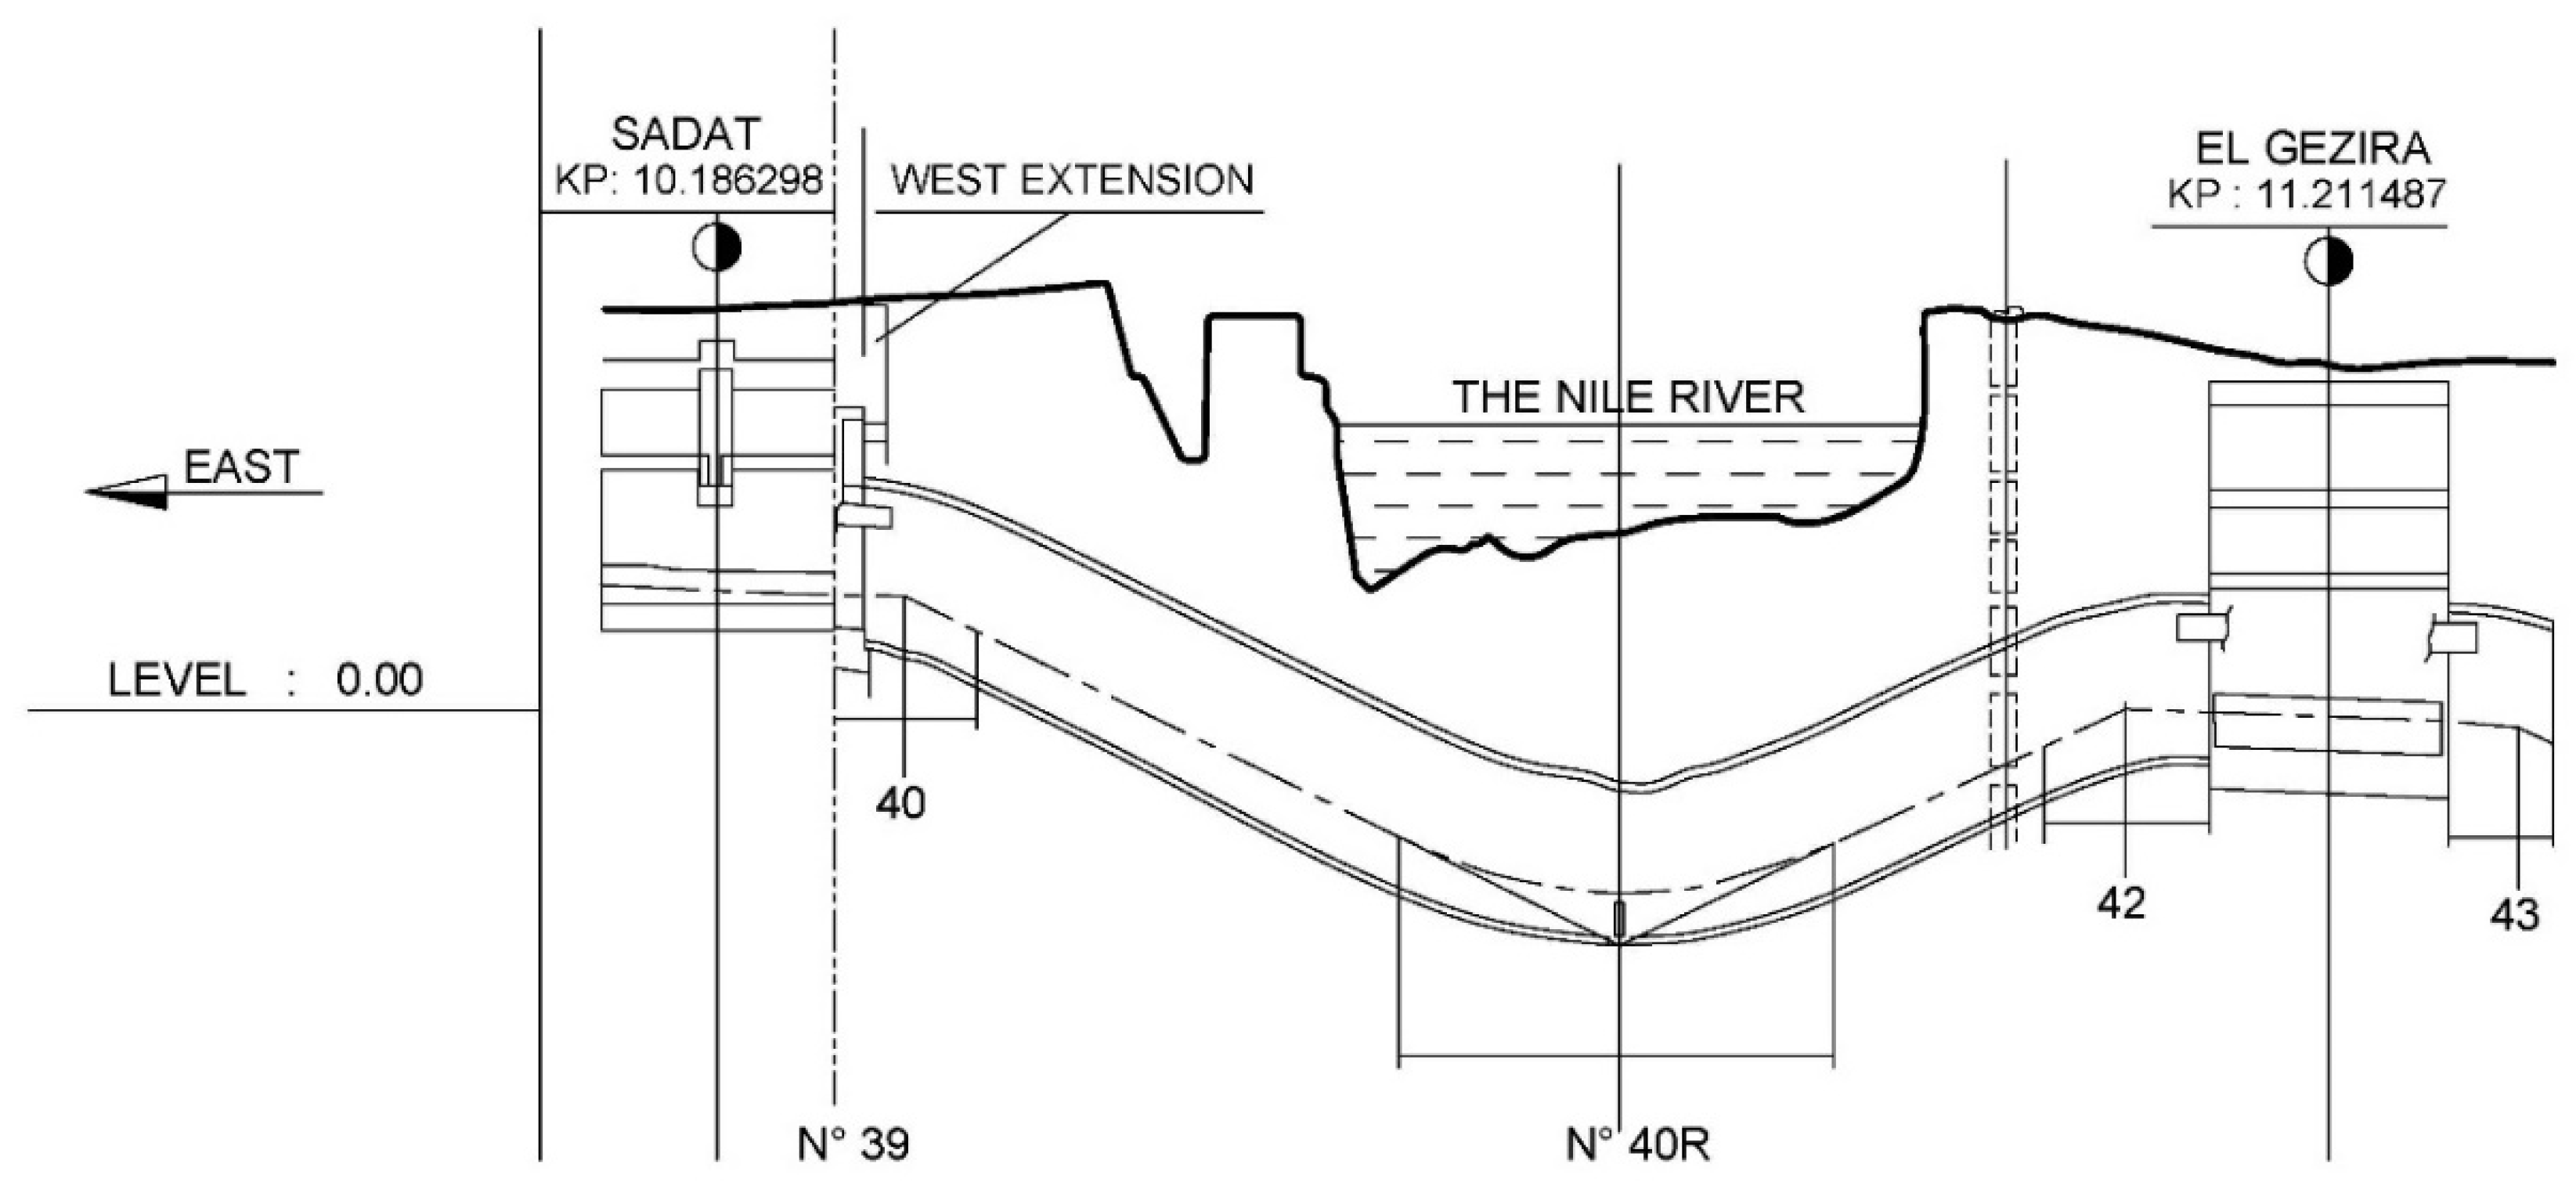
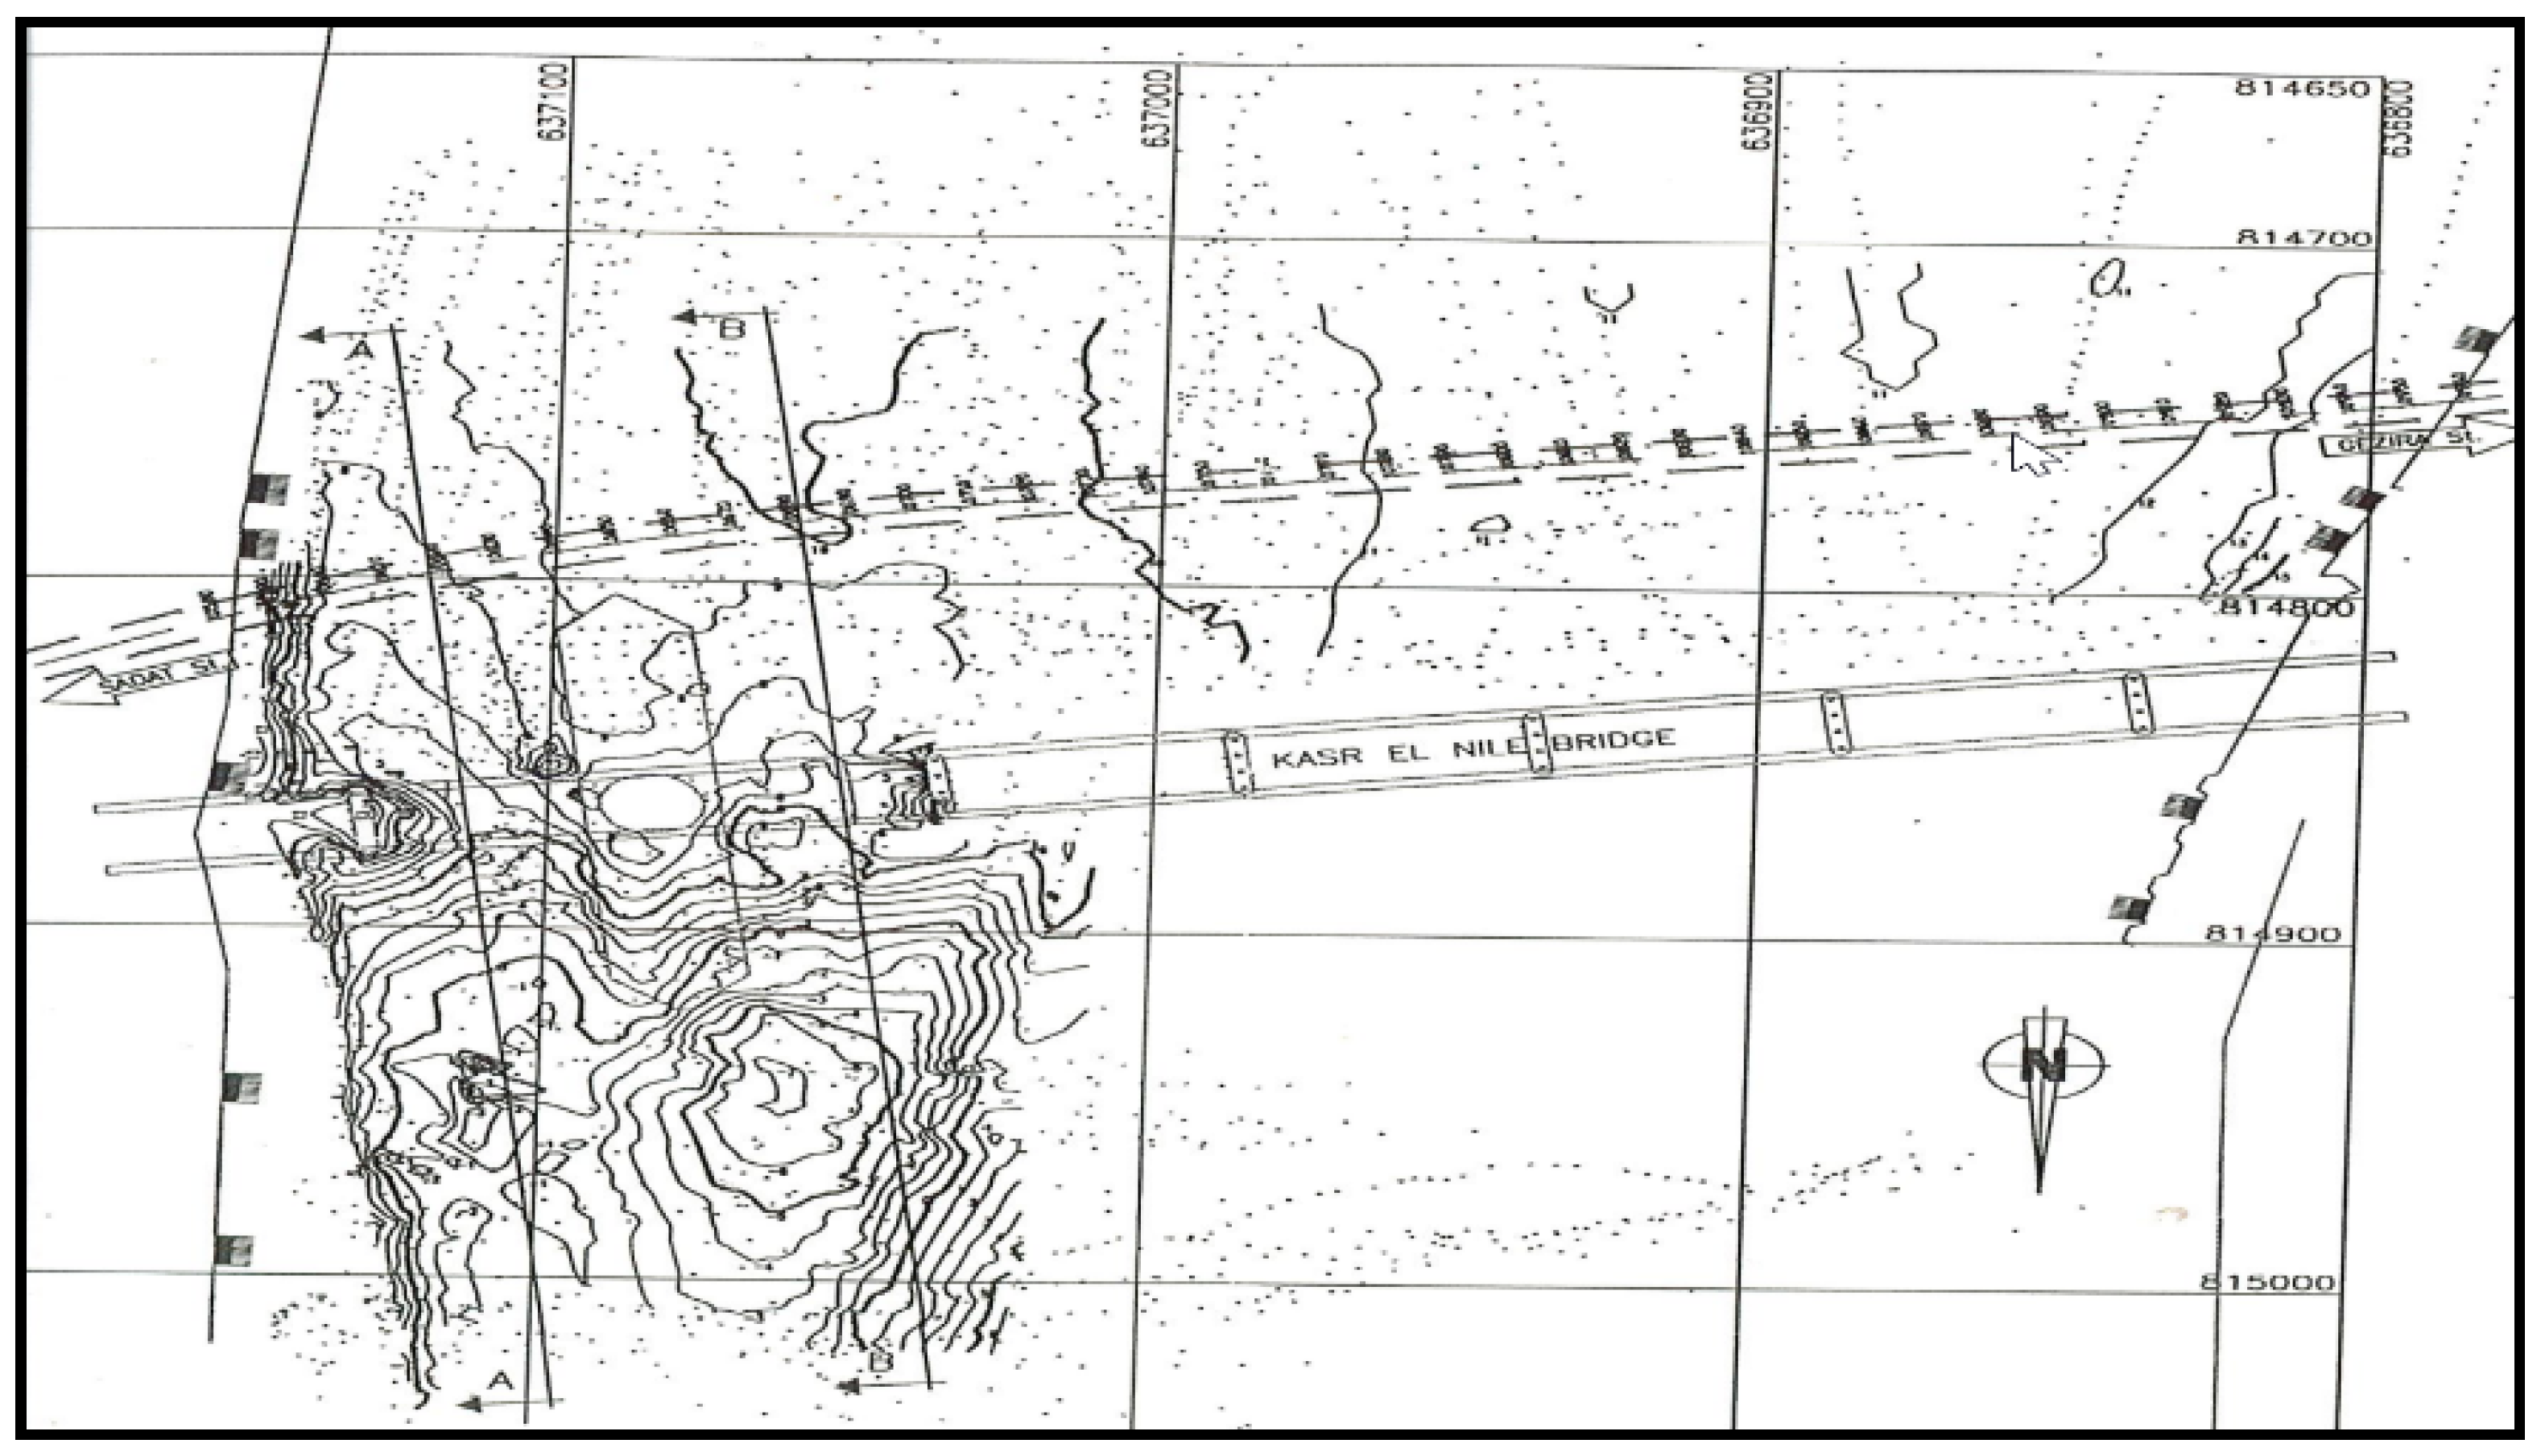
The Greater Cairo Metro is an important rapid transit system in Egypt. It was the first of the three full-fledged metro systems in Africa to be constructed and the first in the Arab world. The first tunnel to be built under the Nile River carries Line 2 across the river, crossing the two branches of the Nile. That part of the shield-bored tunnel heads east of El Gizera station to cross under the 370-m-wide main branch at the south of Kaser El Nile bridge to reach Sadat station situated at Tahrir square (
Figure 1).
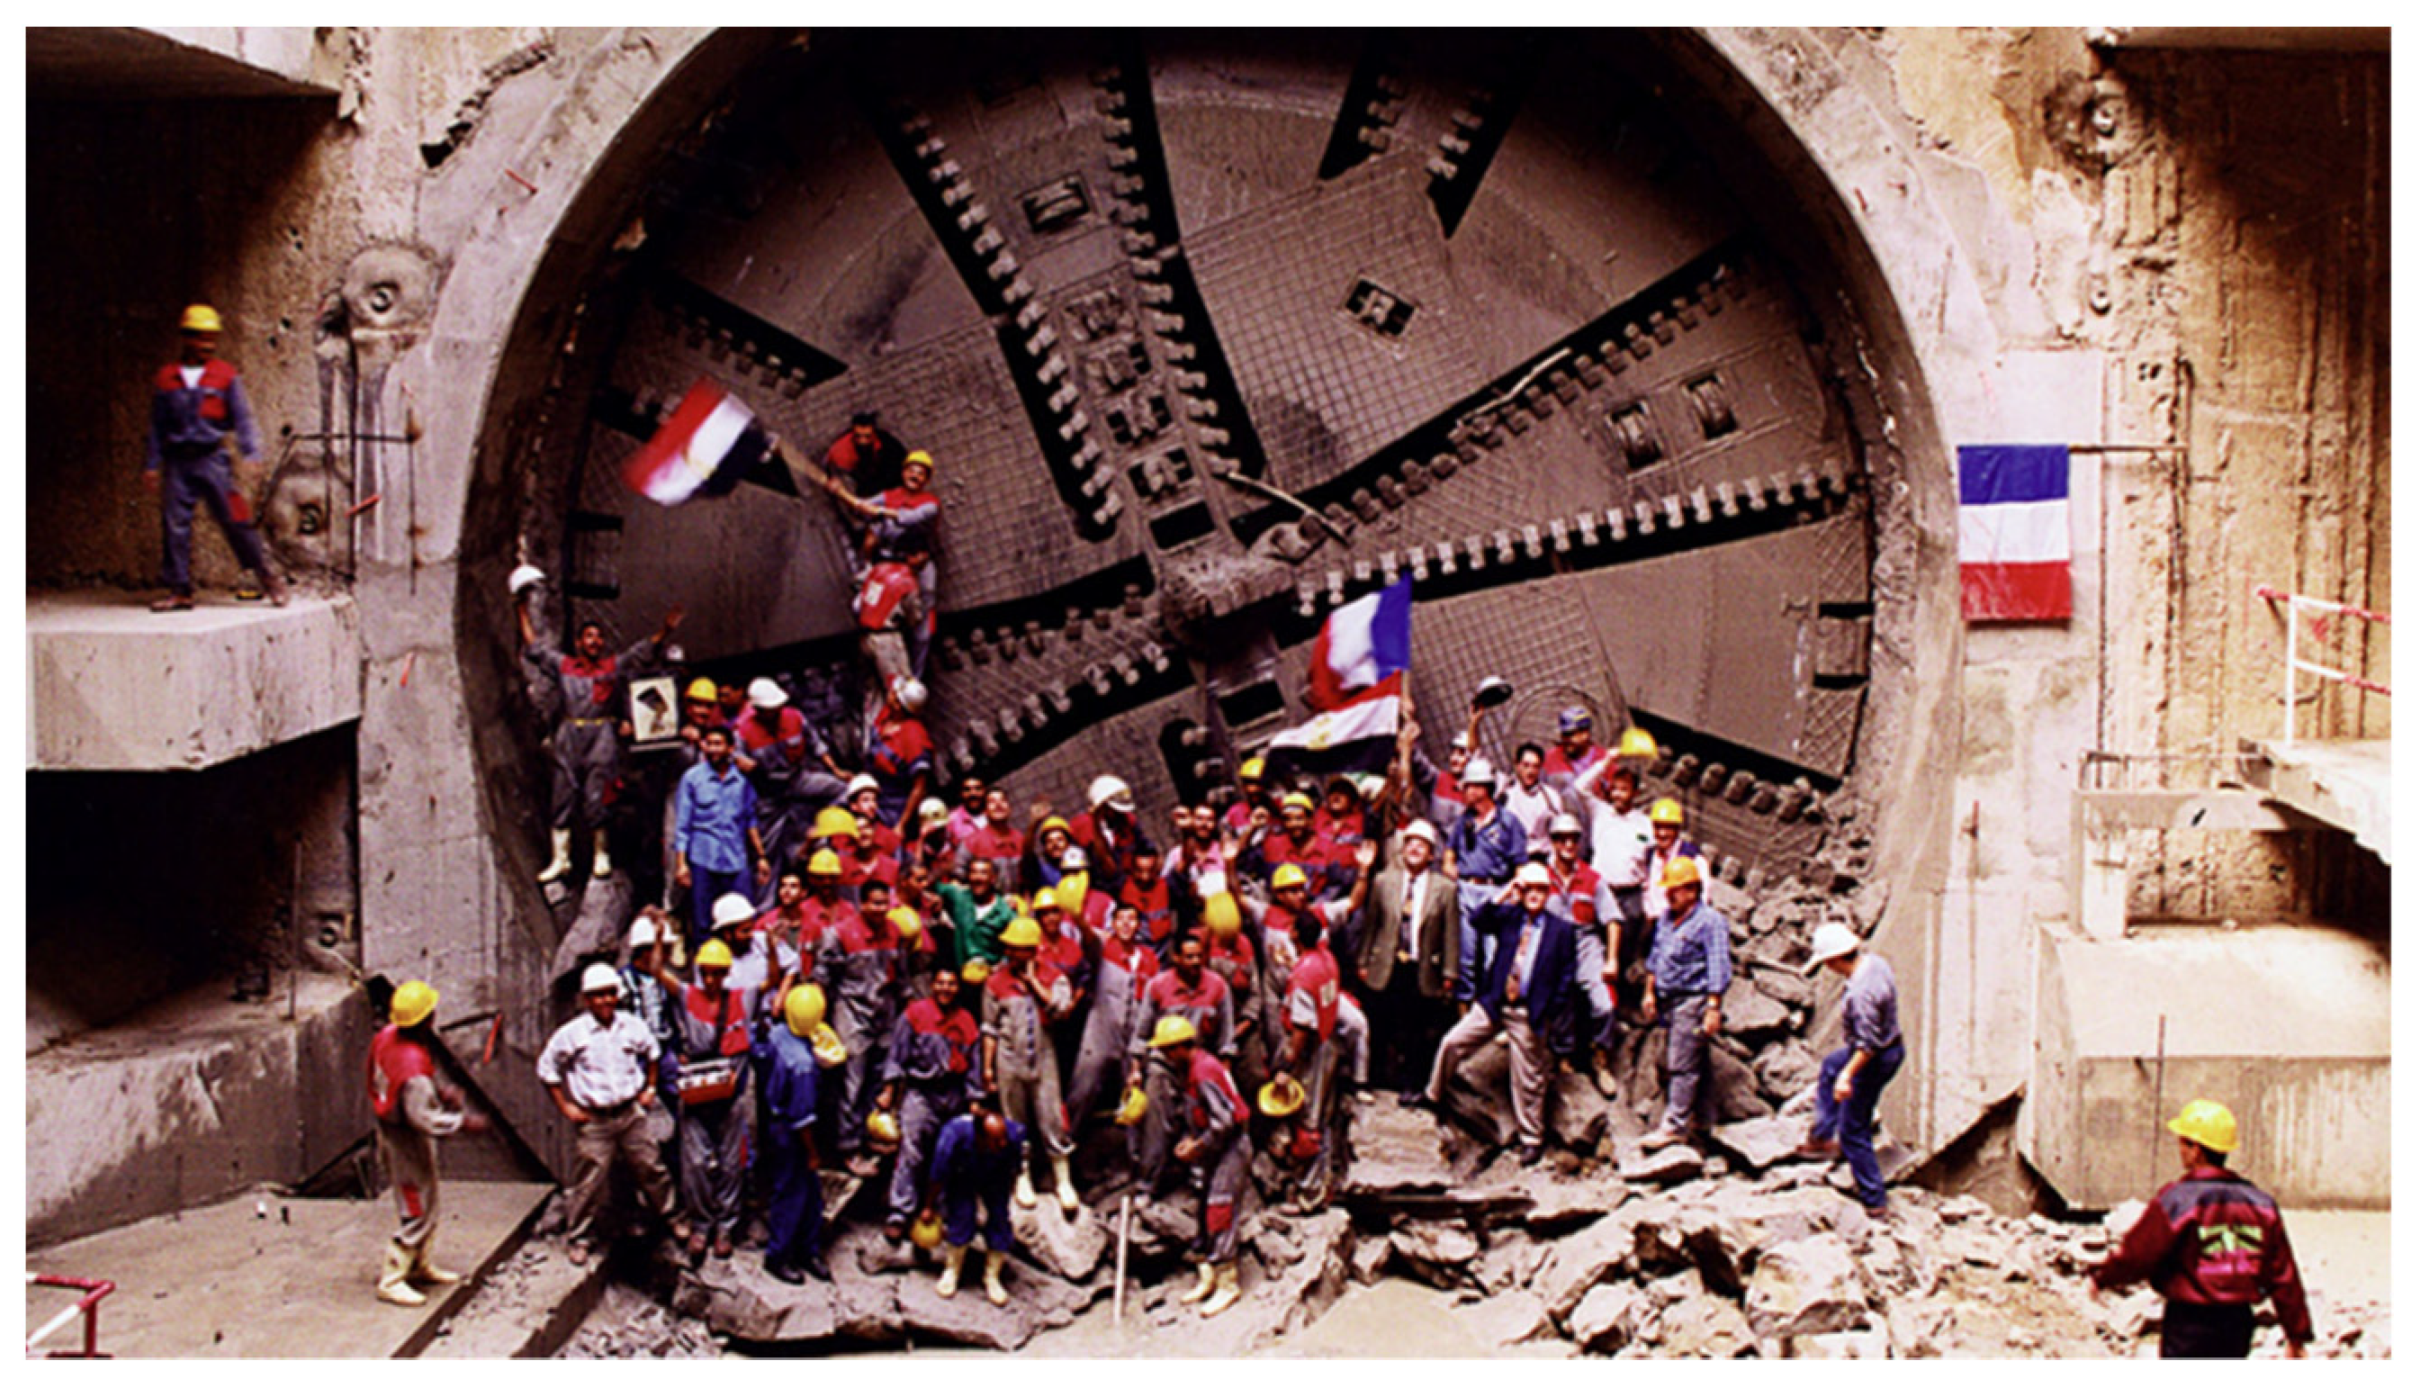
Figure 2 depicts the Line 2 alignment. It includes 6.00 km of at-grade and a viaduct section with six at-grade stations, cut and cover tunnels of 1.80 km length, and a bored tunnel of 9.50 km length (
Figure 2). For the bored tunnel section, a single tunnel 8.35 m in internal diameter was constructed using two bentonite slurry shield tunnel boring machines (TBMs), each 9.48 m in diameter with a length of 8.32 m, a weight of 5660 kN, and slurry-specific weight of 11.00 kN/m
3 (
Figure 3).
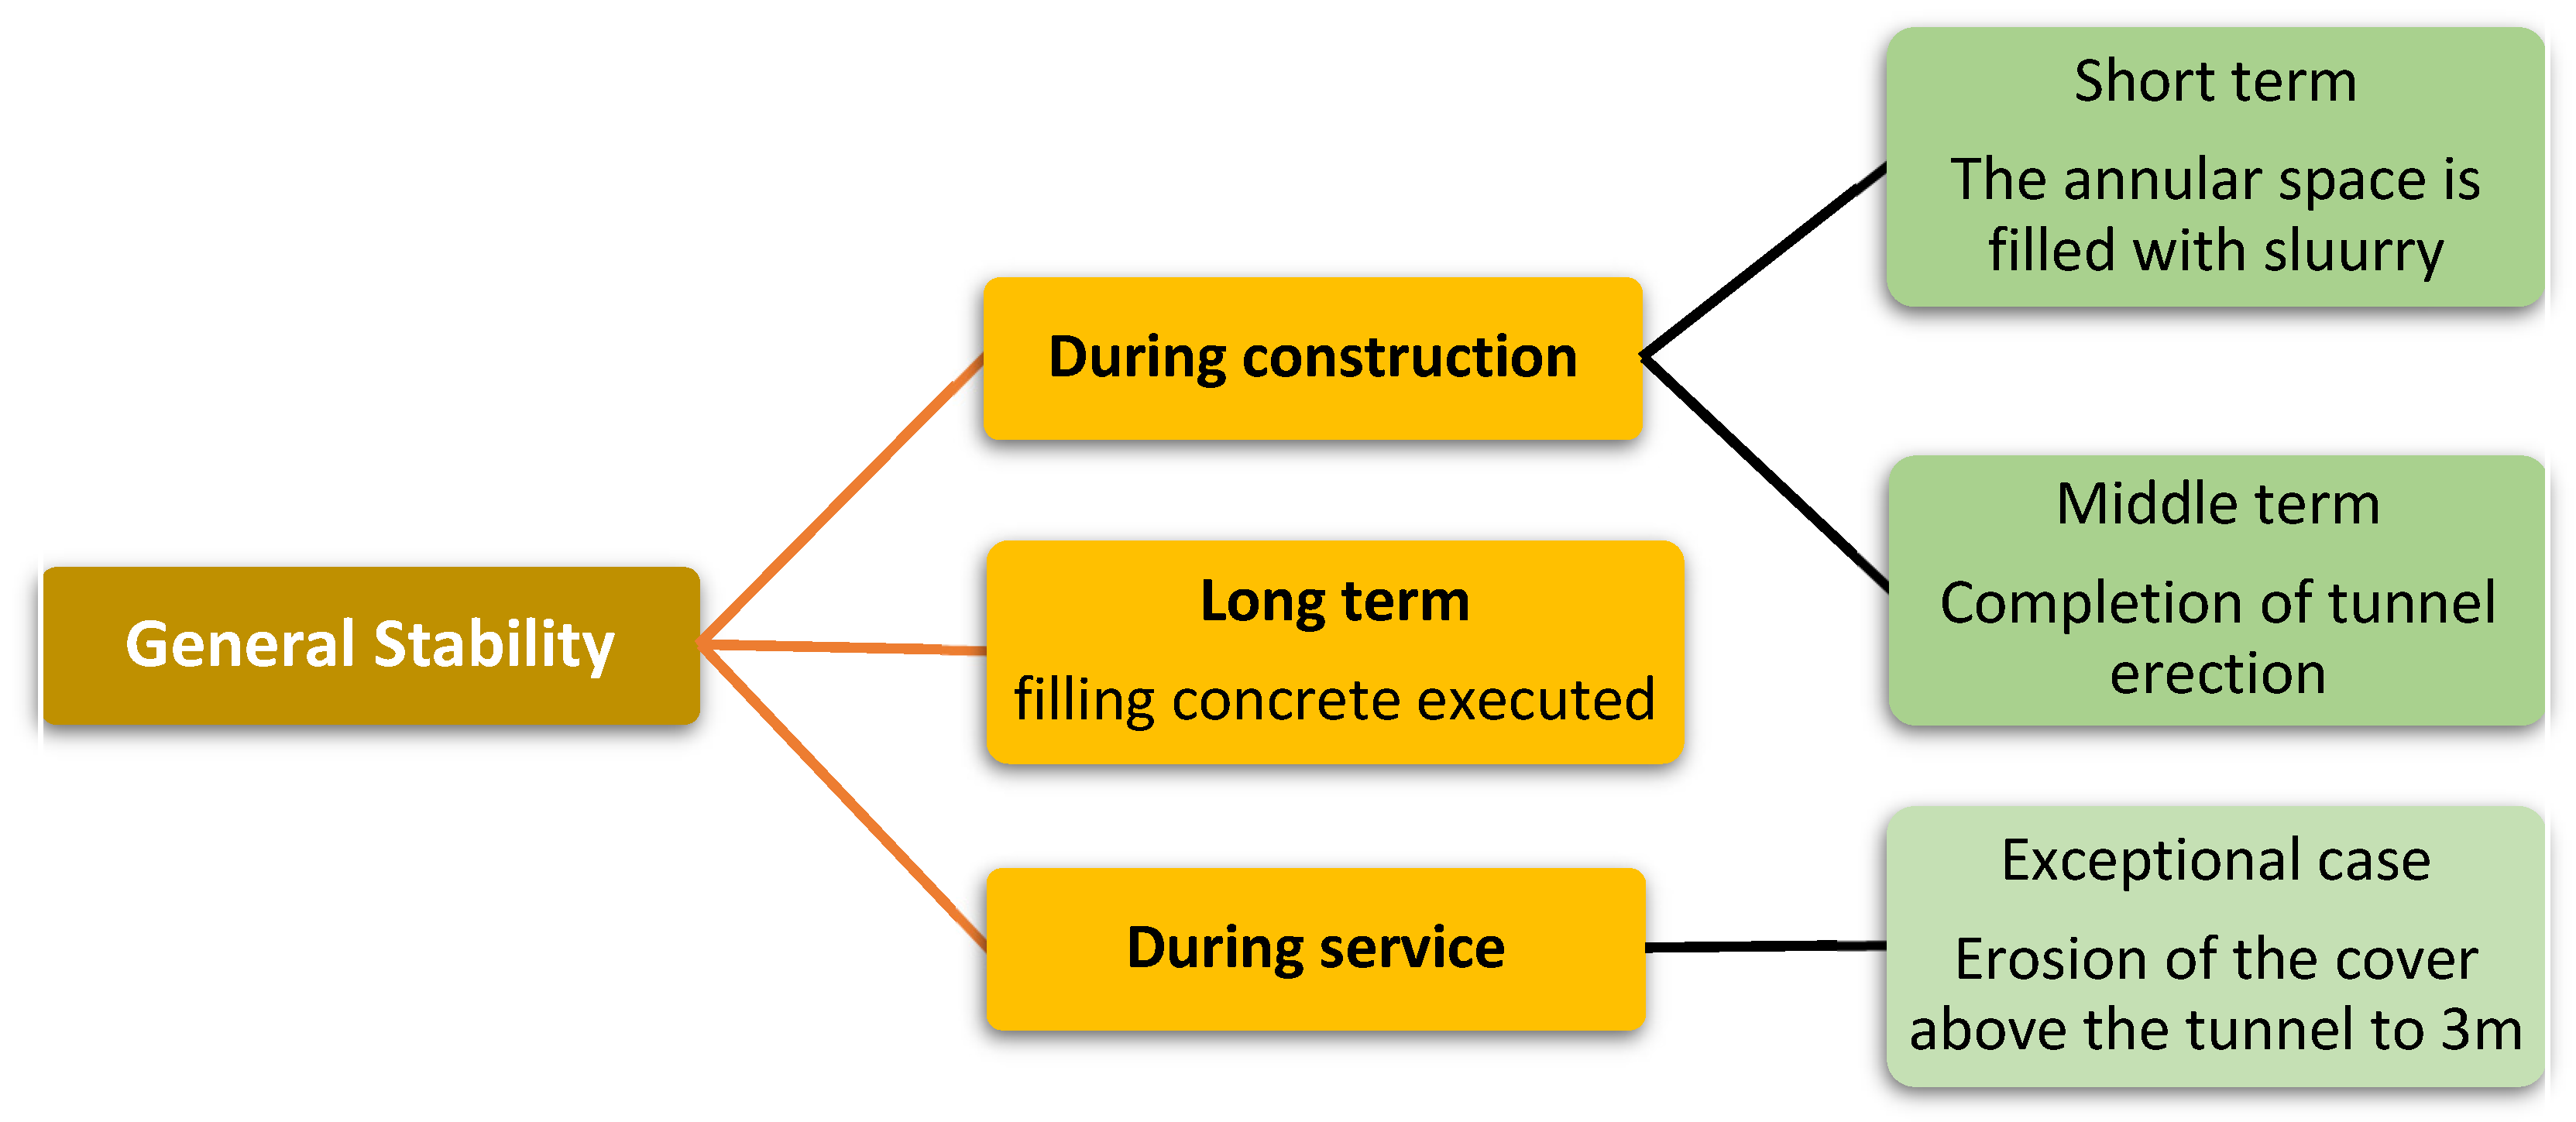
To cover all aspects of tunnel stability under the Nile River during construction and service, general stability, front face stability, and soil–lining interaction had to be taken into consideration [
40,
41,
42,
43,
44].
General stability concerns protecting the tunnel against buoyancy during the different phases of construction and service. Front face stability requires maintaining appropriate stability during the excavation of the tunnel. Soil–lining interaction analysis involves evaluating the deformation of the tunnel subject to cover thickness.
This research studied the general stability of the tunnel using two methodologies. The first was an empirical model, and the second was a 3D numerical model using the F.E. method.
3. Empirical Model
In general, underground structures are subjected to deformations through the interaction between the ground and the structures. A tunnel should be designed to satisfy safety and function criteria in tunnel construction and during the service stage of the tunnel life cycle.
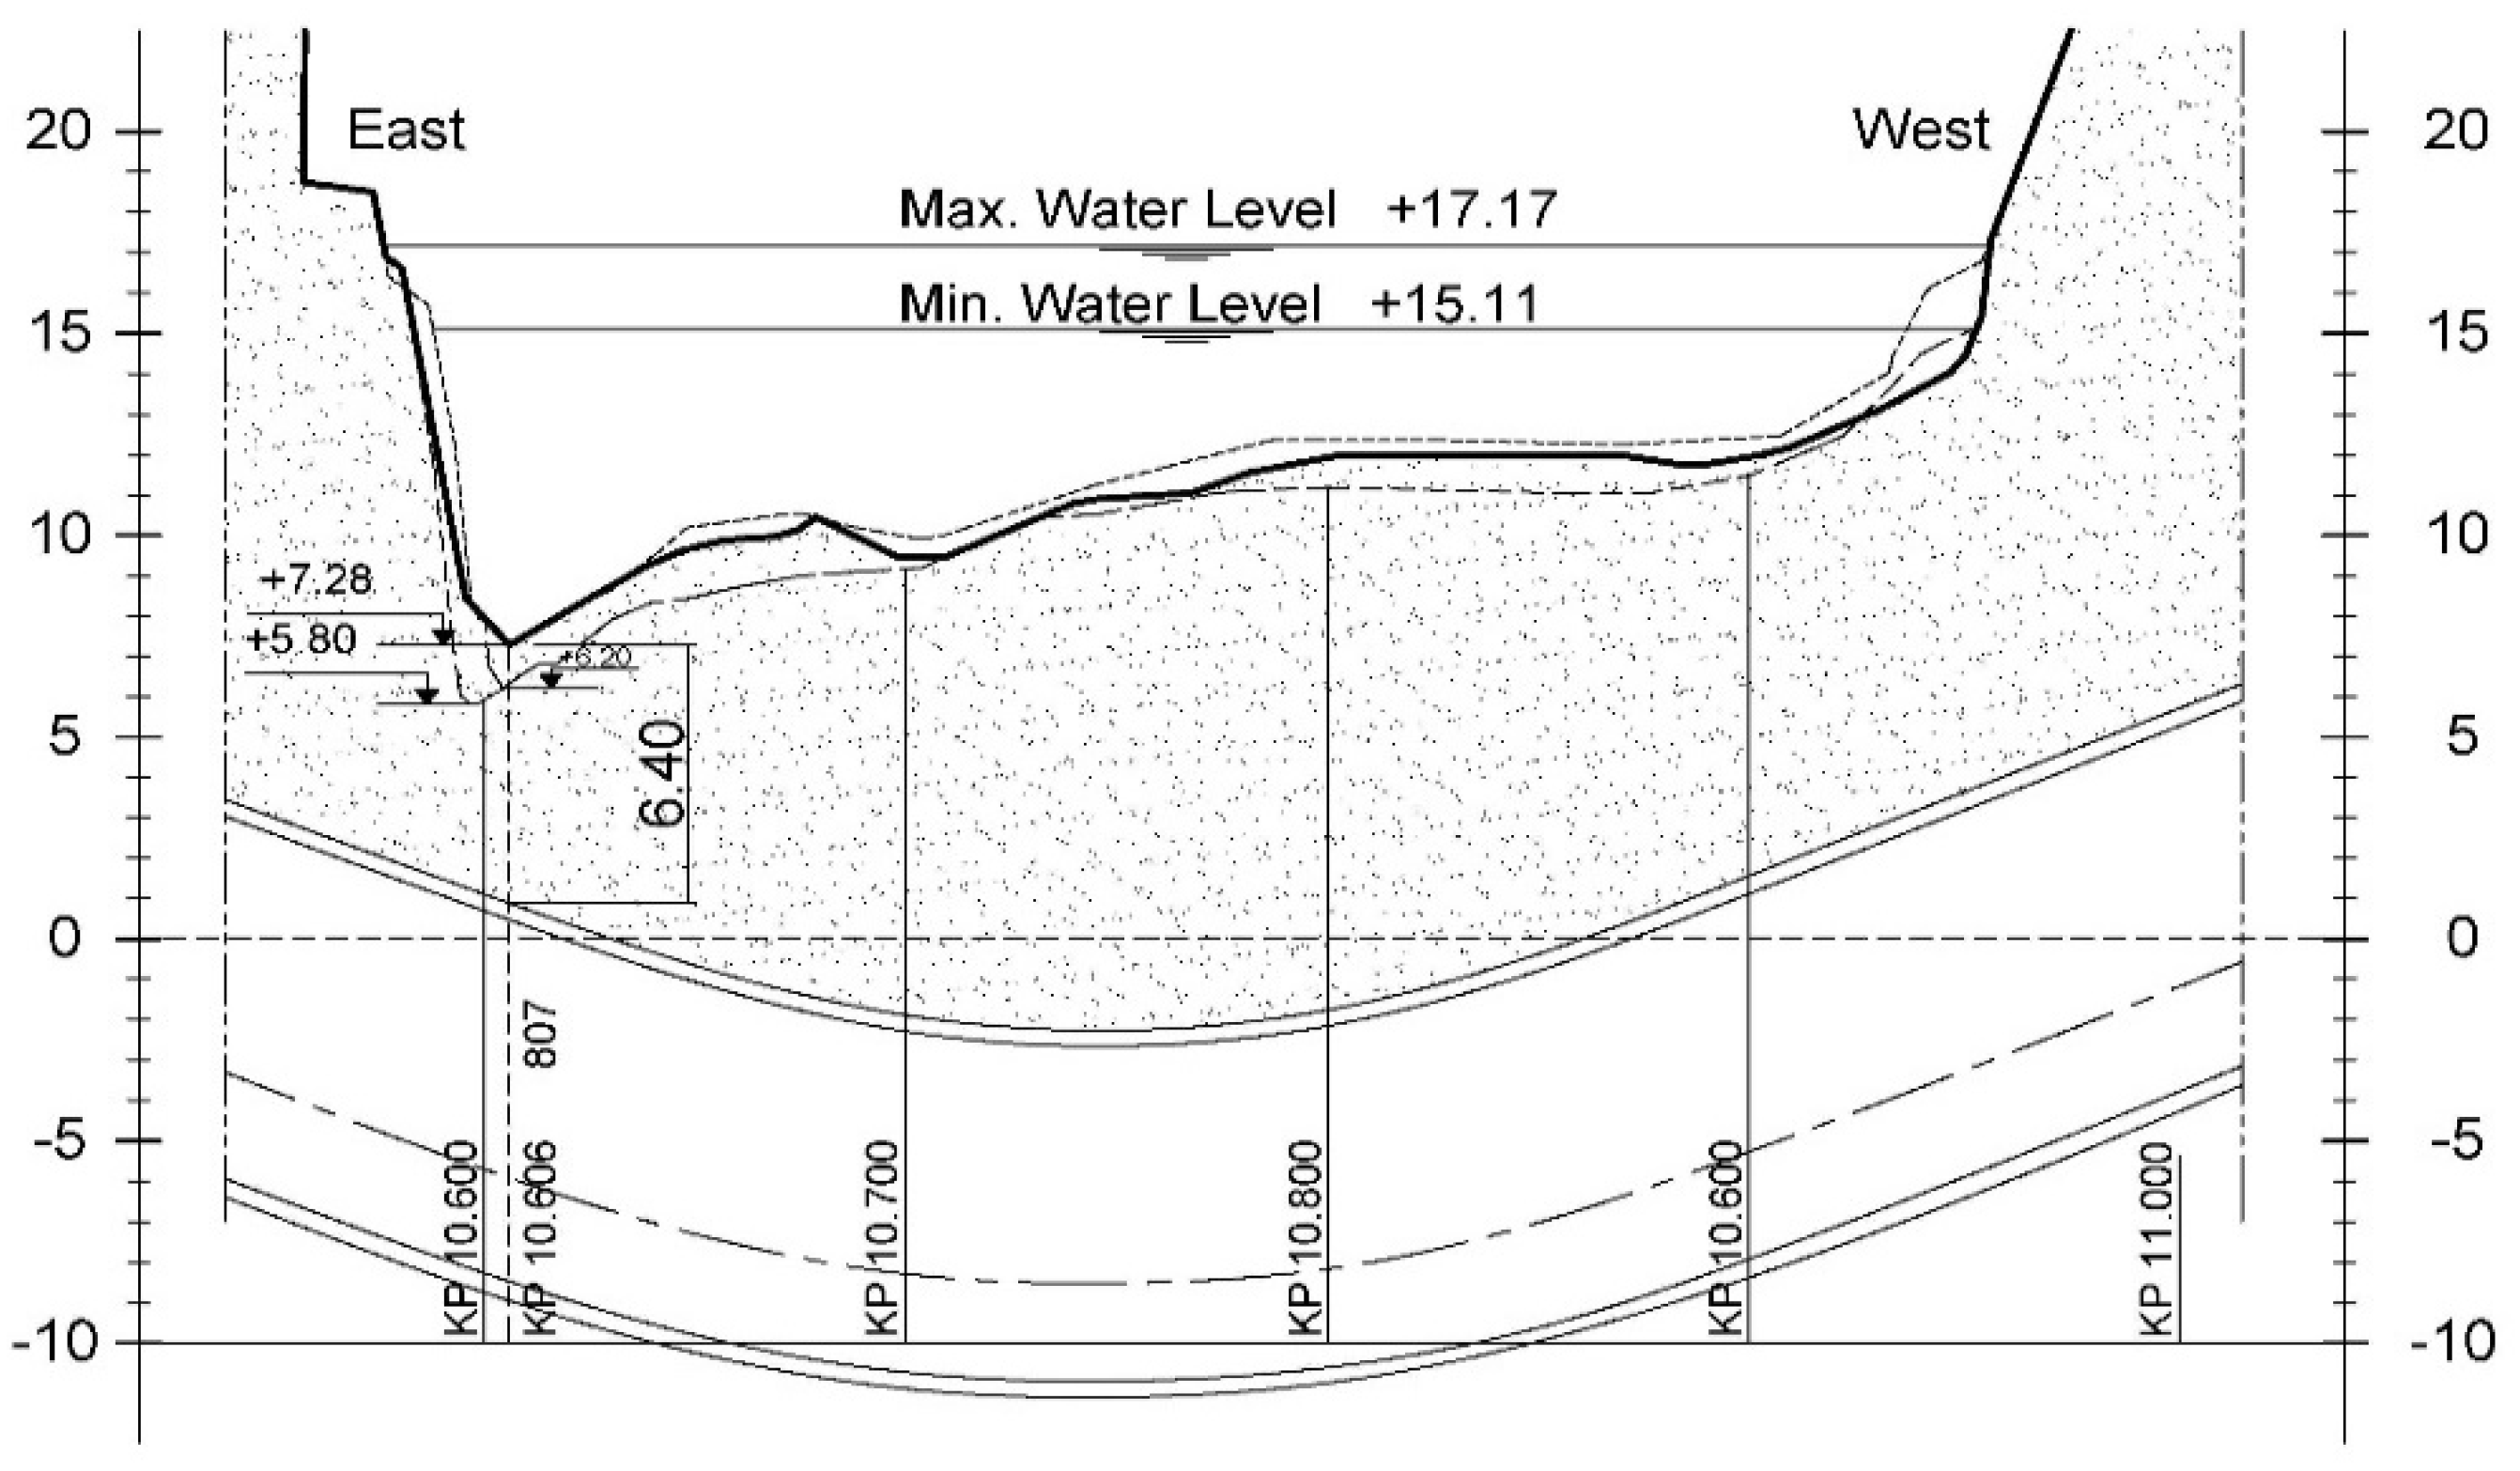
This study was conducted on the most critical section of the Line 2 tunnel under the Nile River. The only section with a cover thickness above the tunnel crown less than the minimum requirement is section K
p10.60 (
Figure 4).
3.1. Geotechnical Investigations
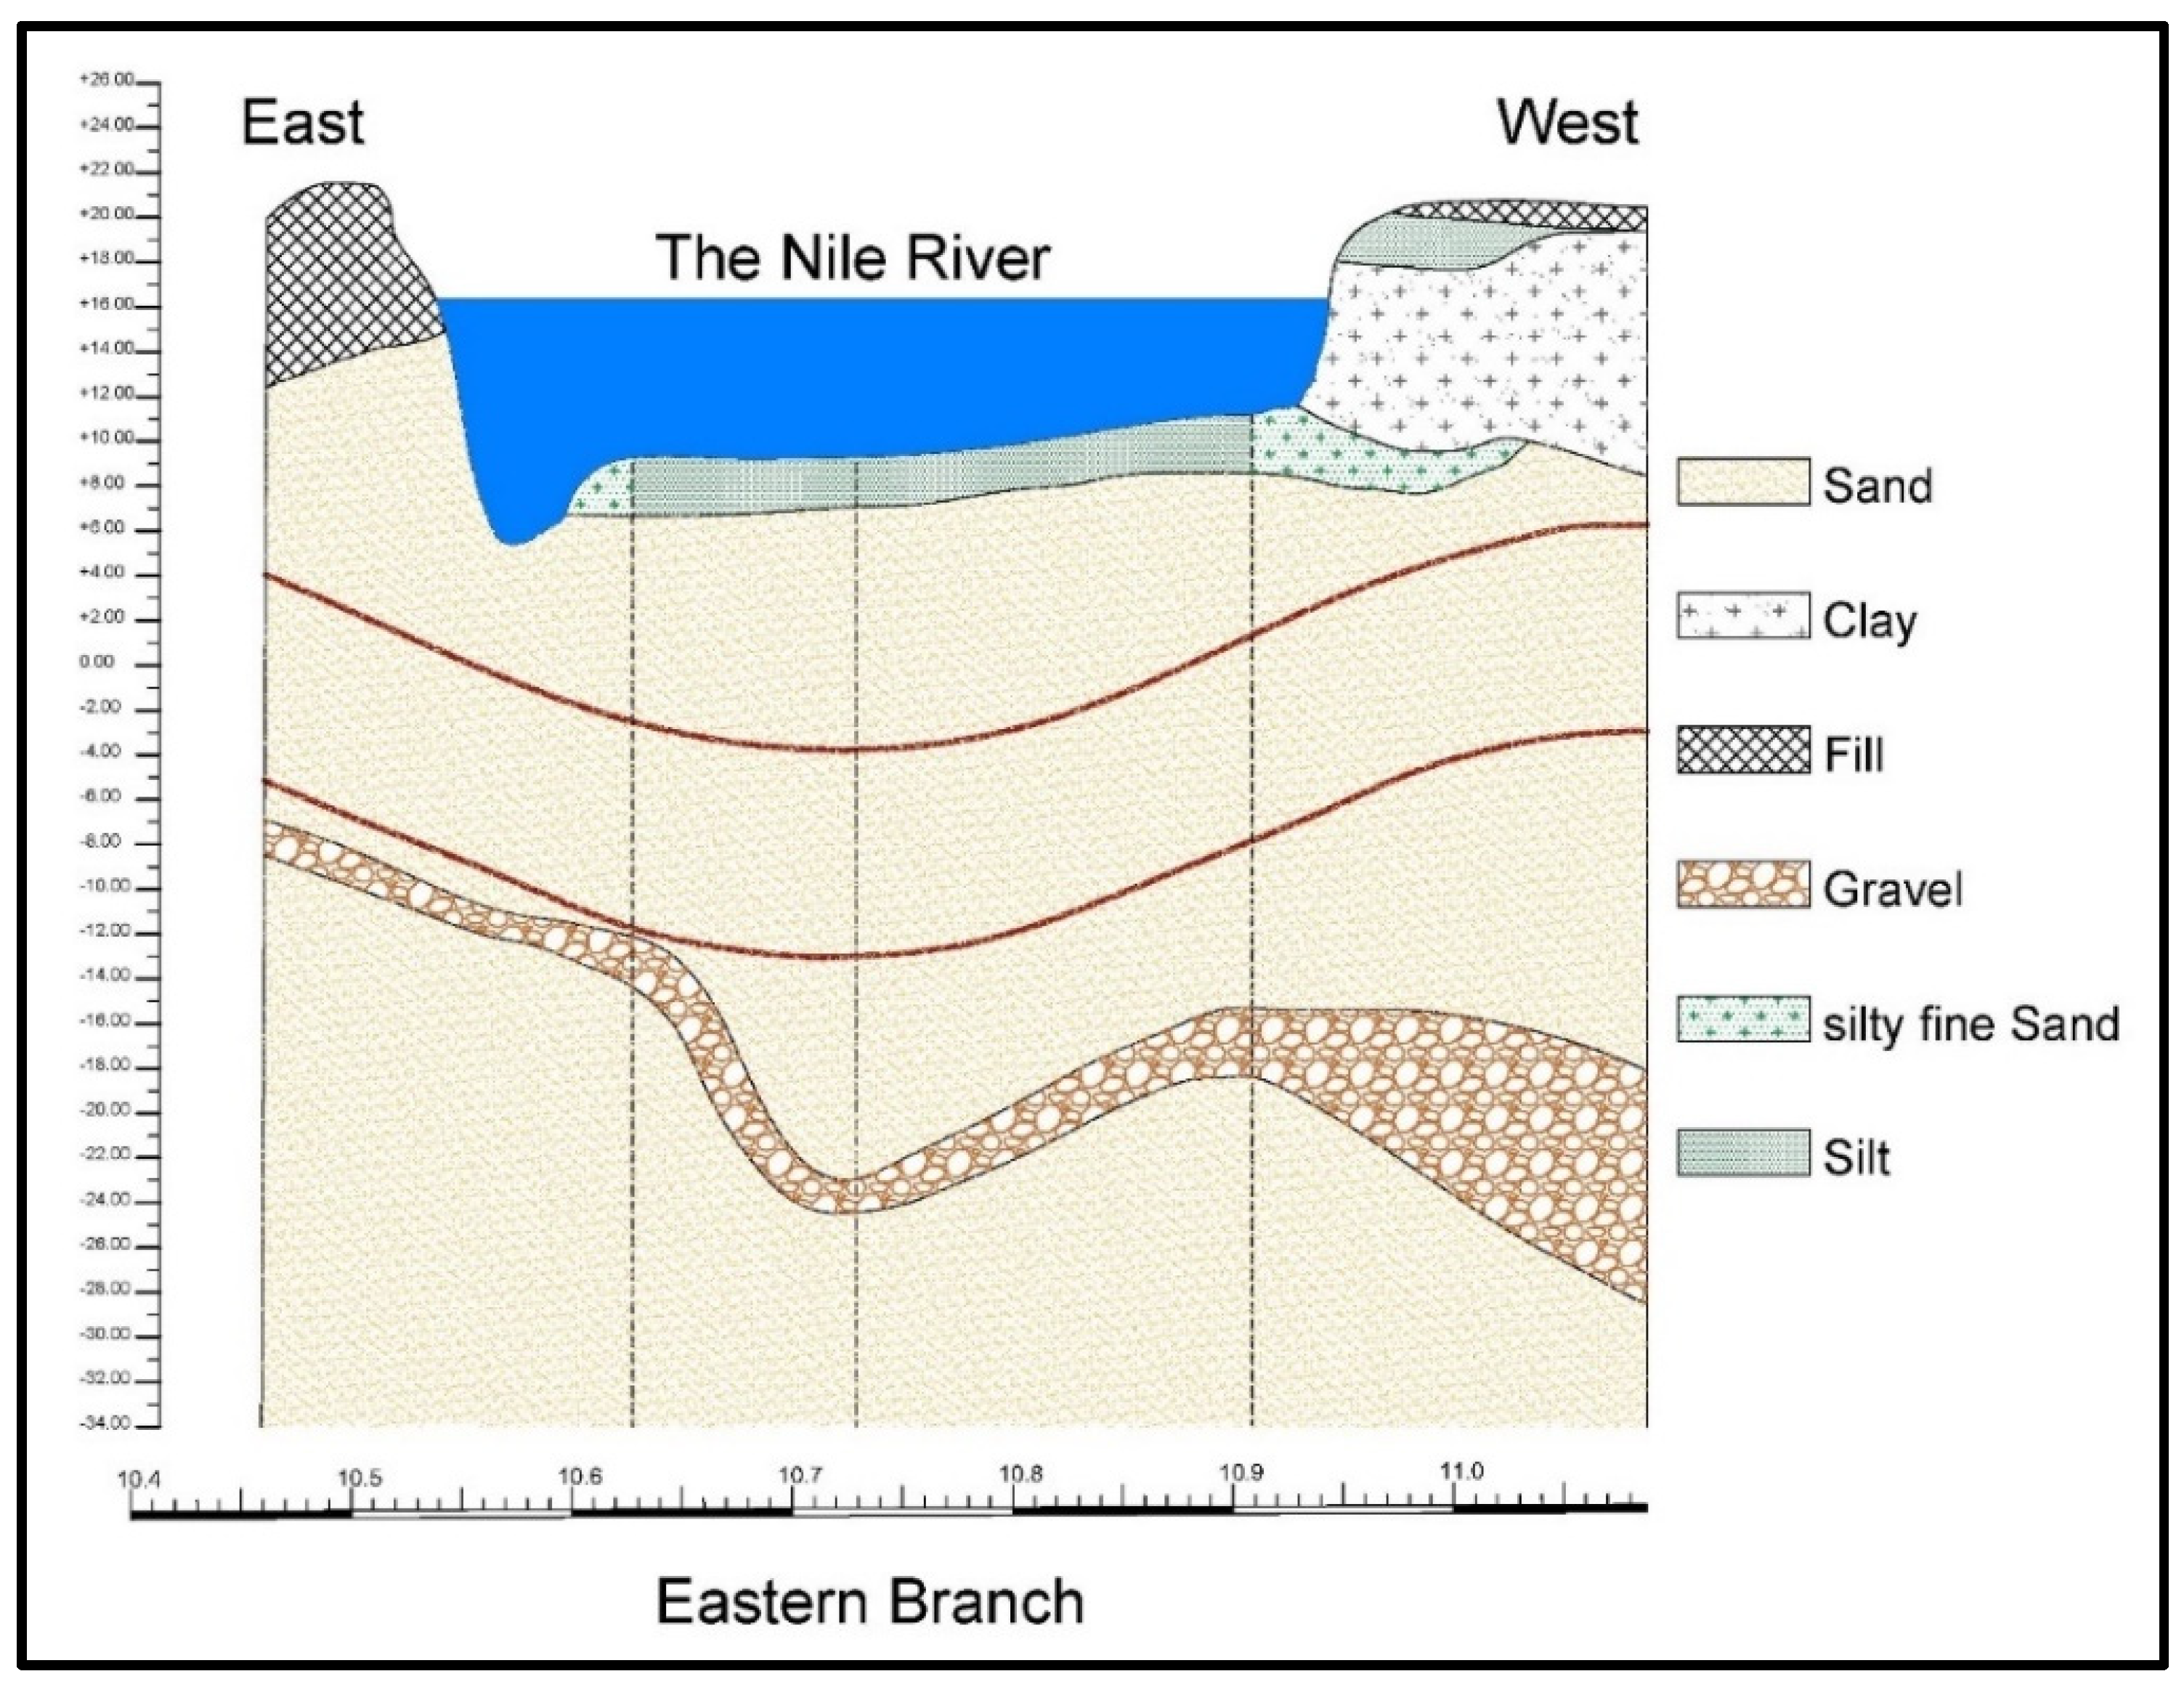
The geological condition of the site consists of a thick deposit of slightly silty sand. The soil formation becomes slightly gravelly as the depth increases from 21.00 m to 39.00 m below the Nile bed. The geological profile (
Figure 5) illustrates that the formation contains sandy gravel with a sparse cobble layer 1.5 m to 6.5 m thick. Thin layers of silty clay (0.2 m to 0.5 m thick) also occur at different depths. The sandy soil formation can be divided into three main layers concerning the variability of soil properties with depth (
Figure 5).
3.2. Bathymetric Survey
A bathymetric survey was essential to estimate the scour risk during the service stage regarding floatability. Before tunnel construction, a long-term sediment transport hydraulic study for the zone which the tunnel crossing. The design river discharge is 605 × 10
6 m
3/day, with a division of 75% in the east branch and 25% in the west branch. On the east branch, scours are due to the upstream bridge (
Figure 6). In the context of substantive flood events, scours up to 3.00 m under the actual bed can occur, which will be referred to later as the exceptional case. At the location of Metro Line 2, the influence of the bridge is noticeable [
45,
46,
47].
3.3. General Stability of the Tunnel
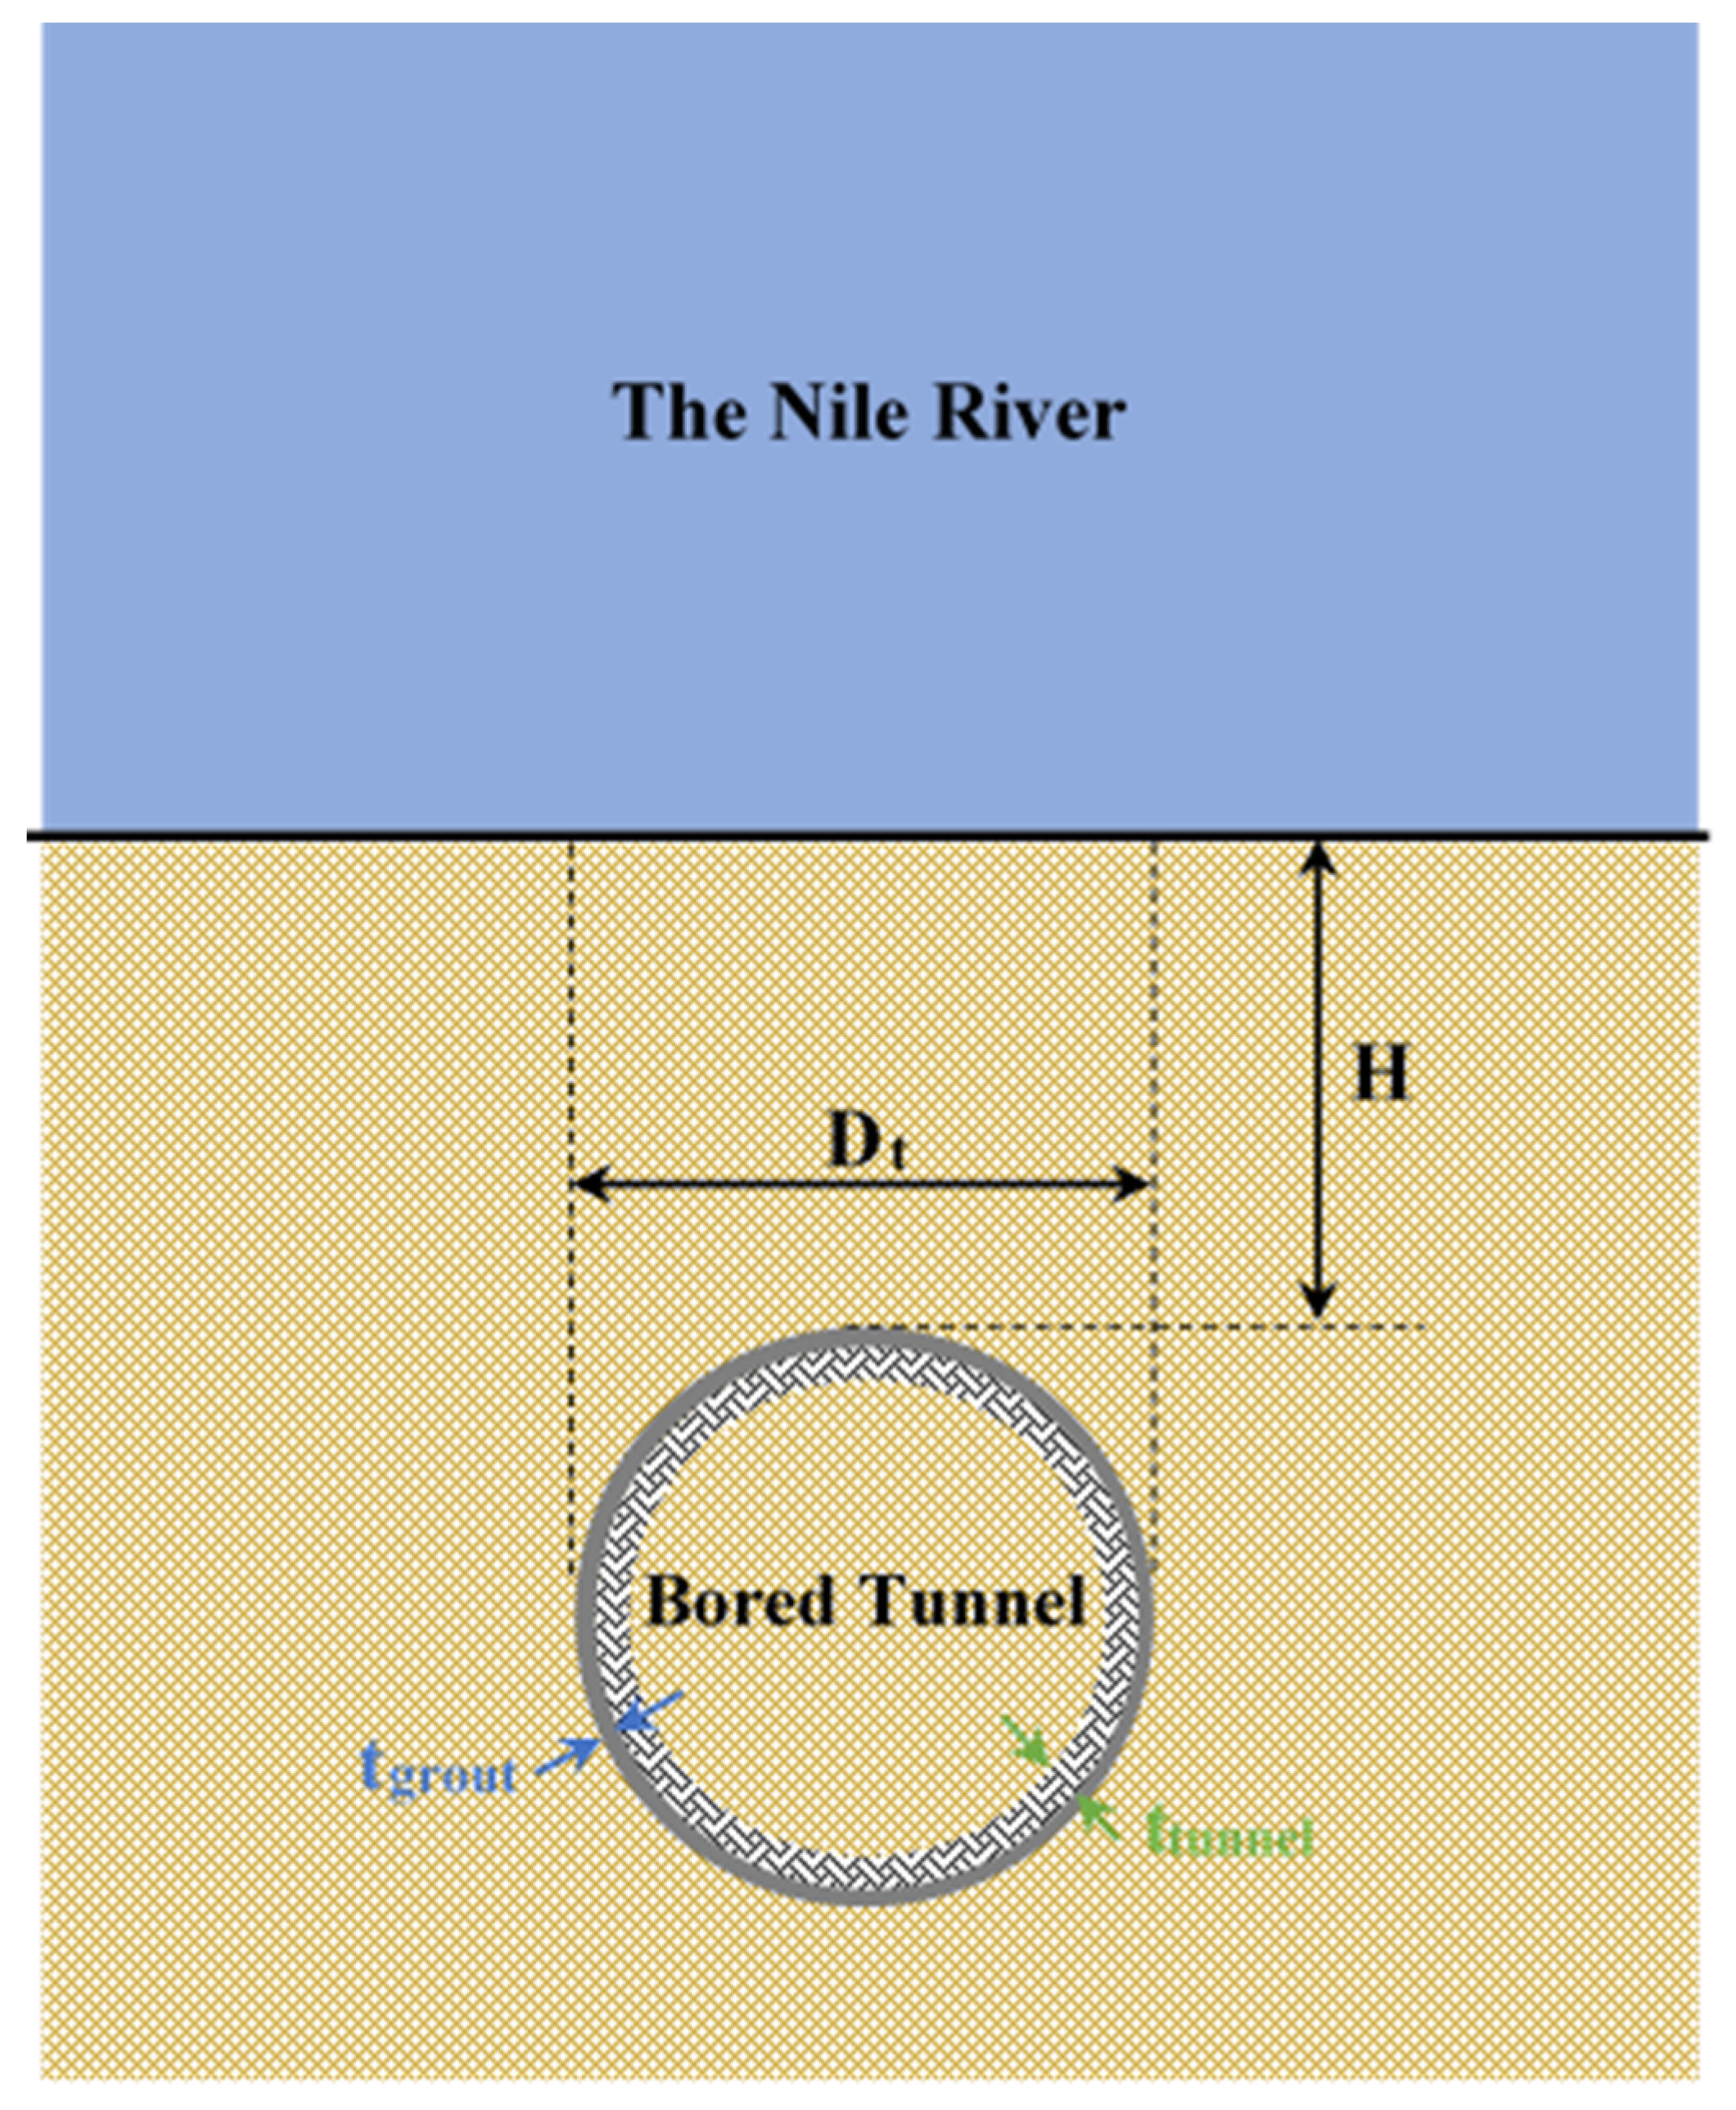
The general stability condition is fulfilled when downward forces are greater than upward buoyancy forces. Therefore, the safety factor is given by the ratio between the downward and upward forces, which should not be less than 1.50 for construction and service stability, but 1.30 for the exceptional case where erosion of the cover is assumed to occur.
The shield-driven bored tunnel consists of a segmental lining with an external ring diameter of 9.15 m, a lining thickness of 0.40 m, and a specific weight of 25.00 kN/m3.
Figure 7 shows that
H is the cover thickness of the soil above the tunnel crown with parameters as follows: bulk unit weight is 19.00 kN/m
3, frictional angle is 37°, and cohesion is zero.
To satisfy the general stability condition, three stages during construction and one case during service are necessary, as per
Figure 8.
For the middle term case,
For the exceptional case,
where
Fu is the upward (uplift) force,
Fr is the downward (resistance) force,
o.ws is the weight of the TBM,
o.wt is the weight of the tunnel,
o.wfilling is the weight of the filling,
rs is the external radius of the TBM,
rt is the external radius of the tunnel,
Ds is the external diameter of the TBM,
Dt is the external diameter of the tunnel,
H is the thickness of the soil above the tunnel,
ρs is the slurry-specific weight of the TBM,
ρt is the concrete specific weight of the tunnel, and
ρsub is the submerged density of soil.
The minimal allowable cover thickness has to be the greatest of all the above cases, as calculated in
Table 1, so
H = 8.16 m. This condition is fulfilled in all the sections along the tunnel route except near section K
p10.600, where the actual
H is about 5.60 m (
Figure 4). This section is critical and backfilling of the Nile bed is required at this location. The stability should be checked, considering the addition of the backfilling of the depression.
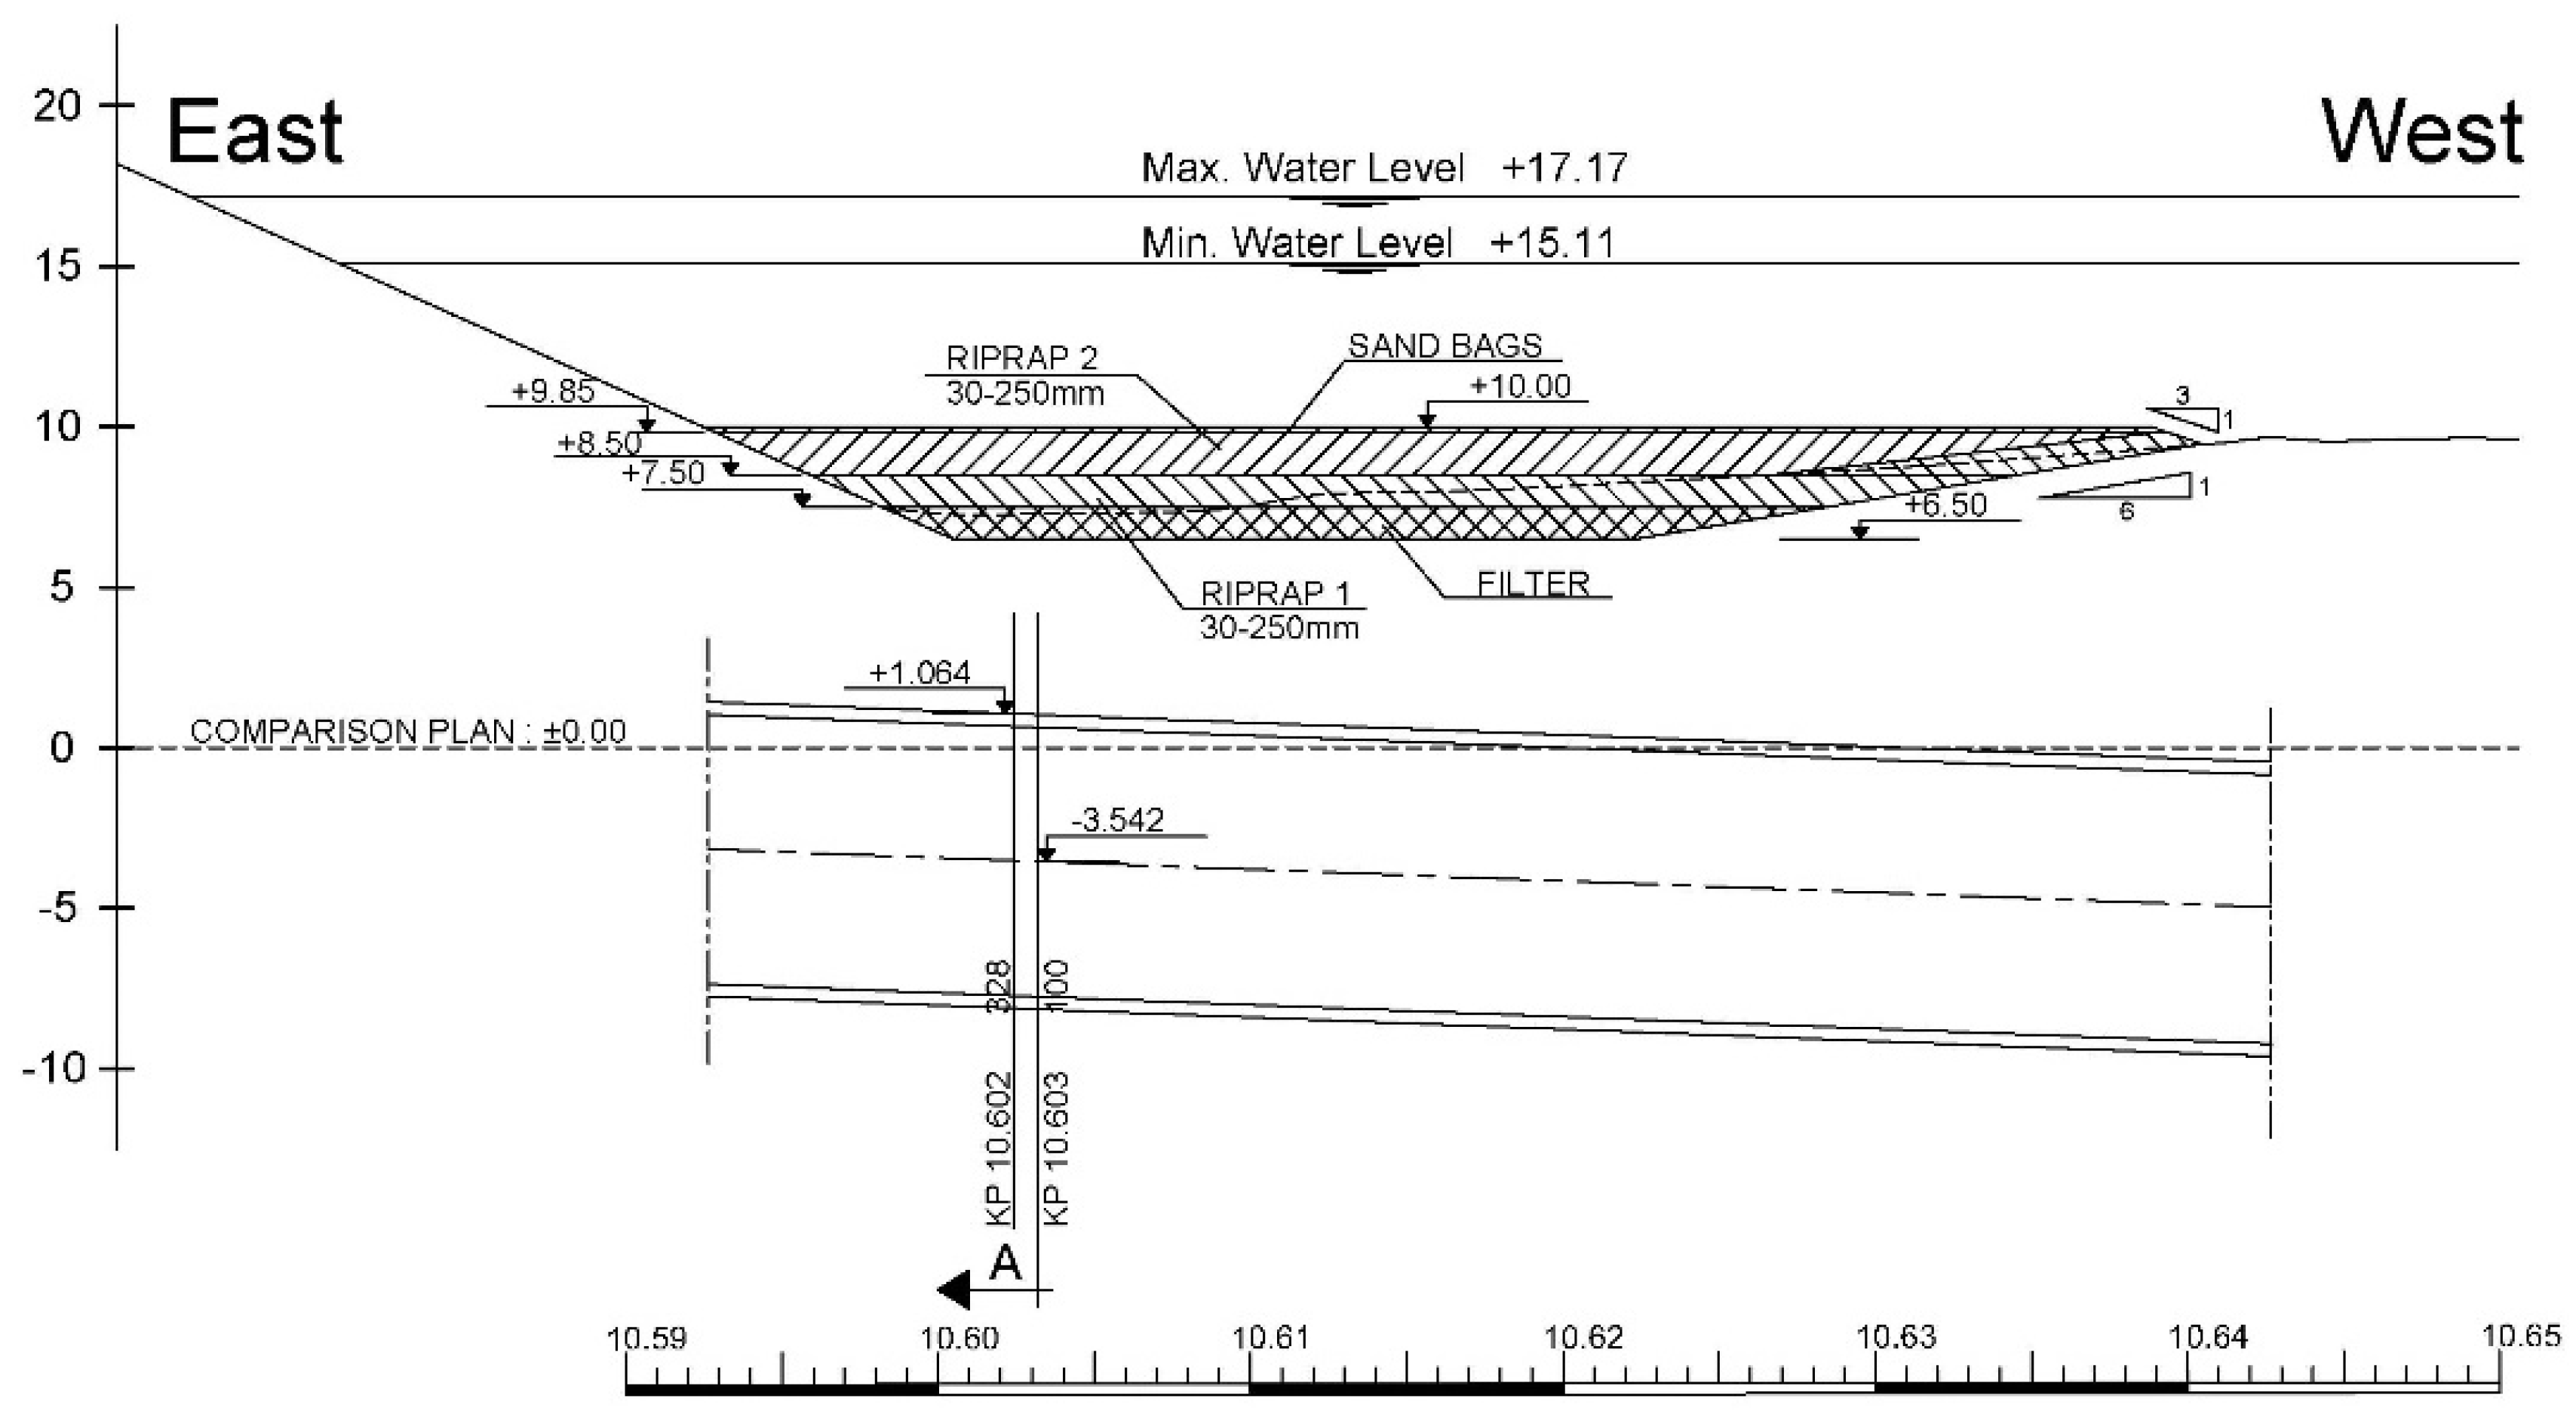
3.4. Stability of Backfilling
Protection of the bed is necessary to prevent scours. Backfilling was required, which included riprap and filters (
Figure 9 and
Figure 10). The protection concept should ensure a sufficient cover for the tunnel, resist flowing velocities, avoid washing the sand bedding by the flow, and not generate currents that will lead to new scourings, especially beside the protected area.
Many empirical relationships have been developed for sizing riprap. Here, the California Division of Highways [
48] study was used for sizing the riprap, as per Equation (9).
where
U is the mean velocity,
Ss is the specific weight of the riprap,
D50 is the median size of the riprap, and
g is gravity acceleration.
The backfilling can be considered according to three stages. During the construction, the filter proposed should be gravel from 1 mm to 50 mm with submerged density 8.00 kN/m3 and thickness 1.00 m; riprap should be enrockments from 30 to 250 mm with submerged density 8.00 kN/m3 and thickness 2.50 m. At the next stage, the top 1.50 m of riprap should be removed. Finally, there is a temporary backfilling level (+10.00), with the weight of backfilling 28.00 kN/m2, and final backfilling level (+8.50), with the weight of backfilling 12.00 kN/m2.
The checking of the most critical section with backfilling protection follows the same procedure used to calculate the minimal cover thickness with an additional load of backfilling and takes
H = 5.5 m, as shown in
Table 2.
4. Numerical Modeling
The principal aim in this section was to present 3D numerical analyses, based on the F.E. technique, for the prediction and mitigation of the impact of minimum cover thickness for the Nile crossing tunnel. The numerical modeling was developed to simulate soil–tunnel interactions using the commercial 3D F.E. program Midas/GTS NX [
49].
4.1. Model Establishment
The tunnel embedded in the soil has an excavation diameter equal to 9.15 m and a lining thickness of 400 mm with a segment width of 1.5 m. As the thickness of segments is not constant due to the longitudinal joints of the segments constituting the rings of the tunnel, a reduction in flexural stiffness of the lining should be taken into consideration, based on Muir Wood [
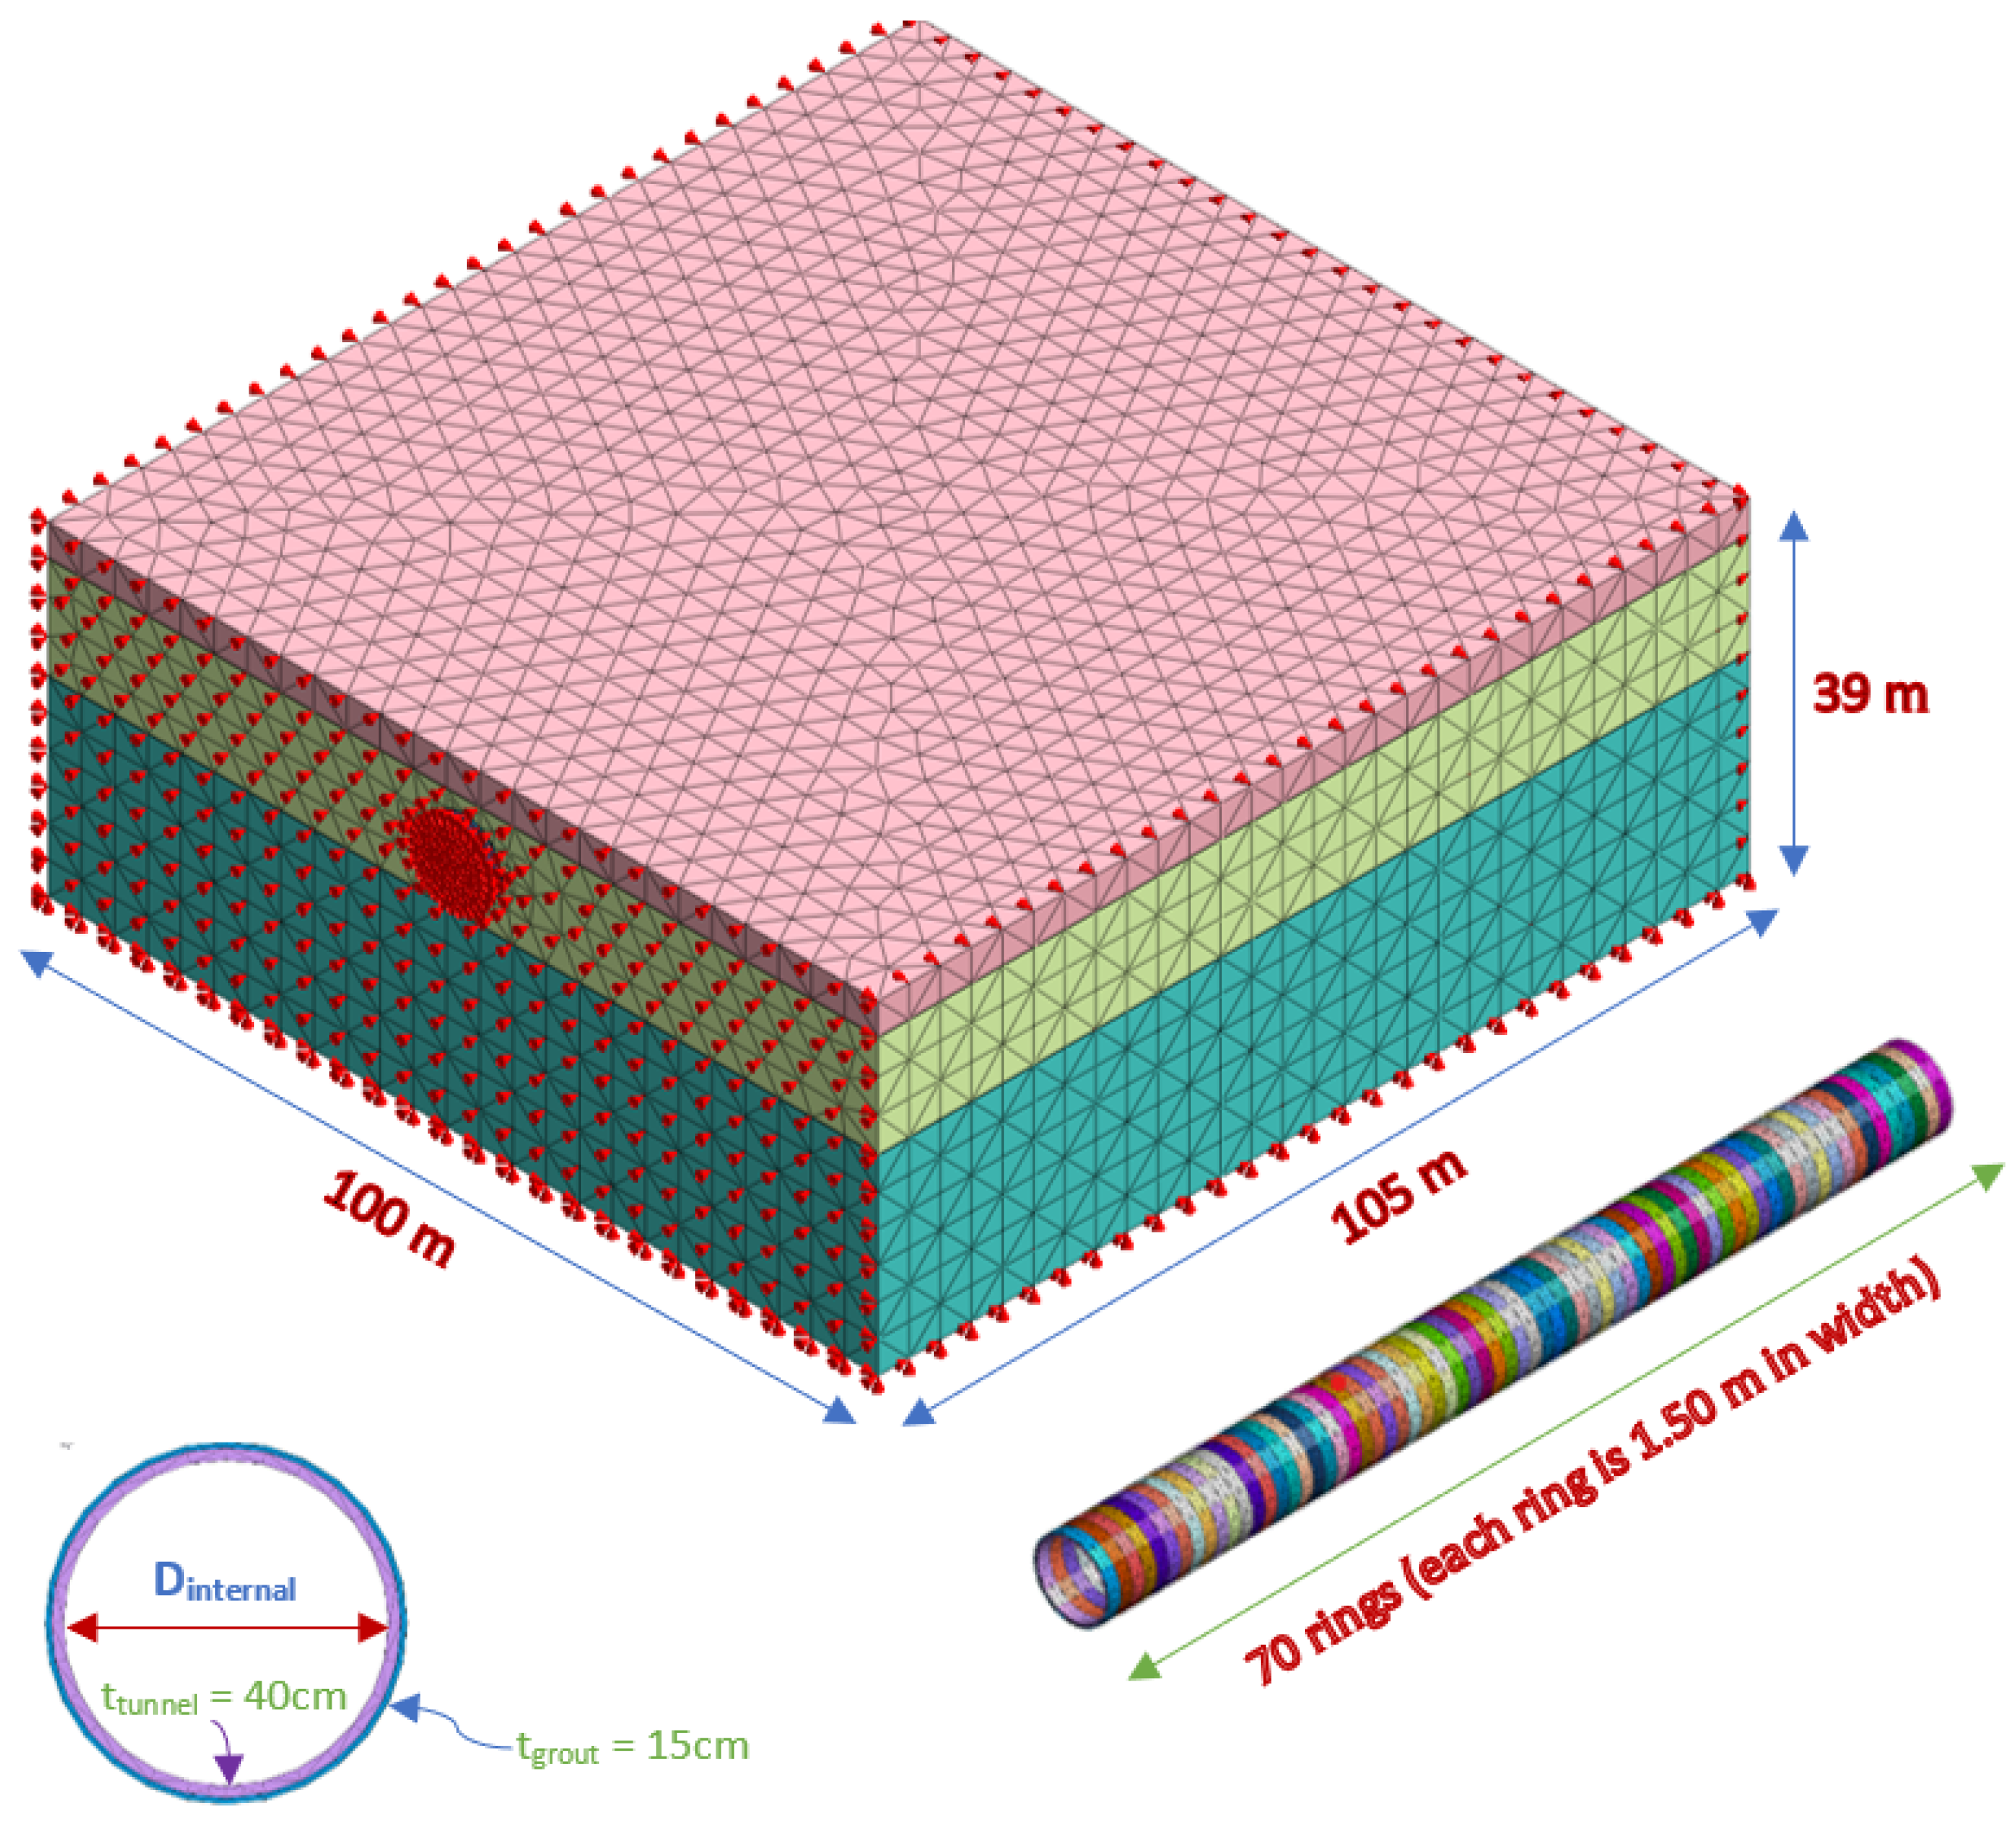
50]. Thus, after calculating the Muir Wood reduction ratio and the equivalent lining section thickness, the tunnel lining was modeled as continuous with a reduced thickness of 0.32 m. The dimensions of the overall model in
x,
y, and
z directions are 100.00 × 105.00 × 39.00 m (
Figure 11). The burial depth (H) is assumed to be 5.50 m from the Nile bed. The water height is 10.00 m over the bed level.
The thickness of the grout coating was assumed to be 150 mm to fill the tail void of the shield machine. Solid elements were chosen for ground, tunnel, grout, and isolation. The most critical part of mesh generation is the node connection. It is between adjacent elements so that hybrid mesh is formed by combining a pyramid and tetrahedron on a hexahedron base. The ground was assumed to consist of three layers of soil. The soil behavior is described using the non-associated Mohr–Coulomb (MC) criteria. The material properties of the soil are shown in
Table 3.
The elastic properties of the concrete lining and grouting are shown in
Table 4. The grouting should have the same properties (or better) as the surrounding ground in the final state [
51].
Midas/G.T.S. N.X. is capable of automatically constraining the model [
49]. The nodal Degree of Freedom (D.O.F.) along the vertical sides of the model was constrained in the
x-direction. On the other hand, for the front and back, it was constrained in the
y-direction. Nodes located at the bottom have D.O.F.s of the
z-direction that were constrained with
y and
x directions. D.O.F.s along the ground surface were not constrained (
Figure 11).
4.2. Construction Analysis
Active/reactive elements and loads present simulations of the progressive advancement of the TBM. It reflects the change in material properties. It starts from the initial condition of the ground before the commencement of any construction events. The analytical results from the previous stage are accumulated and reanalyzed.
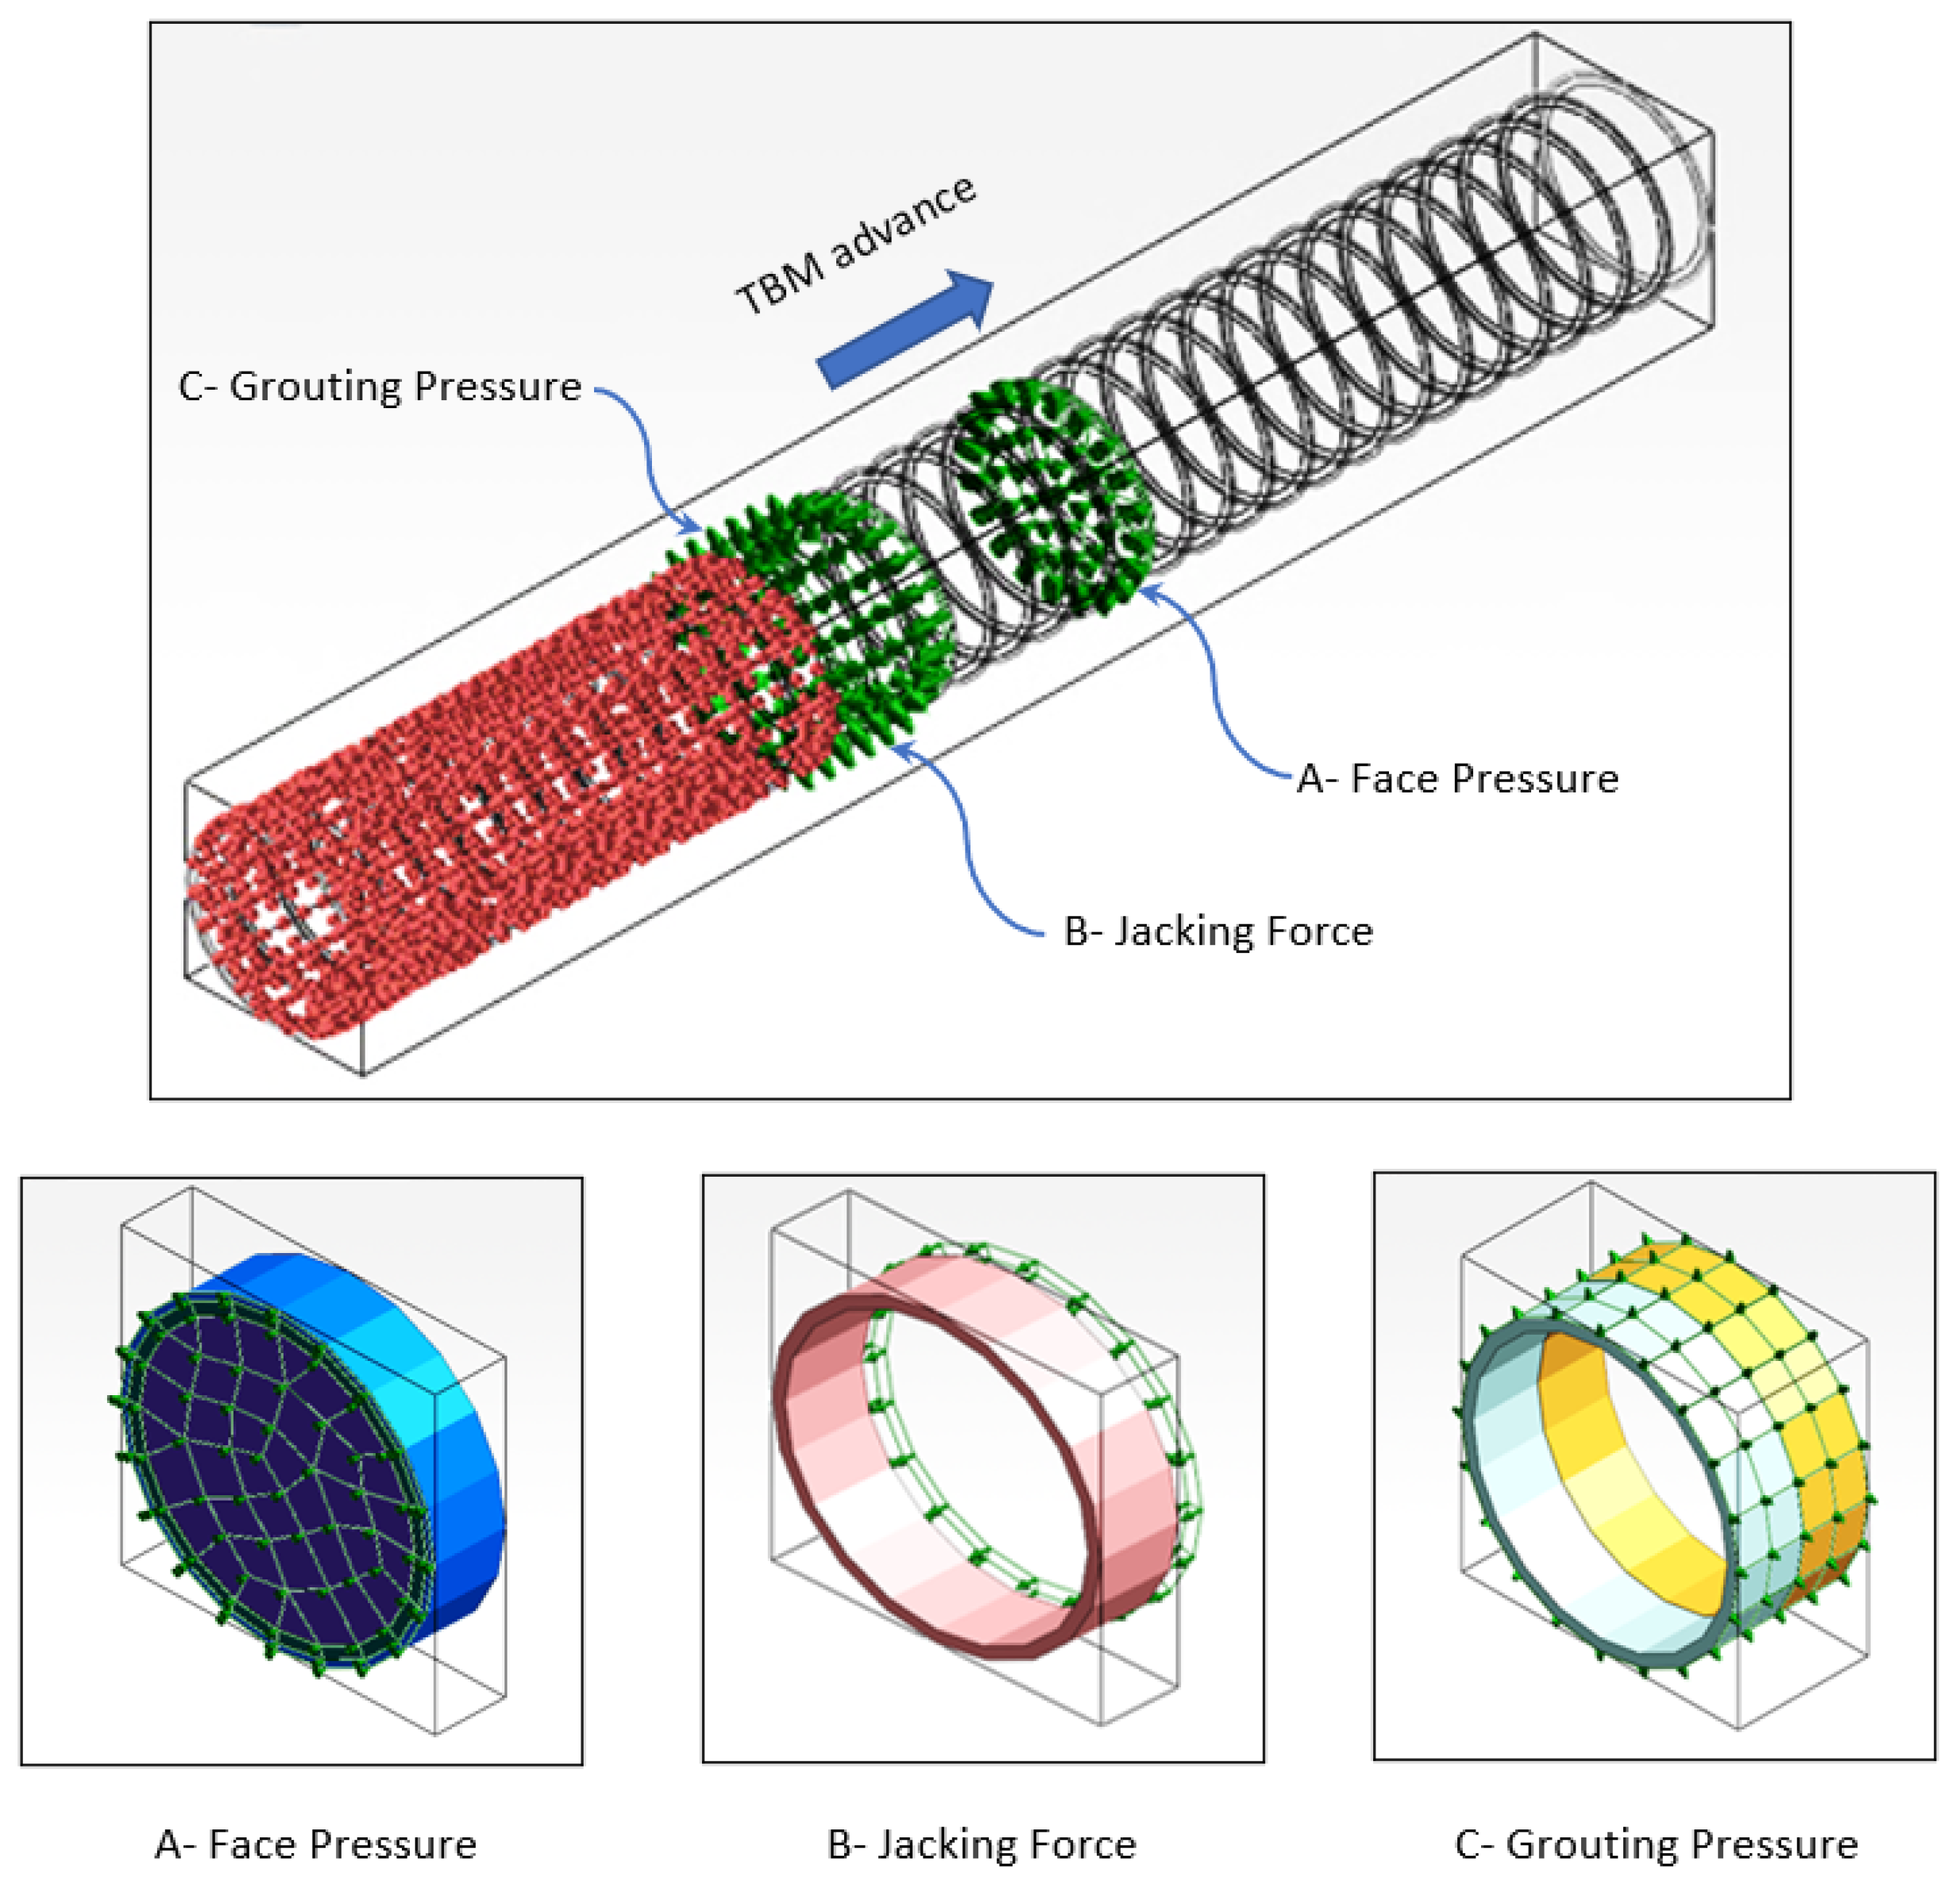
4.3. Construction Loads
The main construction loads applied in this study (
Figure 12;
Table 5) were as follows:
Face pressure: Horizontal pressure applied to the face of the excavation by the slurry in the chamber of the slurry TBM, related to the vertical earth pressure and groundwater table, acts normal in the excavated soil.
Grouting pressure: Radial pressure applied by injecting the grouting material through the tail skin into the annular void (residual space between the ground and the extrados of the segments) normally acts around the tunnel toward the soil and rings of the tunnel. It is tacked as face pressure + 100 KN/m
2 [
52].
Jacking pressure: Jacking system pushes the machine to advance. It includes 30 TBM RAMs distributed by pairs on 15 pads with two pads per segment and one pad on the key segment. The jacking force = 3400 KN/pad, which can be activated on the model on the net area of the segment, which equals = π [(Dout)2 − (Dint)2]/4.
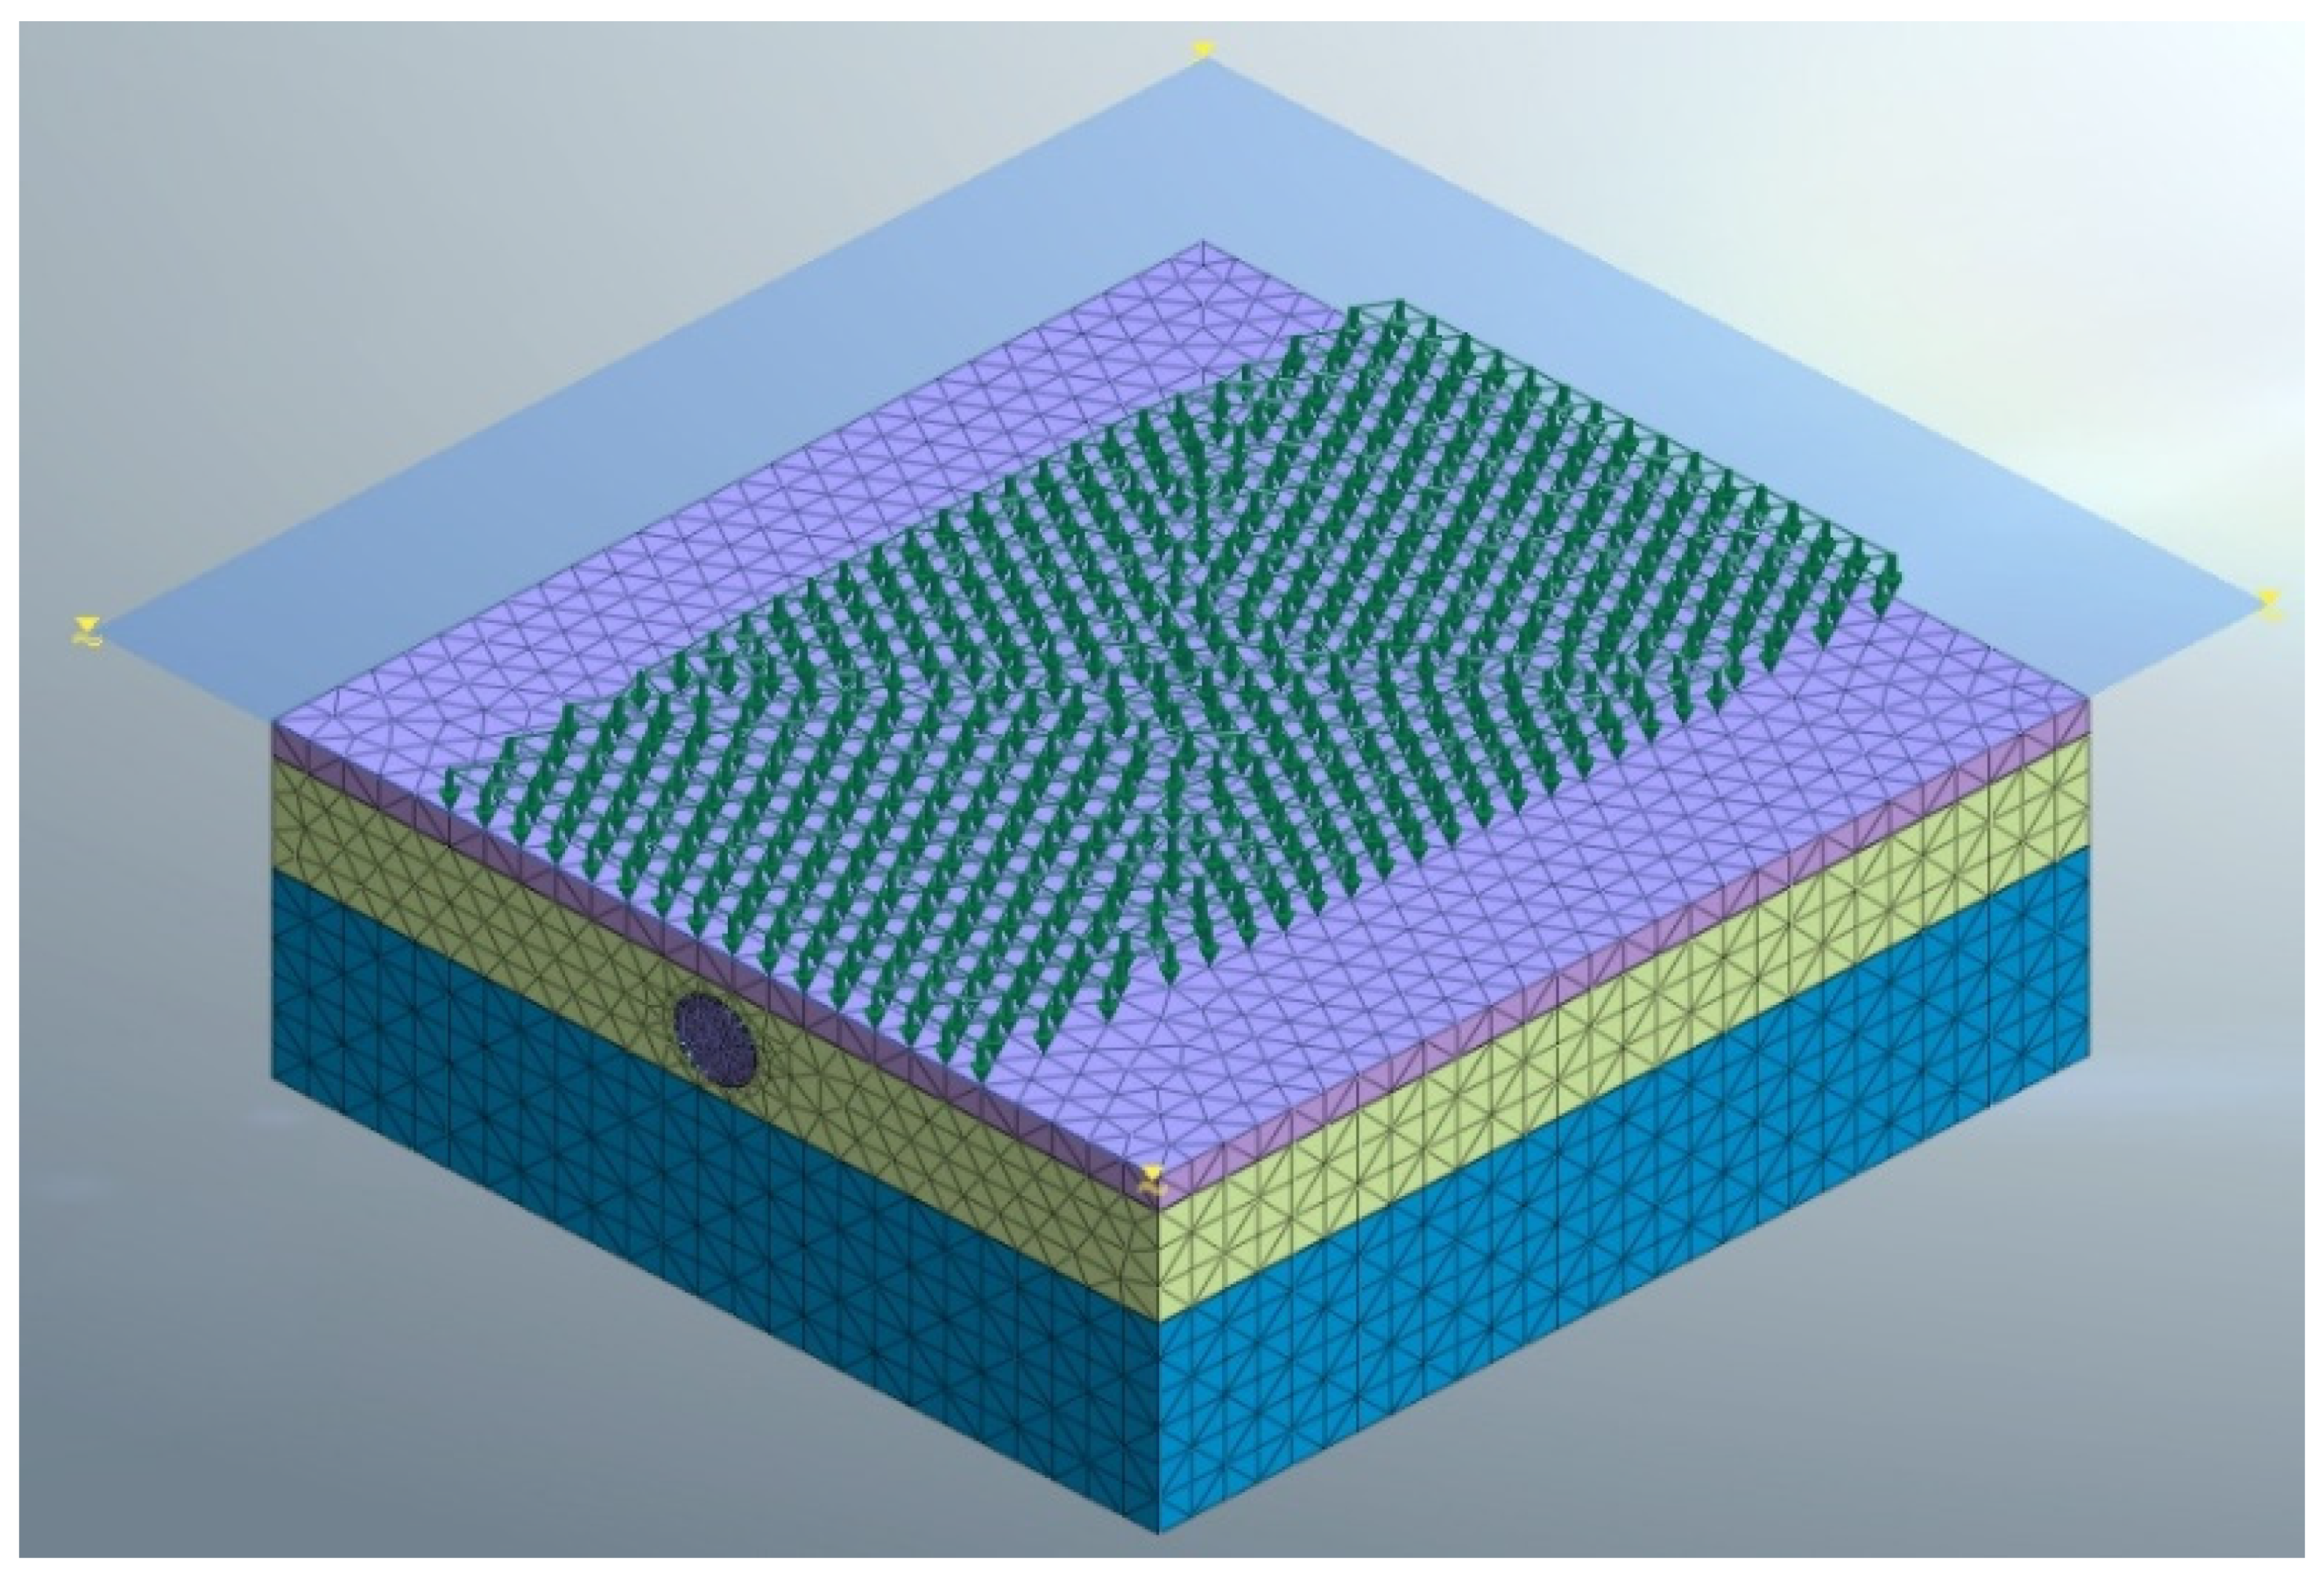
4.4. Construction Stages
A stage-by-stage analysis was employed to simulate the progress of the TBM and the tunnel construction process. The tunnel is divided into 70 rings constructed in 79 stages. The length of the shield is 10.5 m, simulated in the model as a ring with a width of 1.5 m. The face pressure is normal on the excavated soil at the shield face. The soft grout is pumped from the tail of the shield by grouting pressure towards the soil to prevent it from collapsing. The grout results in a compressive force on the segments. The jacking force rested on the tunnel segment to push the machine to advance (
Figure 13).
It is assumed that the grout hardened after two constructed rings, and the grout pressure was simulated considering the soft grout state. The Initial Stage (I.S.) simulated the initial state of stresses in the terrain before tunneling construction. In Stage
n (
Sn), the excavation of the
nth ring is simulated and replaced by the shield. With the machine progression, the tail of the shield is released from its position to the next excavated ring. In the meantime, the tunnel segments are constructed. Then, jacking is released from its position to be applied on the next. The grout pressure acts on the perimeter of the segments toward the soil and is released before the previous segments; then, the hard grout is applied to them. This stage is repeated until all segments are constructed. The main construction stages applied in the F.E. model are shown in
Table 6.
4.5. Service Analysis
Service analysis includes long-term and exceptional cases. The tunnel is completed and filled with concrete, undertaken using the long-term concrete modulus since dimensioning actions are static and of long duration. Filling concrete is plain concrete used for the trackbed invert; a specific weight of 22.00 kN/m2 was considered and used in the model as a normal load acting on the internal mesh element of the tunnel. The exceptional case corresponds to recommendations of the Nile Research Institute to consider a 3.00-m scour design value for emergency discharge of the Nile River (N.R.I. 1997).
4.6. Backfilling
A local backfilling of the main branch bed was foreseen to ensure a sufficient covering for the shield-bored tunnel. Riprap and gravel filters can be modeled as an average weight on the riverbed with 60 m width (
Figure 14). For the short term, the weight of backfilling is 28.00 kN/m
2. For the long-term and exceptional case, the weight of backfilling is 12.00 kN/m
2.
4.7. Model Development
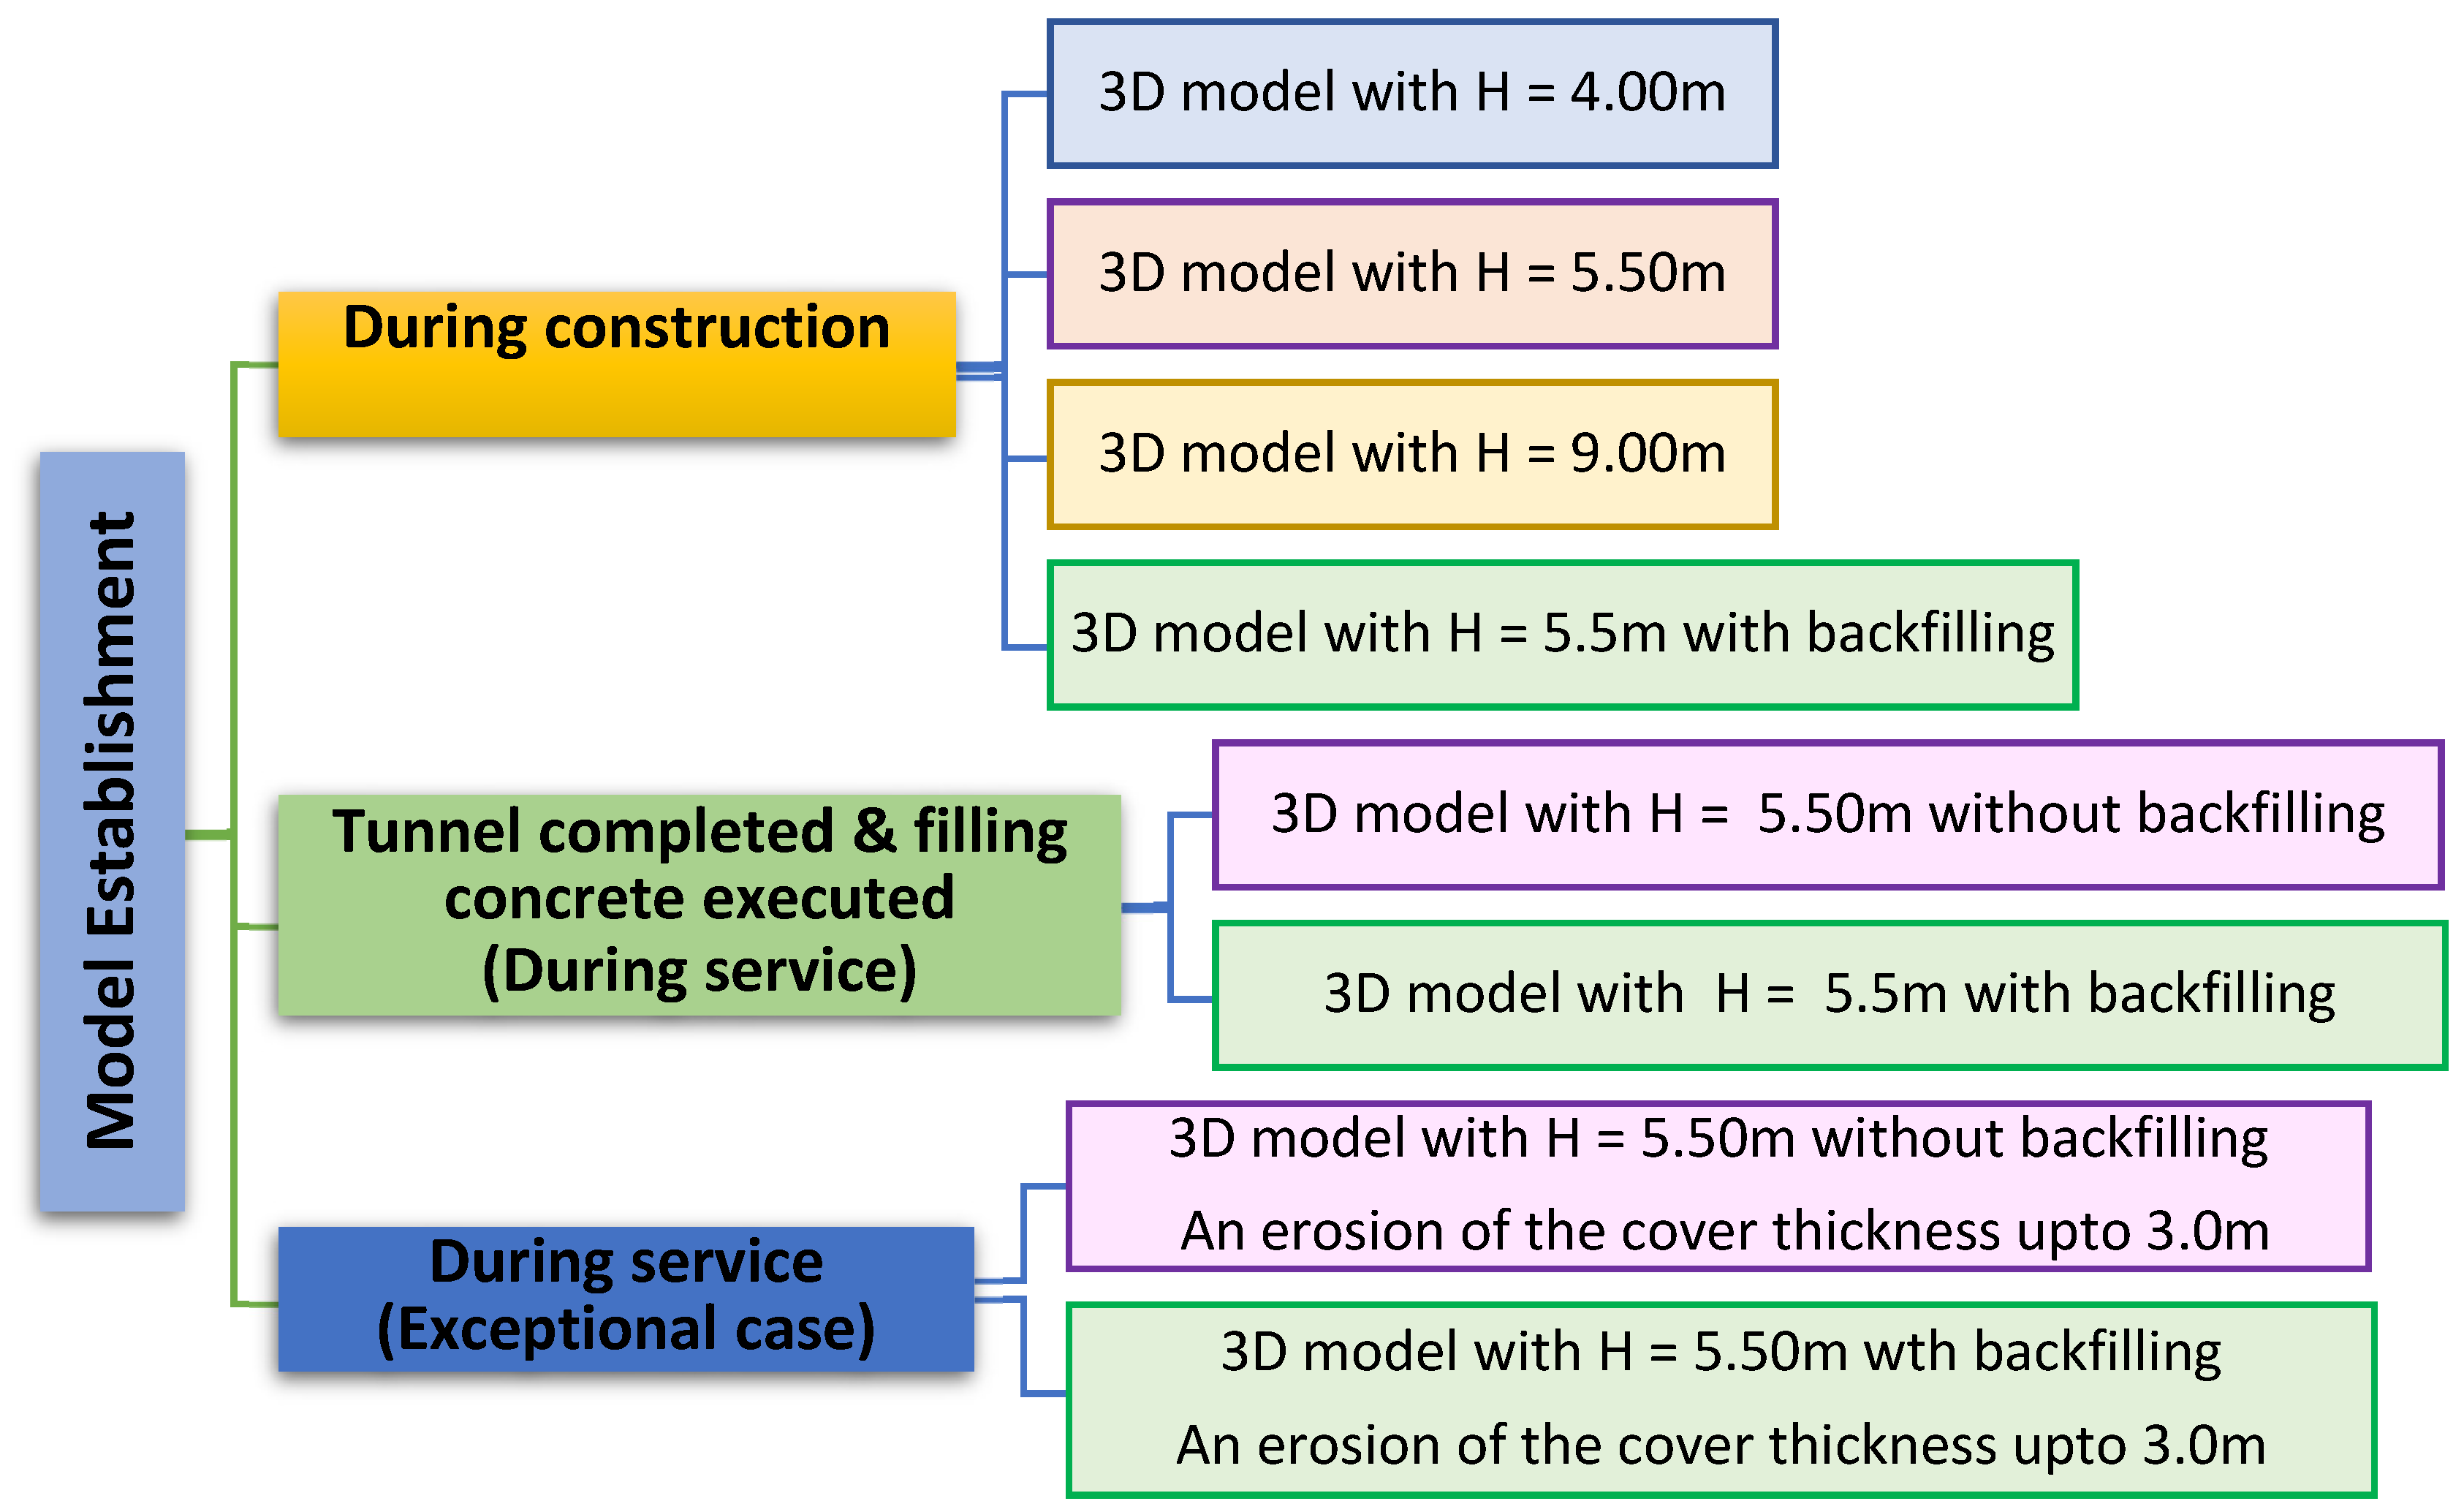
The 3D model calculations were processed with Midas/G.T.S. NX, the interaction between soil and lining, was modeled in successive stages.
In checking the stability of the tunnel, the cover thickness is the essential factor to consider. An estimation of the deformation of the tunnel rings and surrounding soil was the main objective of this study. Eight numerical models were considered for checking the stability of the tunnel under the Nile.
The critical section was based on a case study of Greater Cairo Metro Line 2, which has a cover thickness of 5.50 m checked with three models without backfilling and three further models with backfilling at construction, service stage, and exceptional case. Two additional models with a cover thickness less and more significant than the critical section were also considered to compare the effect of cover thickness. The study program is shown in
Figure 15. Nonlinear analysis was used for the service stage and exceptional case models.
5. Results and Discussion
An interpretation of the 3D F.E. analysis results regarding the ground and tunnel lining responses to tunneling was described. Based on the interpretation of the results, the determination of the reasonable minimum cover thickness for the considered underwater shield tunnel case history was discussed.
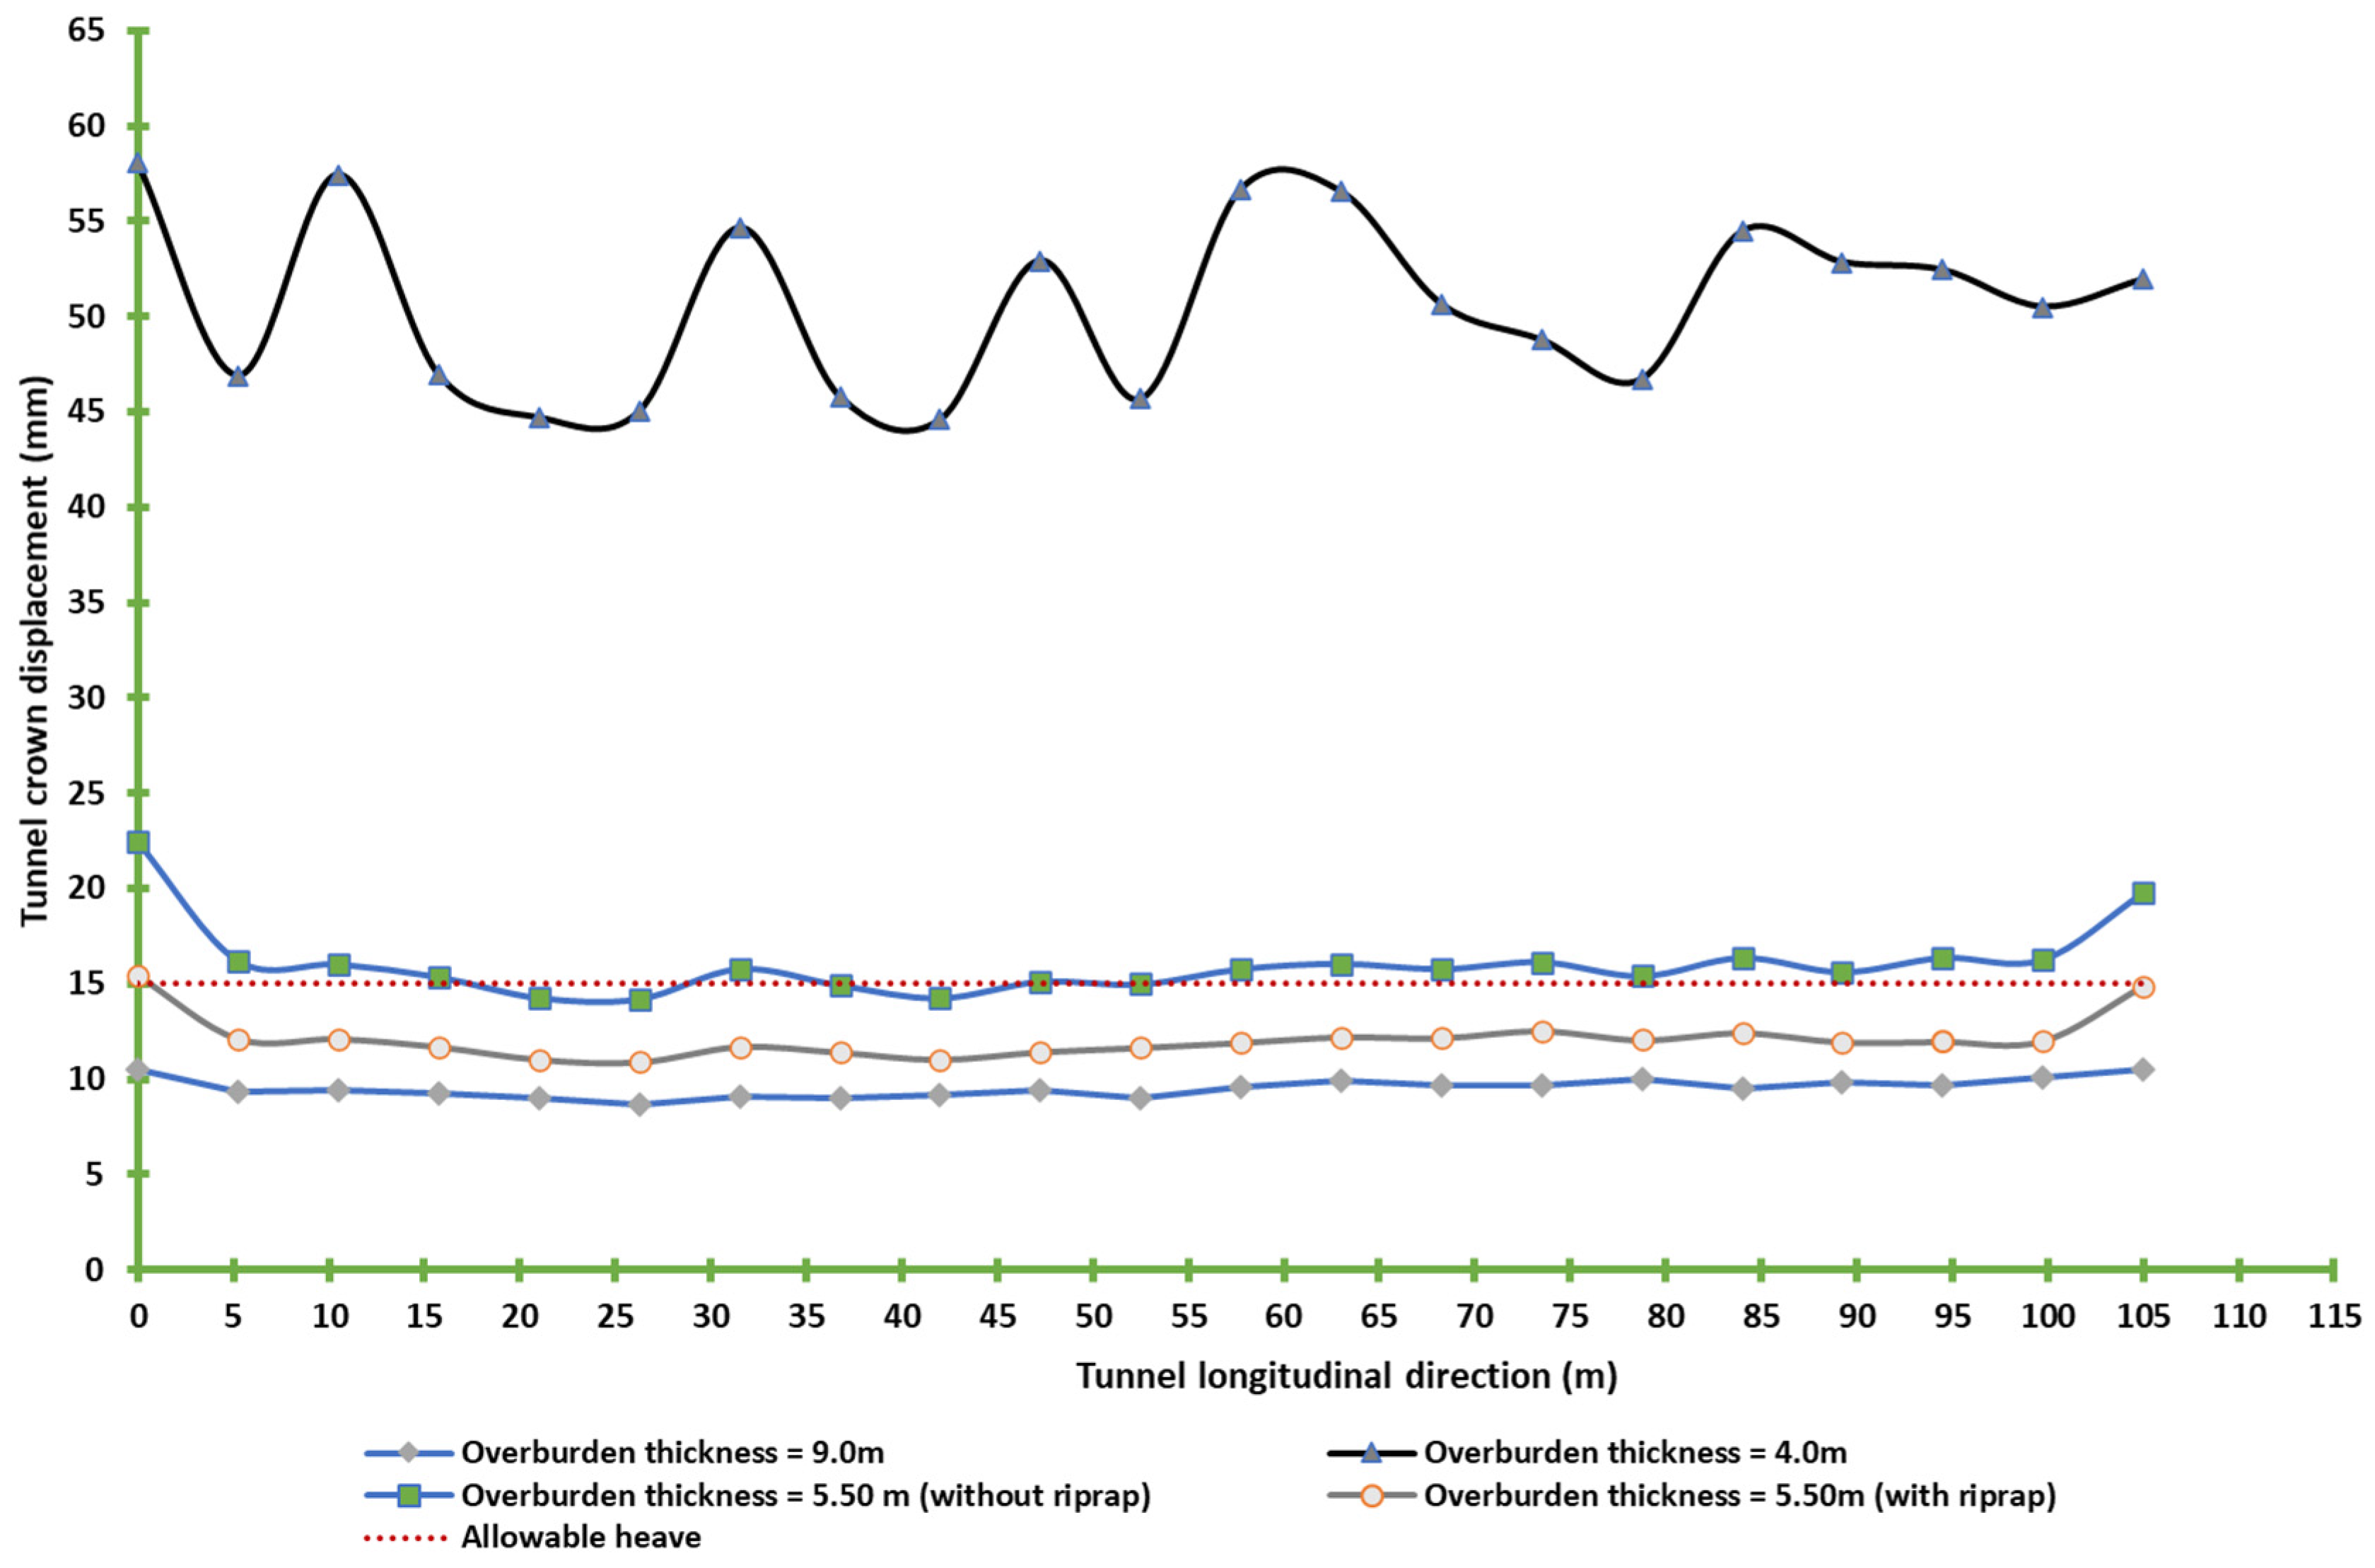
The vertical displacement at the crown of the tunnel during different stages of the tunnel construction and in-service case were studied. For the construction stage, the 3D analysis results (
Figure 16) showed that the maximum crown vertical displacement values were about 58.00 mm and 10.52 for cover thickness 4.00 m (half-tunnel diameter) and 9.0 m (tunnel diameter), respectively. When the cover thickness changes from a half-tunnel diameter to approximately one diameter ahead of the tunnel face, the crown vertical displacement value decreases by a ratio of 80%.
Two models with/without riprap conducted analyses. If the cover thickness is less than the theoretical calculation, this is called a critical section. The critical section has a 5.50-m cover thickness. For the construction stage, in the model with riprap, the maximum heave equals 15.45 mm, but for the model without riprap, the heave is equal to 22.45 mm, as shown in
Figure 16.
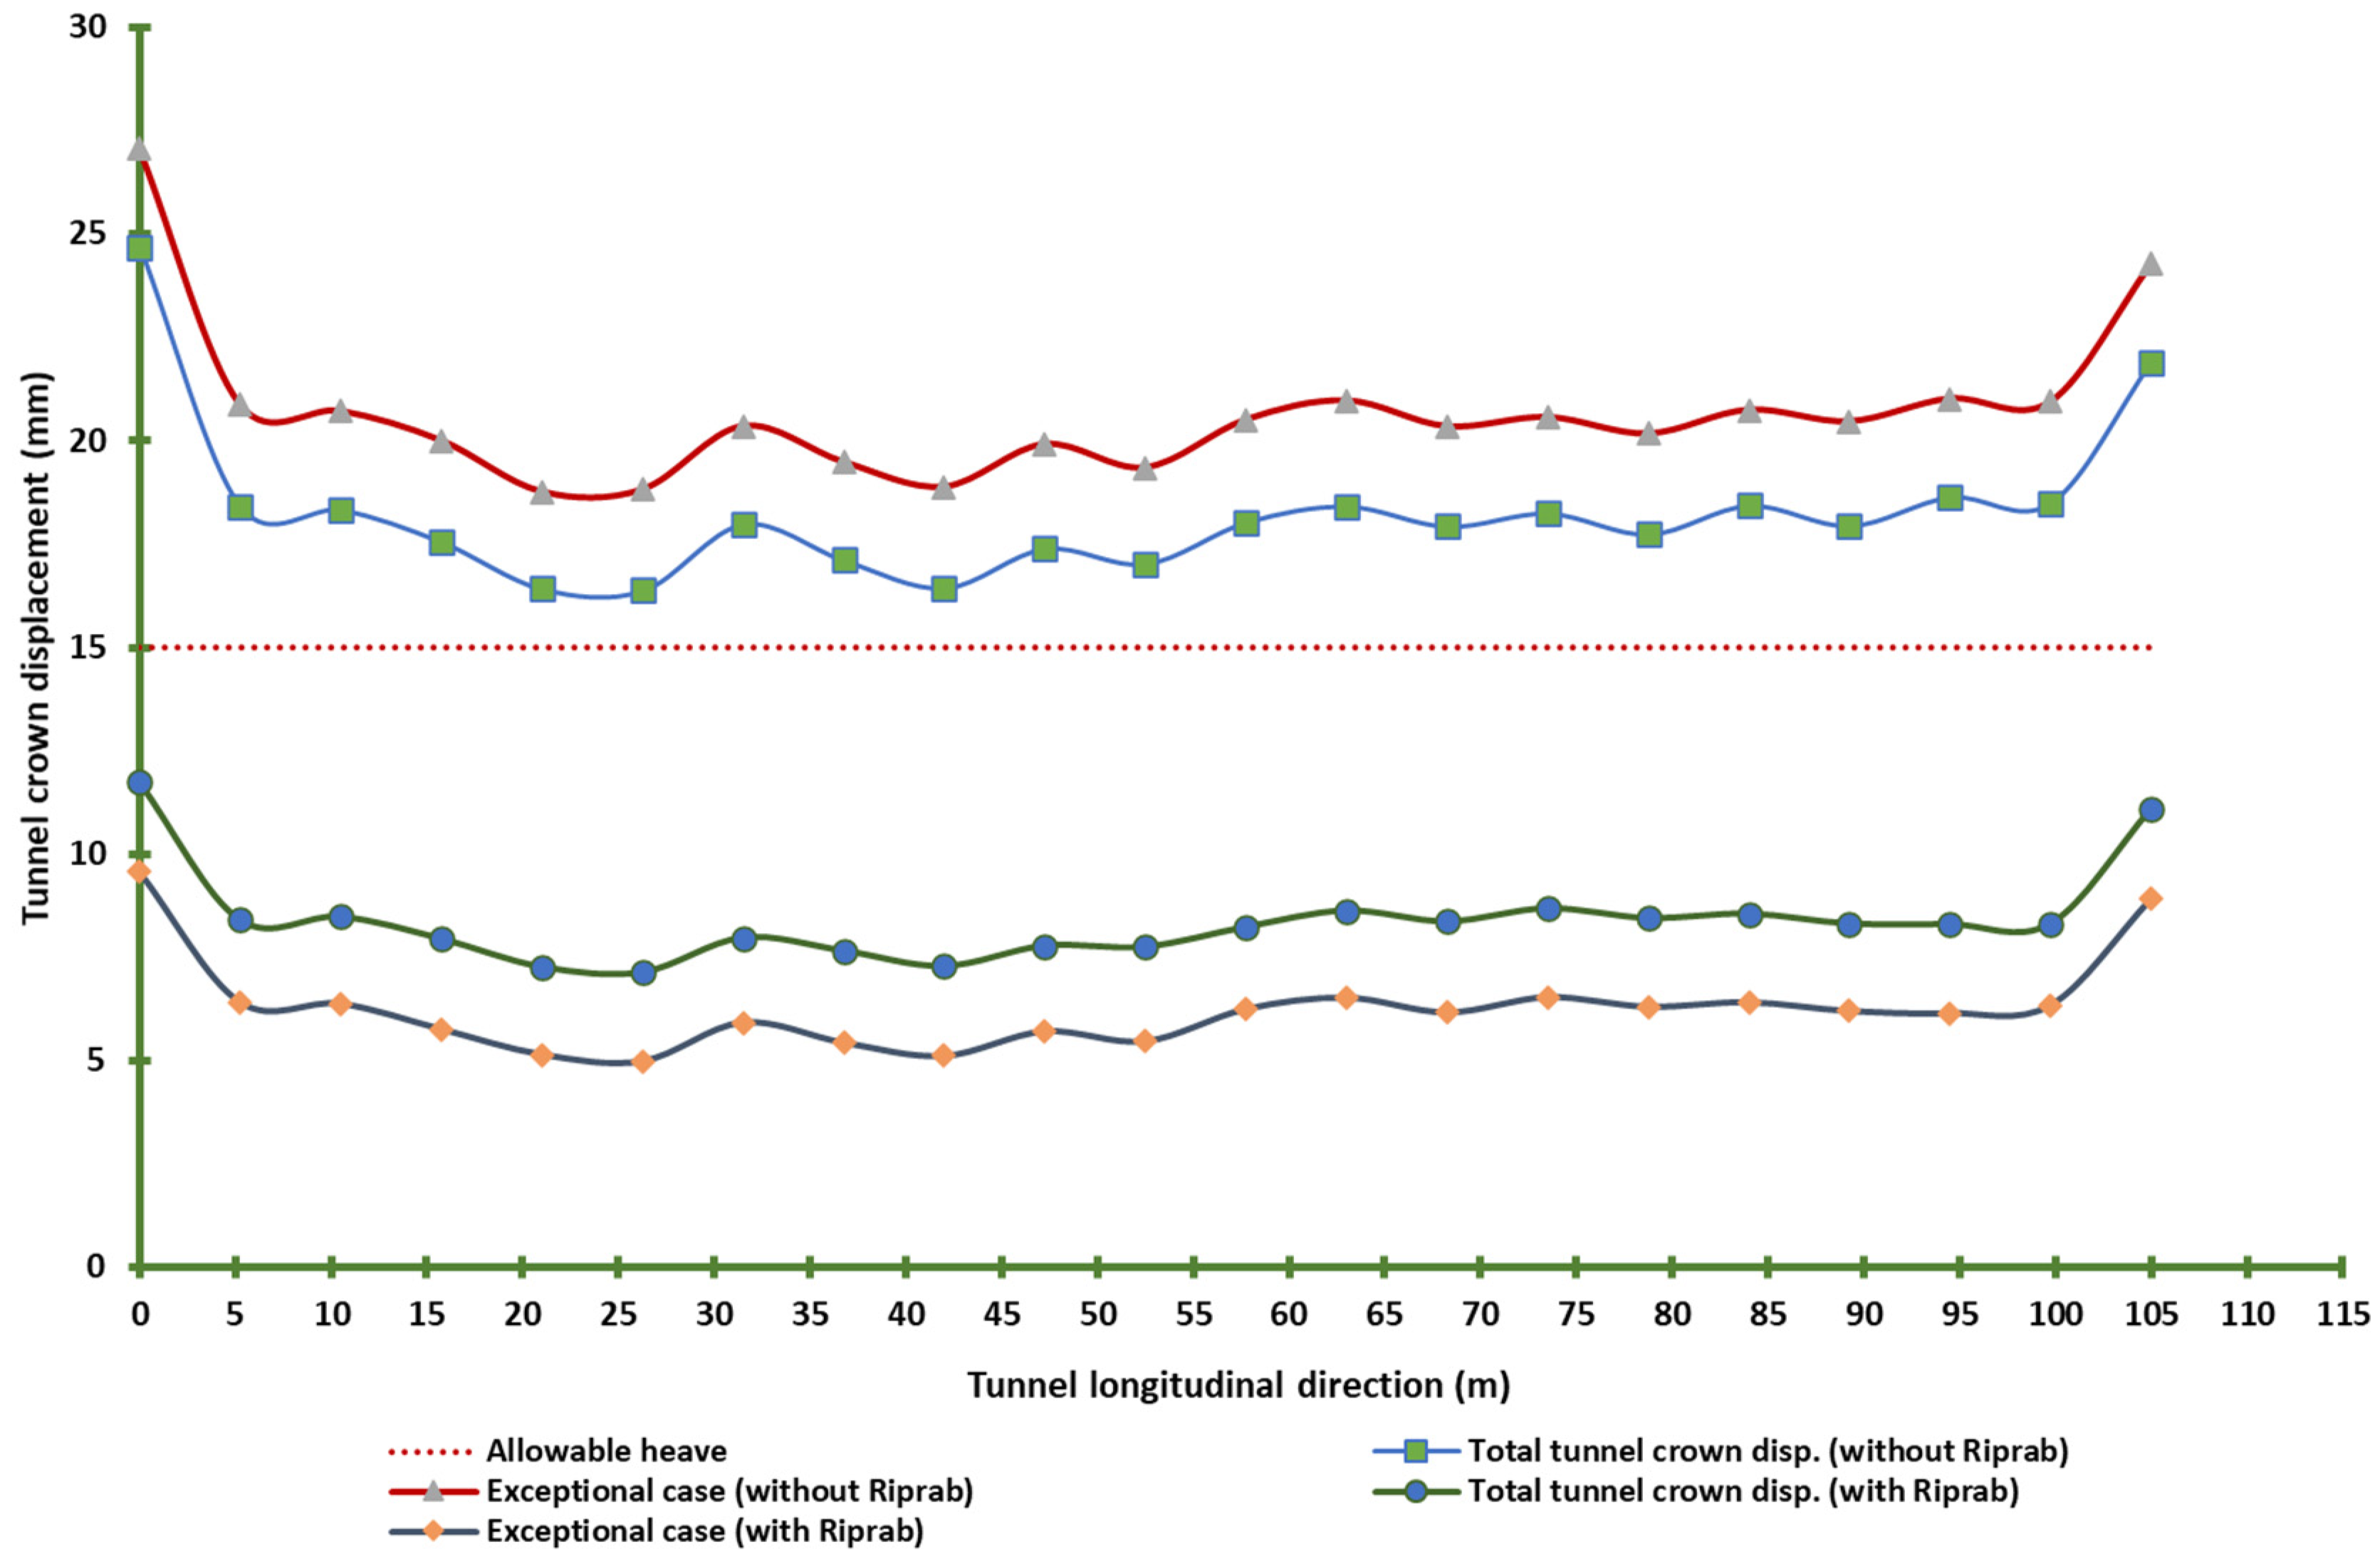
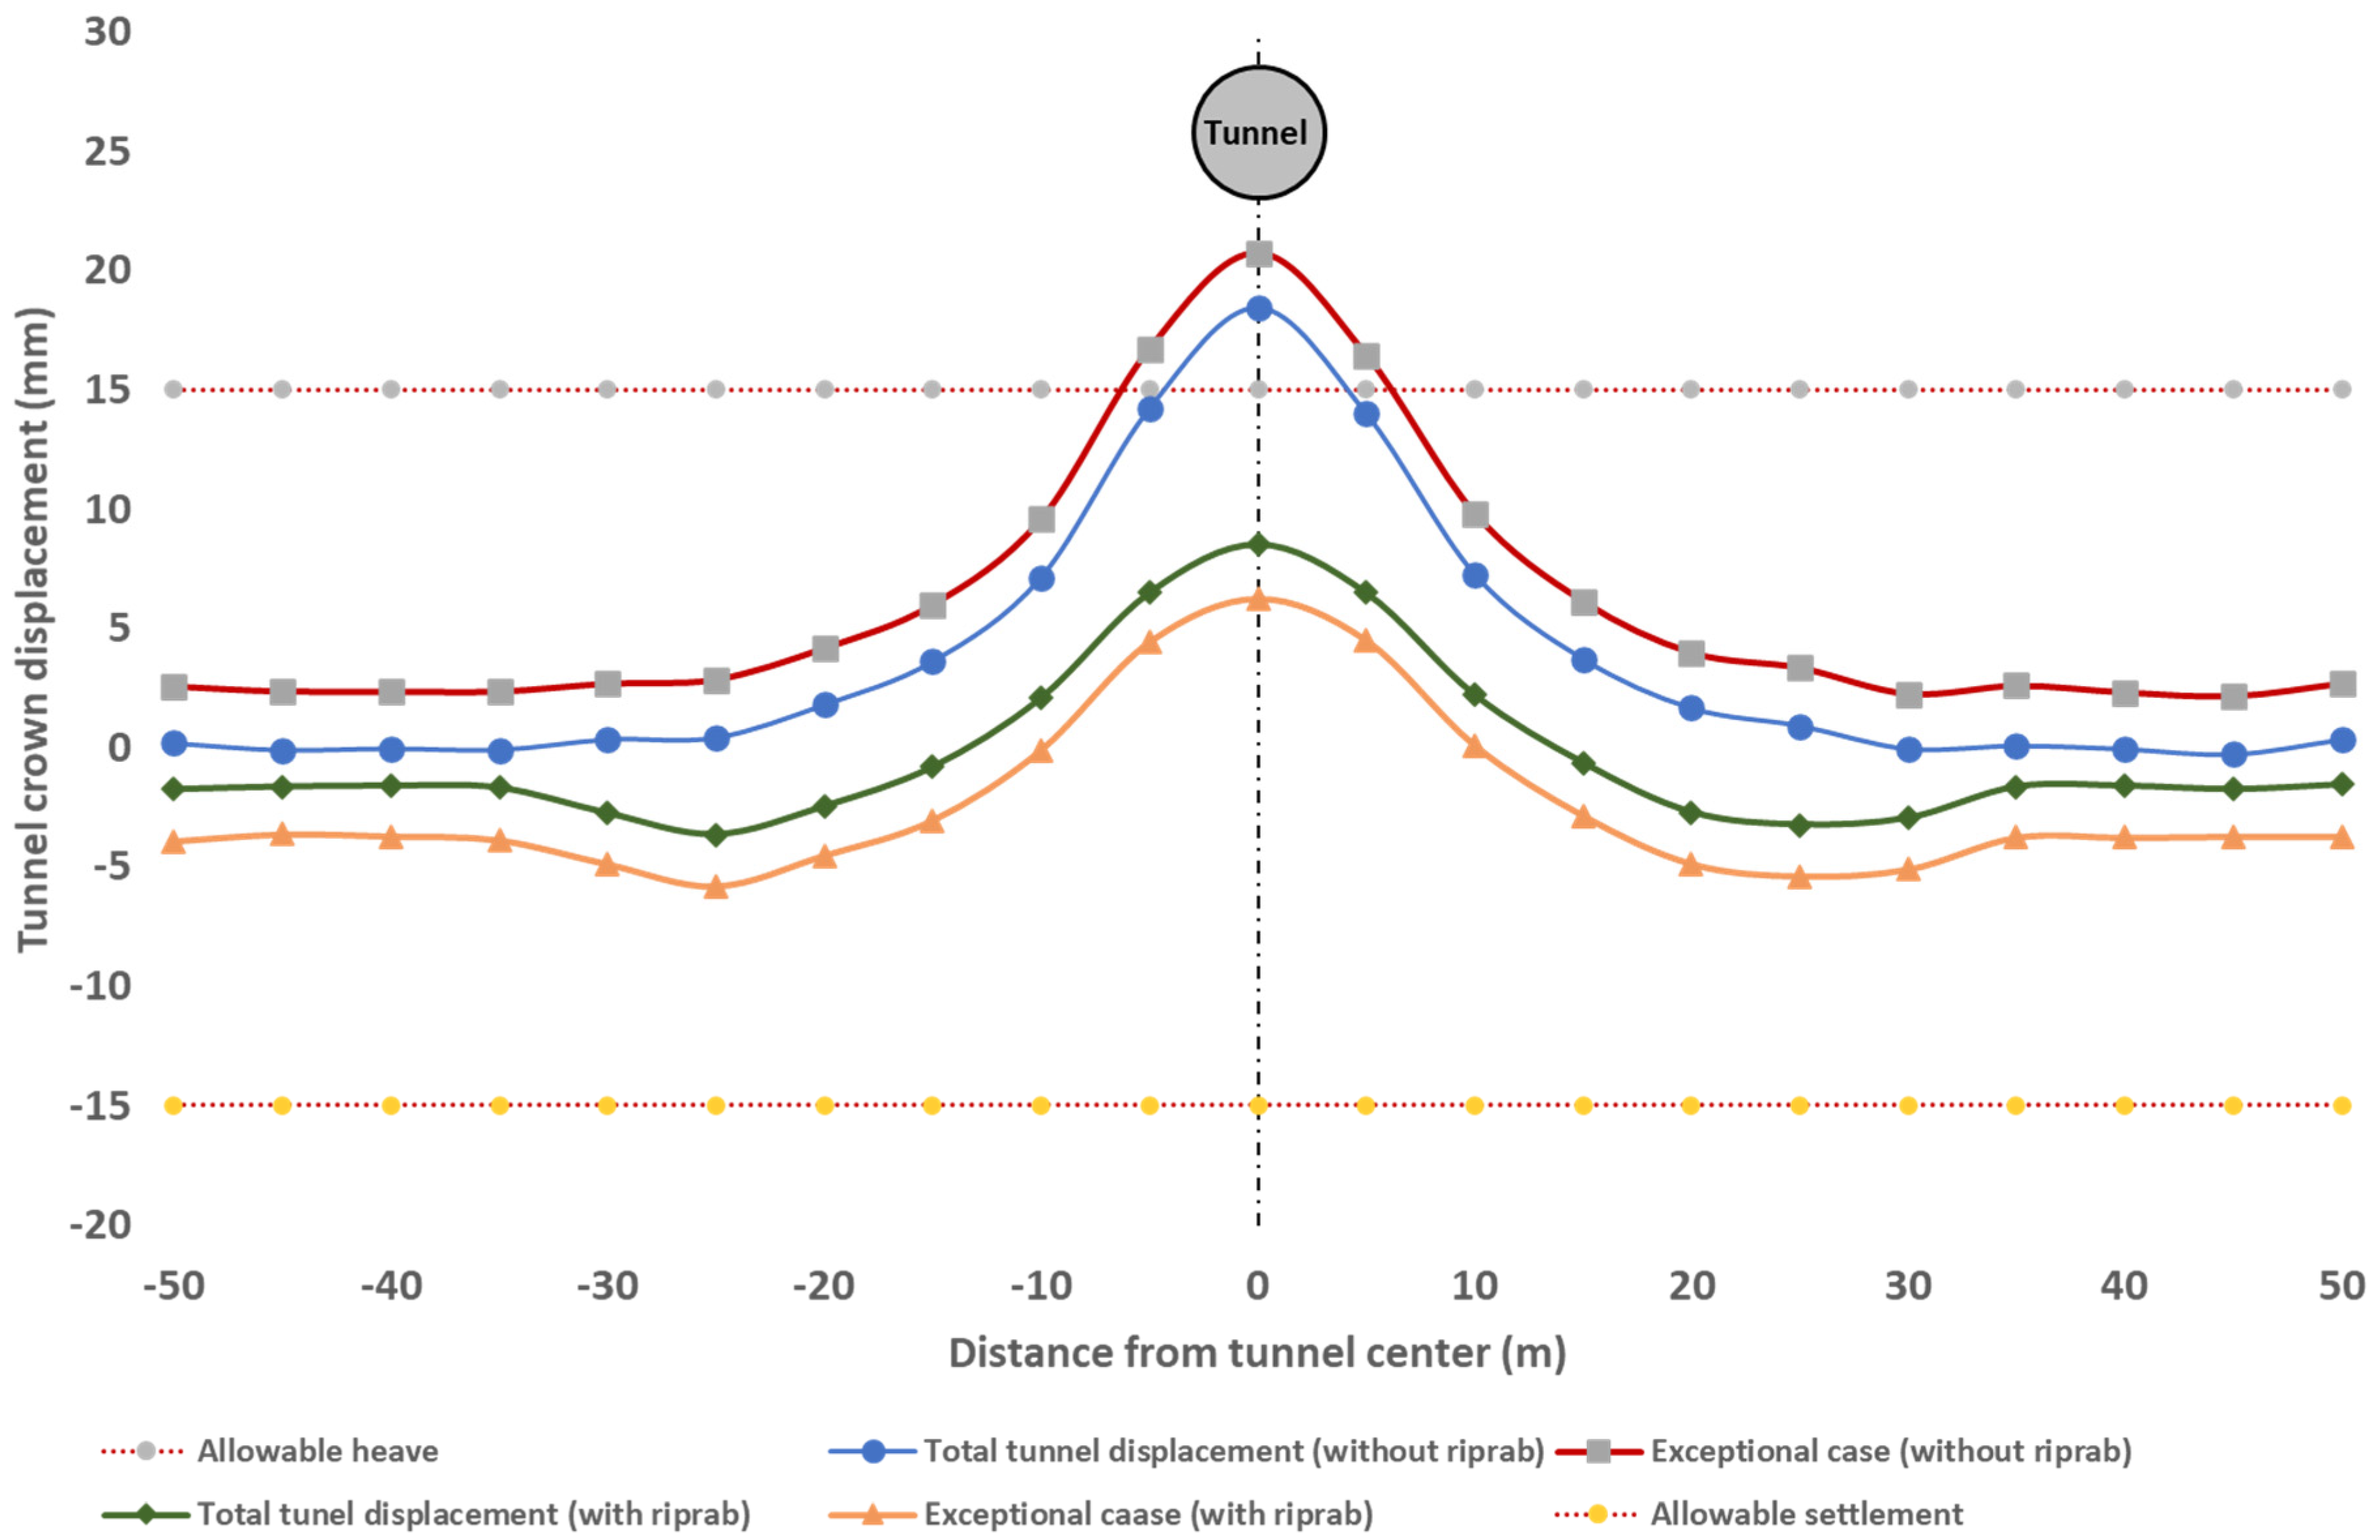
For the long- and short-term combination, the total crown vertical heave was 24.68 mm for the model without riprap and 11.75 mm for the model with riprap, decreasing the ratio by approximately 52% (
Figure 17). For the exceptional case, the total crown vertical heave was 27.00 mm for the model without riprap and 9.59 mm for the model with riprap by decreasing the ratio by approximately 54% (
Figure 17).
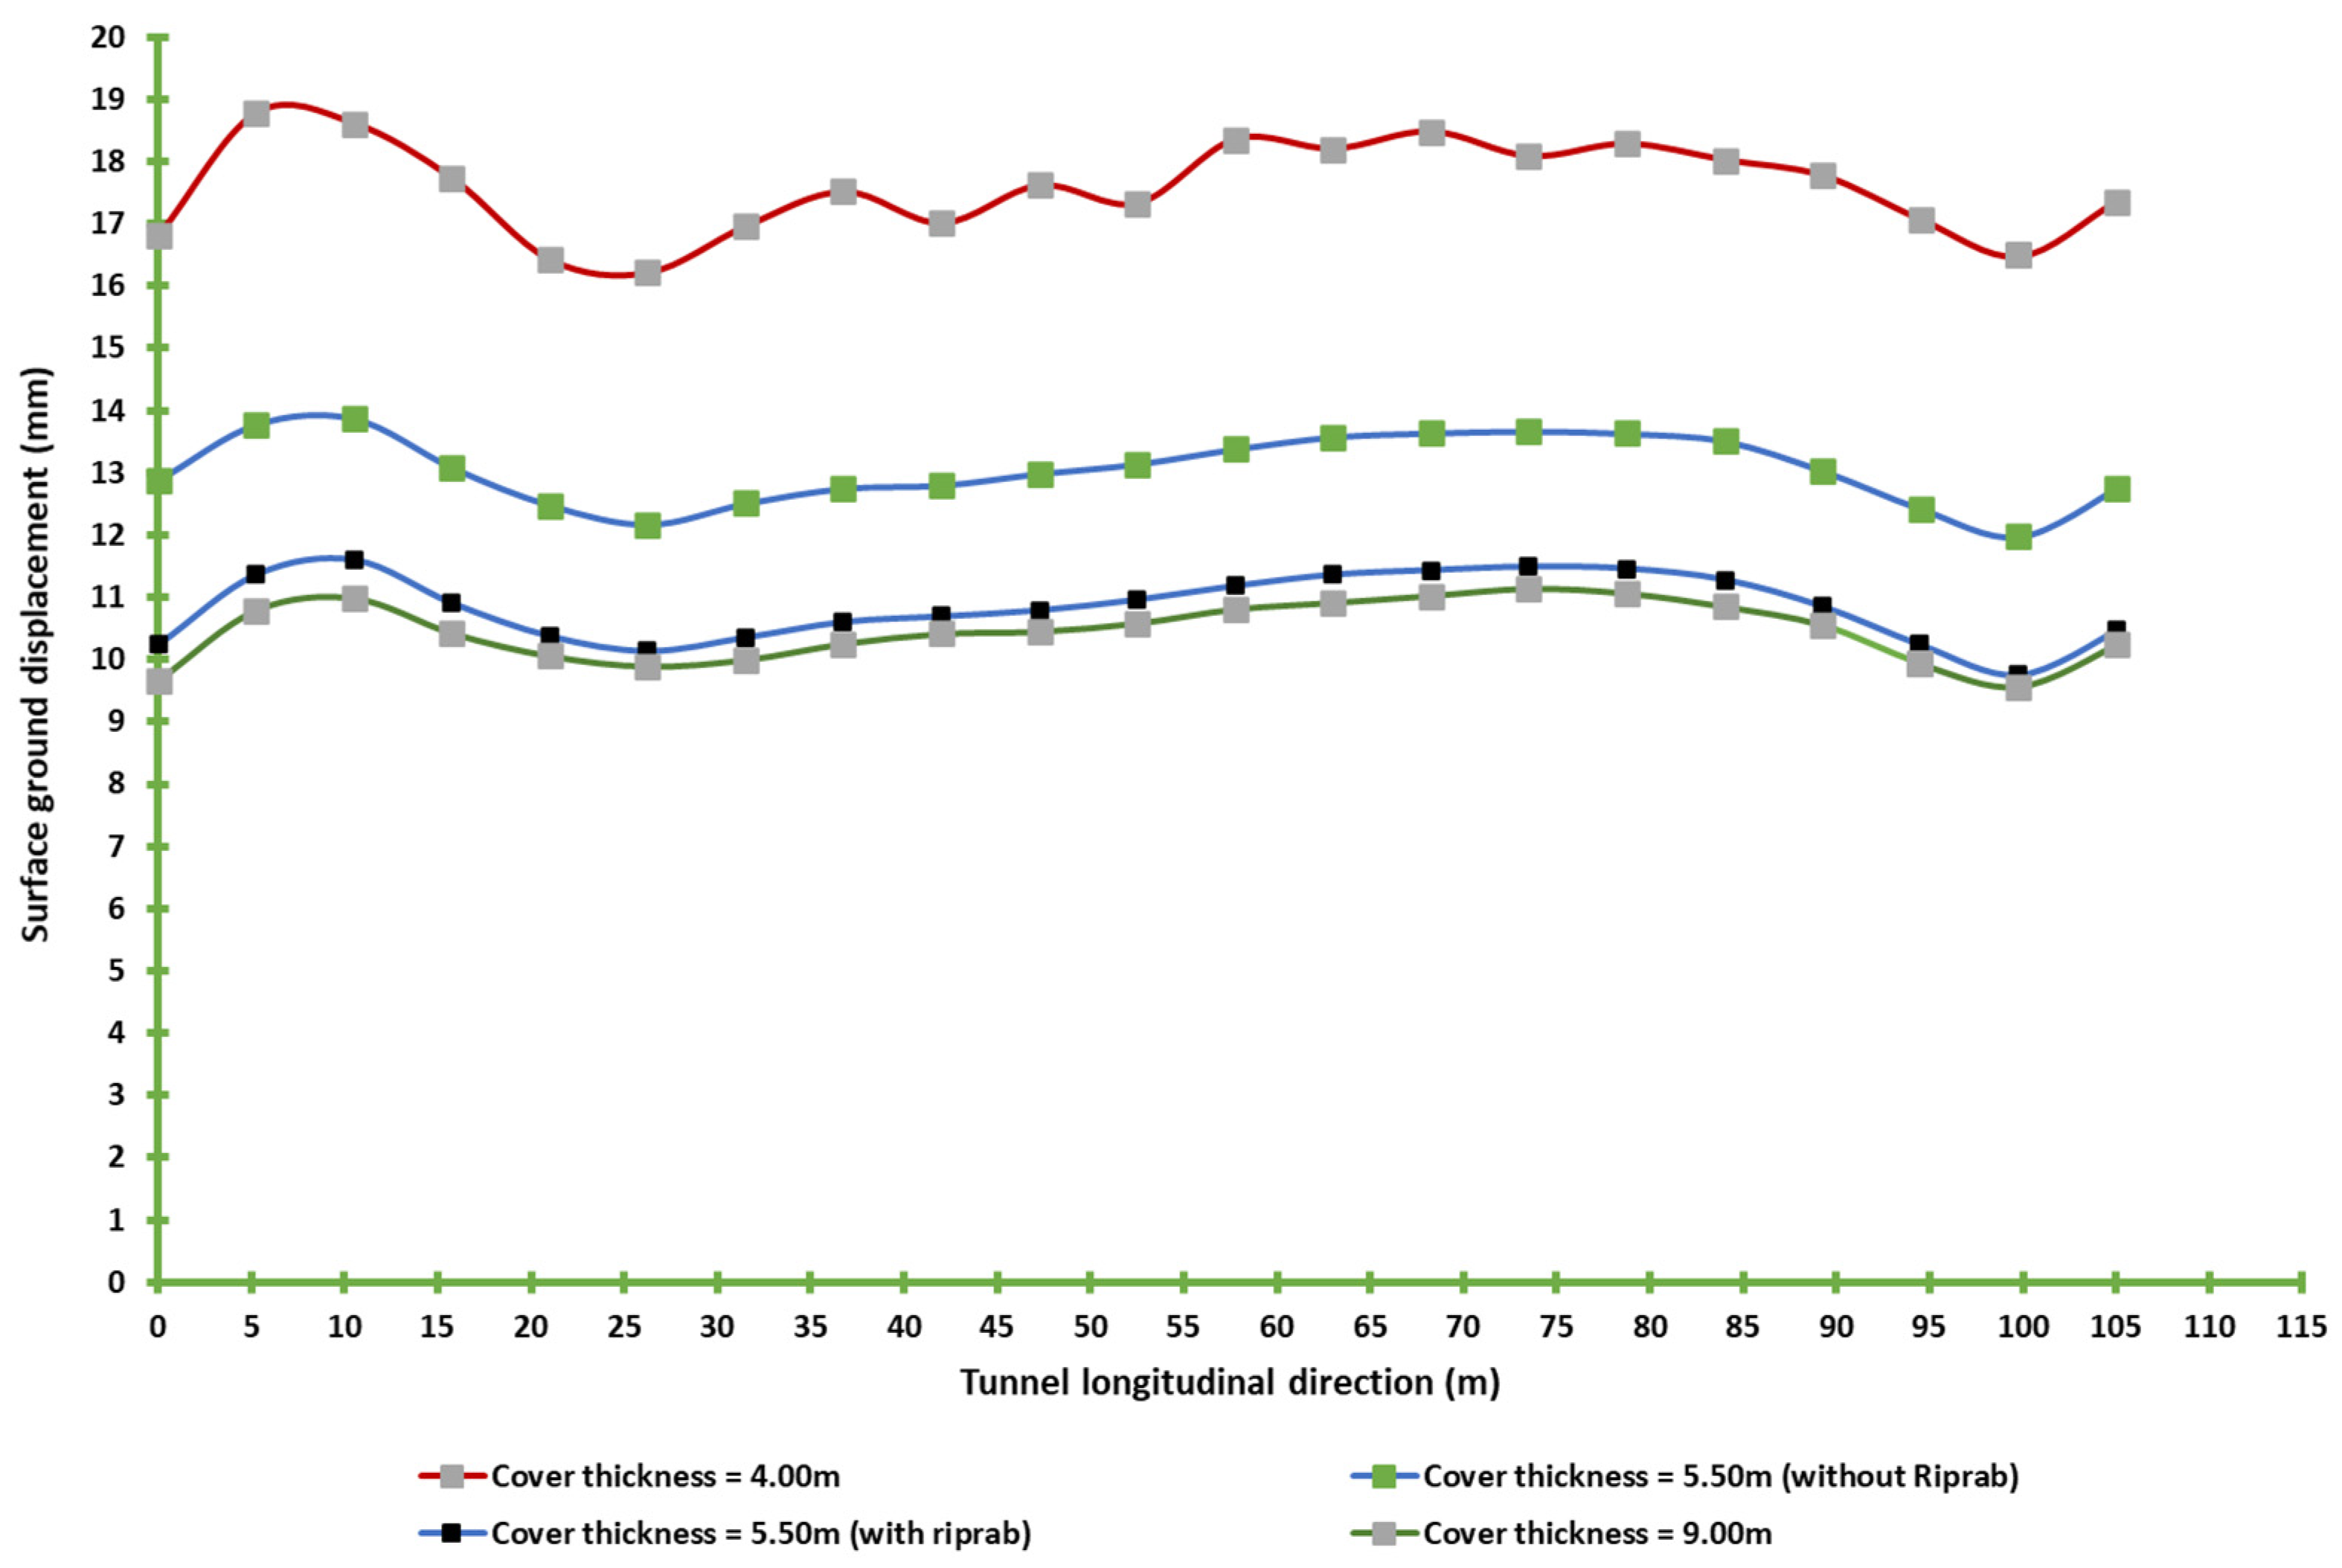
The surface displacement should be less than the design value (±15 mm). For the construction stage, when the cover thickness changed from a value equal to a half diameter to one diameter, the total surface displacement decreased from 18.77 mm to 11.14 mm.
For the model with cover thickness 5.5 m with/without riprap, the following was noticed:
The surface heave decreased by 21–31% during construction, as shown in
Figure 18.
The surface heave decreased by 59–65% for the combination between short-term and long-term, as shown in
Figure 19.
For the models during the exceptional case, the surface heave decreased by 63–73%, as shown in
Figure 19.
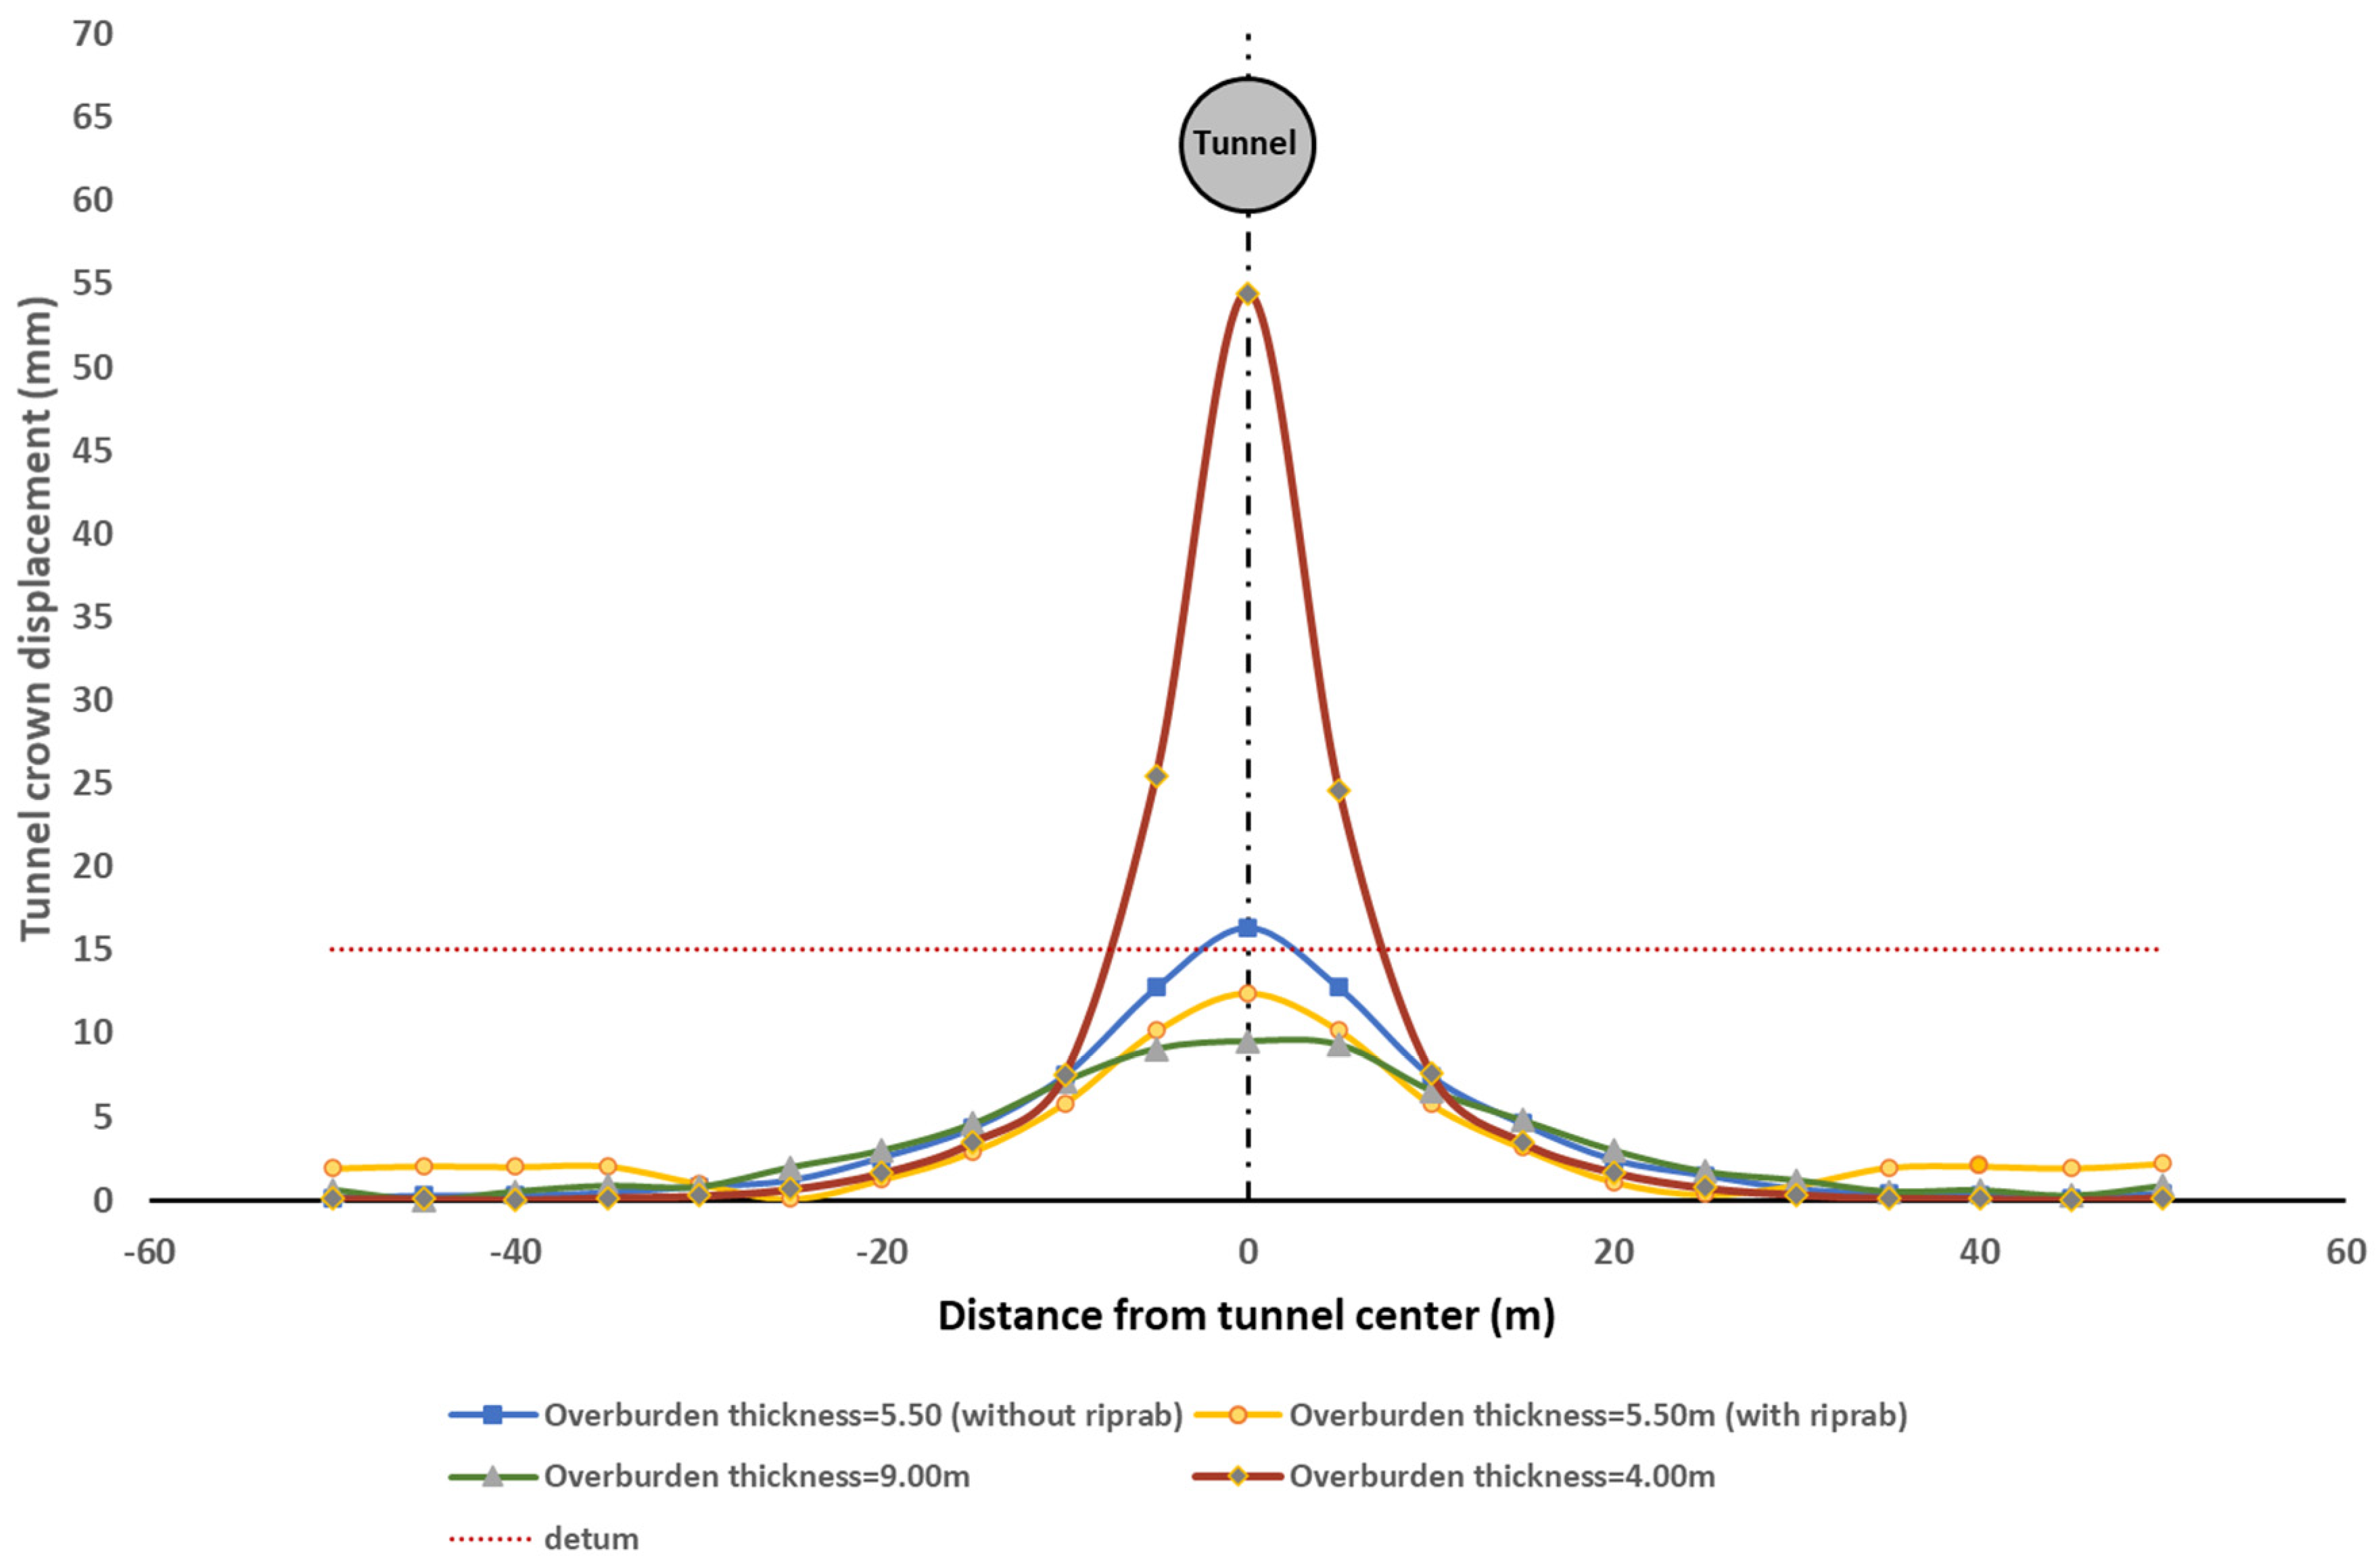
Figure 20 and
Figure 21 show the horizontal surface settlement displacement and transverse trough during the service stage during construction and service stages. The results show the effectiveness of riprap to reduce the tunnel crown displacement.
6. Conclusions
The safety factor for the stability of the tunnel, which is the ratio of the downward forces to the upward forces, should not be less than 1.5 for construction and service cases and 1.3 for the exceptional case (scour accrues).
To satisfy the general stability condition for the different cases studied, the minimum allowable cover thickness has to be the greatest cover thickness that fulfills the above-mentioned safety factor.
Comparison between models indicated that the safe cover thickness was equal to the diameter of the tunnel. Suppose there is a difficulty in satisfying this depth because of the alignment or another reason. In that case, the minimum cover thickness can be used to verify the required factor of safety calculated by theoretical analysis.
It is essential to check that the soil–lining interaction is compatible with the condition stipulated in the specifications of tunnel stability.
Floatability during the service stage should be taken into account. To ensure tunnel stability, protection of the bed is necessary. The layers should be significantly thick to ensure a sufficient cover for the tunnel. The width of the riprap should be sufficient to avoid security issues above the tunnel.
Suppose the buoyancy condition is verified for the construction stage. In that case, it is also valid for the service stage, where filling concrete inside the tunnel is favorable as it increases the resistance force.
The protection backfilling weight should be equivalent to the difference between the minimum cover thickness used and the actual thickness related to the condition of execution.
Author Contributions
Conceptualization, A.E.; N.E.; methodology, A.E.; N.E.; software, N.E.; validation, A.E.; N.E.; formal analysis, A.E.; investigation, A.E.; resources, N.E.; data curation, N.E.; writing—original draft preparation, A.E.; writing—review and editing, A.E.; visualization, A.E.; supervision, A.E. All authors have read and agreed to the published version of the manuscript.
Funding
This research received no external funding.
Institutional Review Board Statement
Not applicable.
Informed Consent Statement
Not applicable.
Data Availability Statement
The study contains all data used in the manuscript.
Conflicts of Interest
The authors declare no conflict of interest.
References
- Miyaguchi, K. Maintenance of the Kanmon railway tunnels. Tunn. Undergr. Space Technol. 1986, 1, 307–314. [Google Scholar] [CrossRef]
- Hong, K. Typical underwater tunnels in the mainland of China and related tunneling technologies. Engineering 2017, 3, 871–879. [Google Scholar] [CrossRef]
- Kirkland, C.J. The fire in the Channel Tunnel. Tunn. Undergr. Space Technol. 2002, 17, 129–132. [Google Scholar] [CrossRef]
- Eisenstein, Z.D. Large undersea tunnels and the progress of tunnelling technology. Tunn. Undergr. Space Technol. 1994, 9, 283–292. [Google Scholar] [CrossRef]
- Rame Gowda, B.M.; Ghosh, N.; Ramteke, R.S.; Wadhwa, R.S.; Satpute, M.S.; Choudhari, M.S. Seismic survey for piercing of an underwater tunnel for Koyna Hydroelectric Project, India. Eng. Geol. 1997, 47, 279–288. [Google Scholar] [CrossRef]
- Morris, M.; Yang, M.W.W.; Tsang, C.K.; Hu, A.Y.M.; Shut, D.S.C. An overview of subsea tunnel engineering in Hong Kong. Proc. Inst. Civil Eng. 2016, 169, 9–15. [Google Scholar] [CrossRef]
- Chen, H.; Li, X.; Yan, W.; Chen, S.; Zhang, X. Shaking table test of immersed tunnel considering the geological condition. Eng. Geol. 2017, 227, 93–107. [Google Scholar] [CrossRef]
- Shi, C.; Cao, C.; Lei, M. Construction technology for a shallow-buried underwater interchange tunnel with a large span. Tunn. Undergr. Space Technol. 2017, 70, 317–329. [Google Scholar] [CrossRef]
- Zhang, C.; Yang, J.; Fu, J.; Ou, X.; Xie, Y.; Dai, Y.; Lei, J. A new clay-cement composite grouting material for tunnelling in underwater karst area. J. Cent. South Univ. 2019, 26, 1863–1873. [Google Scholar] [CrossRef]
- Guo, P.; Gong, X.; Wang, Y.; Lin, H.; Zhao, Y. Minimum cover depth estimation for underwater shield tunnels. Tunn. Undergr. Space Technol. 2021, 115, 104027. [Google Scholar] [CrossRef]
- Wang, Z.; Wang, L.; Wang, J.; Li, L. Case study of rehabilitation of a damaged underwater tunnel in the construction phase. J. Perform. Constr. Facil. 2016, 30, C4014003. [Google Scholar] [CrossRef]
- Azali, S.T.; Ghafoori, M.; Lashkaripour, G.R.; Hassanpour, J. Engineering geological investigations of mechanized tunneling in soft ground: A case study, East-West lot of line 7, Tehran Metro, Iran. Eng. Geol. 2013, 166, 170–185. [Google Scholar] [CrossRef]
- Thum, L.; De Paoli, R. 2D and 3D GIS-based geological and geomechanical survey during tunnel excavation. Eng. Geol. 2015, 192, 19–25. [Google Scholar] [CrossRef]
- Yang, J.-P.; Chen, W.-Z.; Li, M.; Tan, X.-J.; Yu, J. Structural health monitoring and analysis of an underwater TBM tunnel. Tunn. Undergr. Space Technol. 2018, 82, 235–247. [Google Scholar] [CrossRef]
- Tan, X.; Chen, W.; Wang, L.; Tan, X.; Yang, J. Integrated approach for structural stability evaluation using real-time monitoring and statistical analysis: Underwater shield tunnel case study. J. Perform. Constr. Facil. 2020, 34, 04019118. [Google Scholar] [CrossRef]
- Ming, H.; Wang, M.-S.; Tan, Z.-S.; Wang, X.-Y. Analytical solutions for steady seepage into an underwater circular tunnel. Tunn. Undergr. Space Technol. 2010, 25, 391–396. [Google Scholar] [CrossRef]
- Fahimifar, A.; Zareifard, M.R. A new elasto-plastic solution for analysis of underwater tunnels considering strain-dependent permeability. Struct. Infrastruct. Eng. 2014, 10, 1432–1450. [Google Scholar] [CrossRef]
- Joo, E.J.; Shin, J.H. Relationship between water pressure and inflow rate in underwater tunnels and buried pipes. Geotechnique 2014, 64, 226–231. [Google Scholar] [CrossRef]
- Fahimifar, A.; Ghadami, H.; Ahmadvand, M. An elasto-plastic model for underwater tunnels considering seepage body forces and strain-softening behavior. Eur. J. Environ. Civ. Eng. 2015, 19, 129–151. [Google Scholar] [CrossRef]
- Fang, Q.; Song, H.; Zhang, D. Complex variable analysis for stress distribution of an underwater tunnel in an elastic half plane. Int. J. Numer. Anal. Meth. Geomech. 2015, 39, 1821–1835. [Google Scholar] [CrossRef]
- Zhang, Y.; Zhang, D.; Fang, Q.; Xiong, L.; Yu, L.; Zhou, M. Analytical solutions of non-Darcy seepage of grouted subsea tunnels. Tunn. Undergr. Space Technol. 2020, 96, 103182. [Google Scholar] [CrossRef]
- Palmstrom, A. The challenge of subsea tunnelling. Tunn. Undergr. Space Technol. 1994, 9, 145–150. [Google Scholar] [CrossRef]
- Matsuo, S. An overview of the Seikan Tunnel Project. Tunn. Undergr. Space Technol. 1986, 1, 323–331. [Google Scholar] [CrossRef]
- Li, C.; Zhang, W.; Zhu, H.-H.; Wang, P.; Ren, J.-T.; Spencer, B.F., Jr. Fast vibration characteristics analysis of an underwater shield tunnel using the accelerometer network enhanced by edge computing. Measurement 2019, 141, 52–61. [Google Scholar] [CrossRef]
- Do, N.-A.; Dias, D.; Oreste, P.; Djeran-Maigre, I. Three-dimensional numerical simulation for mechanized tunneling in soft ground: The influence of the joint pattern. Acta Geotech. 2014, 9, 673–694. [Google Scholar] [CrossRef]
- Ng, C.W.W.; Lee, K.M.; Tang, D.K.W. Three-dimensional numerical investigations of new Austrian tunnelling method (NATM) twin tunnel interactions. Can. Geotech. J. 2004, 41, 523–539. [Google Scholar] [CrossRef]
- Zhang, D.M.; Ma, L.X.; Zhang, J.; Hicher, P.Y.; Juang, C.H. Ground and tunnel responses induced by partial leakage in saturated clay with anisotropic permeability. Eng. Geol. 2015, 189, 104–115. [Google Scholar] [CrossRef]
- Tang, Z.; Yao, W.; Zhang, J.; Xu, Q.; Xia, K. Experimental evaluation of PMMA simulated tunnel stability under dynamic disturbance using digital image correlation. Tunn. Undergr. Space Technol. 2019, 92, 103039. [Google Scholar] [CrossRef]
- Yu, H.; Chen, J.; Bobet, A.; Yuan, Y. Damage observation and assessment of the Longxi tunnel during the Wenchuan earthquake. Tunn. Undergr. Space Technol. 2016, 54, 102–116. [Google Scholar] [CrossRef]
- Di, H.; Zhou, S.; Xiao, J.; Gong, Q.; Luo, Z. Investigation of the long-term settlement of a cut-and-cover metro tunnel in a soft deposit. Eng. Geol. 2016, 204, 33–40. [Google Scholar] [CrossRef]
- Katebi, H.; Rezaei, A.H.; Hajialilue-Bonab, M.; Tarifard, A. Assessment the influence of ground stratification, tunnel and surface buildings specifications on shield tunnel lining loads (by F.E.M.). Tunn. Undergr. Space Technol. 2015, 49, 67–78. [Google Scholar] [CrossRef]
- Peck, R.B. Deep excavations and tunnelling in soft ground. In Proceedings of the 7th International Conference on SMFE, Mexico City, Mexico, 1969; pp. 225–290. [Google Scholar]
- Mair, R.J.; Taylor, R.N.; Bracegirdle, A. Subsurface settlement profiles above tunnels in clays. Geotechnique 1993, 43, 315–320. [Google Scholar] [CrossRef]
- Loganathan, N.; Poulos, H.G. Analytical prediction for tunneling-induced ground movements in clays. J. Geotech. Geoenviron. Eng. 1998, 124, 846–856. [Google Scholar] [CrossRef]
- Loganathan, N.; Poulos, H.G.; Stewart, D.P. Centrifuge model testing of tunnelling-induced ground and pile deformations. Geotechnique 2000, 50, 283–294. [Google Scholar] [CrossRef]
- Ahmed, M.; Iskander, M. Analysis of tunneling-induced ground movements using transparent soil models. J. Geotech. Geoenviron. Eng. 2010, 137, 525–535. [Google Scholar] [CrossRef]
- Vu, M.N.; Broere, W.; Bosch, J. Effects of cover depth on ground movements induced by shallow tunnelling. Tunn. Undergr. Space Technol. 2015, 50, 499–506. [Google Scholar] [CrossRef] [Green Version]
- Kasper, T.; Meschke, G. A numerical study of the effect of soil and grout material properties and cover depth in shield tunnelling. Comput. Geotech. 2006, 33, 234–247. [Google Scholar] [CrossRef]
- Boonyarak, T.; Ng, C.W.W. Effects of construction sequence and cover depth on crossing-tunnel interaction. Can. Geotech. J. 2015, 52, 851–867. [Google Scholar] [CrossRef] [Green Version]
- Ports, M.A.; Shea, C. Design and Construction of the First Bored Tunnel Under the Nile River. In Water Resources Engineering’98; ASCE: Reston, VA, USA, 1998; pp. 121–126. [Google Scholar]
- Madkour, A.; Hudson, M.A.; Bellarosa, A. Construction of Cairo Metro Line 2. In Proceedings of the Institution of Civil Engineers-Civil Engineering; Thomas Telford Services for the Institution of Engineers: London, UK, 1999; Volume 132, pp. 103–117. [Google Scholar]
- Abd El Salam, M.E. Historic Nile crossing by a bored tunnel. Tunn. Undergr. Space Technol. 1999, 14, 257–265. [Google Scholar] [CrossRef]
- Chen, J.; Tang, H.W.; Li, Z.S.; Dai, W.H. Multi-approach analysis of maximum riverbed scour depth above subway tunnel. Water Sci. Eng. 2010, 3, 431–442. [Google Scholar]
- Zhang, S.; Wen, J.; Zhang, H.; Huang, L.; Zhong, Y.F. Analytical and numerical anti-floating study concerning the shield tunnel across the river. In Advanced Materials Research; Trans Tech Publications Ltd.: Bäch SZ, Switzerland, 2013; Volume 671, pp. 1087–1092. [Google Scholar]
- Nile Research Institute (N.R.I.). Hydraulic Analysis and Scour Evaluation for Underground Metro line 2 Nile River Crossing; Final Report; Nile Research Institute (N.R.I.): Ashmoun, Egypt, 1997. [Google Scholar]
- El Barbary, Z.; El-Sersawy, H. Hydraulic analysis and scour evaluation for metro tunnel river crossing. J. Appl. Sci. Res. 2013, 9, 5146–5158. [Google Scholar]
- Pizarro, A.; Manfreda, S.; Tubaldi, E. The science behind scour at bridge foundations: A review. Water 2020, 12, 374. [Google Scholar] [CrossRef] [Green Version]
- California Division of Highways. Bank and Shore Protection in California Highway Practice; Business and Transportation Agency, Dept. of Public Works: Sacramento, CA, USA, 1970.
- Midas/G.T.S. N.X. Manual (Version 1.1); Copyright since 1989; Midas Information Technology Co. Ltd.: Seongnam-si, Korea, 2020. [Google Scholar]
- Wood, A.; Muir, M. The circular tunnel in elastic ground. Geotechnique 1975, 25, 115–127. [Google Scholar] [CrossRef]
- Thewes, M.; Budach, C. Grouting of the annular gap in shield tunnelling-An important factor for minimisation of settlements and production performance. In Proceedings of the ITA-AITES World Tunnel Congress 2009, Budapest, Hungary, 23–28 May 2009. [Google Scholar]
- Salam, S.; Abdel, A.A.; Shaalan, O.; Hammad, N. Modeling of TBM tunnel construction for the greater Cairo metro line 3. Int. J. Eng. Innov. Technol. 2015, 4, 18–24. [Google Scholar]
Figure 1.
Tunnel layout under the east branch of the Nile River.
Figure 1.
Tunnel layout under the east branch of the Nile River.
Figure 2.
Tunnel profile. (a) plan view, (b) elevation section.
Figure 2.
Tunnel profile. (a) plan view, (b) elevation section.
Figure 3.
One of the TBMs on the last day of drilling the Line 2 tunnel.
Figure 3.
One of the TBMs on the last day of drilling the Line 2 tunnel.
Figure 4.
Tunnel section under the east branch of the Nile River.
Figure 4.
Tunnel section under the east branch of the Nile River.
Figure 5.
Geological section under the east branch of the Nile River.
Figure 5.
Geological section under the east branch of the Nile River.
Figure 6.
Bathymetric survey plan view.
Figure 6.
Bathymetric survey plan view.
Figure 7.
Sketch of the bored tunnel under the Nile River.
Figure 7.
Sketch of the bored tunnel under the Nile River.
Figure 8.
Tunnel general stability flowchart according to the empirical model.
Figure 8.
Tunnel general stability flowchart according to the empirical model.
Figure 9.
Longitudinal section of backfilling protection.
Figure 9.
Longitudinal section of backfilling protection.
Figure 10.
Cross section of backfilling protection.
Figure 10.
Cross section of backfilling protection.
Figure 11.
F.E. modeling for tunnel and surrounding soil.
Figure 11.
F.E. modeling for tunnel and surrounding soil.
Figure 12.
Construction loads.
Figure 12.
Construction loads.
Figure 13.
Construction stages.
Figure 13.
Construction stages.
Figure 14.
F.E. simulation of backfilling load.
Figure 14.
F.E. simulation of backfilling load.
Figure 15.
Numerical modeling development flowchart.
Figure 15.
Numerical modeling development flowchart.
Figure 16.
Displacement of tunnel crown during construction.
Figure 16.
Displacement of tunnel crown during construction.
Figure 17.
Displacement of tunnel crown during service.
Figure 17.
Displacement of tunnel crown during service.
Figure 18.
Displacement of surface ground during the construction stage.
Figure 18.
Displacement of surface ground during the construction stage.
Figure 19.
Displacement of surface ground during service stage.
Figure 19.
Displacement of surface ground during service stage.
Figure 20.
Horizontal surface settlement displacement and transverse trough during construction stage.
Figure 20.
Horizontal surface settlement displacement and transverse trough during construction stage.
Figure 21.
Horizontal surface settlement displacement and transverse trough during service stage.
Figure 21.
Horizontal surface settlement displacement and transverse trough during service stage.
Table 1.
Calculation of minimum cover thickness above the tunnel.
Table 1.
Calculation of minimum cover thickness above the tunnel.
| General Stability | Upward Forces (Fup) [kN] | Downward Forces
(Fdown)
[kN] | The Factor
of Safety
(Fup/Fdown) | Minimum Cover Thickness
[m] |
|---|
| Short term | 776.4 | 680.3 + 80.6H + 82 | 1.50 | 5.00 |
| Middle term | 657.5 | 274.9 + 77.8H + 76.4 | 1.50 | 8.16 |
| Long term | 657.5 | 274.9 + 77.8H + 76.5 + 241.5 | 1.50 | 5.06 |
| Exceptional case | 657.5 | 274.9 + 77.8(H-3) + 76.5 + 241.6 | 1.30 | 6.37 |
Table 2.
The factor of safety calculation of tunnel-critical section.
Table 2.
The factor of safety calculation of tunnel-critical section.
| General Stability | Upward Forces (Fup) [kN] | Downward Forces
(Fdown)
[kN] | Cover at the Critical Section [m] | The Factor of Safety
(Fup/Fdown) |
|---|
| Short term | 776.4 | 680.3 + 80.6H + 82 + (9.48 × 28) | 5.50 | 1.89 |
| Middle term | 657.5 | 274.9 + 77.8H + 76.4 + (9.15 × 28) | 5.50 | 1.57 |
| Long term | 657.5 | 274.9 + 77.8H + 76.5 + 241.5 + (9.15 × 12) | 5.50 | 1.72 |
| Exceptional case | 657.5 | 274.9 + 77.8(H-3) + 76.5 + 241.6 + (9.15 × 12) | 5.50 | 1.36 |
Table 3.
Properties of soil materials.
Table 3.
Properties of soil materials.
| Material | Thickness of Layer [m] | Modulus of Elasticity (E)
[kN/m2] | Poisson’s Ratio (ν) | Unit Weight
(γ)
[kN/m3] | Cohesion
(cu)
[kN/m2] | Friction Angle
(Φ) [°] |
|---|
| Upper sand | 3.80 | 20000 | 0.30 | 19.00 | 0.00 | 30.00 |
| Middle sand | 12.30 | 75000 | 0.30 | 20.00 | 0.00 | 36.00 |
| Lower Sand | 23.00 | 90000 | 0.35 | 20.00 | 0.00 | 40.00 |
Table 4.
Properties of concrete lining and grout materials.
Table 4.
Properties of concrete lining and grout materials.
| Material | Modulus of Elasticity (E) [kN/m2] | Poisson’s Ratio (ν) | Unit Weight (γ) [kN/m3] |
|---|
| Concrete short term | 2.85 × 10⁷ | 0.20 | 25.00 |
| Concrete long term | 1.516 × 10⁷ | 0.20 | 25.00 |
| Shield | 2.00 × 10⁸ | 0.30 | 75.00 |
| Hard Grout | 50,000 | 0.30 | 23.00 |
| Soft Grout | 1000 | 0.30 | 11.00 |
Table 5.
Construction loads.
Table 5.
Construction loads.
| Pressure Type | Value
[kN/m2] |
|---|
| Face pressure | 200 |
| Grout pressure | 300 |
| Jacking pressure | 4600 |
Table 6.
Construction stages.
Table 6.
Construction stages.
| Components | I.S. | S1 | S2 | S3 | S4 | S5 | S6 | S7 | S8 | S9 | S10 | Sn |
|---|
| Upper sand | A | | | | | | | | | | | |
| Middle sand | A | | | | | | | | | | | |
| Lower sand | A | | | | | | | | | | | |
| Constrain | A | | | | | | | | | | | |
| Self-weight | A | | | | | | | | | | | |
| Water level | A | | | | | | | | | | | |
| Excavated soil | A | R1 | R2 | R3 | R4 | R5 | R6 | R7 | R8 | R9 | R10 | Rn |
| Shield | | Length of shield = 10.5 m | | | | |
| A1 | A2 | A3 | A4 | A5 | A6 | A7 | A8 | A9 | A10 | An |
| | | | | | | | R1 | R2 | R3 | R (n − 7) |
| Face pressure | | A2 | A3 | A4 | A5 | A6 | A7 | A8 | A9 | A10 | A11 | A (n + 1) |
| | | R2 | R3 | R4 | R5 | R6 | R7 | R8 | R9 | R10 | R (2 − 1) |
| Segment | | | | | | | | A1 | A2 | A3 | A4 | A (n − 6) |
| Jacking pressure | | | | | | | | A1 | A2 | A3 | A4 | A (n − 6) |
| | | | | | | | R1 | R2 | R3 | R (n − 7) |
| Grout pressure & Soft grout | | | | | | | | | A1 | A2 | A3 | A (n − 7) |
| | | | | | | | | | R1 | R (n − 9) |
| Hard grout | | | | | | | | | | | A1 | A (n − 9) |
| Publisher’s Note: MDPI stays neutral with regard to jurisdictional claims in published maps and institutional affiliations. |
© 2021 by the authors. Licensee MDPI, Basel, Switzerland. This article is an open access article distributed under the terms and conditions of the Creative Commons Attribution (CC BY) license (https://creativecommons.org/licenses/by/4.0/).


