Performance Assessment and Economic Analysis of a Gas-Fueled Islanded Microgrid—A Malaysian Case Study


Abstract
:
1. Introduction
- Performance of a gas fuel-based islanded microgrid system (8.4 MW) is investigated (using the collected data of installed capacity, generation, and load) to find highly efficient operational conditions (Section 3).
- Simple performance indicators are developed for assessing the performance of the gas-fueled islanded microgrid, which can also be applied to other power stations in Malaysia and elsewhere (Section 4).
- The cost due to the non-optimal production (in terms of fuel cost) is analyzed (Section 5).
- With the hope that microgrid owners will benefit from this study, some recommendations are proffered for improving power generation and reducing the generation costs of the microgrid (Section 6).
2. Gas-Fueled Electricity Generation in Malaysia
3. System under Study
3.1. System Description
3.2. Electrical Generation and Consumption
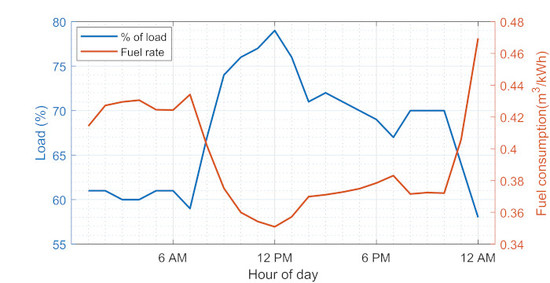
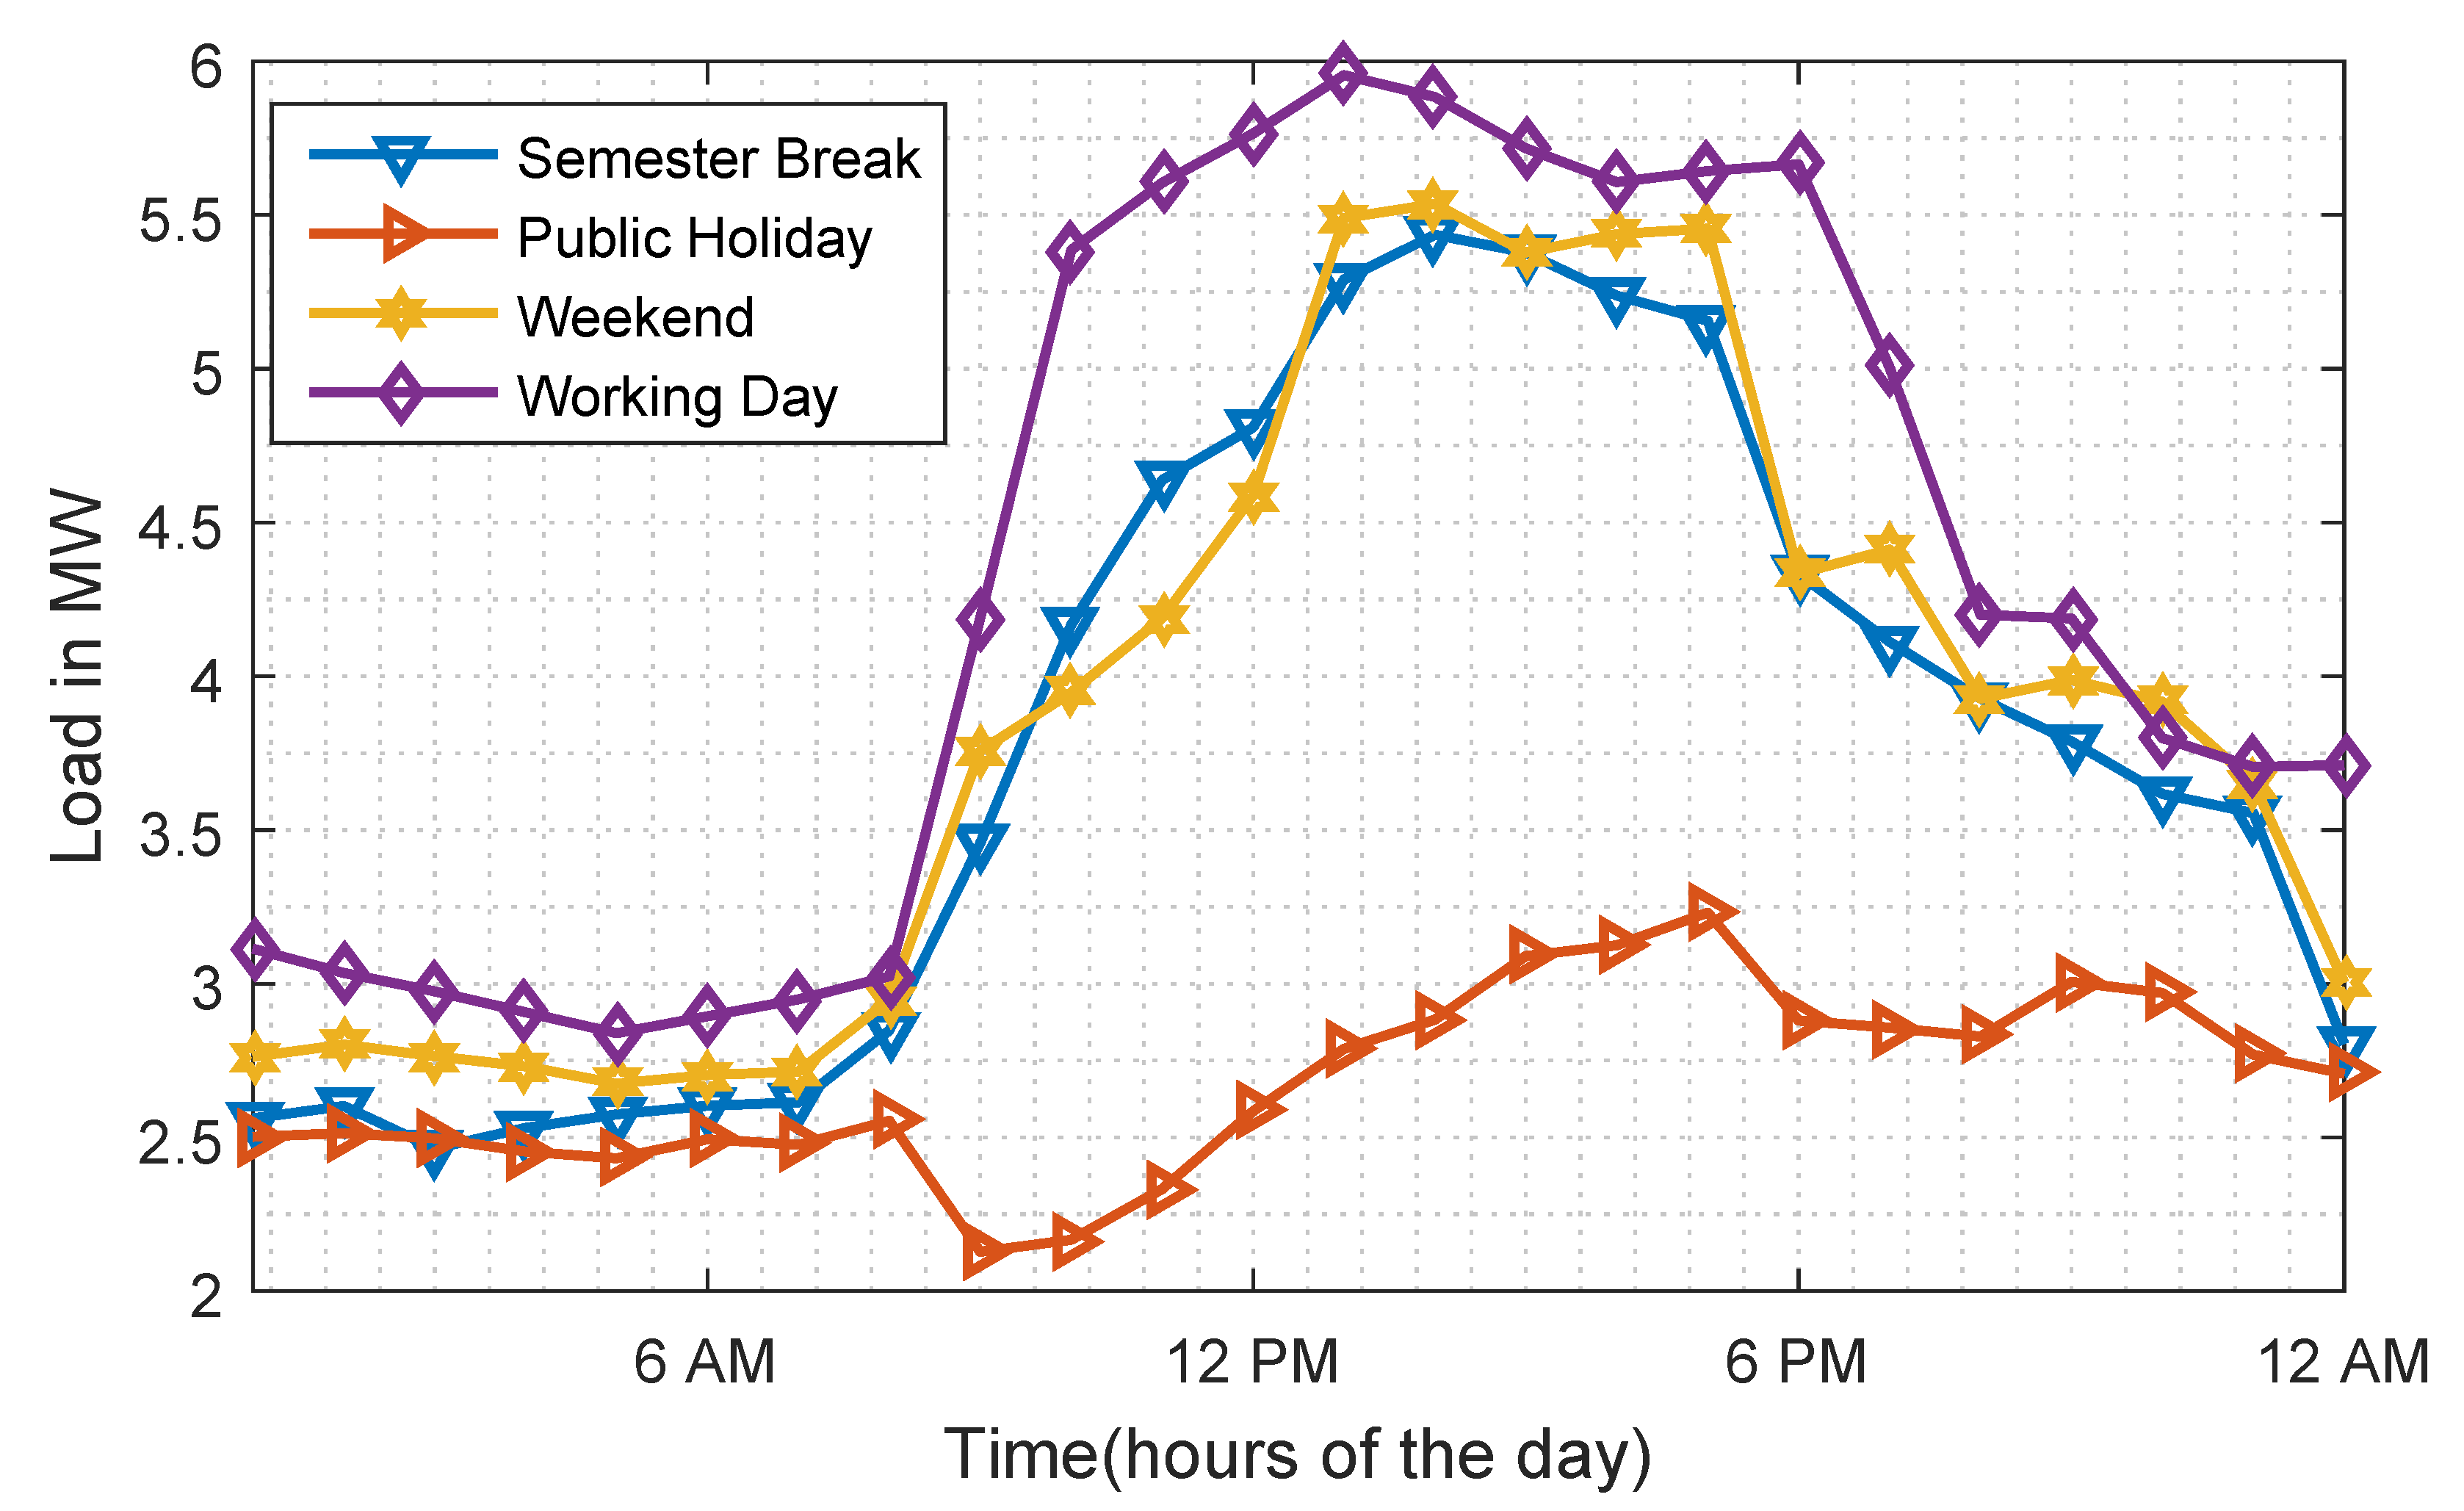
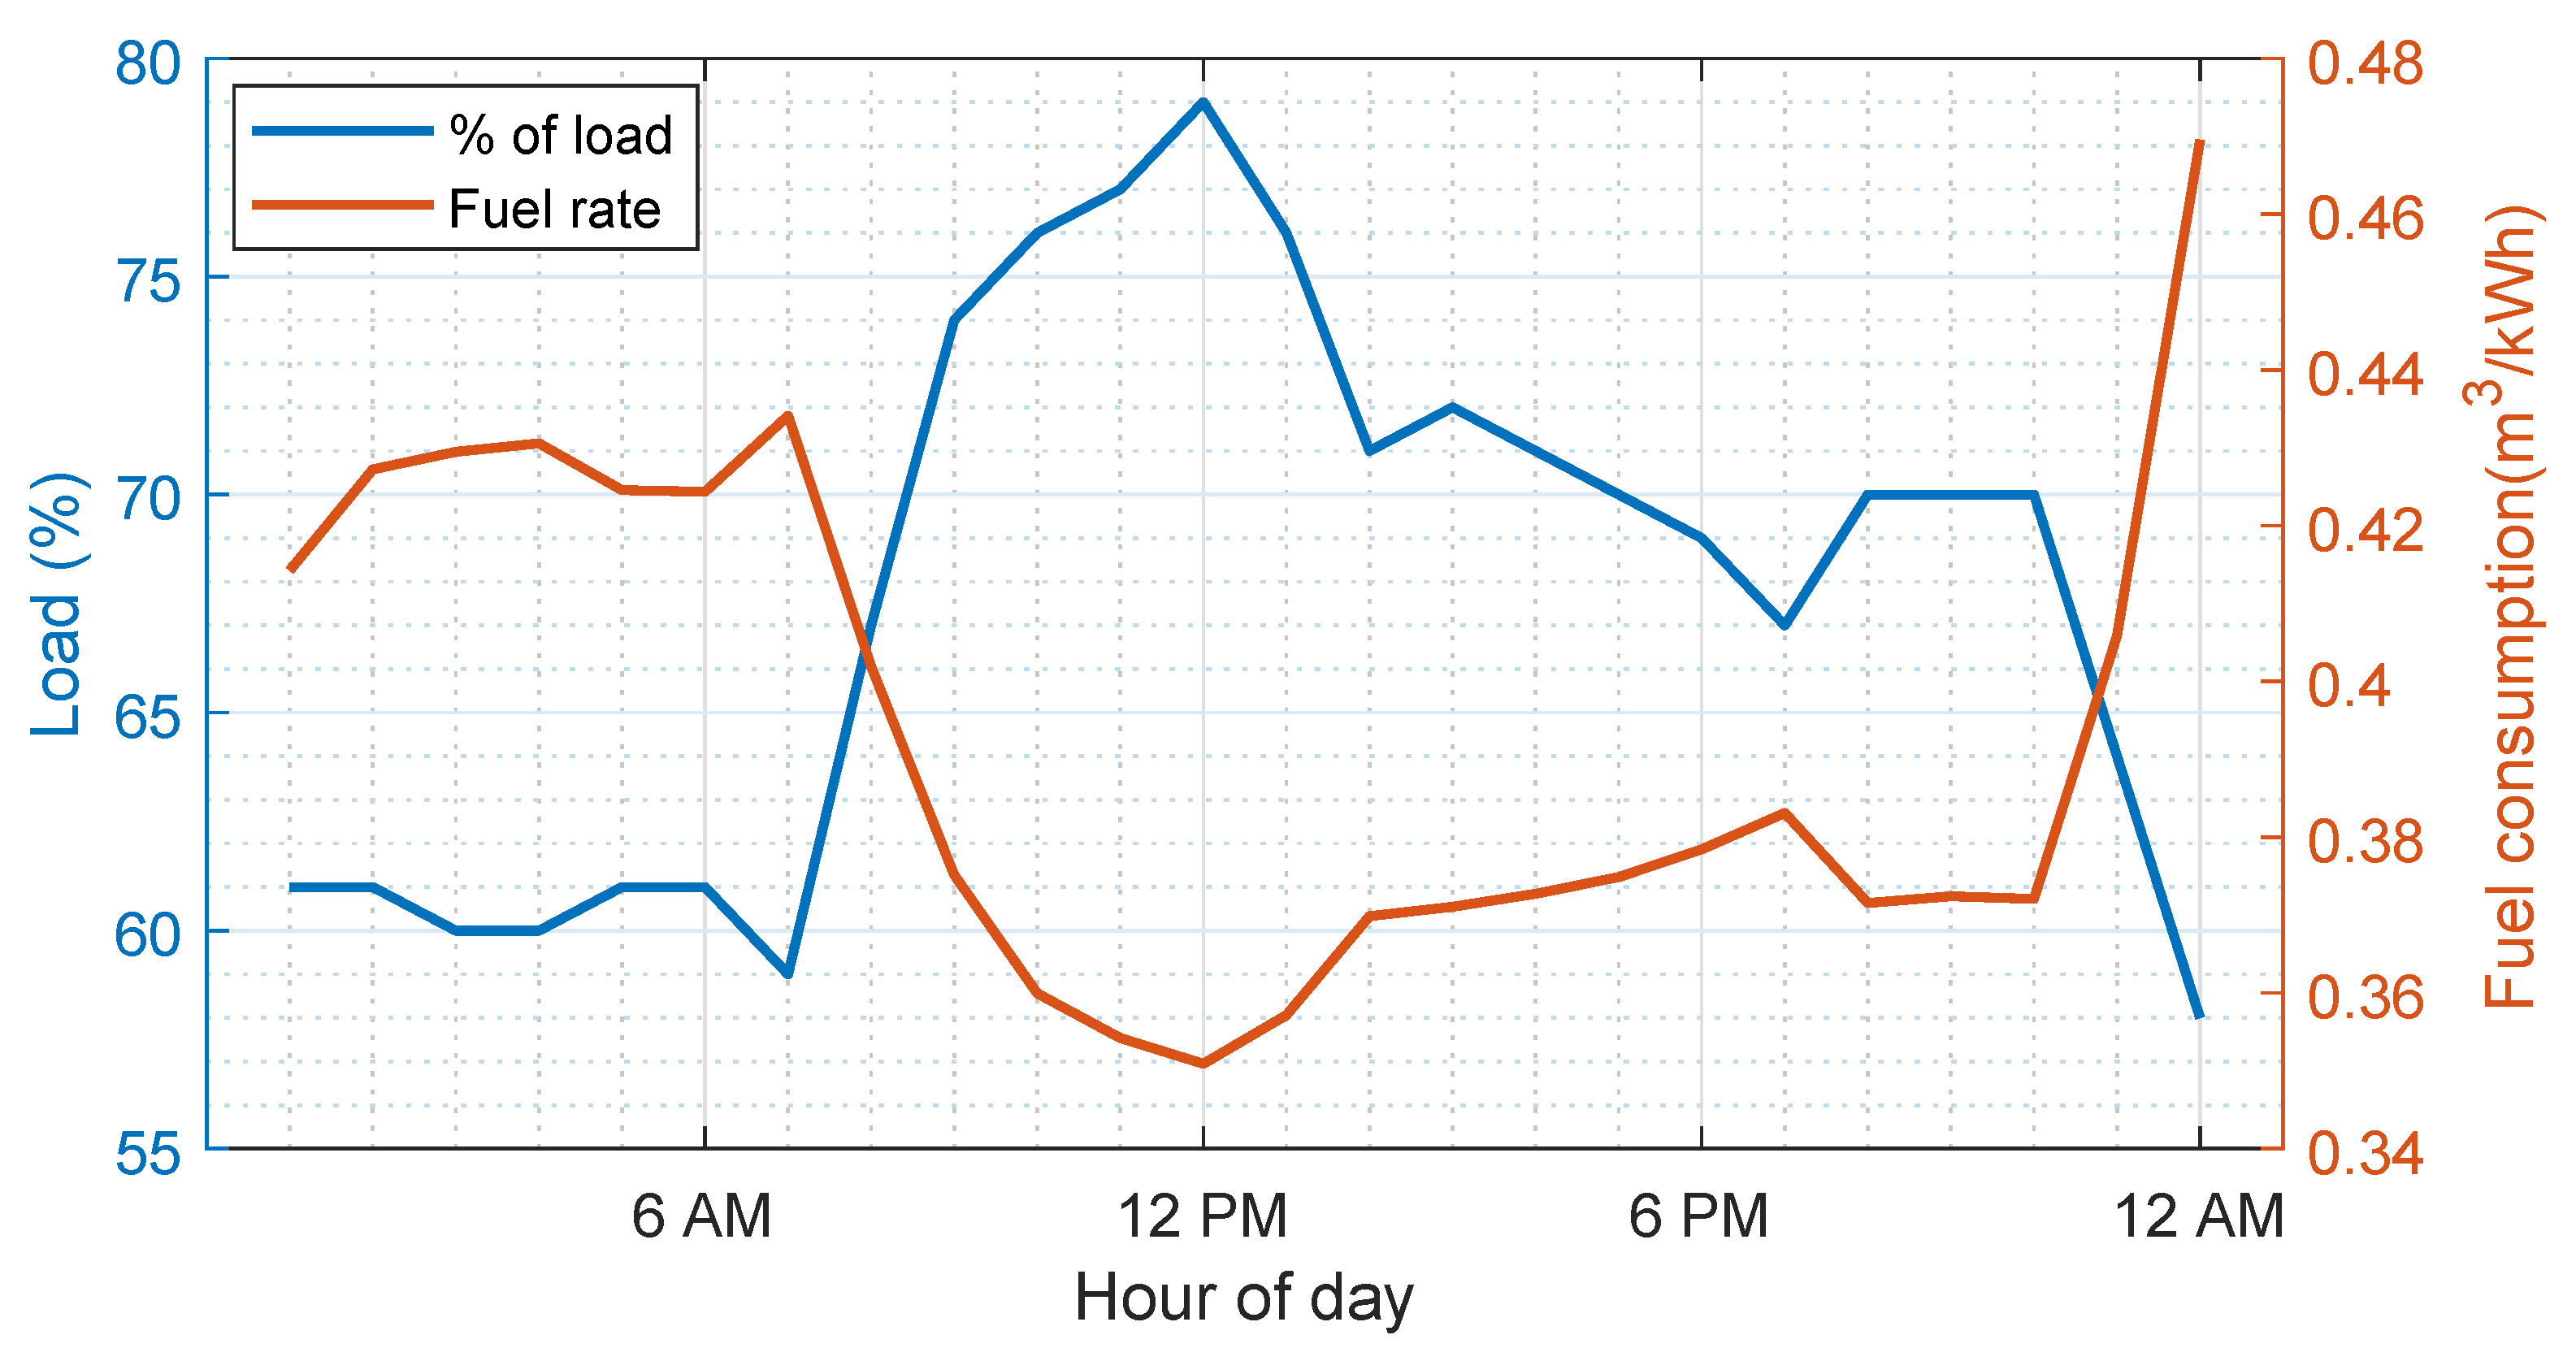
- In working days (or study weeks), the UTP microgrid is characterized by a low load at night and early morning (12 a.m. to 6.30 a.m.), and an increased load between 6.30 a.m. and 10 a.m.; from the working day load profile, it can also be observed that there are two electrical demand peaks: Aa daytime peak between 11 a.m. and 1 p.m., and an evening peak, around 9 p.m., which may last about 2 h. During this evening peak, demand varies between 3.7–4.2 MW. To supply this 4.2 MW demand, the two generation units, with total capacity of 8.4 MW, are operated. This results in low efficiency and increased production costs.
- Daily energy consumption during the weekend and semester break are nearly equal. However, the weekend load profile experiences more fluctuations.
- It can also be remarked that the lowest energy demand on the UTP microgrid is during public holidays.
3.3. Data Presentation
4. Microgrid Performance Indices
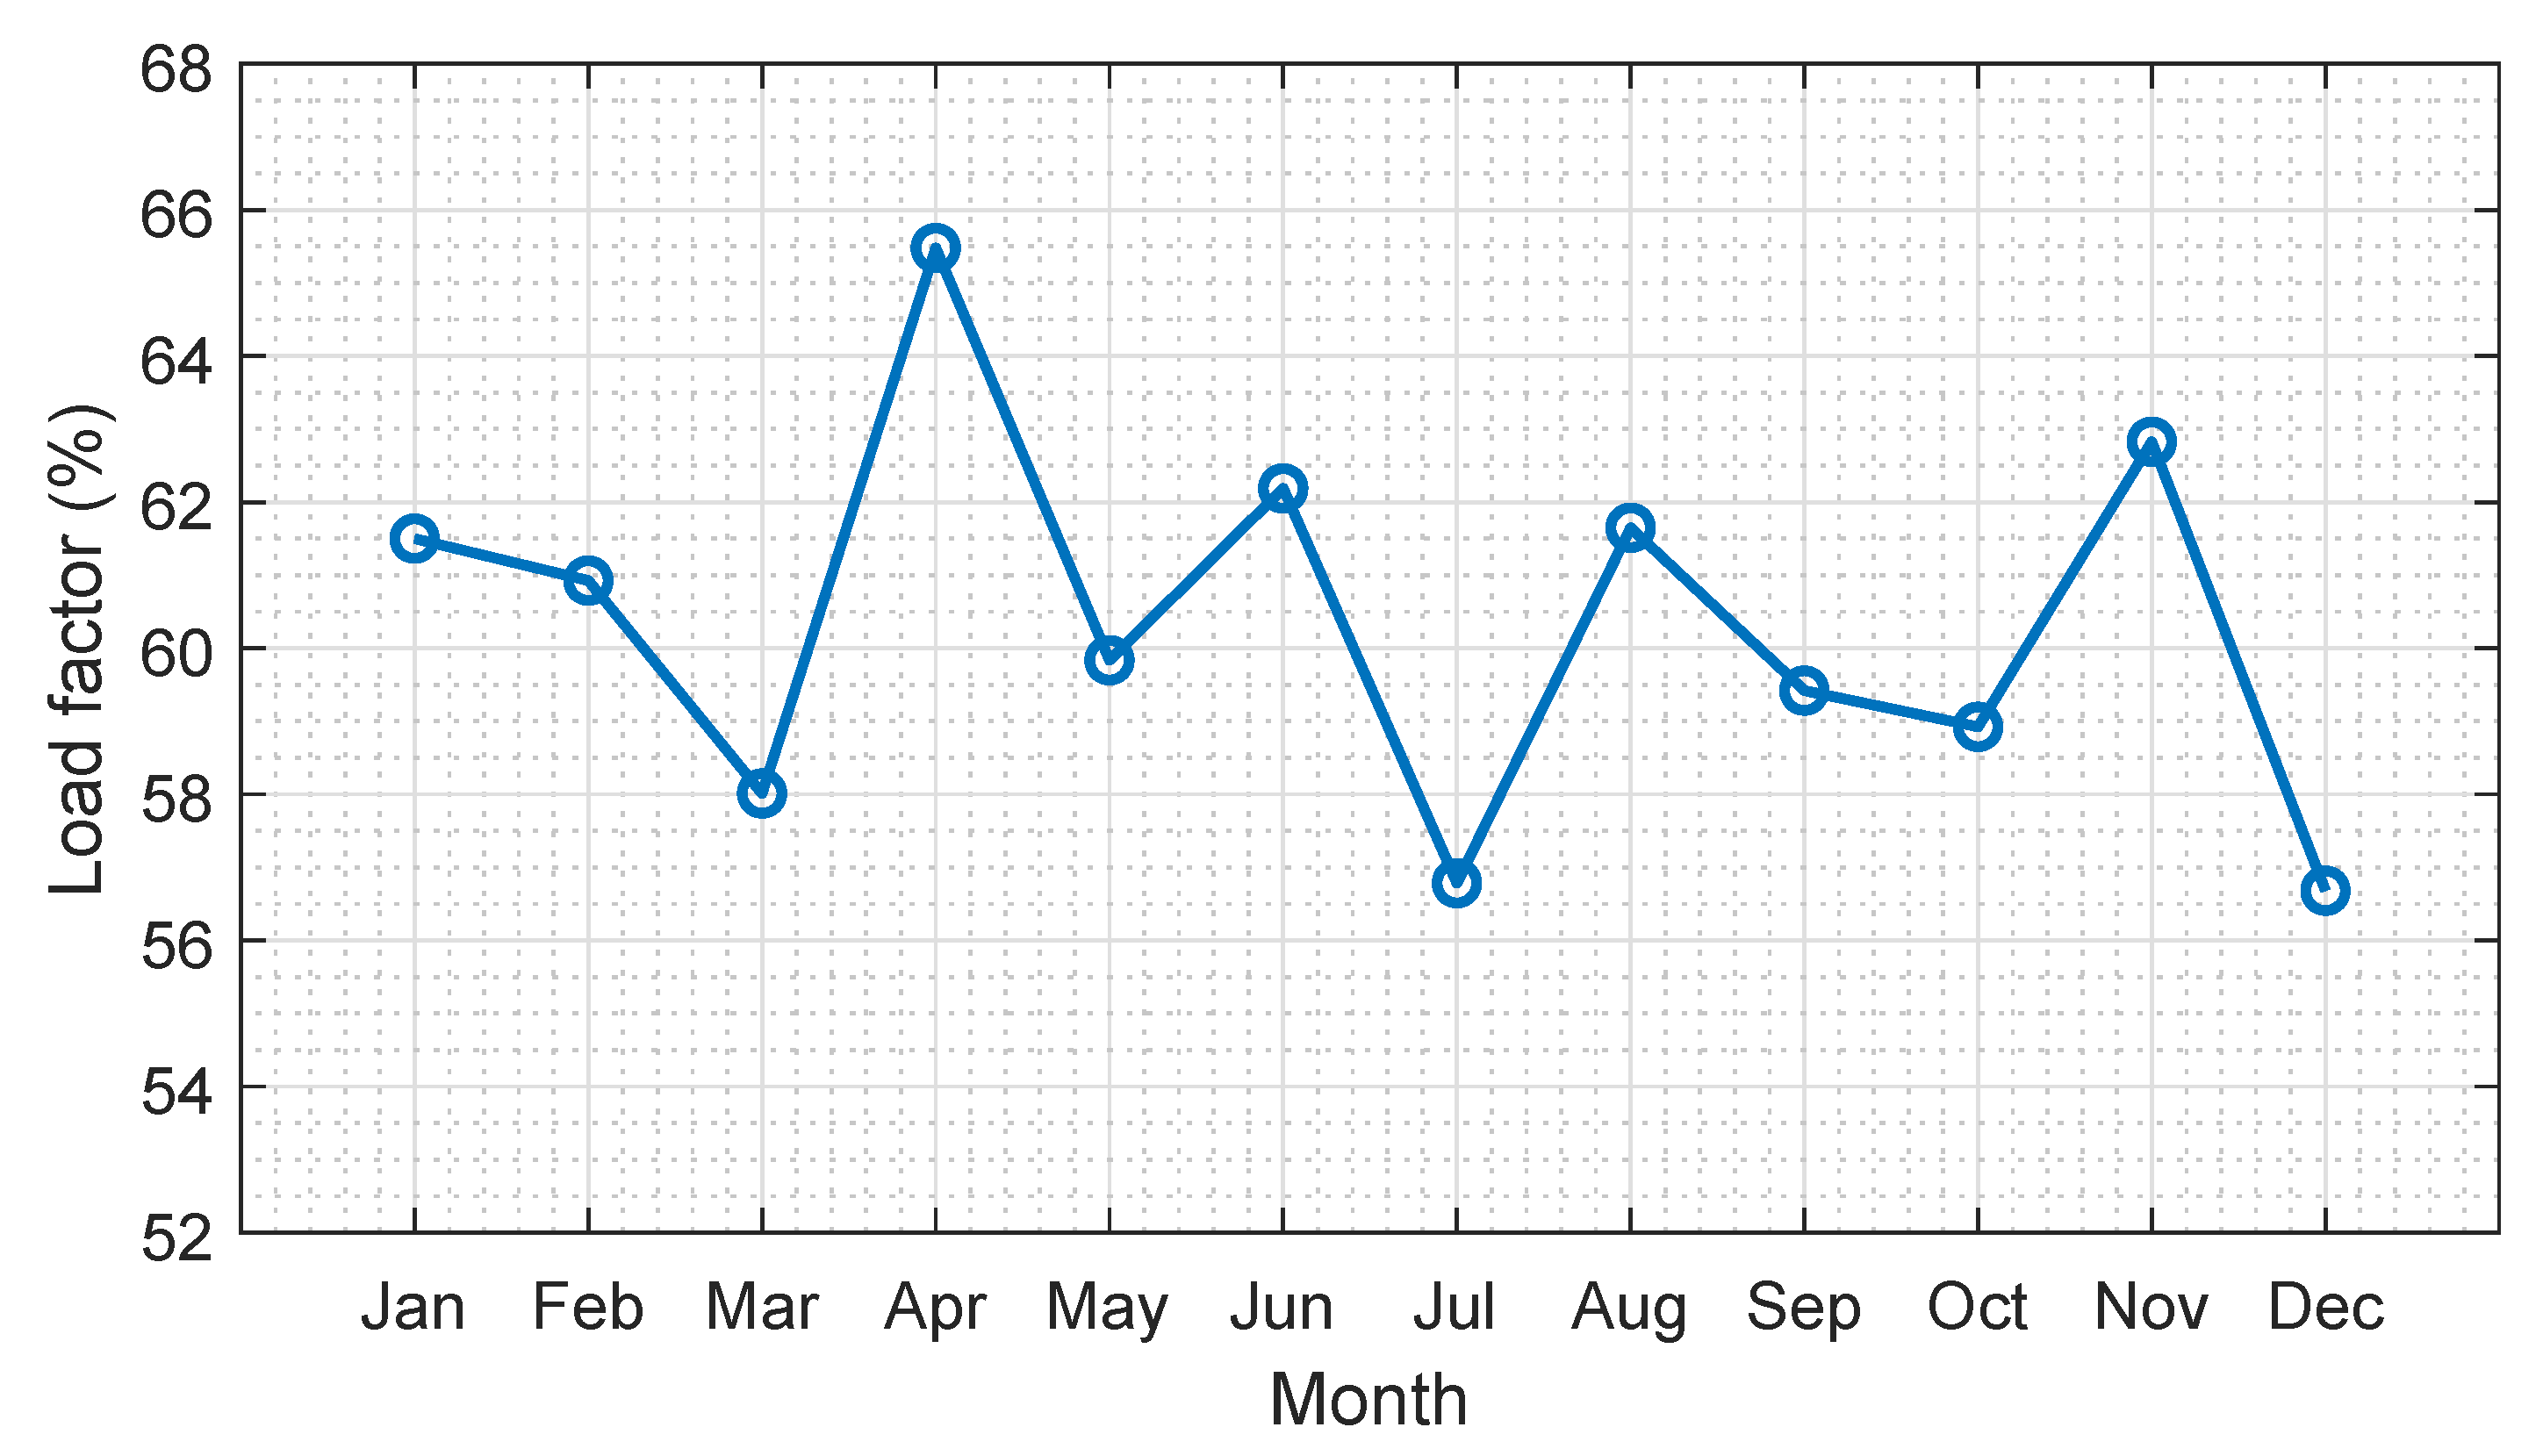
4.1. Load Factor
4.2. Plant (Microgrid) Operating Factor
4.3. Plant Capacity ()
4.4. Plant Capacity Factor ()
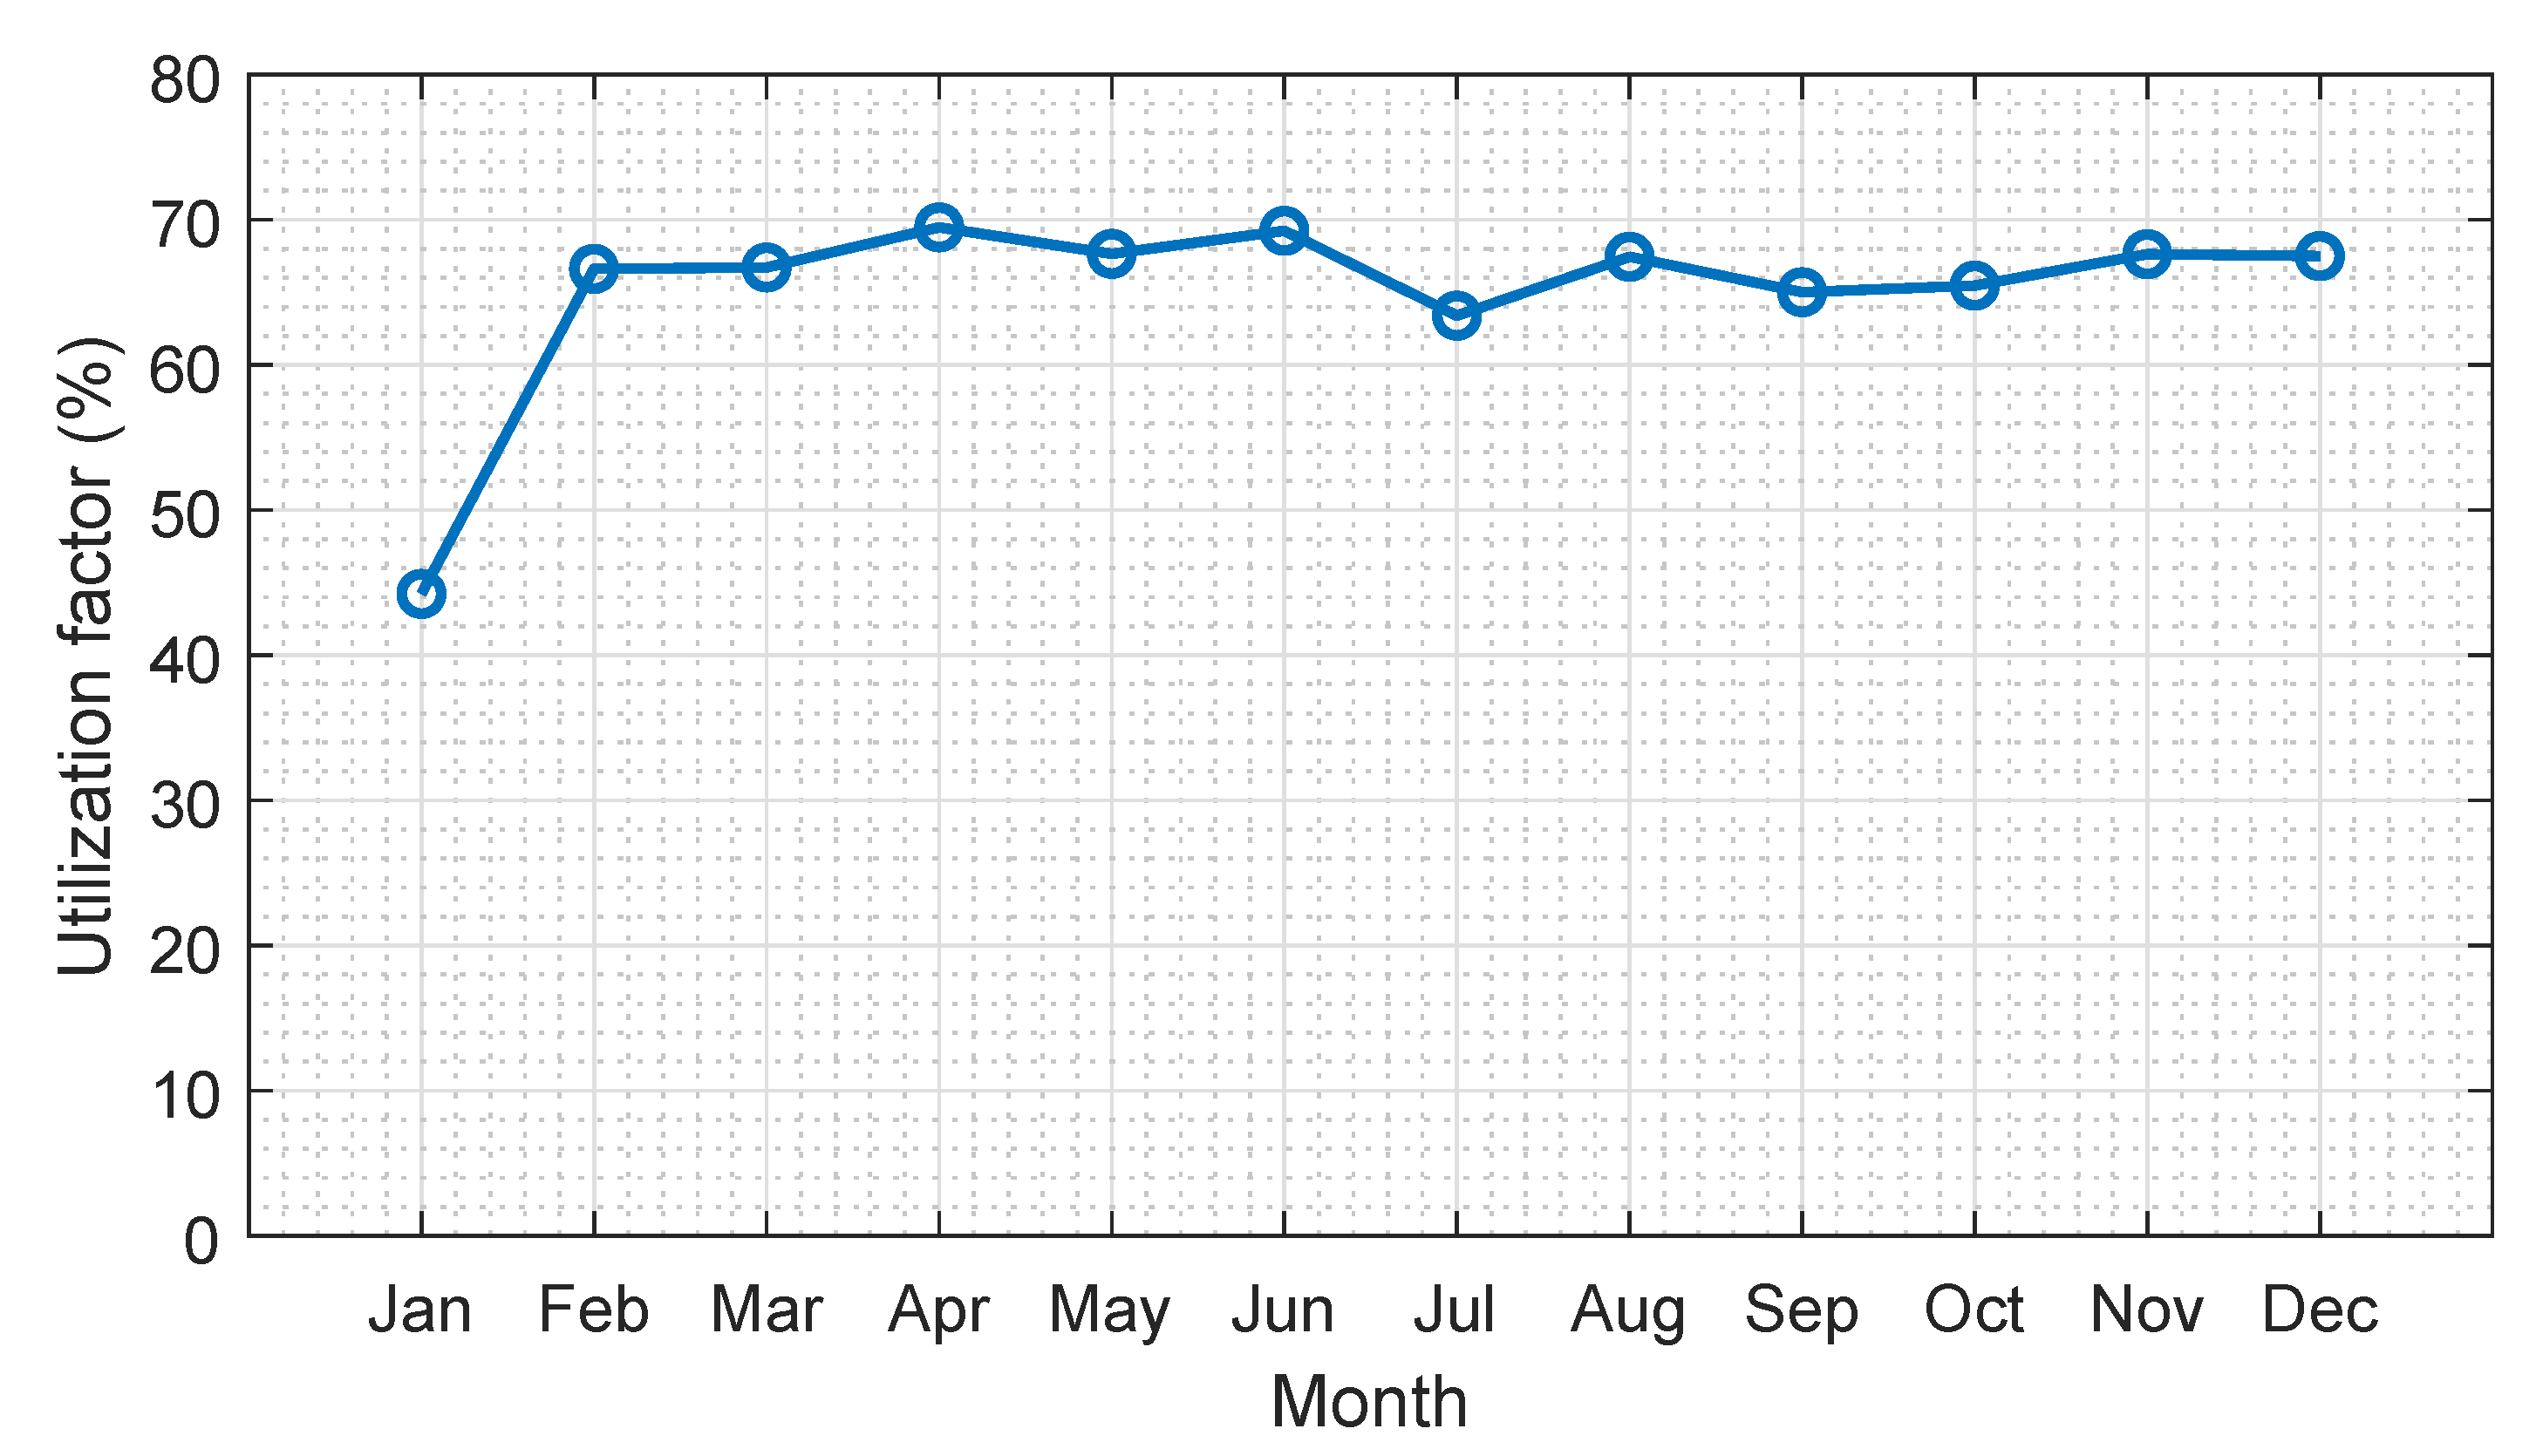
4.5. Utilization Factor ()
4.6. Utility Factor ()
4.7. Plant Use Factor ()
5. Cost Analysis of Peak and Part Load Operations
6. Result and Discussion
6.1. Performance of the Test Microgrid
6.2. Cost of the Peak and Part Load Operations
- (i)
- Operating the gas turbine generator at the optimum production level;
- (ii)
- scheduling the generators of microgrid most economically; and
- (iii)
- reducing the gap between average load and peak load.
7. Conclusions
Author Contributions
Funding
Acknowledgments
Conflicts of Interest
Abbreviations
| TNB | Tenaga Nasional Berhad |
| IPPs | Independent Power Producers |
| SREP | Small Renewable Energy Power |
| FiT | Feed-in-Tariff |
| SESB | Sabah Electricity Sdn Bhd |
| UTP | Universiti Teknologi PETRONAS |
| RM | Ringgit Malaysia (Malaysian Ringgit) |
| USD | U.S. Dollar |
References
- Walsh, P.P.; Fletcher, P. Gas Turbine Performance; John Wiley & Sons: Hoboken, NJ, USA, 2004. [Google Scholar]
- Boyce, M.P. Gas Turbine Engineering Handbook; Elsevier: Amsterdam, The Netherlands, 2011. [Google Scholar]
- Sasao, T.; Shimoki, T.; Akatsu, F.; Liu, K. Performance Evaluation of H-25 Gas Turbine. Hitachi Rev. 2003, 52, 97. [Google Scholar]
- Study on Gas-Fired Combined Cycle Power Plant Project in Malaysia; Technical Report; Tokyo Electric Power Services Co. Ltd.: Tokyo, Japan, 2016.
- El-Wakil, M.M. Powerplant Technology; Tata McGraw-Hill Education: New York, NY, USA, 1984. [Google Scholar]
- Gao, D.W. Energy Storage for Sustainable Microgrid; Academic Press: Cambridge, MA, USA, 2015. [Google Scholar]
- Oriti, G.; Julian, A.L.; Anglani, N.; Hernandez, G.D. Novel economic analysis to design the energy storage control system of a remote islanded microgrid. IEEE Trans. Ind. Appl. 2018, 54, 6332–6342. [Google Scholar] [CrossRef]
- Farrokhabadi, M.; Solanki, B.V.; Canizares, C.A.; Bhattacharya, K.; Koenig, S.; Sauter, P.S.; Leibfried, T.; Hohmann, S. Energy storage in microgrids: compensating for generation and demand fluctuations while providing ancillary services. IEEE Power Energy Mag. 2017, 15, 81–91. [Google Scholar] [CrossRef]
- Mehta, V.; Mehta, R. Principles of Power System; S. Chand: New Delhi, India, 2004. [Google Scholar]
- Uddin, M.; Romlie, M.F.; Abdullah, M.F.; Halim, S.A.; Kwang, T.C. A review on peak load shaving strategies. Renew. Sustain. Energy Rev. 2018, 82, 3323–3332. [Google Scholar] [CrossRef]
- Gu, W.; Wu, Z.; Bo, R.; Liu, W.; Zhou, G.; Chen, W.; Wu, Z. Modeling, planning and optimal energy management of combined cooling, heating and power microgrid: A review. Int. J. Electr. Power Energy Syst. 2014, 54, 26–37. [Google Scholar] [CrossRef]
- Zunnurain, I.; Maruf, M.; Rahman, M.; Shafiullah, G. Implementation of advanced demand side management for microgrid incorporating demand response and home energy management system. Infrastructures 2018, 3, 50. [Google Scholar] [CrossRef]
- Uddin, M.; Romlie, M.; Abdullah, M.; Hassan, K.; Tan, C.; Bakar, A. Modeling of campus microgrid for off-grid application. In Proceedings of the 5th IET International Conference on Clean Energy and Technology (CEAT2018), Kuala Lumpur, Malaysia, 5–6 September 2018. [Google Scholar]
- Aminov, R.; Kozhevnikov, A. Optimization of the operating conditions of gas-turbine power stations considering the effect of equipment deterioration. Therm. Eng. 2017, 64, 715–722. [Google Scholar] [CrossRef]
- Prete, C.L.; Hobbs, B.F.; Norman, C.S.; Cano-Andrade, S.; Fuentes, A.; von Spakovsky, M.R.; Mili, L. Sustainability and reliability assessment of microgrids in a regional electricity market. Energy 2012, 41, 192–202. [Google Scholar] [CrossRef]
- Uddin, M.; Romlie, M.F.; Abdullah, M.F. Performance Evaluation of Islanded Microgrid Using Load Flow Analysis Technique. In Proceedings of the 2018 International Conference on Intelligent and Advanced System (ICIAS), Kuala Lumpur, Malaysia, 13–14 August 2018; pp. 1–6. [Google Scholar]
- Oyedepo, S.O.; Fagbenle, R.; Adefila, S.; Adavbiele, S. Performance evaluation and economic analysis of a gas turbine power plant in Nigeria. Energy Convers. Manag. 2014, 79, 431–440. [Google Scholar] [CrossRef] [Green Version]
- Oyedepo, S.O.; Fagbenle, R.O.; Adefila, S.S. Assessment of performance indices of selected gas turbine power plants in Nigeria. Energy Sci. Eng. 2015, 3, 239–256. [Google Scholar] [CrossRef]
- Rahman, S.; Rahman, H.A. Use of Photovoltaics in Microgrid as Energy Source and Control Method using MATLAB/Simulink. Int. J. Electr. Comput. Eng. 2016, 6, 851–858. [Google Scholar] [CrossRef]
- Malaysia Energy Commission. Malaysia Energy Statistics Handbook 2015; Energy Commission: Kuala Lumpur, Malaysia, 2016. [Google Scholar]
- Tehrani, S.S.M.; Avval, M.S.; Alvandifar, N.; Rabiei, H. Technical and economic evaluation of gas turbine inlet air cooling in a combined cycle power plant. In Proceedings of the 3rd Conference on Thermal Power Plants, Tehran, Iran, 18–19 October 2011; pp. 1–6. [Google Scholar]
- Kothari, D.P.; Nagrath, I. Modern Power System Analysis; Tata McGraw-Hill Education: New York, NY, USA, 2011. [Google Scholar]
- Chua, K.H.; Lim, Y.S.; Morris, S. Energy storage system for peak shaving. Int. J. Energy Sect. Manag. 2016, 10, 3–18. [Google Scholar] [CrossRef]
- Grigsby, L.L. Electric Power Generation, Transmission, and Distribution; CRC Press: Boca Raton, FL, USA, 2018. [Google Scholar]
- Raja, A.; Srivastava, A.P. Power Plant Engineering; New Age International: Delhi, India, 2006. [Google Scholar]
- Husain, A. Electric Power System; CBS Publisher & Distributors: Delhi, India, 2014. [Google Scholar]
- Ray, S. Electrical Power Systems: Concept, Theory and Practice; PHI Learning Pvt. Ltd.: Delhi, India, 2014. [Google Scholar]
- Petek, J.; Hamilton, P. Performance monitoring for gas turbines. Orbit 2005, 25, 64–74. [Google Scholar]
- Melodi, A.; Famakin, S. Assessment of solar PV-grid parity in Akure, South-West Nigeria. J. Emerg. Trends Eng. Appl. Sci. 2011, 2, 531–536. [Google Scholar]
- Waniczek, P.; Therkorn, D.; Lilley, D. Optimal Gas Turbine Power Plant Operation Regarding Fuel and Maintenance Cost. In Proceedings of the ASME Turbo Expo 2017: Turbomachinery Technical Conference and Exposition, Charlotte, NC, USA; 2017; p. V003T08A009. [Google Scholar]


| Hydro | Natural Gas | Coal | Diesel | Biomass | Solar | Biogas | Others | Total | ||
|---|---|---|---|---|---|---|---|---|---|---|
| TNB | 1911 | 4705 | - | - | - | - | - | - | 6616 | |
| IPPs | 20 | 8069 | 7200 | - | - | - | - | - | 15,289 | |
| Peninsular | Co-Generation | - | 514 | - | 8 | 79 | - | - | 51 | 652 |
| Self-Generation | 5 | - | - | 338 | 293 | 1 | - | - | 637 | |
| SREP/ FiT | 9 | - | - | - | 19 | 160 | 12 | - | 200 | |
| Subtotal | 1946 | 13,288 | 7200 | 346 | 392 | 161 | 12 | 51 | 23,396 | |
| SESB | 70 | 112 | - | 181 | - | - | - | - | 363 | |
| IPPs | - | 922 | - | 190 | - | - | - | - | 1112 | |
| Sabah | Co-Generation | - | 42 | - | 8 | 110 | - | - | - | 160 |
| Self-Generation | - | - | - | - | 115 | - | 3 | - | 543 | |
| SREP/ FiT | 7 | - | - | 425 | 52 | 0 | - | - | 59 | |
| Subtotal | 77 | 1076 | 0 | 803 | 277 | 0 | 3 | 0 | 2236 | |
| SEB | 351 | 595 | 480 | 158 | - | - | - | - | 1584 | |
| IPPs | 2400 | - | - | - | - | - | - | - | 2400 | |
| Sarwak | Co-Generation | - | 289 | - | - | 60 | - | - | - | 289 |
| Self-Generation | - | - | - | 9 | 60 | - | - | 1 | 70 | |
| Subtotal | 2751 | 884 | 480 | 167 | 60 | - | - | 1 | 4343 | |
| Total | 4773 | 15,248 | 7680 | 1315 | 729 | 161 | 15 | 52 | 29,973 |
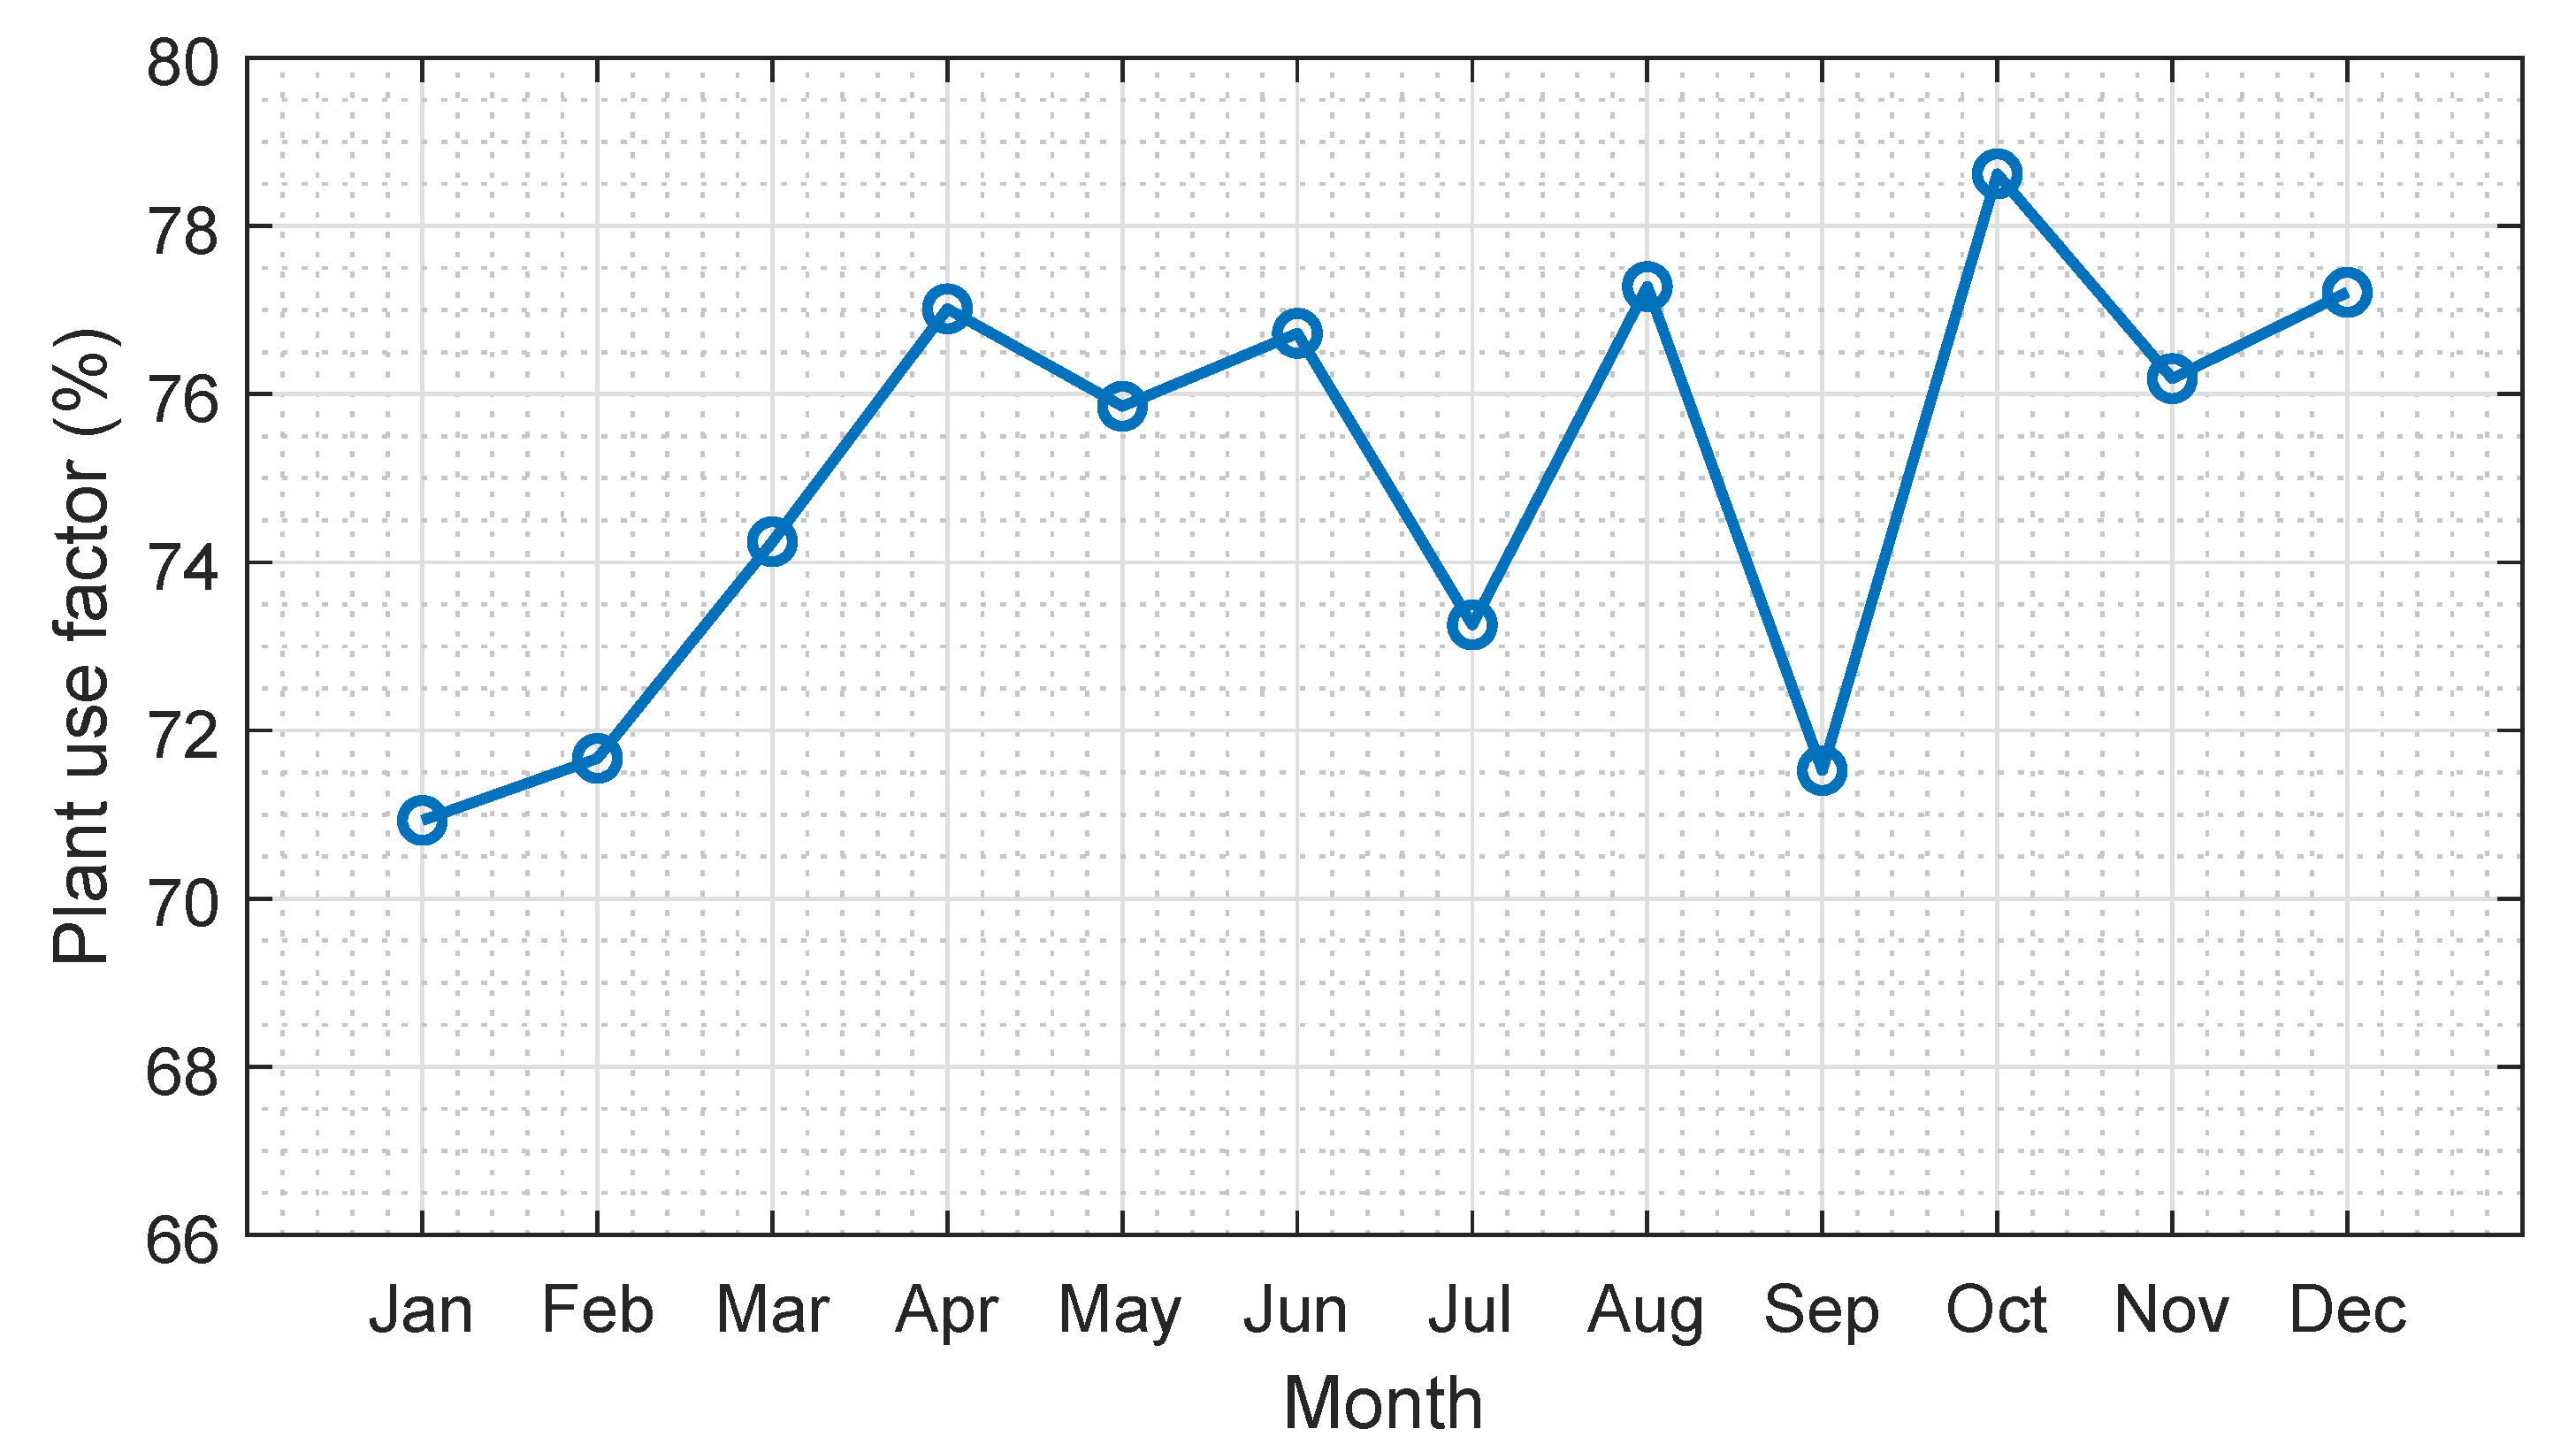
| Month | Installed Capacity (kW) | Generation (kW) | Capacity Utilized (%) | ||||||
|---|---|---|---|---|---|---|---|---|---|
| Unit A | Unit B | Overall | Unit A | Unit B | Overall | Unit A | Unit B | Overall | |
| January | 4200 | 4200 | 8400 | 642 | 3073 | 3715 | 15.2 | 73.1 | 44.2 |
| February | 4200 | 4200 | 8400 | 2238 | 3358 | 5596 | 53.2 | 79.9 | 66.6 |
| March | 4200 | 4200 | 8400 | 2293 | 3311 | 5604 | 54.5 | 78.8 | 66.7 |
| April | 4200 | 4200 | 8400 | 2431 | 3405 | 5836 | 57.8 | 81.0 | 69.4 |
| May | 4200 | 4200 | 8400 | 2272 | 3411 | 5683 | 54.0 | 81.2 | 67.6 |
| June | 4200 | 4200 | 8400 | 3515 | 2301 | 5816 | 83.6 | 54.7 | 69.2 |
| July | 4200 | 4200 | 8400 | 3312 | 2013 | 5325 | 78.8 | 47.9 | 63.3 |
| August | 4200 | 4200 | 8400 | 2548 | 3119 | 5666 | 60.6 | 60.6 | 67.4 |
| September | 4200 | 4200 | 8400 | 2173 | 3326 | 5461 | 51.7 | 79.1 | 65.0 |
| October | 4200 | 4200 | 8400 | 719 | 3258 | 5499 | 17.1 | 77.5 | 65.4 |
| November | 4200 | 4200 | 8400 | 3468 | 2213 | 5681 | 82.5 | 52.6 | 67.6 |
| December | 4200 | 4200 | 8400 | 3522 | 2148 | 5670 | 83.8 | 51.1 | 67.5 |
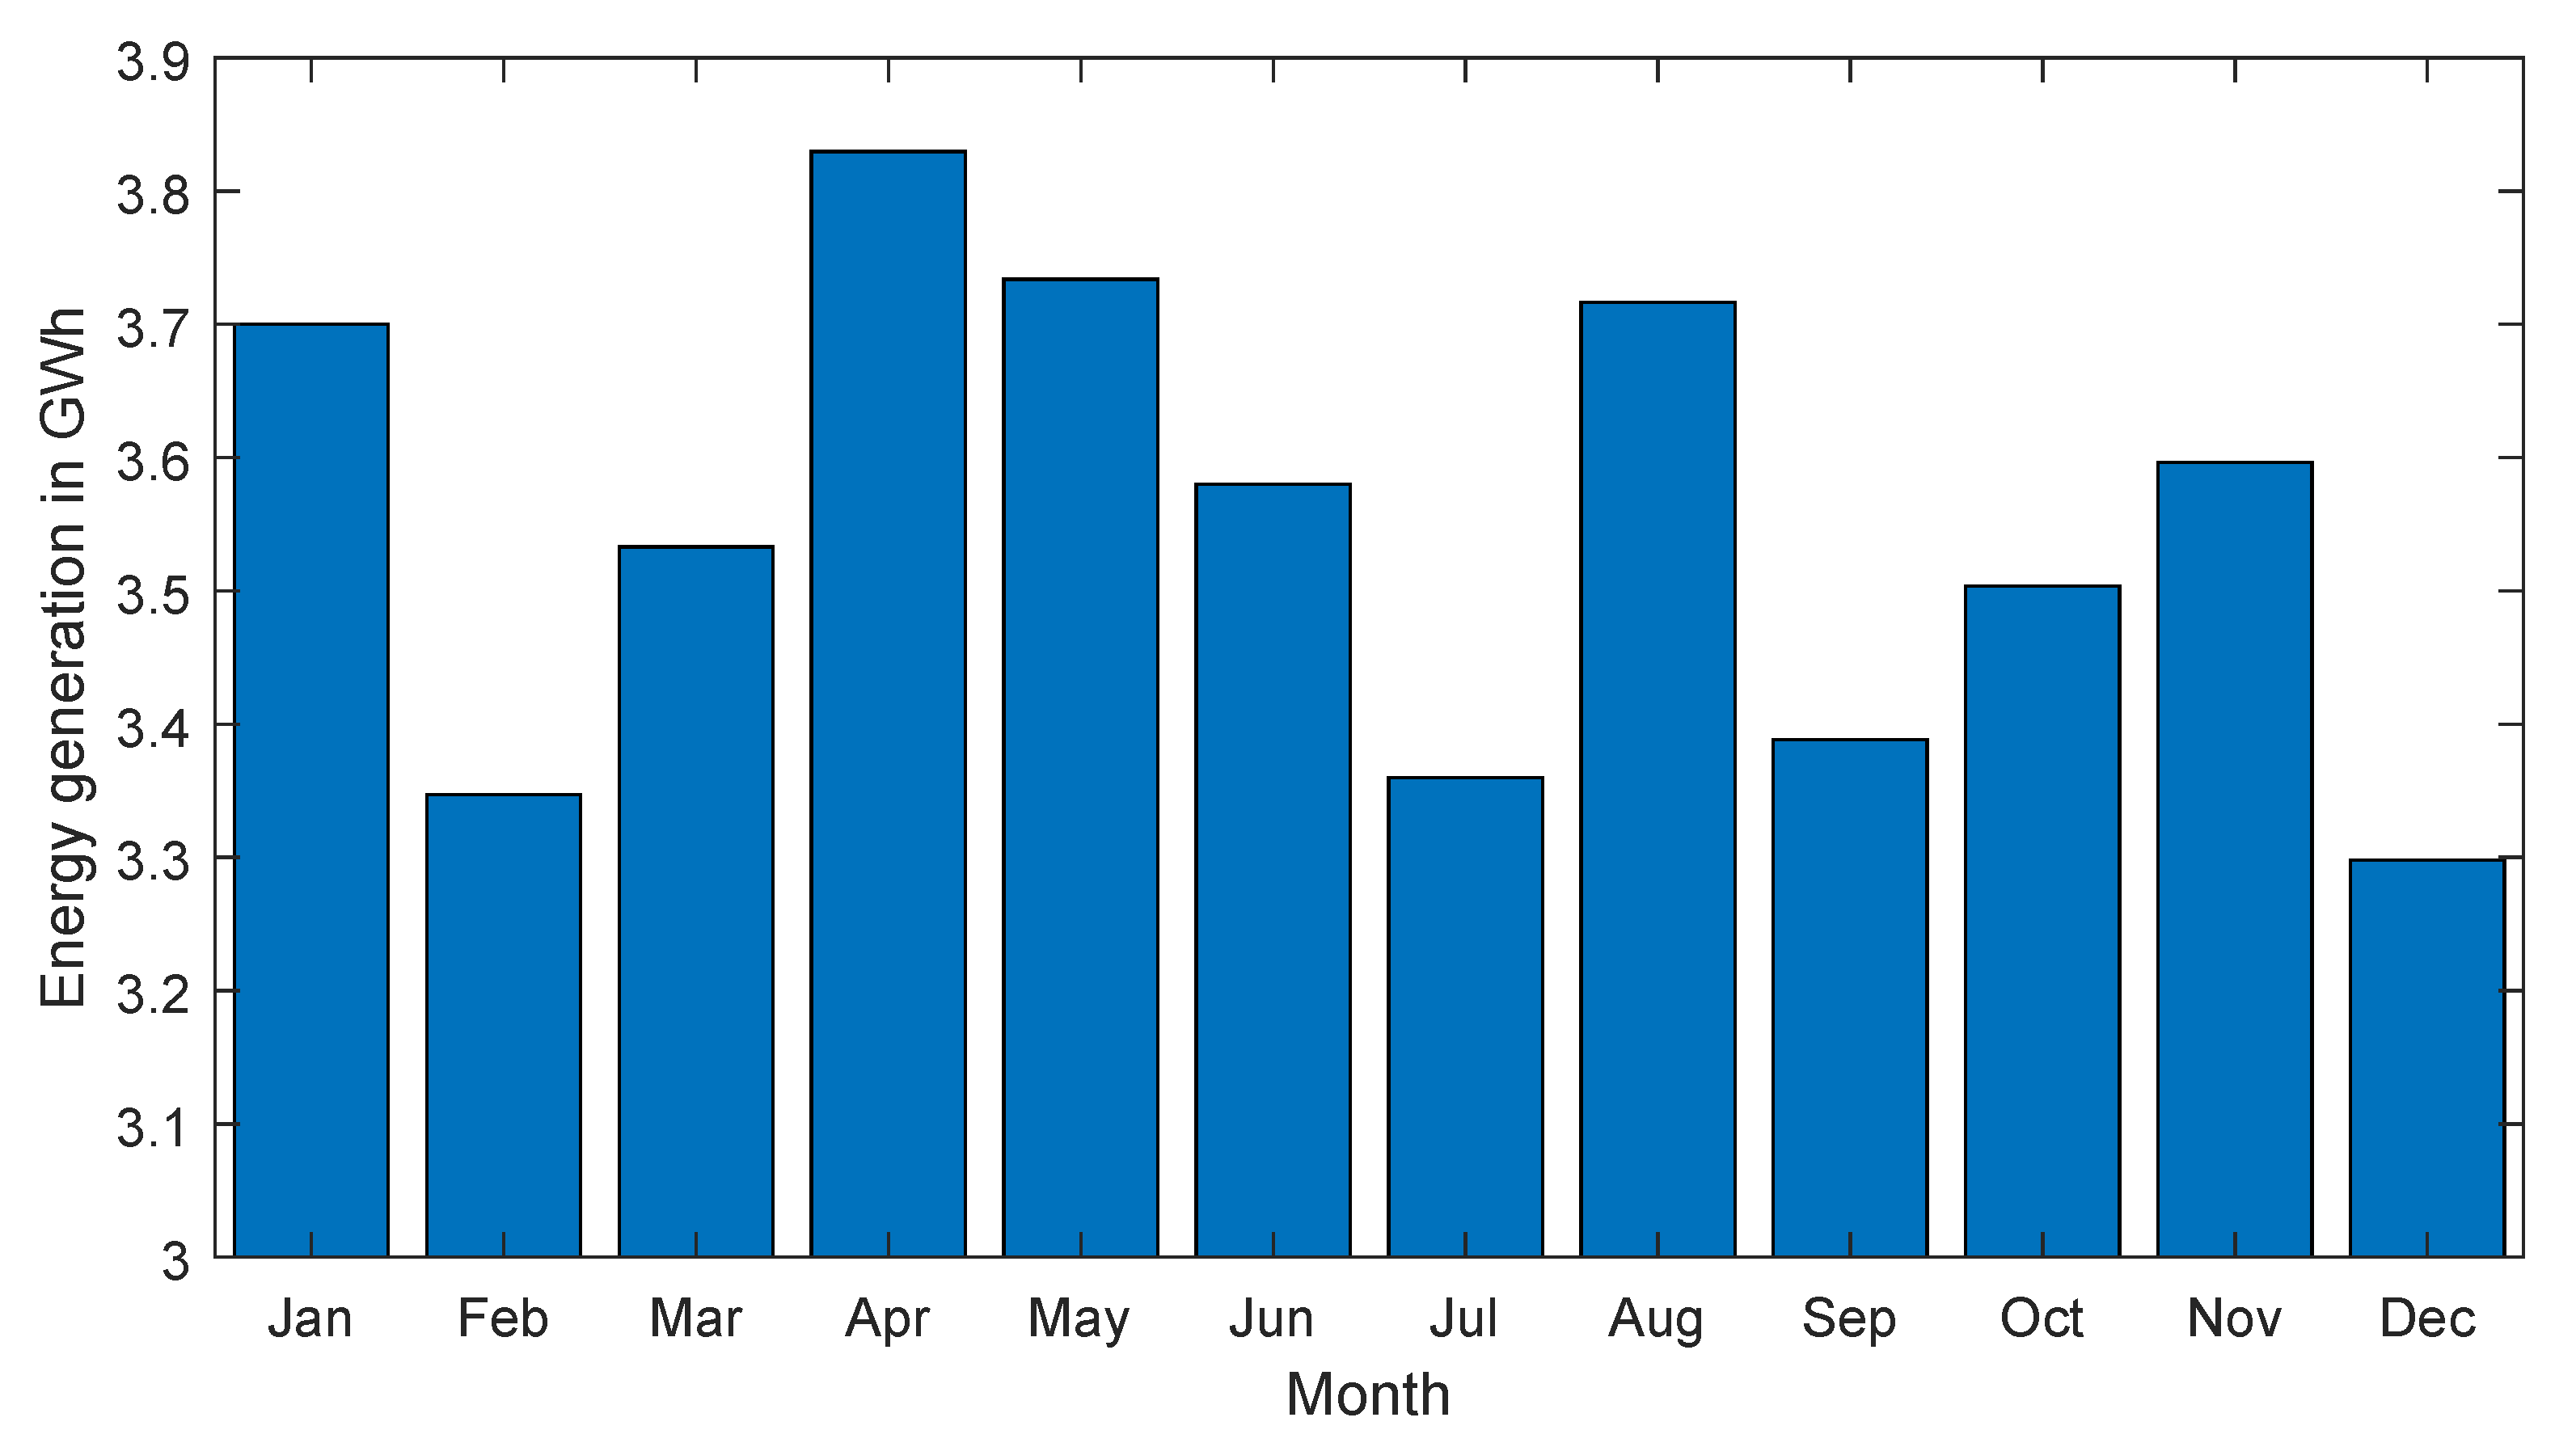
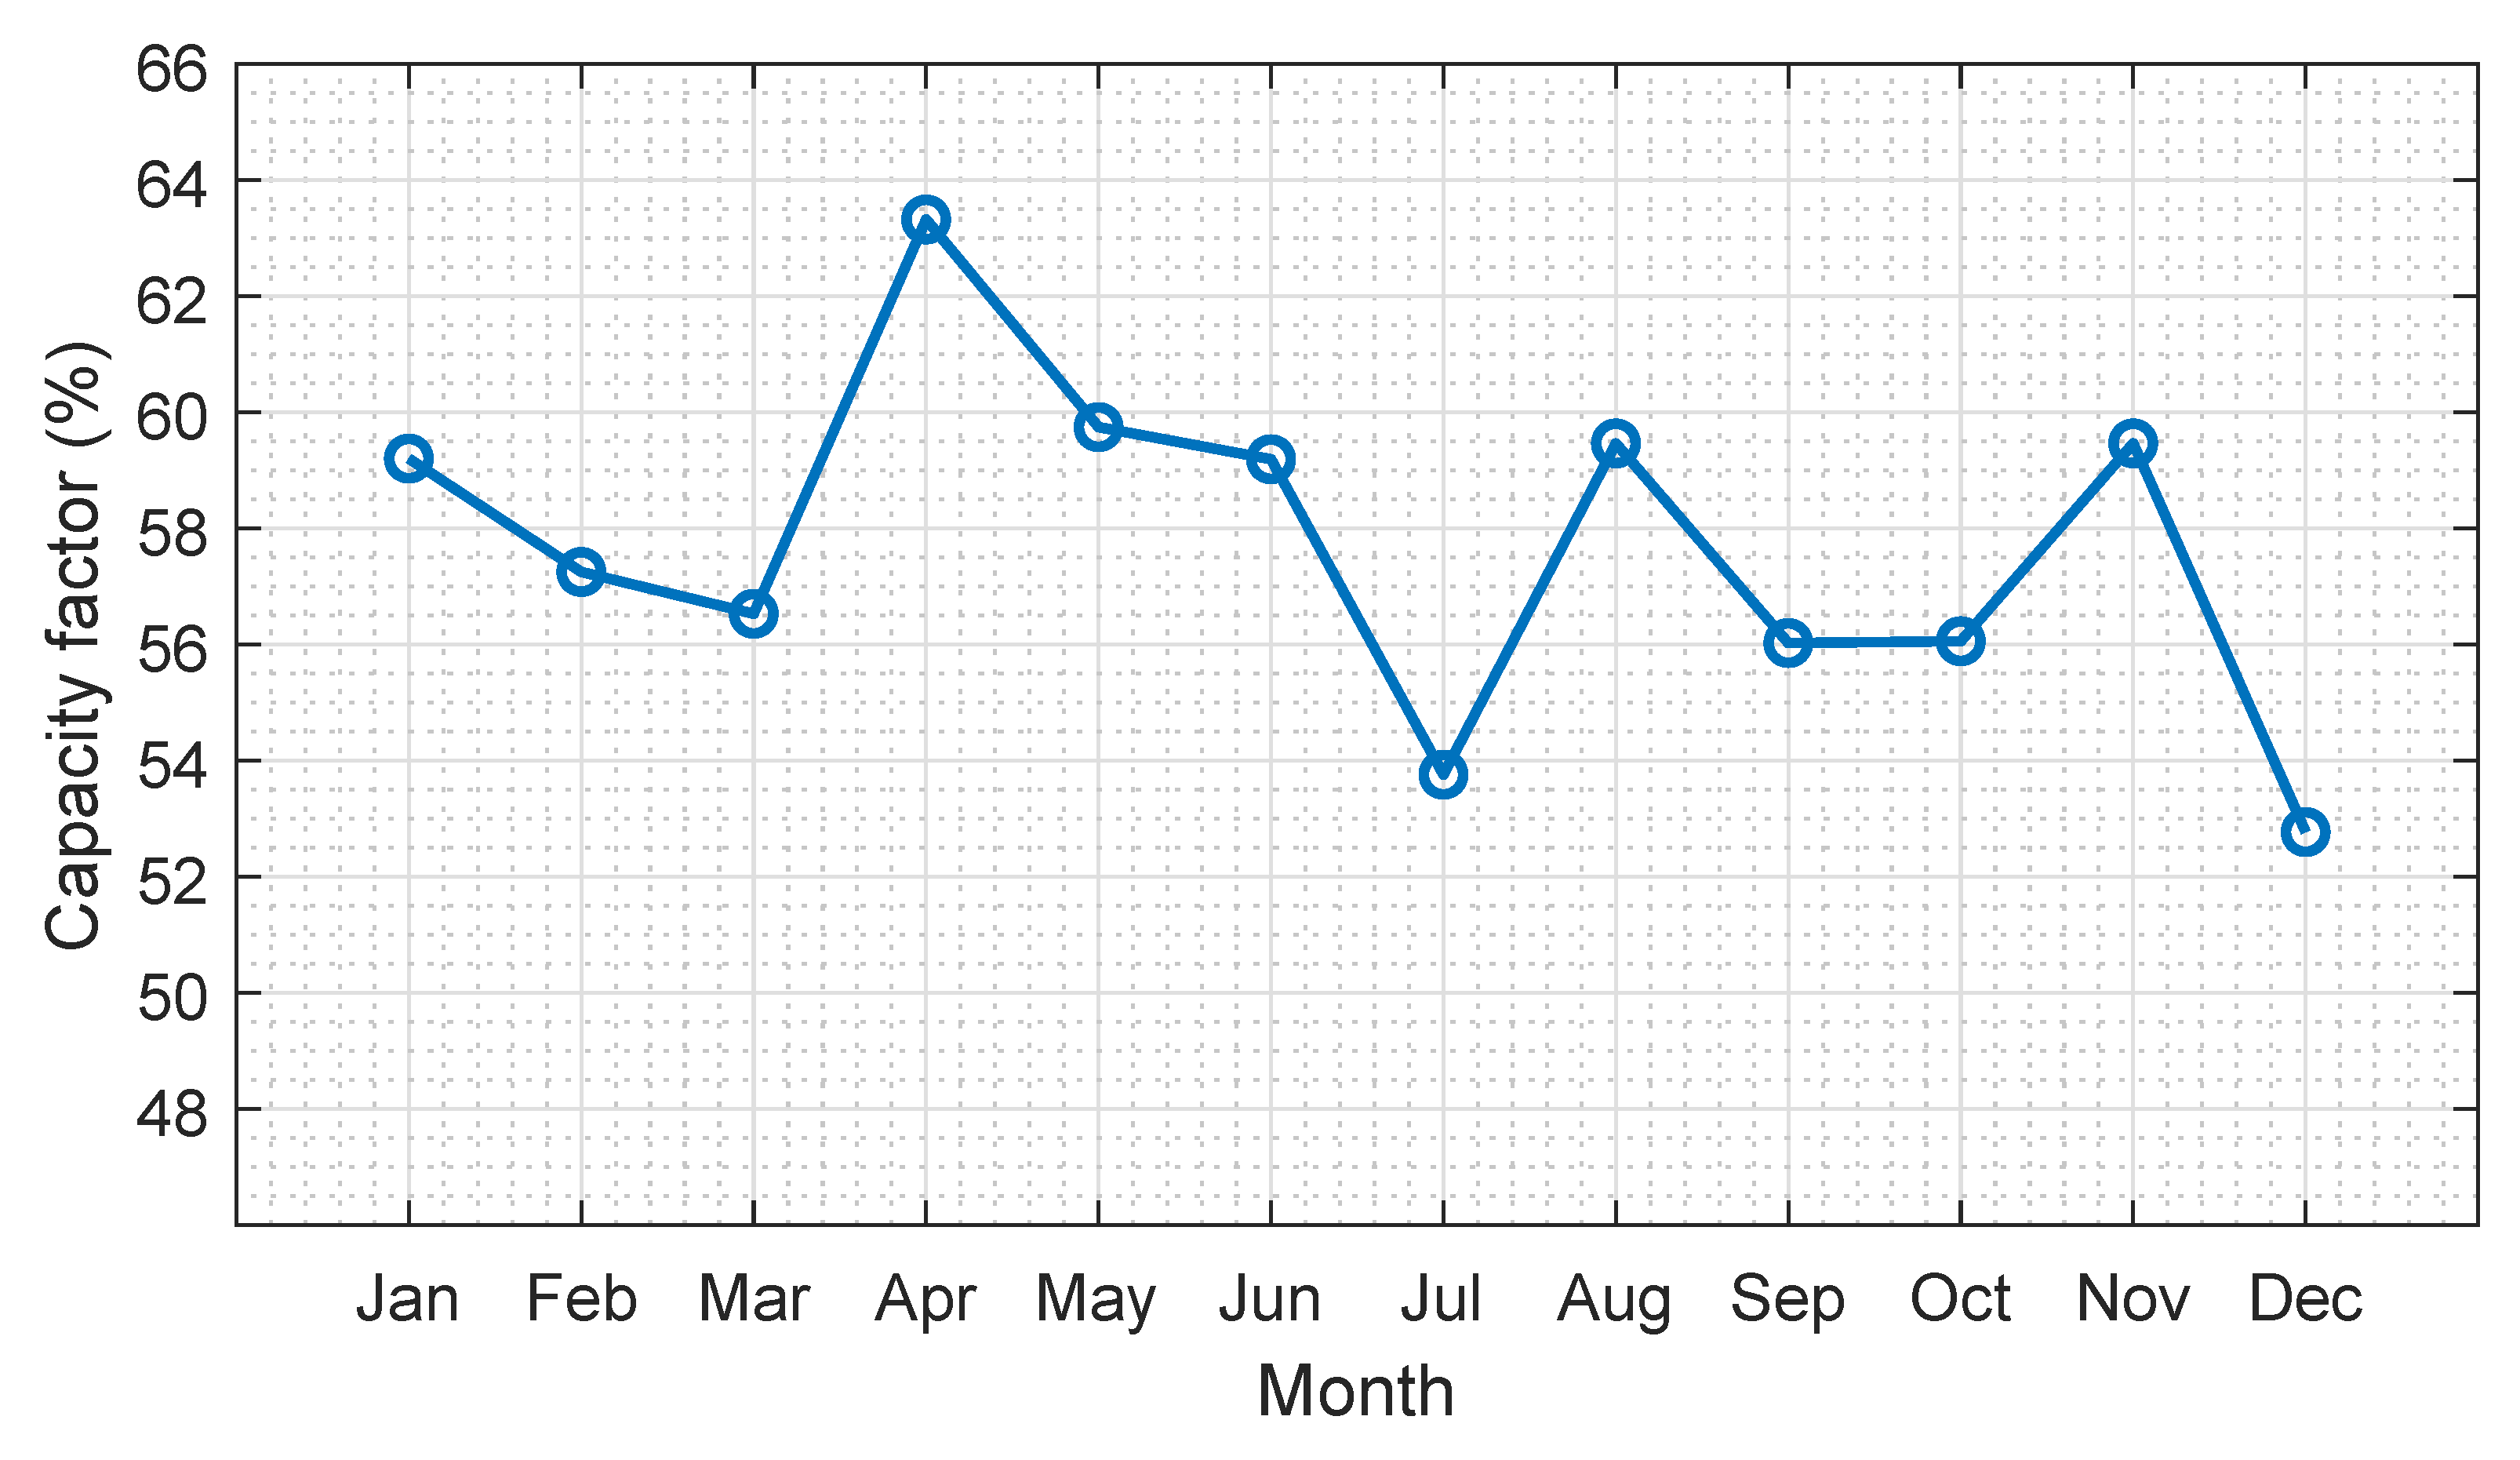
| Month | Energy Generation (kWh) | Average Running Hours | Capacity Factor | ||
|---|---|---|---|---|---|
| Unit A | Unit B | Overall | |||
| January | 3,700,044 | 520 | 722 | 621 | 0.70 |
| February | 3,347,183 | 543 | 569 | 556 | 0.71 |
| March | 3,532,988 | 532 | 601 | 566.5 | 0.74 |
| April | 3,829,804 | 653 | 531 | 592 | 0.77 |
| May | 3,733,923 | 648 | 524 | 586 | 0.75 |
| June | 3,580,045 | 665 | 446 | 555.5 | 0.76 |
| July | 3,359,790 | 677 | 415 | 546 | 0.73 |
| August | 3,716,390 | 676 | 469 | 572.5 | 0.77 |
| September | 3,388,543 | 494 | 634 | 564 | 0.71 |
| October | 3,503,454 | 590 | 471 | 530.5 | 0.78 |
| November | 3,596,530 | 635 | 489 | 562 | 0.76 |
| December | 3,297,978 | 525 | 492 | 508.5 | 0.77 |
| Average | 3,548,889 | 596.5 | 530.25 | 563.38 | 0.75 |
| Month | Fuel Consumption | Energy Generation | Fuel Consumption Rate |
|---|---|---|---|
| (m) | (kWh) | (m/kWh) | |
| January | 1,414,918 | 3,700,044 | 0.38 |
| February | 1,322,876 | 3,347,183 | 0.39 |
| March | 1,348,702 | 3,532,988 | 0.38 |
| April | 1,385,444 | 3,829,804 | 0.36 |
| May | 1,342,269 | 3,733,923 | 0.35 |
| June | 1,254,655 | 3,580,045 | 0.35 |
| July | 1,249,653 | 3,359,790 | 0.37 |
| August | 1,352,706 | 3,716,390 | 0.36 |
| September | 1,218,619 | 3,388,543 | 0.35 |
| October | 1,243,869 | 3,503,454 | 0.35 |
| November | 1,350,204 | 3,596,530 | 0.37 |
| December | 1,199,180 | 3,297,978 | 0.36 |
| Total | 15,683,095 | 42,586,675 | - |
© 2019 by the authors. Licensee MDPI, Basel, Switzerland. This article is an open access article distributed under the terms and conditions of the Creative Commons Attribution (CC BY) license (http://creativecommons.org/licenses/by/4.0/).
Share and Cite
Uddin, M.; Romlie, M.F.; Abdullah, M.F. Performance Assessment and Economic Analysis of a Gas-Fueled Islanded Microgrid—A Malaysian Case Study. Infrastructures 2019, 4, 61. https://doi.org/10.3390/infrastructures4040061
Uddin M, Romlie MF, Abdullah MF. Performance Assessment and Economic Analysis of a Gas-Fueled Islanded Microgrid—A Malaysian Case Study. Infrastructures. 2019; 4(4):61. https://doi.org/10.3390/infrastructures4040061
Chicago/Turabian StyleUddin, Moslem, Mohd Fakhizan Romlie, and Mohd Faris Abdullah. 2019. "Performance Assessment and Economic Analysis of a Gas-Fueled Islanded Microgrid—A Malaysian Case Study" Infrastructures 4, no. 4: 61. https://doi.org/10.3390/infrastructures4040061
APA StyleUddin, M., Romlie, M. F., & Abdullah, M. F. (2019). Performance Assessment and Economic Analysis of a Gas-Fueled Islanded Microgrid—A Malaysian Case Study. Infrastructures, 4(4), 61. https://doi.org/10.3390/infrastructures4040061