Article

An Assessment of Sustainable Airport Water Management: The Case of Osaka’s Kansai International Airport

1
School of Tourism and Hospitality Management, Suan Dusit University, Huahin Prachaup Khiri Khan 77110, Thailand
2
School of Engineering, RMIT University, Melbourne, VIC 3000, Australia
*
Author to whom correspondence should be addressed.
Infrastructures 2018, 3(4), 54; https://doi.org/10.3390/infrastructures3040054
Submission received: 13 November 2018 / Accepted: 26 November 2018 / Published: 29 November 2018
(This article belongs to the Special Issue Sustainable Transportation Infrastructures)

Abstract

:
Airports are an essential infrastructure to facilitate aviation. The substantial growth of aviation has led to a significant increase in water usage by airports. Airports also generate large volumes of wastewater that may include contaminants. Hence, understanding sustainable water management practices is essential in the aviation industry. In this study, an exploratory research design was utilized in the examination of the sustainable water management strategies and systems at Kansai International Airport from 2002 to 2016. The qualitative data were examined using document analysis as part of a case study. The quantitative data were analyzed using regression analysis as part of a longitudinal study. The airport has been able to reduce the total water consumption, water consumption per passenger, and water consumption per aircraft movement, even with increased traffic in recent years. The airport sources water from the municipal authorities and reclaims water for non-potable water uses. The airport conducts regular water quality tests which measure the Chemical oxygen demand, total nitrogen, and total phosphates. The airport’s onsite wastewater processing centre processes all wastewaters, which discharges non-reclaimed water into Osaka Bay. With a decrease in water consumption, there has similarly been a decrease in the need to treat wastewater, while the reclaimed water ratio has increased over the period of the study.

Graphical Abstract

1. Introduction

Airports are critical pieces of infrastructure of the complex global aviation system that supports the movement of passengers and air cargo. However, in providing these essential services, airport operations have the potential to adversely affect the environment [1]. Consequently, airport environmental management has become a critical element in the global air transport industry development [2]. Airports all around the world are now increasingly focusing on sustainable water management as a key element of their environmental plans and strategies. This is because airports consume substantial amounts of water to maintain both their infrastructure and operations [3,4,5,6,7,8]. Large volumes of wastewater are also generated at airports. These wastewaters could have a negative impact on both soil and groundwater since they contain a relatively high concentration of contaminants [9].
Osaka’s Kansai International Airport (IATA Airport code: KIX) is Japan’s third busiest airport. KIX has historically placed a very high focus on sustainable environmental management and places a very high emphasis on sustainable water management. A key objective of KIX is for the airport to be smart, that is, to be both people and earth-friendly. Importantly, the airport is driven by its objective of becoming a pollution-free airport that also co-exists and prospers with the local Kansai region [10]. Consequently, environmental management forms an integral part of KIX’s governance, strategy, and management system. Most importantly, the airport has implemented and adopted a wide-ranging sustainable environment policy that is underpinned by three fundamental principles—Green Innovation, Eco Operations and Eco Relations—as well as five basic sustainable environmental principles—an airport that co-exists with the local region, airports that protect a sound local environment, airports with a minimal impact on the global environment, airports that recycle resources, and, finally, airports that keep biodiversity in mind [11].
The objective of this paper is to analyze the sustainable water management systems at Kansai International Airport (hereafter KIX), as well as the sources and volumes of water consumed at the airport, the annual recycled water rates, and the methods used to mitigate the environmental impact of the wastewater produced from the operations undertaken at the airport. KIX was selected as the case airport due to its long-standing commitment to sustainable water management, its water management systems, and due to the availability of a data set covering the period 2002 to 2015.
To address the study objectives, the following research questions were empirically examined:
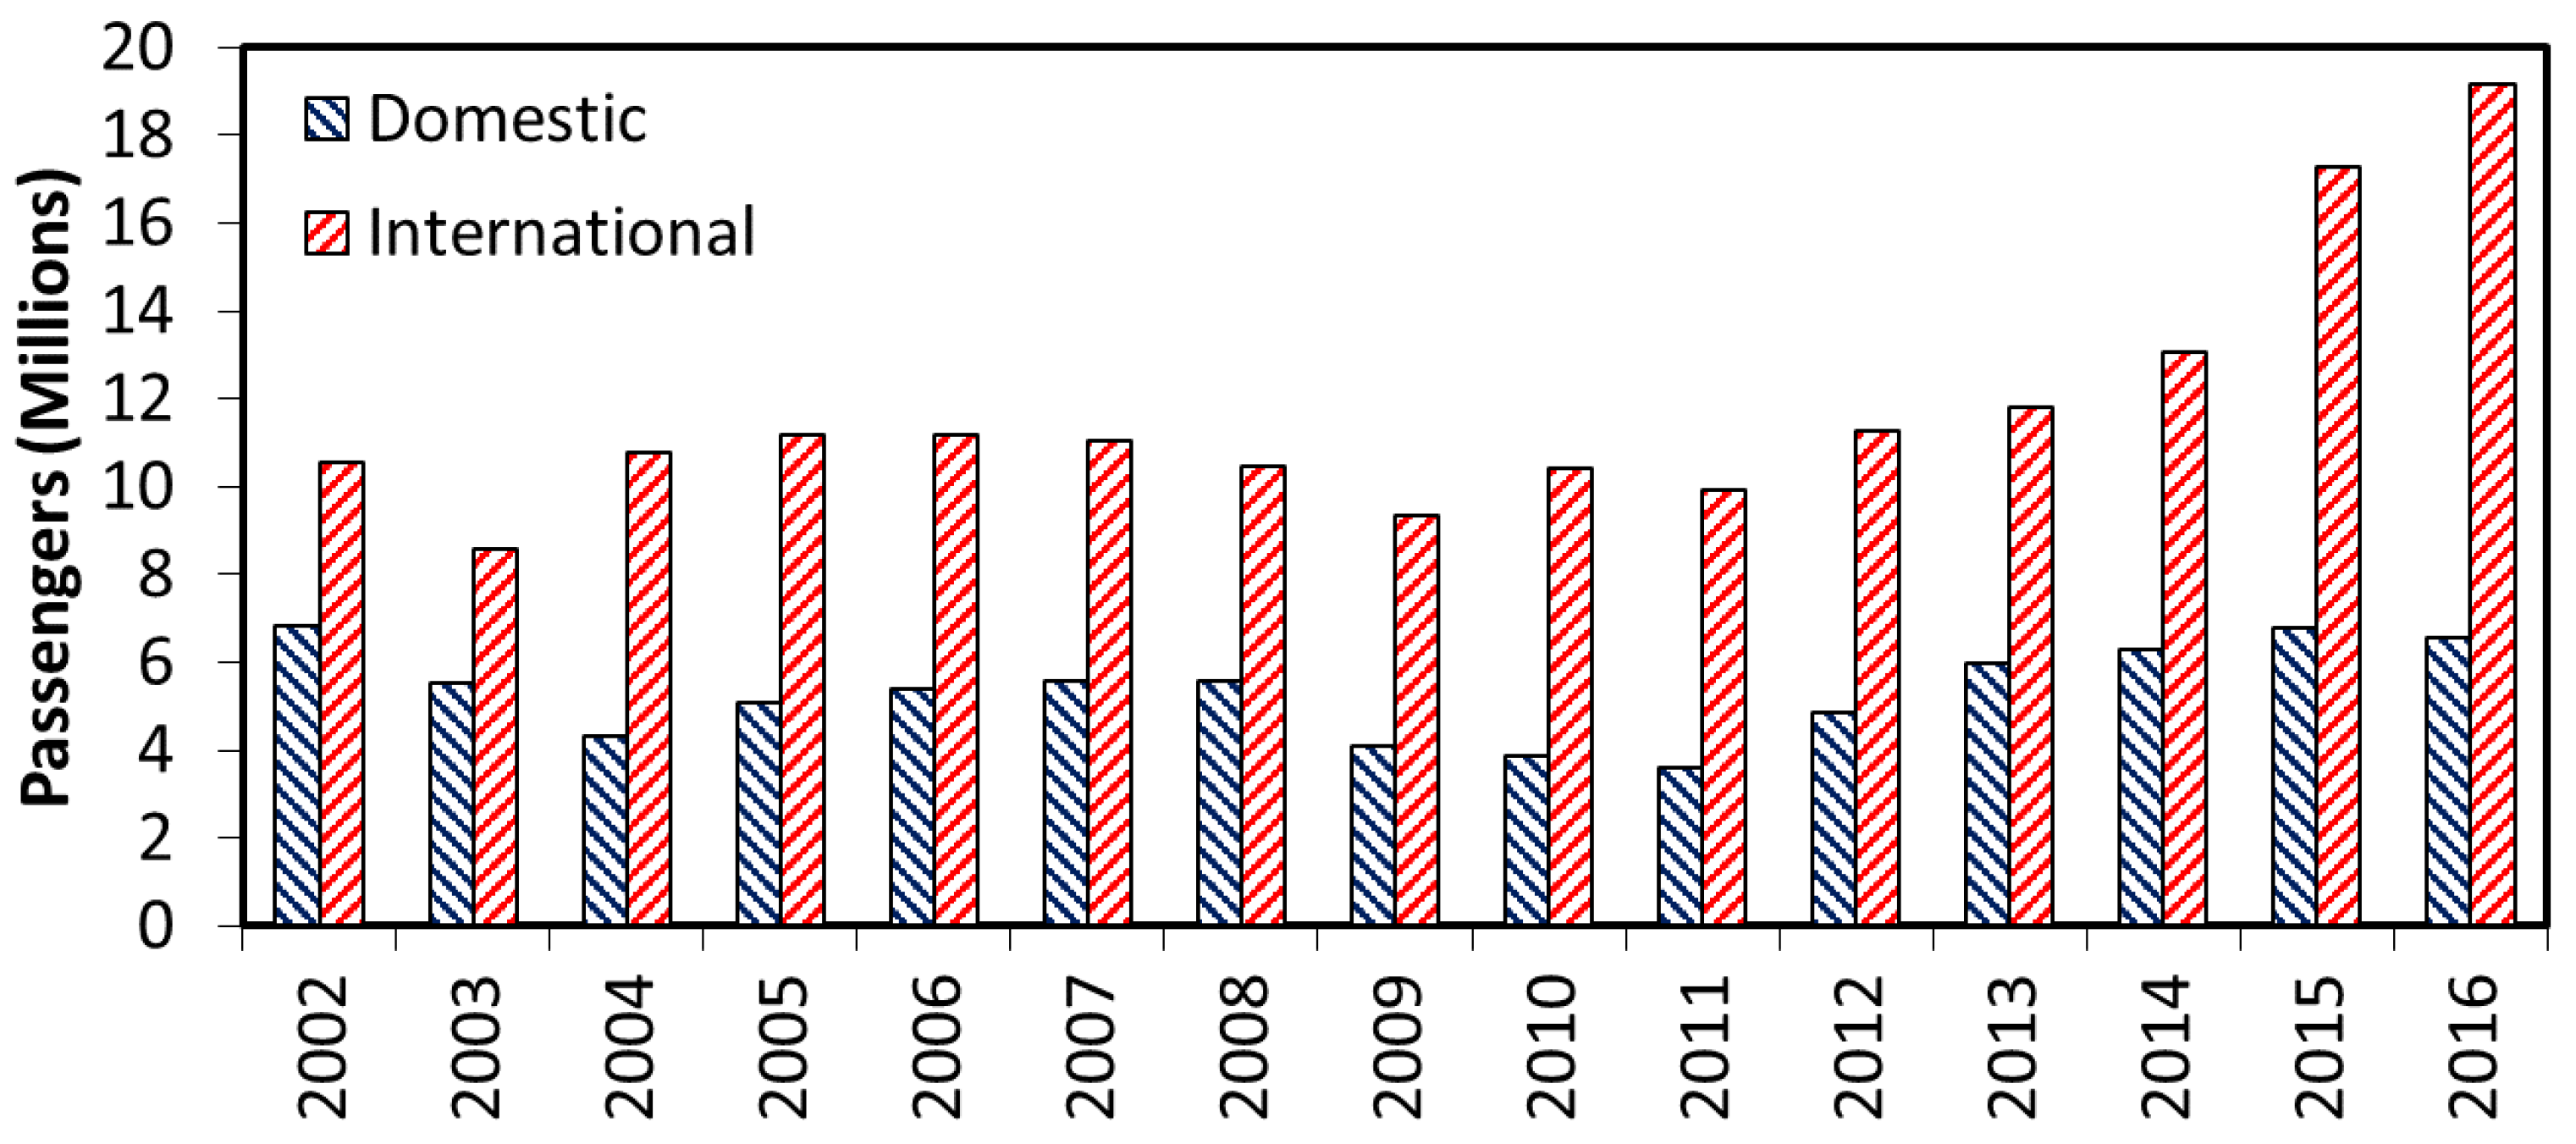
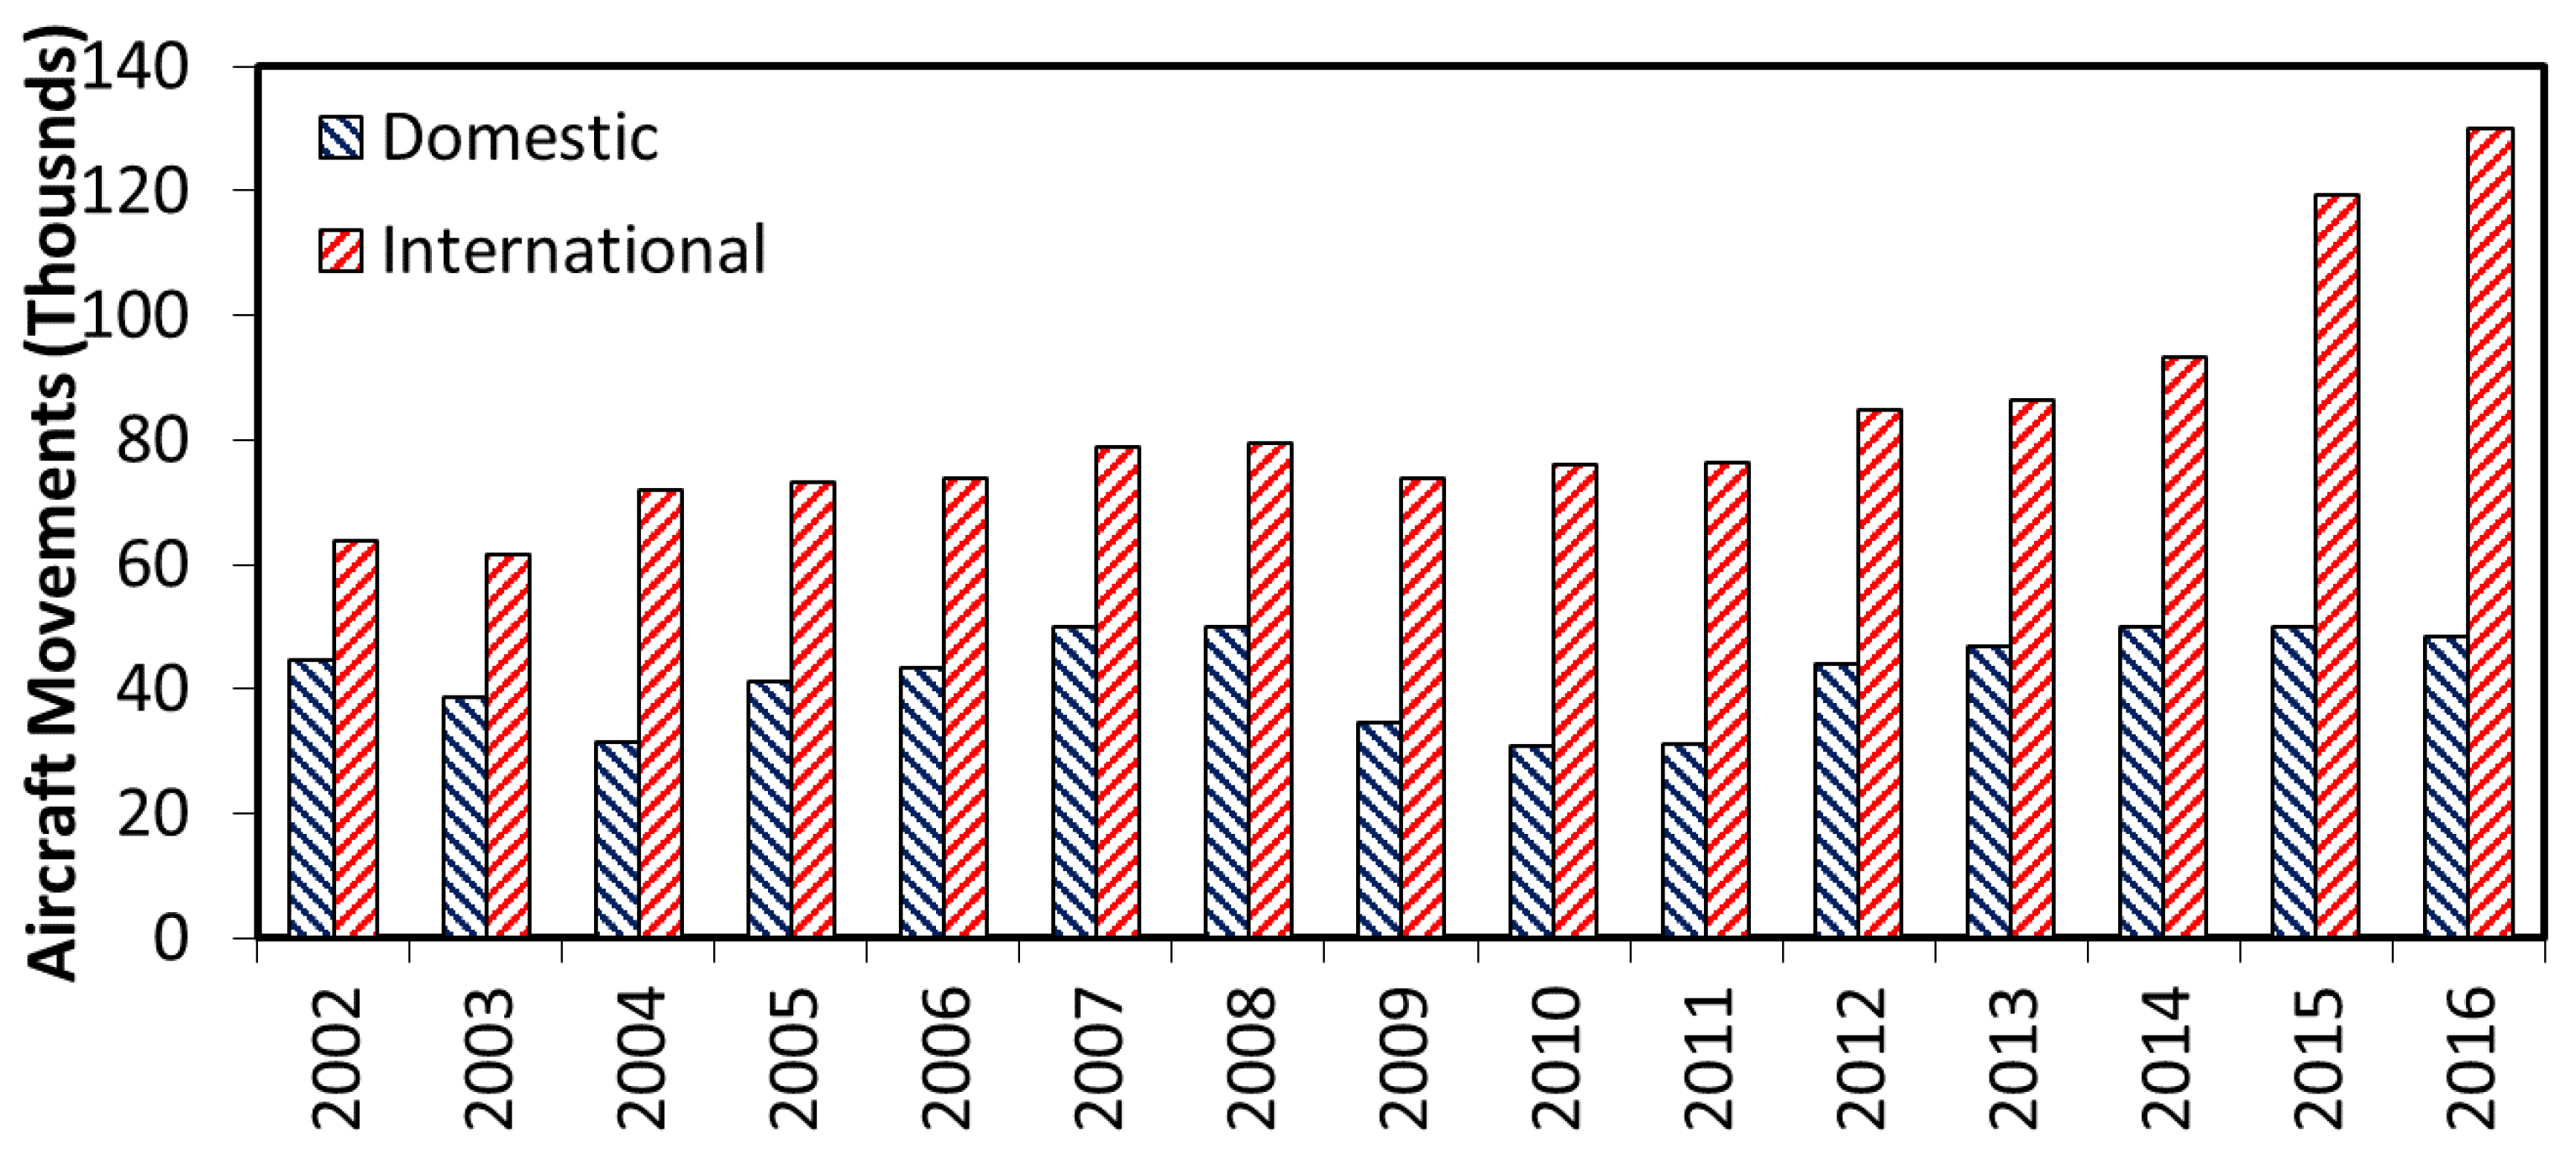
  • What is the annual consumption of water at KIX and how have these consumption patterns changed considering the increased passenger traffic and aircraft movements recorded at the airport over the period 2002 to 2016?
  • What are the principal sources of water used at KIX?
  • What are the annual volumes of recycled water and the recycled water ratios at KIX and how have these changed over the period 2002 to 2016?
  • What measures are used to monitor water pollution at KIX?
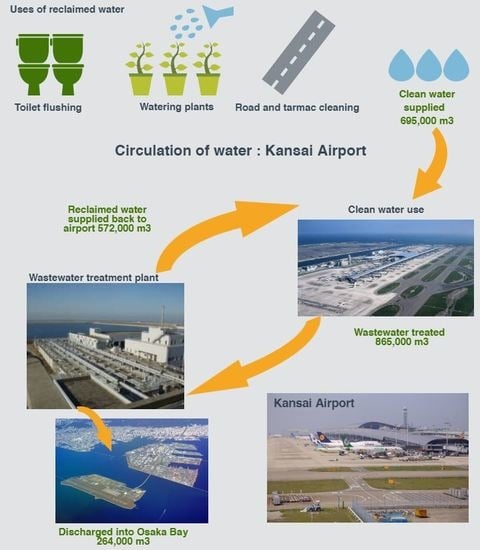
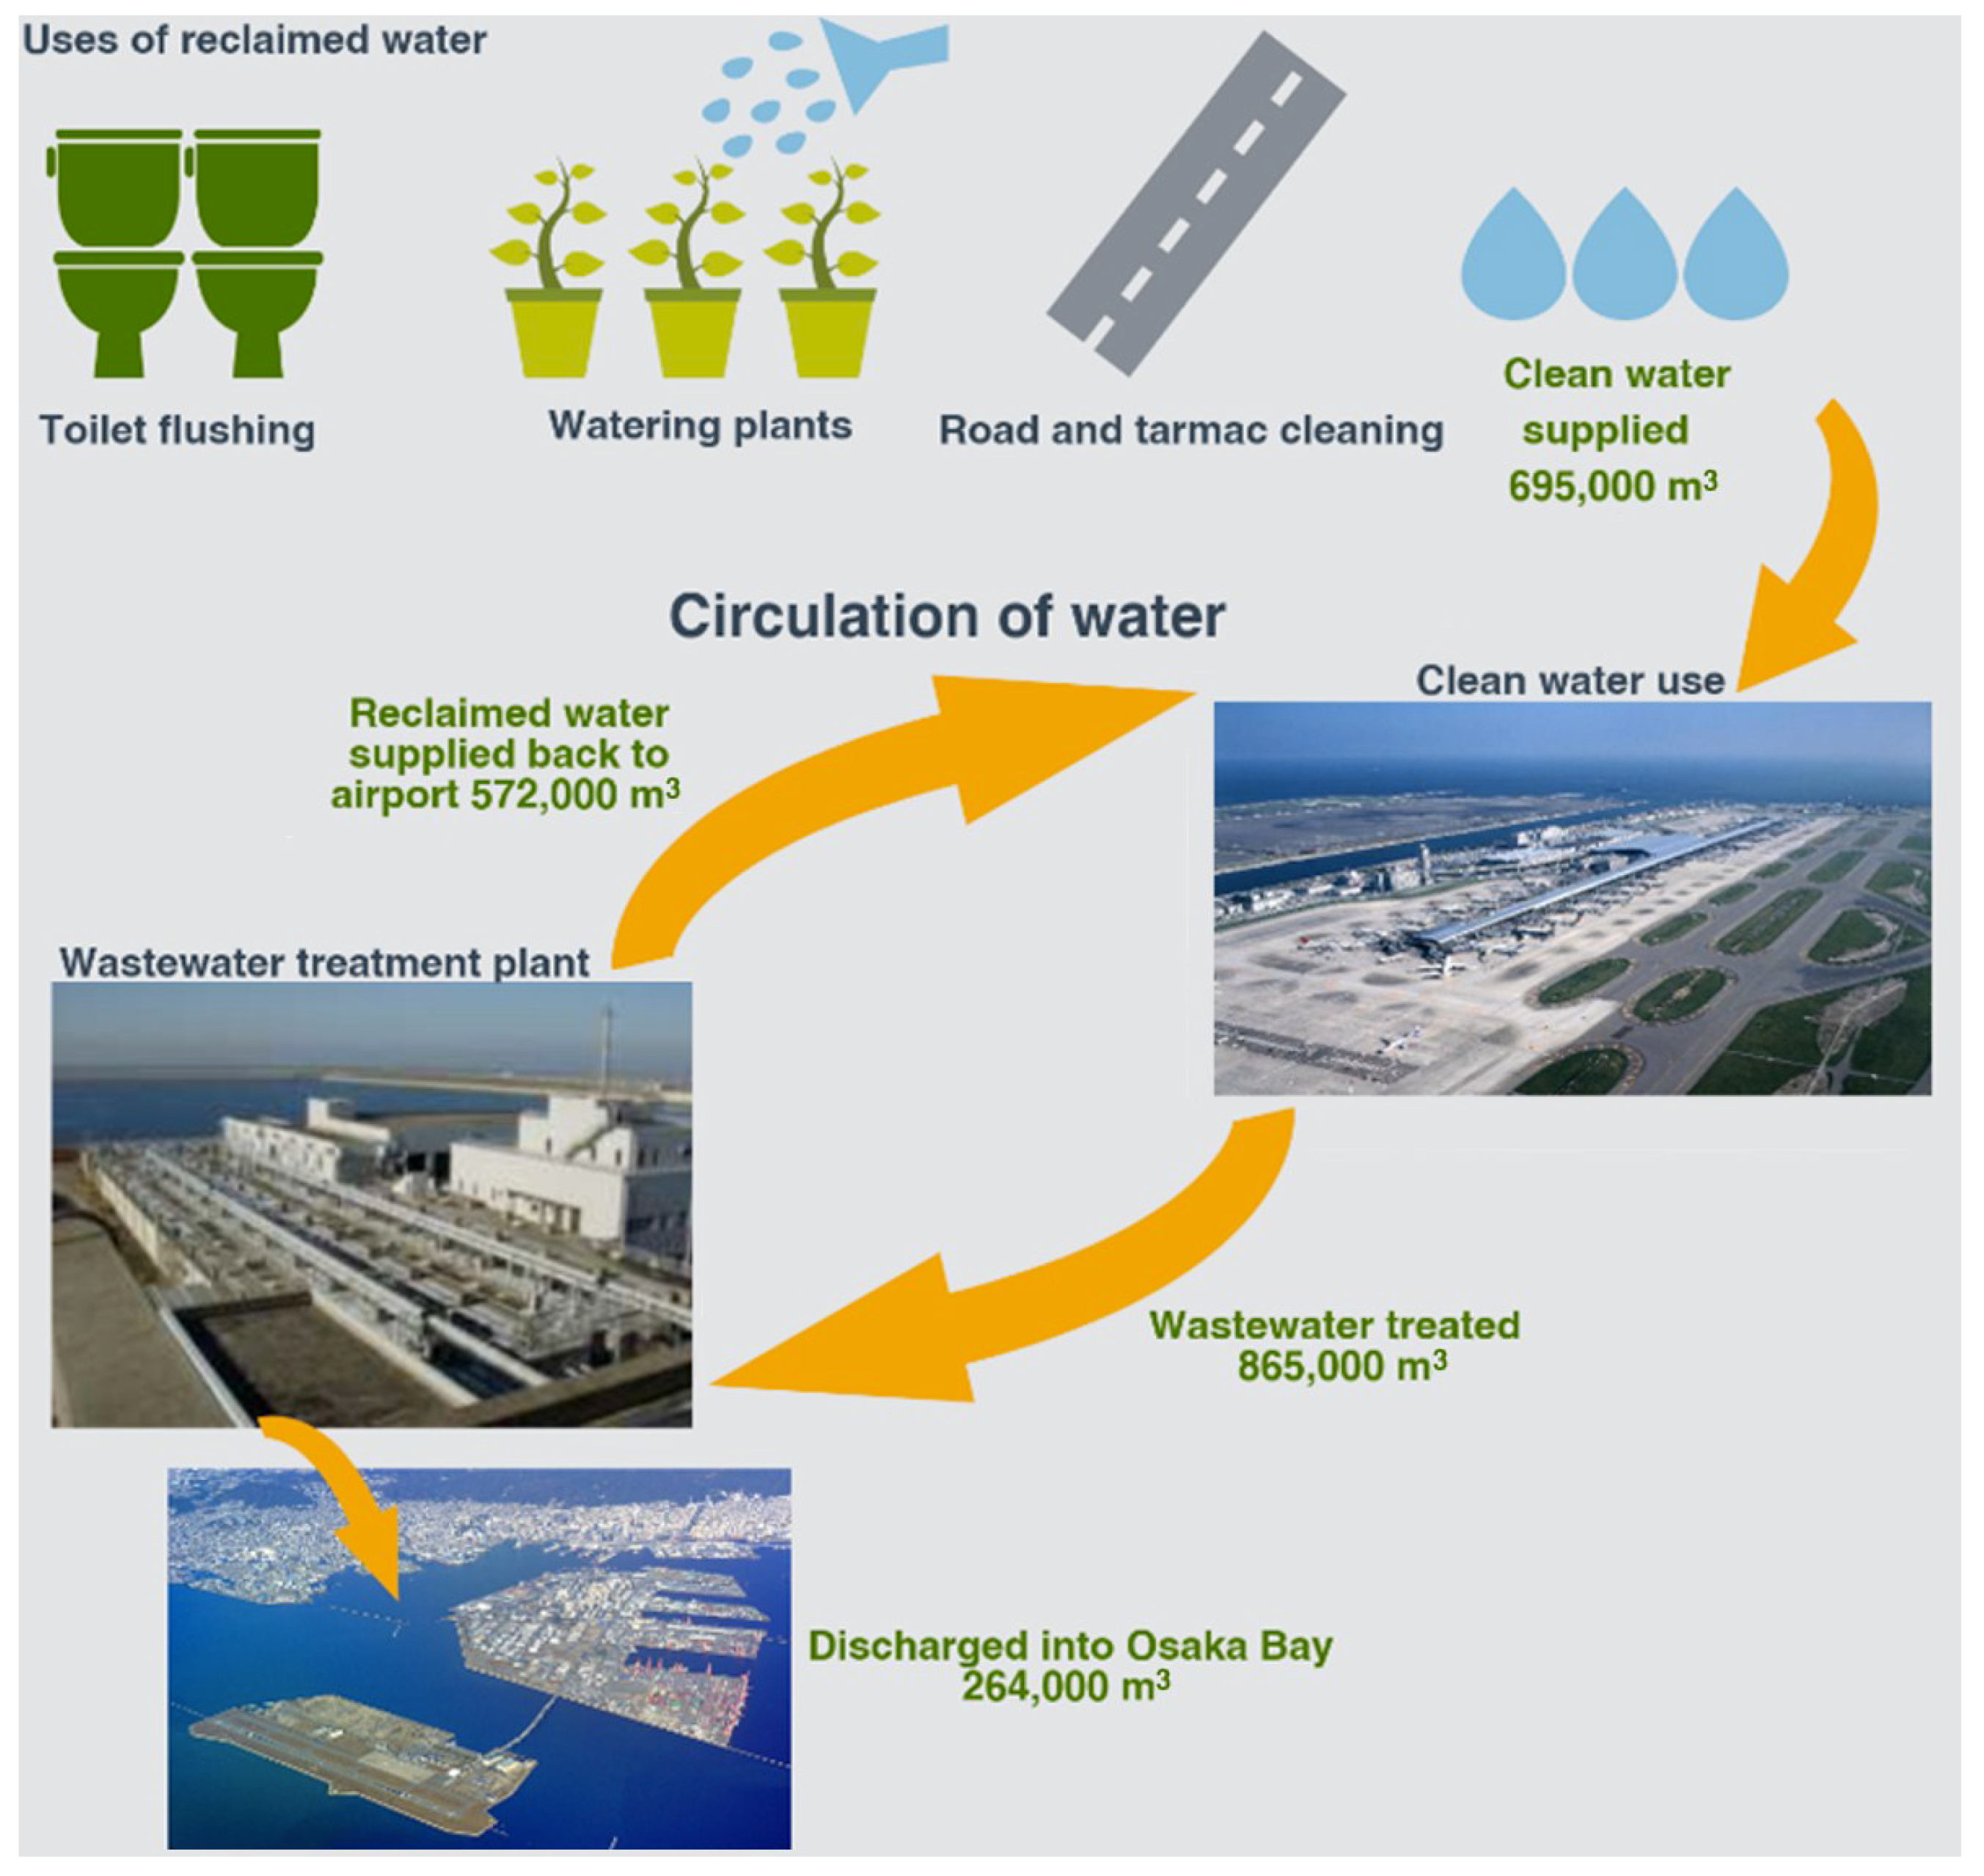
  • How does KIX process wastewater to minimize and mitigate its environmental impact?
The remainder of the paper is structured as follows. Section 2 reviews the literature on sustainable water management at airports. The research methodology used to underpin the case study is presented in Section 3. The case study of KIX’s sustainable water management follows in Section 4. Section 5 presents the findings of the study.

2. Background

2.1. Airport Stakeholders Water Usage

Water consumed by airports can be broadly divided into the water consumed by the landside activities undertaken at the airport as well as the water consumed by the key stakeholders involved in the provision of the airport’s airside area activities (operations). Landside means those parts of an airport as well as the adjacent terrain and buildings or portions thereof that are not in the airside precinct. The airside means the movement area at an airport, adjacent terrain and buildings/infrastructure, or portions, the access to which is restricted [12].
There are a number of key stakeholders, for example, airlines, ground handling agents and the airport authorities themselves that are involved in the facilitation and handling of passengers within an airport’s landside precinct. Additionally, at some airports, air cargo is handled in cargo terminals that are located on the airport’s landside. Many airports around the world also have hotels located in the landside precinct. These actors require and consume water for a variety of purposes. These include drinking water for passengers, meeters and greeters, airport staff, washing of vehicles, the flushing of toilets, personal hygiene (for example, washing of hands and in showers provided for passengers and airport-related staff), cooking and beverages provided by concessionaires operating at the airport and by flight catering firms. Water is also used for landscaping and lawn and plant watering.
The various key stakeholders that are typically involved in the facilitation and handling of aircraft (passenger and freighter aircraft), passenger and air cargo movements, aircraft maintenance and air traffic control (ATC) on the air side of an airport also require and consume water for a variety of purposes. In addition to the actors involved with servicing and maintaining aircraft (and ground service equipment), many airports also often have concessionaires located in the airside section of the terminal, for example, duty-free shops and restaurants [13,14]. These actors require drinking water for staff working on the airside, water is required for the washing of aircraft and ground service vehicles, the flushing of toilets, personal hygiene (for example, the washing of hands and in showers provided for airport-related staff), cooking and beverages provided by concessionaires operating restaurants and coffee shops in the airside terminal precinct and by flight catering firms operating on the airside at the airport.

2.2. Sustainable Water Usage Management at Airports

The volume of water used by airports has been estimated to be equivalent to the volume of water that is consumed by mid-size cities, thus practices aimed at reducing water consumption are both important and necessary [6]. Thus, it is important to note that considering the increasing pressure to reduce water consumption and conserve available water resources, airports must manage their activities and operations to reduce water consumption. Airports also need to protect both the surface and groundwater resources as well. To achieve these objectives, airports have implemented a range of methods including the following:
  • Reduction in water consumption at the airport site;
  • Re-using water, following treatment (wastewater and sewage treatment plants) in toilet facilities or for irrigation purposes;
  • The use of rainwater for the flushing of toilets;
  • Protecting groundwater from pollution;
  • Monitoring of water consumption at the airport; and
  • Monitoring the quality of the surface and groundwater [2].
Historically, airports have been designed to make use of groundwater or water supplied from municipal authorities, which satisfies the appropriate quality standards. Where this water has only been used for non-industrial purposes (for example, washing, cleaning, and laundry), wastewater can be collected by the airport, treated, and subsequently reused for activities including toilet flushing, washing, and in some cases irrigation of plants. Such practices may require the airport to introduce a dual drainage system as well as water-purification facilities. The most sustainable approach to water management is for airports to become self-sufficient in their water supply. This can be achieved by optimizing opportunities for recycling and minimizing consumption [15] and water harvesting [16,17,18].

2.3. Airport Water Quality

The water pollution from an airport shares some of the impacts associated with water pollution from industrial sites:
  • the potential contamination of drinking water supplies of aquatic life in the waters receiving the potentially toxic compounds;
  • the potential for depleting dissolved oxygen levels in the receiving waters to the point where there is fish mortality (or where fish die); and
  • the potential siltification of adjacent streams from airport construction run-off waters as well as the potential for acute exposure to irritants by persons who are exposed to the contaminated water [19].
The principal water pollutants and their sources at airports are the residual contaminants from the military or industrial manufacturing of munitions (in the case where the airport site was previously used for military purposes), contaminants from aircraft maintenance activities, run-off of silt from airport-related construction sites, chronic leakage or spills of aviation fuel and aircraft and runway de-icing agents that are used during winter periods to ensure safe aircraft and airport operations [19]. Other contaminants include detergent formulations, solids, oils, greases, residues, solvent residues, as well as heavy metals [20]. In addition, the discharge of fire-fighting foam in the event of aircraft emergencies [21], as well as the production of in-flight meals, restaurants, and staff, also contribute grease and detergents to the wastewater generated at an airport [22].
The treatment of such wastes must satisfy health and safety requirements regarding the contents of heavy metals, chlorinated hydrocarbons, and sedimentation substances. Consequently, these wastewaters must be properly treated prior to being discharged by the airport into the sewerage system [23]. Construction of an airport and, particularly, the construction of the runway(s) can disturb the groundwater system not only in the airport precinct but also in the broader airport surroundings [24]. Pollutants that could affect stormwater quality at airport construction sites include sediment, oil, grease, and chemicals [25].
Most countries have set water quality standards. However, the water quality standards set by airports are normally much more stringent [23]. Around the world, the organic water pollution indicators that are commonly used to measure water pollution are chemical oxygen demand (COD), total nitrogen (T-N), and total phosphorus (T-P) [26]. The chemical oxygen demand (COD) test measures the total amount of oxygen that is required to completely oxidize organic matter to carbon dioxide (CO2) and water. Hence, the COD test provides an indication of its potential maximum oxygen demand [20,27].
Because water sources are often connected to each other, any adverse impacts on the local deterioration of water quality arising from airport operations can have an impact in regions that are located quite a distance from the airport itself [28].

2.4. Stormwater Management at Airports

Stormwater (also called surface or rainwater runoff) is the precipitation (for example, rain or snow) discharged from a catchment area, such as an airport’s apron area, into a stream, drain or sewer. The quality of the stormwater runoff is influenced by the activities that are undertaken in the catchment area [20]. There are three principal forms of water contamination at airports: (1) chronic contamination, (2) seasonal contamination associated with de-icing procedures during winter operations, and (3) accidental pollution [29].
As noted earlier, an airport can be a significant contributor to water pollution if suitable facilities to treat airport wastes are not provided [24,30,31]. Drainage from an airport’s movement areas requires special treatment due to the oil-products or de-icing chemicals used in the winter. Sewage water from an airport is cleansed in normal water treatment plants. In addition, rain water from the paved areas, especially from the apron areas, can be cleaned in a special treatment plant located at the airport, with the separation of oil products, or alternatively, the collector can be connected to the local municipal treatment plant [23].
Furthermore, especially dangerous areas of the airport, for instance, fuel storage, and aircraft hangars, and aircraft and ground service equipment (GSE) maintenance facilities need to be equipped with traps for oil products and be inspected regularly. Additionally, it is important for airports to pay attention to possible water or soil contamination arising from fire-fighting training. Such training activities should only be undertaken within a specially designated area [23].

3. Research Method

The research undertaken in this study used a mixed methods research design [32,33] that was broadly exploratory in nature [34,35] and followed an inductive approach using both qualitative and quantitative methods [36,37]. The goal of such an approach is to expand and build theories rather than perform a statistical analysis to test a certain hypothesis [38]. The exploratory design began with a qualitative case study and was followed by a quantitative longitudinal study, utilizing regression analysis.
A case study, whilst like an experiment, does not represent a sample, and the researcher’s role is to expand and generalize theories (analytical generalization) and not to enumerate frequencies (statistical generalization) [39]. To alleviate potential biases and to support measurement validity, careful attention has been paid to the selection of sources used in the study [40]. The qualitative and quantitative data for this study were obtained from a range of documents, including the KIX sustainability reports (2007 Eco-Island Report, 2013 Eco-Island Report, 2014 Smart Island Report, 2015 Smart Island Report, 2016 Smart Island Report, and the 2017 Environmental Report). Qualitative data was also gathered from websites, air transport and airport industry-related magazines and trade publication, and press articles. The three principles of data collection suggested by Yin [41] were followed in this study: the use of multiple sources of case evidence, the creation of a database on the subject, and the establishment of a chain of evidence. A complete case study analysis includes the data collection for the study, coding, and the script [42]. A common approach when undertaking case study research is to gather comprehensive information on the case by using and triangulating across different data collection techniques, for example, document review, and examining archival records [41,43]. All relevant documents were downloaded into a case study database [41]. The documents collected for the study were all in English. Each document was carefully read and key themes such as water usage, water pollution, water reclaiming, and recycling, were coded and recorded [44].
The second phase of the study used a longitudinal case study approach [45,46]. According to Rainer [47], there are four principal types of longitudinal study: (1) describing a phenomenon; (2) exploring a phenomenon to determine what is happening, that is, seeking to identify connections between events and processes over time; (3) explaining a phenomenon, to seek causal explanations of events and processes as they change over time; and (4) improving the phenomenon, that is, looking for ways to improve some aspect of the phenomenon under study. As the present study aims to explore KIX’s sustainable water management over the period 2002–2016, it utilized the second type of longitudinal study approach as it sought to determine what was happening with the airport’s sustainable water usage and systems [48].
Regression analysis was the key tool utilized as part of the longitudinal study to assess the statistical significance of the observed trends. Specifically, the various water measures were regressed as a function of time. This included the water sources used at KIX as well as the annual trends in water consumption per passenger and water consumption per aircraft movement at the airport. To assess the significance of any trends, a Student t-test was utilized. The statistics tested the following hypotheses:
Null hypothesis (H0):r = 0
Alternative hypothesis (HA1):r > 0, or
Alternative hypothesis (HA2):r < 0
That is, the objective of the statistical test was to determine if the correlation coefficient, r, was essentially 0, and hence, there was no trend over time, or alternatively (1) there was an observed positive trend over time for a parameter that was expected to increase, given by a positive correlation coefficient, or (2) there was a negative trend over time for the parameter that was expect to decrease, given by a negative correlation coefficient. As such, only one-sided tests were utilized. The t-test followed the standard as outlined by Andrews et al. [49], Heavey [50], and Heiman [51], which requires the calculation of the correlation coefficient and knowing the number of data points, n (fifteen in the review period). Specifically,
t = r n 2 1 r 2 ,
where the value n − 2 is referred to as the number of degrees of freedom, α. This is then used to calculate a probability or a p-value. The p-value is then assessed relative to the level of statistical significance utilised. In this study, a statistical significance of 95% was utilised. This gives an alpha (α) of 0.05. If the p-value, which corresponds to the one-sided t-statistic and is greater than α, we accept the null hypothesis. That is, there is no trend over time. If, however, the p-value is less than α, then we reject the null hypothesis as there is a statistically significant trend, over time.

4. Results

4.1. Kansai International Airport: A Brief Overview

KIX was constructed as a man-made island 5 km off-shore in Osaka Bay. The airport commenced operations in 1994 as Japan’s first 24-h airport and now plays a key role as an important international hub in the world air transport network [52]. The concept for KIX appeared in 1968, following a survey of potential airport sites in the Osaka area. Due to the high population density in the Osaka region and the scarcity of available land, a man-made island was determined to be the only feasible option for the new airport. Noise pollution and other environmental concerns assisted the Ministry of Transport in granting approval to construct the airport in 1986 [53].
KIX has had two key development phases. In the KIX first phase project, an airport island with a land area of around 510 hectares was reclaimed in Osaka Bay on which a 3500 metre long runway and the related infrastructure were constructed [52]. However, during the early 1990s, the number of aircraft departures and arrivals during the airport’s morning and early evening peak periods exceeded the airport’s handling capacity of 30 aircraft movements per hour. Consequently, in order to accommodate demand and to also be able to operate as an international hub airport, the second phase of the airport development commenced in 1999 [54].
The second phase KIX project involved the development of a further man-made island 545 hectares in size. The airport’s second runway, which is 4000 metres in length, was also built on the second airport island [55]. The second island is located 200 metres off-shore from the initial Phase 1 Island [52]. The official opening of the airport’s second runway occurred in 2007. The opening of the second runway provided the airport with the ability to become an international hub [56].
On 1 April 2012, the New Kansai International Airport Company (NKIAC) was established. The management of Kansai International Airport (IATA Airport Code: KIX) and Osaka International Airport (IATA Airport Code: ITM) was integrated into a single company on 1 July 2012. The establishment of NKIAC was a new business model for Japan as this was the first time that the management of multiple airports was managed and operated by a single company [57].
In June 2014, the Japanese government announced that it intended to sell the rights to operate the facilities at KIX as part of the government’s debt reduction programme [58]. In December 2016, a consortium that was led by the very large Japanese leasing firm Orix and Vinci Airports of France acquired the rights to operate the two Osaka-area airports (ITM and KIX), commencing in April 2016. The contract, valued at around ¥2.2 trillion yen ($USD 18 billion), to operate the two airports was for a period of 44 years. Thirty other firms have also invested in the venture, including Kansai Electric Power, Hanshin Hankyu Holdings, and Panasonic [59].
Figure 1 shows the total annual domestic and international passengers at KIX since its inception of operations from 2002 to 2015. The aftermath of the impact of 9/11 and the 2008 global financial crisis (GFC) can clearly be observed in the annual domestic and international enplaned passengers. Figure 1 also shows that the international passenger numbers are more significant relative to the domestic passenger numbers. This is due to Osaka International Airport primarily acting as the major local domestic terminal for the city of Osaka. In addition, since 2012, the low-cost carriers (LCCs) have emerged in the Japanese market and these carriers appear to be particularly important for KIX. Peach Aviation (a joint venture including ANA) is now one the airport’s leading airlines in terms of weekly departures. In the July 2012, Jetstar Japan, also an LCC, commenced business at KIX and has subsequently grown their operations at the airport. The LCCs have helped to drive traffic growth at the airport [60].
Figure 2 shows the total annual domestic and international aircraft movements at KIX from 2002 to 2015. As can be observed in Figure 2, since 1997, international flights have accounted for the largest number of flights at the airport—this reflects the airport’s role as the international hub for Osaka and the Kansai Region. As previously noted, the advent of LCC domestic operations at the airport in 2012, has resulted in the growth in domestic aircraft movements. Figure 2 also shows during the downturn in demand following the tragic events of 9/11 and the 2008 global financial crisis (GFC), that there was a decline in the annual aircraft movements at the airport—this could be due to airlines adjusting their schedules to accommodate the lower levels of passenger demand.
Eight airlines provide domestic services from KIX. Around 71 airlines operate international services to and from KIX (these include code-sharing arrangements). The two largest airlines serving the airport are All Nippon Airways (ANA) and Japan Airlines (JAL) [62]. It has been estimated that there are around 15,000 people working at the airport.

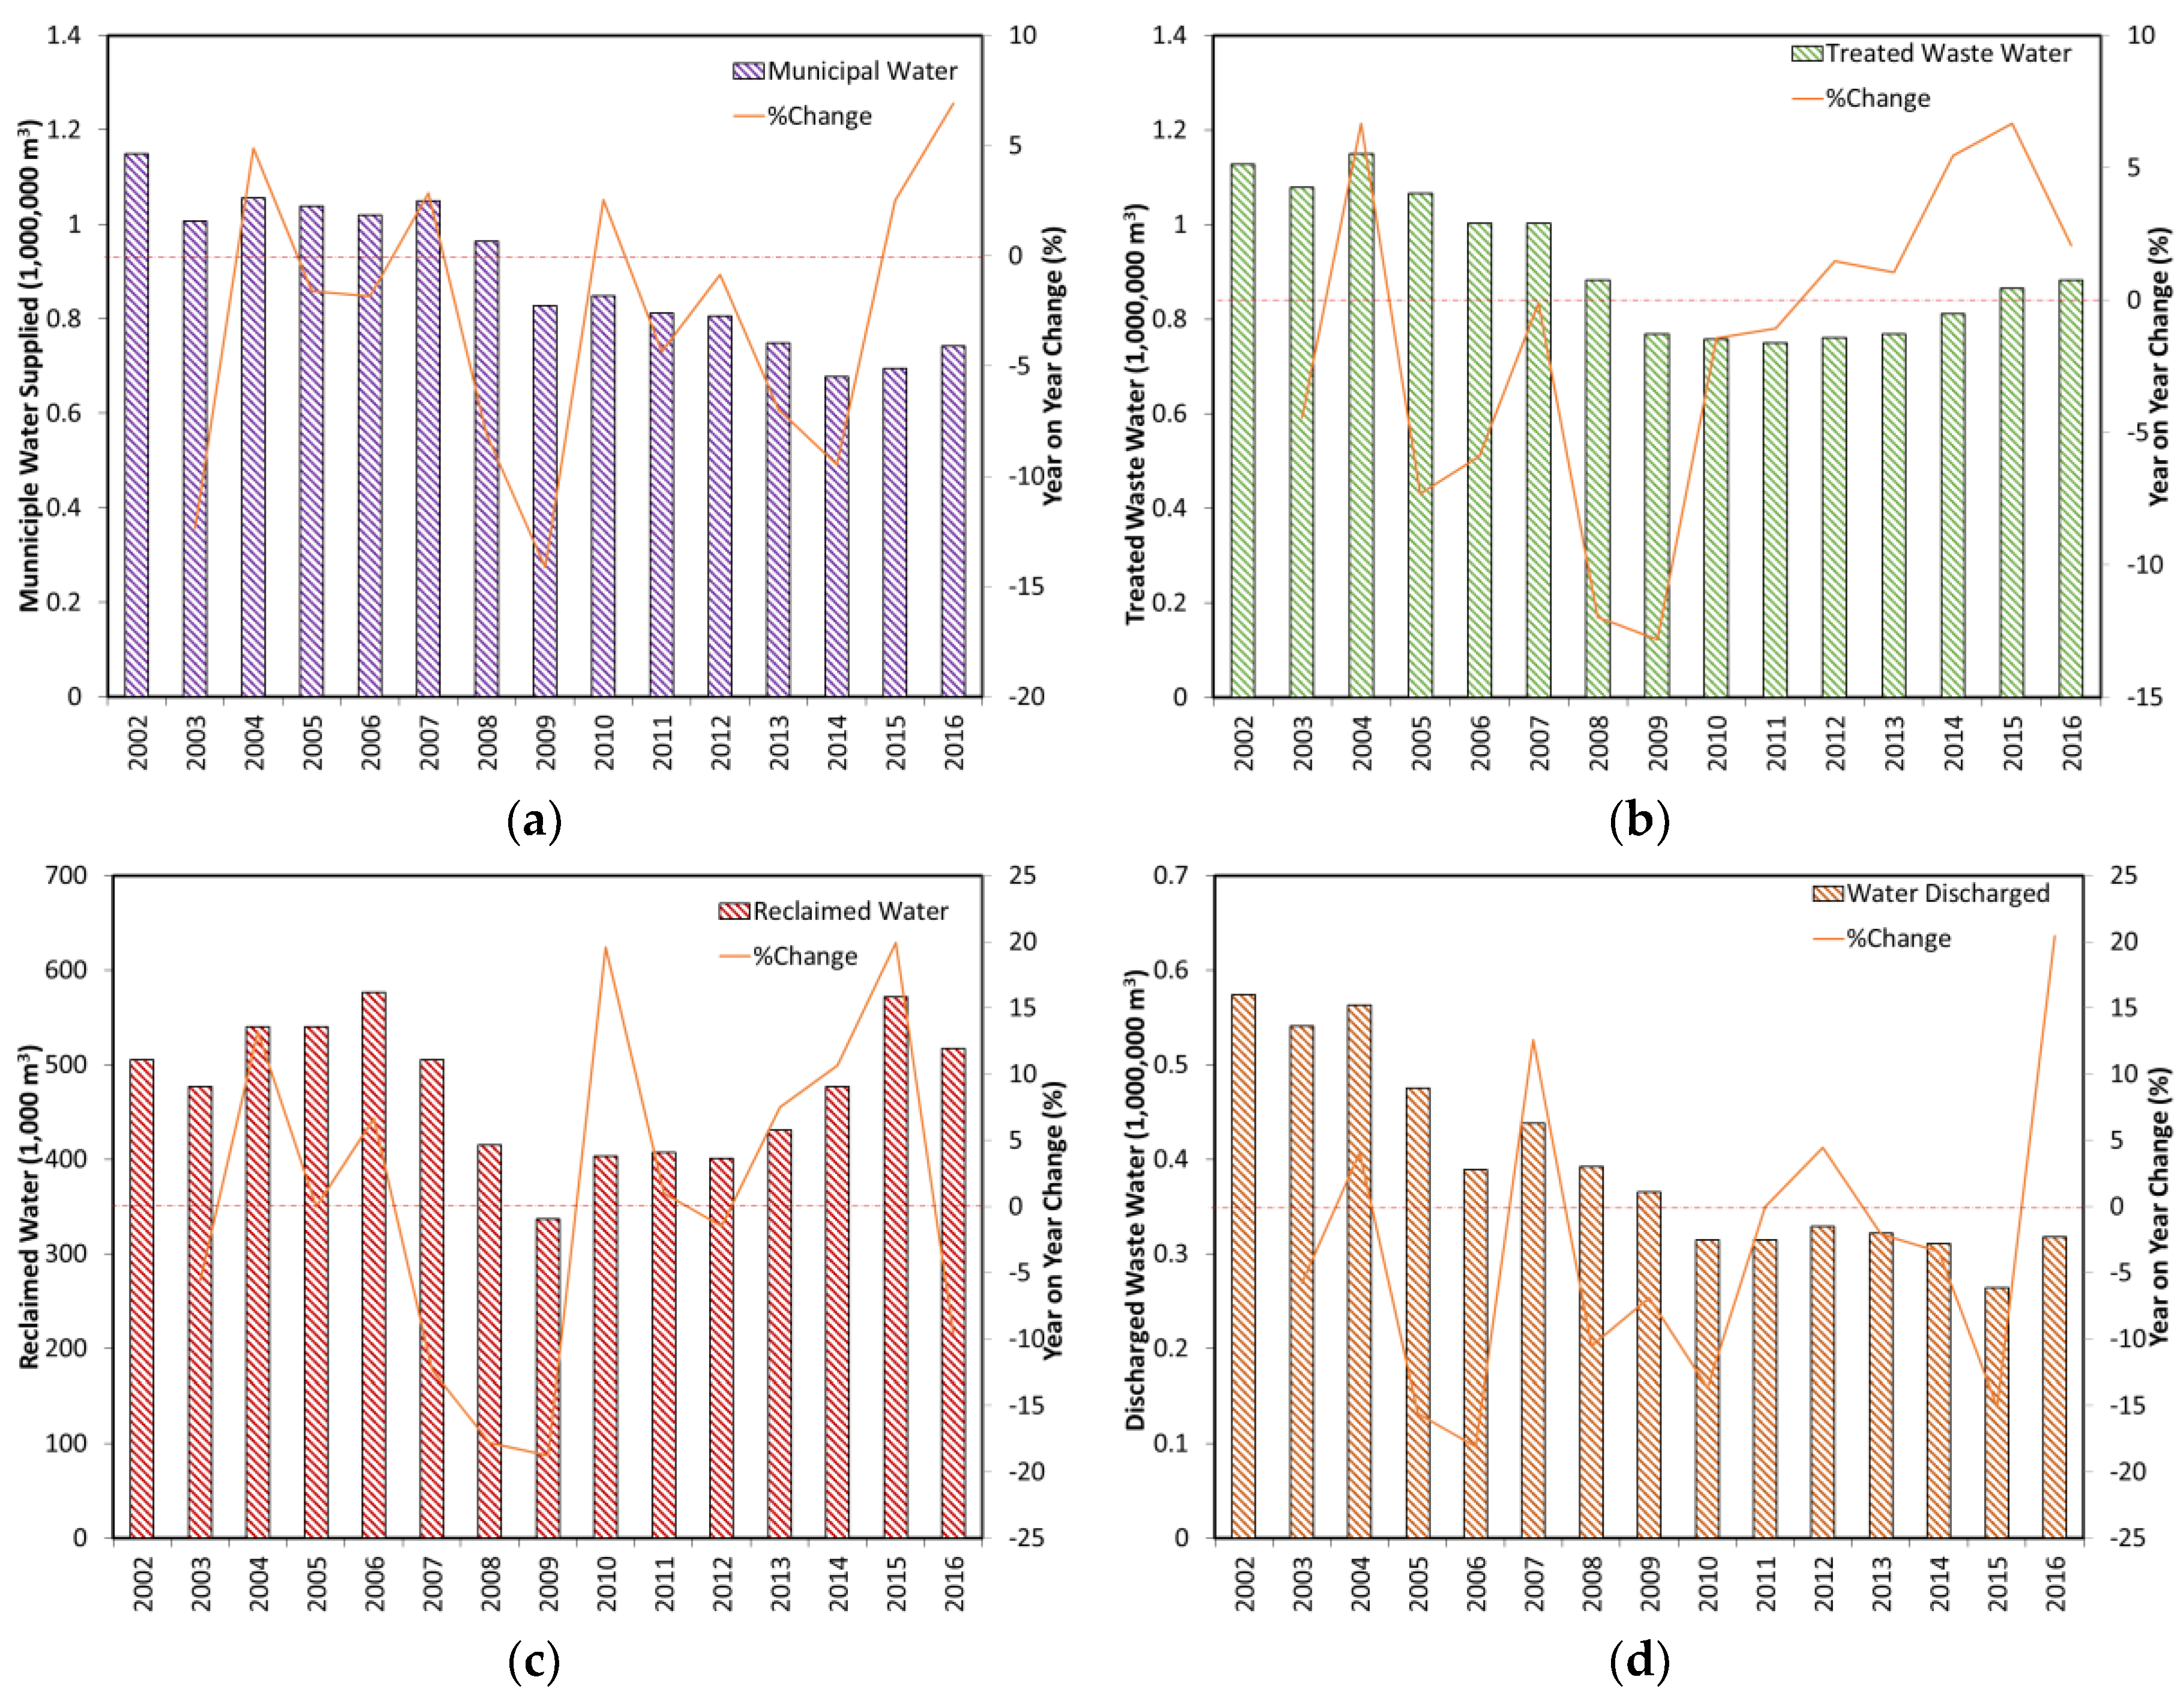
4.2. Principal Sources of Water at Kansai International Airport

In addition to the water purchased from the municipal authorities, KIX also processes its wastewater for subsequent reuse. These are the two principal sources of water for the airport.

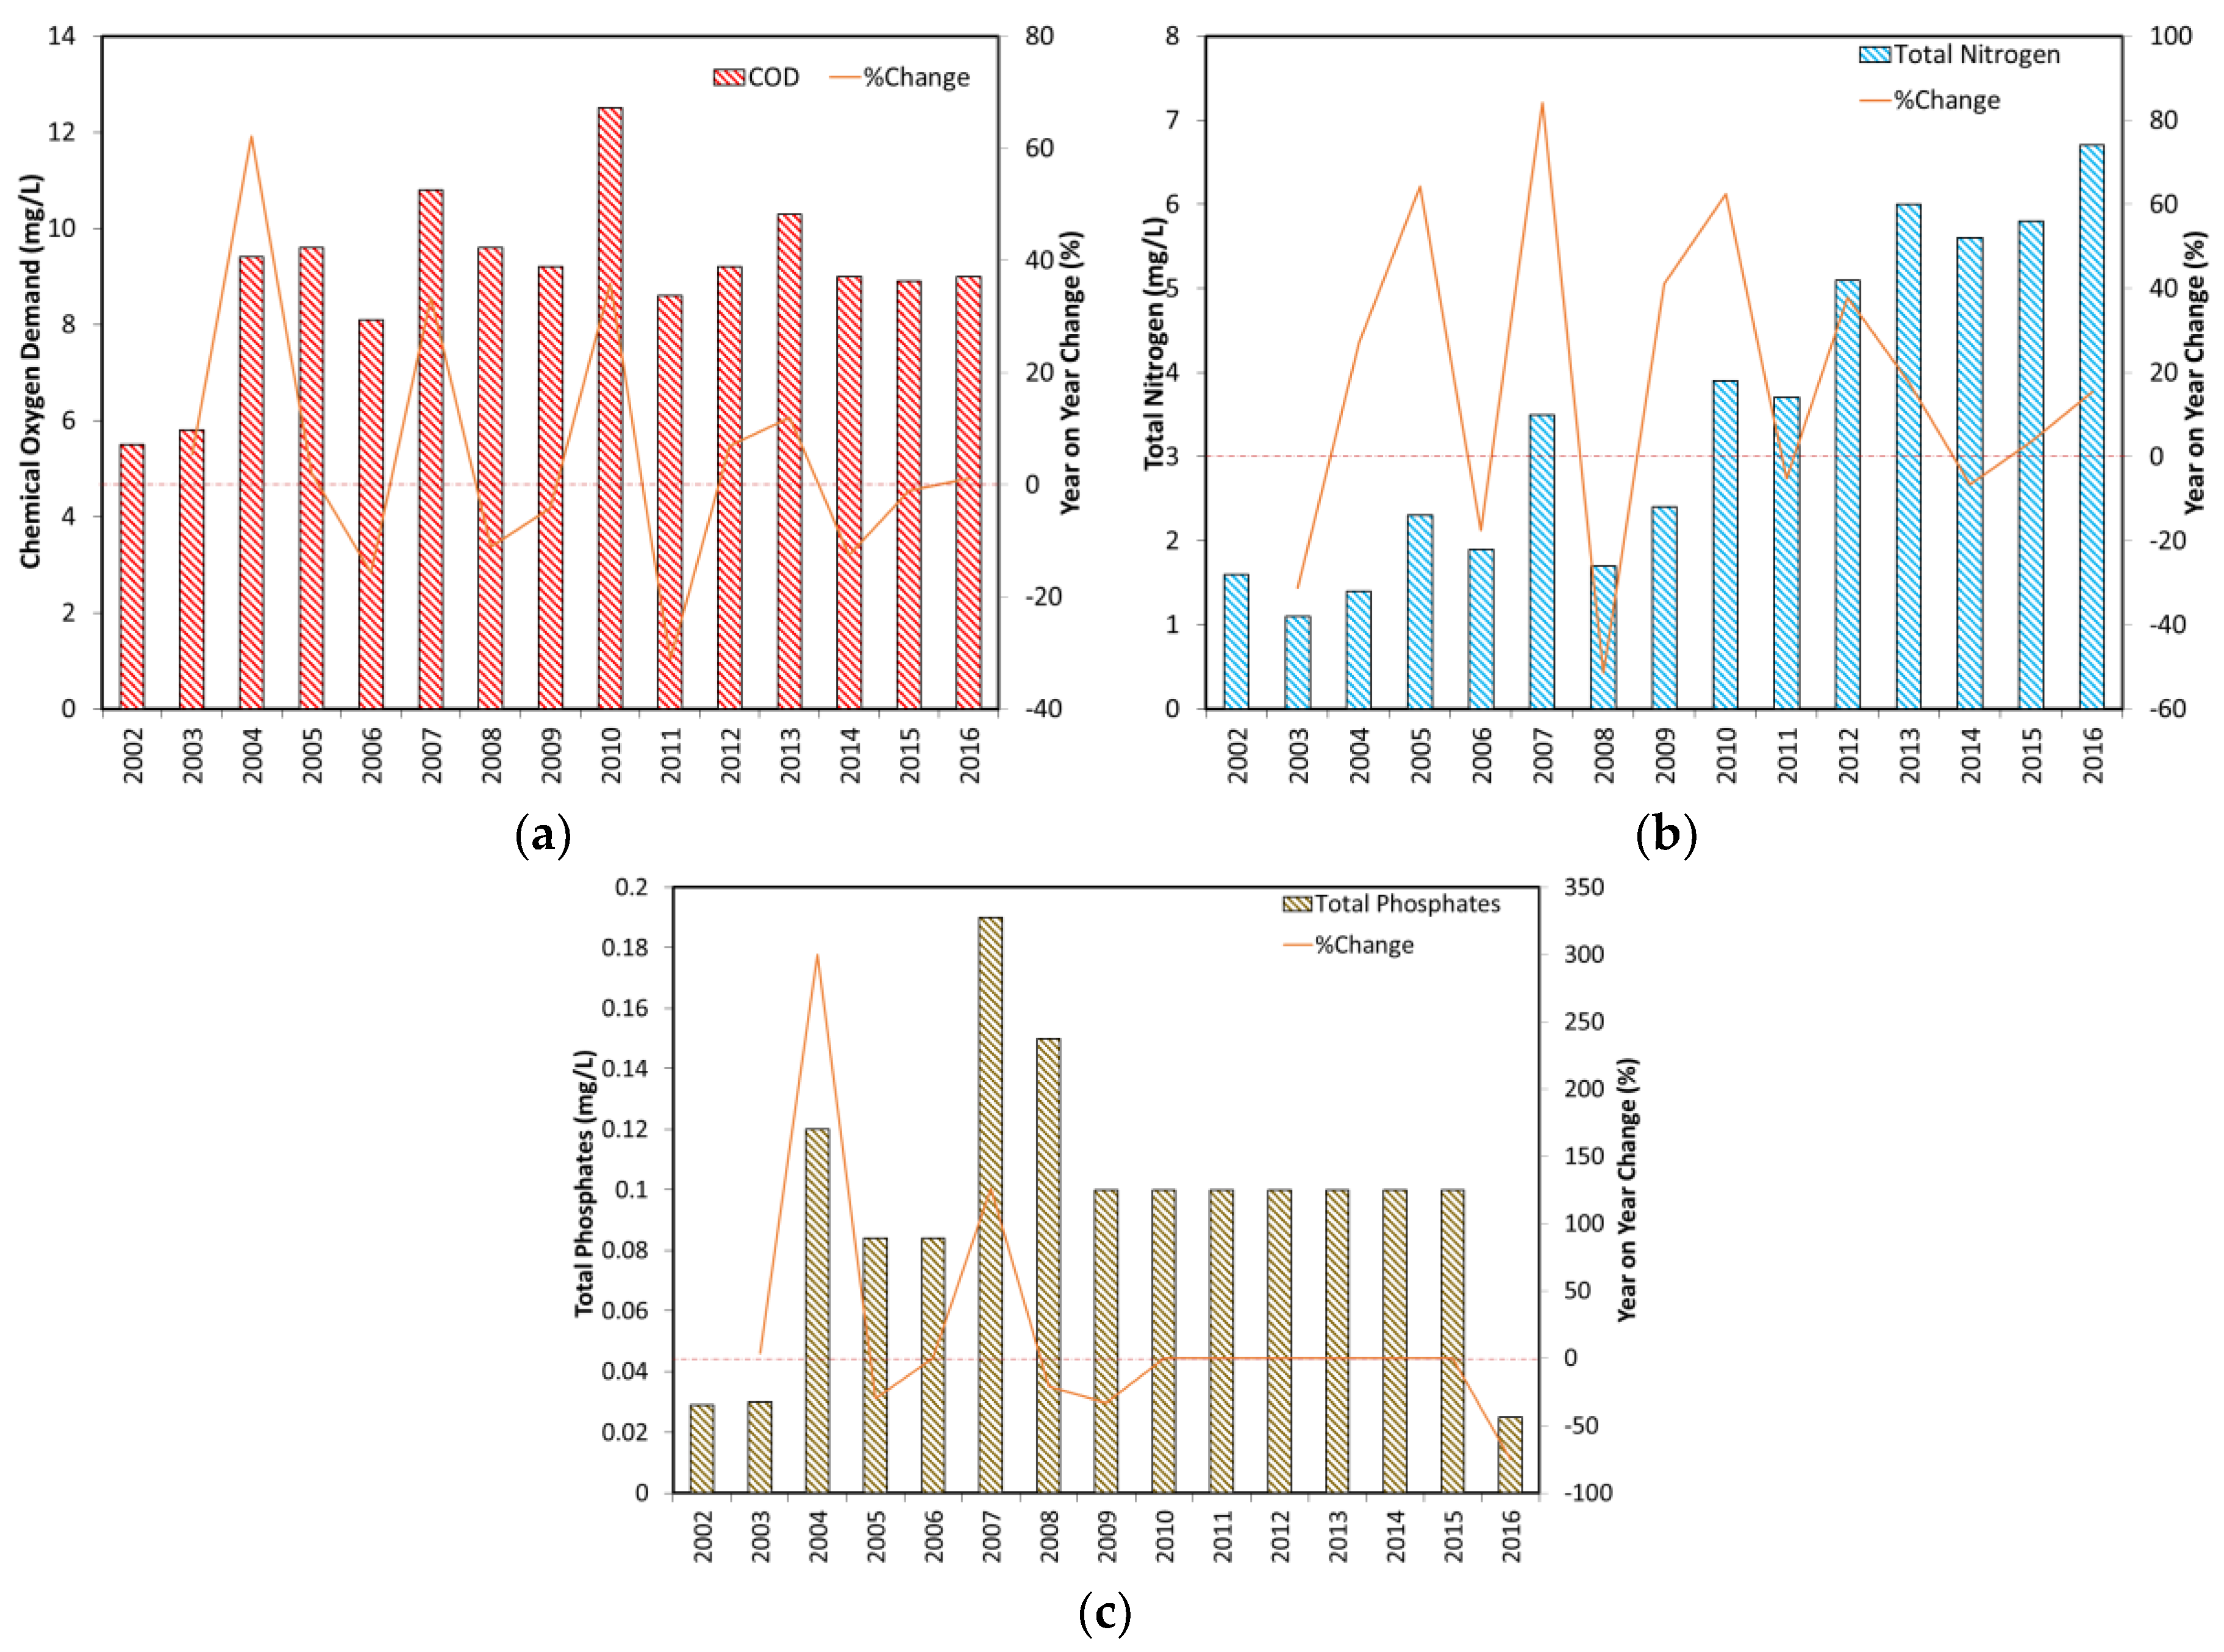
4.3. Wastewater Pollution at Kansai International Airport

Around the world, the organic water pollution indicators that are commonly used to measure water pollution are chemical oxygen demand (COD), total nitrogen (T-N), and total phosphorus (T-P) [26]. The COD test measures the total amount of oxygen that is required to completely oxidize organic matter to carbon dioxide (CO2) and water. Hence, the COD test provides an indication of its potential maximum oxygen demand. According to Grantham [20] (p. 118), “the nutrients nitrogen and phosphorus occur naturally in the aquatic environment”. The discharge of nutrients into the receiving waters can adversely impact the delicate balance of aquatic eco-systems whilst also causing secondary pollution effects [20] (p. 118).
Prior to examining KIX’s water pollution, it is important to note Japan’s National Effluent Standards. The government’s national effluent standards are uniformly applied across the country and are comprised of two categories: the standards for protecting human health and the standards for protecting the living environment. Table 1 presents Japan’s current Uniform National Effluent Standards. These standards are relevant to effluent, requiring discharged water to be monitored. There is no requirement for monitoring of raw wastewater prior to treatment.
KIX carefully monitors water pollution measures on a regular basis. Importantly, the airport has voluntarily set water quality standards that are more stringent than the regulated standards. For example, the maximum regulated chemical oxygen demand (COD) discharge is 20 mg/L, yet the KIX standard is 12 mg/L [11].

4.4. Wastewater Treatment at Kansai International Airport

General wastewater that is produced from airport-related facilities at KIX is directed to a wastewater treatment plant for advanced treatment prior to it being discharged. The treated water that is discharged from the airport is significantly cleaner than legally-required standards. This is because the airport uses its own more stringent voluntary standards (for example, a chemical oxygen demand [COD] daily average 12 mg/L) [11]. Chemical oxygen demand (COD) is defined “as the amount of (dissolved) oxygen required to oxidise and stabilize (organic and inorganic content of) the sample solution”. According to Srinivas [64] (p. 10), “COD is used to measure the content of the oxidisable organic—as well as inorganic—matter of the given sample of waters” [64]. KIX has a laboratory which is equipped with a variety of testing equipment to measure and monitor water quality. This practice, therefore, ensures the rigorous control of water quality prior to the point when the treated water is discharged into Osaka Bay [11].
Wastewater that is generated from the airport’s passenger terminal buildings and other airport facilities is considered to be general wastewater, and hence, undergoes advanced treatment such as activated-sludge circulation nitrification/denitrification, and chemical clarification (coagulation/sedimentation). The advanced wastewater treatment also includes rapid sand filtration. Special wastewater generated from industrial sources initially undergoes onsite pre-processing to remove hazardous substances. This special wastewater subsequently undergoes advanced treatment at KIX’s wastewater treatment plant through chemical coagulation/sedimentation and rapid sand filtration processes, and so forth. As previously noted, following the advanced treatment, the treated water is reused as reclaimed water for various purposes, such as the flushing of toilets, watering plants, and so forth, and any surplus amount is then discharged into the sea. The airport’s wastewater treatment plant has the capacity to process 10,050 m3/day of general wastewater and 3300 m3/day of special wastewater. In the 2015 fiscal year, the average processed volumes were 2151 m3/day of general wastewater and 225 m3/day of special wastewater [11].
Figure 3 shows the circulation of water resources at KIX. As noted earlier, clean water is sourced from the municipal authorities. Wastewater is processed at the airport’s wastewater treatment centre and reclaimed water is supplied back into the airport where it is used for toilet flushing, water plants, and road and tarmac cleaning (Figure 3). Figure 3 also shows that treated wastewater that is not suitable for re-use is discharged into Osaka Bay [11].

4.5. Qualitative Analysis

KIX, like other major hub airports, requires substantial volumes of municipally supplied water to maintain and service its infrastructure and to accommodate its key stakeholder requirements. As can be seen in Figure 4a, which shows the annual water supplied to KIX by the municipal authorities and the year-on-year change (%) from 2002 to 2016, the airport has been able to reduce the overall consumption of water supplied from municipal sources from 2008 to 2014. This is despite the increased passenger traffic and aircraft movements recorded over the same period (Figure 1 and Figure 2). An important aspect of KIX’s environmental policy is to ensure that the airport’s water recycling systems ensure the most efficient use of water resources. This is achieved through the airport’s efforts to promote the use of reclaimed water [11]. Kansai Airport also encourages key stakeholders to save water wherever possible, with the use of automatic taps and other water conservation devices [11]. The airport also promotes and encourages the use of reclaimed/recycled water [57].
The year-on-year changes (%) in the annual wastewater treated by KIX from 2002 to 2016 are presented in Figure 4b. The annual volumes of wastewater treated at the airport during this period peaked in 2004 and then subsequently declined from 2005 to 2008, and then largely stabilized at around 760,000 m3 from 2010 to 2013. From 2014 to 2015, the treated wastewaters averaged around 853,000 m3.
KIX focuses on the recycling of resources as part of its environmental plan and aims to recycle (reclaim) water wherever possible. As such, KIX reuses a proportion of the treated wastewater. Figure 4c shows the annual reclaimed water volumes at KIX from 2002 to 2016. As can be seen in Figure 4c, the annual volumes of reclaimed water have oscillated quite clearly with the airport achieving the highest level of reclaimed water in 2006. In 2007 and 2008, the volumes of reclaimed water fell but have steadily increased from 2010 to 2015, particularly from 2013 to 2015. Overall, based on the year of year change, the reclaimed water volume has remained fairly consistent.
Other than reclaiming, a significant proportion of treated wastewater is discharged into Osaka Bay, where the airport is located. The year-on-year changes (%) in the annual wastewater discharged by KIX from 2002 to 2016 are presented in Figure 4d. The trend, based on the year of year change, is that the total annual volume of wastewater discharged by the airport is decreasing (only 4 of the 15 years saw an increase in the volume of wastewater discharged).
Figure 5a shows the annual trends in the amount of COD at KIX from 2002 to 2016. As can be observed, there was an upward trend in the COD from 2002 to 2007, where it stabilized in 2008, and subsequently, declined in 2009. The COD levels rose again in 2010 before declining in 2011 and then increased again in 2012 and 2013 before declining again in 2014 and 2015. However, other than the relatively large spike in 2004 in the year-on-year change, the 2004 to 2016 COD value is fairly constant with an average of 9.6 mg/L.
Figure 5b shows the annual trends in the total amount of nitrogen (T-N) in the wastewater discharged at KIX from 2002 to 2016. The total nitrogen (T-N) is a complete measure of the nitrogen content in water. The principal forms of nitrogen in water are nitrate (NO3), nitrite (NO2), ammonia (NH3), and organic nitrogen [65]. The annual T-N measures at KIX have oscillated over the period with an increase recorded in 2007, prior to a decline in 2008, and then there was a general increase over the subsequent years.
Water is also regularly checked at KIX for phosphates. Phosphates in water are classified as “orthophosphates, condensed phosphates, and organic phosphates” [65] (p. 64). Figure 5c shows the annual trends in the total amount of phosphates (T-P) in the wastewater discharged at KIX from 2002 to 2016. The airport has recorded very small levels of total phosphates, which has averaged around 0.09 mg/L over the period of the study and has clearly remained fairly constant.

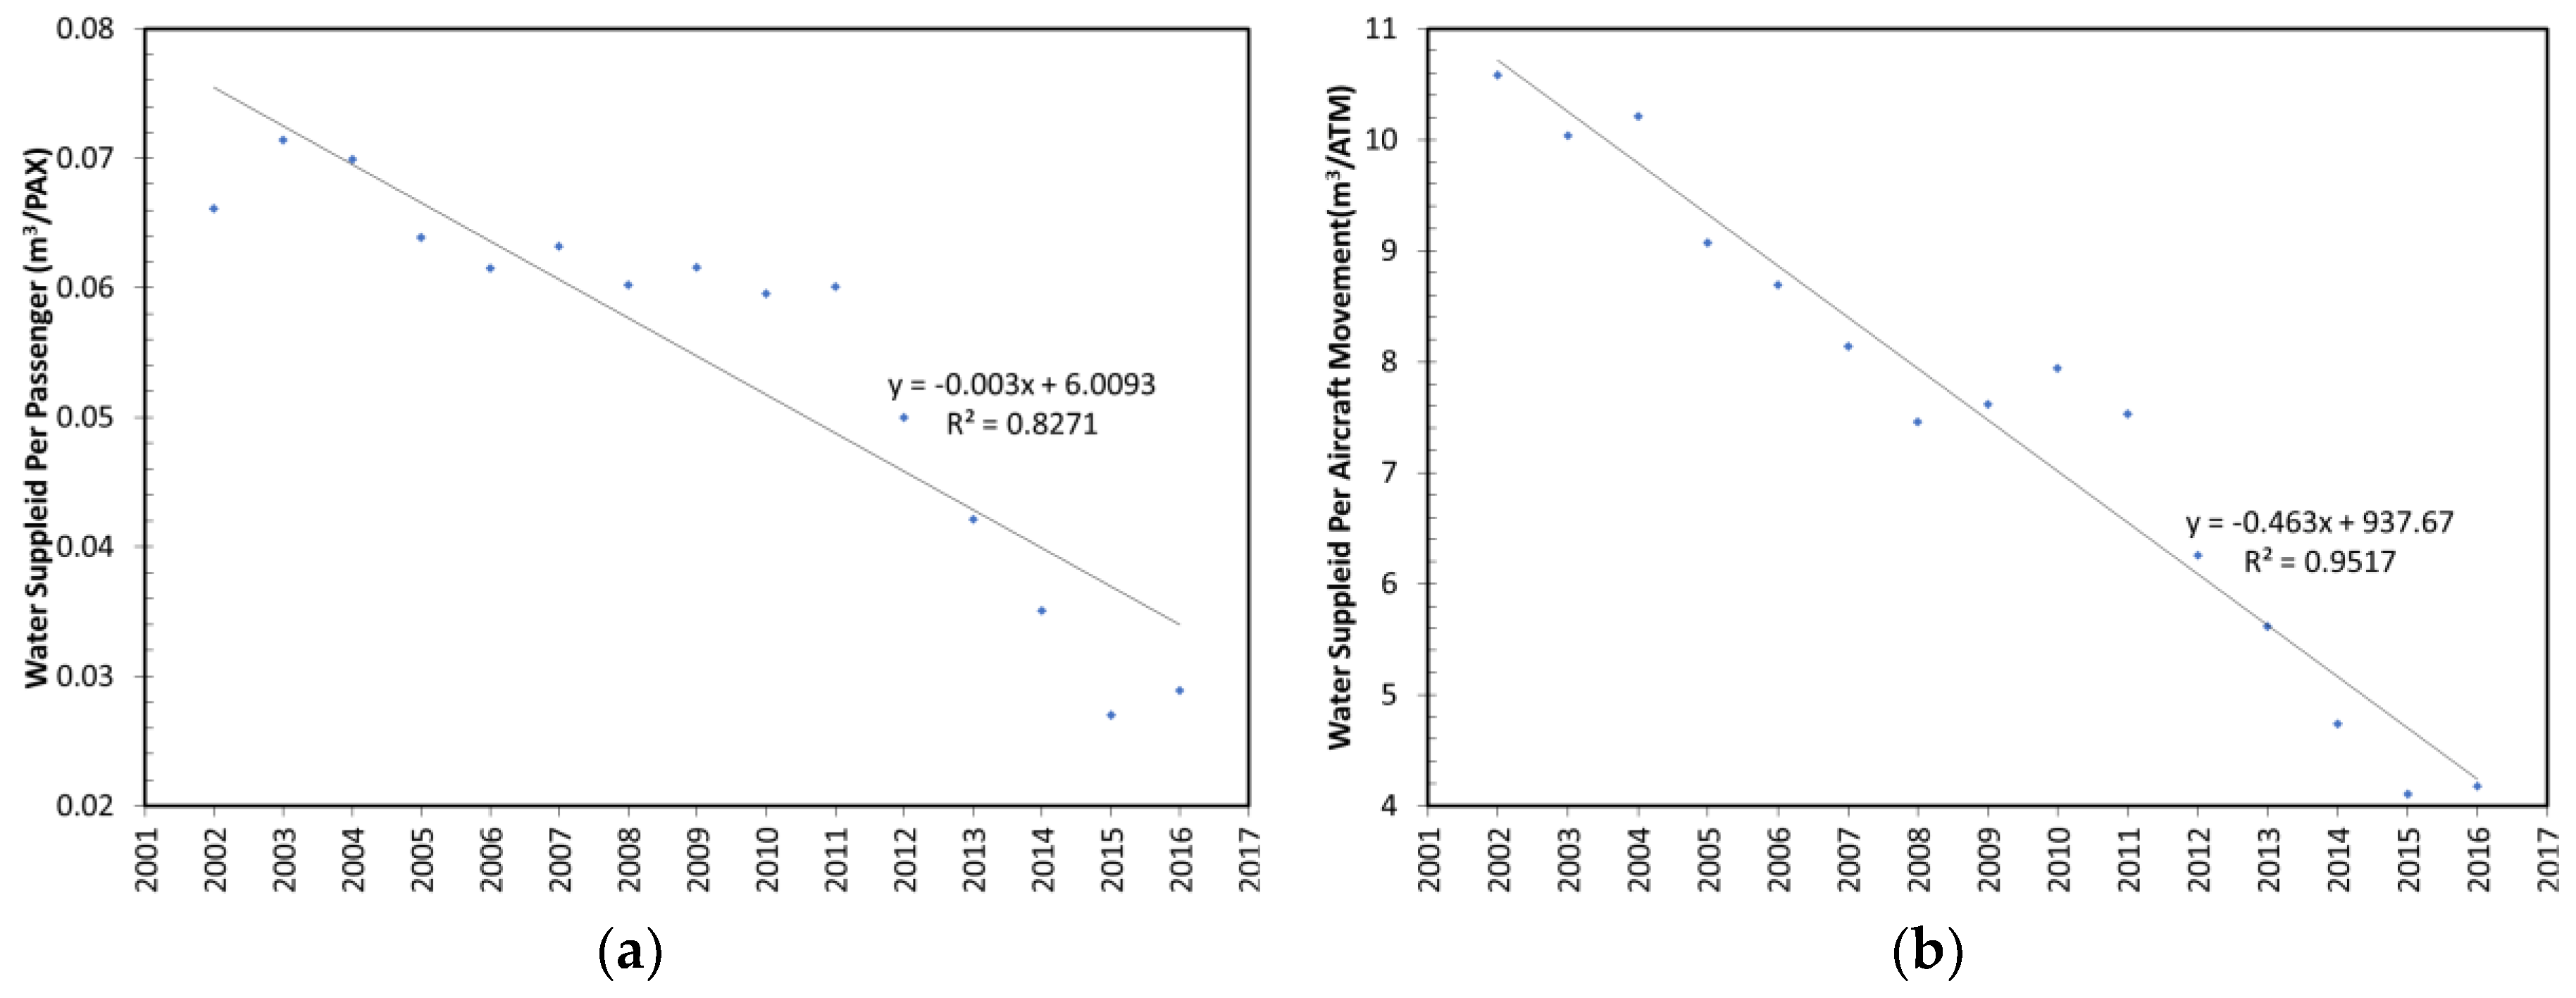
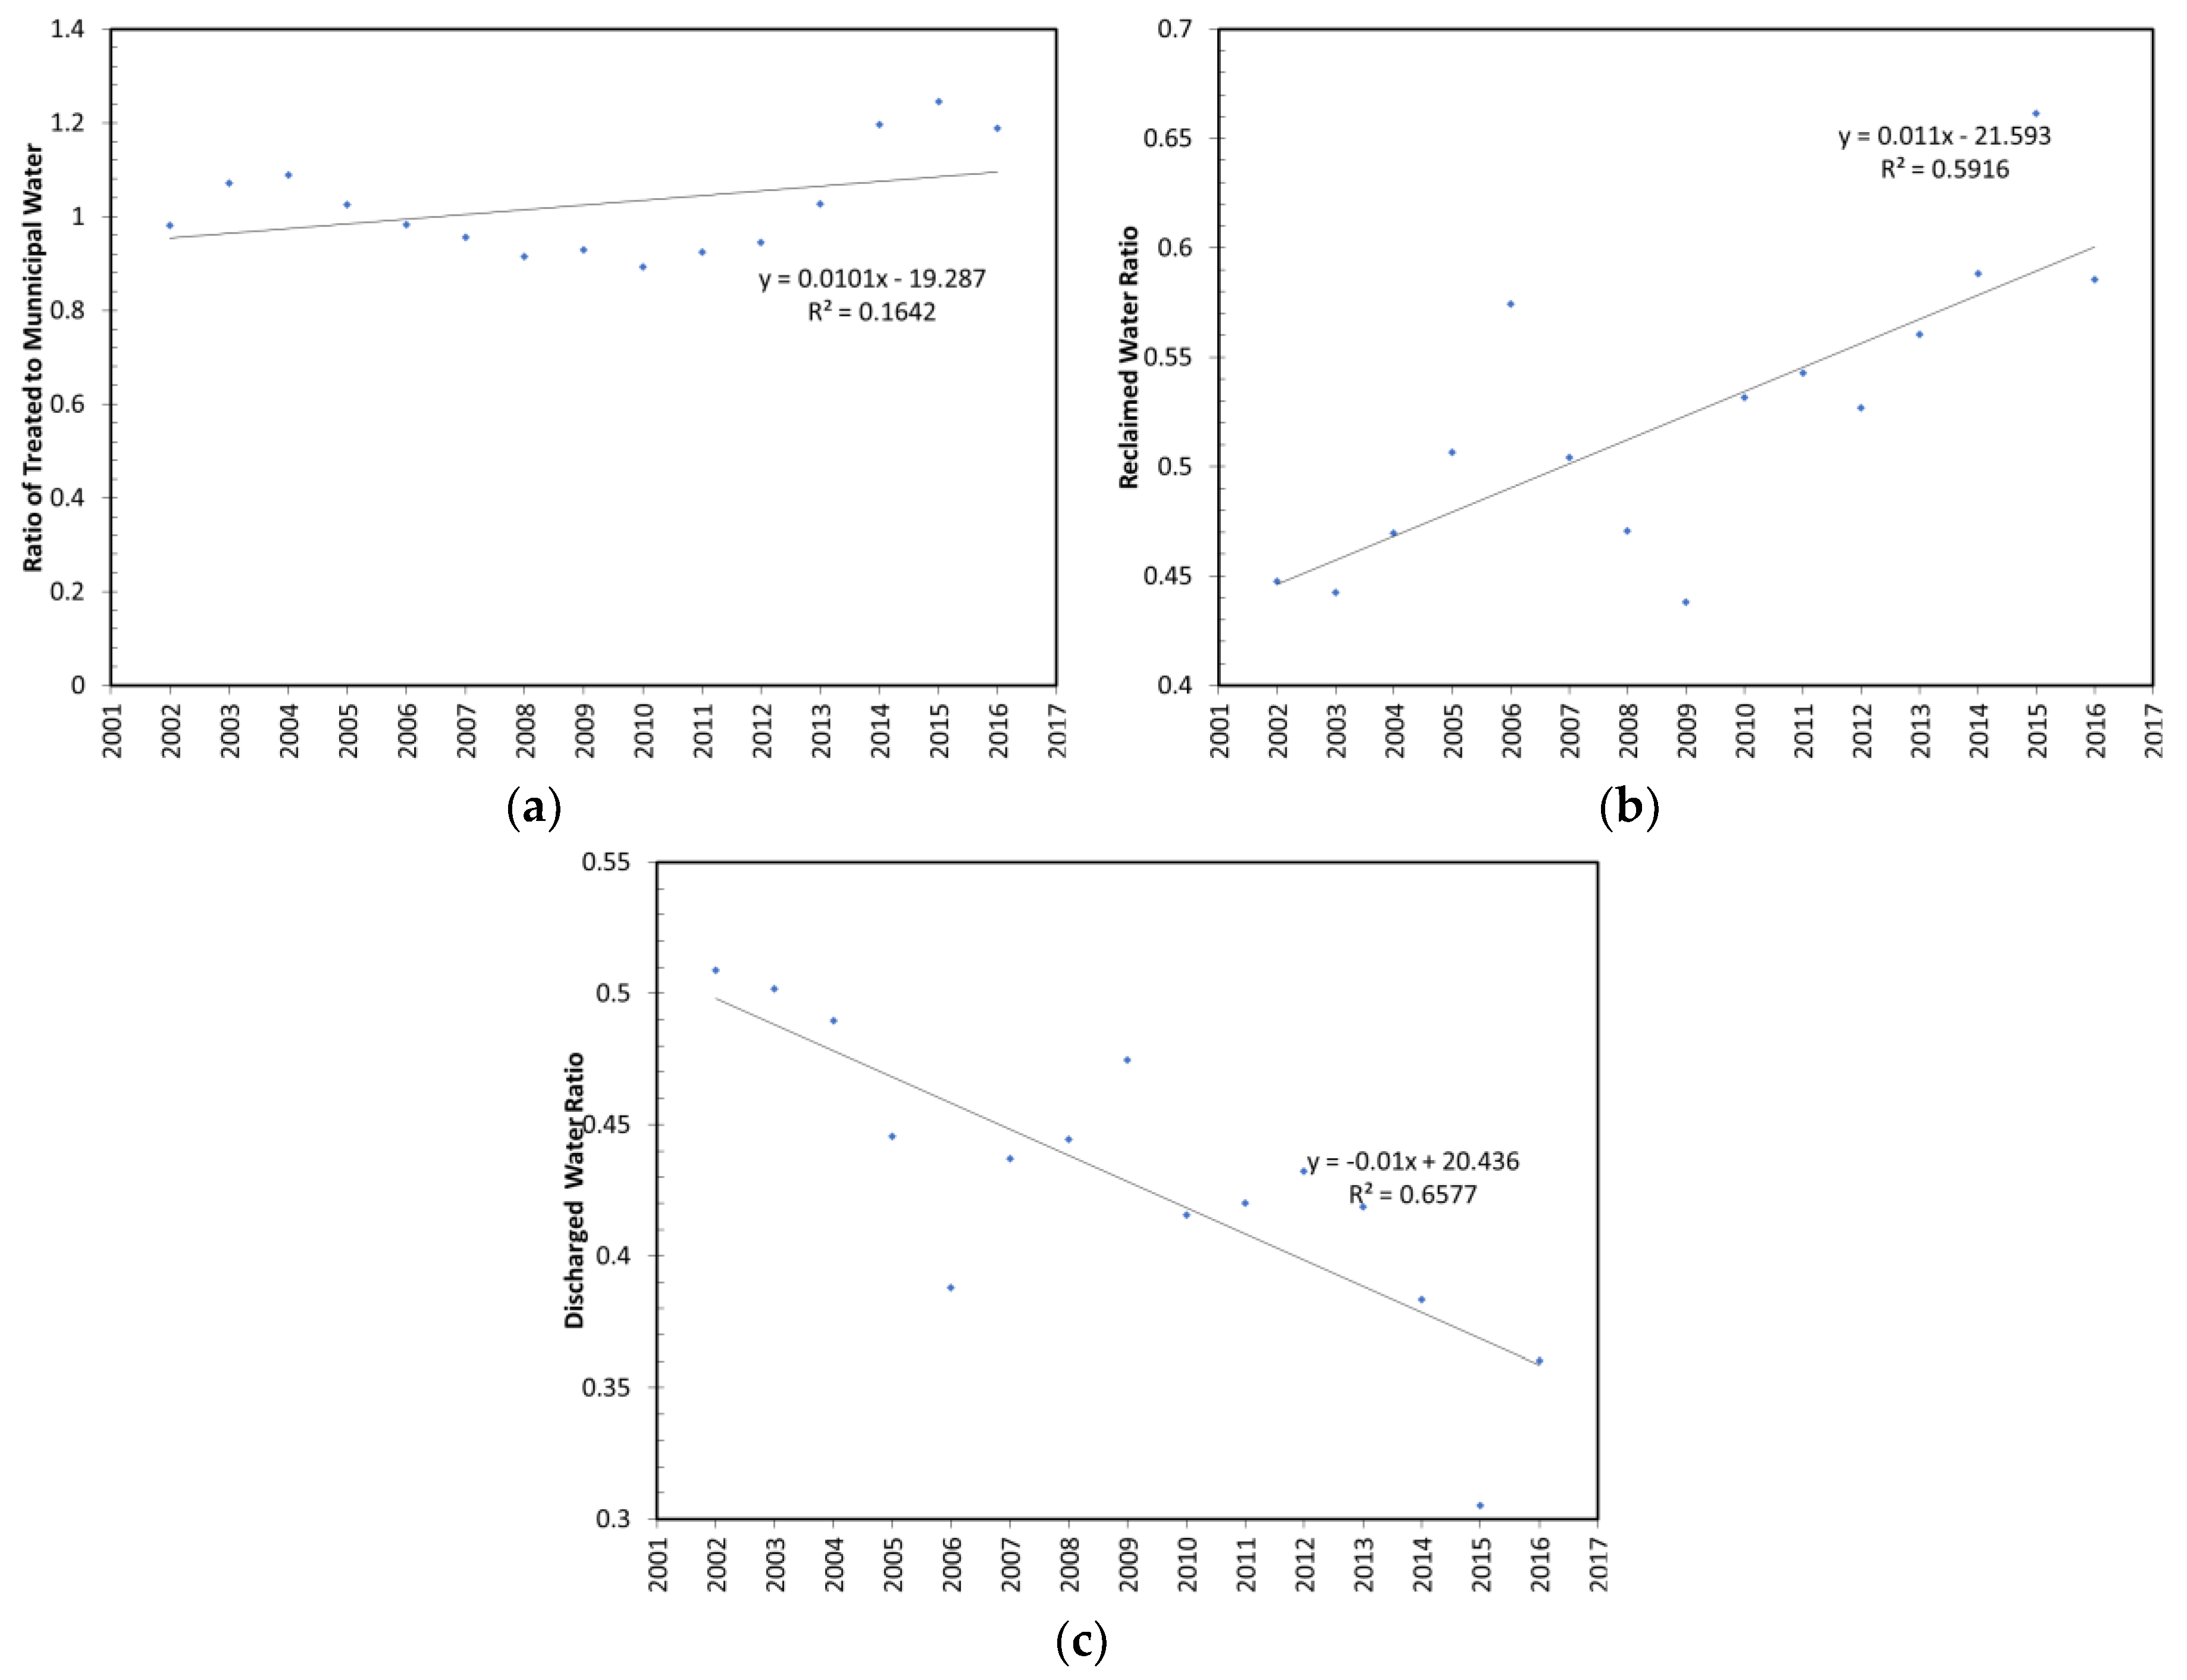
4.6. Quantitative Analysis

One of the primary indicators of environmental management performance measures at airports is the water consumption per passenger [66,67,68,69]. Figure 6a shows the water consumption per passenger at KIX from 2002 to 2016. There is a clear trend in terms of a reduction in the amount of water consumed per passenger utilizing the airport over the review period and this, as previously noted, despite the large increase in passenger using the airport. This fact is supported by the associated conclusion in Table 2 (reject H0).
Figure 6b shows the municipally supplied water per aircraft take-off/landing (LTO) cycle at KIX for the period 2002 to 2016. As can be observed, the amount of water per aircraft movement has declined from a high in 2002 to a low in 2015. Again, the conclusion in Table 2 (reject H0) supports the observation that there is a significant reduction in water consumption per aircraft movement. This is despite larger aircraft types, such as the Airbus A380 and Boeing B777-300ER aircraft using the airport. This suggests that both the airlines and Kansai Airport are very carefully monitoring their water usage.
Figure 7 shows the various treated wastewater ratios. Figure 7a is a scatter plot showing the line of best fit and the correlation coefficient (squared) of KIX’s total treated wastewater volume relative to the municipally supplied water volume from 2002 to 2016, as a ratio. The weak r squared value suggests that relatively speaking, the volume of wastewater treated has remained constant (Table 2 conclusion: accept H0). Figure 7b is a scatter plot drawing showing the line of best fit and the correlation coefficient (squared) of KIX’s annual reclaimed wastewater ratio from 2002 to 2015, relative to the total treated wastewater. From Table 2, the ratio of wastewater reclaimed has increased over the period of the study (conclusion: reject H0). Note that this result is in contrast to the conclusion for the volume of reclaimed water alone, which has not changed (Table 2 conclusion: accept H0); however, the total volume of wastewater treated needs to be considered (the reclaimed water ratio). Figure 7c is a scatter plot showing the line of best fit and the correlation coefficient (squared) of the ratio of the treated wastewater discharged from KIX relative to the total treated wastewater, from 2002 to 2016. As the majority of treated wastewater is either reused or discharged, the trend of the discharge ratio is the opposite of that for the reclaimed ratio, that is, a statistically decrease (Table 2 conclusion: reject H0).
The final section of Table 2 to be considered are the water pollutant metrics. The first of these is the COD concentration. The result of the regression analysis is a statistically insignificant correlation coefficient. Therefore, we can conclude that the COD from KIX from 2002 to 2016 has remained constant with time. For the T-N, the conclusion from Table 2 is to reject H0; that is, the T-N discharged from KIX from 2002 to 2016 has increased with time. This is a significant result and highlights why the airport so closely monitors these levels in its water monitoring and analysis program. It should be noted that the current levels are well below the regulated limits indicated in Table 1 (by almost a factor of 20). Finally, for T-P, the result presented in Table 1 is to accept the null hypothesis. As such, the T-P discharged from KIX from 2002 to 2016 has remained constant with time.

5. Discussion

5.1. Findings

Historically, Kansai Airport has sought to promote water conservation as a key part of its sustainable water management. To achieve this objective, the airport works closely with key stakeholders to find ways to conserve water. The airport also encourages the use of reclaimed/recycled water wherever possible. Recycled or reclaimed water is used for watering, washing roadways, and toilet flushing.

5.2. Study Limitations

A limitation of the present study was that the data was only available at the aggregate airport level, and hence, it was not possible to analyze the water usage in the KIX airside and landside precincts. Should such data become available in the future then a future study could examine water usage and the systems used to monitor and process water at both the airside and landside precinct levels?

5.3. Future Work

Future work on Airport Sustainable Water Management will look at a cross-sectional study to investigate how KIX compares to other airports globally. This will enable a detailed understanding of how different global regions are addressing sustainable water management at airports varies, and how regulator frameworks and natural environments contribute to this.

6. Conclusions

In this paper, the sustainable water management strategies and systems at KIX were examined. The airport sources water from the municipal authorities and has a wastewater treatment centre that processes wastewater for subsequent non-potable water usages, such as for the flushing of toilets, watering gardens, and washing the tarmac and roads. Despite the substantial increase in passengers and aircraft movements, the airport has been able to reduce its consumption of municipally supplied water over the study period from 2002 to 2015. In 2015, the airport purchased 695,000 cubic metres (m3) of water from the local municipal authorities. This was a significant decrease in the 1.14 million cubic metres (m3) of water purchased from the local municipal authorities in 2002. From 2010 to 2015, the airport has successfully reduced the volume of water per passenger and per aircraft movement.
KIX aims to recycle as much water as possible and to achieve this objective the airport has built and operates a wastewater recycling centre. From 2010 to 2015, there has been a steady increase in the volume of water recycled at the airport. In 2015, a total of 572,000 cubic metres (m3) was recycled, this was a substantial increase on the volumes recycled in 2009 (337,000 cubic metres), which was the lowest annual volume of recycled water during the study period. From 2010 to 2015, there was a marked increase in the annual recycled water ratio at the airport. In 2009, the annual recycled water ratio was 43.8 per cent, the lowest during the study period, and in 2015, the recycled water ratio had increased to 66.1 per cent. This was the airport’s highest recycled water ratio during the study period (2002 to 2015).
KIX has implemented a water monitoring program that includes the regular monitoring of water quality at the airport. The key measurements are the chemical oxygen demand (COD), total nitrogen (T-N) and total phosphates (T-P). Samples from the municipal and recycled water, wastewater, and the treated wastewater that is discharged into Osaka Bay are analysed in the laboratory. The airport has voluntarily set water quality standards that are lower than the regulated standard.
Wastewater is processed at the airport’s water treatment centre and wherever possible the recycled (reclaimed water) is used for non-potable water uses. As previously noted, these include water used for toilet flushing, watering of gardens, and water used for washing roads/tarmac. The water treatment plant plays a critical role in ensuring that all water discharged from the airport complies with the airport’s statutory requirements.

Author Contributions

G.B. conceived the paper, writing the first draft paper. All authors contributed equally to the data analysis and editing of the manuscript.

Funding

This research received no external funding.

Acknowledgments

The authors would like to express their sincere gratitude to H. Shintani, Manager of Environmental Division, Kansai International Airport for the kind permission to the airport’s environmental data and reports.

Conflicts of Interest

The authors declare no conflict of interest.

References

  1. Airports Council International North America. Going Greener: Minimizing Airport Environmental Impacts. Available online: http://www.aci-na.org/sites/default/files/going_greener_brochure.pdf (accessed on 30 November 2017).
  2. Dimitriou, D.J.; Voskaki, A.J. Regional airports’ environmental management: Key messages from the evaluation of ten European airports. In Regional Airports; Postorino, M.N., Ed.; WIT Press: Southampton, UK, 2011; pp. 73–86. [Google Scholar]
  3. de Castro Carvalho, I.; Calijuri, M.L.; Assemany, P.P.; Silva, M.D.F.M.; Neto, R.M.F.; da Fonseca Santiago, A.; de Souza, M.H.B. Sustainable airport environments: A review of water conservation practices in airports. Resour. Conserv. Recycl. 2013, 74, 67–75. [Google Scholar]
  4. do Couto, E.A.; Assemany, P.; Calijuri, M.C.; Alves, L. Reuse of treated sewage effluent in airports: Irrigation of ornamental plant nursery. J. Urban Environ. Eng. 2013, 7, 264–273. [Google Scholar] [CrossRef]
  5. do Couto, EA.; Calijuri, M.L.; Assemany, P.P.; Santiago, A.; Lopes, L.S. Greywater treatment in airports using anaerobic filter followed by UV disinfection: An efficient and low cost alternative. J. Clean. Prod. 2015, 106, 372–379. [Google Scholar] [CrossRef]
  6. do Couto, E.; Calijuri, M.L.; Assemany, P.P.; da Fonseca Santiago, A.; de Castro Carvalho, I. Greywater production in airports: Qualitative and quantitative assessment. Resour. Conserv. Recycl. 2013, 77, 44–51. [Google Scholar] [CrossRef]
  7. Neto, R.M.F.; Carvalho, I.C.; Calijuri, M.L.; da Fonseca Santiago, A. Rainwater use in airports: A case study in Brazil. Resour. Conserv. Recycl. 2012, 68, 36–43. [Google Scholar] [CrossRef]
  8. Neto, R.M.F.; Calijuri, M.L.; Carvalho, I.C.; da Fonseca Santiago, A. Rainwater treatment in airports using slow sand filtration followed by chlorination: Efficiency and costs. Resour. Conserv. Recycl. 2012, 65, 124–129. [Google Scholar] [CrossRef]
  9. Vanker, S.; Enneveer, M.; Mäsak, M. Implementation of environmentally friendly measures at Tallinn Airport. Aviation 2013, 17, 14–21. [Google Scholar] [CrossRef]
  10. New Kansai International Airport Company Ltd. Smart Island KIX Environmental Plan. Available online: http://www.kansai-airports.co.jp/efforts/environment/kix/smart-island/file/smartisland_pamph_en.pdf (accessed on 21 November 2017).
  11. Kansai International Airport. Smart Island Report 2016. Available online: http://www.kansai-airports.co.jp/en/efforts/environment/kix/smart-island/file/smart_rprt16.pdf (accessed on 21 November 2017).
  12. Rossi Dal Pozzo, F. EU Legal Framework for Safeguarding Air Passenger Rights; Springer: Cham, Switzerland, 2015. [Google Scholar]
  13. Graham, A. Managing Airports an International Perspective, 4th ed.; Routledge: Abingdon, UK, 2014. [Google Scholar]
  14. Halpern, N.; Graham, A. Airport Marketing; Routledge: Abingdon, UK, 2013. [Google Scholar]
  15. Thomas, C.; Hooper, P. Sustainable development and environmental capacity of airports. In Airport Operations, 3rd ed.; Ashford, N.J., Stanton, H.P.M., Moore, C.A., Coutu, P., Beasley, J.R., Eds.; McGraw-Hill: New York, NY, USA, 2013; pp. 553–578. [Google Scholar]
  16. Chandrappa, R.; Das, D.B. Sustainable Water Engineering: Theory and Practice; John Wiley & Sons: Hoboken, NJ, USA, 2014. [Google Scholar]
  17. Kuller, M.; Dolmanc, N.J.; Vreeburgad, J.H.G.; Spillera, M. Scenario analysis of rainwater harvesting and use on a large scale—Assessment of runoff, storage and economic performance for the case study Amsterdam Airport Schiphol. Urban Water J. 2015, 14, 237–246. [Google Scholar] [CrossRef]
  18. Somerville, A.; Baxter, G.S.; Richardson, S.; Wild, G. Sustainable water management at major Australian regional airports: The case of Mildura Airport. Aviation 2015, 19, 83–89. [Google Scholar] [CrossRef]
  19. Hansen, M.; Ryerson, M.S.; Marchi, R.F. New methodologies for environmental impact analysis. In Modelling and Managing Airport Performance; Zografos, K., Andreatta, G., Odoni, A., Eds.; John Wiley & Sons: Chichester, UK, 2013; pp. 145–160. [Google Scholar]
  20. Grantham, D.J. Surface water contamination caused by airport operations. In Environmental Management at Airports: Liabilities and Social Responsibilities; Tunstall Pedoe, N., Raper, D.W., Holden, J.M.W.., Eds.; Thomas Telford Publishing: London, UK, 1996; pp. 104–121. [Google Scholar]
  21. Fawell, J.K. Drinking water quality and health. In Pollution: Causes, Effects and Control, 5th ed.; Harrison, R.M., Ed.; RSC Publishing: Cambridge, UK, 2014; pp. 60–79. [Google Scholar]
  22. Copenhagen Airports A/S. Environmental Report 2007. Available online: https://www.cph.dk/contentassets/fe47a2fb90bd4688a72aa2987119d645/miljo2007_uk.pdf (accessed on 30 November 2017).
  23. Kazda, T.; Caves, B.; Kamenický, M. Environmental control. In Airport Design and Operation, 3rd ed.; Kazda, A., Caves, R.E., Eds.; Emerald Group Publishing: Bingley, UK, 2015; pp. 457–500. [Google Scholar]
  24. Horonjeff, R.; McKelvey, F.X.; Sproule, W.J.; Young, S.B. Planning and Design of Airports, 5th ed.; McGraw-Hill: New York, NY, USA, 2010. [Google Scholar]
  25. McGormley, R.W. Guidebook of Practices for Improving Environmental Performance at Small Airports; ACRP Report 43; Transportation Research Board: Washington, DC, USA, 2011. [Google Scholar]
  26. Yan, J. Comprehensive Evaluation of Effective Biomass Resource Utilization and Optimal Environmental Policies; Springer: Berlin/Heidelberg, Germany, 2015. [Google Scholar]
  27. Balsaraf, V.M.; Pawar, A.V.; Mane, P.A. Applied Chemistry, 2nd ed.; I.K. International Publishing House: New Delhi, India, 2010; Volume 1. [Google Scholar]
  28. Marais, K.; Wolfe, P.J.; Waitz, I.A. Air transport and the environment. In The Global Airline Industry, 2nd ed.; Belobaba, P., Odoni, A., Barnhart, C., Eds.; John Wiley & Sons: Chichester, UK, 2015; pp. 423–459. [Google Scholar]
  29. Branchu, P.; Gres, L.; Mougin, F.; Le Blanc, M.; Lucas, E.; Mars, B. French airport runoff pollution management (water and sludge): Toward a new approach based on constructed wetlands? Case of Aéroports de Paris—Orly (France). Water Pract. Technol. 2014, 9, 20–32. [Google Scholar] [CrossRef]
  30. Young, S.B.; Wells, A.T. Airport Planning and Management, 6th ed.; McGraw-Hill: New York, NY, USA, 2011. [Google Scholar]
  31. Meincke, P.A.; Tkotz, A. Airports—Types, functions, facilities and accessibility. In Introduction to Aviation Management; Wald, A., Fay, C., Gleich, R., Eds.; LIT Verlag: Münster, Germany, 2010; pp. 89–130. [Google Scholar]
  32. Creswell, J.W. A Concise Introduction to Mixed Methods Research; SAGE Publications: Thousand Oaks, CA, USA, 2014. [Google Scholar]
  33. Creswell, J.W.; Plano Clark, V.L. Designing and Conducting Mixed Methods Research, 3rd ed.; SAGE Publications: Singapore, 2017. [Google Scholar]
  34. Hair, J.F. Essentials of Business Research Methods, 2nd ed.; M.E. Sharpe, Inc.: Armonk, NY, USA, 2011. [Google Scholar]
  35. Mooi, E.; Sarstedt, M. A Concise Guide to Market Research: The Process, Data, and Methods Using IBM SPSS Statistics; Springer: Berlin/Heidelberg, Germany, 2011. [Google Scholar]
  36. Weathington, B.L.; Cunningham, C.J.L.; Pittenger, D.J. Research Methods for the Behavioral and Social Sciences; John Wiley & Sons: Hoboken, NJ, USA, 2010. [Google Scholar]
  37. Putman, S.M.; Rock, T. Action Research: Using Strategic Inquiry to Improve Teaching and Learning; SAGE Publications: Thousand Oaks, CA, USA, 2017. [Google Scholar]
  38. Rahim, A.R.; Baksh, M.S. Case study method for new product development in engineer-to-order organisations. Work Study 2003, 52, 25–36. [Google Scholar] [CrossRef]
  39. Yin, R.K. Case Study Research: Design and Methods, 4th ed.; SAGE Publications: Thousand Oaks, CA, USA, 2009. [Google Scholar]
  40. Fasone, V.; Maggiore, P. “Non-Aviation” activities and the introduction of new thinking and ideas in the airport business: Empirical evidence from an Italian case study. J. Airl. Airpt. Manag. 2012, 2, 34–50. [Google Scholar]
  41. Yin, R.K. Case Study Research: Design and Methods, 6th ed.; SAGE Publications: Thousand Oaks, CA, USA, 2017. [Google Scholar]
  42. Corbin, J.; Strauss, A. Grounded theory research: Procedures, canons and evaluative criteria. Zeitschrift für Soziologie 1990, 19, 418–427. [Google Scholar] [CrossRef]
  43. Leedy, P.D.; Ormrod, J.E. Practical Research: Planning and Design, 11th ed.; Pearson Education: London, UK, 2014. [Google Scholar]
  44. Baxter, G.; Srisaeng, P. Cooperating to compete in the global air cargo industry: The case of the DHL Express and Lufthansa Cargo A.G. joint venture airline ‘AeroLogic’. Infrastructures 2018, 3, 7. [Google Scholar] [CrossRef]
  45. Caputo, F.; Veltri, S.; Venturelli, A. Sustainability strategy and management control systems in family firms: Evidence from a case study. Sustainability 2017, 9, 977. [Google Scholar] [CrossRef]
  46. Hasset, M.E.; Paavilainen-Mäntymäki, E. Longitudinal research in organizations: An introduction. In Handbook of Longitudinal Research Methods in Organisation and Business Studies; Hasset, M.E., Paavilainen-Mäntymäki, E., Eds.; Edward Elgar Publishing: Cheltenham, UK, 2013; pp. 1–22. [Google Scholar]
  47. Rainer, A. The longitudinal, chronological case study research strategy: A definition, and an example from IBM Hursley Park. Inf. Softw. Technol. 2011, 53, 730–746. [Google Scholar] [CrossRef] [Green Version]
  48. De Waal, A. A longitudinal study into the effectiveness of the HPO Framework. J. Adv. Manag. Res. 2017, 14, 352–374. [Google Scholar] [CrossRef]
  49. Andrews, D.P.S.; Pedersen, P.M.; McEvoy, C.D. Research Methods and Design in Sport Management; Human Kinetics: Champaign, IL, USA, 2011. [Google Scholar]
  50. Heiman, G.W. Basic Statistics for the Behavioral Sciences, 6th ed.; Wadsworth Cengage Learning: Belmont, CA, USA, 2011. [Google Scholar]
  51. Heavey, E. Statistics for Nursing: A Practical Approach; Jones & Bartlett Learnin: Sudbury, MA, USA, 2011. [Google Scholar]
  52. Morikawa, Y.T.; Emura, T. Ground improvement for the second phase construction of Kansai International Airport. In Advances in Deep Foundations: International Workshop on Recent Advances of Deep Foundations; Kikuchi., Y., Kimura., M., Otani, J., Morikawa, Y., Eds.; Taylor & Francis Balkema: Leiden, The Netherlands, 2007; pp. 389–394. [Google Scholar]
  53. Moorman, R.W. Osaka to me. Air Transp. World 1994, 31, 62–65. [Google Scholar]
  54. Furudoi, T. The second phase construction of Kansai International Airport considering the large and long-term settlements of the clay deposits. Soils Found. 2010, 50, 805–816. [Google Scholar] [CrossRef]
  55. Dempsey, P.S. Airport Planning and Development Handbook: A Global Survey; McGraw-Hill: New York, NY, USA, 2000. [Google Scholar]
  56. Yamaguchi, K. Evolution of Metropolitan Airports in Japan—Air Development in Tokyo and Osaka, International Transport Forum, Discussion Paper 2013. Available online: http://www.oecd-ilibrary.org/evolution-of-metropolitan-airports-in-japan_5jz5mpq7kjg0.pdf;jsessionid=11h5m0xfx5c95.x-oecd-live-02?contentType=%2fns%2fChapter&itemId=%2fcontent%2fchapter%2f9789282107393-4-en&mimeType=application%2fpdf&containerItemId=%2fcontent%2fserial%2f2074336x&accessItemIds=%2c%2fcontent%2fserial%2f25198785%2fcontent%2fserial%2f19900228%2c&option6=imprint&value6=http%3a%2f%2foecd.metastore.ingenta.com%2fcontent%2fimprint%2foecd (accessed on 2 December 2017).
  57. New Kansai International Airport Company, Ltd. Environmental Report 2014. Available online: http://www.kansai-airports.co.jp/en/efforts/environment/file/envreport2014.pdf (accessed on 22 November 2017).
  58. Airport Technology. Too High a Price? The Risks and Rewards of Airport Privatisation, Airport Technology, July 31 2014. Available online: http://www.airport-technology.com/features/featuretoo-high-a-price-the-risks-and-rewards-of-airport-privatisation-4327078/ (accessed on 24 November 2017).
  59. Nikkei Asian Review. Japanese-French Consortium to Manage Osaka Airports, Nikkei Asian Review, December 16, 2015. Available online: http://asia.nikkei.com/Business/Deals/Japanese-French-consortium-to-manage-Osaka-airports (accessed on 24 November 2017).
  60. Anna Aero. Kansai International Airport Benefits from LCC Expansion from Peach Aviation and Jetstar Japan. Available online: http://www.anna.aero/2014/11/19/kansai-international-airport-benefits-from-lcc-expansion/ (accessed on 24 November 2017).
  61. Kansai Airports. Kansai International Airport Statistics. Available online: http://www.kansai-airports.co.jp/en/company-profile/about-airports/kix.html (accessed on 29 August 2018).
  62. Kansai Airports. Airline Information. Available online: http://www.kansai-airport.or.jp/en/flight/airlines/index.html (accessed on 24 November 2017).
  63. Ministry of the Environment. Available online: https://www.env.go.jp/en/water/wq/nes.html (accessed on 13 May 2018).
  64. Srinivas, T. Environmental Biotechnology; New Age International (P) Ltd.: Delhi, India, 2013. [Google Scholar]
  65. McTigue, N.E.; Symonds, J.M. The Water Dictionary: A Comprehensive Reference of Water Terminology, 2nd ed.; American Water Works Association: Denver, CO, USA, 2010. [Google Scholar]
  66. Somerville, A.N. Chemical Librarianship: Challenges and Opportunities; Routledge: New York, NY, USA, 2013. [Google Scholar]
  67. Hazel, R.A.; David Blais, J.; Browne, T.J.; Benzon, D.M. Resource Guide to Airport Performance Indicators; Airport Cooperative Research Program (ACRP) Report 19A; Transportation Research Board: Washington, DC, USA, 2011. [Google Scholar]
  68. Graham, A. Airport benchmarking: A review of the current situation. Benchmarking Int. J. 2005, 12, 99–111. [Google Scholar] [CrossRef]
  69. Grant, J.S.; Albjerg, G.H.; Warner-Dooley, S.; Feldman, M.D.; Siecke, R.C.; Yarossi, P.A.; Cox, B.R.; Bartels Smith, J. Transportation: Aviation/airports. In Infrastructure Sustainability and Design; Pollalis, S.N., Georgoulias, A., Ramos, S.J., Schodek, D., Eds.; Routledge: New York, NY, USA, 2012; pp. 132–147. [Google Scholar]
Figure 1. The annual domestic and international passenger traffic at KIX: 2002 to 2015. Source: data derived from Reference [61].
Infrastructures 03 00054 g001
Figure 2. The annual domestic and international aircraft movements at KIX: 2002 to 2015. Source: data derived from Reference [61].
Infrastructures 03 00054 g002
Figure 3. The circulation of water resources at Kansai International Airport. Source: adapted from Reference [11] (p. 20).
Infrastructures 03 00054 g003
Figure 4. The total annual water quantities at KIX during 2002–2016 and the year-on-year change (%): (a) municipally supplied, (b) treated, (c) reclaimed, and (d) discharged. Source: data derived from References [10,11,12,13]. Note: Year-on-year change axis varies in span, and a reference “0” line is included to facilitate comparison.
Infrastructures 03 00054 g004
Figure 5. The annual wastewater pollutants at KIX during 2002–2016 and the year-on-year change (%): (a) Chemical Oxygen Demand (COD), (b) nitrogen, and (c) phosphates. Source: data derived from [12,13].
Infrastructures 03 00054 g005
Figure 6. The scatter plot showing the line of best fit and correlation coefficient (squared) of KIX 2002–2016 annual municipally supplied water consumption: (a) per passenger and (b) per aircraft movement. Source: Data derived from References [10,11,12,13].
Infrastructures 03 00054 g006
Figure 7. The scatter plot showing the line of best fit and correlation coefficient (squared) of KIX 2002–2016 annual water ratios: (a) treated to supply, (b) reclaimed to treated, and (c) discharged to treated. Source: Data derived from References [12,13].
Infrastructures 03 00054 g007
Table 1. Japan’s national effluent standards: items related to the protection of the living environment.
ChemicalPermissible Limit
Potential Hydrogen (pH) (coastal areas)5.0–9.0
Potential Hydrogen (pH) (non-coastal areas)5.8–8.6
Biochemical Oxygen Demand (BOD)160 mg/L (Daily Average 120 mg/L)
Chemical Oxygen Demand (COD)160 mg/L (Daily Average 120 mg/L)
Suspended solids (SS)200 mg/L (Daily Average 150 mg/L)
N-hexane Extracts (mineral oil)5 mg/L
N-hexane Extracts (animal and vegetable fats)30 mg/L
Phenols5 mg/L
Copper3 mg/L
Zinc2 mg/L
Dissolved iron10 mg/L
Dissolved manganese10 mg/L
Chromium2 mg/L
Coliform groupsDaily Average 3000/cm3
Nitrogen120 mg/L (Daily Average 60 mg/L)
Phosphorus16 mg/L (Daily Average 8 mg/L)
Notes: 1. The permissible limit by ‘daily average’ is provided for the average contaminated status of effluent per day. 2. The effluent standards listed in this table apply to the effluents of factories or commercial facilities which discharge 50 m3 or more of effluent per day on average. 3. The effluent standards for biochemical oxygen demand (BOD) exclusively apply to the effluents discharged into public waters other than seas and lakes, the effluent standards for chemical oxygen demand (COD) exclusively apply to the effluents discharged into seas and lakes. 4. The effluent standards for suspended solids (SS) does not apply to the effluents discharged into seas. Source: adapted from Reference [63].
Table 2. The correlation assessment of water parameters for various metrics, all testing at the 95% confidence level, with 12 degrees of freedom, using a one-tailed test, with tcrit = 1.77.
WaterMetricrtConclusionTrend
SupplyTotal−0.95−10.9RejectDecreasing
Per PAX−0.91−7.89RejectDecreasing
Per ATM−0.98−16.0RejectDecreasing
TreatedTotal−0.79−4.65RejectDecreasing
Ratio0.411.60AcceptConstant
ReclaimedTotal−0.19−0.68AcceptConstant
Ratio−0.774.34RejectIncreasing
DischargedTotal−0.92−8.46RejectDecreasing
Ratio−0.81−5.00RejectDecreasing
PollutantCOD0.421.69AcceptConstant
T-N0.939.49RejectIncreasing
T-P0.060.23AcceptConstant

