Article

Material Structural Deficiencies of Road Bridges in the U.S.

Cincinnati, OH 45231, USA
Infrastructures 2018, 3(1), 2; https://doi.org/10.3390/infrastructures3010002
Submission received: 30 November 2017 / Revised: 10 January 2018 / Accepted: 11 January 2018 / Published: 12 January 2018

Abstract

:
This study analyzes the National Bridge Inventory in the U.S. to determine the relative structural deficiencies of bridge materials, comparing between the overall national values and each state, geographically. The analysis considers the most common bridge construction materials—concrete, steel, and prestressed/post-tensioned concrete. The results suggest need to reassess the efficacy of best performance practices for steel bridges and for states with structural deficiencies above the national average. Geographic consistency of structurally deficient bridge density with population density shows need to improve intervention strategies for regions with higher levels of service usage. The study also compares the relative operational lifespan of bridge materials in each state. The average structurally deficient bridge ages are lower than the 75-year life-cycle expectancy. Prestressed/post-tensioned concrete bridges reveal relatively lower lifespan. Over time, concrete and steel bridges show some gradual improvement with decreasing percentage of structural deficiency and increasing lifespan. Prestressed/post-tensioned concrete bridges reveal shifting earlier accumulation of structural deficiency for a particular age group. The study also reveals relative climate effects. Climate conditions correlate differently with the structural deficiency and life cycle of bridge materials in each state. Structurally deficient bridge densities show correlation with climate maps, especially under colder and moist conditions.

Graphical Abstract

1. Introduction

The U.S. National Bridge Inventory (NBI) is compiled by the Federal Highway Administration (FHWA) as a unified database with information on road bridges from all states and territories [1,2]. A bridge is defined as having a span of more than 6.1 m (20 ft) [1]. Additionally, culverts may qualify to be considered bridge length and are included in the database. The recorded data items include technical and engineering categories. The structural status data include the evaluation of the deck, superstructure, and substructure of bridges for structural adequacy and safety. The evaluation is based on a rating scale from 9 (superior to present desirable criteria) down to 0 (bridge closed). A structural evaluation of 4 (meets minimum tolerable limits to be left in place as is) or lower qualifies a bridge as structurally deficient (SD) [3]. Structural deficiency is a diagnostic measure that results from separately rating the conditions of the structural components of a bridge [4,5,6,7,8]. The SD status of a bridge indicates the existence of one or more significant structural defect(s), often limiting its intended usage to ensure safety [6,8]. Overall, SD bridges impact the safety, mobility, and economy. Based on the NBI from 2016, there are 185 million daily crossings on nearly 56,000 SD bridges in the U.S. [9].
This study analyzes the NBI to determine the relative structural deficiencies of the most common bridge materials in each state, separately. The analysis includes the 50 states, Washington, D.C., and Puerto Rico. The NBI’s construction material categories of concrete, steel, and prestressed/post-tensioned concrete (PC) are most common in the U.S. The comprehensive study compares the structural deficiencies of the national network-level with the individual state-level subsets of the different bridge materials. Comparison of the average age ranges of bridges reflects the relative potential of operational lifespan. The study also explores the extent of the correlation between the geographic distribution of the relative state-level structural deficiencies of each material with climate conditions. The results can help identify potential issues and improve the relative dependability and sustainability of bridge materials.

2. Inventory Distribution

Table 1 summarizes the counts of bridges in the NBI with a rated structural status at the end of the year 2015 by state [2], along with their designated alphabetic and numeric state codes [10]. The table details the counts of predominant kind of construction materials for bridge main span(s) of concrete, steel, and PC, based on the NBI’s coded material categories. The sum of the counts of concrete, steel, and PC (C+S+P) bridges comprises 96.1% of all the bridges in the NBI. However, the percentages of each material and their sum in each state are different. Texas has the highest count with a total of 53,209 bridges, 29,237 concrete bridges, and 15,817 PC bridges. Ohio has the highest count of 11,844 steel bridges.
Figure 1 shows the overall percentage distribution of bridge counts in each state from the U.S. total. The map point on the top left shows the overall value for all of the U.S., followed by the maximum with the next highest and the minimum with the next lowest values. The next highest/lowest values provide a better outlook since some maxima/minima have extreme values. The value for Puerto Rico is shown on the bottom right as a map point, rather than a map shape, to discern relative color shades. The percentage concentration of all bridges is higher from Texas through the southern Midwest to the Mid-Atlantic, and California.

3. Structural Deficiency
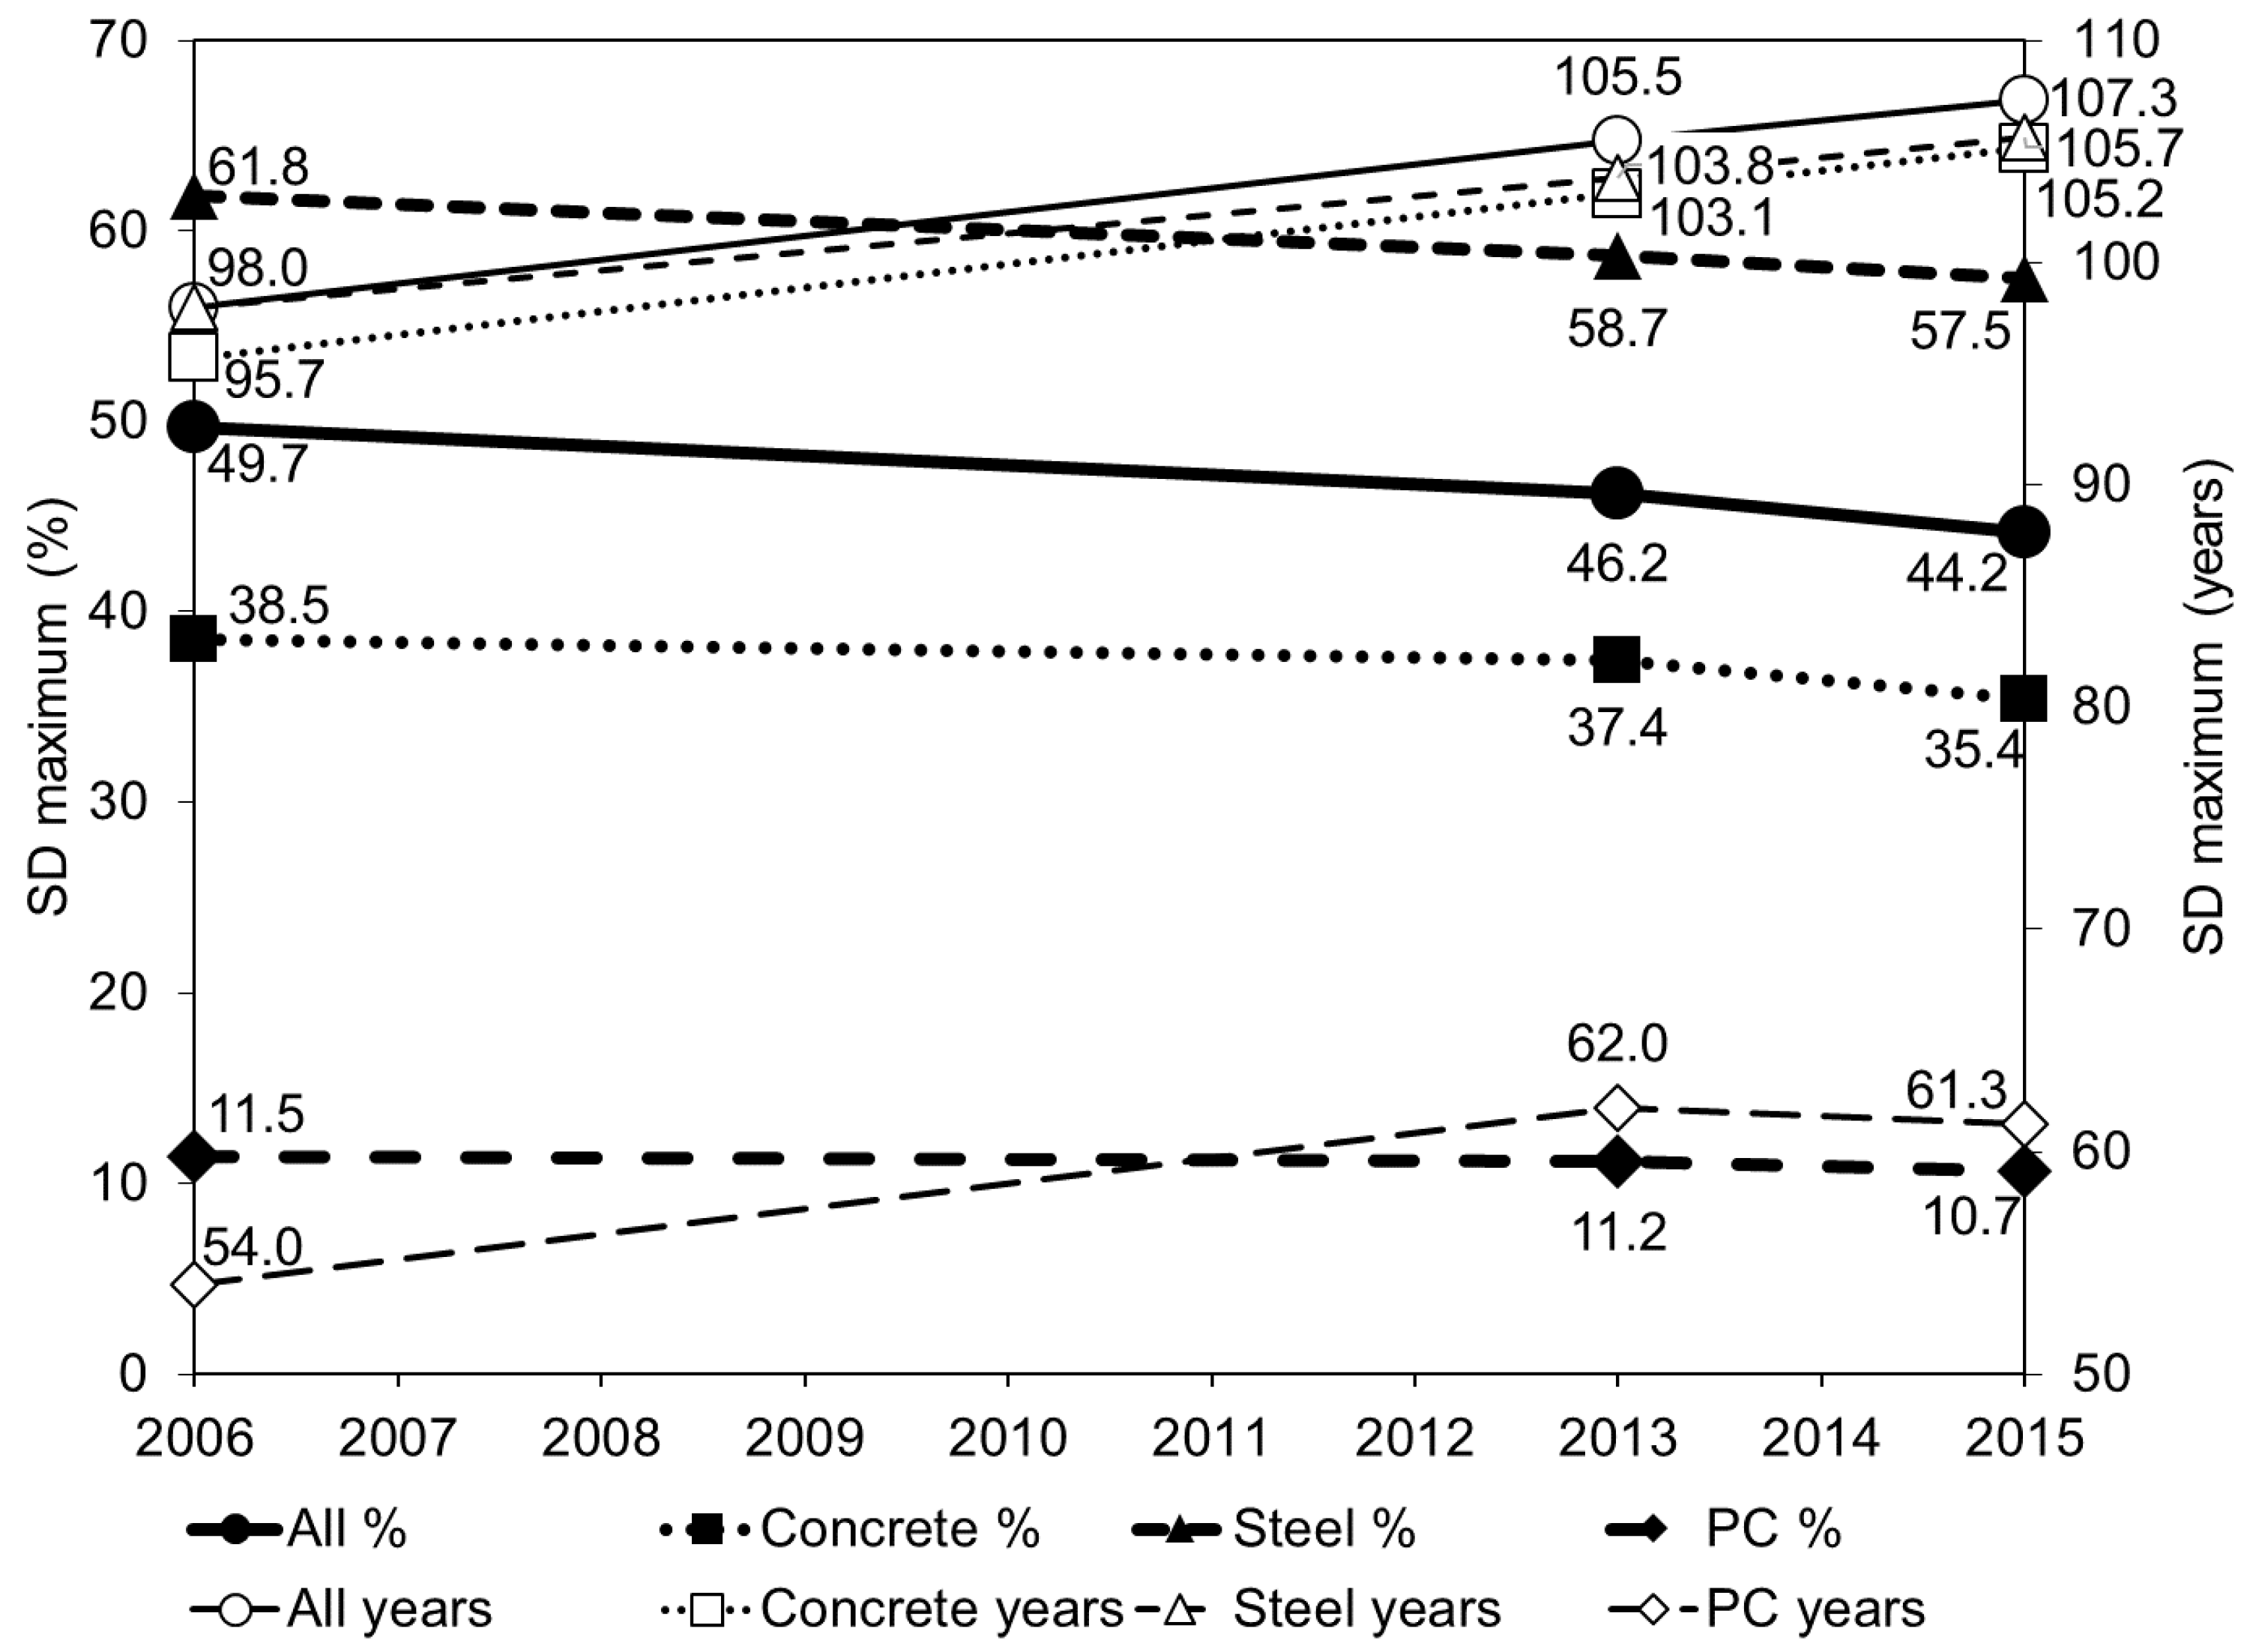
Table 2 summarizes the counts of SD bridges for concrete, steel, PC and the total of all bridge materials. Figure 2 shows the percentage distribution of SD bridge counts in each state from the U.S. total. Most of the SD bridges are around the southern Midwest towards the northern Mid-Atlantic, scattered in the Southeast, and California. The SD percentage ranges from 0.02% in DC and 0.06% in Nevada to 8.1% in Pennsylvania and 8.5% in Iowa.
Figure 3 shows the respective SD bridge count percentages for concrete, steel, PC and all the bridges within each state, comparing between states and the overall national value. SD concrete bridge percentages are higher from around the Midwest through the Mid-Atlantic to the Northeast and scattered in the Southeast with a national average of 6.1%. SD steel bridge percentages are higher scattered around the Midwest, Southeast, Mid-Atlantic, and Northeast with a relatively higher national average of 17.0%. SD PC bridge percentages are higher scattered in the North, East, Southeast, California, and Alaska with a relatively lower national average of 3.4%. The overall SD bridge percentages are higher from around the Midwest to the western Southeast and from the south Mid-Atlantic to the Northeast, ranging from 1.8% in Nevada and 1.9% in Texas to 21% in Pennsylvania and 23.2% in Rhode Island with a national average of 9.6%. These results suggest the need to reassess the relative efficacy of best performance practices for steel bridges and for states with structural deficiencies above the national average.
Figure 4 shows the density (count/108 m2 = count/100 km2) of SD bridge counts per the land area in each state (Table 2) [11]. SD concrete bridge density is higher around the southern Midwest and scattered in the Southeast, Mid-Atlantic, and Northeast with a national average of 0.17. SD steel bridge density is higher around the southern Midwest, northern Southeast, Mid-Atlantic, and southern Northeast with a national average of 0.33. SD PC bridge density is higher around the eastern Midwest, northern Mid-Atlantic, and southern Northeast with a national average of 0.06. The overall SD bridge density is higher from around the Midwest through the central Mid-Atlantic to the southern Northeast, ranging from 0.01 in Alaska and Nevada to 6.3 in DC and 6.6 in Rhode Island with a national average of 0.64 bridges per 108 m2. Overall, the SD bridge density of all bridges generally correlates with the population density map [12]. While concrete and steel bridges mostly match this correlation, PC bridges have some regional exceptions with lower SD density. The general geographic consistency of SD bridge density with population density suggests need to improve intervention strategies for regions with higher levels of service usage. Structural deficiency maps do not reveal any significant correlation with seismic hazard maps [13]. Regional comparisons show the relative awareness of local transportation agencies based on accumulated experiences.

4. Life Cycle

To observe relative service life-cycle dependability, Figure 5 summarizes side-by-side the average age ranges of all, structurally adequate (SA—not structurally deficient), and SD bridges for concrete, steel, PC, and all bridges in each state. States are arrayed in west-to-east strips (shown within horizontal braces) and sequenced north-to-south corresponding with their approximate geographic location. The national (US) average is set first for comparison. The overall position of the up-down bars and the ranges between the SD, all, and SA ages indicate relative potential of operational lifespan. The SA to SD age range reveals the average durability of SA bridges before they become SD. The centroid position of all age between SA and SD ages reveals the ratio of SA and SD bridges and how relatively older or newer they are. The west-to-east strips (within the horizontal braces) show a slight upward shift within each strip, showing that bridges are relatively older towards the east, more noticeably for concrete bridges. The average SD bridge ages are 69 for concrete, 67 for steel, 48 for PC, and 65 for all the bridges in the NBI. Overall, the average SD bridge ages are lower than the 75-year life-cycle expectancy before structural deficiency [14], showing need to improve service life-cycle. PC bridges reveal relatively lower operational lifespan with even younger SD bridges.

5. Distribution and Accumulation of Structural Deficiency

The distribution of the proportion of SD bridges relative to the respective total counts versus service life enables analysis of the deterioration [15]. Figure 6 shows the distribution of the SD percentages of concrete, steel, PC, and all bridges versus year built for the year 2015. The deterioration accumulates backwards as bridges age and wanes with decommissioning of older bridges. Intermittent interventions, lack of resources for periodic inspections, and inconsistent, inaccurate, and/or outdated status recording/reporting are analytically known reasons that create the annual uneven variances of structural deficiency. Thus, considering the context of time in applied statistics, a sixth-order polynomial trendline averages the distribution [16,17].
Observation of the backwards accumulation outlines the relative deterioration over time, considering the maximum percentage of structural deficiency versus the lifespan it is reached for the different materials. The maximum average accumulation of structural deficiency is 35.43% at 105.15 years for concrete, 57.51% at 105.65 years for steel, 10.69% at 61.26 years for PC, and 44.17% at 107.30 years for all bridges. Steel bridges accumulate more structural deficiency than concrete bridges at comparable years. PC bridges accumulate significantly less structural deficiency while the trendline is nearly comparable to all the bridges backwards to the late 1970s. This shows that PC bridges older than the late 1970s have better performance with less accumulation of structural deficiency.
Observation of the distributions in Figure 6 enables to detect relatively earlier accumulation of structural deficiency caused by groups of bridges built during certain periods before the maximum. These critical accumulations can be associated with particular practices and technologies of construction and intervention during these periods, helping identify the etiologies of earlier deterioration. The proportional distributions of structural deficiency of each material in individual states can show such higher relative accumulation of deterioration in different time periods.
To observe the changes in deterioration over time, Figure 7 summarizes the maximum average accumulation of structural deficiency in percentage (thick line, left axis) along with the time span it was reached (thin line, right axis) for concrete, steel, PC, and all bridges for the years 2006, 2013, and 2015 [15,18]. Overall, concrete and steel bridges show some improvement—the maximum SD percentage is gradually decreasing while the time span is gradually increasing. The time span of PC bridges slightly declined from 2013 to 2015.
Analysis of PC bridges for the years 2006 and 2013 identified earlier accumulation of structural deficiency for a particular age (year built) group around the 1950s [15,18]. In 2013, this accumulation slightly widened, confirming the slight decrease in the time span. Comparison with the proportional distribution of SD PC bridges reveals a minor improvement, confirming the slight increase in 2015, but also a slight shift of this accumulation from the 1950s to the early 1960s.

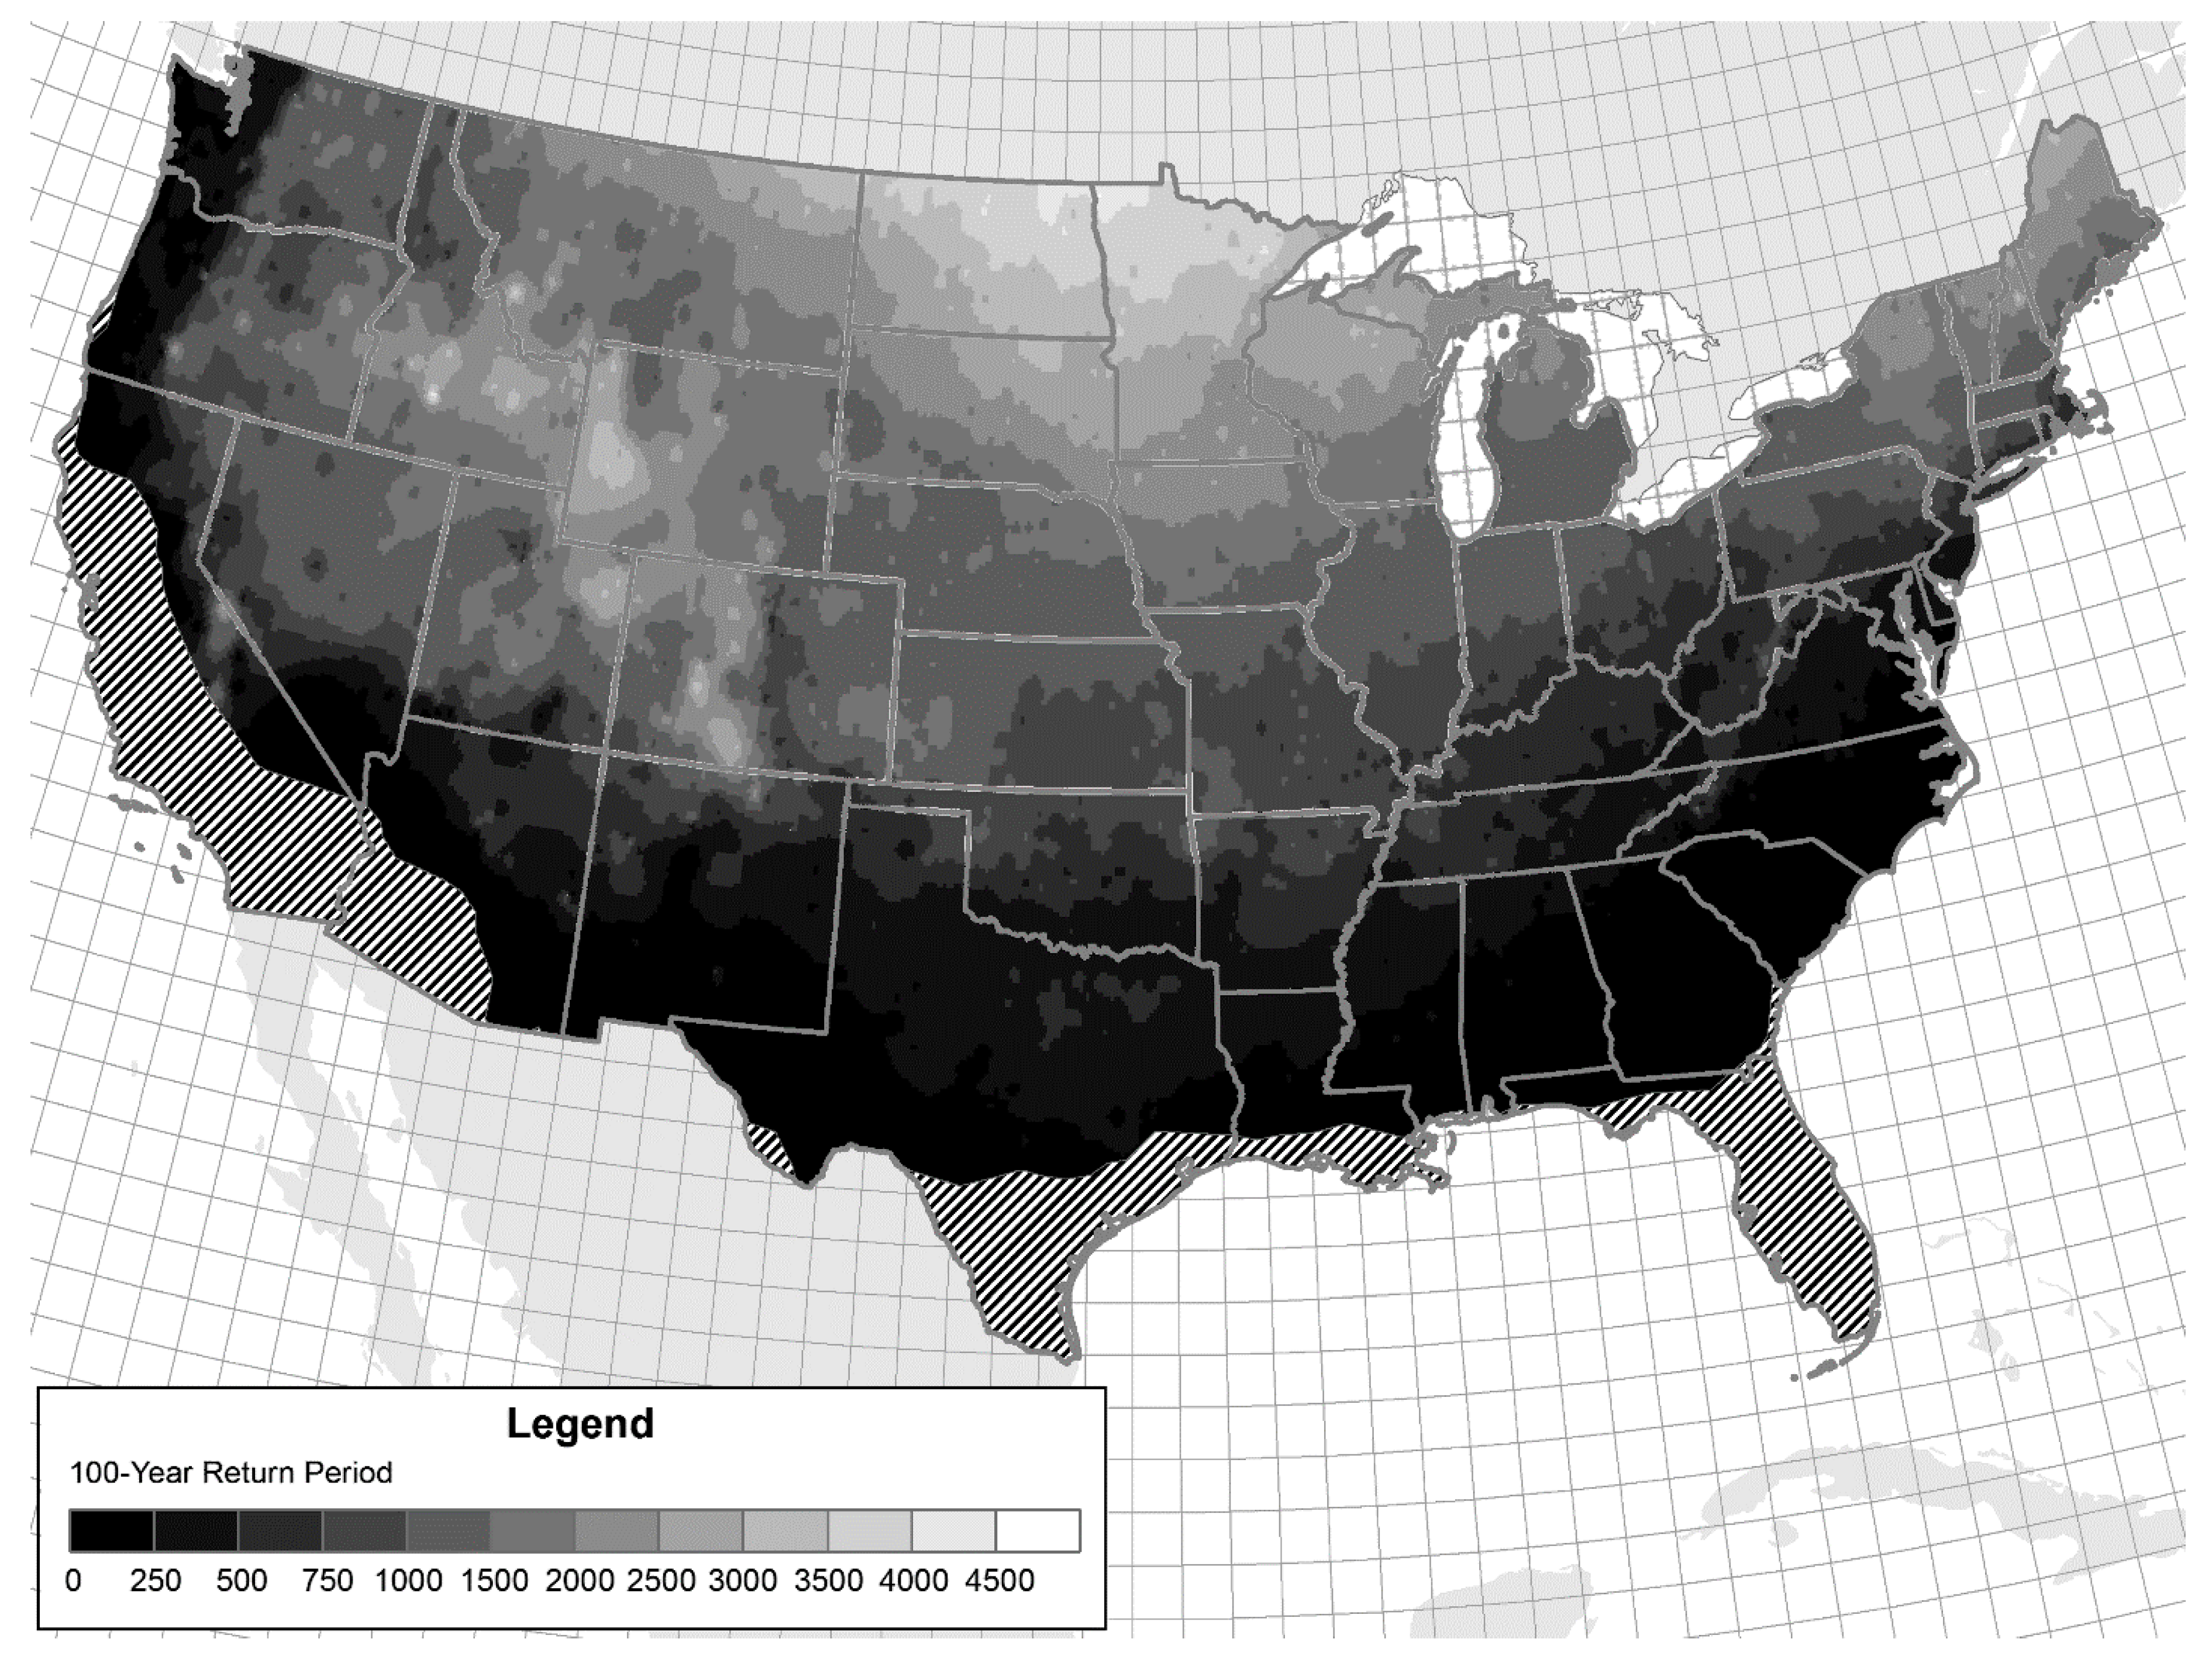
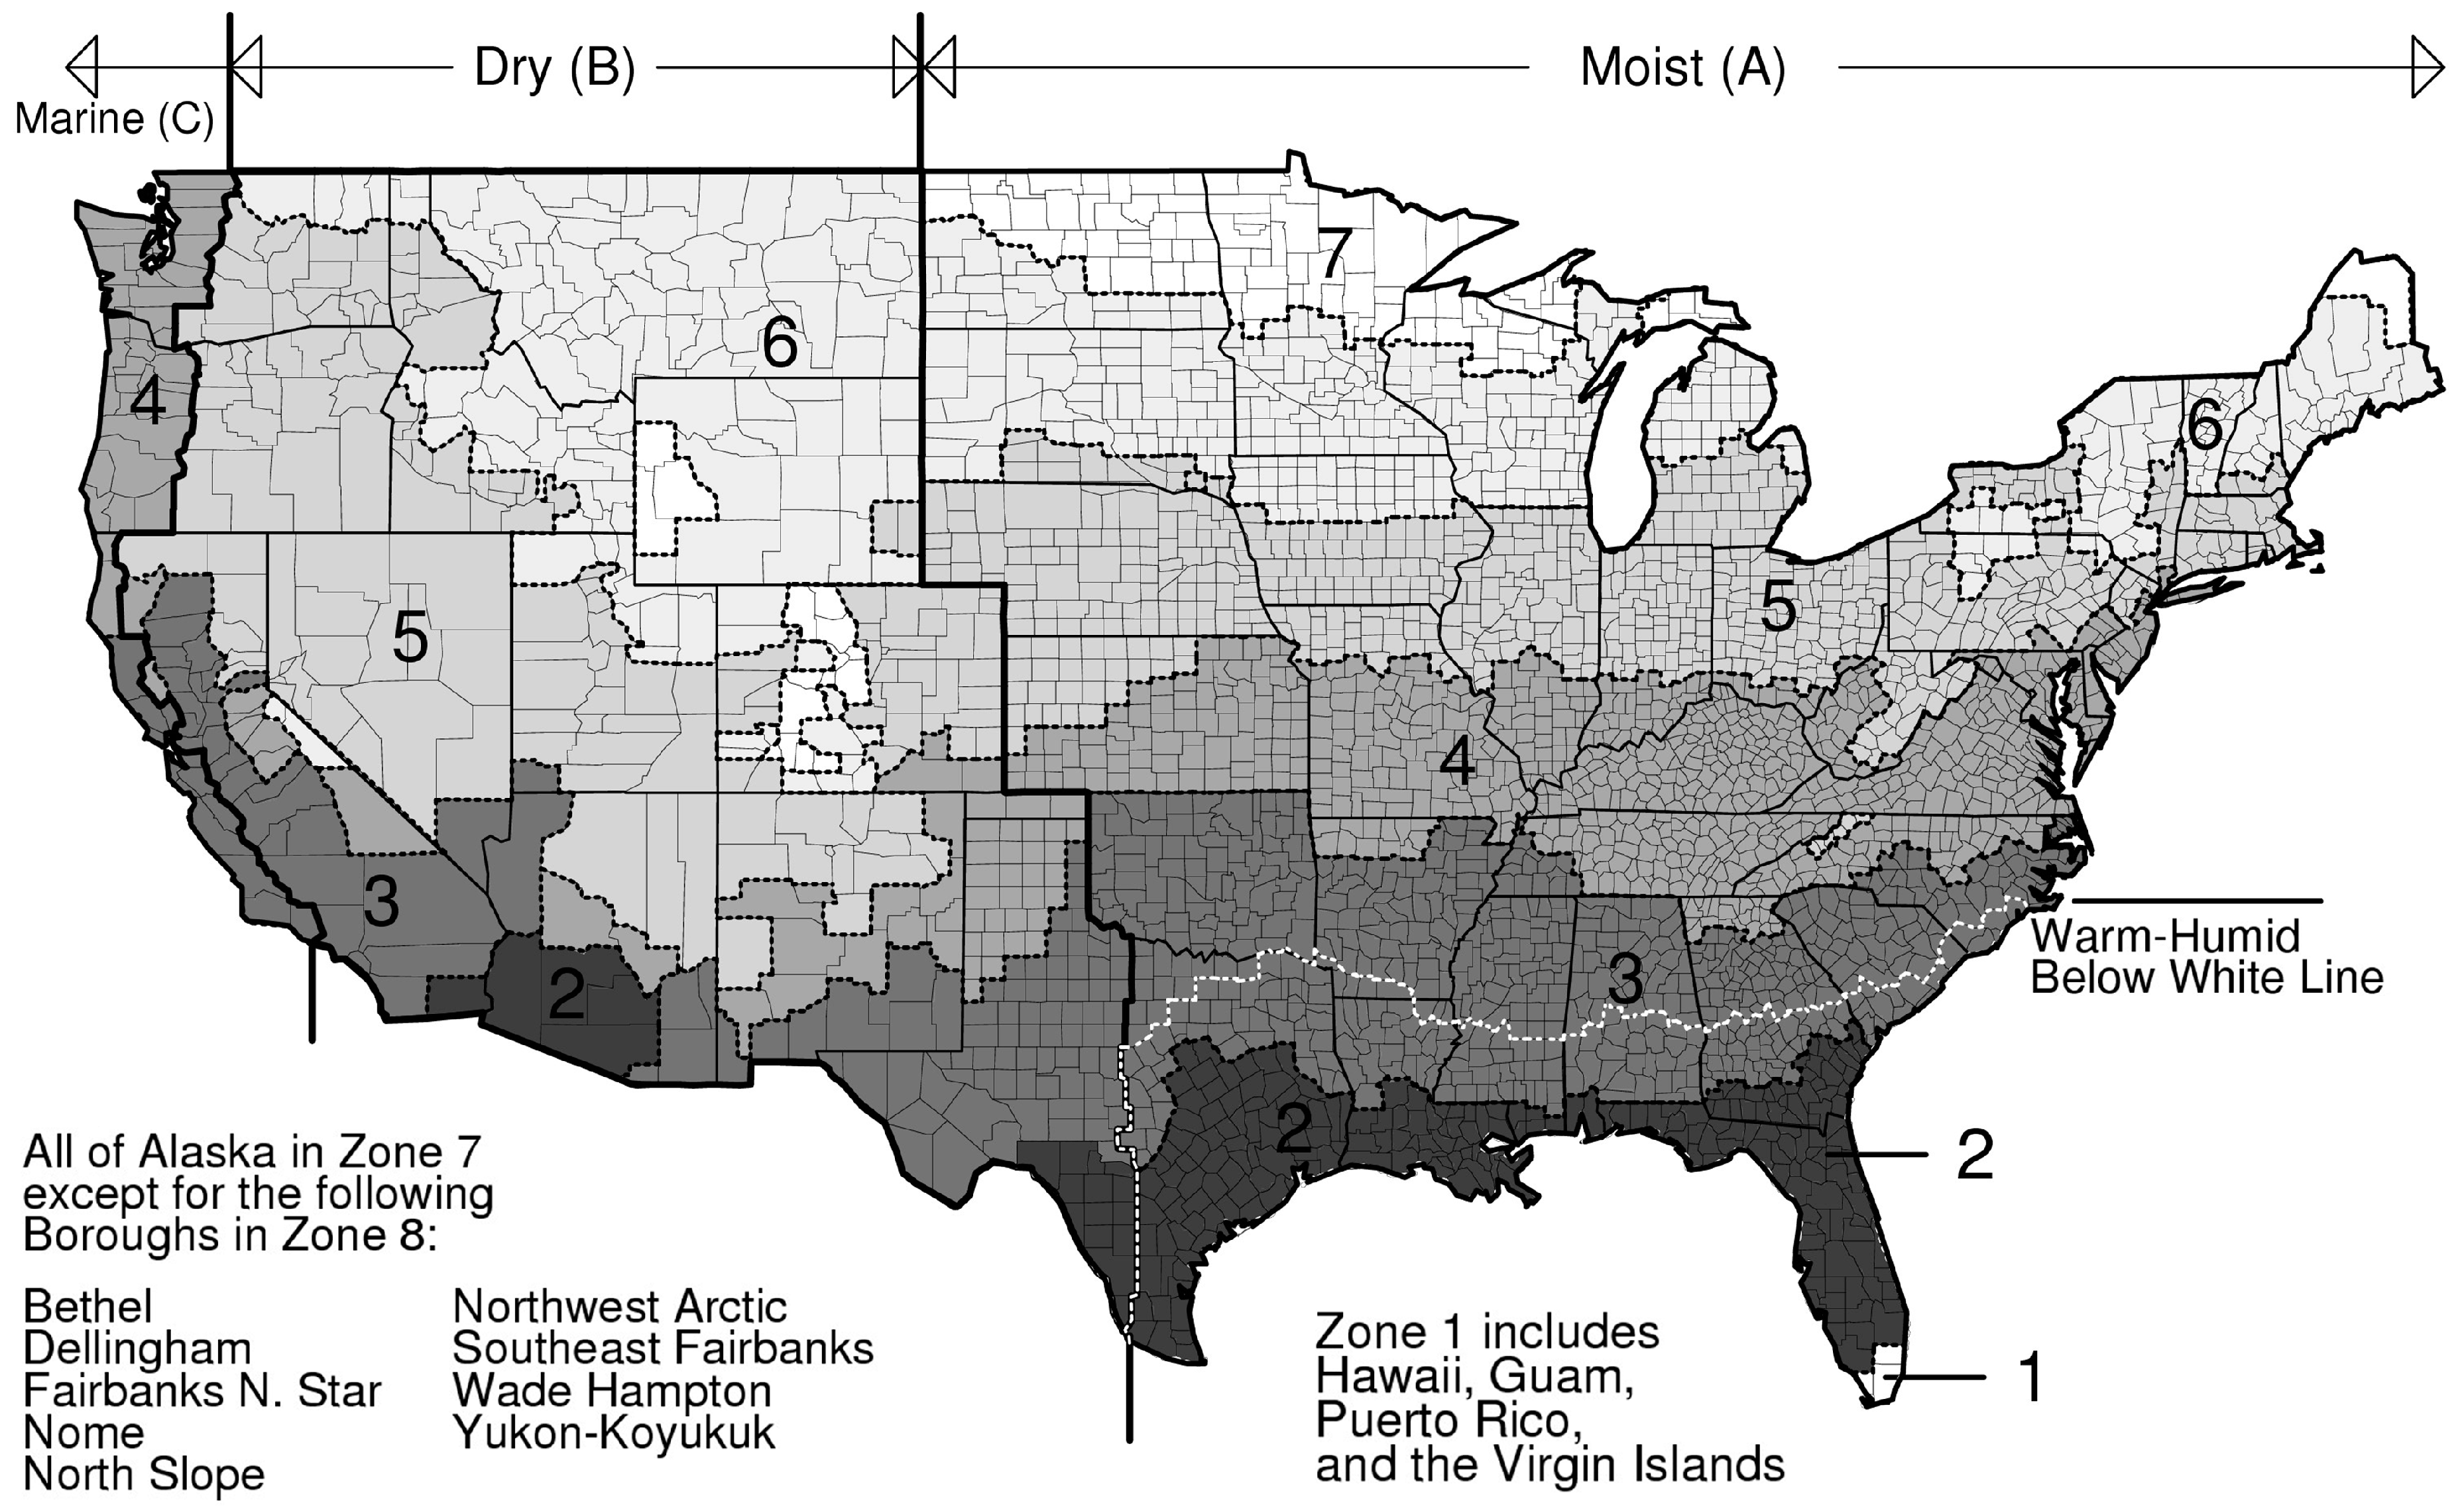
6. Climate Conditions

Climate effects and associated issues affect bridge materials during preparation, manufacturing, construction, and service exposure. Climate also impacts the behavior of the bridge components and their interactions as a system. Furthermore, climate variables require the use of road treatment and deicing chemicals that accelerate bridge material deterioration. Over time, climate conditions have accumulating consequences on the structural condition and life cycle of bridges. The progression, climate effects, and outcome of bridge deterioration are essentially different for the various kinds of materials. Based on perceived experiences with the regional climate, bridge officials devise local best practices attempting to overcome climate-related issues on the various materials. To enable the development of data-driven decision-making tools at the level of individual states, it is necessary to provide national- and state-level analysis of bridge behavior [19] correlating materials to climate.
Climatic and related factors designate typical map regions: Frost Belt (Northeastern and northcentral cold states), Salt Belt (Northeast and Midwest states with extensive chemical deicing in winter), Snowbelt (Northeast and northern Midwest states with lake-effect snow around the Great Lakes), and Sun Belt (Southern, hot-weather states). Map zones of the freezing severity of winter and frost depth consider the magnitude and duration of below freezing air temperature based on a 100-year return period (Figure 8) [20]. In comparison, climate zones map of the severity and frequency of extreme weather conditions consider distinct hygrothermal conditions (Figure 9) [21].
Maps of bridge material structural deficiency by state (Figure 3) correlate in certain regions with the different climate zone variations showing the potential effect of climate. SD concrete bridge percentages are higher scattered around the Salt Belt. SD steel bridge percentages are higher scattered around the East and North. SD PC bridge percentages are higher scattered around northern states.
Maps of SD bridge material density by state (Figure 4) also show some correlation with climate maps. SD concrete bridge density shows scattered correlation around the southern Salt Belt, and the Southeast. SD steel bridge density shows scattered correlation around the eastern and western Salt Belt. SD PC bridge density shows scattered correlation around the Snowbelt. Overall, SD bridge densities reveal correlation with climate effects, especially under colder and moist climate conditions.

7. Discussion

Mapping the structural deficiencies of the various bridge materials by geographic location enables comparative analysis helps identify relative issues, and leads to improvement of sustainability. The comprehensive study by states highlights the need for even further efforts to achieve county-level comparative analysis. Regional correlations of structural deficiencies, service life cycle (age ranges), higher service usage, and climate conditions further enable comparative funding priorities for improved bridge management.
The approach of the proportional distribution of structural deficiency detects critical deterioration instances of age groups within a material category relative to its own general trend of proportional distribution of structural deficiency. In addition, it enables comparison relative to other materials and the overall deterioration trend. These comparative analyses can be implemented on various subsets of local/regional, category, and diverse bridge inventories. The perspective helps focus on the relative need for improvement of the life-cycle dependability of bridge age groups within material categories. In addition, it supports efficient prioritizing of applicable intervention resources to improve the management of the deteriorating bridge groups.
The SD status of bridges in the NBI simply states the presence of the restricting structural defect(s), and thus it is dichotomous (yes or no). It does not indicate further details, measure, and/or percentage on the nature, location, level, and value of severity of the structural defect(s). Recording and reporting of a prioritized and weighted percentage of structural deficiency for each bridge will increase the level of efficacy in bridge management.
Novel and automated methods associated with nondestructive testing and structural health monitoring reflect the ongoing trends in bridge management [22]. Besides, new structural codes are implementing advanced performance evaluation methods to assess structural state of existing buildings. Likewise, reliability based methods have become more and more popular in this field [23,24]. Latest examples combine experimental and theoretical methods developing hybrid bridge condition assessment techniques [25]. Therefore, it is indispensable to adopt quantitative and objective methods into the forthcoming bridge deficiency assessment applications.

8. Conclusions

This comprehensive national- and state-level comparative study analyzes the NBI to determine the relative structural deficiencies of the most common bridge construction materials—concrete, steel, and PC. The geographic distribution of the relative state-level structural deficiencies of each material enables regional and climatic correlations.
The SD bridge count percentage is 6.1% for concrete, 3.4% for PC, 17% for steel, and 9.6% for all the bridges in the NBI. SD bridge percentage maps show materials and states with structural deficiencies higher than the national average. SD density maps show that some states have structural deficiencies substantially above the national average, requiring intervention for improvement of their status. The corresponding cross-correlation between SD bridge density and population density requires to reassess intervention strategies for regions with higher usage levels, to improve satisfactory operational performance.
Comparing age ranges of bridge materials indicates the relative potential of operational lifespan. The average SD bridge ages are 69 for concrete, 67 for steel, 48 for PC, and 65 for all the bridges in the NBI. These are lower than the 75-year life-cycle expectancy. The geographic distribution of materials and states with lower SD bridge ages shows the particular need for improvement of their operational lifespan before structural deficiency.
The distribution of structural deficiency versus service life shows higher relative accumulation of deterioration for steel bridges, requiring to reassess the efficacy of practices to improve their status. From 2006 to 2015, the deterioration rate of concrete and steel bridges show some improvement. PC bridges improved less, while their life cycle also declined from 2013 to 2015. The earlier accumulation of deterioration of PC bridge age subsets shifting from the 1950s to the 1960s requires observation of performance to examine intervention options for relative improvement.
Climate conditions show different effects on the various bridge materials. The state distributions of bridge structural deficiencies of the individual materials reveal correlation with climate effects and associated issues, especially under colder and moist climate conditions. This enables identifying regions and materials with critical issues to improve their structural condition.

Acknowledgments

The support of Frank van Cappelle of Statsilk in providing data visualization software is sincerely appreciated. The support of Rocky Bilotta, Affiliate of the National Oceanic and Atmospheric Administration (NOAA), National Centers for Environmental Information (NCEI), Center for Weather and Climate (CWC), in providing climate map and data is sincerely appreciated. The help of Theresa Muick, Production Coordinator, International Code Council, Inc., in providing the climate zones map is sincerely appreciated.

Conflicts of Interest

The author declares no conflict of interest.

References

  1. Recording and Coding Guide for the Structure Inventory and Appraisal of the Nation’s Bridges; Rep. No. FHWA-PD-96-001; Federal Highway Administration: Washington, DC, USA, 1995.
  2. National Bridge Inventory; Federal Highway Administration: Washington, DC, USA, 2016.
  3. Bridging the Gap: Restoring and Rebuilding the Nation’s Bridges; American Association of State Highway and Transportation Officials: Washington, DC, USA, 2008.
  4. Manual for Condition Evaluation of Bridges, 2nd ed.; American Association of State Highway and Transportation Officials: Washington, DC, USA, 1994.
  5. Guide Manual for Condition Evaluation and Load and Resistance Factor Rating (LRFR) of Highway Bridges; American Association of State Highway and Transportation Officials: Washington, DC, USA, 2003.
  6. Meeting the Needs of America’s Bridges; The Voice of Transportation, Publication Code: MNAB-1; American Association of State Highway and Transportation Officials: Washington, DC, USA, 2007.
  7. Our Nation’s Highways—2000; Rep. No. FHWA-PL-01-1012; Office of Highway Policy Information (OHPI); Federal Highway Administration: Washington, DC, USA, 2000.
  8. Status of the Nation’s Highways, Bridges, and Transit: 2002 Conditions and Performance Report; Federal Highway Administration: Washington, DC, USA, 2003. Available online: www.fhwa.dot.gov/bridge/nbi.htm (accessed on 26 March 2017).
  9. 2017 Bridge Report; American Road & Transportation Builders Association: Washington, DC, USA, 2017; Available online: www.artba.org/deficient-bridge-report-home/ (accessed on 26 March 2017).
  10. States and Outlying Areas of the United States (FIPS PUB 5-1); Federal Information Processing Standard; U.S. Government Printing Office: Washington, DC, USA, 1970.
  11. State Area Measurements; Geography, Reference; United States Census Bureau, U.S. Department of Commerce: Washington, DC, USA, 2010. Available online: www.census.gov/geo/reference/state-area.html (accessed on 4 January 2017).
  12. 2010 Census Results—United States and Puerto Rico; Geography, Maps & Data, Thematic Maps, Population Density by County; United States Census Bureau, U.S. Department of Commerce: Washington, DC, USA, 2010. Available online: www2.census.gov/geo/pdfs/maps-data/maps/thematic/us_popdensity_2010map.pdf (accessed on 4 January 2017).
  13. Petersen, M.D.; Moschetti, M.P.; Powers, P.M.; Mueller, C.S.; Haller, K.M.; Frankel, A.D.; Zeng, Y.; Rezaeian, S.; Harmsen, S.C.; Boyd, O.S.; et al. Documentation for the 2014 Update of the United States National Seismic Hazard Maps; Open-File Report 2014–1091; U.S. Geological Survey: Reston, VA, USA, 2014; 243p. Available online: pubs.usgs.gov/of/2014/1091/pdf/ofr2014-1091.pdf (accessed on 27 January 2017).
  14. LRFD Bridge Design Specifications, 7th ed.; American Association of State Highway and Transportation Officials: Washington, DC, USA, 2014.
  15. Farhey, D.N. Operational structural performances of bridge materials by deterioration trends. J. Perform. Constr. Facil. 2014, 28, 168–177. [Google Scholar] [CrossRef]
  16. Levine, D.M.; Ramsey, P.P.; Smidt, R.K. Applied Statistics for Engineers and Scientists; Pearson Higher Education: Upper Saddle River, NJ, USA, 2001; ISBN 9780134888019. [Google Scholar]
  17. Sweet, S.A.; Grace-Martin, K.A. Data Analysis with SPSS: A First Course in Applied Statistics, 4th ed.; Pearson Higher Education: Upper Saddle River, NJ, USA, 2012; ISBN 9780205019670. [Google Scholar]
  18. Farhey, D.N. Structural performances of bridge materials in the U.S. National Bridge Inventory 2013. Struct. Eng. Int. 2017, 27, 101–113. [Google Scholar] [CrossRef]
  19. Long-Term Bridge Performance Committee Letter Report: February 23, 2016; Long-Term Bridge Performance (LTBP) Committee, Policy Committees, Studies and Special Programs Division, Transportation Research Board, National Academies of Sciences, Engineering, and Medicine; The National Academies Press: Washington, DC, USA, 2016.
  20. Bilotta, R.; Bell, J.E.; Shepherd, E.; Arguez, A. Calculation and evaluation of an air-freezing index for the 1981–2010 climate normals period in the coterminous United States. J. Appl. Meteorol. Climatol. 2015, 54, 69–76. [Google Scholar] [CrossRef]
  21. International Energy Conservation Code (IECC); International Code Council, Inc.: Country Club Hills, IL, USA, 2015; ISBN 978-1-60983-486-9. Available online: codes.iccsafe.org/app/book/toc/2015/I-Codes/2015%20IECC%20HTML/index.html (accessed on 27 January 2017).
  22. Farhey, D.N. Bridge instrumentation and monitoring for structural diagnostics. Struct. Health Monit. 2005, 4, 301–318. [Google Scholar] [CrossRef]
  23. Wang, N.; O’Malley, C.; Ellingwood, B.R.; Zureick, A.H. Bridge rating using system reliability assessment. I: Assessment and verification by load testing. J. Bridge Eng. 2011, 16, 854–862. [Google Scholar] [CrossRef]
  24. Wang, N.; Ellingwood, B.R.; Zureick, A.H. Bridge rating using system reliability assessment. II: Improvements to bridge rating practices. J. Bridge Eng. 2011, 16, 863–871. [Google Scholar] [CrossRef]
  25. Ozer, E.; Soyoz, S. Vibration-based damage detection and seismic performance assessment of bridges. Earthq. Spectra 2015, 31, 137–157. [Google Scholar] [CrossRef]
Figure 1. Percentage distribution of state bridge counts from U.S. total.
Infrastructures 03 00002 g001
Figure 2. Percentage distribution of state structurally deficient bridge counts from U.S. total.
Infrastructures 03 00002 g002
Figure 3. Structurally deficient bridge count percentage from state total.
Infrastructures 03 00002 g003
Figure 4. Density (count/108 m2) of structurally deficient bridges by state.
Infrastructures 03 00002 g004
Figure 5. Average age ranges of bridges by state.
Infrastructures 03 00002 g005aInfrastructures 03 00002 g005b
Figure 6. Distribution of the proportion of structurally deficient bridges.
Infrastructures 03 00002 g006
Figure 7. Maximum average accumulation of structural deficiency.
Infrastructures 03 00002 g007
Figure 8. Freezing severity of winter and frost depth [20]. (Excerpt reprinted with permission).
Infrastructures 03 00002 g008
Figure 9. Severity and frequency of extreme weather conditions [21]. (Climate Zone Map, excerpted from the 2015 International Energy Conservation Code; Copyright © 2014 International Code Council, Inc., www.iccsafe.org. All rights reserved. Excerpt reprinted with permission).
Infrastructures 03 00002 g009
Table 1. Bridge Materials by State.
State#STBridge CountsConcrete Bridge CountsSteel Bridge CountsPC Bridge CountsC+S+P Bridge Counts
Alabama01AL16,09510,6142922170515,241
Alaska02AK1493317604161207
Arizona04AZ8056541682917688013
Arkansas05AR12,8537435490418912,528
California06CA25,31815,85127875938 24,576
Colorado08CO8,6242693297725108180
Connecticut09CT4225101522528604127
Delaware10DE875229403179811
DC11DC2546616324253
Florida12FL12,19843341374601411,722
Georgia13GA14,79083203856243714,613
Hawaii15HI11426781113181107
Idaho16ID4369124884817463842
Illinois17IL26,6748668712710,74126,536
Indiana18IN19,14555735172732818,073
Iowa19IA24,24293168108475122,175
Kansas20KS25,04714,9097790132024,019
Kentucky21KY14,26157242586575914,069
Louisiana22LA13,01281481711166511,524
Maine23ME243174714031792329
Maryland24MD5313142631974245047
Massachusetts25MA5166850299010974937
Michigan26MI11,08617054592409210,389
Minnesota27MN13,29964032380320211,985
Mississippi28MS17,05798021691469516,188
Missouri29MO24,398834711,288458124,216
Montana30MT5243552129021513993
Nebraska31NE15,34154027390153614,328
Nevada32NV191911782504771905
New Hampshire33NH247071014051802295
New Jersey34NJ66861219357815416338
New Mexico35NM3960210959310533755
New York36NY17,457333510,552285916,746
North Carolina37NC18,12437308450513017,310
North Dakota38ND44011452121812813951
Ohio39OH27,100710411,844783526,783
Oklahoma40OK23,04999748104448422,562
Oregon41OR80372273113239747379
Pennsylvania42PA22,78367057031841322,149
Rhode Island44RI766186392154732
South Carolina45SC93445485132024429247
South Dakota46SD58662877156911465592
Tennessee47TN20,10612,1462558522719,931
Texas48TX53,20929,237729715,81752,351
Utah49UT301997985410782911
Vermont50VT274979316971622652
Virginia51VA13,88451867071150413,761
Washington53WA81573121108434277632
West Virginia54WV72151427336622877080
Wisconsin55WI14,13459243538405013,512
Wyoming56WY3085128414092462939
Puerto Rico72PR230610293479252301
United States US611,833254,965179,560153,317587,842
Table 2. Structural Deficiency of Bridge Materials by State.
StateSD Concrete Bridge CountsSD Steel Bridge CountsSD PC Bridge CountsSD Bridge CountsLand Area
(106 m2 = km2)
Alabama418610191353131,171
Alaska381191481,477,953
Arizona1019538246294,207
Arkansas1805183845134,771
California10914753142009403,466
Colorado8930658521268,431
Connecticut772343535712,542
Delaware2383485047
DC46010158
Florida1006934251138,887
Georgia18945929729148,959
Hawaii47656016,635
Idaho6113889385214,045
Illinois70310944212244143,793
Indiana566673416171792,789
Iowa91528882735025144,669
Kansas6691240332303211,754
Kentucky3945592031183102,269
Louisiana696232791838111,898
Maine99243336179,883
Maryland811691730625,142
Massachusetts523453346120,202
Michigan1927882281299146,435
Minnesota16335376810206,232
Mississippi767581272184121,531
Missouri7472387413222178,040
Montana1822044411376,962
Nebraska1541622262474198,974
Nevada1317235284,332
New Hampshire60187531223,187
New Jersey903785059619,047
New Mexico787840267314,161
New York23115581331990122,057
North Carolina17714182012085125,920
North Dakota6540647692178,711
Ohio46411891671893105,829
Oklahoma105821861333776177,660
Oregon10511396417248,608
Pennsylvania161819349814783115,883
Rhode Island37101251782678
South Carolina585238109100477,857
South Dakota316611961156196,350
Tennessee4194311101026106,798
Texas242510321008676,587
Utah27341795212,818
Vermont32134019023,871
Virginia215808271063102,279
Washington1659756385172,119
West Virginia338606119109262,259
Wisconsin3546781781282140,268
Wyoming9122527370251,470
Puerto Rico132102602968868
United States15,49030,468527758,7919,156,461

