Article

Static Loading Tests and Finite Element Analysis of Phosphogypsum Steel Truss Concrete Slabs

School of Civil Engineering, Jilin Jianzhu University, Changchun 130118, China
*
Author to whom correspondence should be addressed.
Infrastructures 2025, 10(9), 250; https://doi.org/10.3390/infrastructures10090250
Submission received: 8 August 2025 / Revised: 13 September 2025 / Accepted: 15 September 2025 / Published: 19 September 2025

Abstract

This study investigates the utilization of phosphogypsum (PG), an industrial byproduct, as a sustainable additive in reinforced truss concrete slabs to promote eco-friendly construction practices. Through static loading tests (monotonic/cyclic) under mixed boundary conditions (simply supported fixed), four slabs—including 2% PG-modified and ordinary concrete—were evaluated for mechanical performance, stress strain response, deflection, and crack propagation. The results demonstrated that PG enhanced slabs achieved comparable strength to conventional counterparts while exhibiting superior structural integrity at failure, highlighting PG’s potential to reduce environmental waste without compromising performance. Finite element analysis (ABAQUS2023) closely aligned with experimental data (<5% error), validating the model’s reliability in predicting failure modes. The study underscores PG’s viability as a circular economy solution for green building materials, offering dual benefits of waste valorization and resource efficiency. These findings advance sustainable construction by providing actionable insights for integrating industrial byproducts into high-performance structural systems, aligning with global decarbonization goals.

1. Introduction

Phosphogypsum (PG), a byproduct of phosphoric acid production, is predominantly composed of dihydrate calcium sulfate (CaSO4·2H2O), representing more than 80% of its mass fraction [1,2,3,4]. The annual worldwide output of PG approaches 300 million metric tons, with historical stockpiles surpassing 5.6 billion tons due to limited recycling [5,6,7]. Although PG contains reusable components, its high concentrations of phosphates, fluorides, and organic pollutants hinder large-scale recycling [8]. Current disposal methods include landfilling (58%), marine discharge (28%), and partial reuse (14%), with only 15% being effectively repurposed [9,10]. The extensive stockpiling of PG not only consumes valuable land but also contributes to groundwater contamination, soil degradation, and air pollution [5]. Marine disposal further exacerbates ecological risks, including eutrophication and toxic bioaccumulation in aquatic organisms [11]. Given its persistent accumulation and low reuse efficiency, PG remains a critical environmental concern [12,13,14].
Incorporating pretreated PG as a partial cement substitute in concrete offers a dual benefit: reducing cement demand while mitigating PG stockpile issues [15,16,17,18]. This strategy supports sustainable construction practices by transforming industrial waste into functional building materials, aligning with low-carbon development goals [19,20]. Recent studies on PG utilization have primarily explored its role in construction materials. Wei et al. [21] examined vegetation concrete properties by varying the PG content and porosity, noting an inverse strength–porosity relationship and reduced total porosity with higher PG incorporation. Kuang et al. [22] developed a cement slag PG ternary foam concrete system, achieving lightweight subgrade materials through mix optimization. Internationally, Calderón-Morales et al. [23] demonstrated that calcined PG (≤50% content) enhances concrete performance, while Kovalev et al. [24] pioneered direct PG applications in asphalt pavements.
In the research on steel–concrete composite slabs, significant progress has been made in understanding their mechanical behavior, which primarily depends on the shear connection mechanism and composite action. Yurii et al. [25] conducted tests on a 6 m span composite slab, demonstrating its excellent integrity and crack resistance, thereby laying a foundation for subsequent studies on shear connectors. Building on this work, De et al. [26] developed thin-walled channel (TWC) shear connectors, which exhibited superior bending performance in experiments and effectively addressed the issue of collaborative load-bearing between cold-formed thin-walled steel trusses and precast concrete. Further advancing this field, Gholamhoseini [27,28] conducted full-scale tests, revealing the notable influence of shrinkage deformation on the long-term performance of continuous composite slabs, providing critical insights for research on stainless steel composite slabs. The study by I. Arrayago [29] further confirmed that stainless steel composite slabs outperform traditional galvanized steel sheets in longitudinal shear strength, offering a promising alternative for engineering applications. To gain a deeper mechanistic understanding, Francavilla et al. [30] performed parametric analyses and concluded that the geometric characteristics of embossed steel plates play a decisive role in shear bond strength, a finding that provided theoretical support for subsequent research. Ultimately, the experiments by Uy, Brian et al. [31] demonstrated that both solid and hollow precast concrete slab–steel beam composite structures can achieve reliable composite action under various shear connection configurations, completing the cycle from theoretical innovation to practical application.
Despite extensive research on both PG utilization and composite structures, significant knowledge gaps remain. Firstly, the vast majority of PG studies have focused on non-structural applications such as subgrade materials or supplementary cementitious materials [32], while its use as an aggregate or functional additive in structural concrete elements—particularly composite slabs has been largely unexplored [33]. Secondly, existing research on composite slabs has primarily investigated connector types, long-term performance, and design parameters using conventional concrete materials. Crucially, the influence of incorporating industrial waste like PG on the interfacial shear behavior, long-term bonding reliability, and overall structural mechanics of composite systems has not been systematically studied [34].
To address these research gaps, this study pioneers the innovative incorporation of 2% pretreated PG into the structural concrete of steel truss concrete composite slabs. Through a comprehensive experimental program involving static and cyclic load tests, complemented by detailed ABAQUS2023 finite element simulations, we rigorously evaluate the mechanical properties, shear connection mechanisms, and evolutionary behavior of PG-enhanced composite slabs under long-term conditions. The findings aim to provide theoretical foundations and empirical data for the safe and efficient utilization of PG in structural components, thereby promoting the practical engineering application of PG-enhanced composite slabs. This research contributes to advancing sustainable construction practices while simultaneously addressing the critical environmental challenge of PG waste accumulation.

2. Experimental Overview

2.1. Material Properties and Specimen Design

During specimen casting, test blocks were prepared simultaneously for each phosphogypsum content ratio, with dimensions of 150 mm × 150 mm × 150 mm and 150 mm × 150 mm × 300 mm, using identical mix proportions. These blocks underwent the same curing conditions as the specimens, and their mechanical properties—including compressive strength, splitting tensile strength, axial compressive strength, elastic modulus, and Poisson’s ratio—were measured.
The experimental results indicated that the reference concrete (0% phosphogypsum), designed as C35 (Table 1), achieved an actual strength grade of C40. Consequently, subsequent discussions are based on the C40 grade. Compared to the reference, the 2% phosphogypsum mix showed comparable cube compressive and splitting tensile strengths, with only minor reductions (4.3% and 3.1%, respectively). Notably, its compressive strength reached 40.38 MPa, confirming compliance with the C40 standard.
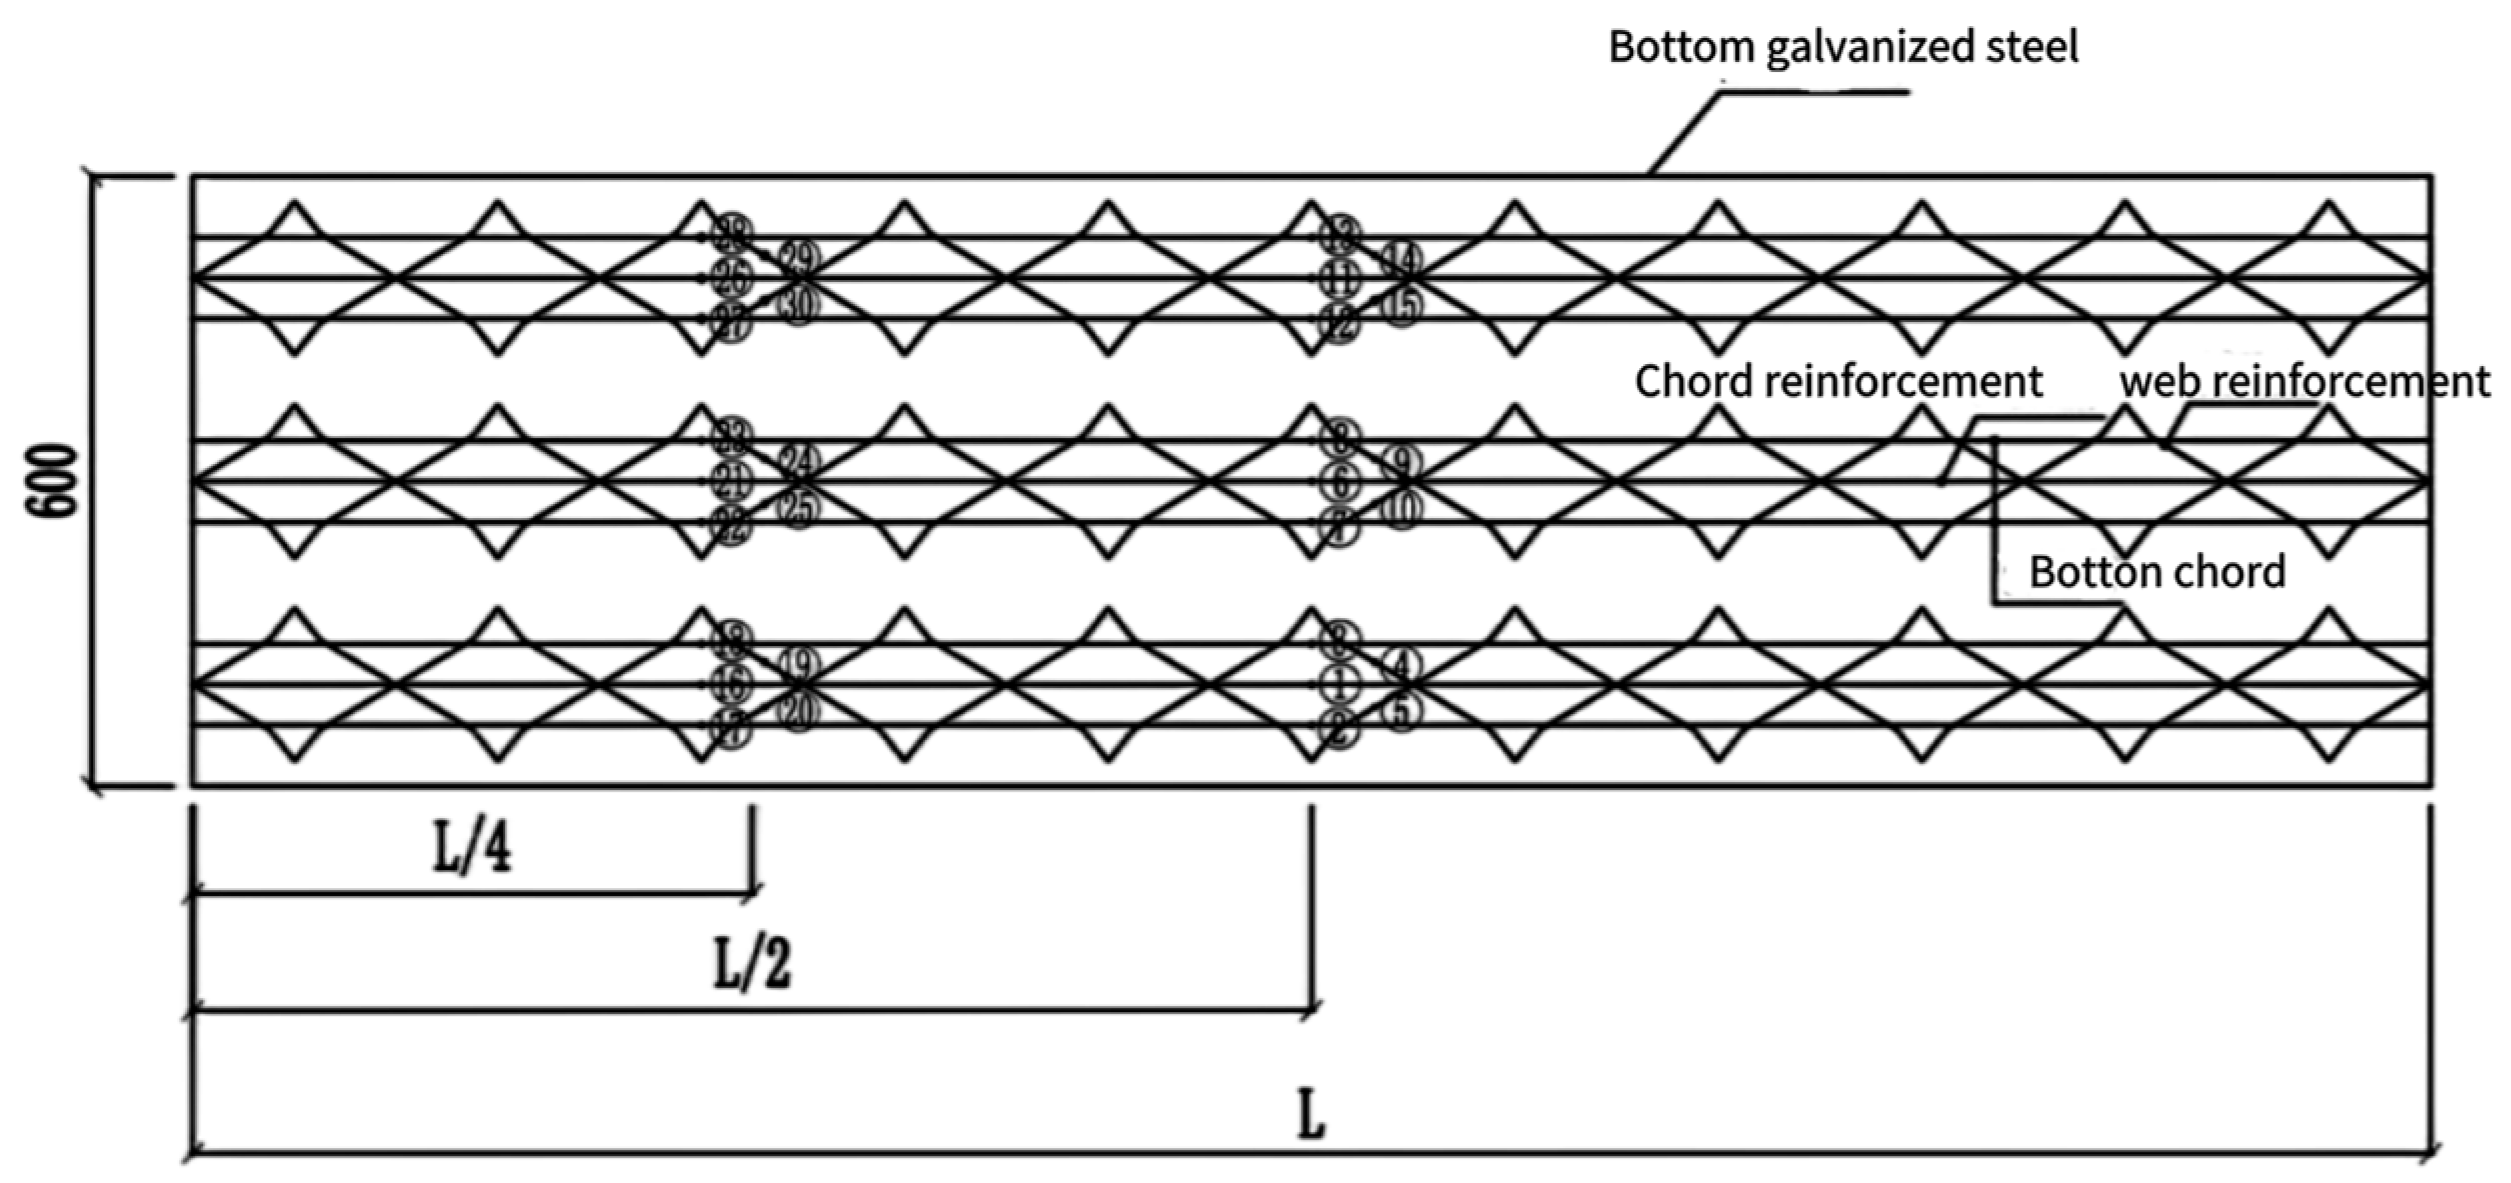
The top chord, bottom chord, and support reinforcement were made of Grade III hot-rolled ribbed steel bars (HRB400) with a diameter of 10 mm. The web reinforcement consisted of cold-rolled plain steel bars (CPB550) with a tensile strength exceeding 550 MPa and a diameter of 5 mm. The bottom steel plates were made of Q235 cold-rolled steel sheets, with a zinc coating of not less than 120 g/m2 on the surface, and the plates had a width of 600 mm and a thickness of 0.5 mm. The design parameters of the slabs are provided in Table 1, with each slab measuring 2200 mm × 600 mm × 120 mm. The cross-sectional dimensions and reinforcement configurations are illustrated in Figure 1.

2.2. Test Program and What to Measure

Based on the content and objectives of this experiment, the main measurements included the strain of the top chord reinforcement, bottom chord reinforcement, and web reinforcement; concrete strain; strain of the bottom galvanized steel plate; mid-span deflection under controlled loading; variation in load deflection curves; and development of cracks.
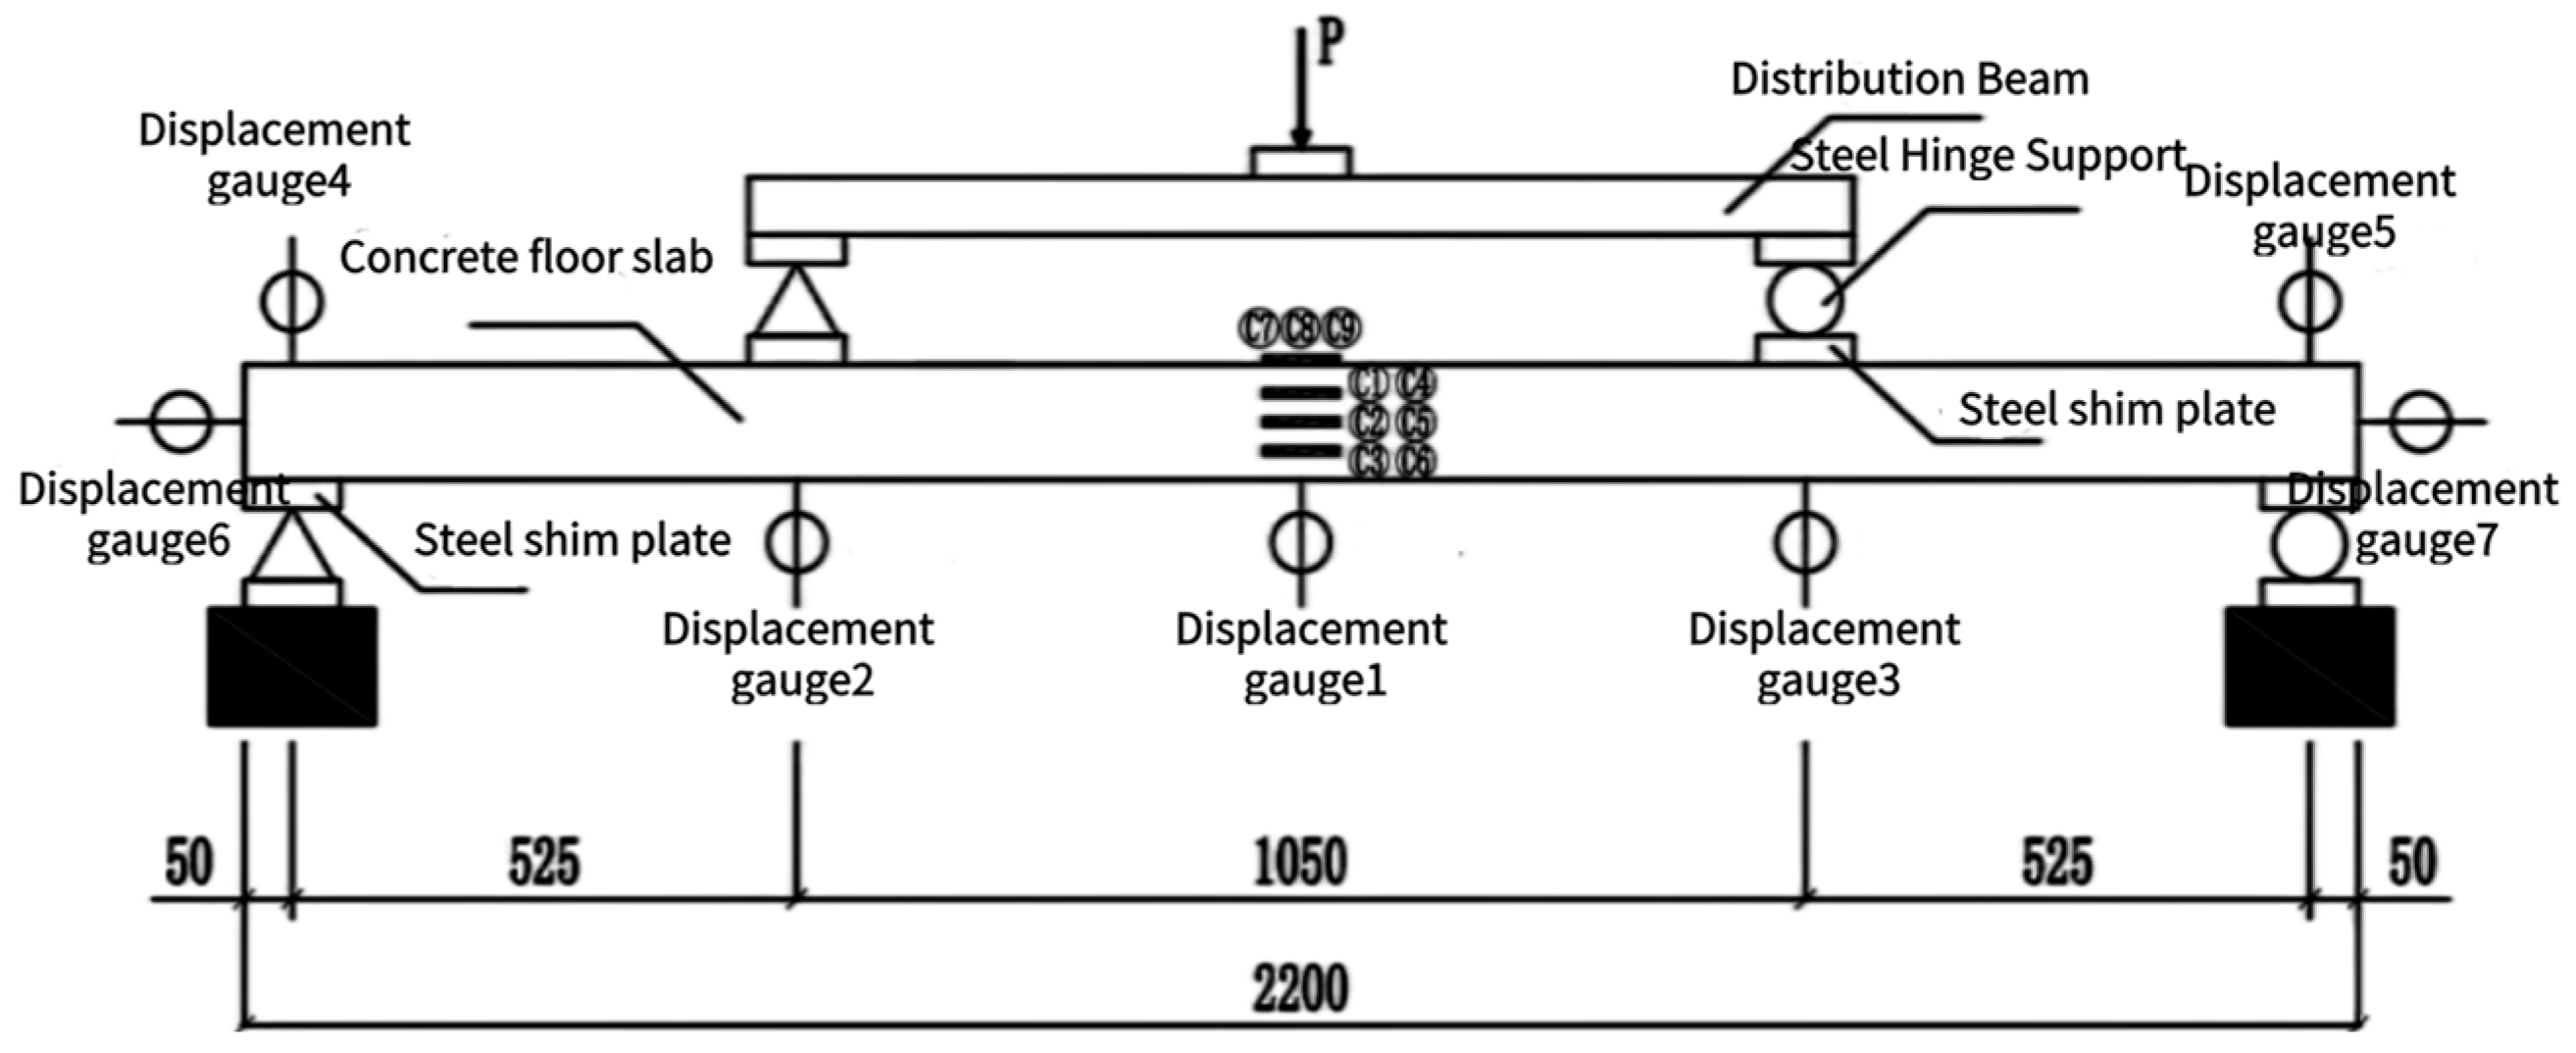
In this experiment, a simply supported one-way slab with four-point loading was adopted. Based on the principles that the support reactions under uniformly distributed load and concentrated load are equal, the areas of the shear force diagrams under both loading conditions are equal, and the maximum bending moments are equal, the positions of the concentrated loads were determined to be at L/4 of the span. In this experiment, a stepwise loading and unloading protocol was implemented to ensure the accuracy of the experimental data. After the load reached the yield strength of the reinforcement, the loading method was switched to displacement control. Each loading step was applied at a displacement increment of 2 mm until the slab failed. During the test, the displacement and crack development of the slab were observed and recorded. The loading was stopped when the specimen lost its load-bearing capacity. The schematic diagrams of the loading setup and strain gauge arrangement are shown in Figure 2 and Figure 3.

3. Experimental Observations and Result Analysis

3.1. Experimental Observations

Utilizing the data collected during the slab tests, load–deflection curves at the mid-span and load strain curves for the reinforcement were plotted. Through comparative analysis of the experimental curves, the influences of the loading methods, phosphogypsum content, and steel plates on the slabs’ bearing capacity and stiffness were identified. The loads depicted in the curves exclude the self-weights of the slabs, distribution beams, and steel hinge supports. The strain and deflection values at each location were derived from experimental measurements. Observations of the failure patterns of slabs X1 and Y1 indicated that the slabs experienced flexural failure, with no evidence of concrete crushing at the top surfaces. Examination of the bottom steel plates revealed tensile deformation due to bending within the pure bending regions, but no tearing failure was detected. Shear failure was observed at the weld points on the bottom steel plates, and delamination was not prominent in the pure bending regions at the mid-span. However, delamination was more pronounced in the bending shear regions at the quarter-span, accompanied by distinct Y-shaped cracks. Observations of the bottom steel plates in slabs X2 and Y2 revealed that no tearing occurred in the bottom steel plates post yielding until failure, although tensile deformation due to bending was evident. The bearing capacity at failure was comparable to that of slabs subjected to monotonic loading. Visual inspection suggested that the failure modes of ordinary concrete and specimens with 2% phosphogypsum content were largely similar. The final failure modes of the specimens are illustrated in Figure 4.
To elucidate the microstructural mechanisms underlying the observed macroscopic failure modes and the slight degradation in mechanical performance, fragments extracted from crack interfaces of the tested slabs—particularly from the Y-shaped cracking zones in shear flexural regions—were analyzed using scanning electron microscopy (SEM). A representative micrograph is presented in Figure 5.
The analysis indicates that crack propagation occurred both through the cement matrix and along the interfacial transition zone (ITZ) between the aggregates and the paste. Compared with conventional concrete, specimens incorporating phosphogypsum (PG) exhibited subtle morphological alterations in their microstructure. These microstructural observations corroborate the macroscopic mechanical behavior, indicating that the incorporation of 2% PG slightly modifies the internal structure without fundamentally altering the failure mechanism. This is consistent with the comparable ultimate load-bearing capacity observed in the tests.
The slight degradation in mechanical properties (less than 5%) observed with the addition of 2% phosphogypsum (PG), while remaining within the acceptable range for C40-grade concrete, warrants consideration from a chemical mineralogical perspective. Phosphogypsum, an industrial byproduct, consists primarily of dihydrate calcium sulfate (CaSO4·2H2O) but also contains impurities such as residual phosphates, fluorides, and trace heavy metals. The existing literature indicates that these impurities can impede the hydration kinetics of Portland cement. Specifically, phosphates and fluorides are known to interfere with the nucleation and growth of key hydration products, particularly calcium silicate hydrate (C-S-H) gel and ettringite, potentially leading to reduced microstructural density and increased porosity [1,2]. This phenomenon provides a plausible explanation for the minor reductions in strength and stiffness observed in this study.
Furthermore, the potential leaching behavior of soluble impurities under environmental exposure raises concerns regarding long-term durability. However, at the low incorporation rate of 2% adopted in this study, the dilution effect and the limited concentration of reactive impurities appear to mitigate significant adverse impacts. This is supported by the consistent failure modes and comparable ultimate load-bearing capacity between the control and PG-modified specimens. These findings suggest that, for structural applications utilizing low-dose PG, the influence of mechanical parameters—such as loading conditions—outweighs the subtle chemical physical alterations induced by the additive.

3.2. Test and Simulated Load Deflection Curves

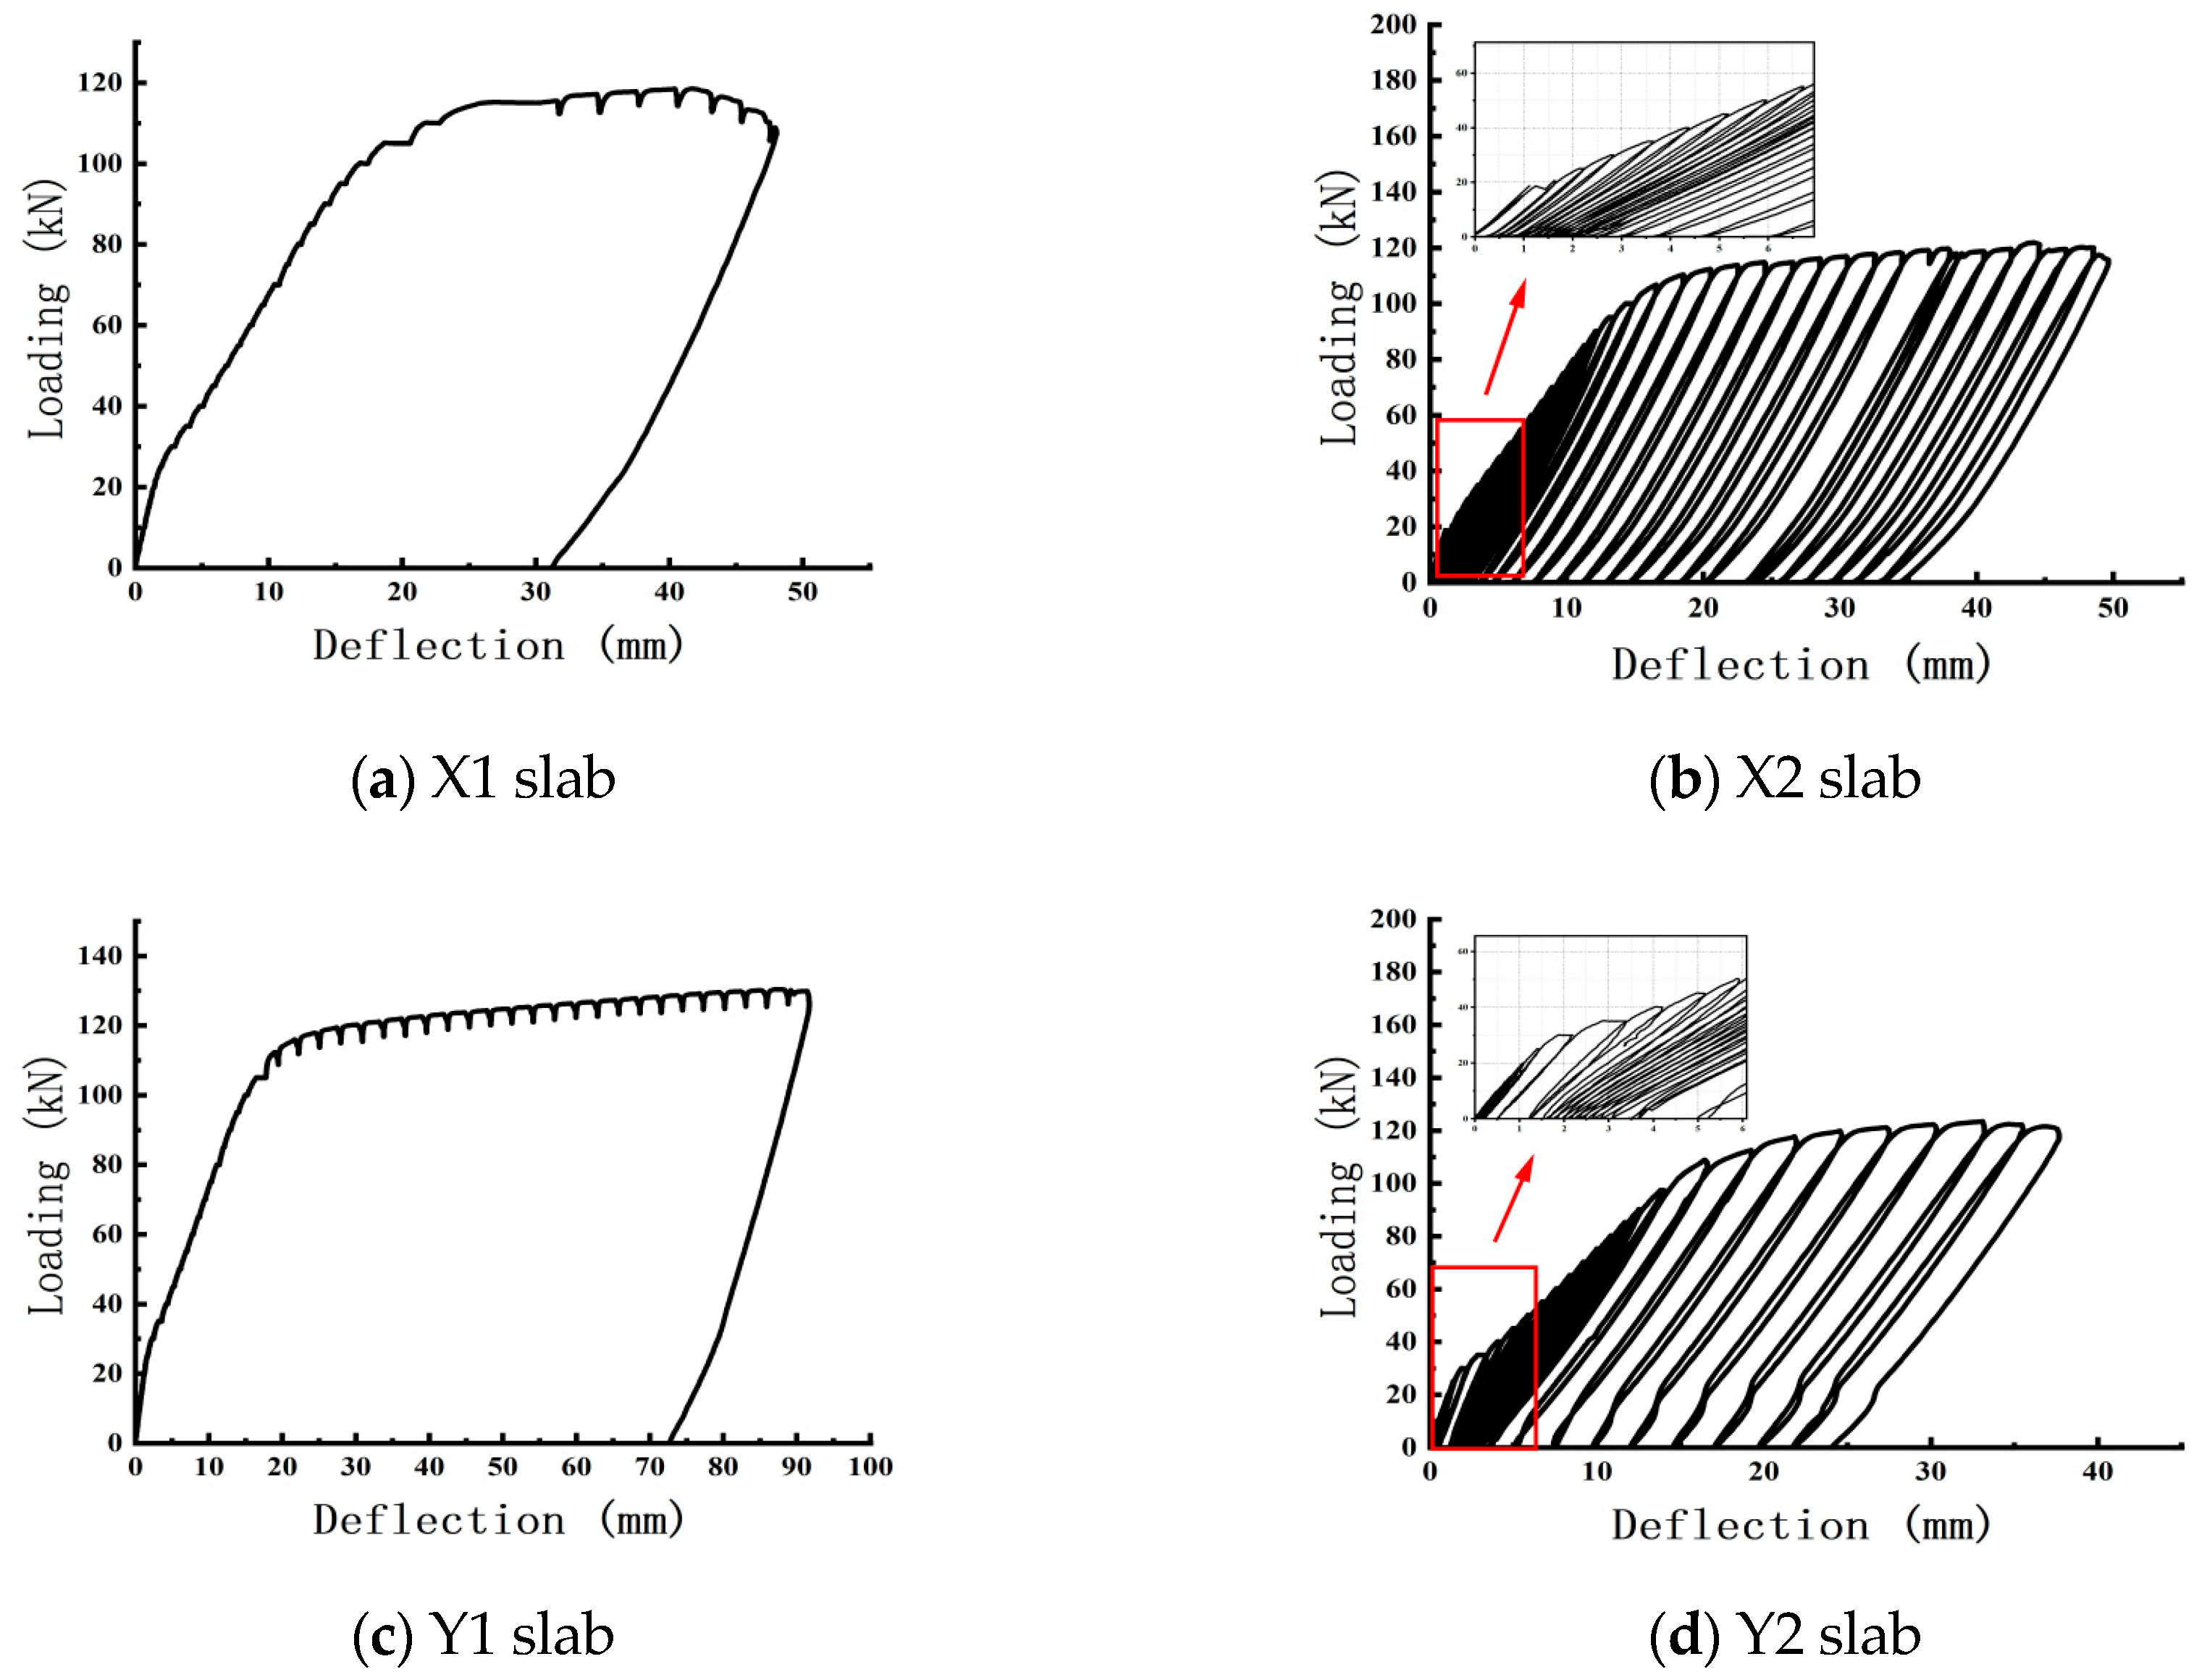
The mid-span test load deflection curves are shown in Figure 6.
Through systematic organization and analysis of the experimental data collected during the tests, the characteristic load values for each slab were determined. The experimentally measured characteristic load values for each slab are summarized in Table 2. The corresponding mid-span deflections and equivalent stiffness values for the characteristic loads of each slab are provided in Table 3. Comparative analysis revealed that the experimentally measured ultimate characteristic load of the ordinary concrete slab in Table 2 was lower than that of the slab containing admixtures, whereas Table 3 indicates that the concrete strength used was 42.19 MPa, while the concrete strength with a 2% phosphogypsum admixture was 40.38 MPa. The former was significantly higher than the latter. This discrepancy can likely be attributed to variations in the fabrication of the reinforcement within the slabs and differences in the loading positions during the tests, which resulted in a mismatch between the ultimate loads and their corresponding concrete strengths.

3.3. Load Strain Curves of Reinforcing Steel

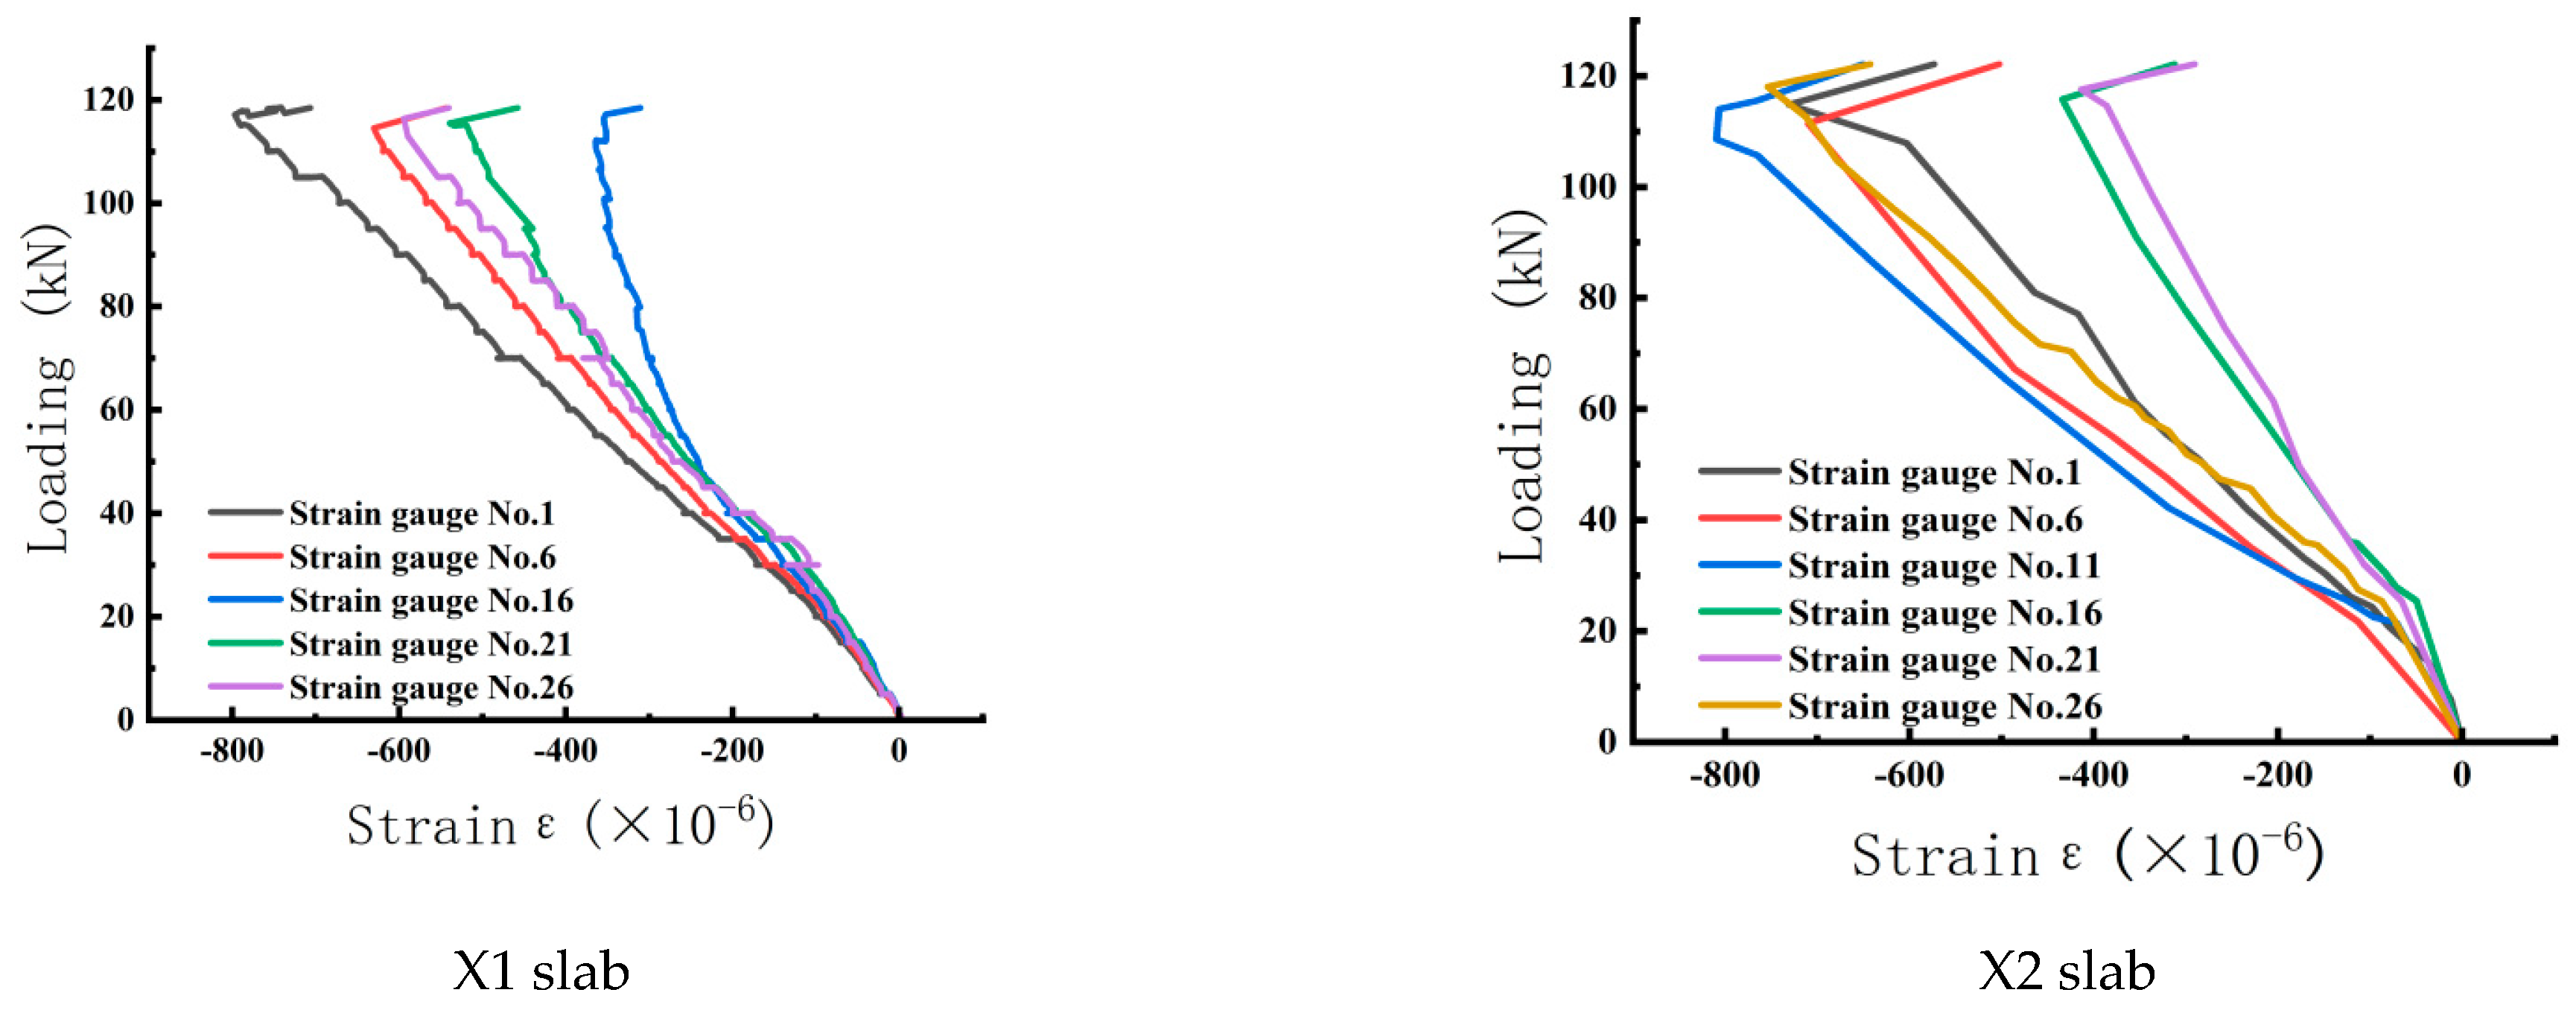
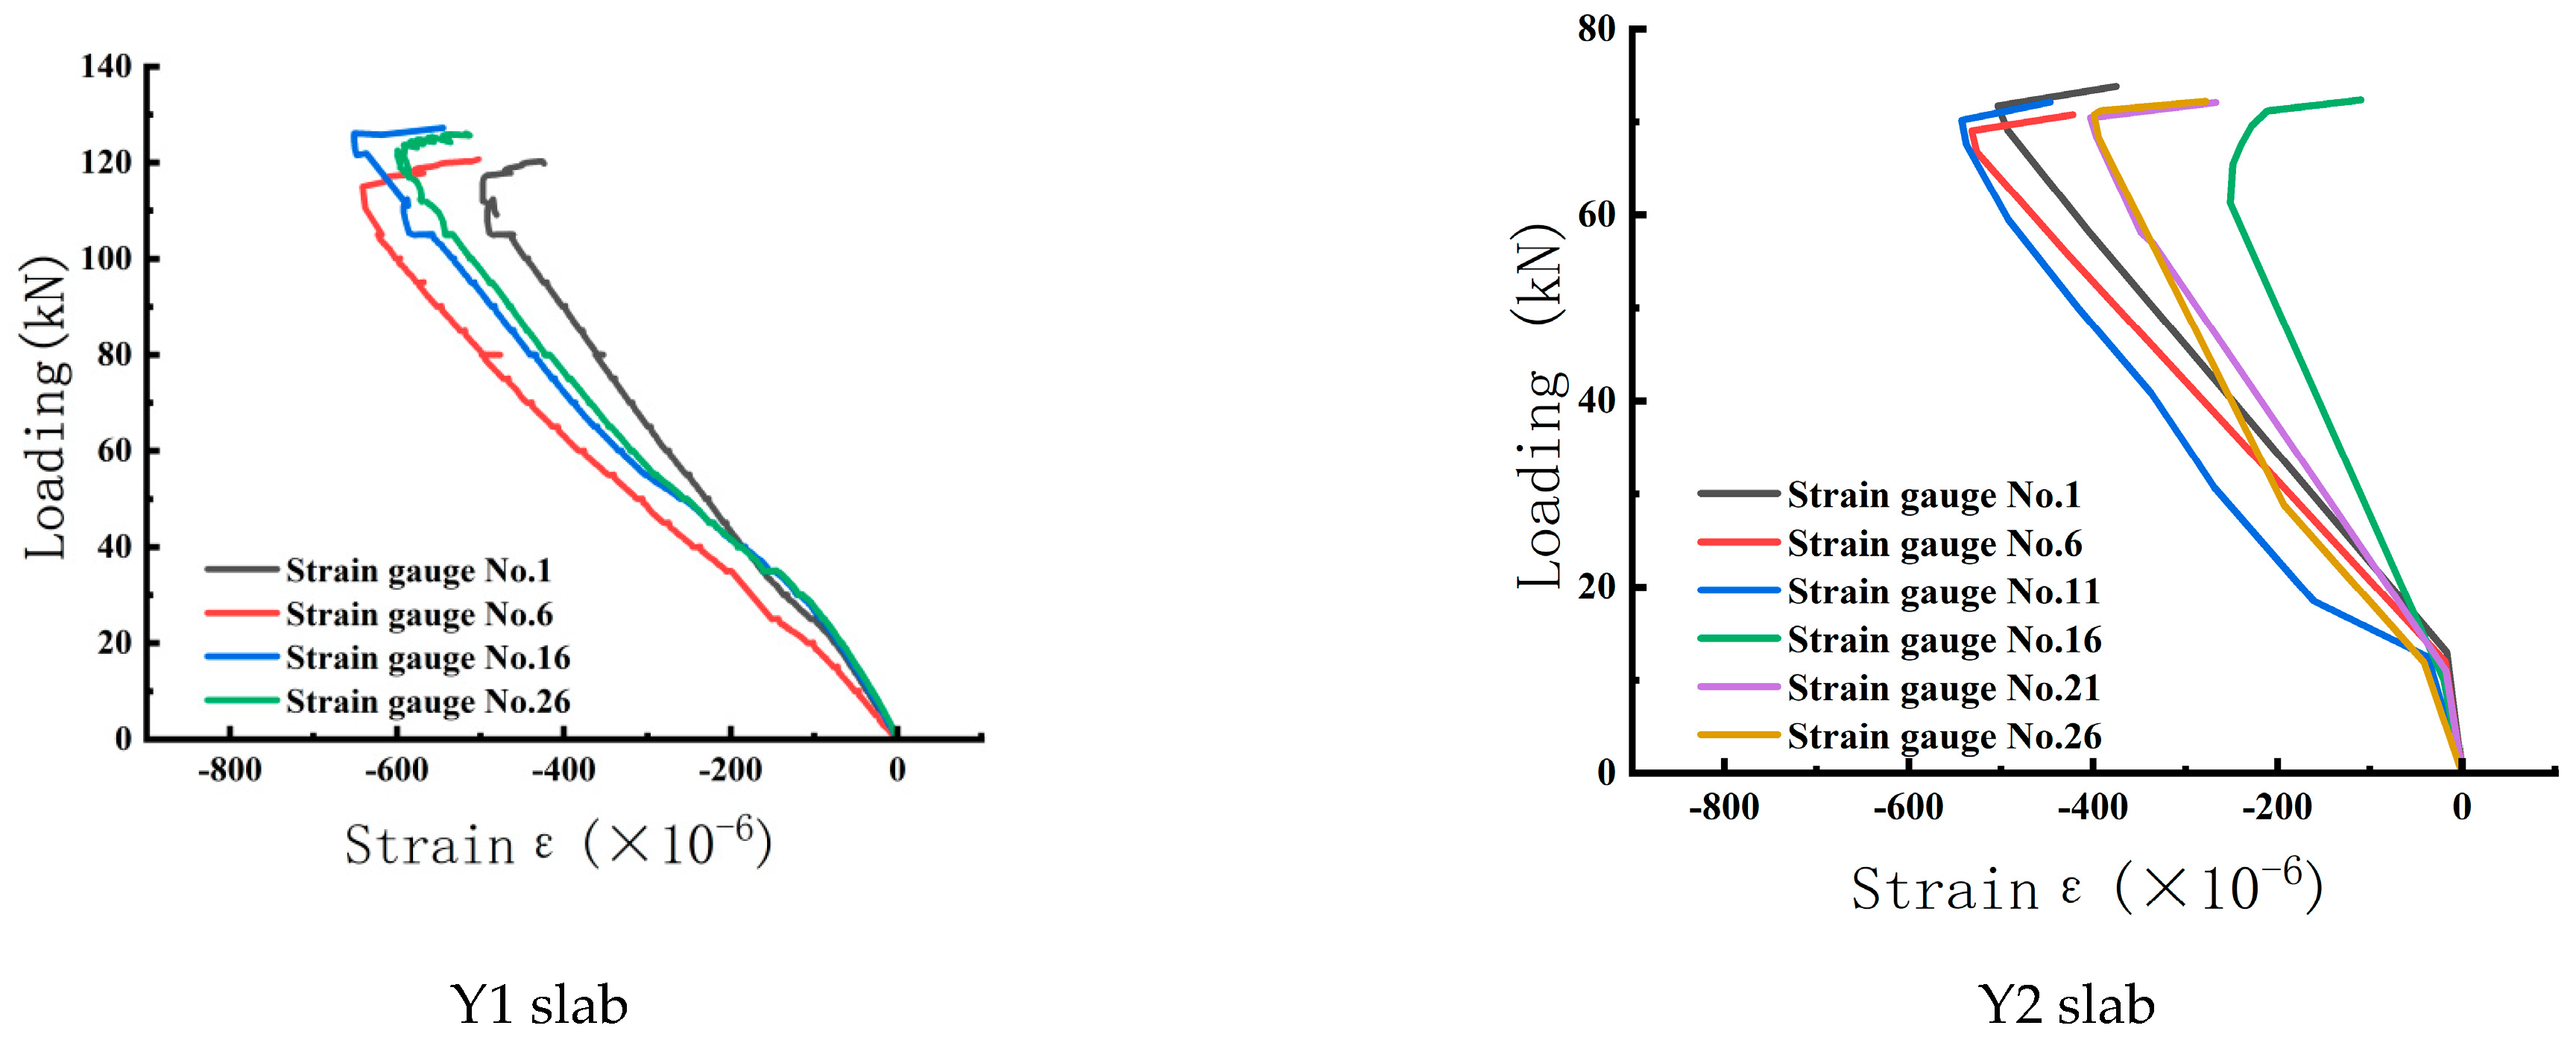
The load strain curves for the top and bottom chord reinforcement are shown in Figure 7 and Figure 8.
As illustrated in Figure 7, the load strain curves of the top chord reinforcement for all slabs display similar characteristics. During the initial loading phase, when the applied load is relatively small, the curves exhibit a linear increase. As loading continues, upon exceeding the yield load and entering the strain-hardening stage of the reinforcement, it is observed that the strain in the top chord reinforcement slightly retracts, and the stress on the top chord reinforcement decreases. Concurrently, the compressive stress on the concrete in the compression zone increases. Prior to the strain retraction of the reinforcement, the curve shape indicates that the top chord reinforcement did not yield, and the maximum compressive stress in the top chord reinforcement occurs when the bottom tensile reinforcement and steel plate yield. Under identical applied loads, the strain in specimens containing phosphogypsum is smaller compared to that in ordinary specimens, reflecting the superior load-bearing capacity of the phosphogypsum-containing specimens.
As depicted in Figure 8, the load–strain curves of the bottom chord reinforcement for all slabs exhibit similar characteristics. During the initial loading phase, when the applied load is relatively small, the curves exhibit a linear increase. As loading continues, upon exceeding the yield load and entering the strain-hardening stage of the reinforcement, the tensile strain of the reinforcement at the mid-span position is greater than that at the loading position, with a notable difference in tensile strain between the two positions.

4. Finite Element Analysis

4.1. Steel Model

The truss model was established using the three-dimensional truss element T3D2, with material properties assigned as HRB400 and CPB550, corresponding to the steel grades used. The density of the steel was set to 7850 kg/m3, the elastic modulus was taken as 200 GPa, and the Poisson’s ratio was set to 0.33. The cross-sectional diameter of the HRB400 reinforcement was 10 mm, while that of the CPB550 reinforcement was 5 mm. The heights of the trusses used in the experiments were 70 mm and 90 mm. For trusses without bottom steel plates, 11 structural reinforcement bars were placed at the top of the trusses, consistent with the experimental setup.
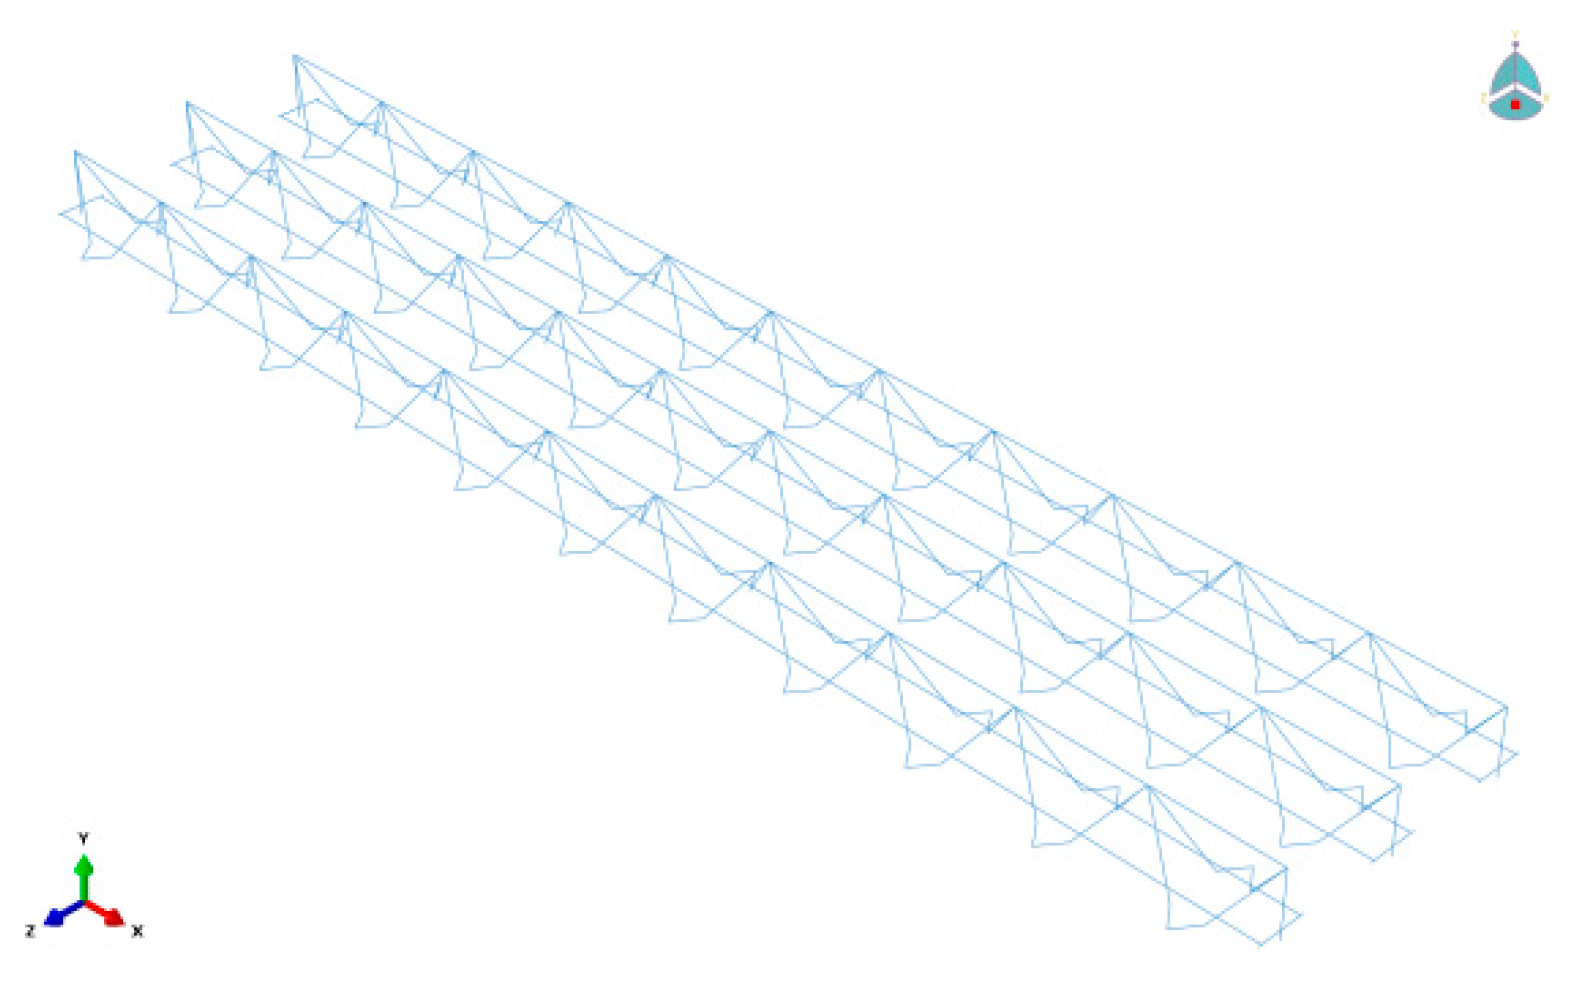
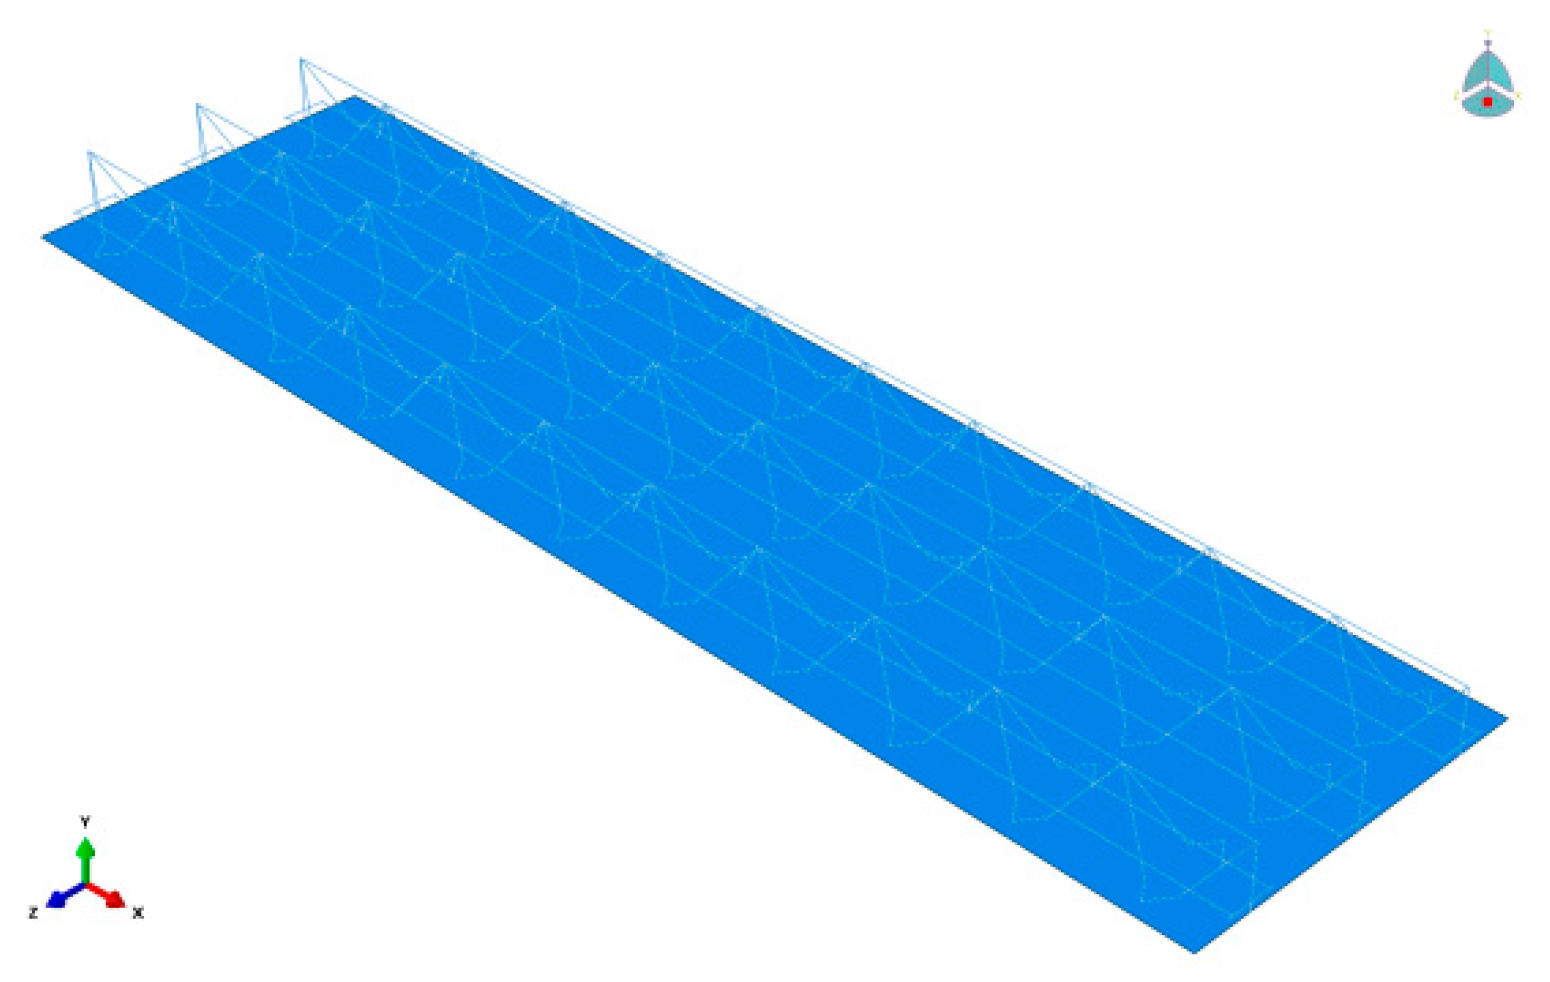
The steel plate model was established using the shell element S4R, with the base material of the steel plate being Q235 steel and a zinc coating of 120 g/m2. The material properties of the steel plate were assigned as Q235 steel, with a thickness of 0.5 mm, a density of 7 850 kg/m3, an elastic modulus of 206 GPa, and a Poisson’s ratio of 0.33. After the truss model was constructed, the top chord, bottom chord, and web reinforcement were merged to form a unified structure capable of bearing loads. For slabs with bottom steel plates, the steel plates were connected to the truss through welding, and thus, the steel plates and truss were merged at shared nodes within the software. Taking the truss with a height of 90 mm as an example, the truss model without steel plates is shown in Figure 9, while the truss model with steel plates is shown in Figure 10.

4.2. Concrete Model

The ABAQUS2023 software provides three constitutive models for concrete materials: the concrete smeared cracking model, the concrete brittle cracking model, and the concrete plastic damage model. The plastic damage model is capable of analyzing both static and dynamic problems, effectively capturing the development of concrete cracks, and it also exhibits good computational convergence. In this study, static analysis was employed for slabs subjected to monotonic loading, while for slabs subjected to cyclic loading, static analysis proved difficult to converge, and thus, dynamic analysis was utilized. Therefore, the concrete plastic damage model was adopted for the analysis.
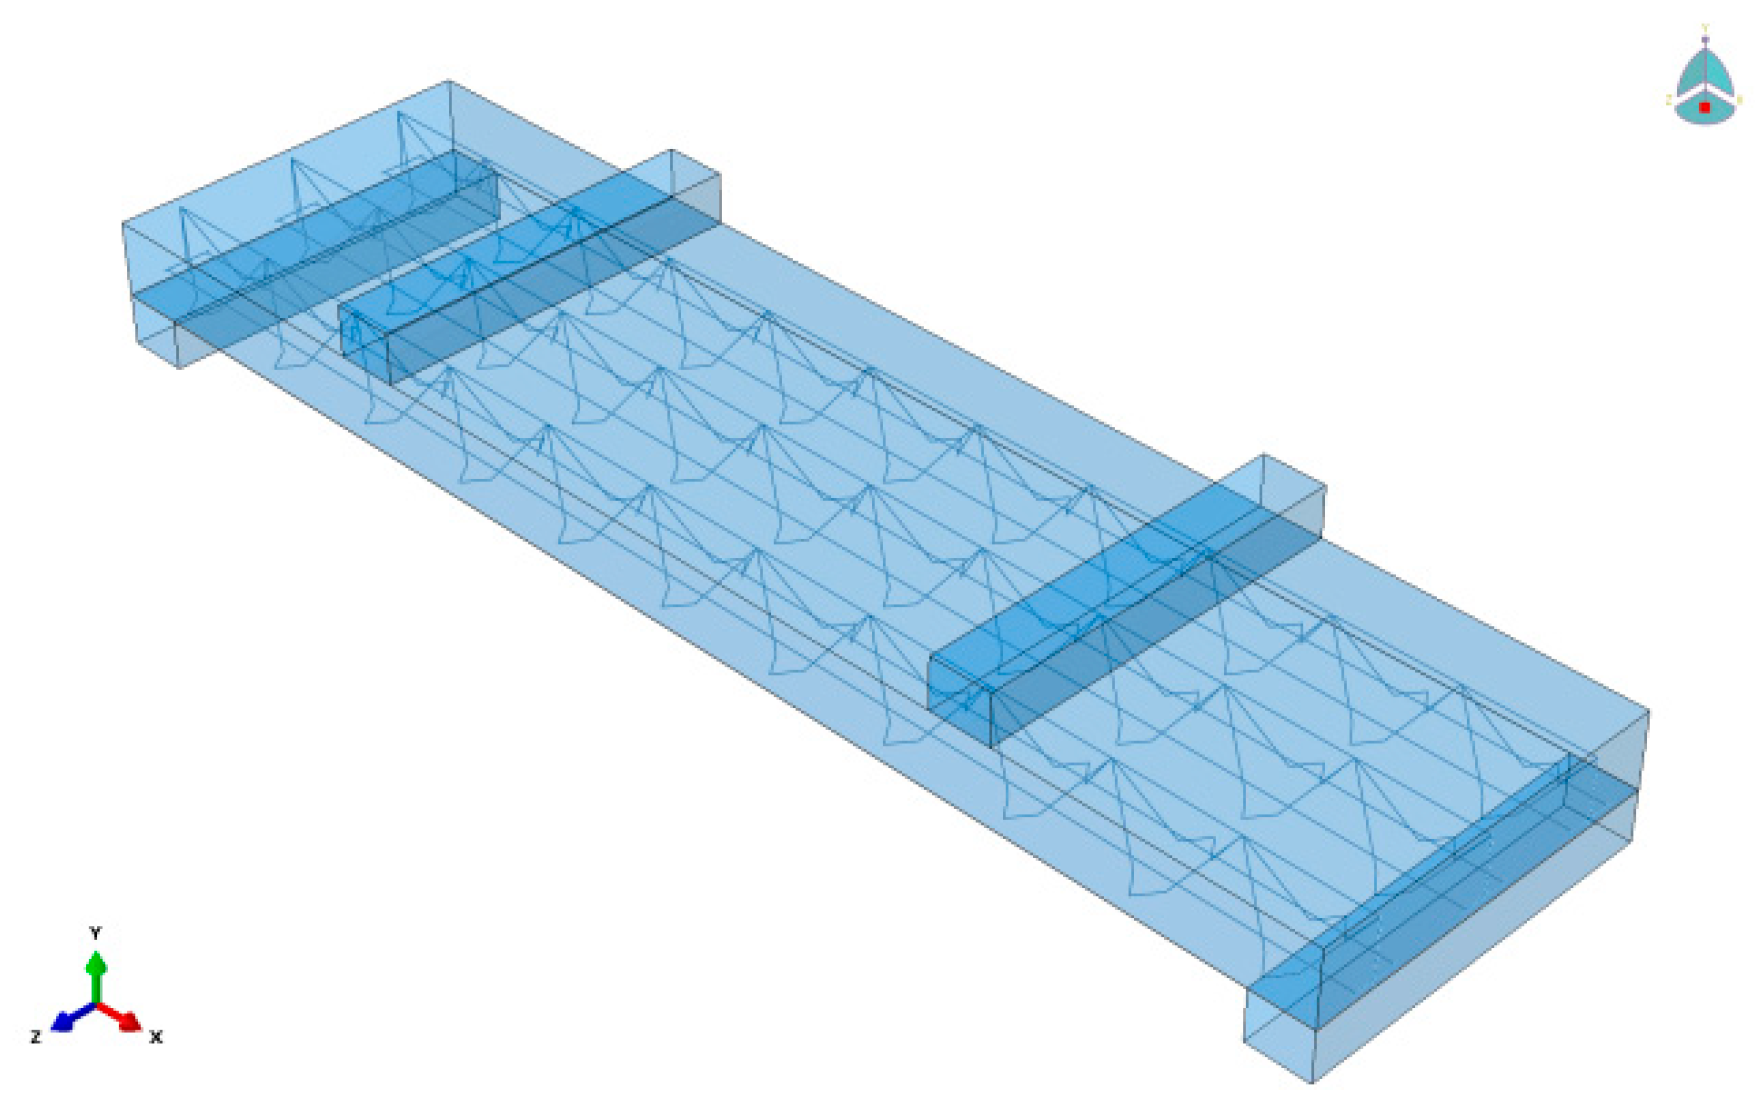
The concrete model was established using the three-dimensional solid element C3D8R. The density of the concrete used in the experiments was measured as 2296 kg/m3, with an elastic modulus of 33,000 MPa for concrete containing 0% phosphogypsum, 32,600 MPa for concrete containing 2% phosphogypsum, and 30,700 MPa for concrete containing 4% phosphogypsum. The Poisson’s ratio for all concrete types was 0.19. The heights of the concrete slabs used in the experiments were 100 mm and 120 mm, and separate models were created for each height. The model is shown in Figure 11.

4.3. Grid Division and Mutual Setting of Roles

Based on the dimensions and geometry of the model in this study, to prevent issues such as insufficient computational accuracy and non-convergence due to overly coarse meshing, as well as stress concentration caused by excessively dense meshing, a uniform mesh size of 20 mm was applied to the concrete, reinforcement truss, bottom steel plate, and supports. The meshing results for the reinforcement truss and bottom steel plate are shown in Figure 12, while the meshing for the concrete slab and supports is illustrated in Figure 13.
After assembling the components, the interactions between them were defined. The contact between the four supports and the concrete surface was defined as hard contact with rough behavior, and reference points were assigned to each support and coupled accordingly. For trusses without bottom steel plates, the reinforcement truss was embedded directly within the concrete. For slabs with bottom steel plates, the slip curves from the experiments in Section 4 indicated minimal slip at the plate ends, but noticeable slip occurred between the steel plate and concrete within the span, which could not be neglected. Therefore, the contact between the steel plate and the bottom concrete was defined as hard contact with a friction coefficient of 0.3.

4.4. Comparison of Load-Deflection Curves

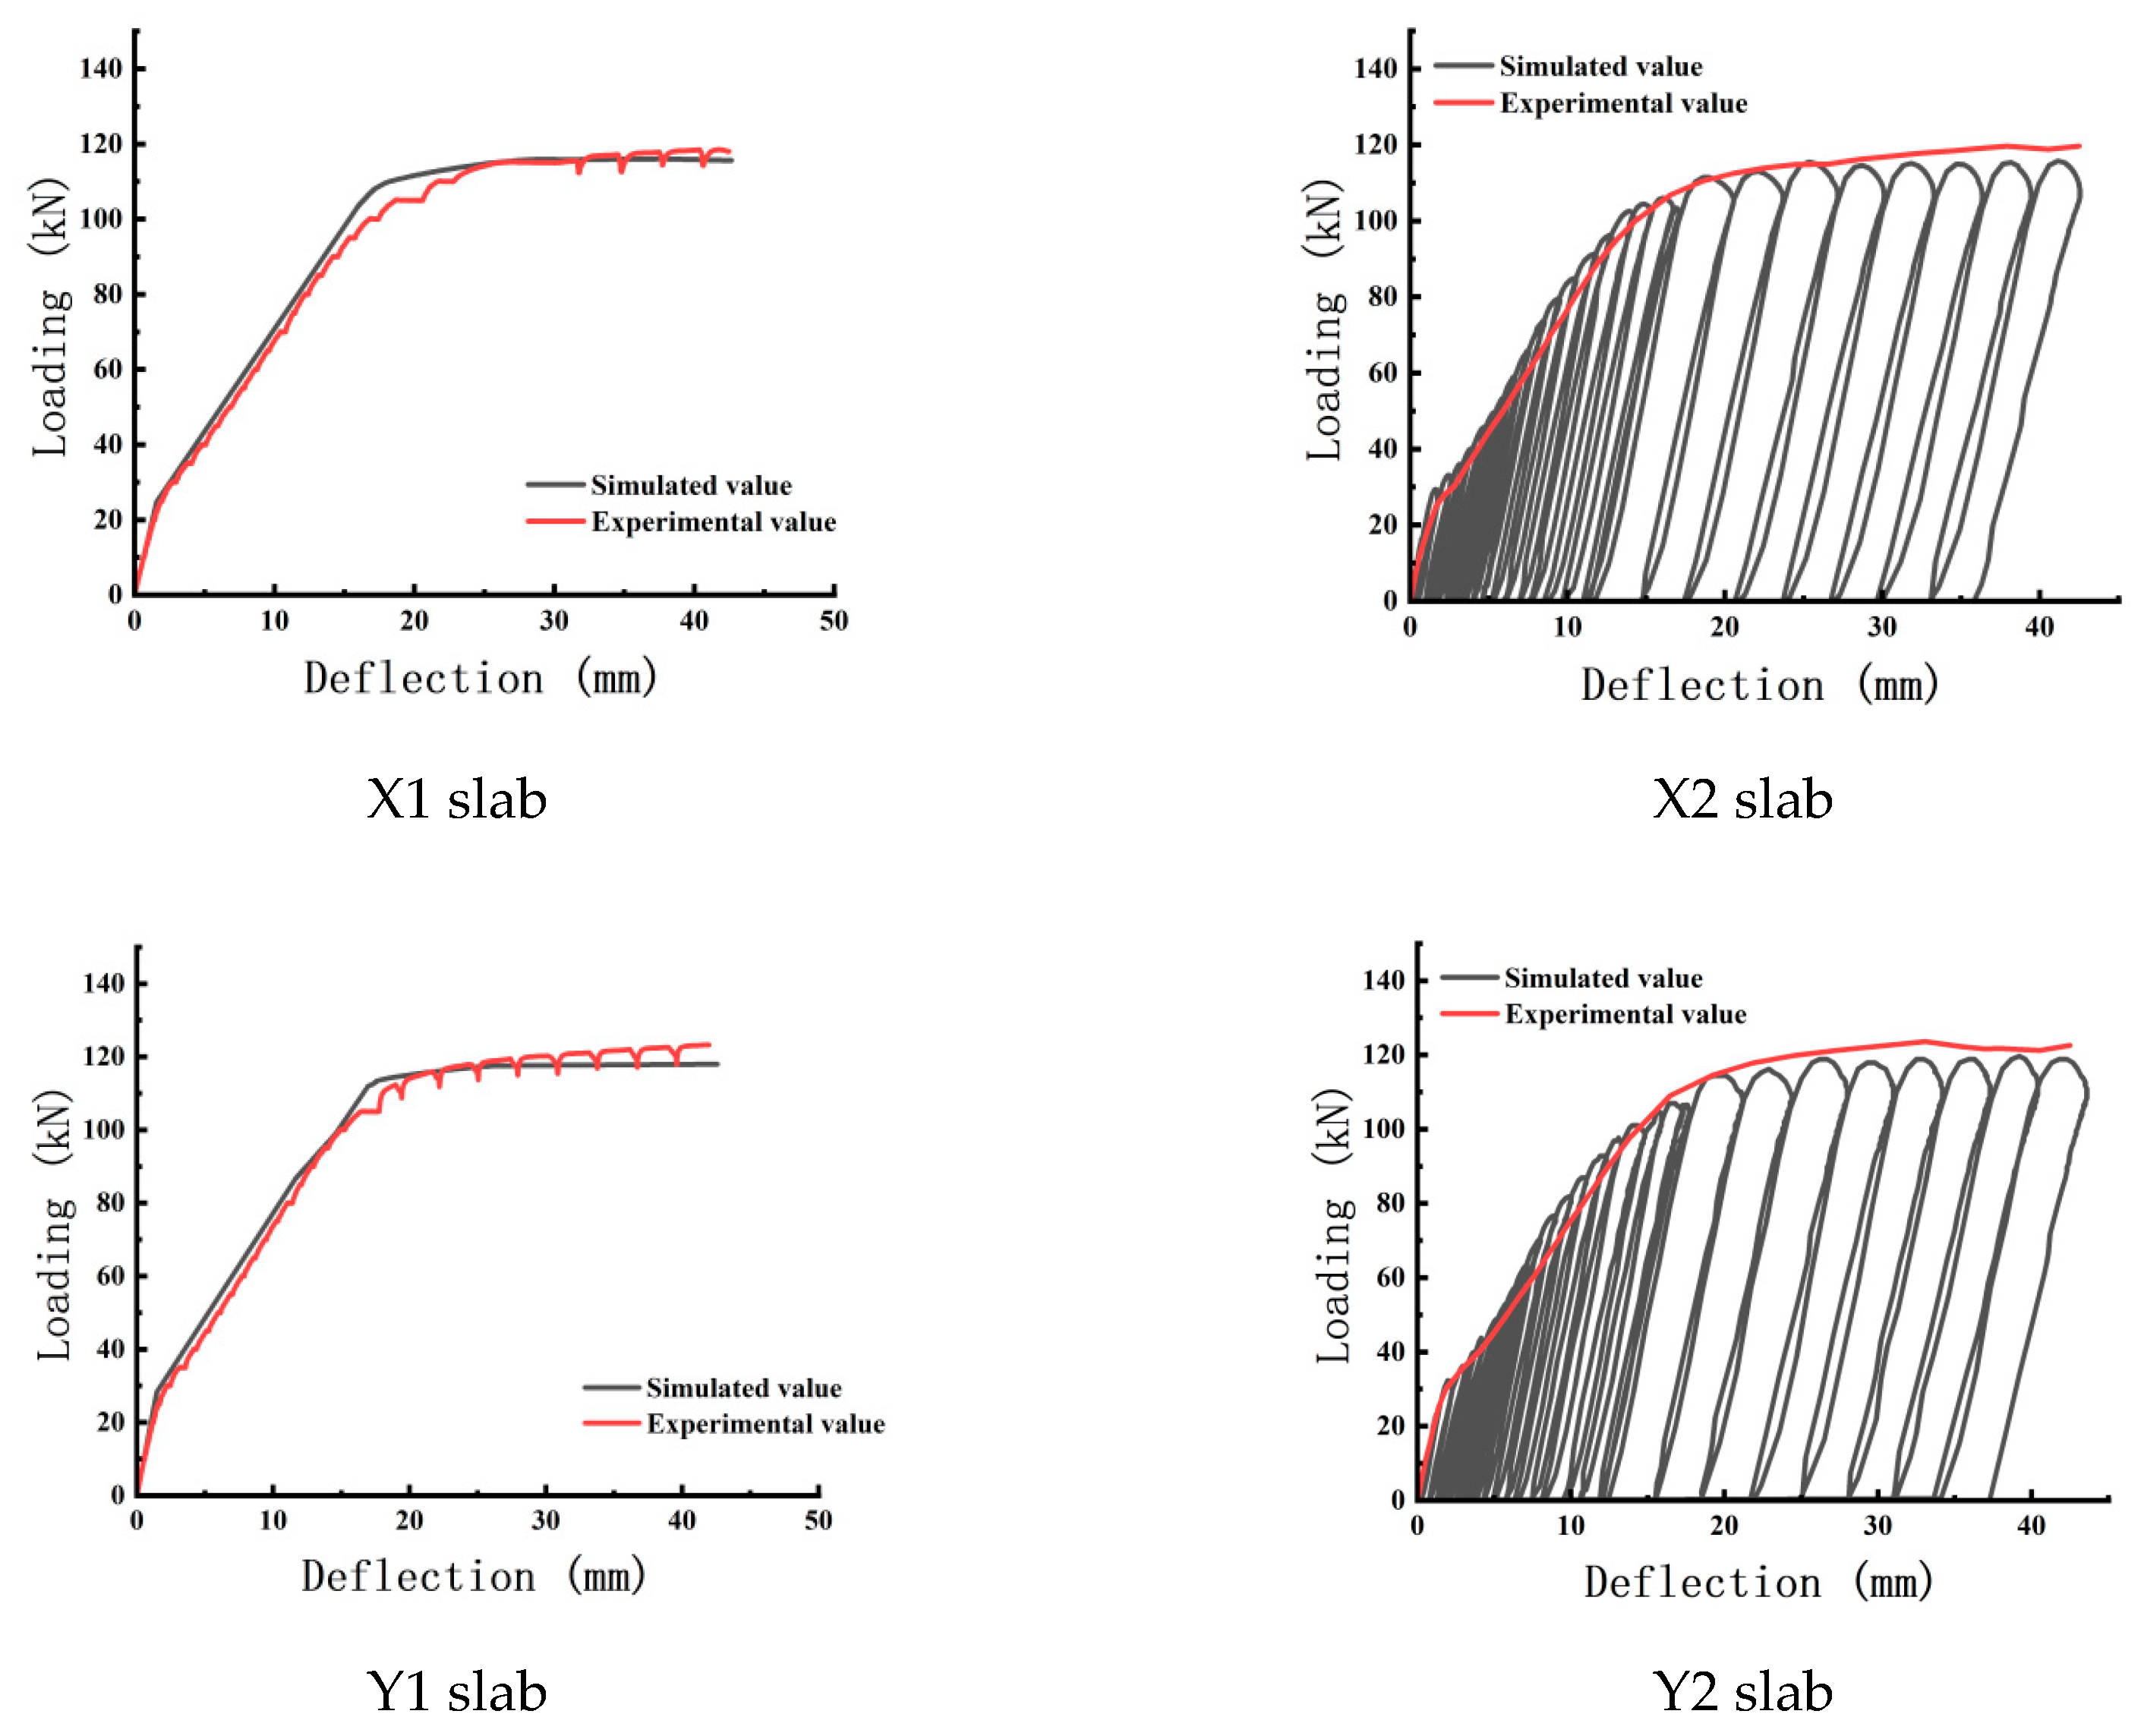
The finite element simulation results for the monotonic loading slabs and the skeleton curves corresponding to the load-deflection curves of the cyclic loading specimens were compared with the experimentally measured mid-span deflection curves and skeleton curves of the slabs, as shown in Figure 14.
The mid-span deflection values from the finite element analysis were extracted up to the experimental failure load deflection of 42 mm, and the simulated values were obtained from the load-deflection curves of each slab and compared with the experimental values. This resulted in Table 4, which compares the experimental and simulated characteristic load values, and Table 5, which compares the experimental and simulated cracking and yield deflection values. The equivalent stiffness values of the slabs are compared in Table 6.
As shown in Table 4, significant discrepancies between the experimental and simulated values are observed before the yield stage, which may be attributed to the difficulty of achieving the ideal conditions assumed in the simulation during experimental operations. However, the material constitutive models used in the simulation accurately reflect the material properties, and thus, the load discrepancies remain within an acceptable range. From Table 5, it can be seen that the simulated deflection values are generally larger, likely due to inaccuracies in data point selection and measurement during the experiments. Although discrepancies exist between the simulated and experimental values, they remain within an acceptable range. As can be seen from Table 4, Table 5 and Table 6, the larger errors in the ABAQUS2023 simulations for the slabs occur before the yield load is reached; however, the simulation results show good agreement with the experimental data for both the cracking load stiffness and the serviceability limit load stiffness. In summary, the simulation results are in good agreement with the experimental results, indicating that the ABAQUS2023 analysis effectively captures the mechanical behavior of the reinforced truss concrete specimens.

4.5. Analysis of Finite Element Simulation Contour Plots

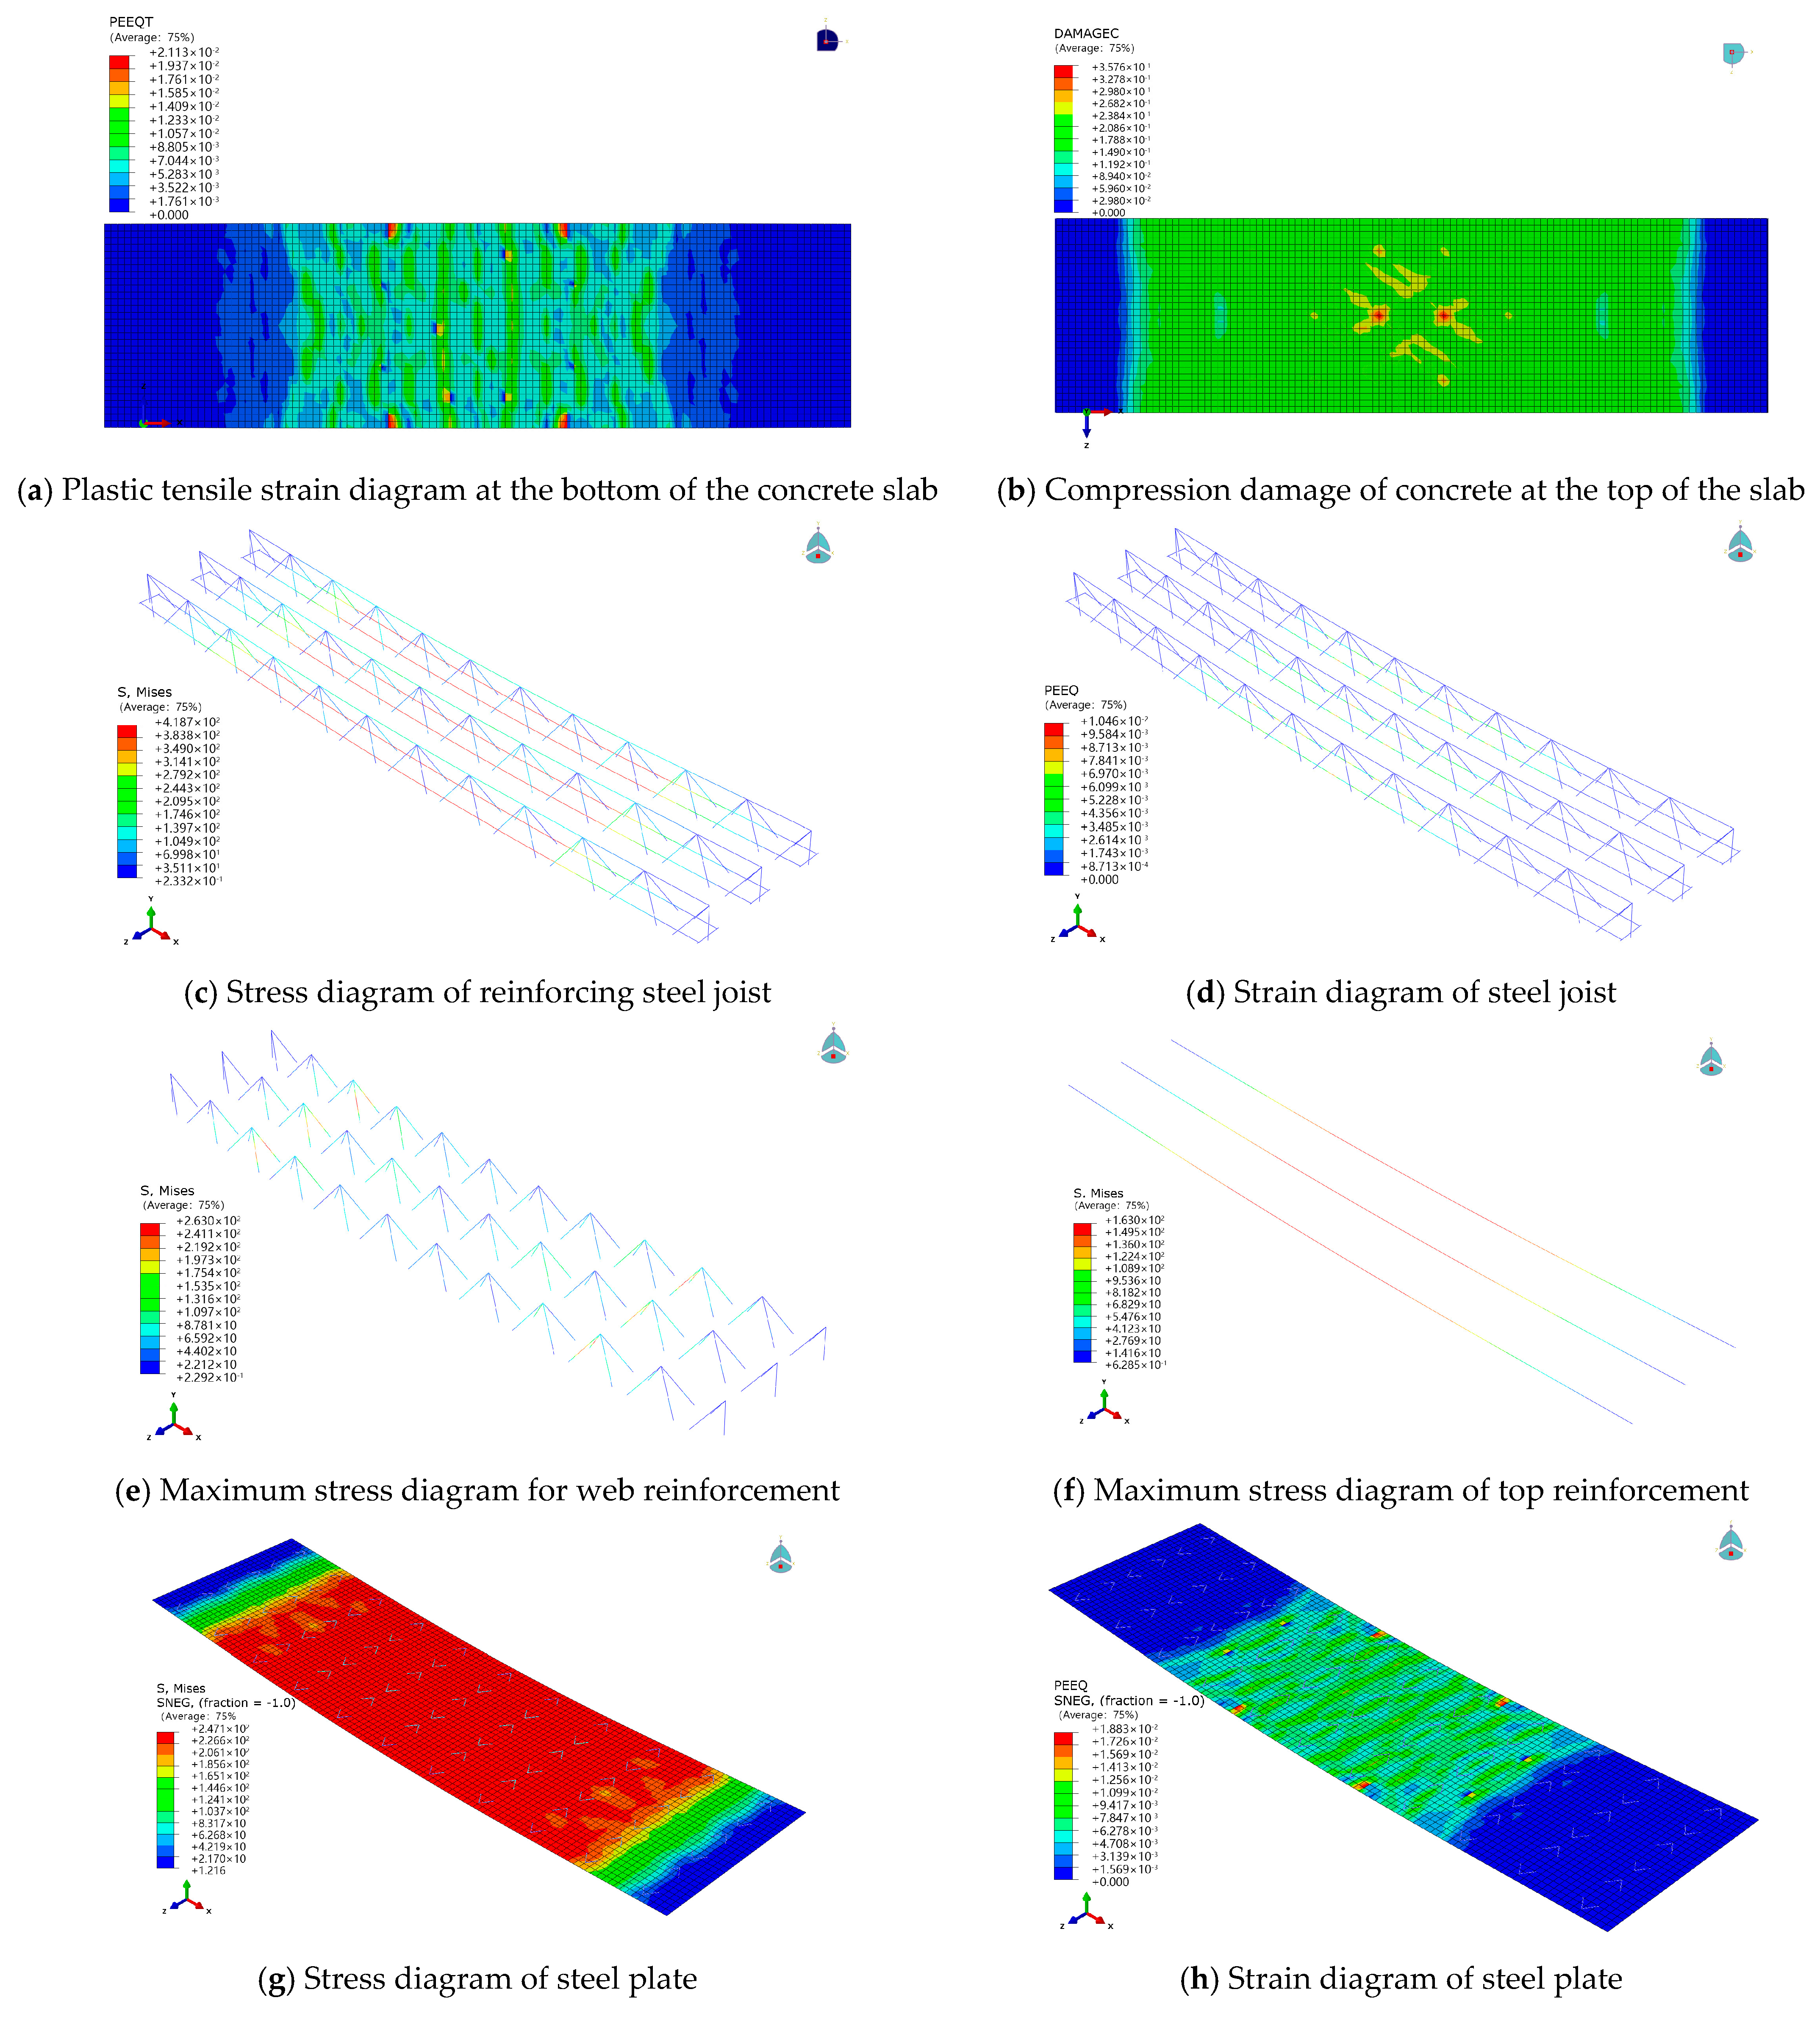
Given the similar patterns observed in the simulation contour plots of the four specimens, only the contour plots of slab X1 are analyzed here for conciseness, as illustrated in Figure 15.
As shown in Figure 15, the equivalent plastic strain contour plot at the bottom of the concrete slab effectively captures the tensile behavior of the concrete, enabling the observation of crack propagation at the slab bottom. Cracks at the slab bottom initiate within the loading zone at the mid-span and propagate along the slab width, with the tensile strain at the mid-span being significantly higher than at the sides, which aligns well with the experimental observations. The compressive damage contour plot at the top of the slab indicates that the compressive damage in the concrete is relatively low. The maximum compressive damage in the top concrete of slab X1 is 0.58, with the corresponding concrete cracking strain being less than 0.0033, indicating that the concrete in compression was not crushed, which is consistent with the experimental findings. From the stress and strain contour plots of the reinforcement truss, it is evident that the maximum tensile stress in the bottom tensile reinforcement at failure is 418.7 MPa, indicating that the tensile reinforcement has yielded, with the stress values being relatively close. The strain corresponding to the maximum stress is 0.01046. From the stress contour plot of the web reinforcement, the maximum stress in the web reinforcement is located on the inner side of the bottom support, with a maximum stress of 263 MPa, indicating that the web reinforcement did not yield. Regarding the maximum compressive stress in the top chord reinforcement, experimental observations reveal that the top chord reinforcement retracts after the bottom chord reinforcement yields; thus, the compressive stress in the top chord reinforcement reaches its maximum when the bottom chord reinforcement yields. Using the frame selector, the slab is adjusted to the state where the bottom chord reinforcement yields, and the bottom chord and web reinforcement are hidden, leaving only the top chord reinforcement visible, as depicted in Figure 15f. The compressive stress in the top chord reinforcement is 163 MPa, indicating that it did not yield, which is consistent with the experimental results.

5. Conclusions

This study comprehensively evaluated the structural performance of one-way steel truss composite slabs incorporating phosphogypsum (PG) concrete through an integrated experimental and numerical approach. The primary objective was to assess the feasibility of utilizing PG as a partial cement replacement by examining its effects on mechanical properties and structural behaviors under static loading. The main conclusions are drawn as follows:
1.
Ultimate Capacity Preservation: The incorporation of 2% PG content resulted in statistically insignificant reductions in key mechanical properties, with the compressive strength decreasing by 4.3%, flexural capacity by 2.6%, and elastic modulus by 1.2%. These minimal reductions demonstrate that the fundamental structural integrity and ultimate load-bearing capacity remain substantially uncompromised, confirming the structural viability of PG concrete for primary load-bearing applications in building construction.
2.
Pronounced Effect on Serviceability Performance: A more notable influence was observed on parameters governing serviceability limit states. The 10–12% reduction in cracking load suggests that PG incorporation affects the microstructural integrity at early loading stages, leading to earlier crack initiation. However, the strong correlation (R2 = 0.89) between pre-yield stiffness and concrete strength implies that the overall deformation behavior post cracking remains predictable and controlled.
3.
Robustness of Numerical Modeling: The finite element model developed in ABAQUS2023 demonstrated a high degree of accuracy in simulating the structural response, with a 90% correlation in load-deflection curves and an 82% similarity in failure modes. The discrepancies observed (primarily in crack propagation and ultimate load prediction, with <12% deviation) are largely attributable to the idealized modeling of the PG concrete interface and the simplified assumptions in the concrete damage plasticity parameters. This highlights the model’s utility for design-stage prediction while underscoring the need for more sophisticated material constitutive laws to capture localized failure mechanisms accurately.
The experimental and numerical results obtained in this study demonstrate the technical feasibility of utilizing 2% PG concrete in composite slab systems from a structural performance perspective. The minimal impact on ultimate capacity suggests that existing design methodologies remain largely applicable, while the observed reduction in cracking load necessitates particular attention to serviceability design considerations, especially in applications requiring stringent crack control.

Author Contributions

Conceptualization, L.S. and A.Z.; methodology, A.Z.; software, A.Z.; validation, L.S., A.Z. and J.F.; formal analysis, L.S.; investigation, L.S.; resources, L.S.; data curation, A.Z.; writing—original draft preparation, A.Z.; writing—review and editing, L.S.; visualization, A.Z.; supervision, L.S.; project administration, L.S.; funding acquisition, L.S. All authors have read and agreed to the published version of the manuscript.

Funding

This research was funded by the Project of Technology Development Program of Science and Technology Department of Jilin Province grant number 20220203072SF, and The APC was funded by Project of Technology Development Program of Science and Technology Department of Jilin Province.

Data Availability Statement

Data are contained within the article. The data that support the findings of this study are available from the corresponding author upon reasonable request.

Conflicts of Interest

The authors declare no conflict of interest. The authors declare that they have no known competing financial interests or personal relationships that could have appeared to influence the work reported in this paper.

References

  1. Jalali, J.; Gaudin, P.; Capiaux, H.; Ammar, E.; Lebeau, T. Fate and transport of metal trace elements from phosphogypsum piles in Tunisia and their impact on soil bacteria and wild plants. Ecotoxicol. Environ. Saf. 2019, 174, 12–25. [Google Scholar] [CrossRef] [PubMed]
  2. Lütke, S.F.; Oliveira, M.L.S.; Silva, L.F.O.; Cadaval, T.R.S.; Dotto, G.L. Nanominerals assemblages and hazardous elements assessment in phosphogypsum from an abandoned phosphate fertilizer industry. Chemosphere 2020, 256, 127138. [Google Scholar] [CrossRef] [PubMed]
  3. Meskini, S.; Mechnou, I.; Benmansour, M.; Remmal, T.; Samdi, A. Environmental investigation on the use of a phosphogypsum-based road material: Radiological and leaching assessment. J. Environ. Manag. 2023, 345, 118597. [Google Scholar] [CrossRef] [PubMed]
  4. Baolin, K.; Qin, Z.; Xianhai, L.; Zhihui, S. Adsorption and solidification of cadmium by calcium sulfate dihydrate (gypsum) in an aqueous environment: A dispersion-corrected DFT and ab initio molecular dynamics study. Phys. Chem. Chem. Phys. 2022, 24, 9521–9533. [Google Scholar] [CrossRef]
  5. Wu, F.; Ren, Y.; Qu, G.; Liu, S.; Chen, B.; Liu, X.; Zhao, C.; Li, J. Utilization path of bulk industrial solid waste: A review on the multi-directional resource utilization path of phosphogypsum. J. Environ. Manag. 2022, 313, 114957. [Google Scholar] [CrossRef]
  6. Bilal, E.; Bellefqih, H.; Bourgier, V.; Mazouz, H.; Dumitraş, D.-G.; Bard, F.; Laborde, M.; Caspar, J.P.; Guilhot, B.; Iatan, E.-L.; et al. Phosphogypsum circular economy considerations: A critical review from more than 65 storage sites worldwide. J. Clean. Prod. 2023, 414, 137561. [Google Scholar] [CrossRef]
  7. Garbaya, H.; Jraba, A.; Khadimallah, M.A.; Elaloui, E. The Development of a New Phosphogypsum-Based Construction Material: A Study of the Physicochemical, Mechanical and Thermal Characteristics. Materials 2021, 14, 7369. [Google Scholar] [CrossRef]
  8. Shuhua, L.; Lu, W.; Baoying, Y. Effect of modified phosphogypsum on the hydration properties of the phosphogypsumbased supersulfated cement. Construct. Build. Mater. 2019, 214, 9–16. [Google Scholar]
  9. Meng, W.; Dong, Y. Mechanical properties and chemical microscopic characteristics of all-solid-waste composite cementitious materials prepared from phosphogypsum and granulated blast furnace slag. Mater. Today Commun. 2024, 41, 110809. [Google Scholar] [CrossRef]
  10. Akfas, F.; Elghali, A.; Aboulaich, A.; Munoz, M.; Benzaazoua, M.; Bodinier, J.L. Exploring the potential reuse of phosphogypsum: A waste or a resource? Sci. Total Environ. 2024, 908, 168196. [Google Scholar] [CrossRef]
  11. Wang, Z.; Shui, Z.; Sun, T.; Li, X.; Zhang, M. Recycling utilization of phosphogypsum in eco excess-sulphate cement: Synergistic effects of metakaolin and slag additives on hydration, strength and microstructure. J. Clean. Prod. 2022, 358, 131901. [Google Scholar] [CrossRef]
  12. Chernysh, Y.; Yakhnenko, O.; Chubur, V.; Roubik, H. Phosphogypsum recycling: A review of environmental issues, current trends, and prospects. Appl. Sci. 2021, 11, 1575. [Google Scholar] [CrossRef]
  13. Romero-Hermida, M.I.; Borrero-López, A.M.; Alejandre, F.J.; Flores-Alés, V.; Santos, A.; Franco, J.M.; Esquivias, L. Phosphogypsum waste lime as a promising substitute of commercial limes: A rheological approach. Cem. Concr. Compos. 2019, 95, 205–216. [Google Scholar] [CrossRef]
  14. Kutymbek, N.; Musabekov, K.; Yestayev, K.; Yessengeldiyeva, P.; Omarova, G. Evaluating the efficacy of phosphogypsum as a soil amendment for enhancing fertility in compacted gray-earth soils of Kazakhstan during comprehensive land reclamation. Int. J. Des. Nat. Ecodyn. 2023, 18, 529–536. [Google Scholar] [CrossRef]
  15. Xiang, H.; Dong, C.; Wu, H.; Hu, X.; Gao, B.; Fan, Z.; Wan, J.; Ma, Y.; Guan, H. Study on Harmless Treatment and Performance of Phosphogypsum-Based Inorganic Cementing Material. Infrastructures 2025, 10, 196. [Google Scholar] [CrossRef]
  16. Ennaciri, Y.; Bettach, M.; El Alaoui-Belghiti, H. Phosphogypsum conversion into calcium fluoride and sodium sulfate. Ann. Chim.-Sci. Matér. 2020, 44, 407–412. [Google Scholar] [CrossRef]
  17. Gawatre, D.W. Advantages of Waste–Phosphogypsum in Concrete. Int. J. Sci. Res. 2013, 2, 2. [Google Scholar] [CrossRef]
  18. Al Qadi, A.N.S.; Khedaywi, T.S.; Haddad, M.A.; AlRababa’ah, O.A. Investigating the effect of olive husk ash on the properties of asphalt concrete mixture. Ann. Chim.-Sci. Matér. 2021, 45, 11–15. [Google Scholar] [CrossRef]
  19. Wang, Z.; Ma, X.; Pan, H.; Yang, X.; Zhang, X.; Lyu, Y.; Liao, W.; Shui, W.; Wu, J.; Xu, M.; et al. Investigating effects of phosphogypsum disposal practices on the environmental performance of phosphate fertilizer production using emergy analysis and carbon emission amounting: A case study from China. J. Clean. Prod. 2023, 409, 137248. [Google Scholar] [CrossRef]
  20. Chen, G.; Yao, N.; Ye, Y.C.; Fu, F.H.; Hu, N.Y.; Zhang, Z. Influence of partial cement substitution by ground blast furnace slag on the mechanical properties of phosphogypsum cemented backfill. Environ. Sci. Pollut. Res. 2023, 30, 102972–102985. [Google Scholar] [CrossRef]
  21. Wei, P.; Zeng, H.; Yang, J.; Zhang, H.; Chu, H.; Zhang, F.; Jiang, L. Preparation and properties of vegetation-compatible concrete using phosphogypsum. Concrete 2024, 1, 169–173. [Google Scholar]
  22. Kuang, Y.; Li, J.; Ding, Q.; Wang, J.; Shi, J.; Xie, P. Influence of cement on foam concrete with high-content phosphogypsum. New Build. Mater. 2023, 50, 145–149. [Google Scholar]
  23. Calderon-Morales, B.R.S.; García-Martínez, A.; Pineda, P.; García-Tenorio, R. Valorization of phosphogypsum in cement-based materials: Limits and potential in eco-efficient construction. J. Build. Eng. 2021, 44, 102506. [Google Scholar] [CrossRef]
  24. Koвaлeв, Я.H.; Яглoв, B.H.; Чиcтoвa, T.A.; Гиpинcкий, B.B. Пpимeнeниe φocφoгипca в дopoжнoм cтpoитeльcтвe. Hayкa Texникa 2021, 6, 493–498. [Google Scholar]
  25. Vybranets, Y.; Vikhot, S. Spatial calculation of metal truss structure in joint work with reinforced concrete slab. In Proceedings of the International Scientific Conference EcoComfort and Current Issues of Civil Engineering, Lviv, Ukraine, 14–16 September 2022; Springer: Berlin/Heidelberg, Germany, 2022. [Google Scholar]
  26. De Seixas Leal, L.A.A.; De Miranda Batista, E.J.S.C. Composite floor system with cold-formed trussed beams and prefabricated concrete slab: Selected and extended contribution of SDSS 2019. Steel Constr. 2020, 13, 12–21. [Google Scholar] [CrossRef]
  27. Gholamhoseni, A. Experimental and finite element study of ultimate strength of continuous composite concrete slabs with steel decking. Int. J. Adv. Struct. Eng. 2018, 10, 85–97. [Google Scholar] [CrossRef]
  28. Zhang, H.; Geng, Y.; Wang, Y.; Wang, Q. Long-term behavior of continuous composite slabs made with 100% fine and coarse recycled aggregate. Eng. Struct. 2020, 212, 110464. [Google Scholar] [CrossRef]
  29. Arrayago, I.; Ferrer, M.; Marimon, F.; Real, E.; Mirambell, E. Experimental investigation on ferritic stainless steel composite slabs. Eng. Struct. 2018, 174, 538–547. [Google Scholar] [CrossRef]
  30. Francavilla, B.; Latour, M.; Rizzano, G. Experimental and numerical analyses of steel-concrete composite floors. Open Civ. Eng. J. 2020, 14, 163. [Google Scholar] [CrossRef]
  31. Uy, B.; Bradford, M.A. Composite action of structural steel beams and precast concrete slabs for the flexural strength limit state. Aust. J. Struct. Eng. 2007, 7, 123–133. [Google Scholar] [CrossRef]
  32. Jin, X. Performance optimization of recycled aggregate concrete with basalt fibers using Box-Behnken response surface methodology. Brick Tile 2024, 4, 39–43. [Google Scholar] [CrossRef]
  33. Shen, W.; Liu, Y.; Wu, M.; Zhang, D.; Du, X.; Zhao, D.; Xu, G.; Zhang, B.; Xiong, X. Ecological carbonated steel slag pervious concrete prepared as a key material of sponge city. J. Clean. Prod. 2020, 256, 120244. [Google Scholar] [CrossRef]
  34. Sha, L.; Zhang, A. Static Load Test and Finite Element Analysis of Phosphogypsum Concrete Composite Slabs. Buildings 2025, 15, 1122. [Google Scholar] [CrossRef]
Figure 1. Cross-sectional dimensions and reinforcement details.
Infrastructures 10 00250 g001
Figure 2. Strain gauge location schematic.
Infrastructures 10 00250 g002
Figure 3. Schematic diagram of loading device.
Infrastructures 10 00250 g003
Figure 4. Images of the final damage forms of the specimens.
Infrastructures 10 00250 g004
Figure 5. SEM micrograph of crack propagation and failure.
Infrastructures 10 00250 g005
Figure 6. Load deflection curves.
Infrastructures 10 00250 g006
Figure 7. Load strain curves of top chord reinforcement.
Infrastructures 10 00250 g007aInfrastructures 10 00250 g007b
Figure 8. Load strain curves of lower chord reinforcement.
Infrastructures 10 00250 g008
Figure 9. Model of a 90 mm high steel truss.
Infrastructures 10 00250 g009
Figure 10. Model of a 90 mm high steel truss with a steel plate.
Infrastructures 10 00250 g010
Figure 11. Completed model of assembled floor slab with steel plate at bottom.
Infrastructures 10 00250 g011
Figure 12. Mesh delineation of steel joist and bottom steel plate.
Infrastructures 10 00250 g012
Figure 13. Meshing diagram of the assembled model.
Infrastructures 10 00250 g013
Figure 14. Span-deflection measured curves and skeleton curves.
Infrastructures 10 00250 g014
Figure 15. Finite element simulation results.
Infrastructures 10 00250 g015
Table 1. Design parameters of each slab.
Slab NumberConcrete GradeTruss Height/mmTop Chord, Web, Bottom Chord Diameter/mmPhosphogypsum DosageLoading Method
X1C409010, 5, 100Monotonic loading
X2C409010, 5, 100Repeated loading
Y1C409010, 5, 102%Monotonic loading
Y2C409010, 5, 102%Repeated loading
Table 2. Actual measured values of characteristic loads on each plate.
Plate
Number
Cracking LoadNormal Use
Limit Load
Yield Load Ultimate Load
F cr ( k N ) q cr ( k N · m ) F 1 / 200 ( k N ) q 1 / 200 ( k N · m ) F y ( k N ) q y ( k N · m ) F u ( k N ) q u ( k N · m )
X123.5418.6870.2655.7695.2075.56118.4594.01
X224.9619.8180.0863.5694.5775.06119.5894.90
Y125.4020.1677.0861.1794.7875.22123.3097.86
Y224.8619.7377.2261.2997.1177.07121.8196.67
Table 3. Corresponding deflection and equivalent stiffness of each plate’s characteristic load.
Plate NumberCracking Load (kN/mm)Normal Use Limit Load (kN/mm)Yield Load (kN/mm)Ultimate Load (kN/mm)
FlexureStiffnessFlexureStiffnessFlexureStiffnessFlexureStiffness
X11.7113.7710.506.6915.446.1742.002.82
X21.6315.3110.507.6312.977.2942.002.85
Y11.6915.0310.507.3414.196.6842.002.94
Y21.3917.8810.507.3513.847.0242.002.90
Table 4. Comparison of test and simulated values of characteristic loads for each plate.
Plate NumberCracking Load (kN)Use Limit Load (kN)Yield Load (kN)Ultimate Load (kN)
Test ValueSimulated ValueErrorTest ValueSimulated ValueErrorTest ValueSimulated ValueErrorTest ValueSimulated ValueError
X123.5424.785.2770.2676.809.3195.20107.9413.38118.45115.582.42
X224.9628.3213.4680.0882.132.6394.57101.457.27119.58116.612.48
Y125.4028.1710.9077.0879.653.3394.78112.4818.67123.30118.753.69
Y224.8628.5614.8877.2283.357.9397.11105.338.46121.81118.252.92
Table 5. Comparison of crack deflection and yield deflection values of each plate.
Plate NumberCracking Load Deflection (mm)Yield Load Deflection (mm)
Test ValueSimulated ValueErrorTest ValueSimulated ValueError
X11.711.578.1915.4417.0810.62
X21.631.746.7512.9715.4118.81
Y11.691.764.1414.1917.1320.71
Y21.391.465.0413.8415.6813.29
Table 6. Comparison of the equivalent stiffness values of each plate (kN/mm).
Plate NumberCracking Load StiffnessService Limit Load StiffnessYield Load StiffnessUltimate Load Stiffness
Test ValueSimulated ValueErrorTest ValueSimulated ValueErrorTest ValueSimulated ValueErrorTest ValueSimulated ValueError
X113.7715.7814.626.697.319.336.176.322.432.822.752.41
Y26.467.3012.983.593.620.943.293.454.811.381.333.52
Disclaimer/Publisher’s Note: The statements, opinions and data contained in all publications are solely those of the individual author(s) and contributor(s) and not of MDPI and/or the editor(s). MDPI and/or the editor(s) disclaim responsibility for any injury to people or property resulting from any ideas, methods, instructions or products referred to in the content.