Article

Mechanical Response Mechanism and Acoustic Emission Evolution Characteristics of Deep Porous Sandstone

1
Key Laboratory of Safe and Effective Coal Mining, Anhui University of Science and Technology, Ministry of Education of China, Huainan 232001, China
2
State Key Laboratory of Deep Coal Mining Safety and Environmental Protection, Anhui University of Science and Technology, Huainan 232001, China
3
School of Civil and Transportation Engineering, Ningbo University of Technology, Ningbo 315211, China
*
Author to whom correspondence should be addressed.
Infrastructures 2025, 10(9), 236; https://doi.org/10.3390/infrastructures10090236
Submission received: 27 July 2025 / Revised: 28 August 2025 / Accepted: 5 September 2025 / Published: 9 September 2025

Abstract

To investigate the failure mechanisms of surrounding rock in deep mine tunnels and its spatio-temporal evolution patterns, a true triaxial disturbance unloading rock testing system, the acoustic emission (AE) system, and the miniature camera monitoring system were employed to conduct true triaxial graded loading tests on sandstone containing circular holes at burial depths of 800 m, 1000 m, 1200 m, 1400 m, and 1600 m. The study investigated the patterns of mechanical properties and failure characteristics of porous sandstone at different burial depths. The results showed that the peak strength of the specimens increased quadratically with increasing burial depth; the failure process of porous sandstone could be divided into four stages: the calm period, the particle ejection period, the stable failure period, and the complete collapse period; as burial depth increases, the failure mode transitions from a composite tensile–shear crack type to a shear crack-dominated type, with the ratio of shear cracks to tensile cracks exhibiting quadratic growth and reduction, respectively; the particle ejection stage is characterised by low-frequency, low-amplitude signals, corresponding to the microcrack initiation stage, while the stable failure stage exhibits a sharp increase in low-frequency, high-amplitude signals, reflecting macrocrack propagation characteristics, with the spatial evolution of their locations ultimately forming a penetrating oblique shear failure zone; and peak stress analysis indicates that as burial depth increases, peak stress during the particle ejection phase first increases and then decreases, while peak stress during the stable failure phase first decreases and then stabilises. The duration of the pre-instability calm phase shows a significant negative correlation with burial depth. The research findings provide a theoretical basis for controlling tunnel rock mass stability and disaster warning.

1. Introduction

As the depth of mineral resource extraction continues to increase, the issue of controlling the stability of tunnel surrounding rock in deep high-stress environments has become a critical factor constraining mine safety production [1,2,3]. Engineering practice has shown that deep high-stress tunnels commonly exhibit severe damage and difficulties in support, significantly affecting the stability of underground rock masses [4,5,6]. Therefore, systematically studying the failure mechanisms and spatial evolution patterns of tunnel rock masses under deep high-stress conditions is a crucial theoretical foundation for optimising support design and ensuring long-term tunnel stability [7,8].
Numerous scholars have conducted extensive experimental studies on rock mechanics to investigate the failure characteristics and stability control of surrounding rock in deep high-stress tunnels [9,10]. Du et al. [11] used a testing machine to conduct uniaxial compression tests on sandstone specimens with prefabricated elliptical holes, investigating the influence of the angle between the hole’s major axis and the axial load on the specimen’s strength and deformation characteristics. Zhu et al. [12] conducted experiments on precast double circular hole plate-shaped sandstone specimens using an indoor uniaxial compression testing machine to investigate the influence of hole centre distance and inclination angle on sandstone strength, deformation characteristics, and failure evolution processes. Dong et al. [13] combined AE and digital image correlation (DIC) techniques to simultaneously analyse changes in AE parameters and deformation evolution characteristics on the specimen surface, studying the damage and fracture characteristics of granite specimens containing circular holes and cracks under uniaxial compression. Li et al. [14] conducted impact compression tests on plate-shaped specimens with circular holes at different inclination angles to study the mechanical properties, crack propagation patterns, and final failure modes of pre-drilled layered sandstone. Zhao et al. [15] designed four types of hole patterns in red sandstone plate specimens and conducted uniaxial compression tests to investigate the effects of hole shape on rock mechanical properties and the evolution characteristics of fracture damage. Liu et al. [16] conducted comprehensive dynamic and static impact tests on shale specimens with circular holes at different bedding angles using an improved split Hopkinson pressure bar device, and recorded the damage process using digital image correlation (DIC) technology. Du et al. [17] designed a novel granite cube specimen with inclined cylindrical holes and conducted a series of biaxial compression tests. They combined AE and digital image correlation (DIC) techniques with discrete element method (DEM) numerical simulations to study the strain field around the holes and the mechanical response characteristics of the specimens. Shi et al. [18] conducted biaxial compression tests on four types of rock specimens to investigate the relationship between the suddenness amplitude of strain and the rock’s inherent suddenness energy. Miao et al. [19] systematically studied the mechanical parameters, stress–strain curves, failure modes, and intermediate principal stress effects of sandstone based on biaxial compression tests on sandstone specimens with holes. Bi et al. [20] conducted biaxial compression tests on different types of rocks containing prefabricated arched holes, investigating the failure and crack propagation characteristics of the specimens. Reza Taherdangkoo [21] conducted biaxial loading tests using prefabricated shale specimens containing circular holes, investigating the failure characteristics under different combinations of confining pressure and bedding plane inclination. Wei et al. [22] conducted biaxial loading tests on rock specimens with circular holes combined with AE monitoring to study the AE information before rock failure, and compared and analysed the changes in different parameters and precursor characteristics. Yang [23] conducted a series of conventional triaxial compression tests on hollow sandstone specimens with different pore diameters to study the effects of pore diameter and confining pressure on the peak strength and failure characteristics of hollow sandstone. Wang et al. [24] conducted triaxial compression tests on sandstone specimens with circular holes under different confining pressures, combined with ABAQUS simulation, to explain the spalling around the holes and the damage to the specimens. Zhao et al. [25] used a true triaxial testing machine to conduct three main stress cycle loading and unloading tests, revealing the effects of cyclic loading and unloading on the main stress on energy accumulation and dissipation in sandstone. Liu et al. [26] conducted rockburst simulation tests on precast circular-hole granite specimens under different lateral loads using a true triaxial testing apparatus, investigating the failure modes and damage evolution processes of the specimens.
Although previous studies have made significant advancements in the field of rock mechanics concerning precast hole specimens, it is important to recognise that much of the existing research focuses on uniaxial and biaxial loading tests. Compared to Zhao et al.’s cyclic loading and unloading studies, which focus on the macroscopic behaviour of energy rather than the progressive failure process of rock bodies with holes under complex stress paths, unlike Liu et al.’s rockburst simulation of granite, many tunnel rock masses in actual engineering projects are sedimentary rocks such as sandstone, and their excavation process is more akin to triaxial loading. There remains a theoretical gap regarding the failure mechanisms of precast circular-hole sandstone under real triaxial high-stress conditions. To address this gap, the current study utilises a true triaxial disturbance unloading rock testing system, an AE system, and a miniature camera to conduct simulated failure tests on deep, high-stress tunnel surrounding rock. This setup allows for the recording of the entire process, from energy accumulation to hole collapse. The study analyses the failure patterns of sandstone specimens at varying burial depths and systematically examines the characteristics of AE signals throughout the failure process. The findings of this research can inform safety, stability, and support design considerations for deep tunnel rock masses.

2. Experimental Procedures

2.1. Specimen Preparation

By the standards of the International Society for Rock Mechanics (ISRM) [27], the experimental materials used in this study were uniform sandstone samples obtained from deep core drilling at a certain mine, ensuring that burial depth was the sole variable. In the laboratory, these samples were processed and prepared into standard cubic specimens (side length 100 mm) with circular through-holes (Φ40 mm), with dimensional deviations, end face parallelism, and perpendicularity all meeting the standard requirements, as shown in Figure 1.
Before conducting the experiments, basic physical parameters of the sandstone material were obtained through uniaxial compression and Brazilian splitting tests on the sandstone specimens, as shown in Table 1.

2.2. Testing System and Experimental Scheme

The experimental system employed consists of a true triaxial disturbance unloading rock testing system, an AE system, and a miniature camera, all developed independently by Anhui University of Science and Technology. The true triaxial testing apparatus can apply a maximum load of 5000 kN in the vertical direction (Z-axis) and a maximum load of 3000 kN in the horizontal directions (X and Y-axes), enabling independent loading in three directions and six faces. The acoustic emission monitoring system employs the Soft Island DS5 acoustic emission signal acquisition system, in conjunction with six acoustic emission probes To minimise noise interference, the threshold value is set to 40 dB, the sound emission sampling frequency range is set to 1 kHz to 1 MHz, and a bandpass filter with a passband of 20 kHz to 400 kHz is also set, performing real-time acquisition of parameters such as AE events, energy, and frequency during the test process. The miniature camera records the entire process from crack initiation to macroscopic failure within the specimen’s pore system. The test site is shown in Figure 2a.
The test was conducted under load control with a loading rate of 0.1 MPa/s. The specific loading stress path was as follows: when loading σ1, σ2, and σ3 simultaneously to the set lateral pressure value, σ2 and σ3 were kept constant, and σ1 continued to be loaded until the specimen underwent macroscopic failure, at which point the test was stopped. The loading path is shown in Figure 2b.
In situ stress field monitoring data from deep rock masses indicate that as burial depth increases, in situ stress exhibits significant three-dimensional non-uniform distribution characteristics (Figure 3), and σ1, σ2, and σ3 often increase within a certain range [28]. To accurately characterise the failure evolution rules of deep tunnel surrounding rock under non-uniform stress fields, this study employs a true triaxial servo-loading test system to achieve three-directional independent loading.
True triaxial loading tests were conducted at five different burial depths: 800 m, 1000 m, 1200 m, 1400 m, and 1600 m. Calculations were performed using the regression equation for ground stress established based on a large amount of field measurement data [29], with the calculation formula shown in Equation (1). Each set of variables was tested 3–5 times, and typical results were selected for analysis. The grouping is shown in Table 2.
σ 1 = 0.027 D σ 2 = 0.0233 D + 4.665 σ 3 = 0.0162 D + 2.100
In the formula, D represents the burial depth of the rock mass, σ1, σ2, and σ3 represent the vertical stress, maximum horizontal principal stress, and minimum horizontal principal stress, respectively.

3. Analysis of Test Results

3.1. Mechanical Characteristics Analysis

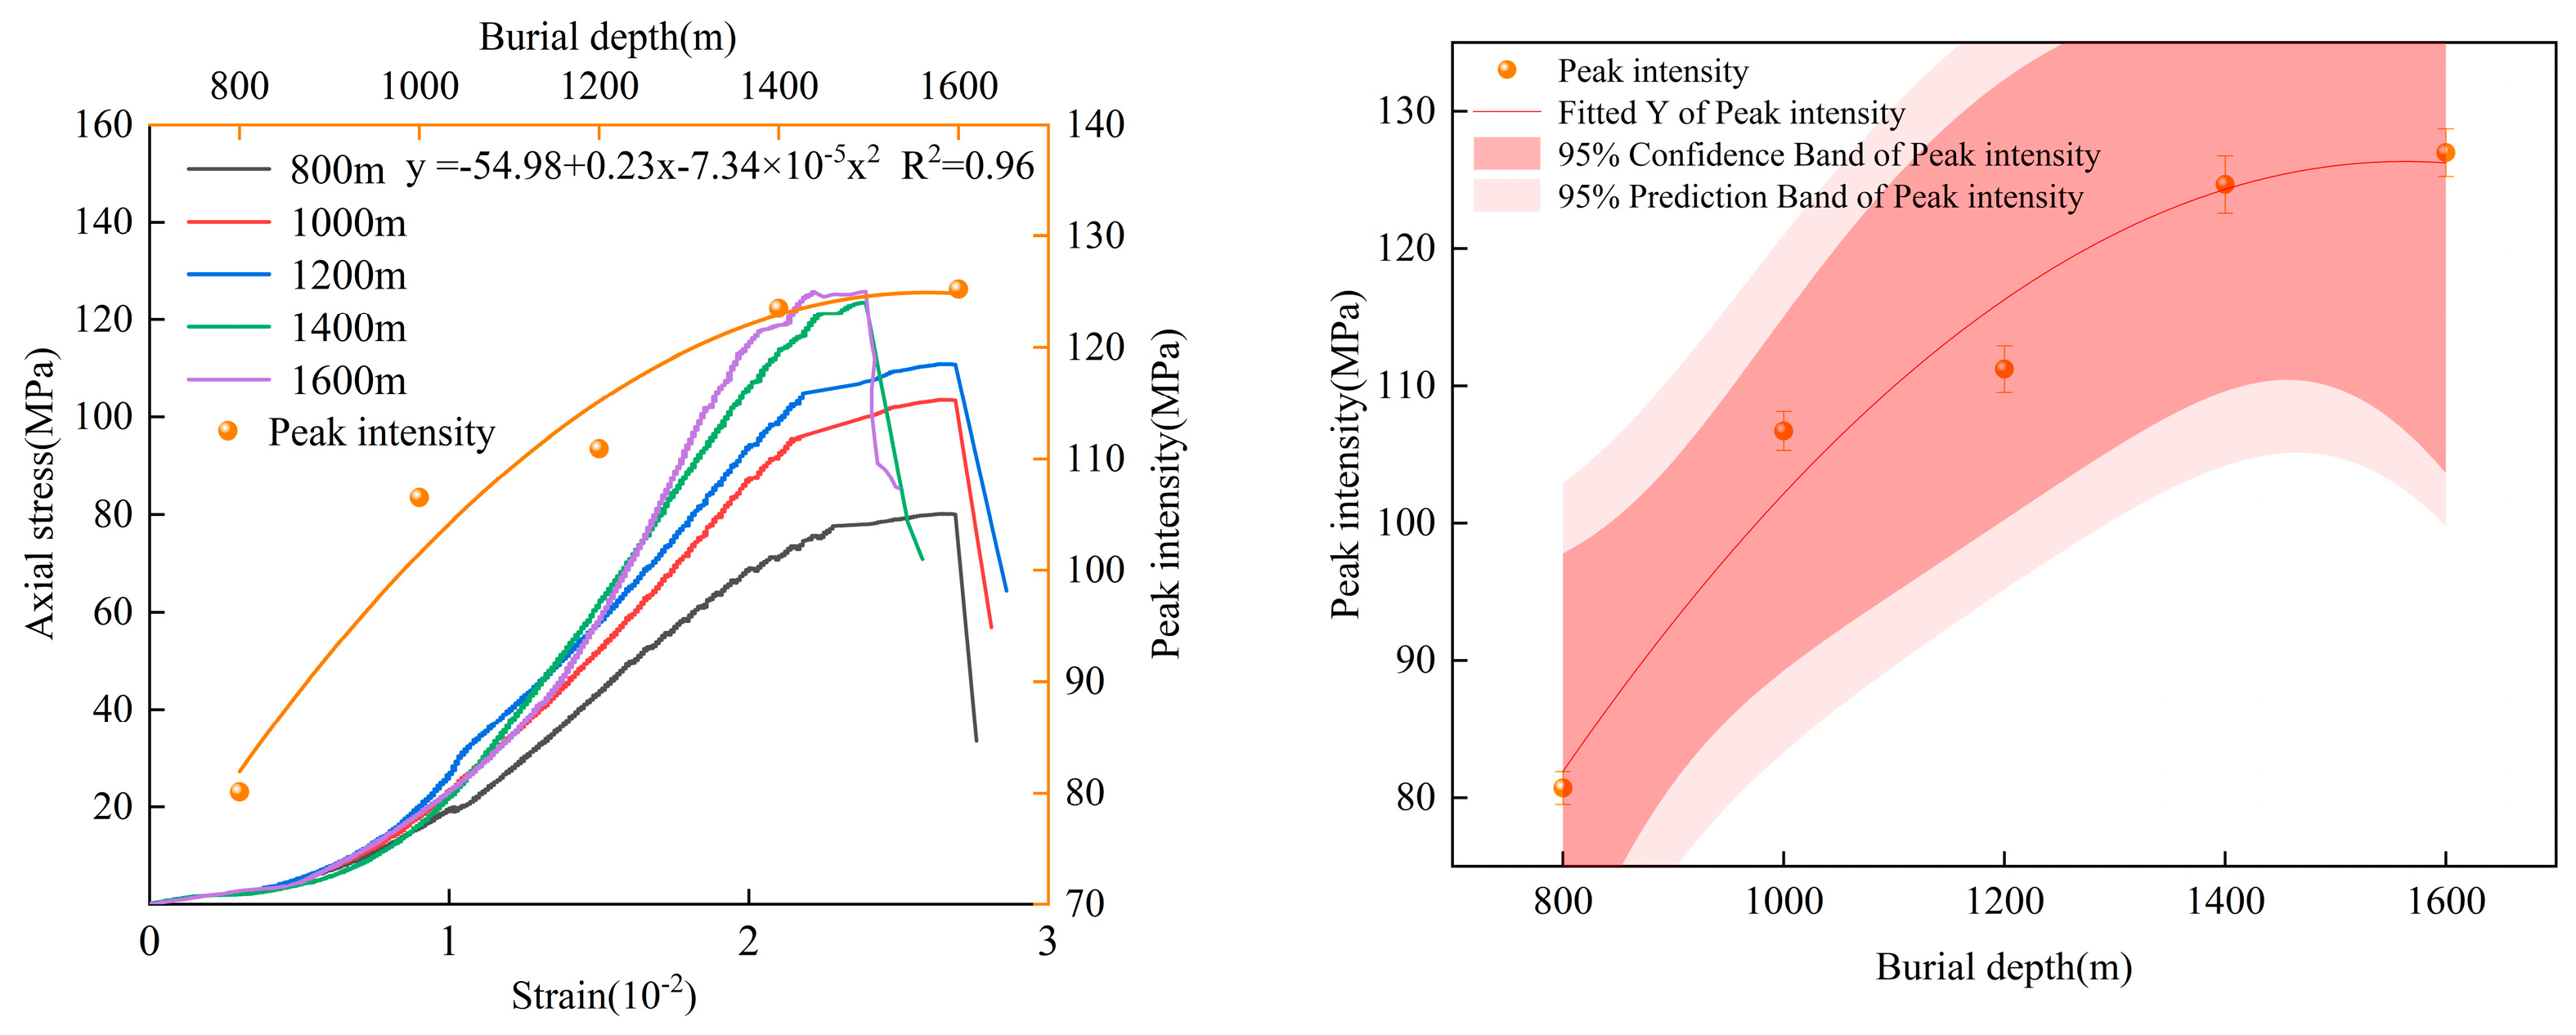
In experiments involving porous sandstone, the strength and mechanical properties of simulated tunnel structures exhibit different patterns of change when the specimens are buried at varying depths, as shown in Figure 4, which presents the axial stress–strain curves of porous sandstone at different burial depths.
From the stress–strain curves, it can be concluded that under different stress conditions, the sandstone specimens exhibit yield and failure stages [30]. When the stress reaches its peak, the presence of pores provides free space within the pores, allowing the rock mass to deform more easily during loading and leading to a reduction in rock strength [31]. In all five burial depth conditions, the specimens experienced significant deformation before and after the peak stress. Under stress at burial depths of 800 m, 1000 m, 1200 m, 1400 m, and 1600 m, the corresponding peak strengths were 80.13 MPa, 103.53 MPa, 110.93 MPa, 123.54 MPa, and 125.73 MPa, respectively. Within the test range, the peak strength of sandstone specimens increases quadratically with increasing burial depth.

3.2. Analysis of Specimen Failure Characteristics

As shown in Figure 5, the overall failure mode of the sandstone specimen exhibits ‘V’-shaped failure pits in the central regions on both sides of the holes when the specimen is at different burial depths. The specimen undergoes oblique shear failure along the concave portions of the ‘V’-shaped failure pits, resulting in expansion deformation in the σ3 direction. The number of rock fragments collapsing within the holes increases with increasing burial depth, indicating that the macro-fracture scale expands with increasing burial depth.
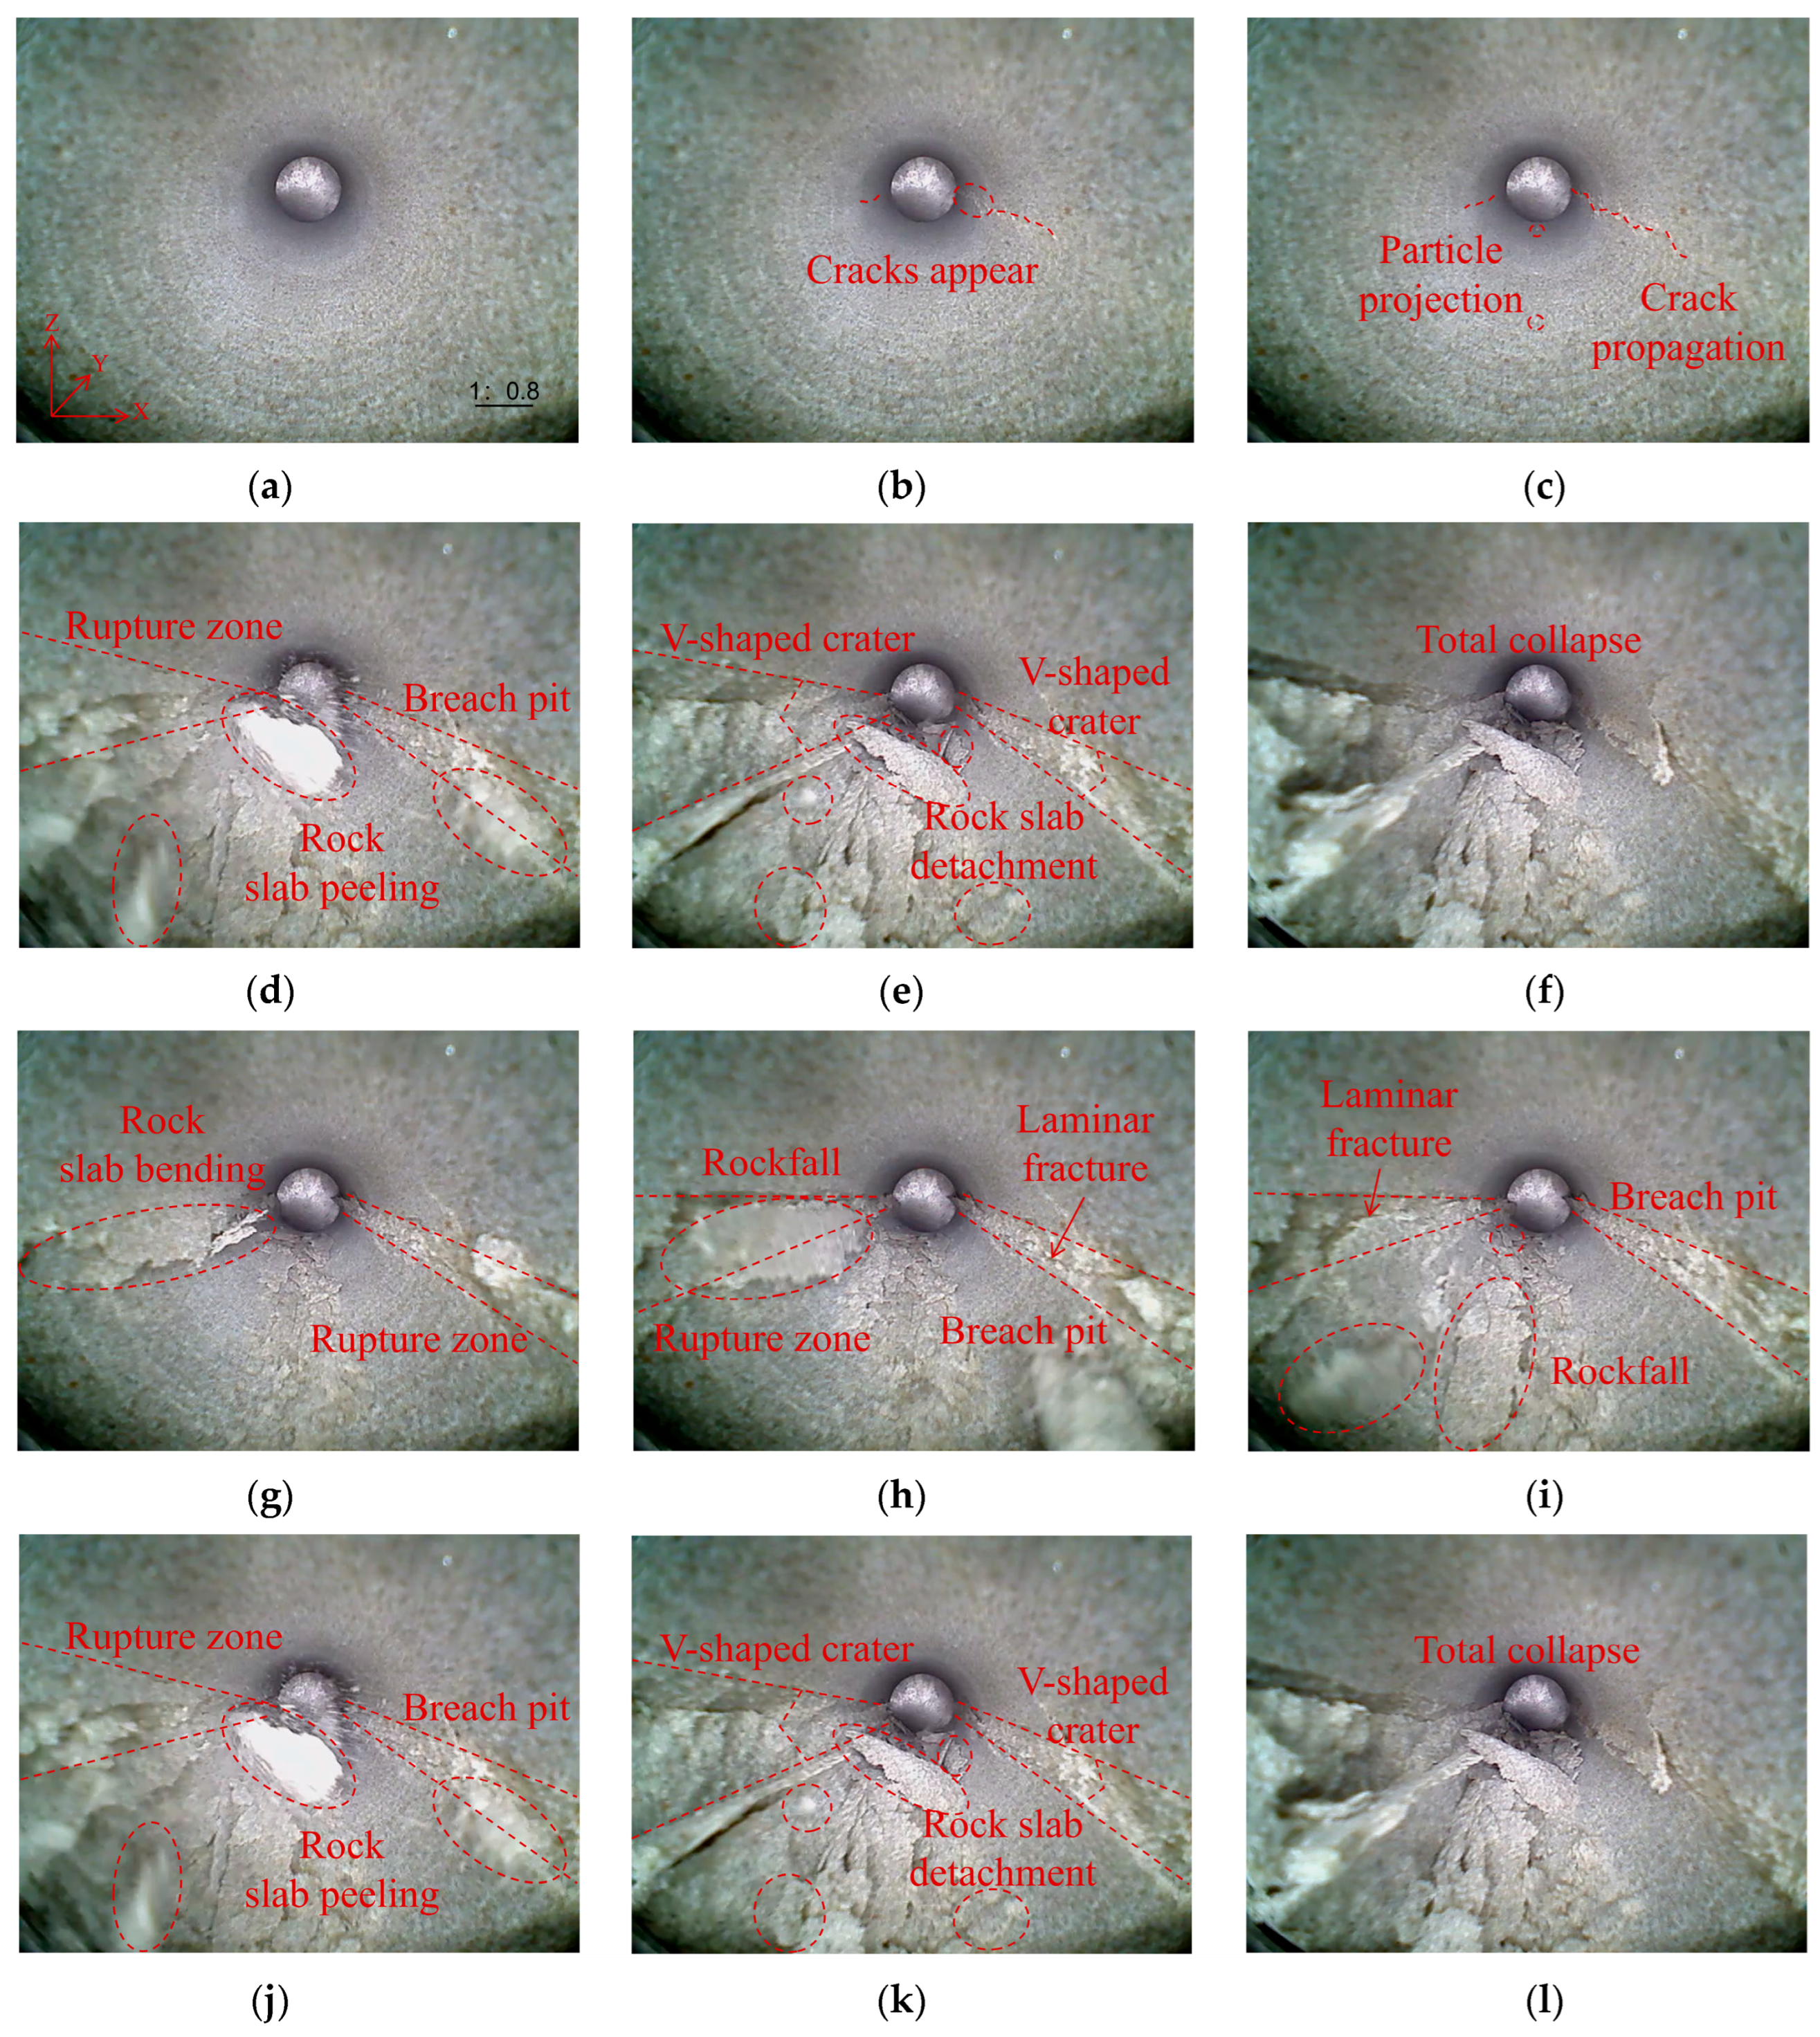
The entire process of the specimen’s cavities collapsing from particle ejection to complete collapse was fully recorded using a miniature camera. In this study, using the S-5 specimen as an example, macro-level failure characteristics of the cavities were extracted from the video data, as shown in Figure 6.
As shown in Figure 6, for an extended period following the application of the initial load, the specimen remains in a state of gradual compaction, with no significant deformation of the hole walls and the hole remaining stable, as illustrated in Figure 6a. When σ1 reaches 70.35 MPa, intermittent particle ejection begins on the hole surface, and the first crack appears on the right-hand hole wall, as shown in Figure 6b. When σ1 is loaded to 80.73 MPa, small particle ejection occurs on the right wall, and the crack on the right wall of the hole further expands, as shown in Figure 6c. When σ1 increases to 91.13 MPa, a new branch of the crack on the right wall of the hole develops, and the crack continues to expand along the axial direction of the hole under the load, as shown in Figure 6d. When σ1 reached 96.39 MPa, the crack propagation range on the right hole wall continued to increase, and the damage area on the right wall gradually penetrated along the hole axis. During the same period, no obvious macroscopic damage was observed on the left hole wall, as shown in Figure 6e,f.
The moment when significant rock plate buckling failure occurred on the left tunnel wall was at 1603.2 s. At this point, the cracks on the right tunnel wall had evolved into an axial failure zone; however, due to the cohesive strength of the specimen, the large-sized rock fragments did not completely detach, as shown in Figure 6g. When σ1 reached 114.16 MPa, the rock slab on the right tunnel wall suddenly slid down, simultaneously forming a failure pit. A failure zone appeared on the left tunnel wall, accompanied by the detachment of large-sized rock fragments, as shown in Figure 6h. When σ1 was loaded to 119.06 MPa, the right-hand tunnel wall and left-hand tunnel wall successively underwent severe plate-fracture failure, exhibiting distinct layer-fracture characteristics, with the fractured rock fragments on both sides suddenly becoming unstable and sliding off, as shown in Figure 6i.
When the test reached 1907.5 s, severe damage occurred inside the hole in the test specimen, with rock plates continuously peeling off, rock fragments sliding down, and rock debris being ejected from both sides of the hole. As the test continued to 1920.3 s, this severe damage intensified further, forming a distinct ‘V’-shaped damage pit, accompanied by a slight noise, as shown in Figure 6j,k. When the test reached 1932.3 s, the rock blocks near the ‘V’-shaped pits on both sides of the hole began to fold inward and protrude. After the hole walls failed, the hole structure became unstable and collapsed. The failed specimen accumulated a large amount of flaky rock fragments at the bottom of the hole, as shown in Figure 6l.
As can be seen from the above, during the initial stress loading stage, the internal structure of the sandstone specimen is in a state of gradual compaction, with no obvious damage observed within the pores. During the σ1 loading stage, the overall structure remains stable, with small particles being ejected and microcracks forming. As σ1 loading continues to increase, various macro-scale damage phenomena occur successively within the pores, specifically manifested as rock slab buckling, rock flake detachment, layer cracking, damage penetration, and the ejection of rock debris, as well as instability and collapse. Therefore, from a macro-scale perspective, the pore damage process of sandstone specimens can be divided into four stages: the calm stage, the particle ejection stage, the stable damage stage, and the complete collapse stage.
It is worth noting that during loading, the loads on both sides of the hole are the same, and the failure conditions should also be the same. However, due to factors such as the anisotropy of natural rock and differences in processing accuracy of the test specimens, it is impossible to achieve ideal conditions during the test. This is similar to the hole wall failure conditions observed in the experiments conducted by Gong et al. [32].
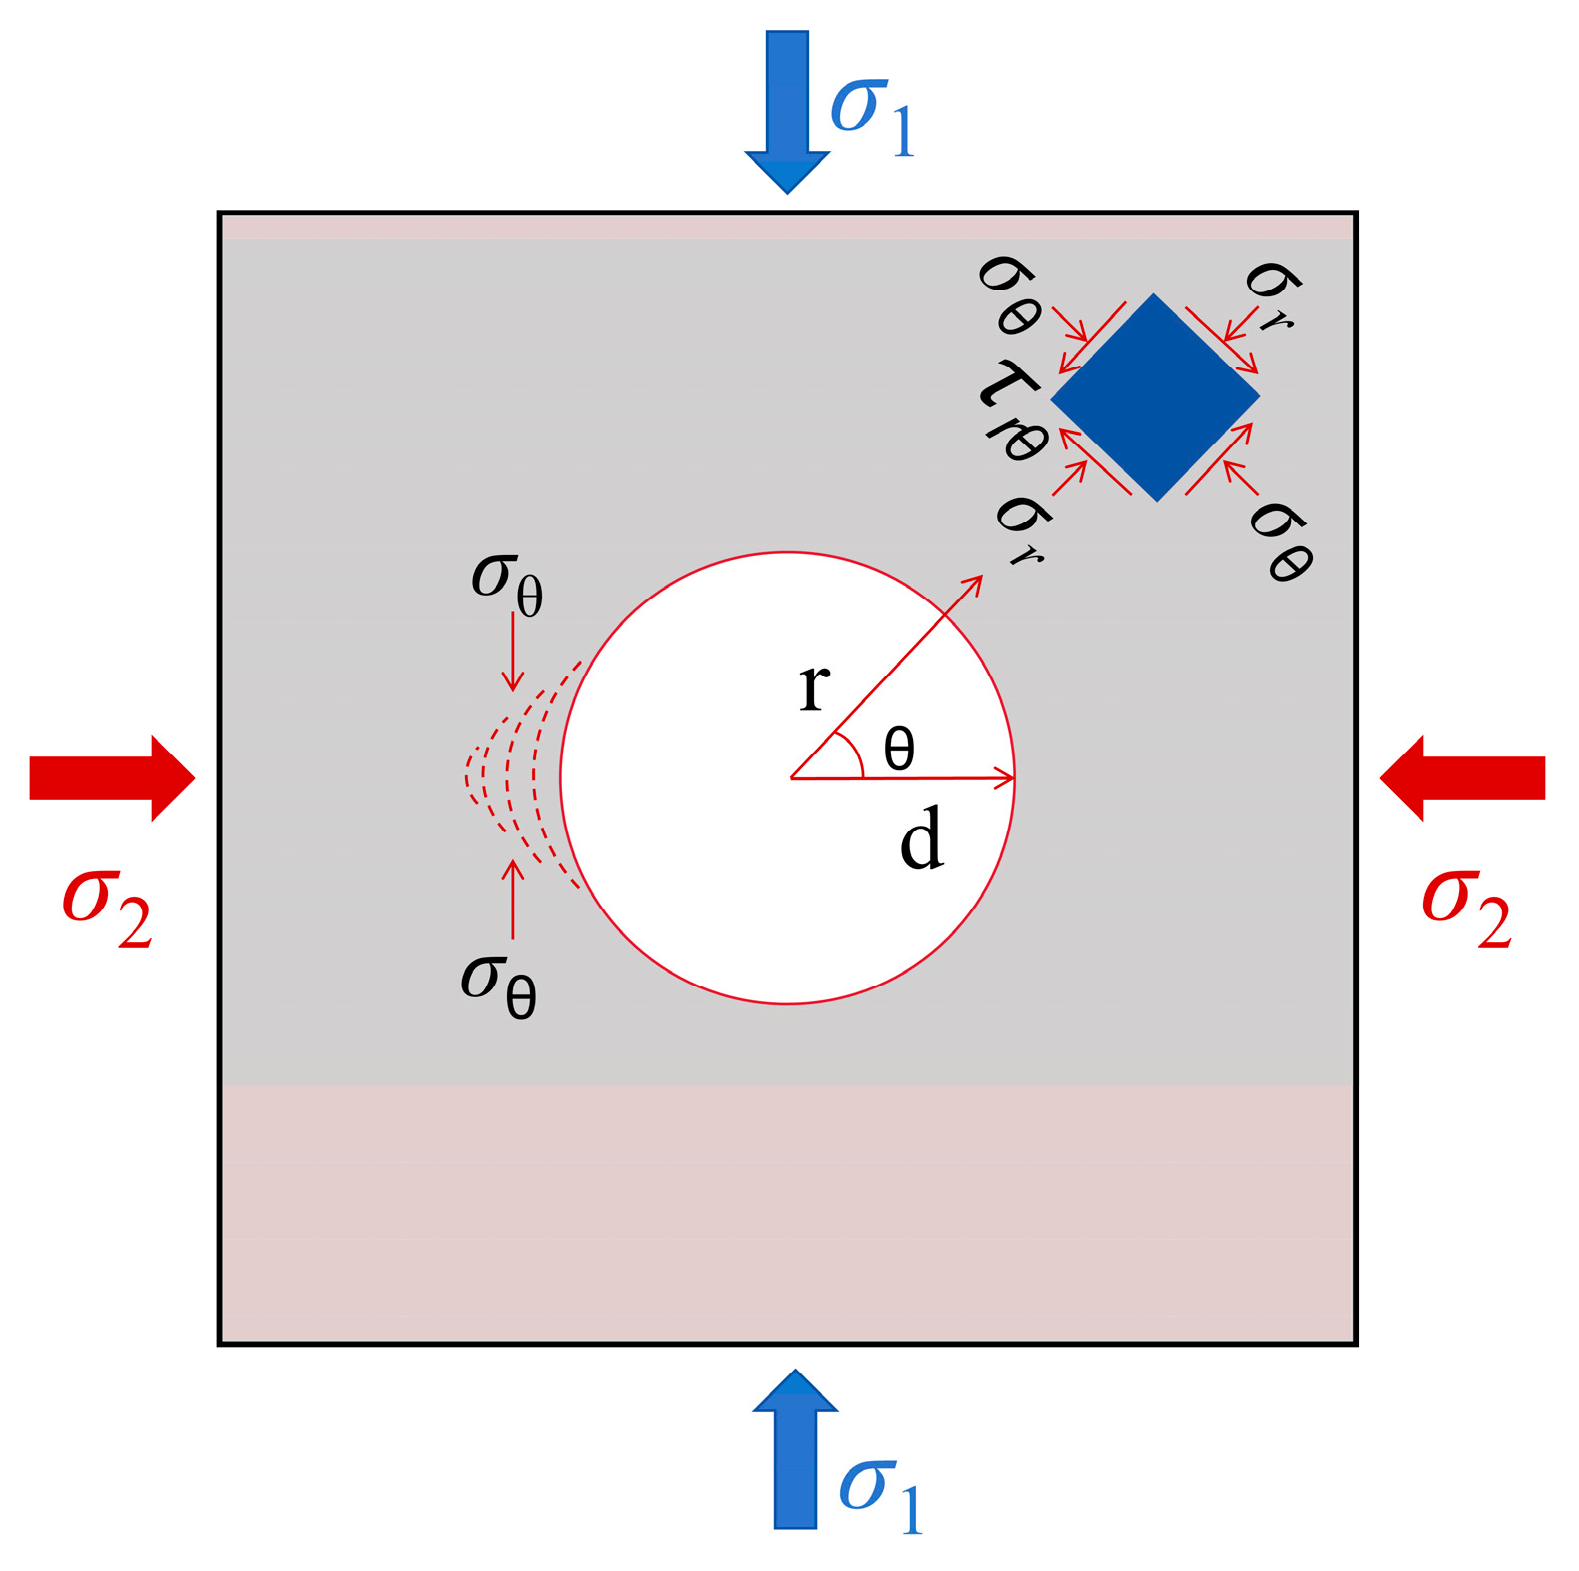
To further analyse the formation mechanism of the ‘V’-shaped failure pit, the stress and deformation of the circular hole are simplified into a plane strain problem, as shown in Figure 7. The stress at any point can be calculated using Equation (2) [33]. In the figure, σr, σϴ, and τ represent the radial stress, tangential stress, and shear stress of the hole, respectively; d is the radius of the circular hole; r is the distance from the rock unit to the centre of the circular hole; and ϴ is the angle between the rock unit and the horizontal direction.
σ r = σ 1 + σ 2 2 1 d 2 r 2 + σ 2 σ 1 2 1 4 d 2 r 2 + 3 d 4 r 4 cos 2 θ σ θ = σ 1 + σ 2 2 1 + d 2 r 2 σ 2 σ 1 2 1 + 3 d 4 r 4 cos 2 θ τ r θ = σ 1 σ 2 2 1 + 2 d 2 r 2 3 d 4 r 4 sin 2 θ
Under structural stress, as shown in Equation (2), the maximum shear stress in the hole is located at the midpoint between the two sides, where r = d, ϴ = 0°, and σϴmax = 3σ1 − σ2. Therefore, the stress concentration is greatest at the midpoints on both sides of the hole, leading to plate cracking and buckling failure of the surrounding rock.

3.3. RA-AF and Sandstone Fracture Characteristics

By analysing the tensor of acoustic emission signals, acoustic emission parameters (RA and AF) can be obtained, which effectively reflect the type of cracks in rock failure. Related scholars use two indices from the acoustic emission characteristic parameters—RA (rise time/amplitude) and AF (ringing count/duration)—to distinguish between tensile cracks and shear cracks. A low AF value/high RA value corresponds to the formation and development of shear cracks, while a high AF value/low RA value represents the formation and development of tensile cracks [34].
Bi [35] et al. analysed the acoustic emission data from sandstone fracture tests using the K-means algorithm and obtained the proportional relationship between RA and AF during sandstone fracture. They plotted the RA-AF point density diagram under different stress conditions, as shown in Figure 8, and performed a statistical analysis of the fracture distribution under different stress conditions based on the proportional relationship between RA and AF during sandstone fracturing, with Q = 380.
Analysis of the distribution characteristics of RA-AF reveals that, under different burial depths in the σ1 loading test, the AF of sandstone specimens primarily distributes between 0 and 200 kHz, while RA primarily distributes between 0 and 0.05 ms/V. Data points near the origin of the coordinate system are densely distributed, whereas those farther away are sparsely distributed, forming an overall distribution pattern resembling a triangle. As burial depth increases, the overall data density of RA-AF in sandstone shows an increasing trend. At a burial depth of 800 m, the data density is minimal, and at 1600 m, it reaches its maximum. This increase is primarily driven by an increase in shear cracks, with a relatively minor increase in tensile cracks. This indicates that under high-stress conditions, the failure of porous sandstone specimens is primarily shear. As burial depth increases, the failure mode of sandstone specimens transitions from a mixture of tensile and shear failure to nearly pure shear failure. This aligns with the pore failure results recorded by the microcamera in Figure 5 and the overall macroscopic failure morphology of the sandstone specimens in Figure 6.
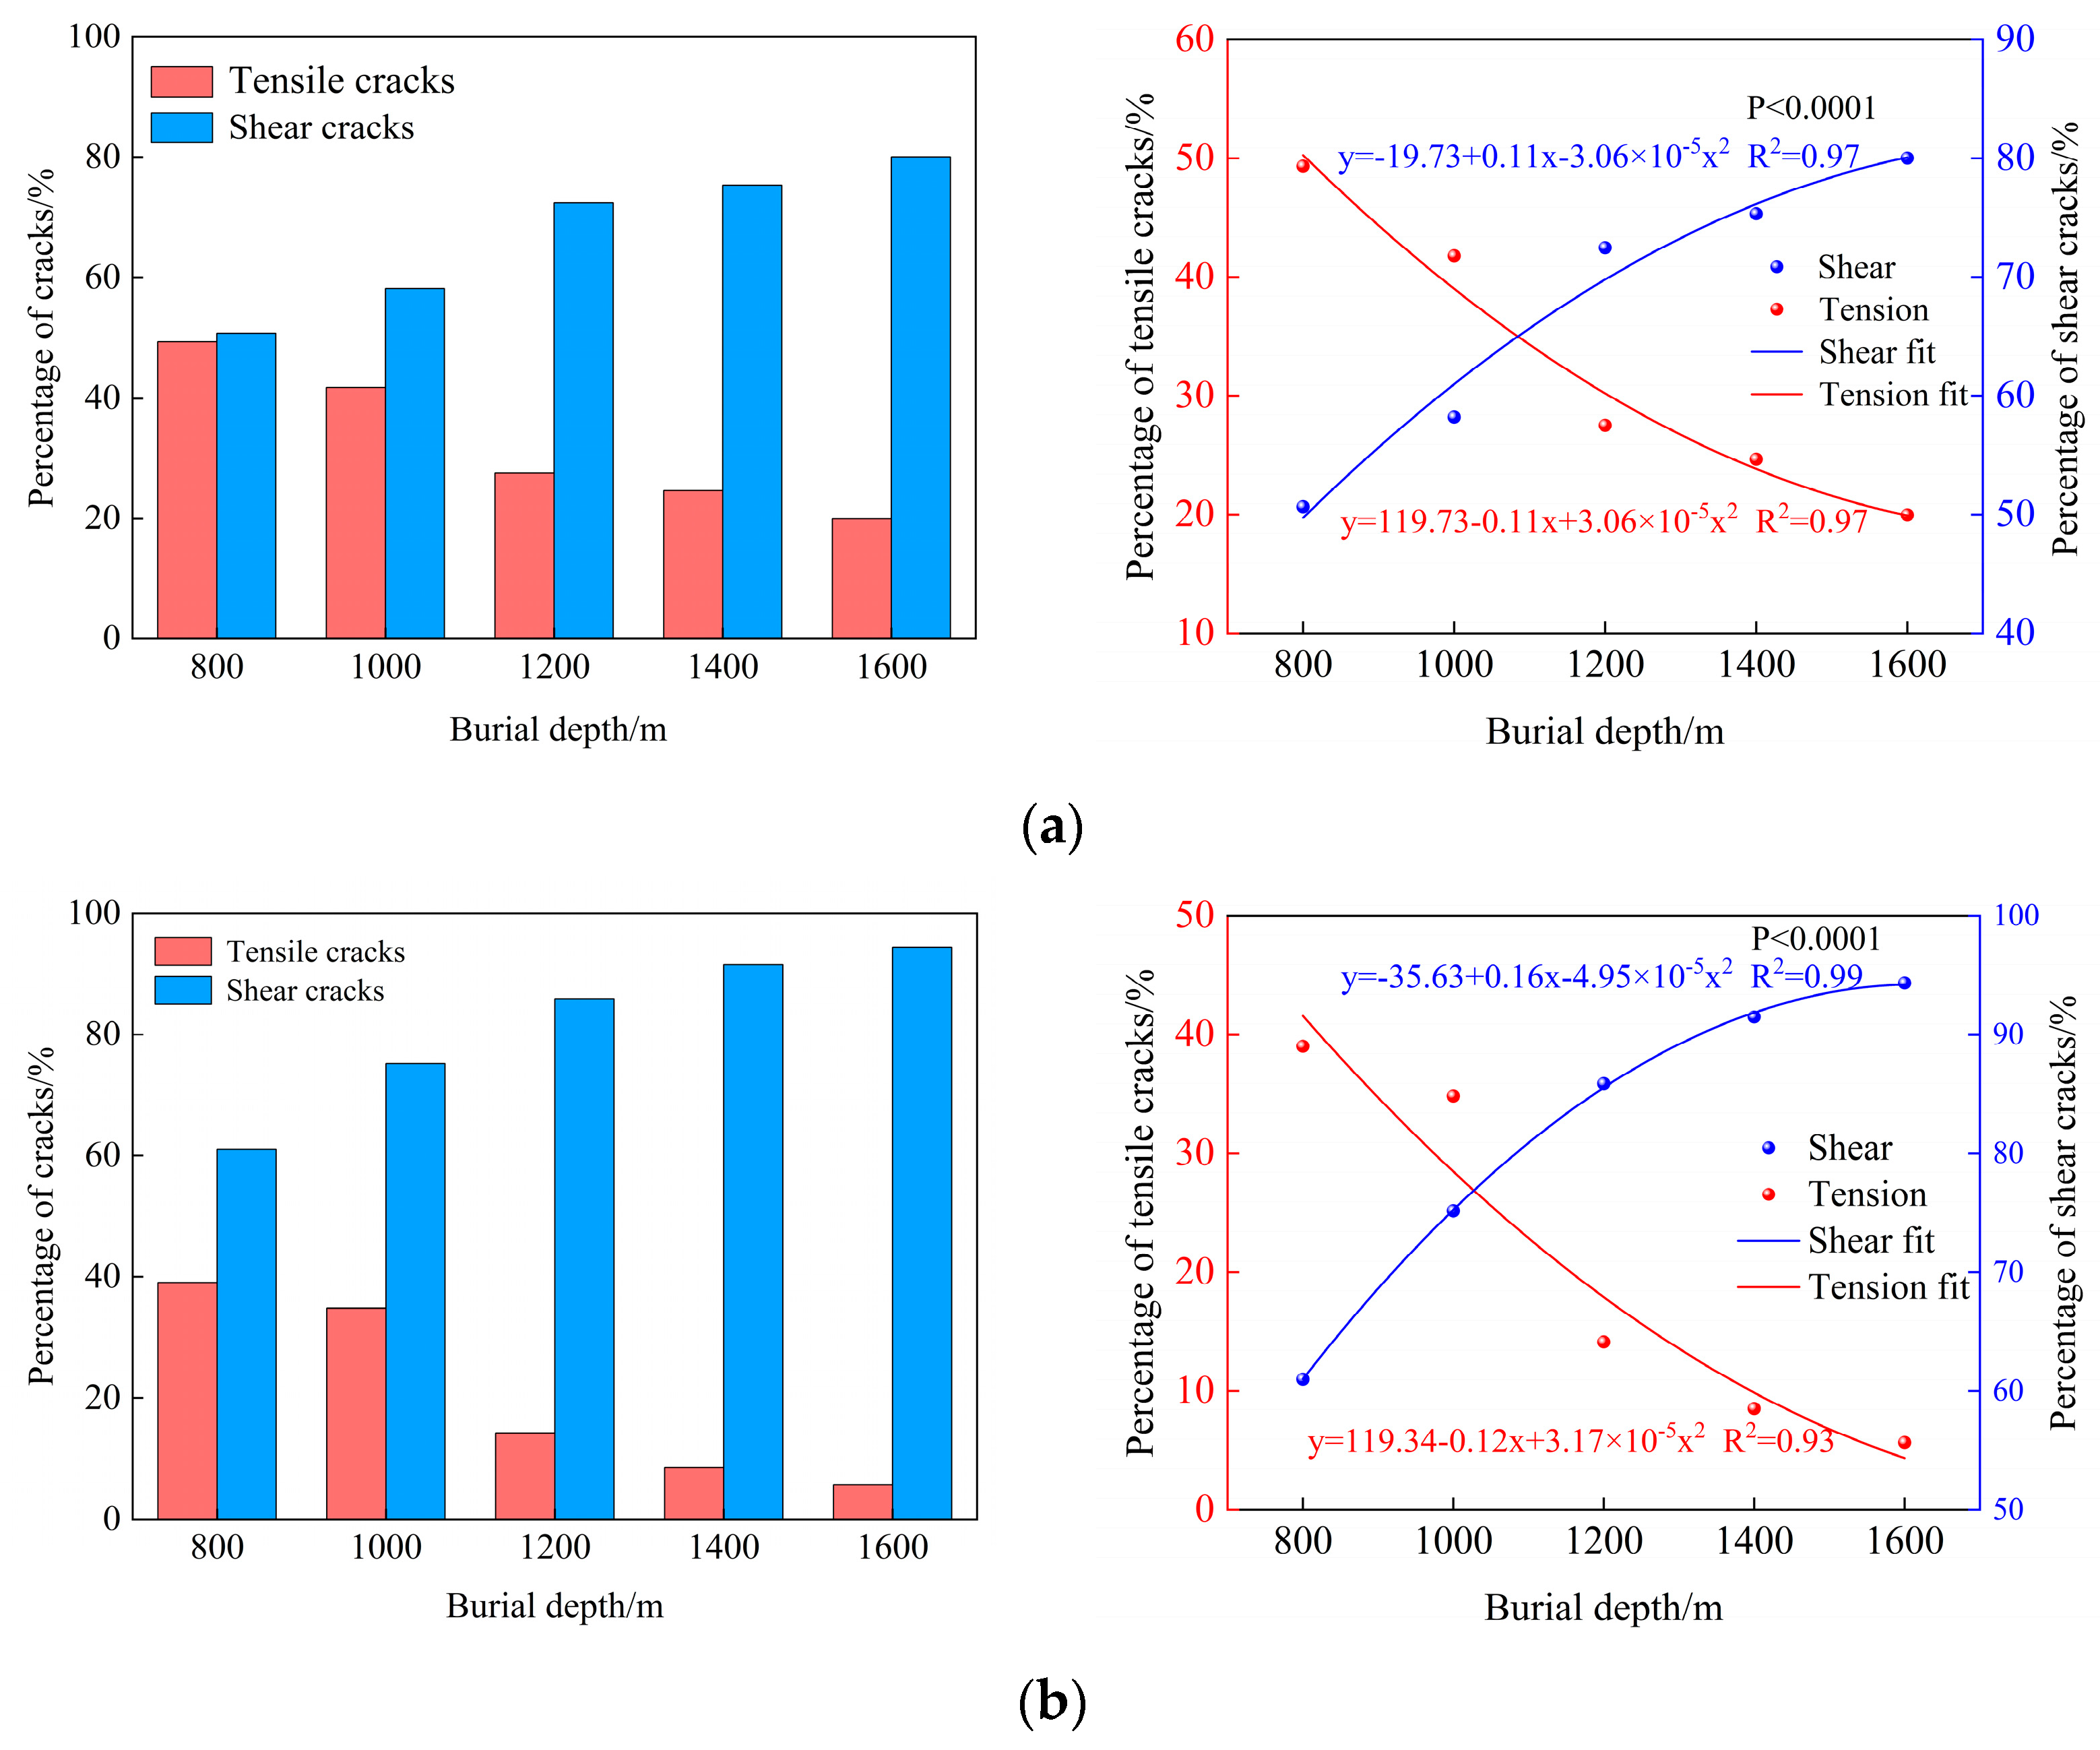
Through acoustic emission (AE) monitoring, quantitative research was conducted on the crack evolution characteristics during the failure process of the test specimens. The proportion of crack types and evolution patterns during the particle ejection period and stable failure period of the test specimens at different burial depths was analysed. The distribution ratio of cracks under different stress states is shown in Figure 9.
As shown in Figure 9, with increasing burial depth, the proportion of shear cracks during the particle ejection phase and stable failure phase increases, while the proportion of tensile cracks decreases, and the difference between shear cracks and tensile cracks becomes increasingly larger. However, at a burial depth of 800 m, both the shear crack ratio and the tensile crack ratio are around 50%. This may be because the horizontal stress at a shallow burial depth of 800 m is relatively low, indicating a transitional stage between tensile failure and shear failure. During the particle ejection phase, the tensile crack ratio at a burial depth of 800 m is 49.33%, while at a burial depth of 1600 m, it is only 19.97%. During the stable failure stage, the tensile crack ratio at a burial depth of 800 m was 39.02%, while at a burial depth of 1600 m, the tensile crack ratio was only 5.66%. This indicates that as burial depth increases, the proportion of shear failure increases while the proportion of tensile failure decreases.
By fitting the crack proportion curves during the particle ejection phase and the stable failure phase, it can be observed that the proportion of shear cracks exhibits a quadratic growth trend, while the proportion of tensile cracks shows a quadratic decrease trend. This indicates that the fracture mode of the specimen exhibits a significant depth effect. At shallow burial depths, where confining pressure is low, tensile stress concentration is more likely to occur, leading to the formation of tensile cracks, which manifest as a composite tensile–shear crack pattern. At deeper burial depths, the high-stress environment restricts tensile crack propagation, and rock fracture is primarily characterised by shear cracks. During the stable failure period compared to the particle ejection period, the proportion of shear cracks is higher, while the proportion of tensile cracks is lower. As burial depth increases, the failure mechanism of the rock gradually transitions from a tensile–shear composite type to a shear-dominated type.

3.4. Time-Frequency and Spatial Evolution Characteristics of Sound Emission

The dominant frequency of acoustic emission is closely related to the size of internal cracks in rock. High-frequency signals typically originate from the propagation of small-scale cracks, while low-frequency, low-amplitude signals and low-frequency, high-amplitude signals correspond to small-scale and large-scale cracks, respectively [36]. Plot the relationship between the primary frequency of acoustic emission and vertical load and time, as shown in Figure 10. During the hole failure process, the primary frequency of acoustic emission ranges from 0 to 390 kHz. By statistically analysing the distribution pattern and evolution process of the primary frequency within this range, important quantitative evidence can be provided to reveal the failure and instability process of the surrounding rock.
A comparative analysis of the AE signal characteristics of five groups of rock specimens at different stages of failure reveals that during the particle ejection phase, the main frequency signal distribution is dispersed, with AE signals predominantly being of low frequency and low amplitude. Among these, Specimen S-1 has the highest proportion at 87.50%, while Specimen S-5 has the lowest at 66.45%. Meanwhile, the proportions of mid-frequency and high-frequency signals increased from 10.23% and 2.27% to 22.59% and 10.96%, respectively. This indicates that the damage during the particle ejection stage is primarily characterised by small-scale damage such as microcrack propagation and the ejection of small particles, falling under the category of medium- to small-scale damage.
During the stable failure stage, the main frequency signals increased significantly and became densely distributed. The proportion of low-frequency high-amplitude signals in all five test specimens showed a decreasing trend, specifically decreasing to 80.81%, 76.69%, and 69.44% for specimens S-1, S-2, and S-3, respectively, and further decreasing to 64.14% and 56.11% for specimens S-4 and S-5. At this stage, mid-to-high-frequency signals generally increased by 3% to 8%, with the mid-to-high-frequency increase in specimen S-5 being the largest at 7.87%. This indicates that the damage during the stable failure stage primarily involved large-scale failures such as rock slab fractures and rock fragment detachment, classified as medium-to-large-scale damage. Notably, the decrease in the proportion of low-frequency high-amplitude signals is attributed to the increase in horizontal stress, which restricted the propagation and expansion of macrocracks, thereby reducing large-scale tensile fractures in the rock slabs.
The results show that low-frequency, low-amplitude signals were present throughout the entire test process, corresponding to microcracks and small-scale cracks generated inside the rock, while low-frequency, high-amplitude signals only appeared during the stable failure period and collapse period, indicating large-scale damage such as rock slab detachment inside the cavity. As the damage intensity of the cavity increased, the distribution of the main frequency signals became more concentrated, and continuous and dense multi-frequency signals could be used as indicators of cavity instability and failure.
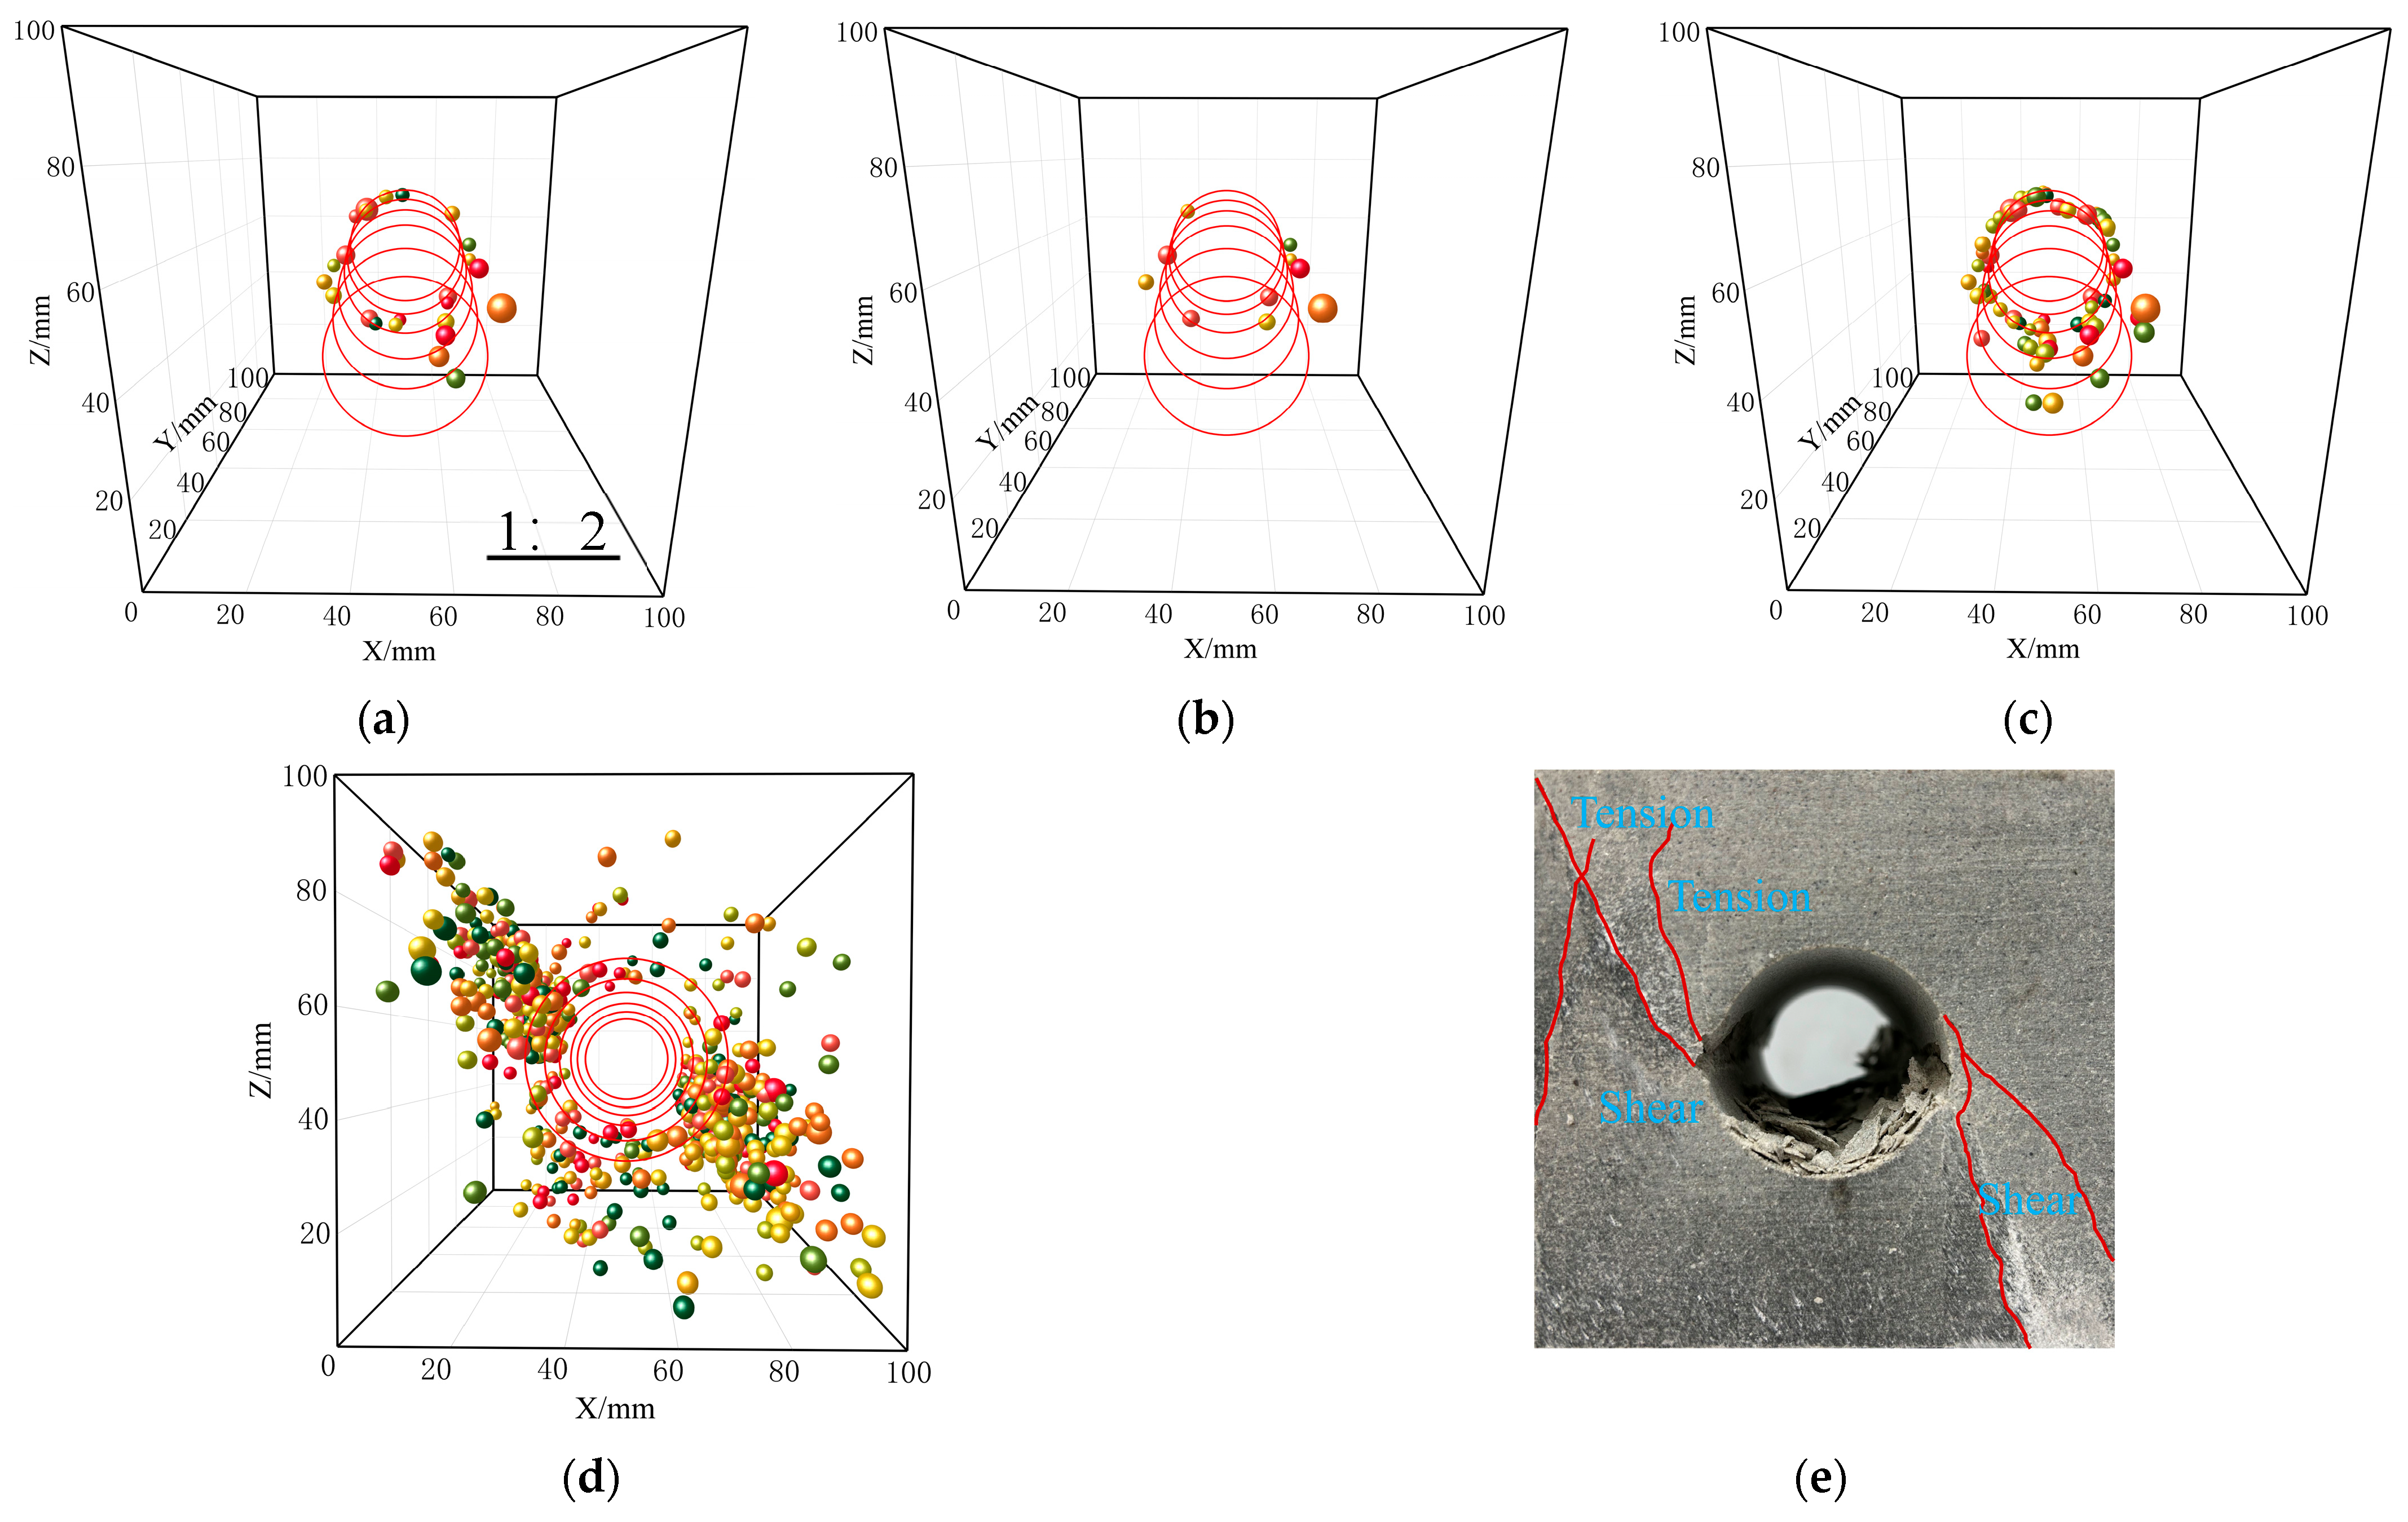
The development and propagation of cracks within rocks release energy in the form of elastic waves, which are detected by acoustic emission probes. By measuring the time difference in the arrival of P-waves detected by sensors, the location of the fracture source can be inverted [37]. To more intuitively reflect the failure process of porous sandstone, the inversion results were screened by range, with a focus on showcasing the evolution characteristics of the localisation points near the pores of the S-5 specimen.
During the quiet period, the location points are mainly formed by the closure and development of natural fractures within the rock. At this time, the acoustic emission signals are weak, and the location points are randomly distributed, mainly concentrated on the cave wall surface, as shown in Figure 11a.
After entering the particle ejection phase, particle ejection from the hole wall increases the number of positioning points, which still show a random distribution overall, but the positioning points begin to expand from the hole wall surface toward the interior. This phenomenon is caused by the action of tangential stress, with cracks appearing on the hole surface, gradually connecting to form rock blocks or rock fragments of a certain thickness. Acoustic emission events are locally concentrated on the right wall, as shown in Figure 11b.
The distribution of localisation points during the stable failure period is shown in Figure 11c. The number of localisation points continues to increase, with a small number of acoustic emission signals distributed at the bottom and top of the hole. The acoustic emission signals on the right side significantly increase, which roughly corresponds to the location of crack propagation in the hole shown in Figure 6e. As the load continues to increase, surface cracks in the hole gradually propagate axially, and the hole wall begins to buckle and fail. This indicates that acoustic emission locations expand axially, with a significant increase in locations on both sides, the range continuously expanding and developing toward the deeper parts of the hole, ultimately forming two failure zones that traverse the hole, corresponding to the ‘V’-shaped failure pit.
The location points during the collapse phase after the specimen failed due to instability are shown in Figure 11d. The rock underwent macroscopic failure, with the fracture zone extending along the failure pit. The specimen formed a penetrating oblique shear zone along the maximum shear stress plane, connecting the pre-drilled holes with the specimen boundary. The concentration zone of the location points was in good agreement with the main fracture surface of the model, as shown in Figure 11e. Under high confining pressure, cubic specimens of sandstone containing holes exhibit typical shear-dominated failure [38], consistent with the shear slip characteristics described by the Mohr–Coulomb criterion, thereby forming a through-going oblique shear failure centred on the holes.

3.5. Evolutionary Characteristics of Acoustic Emission Parameters

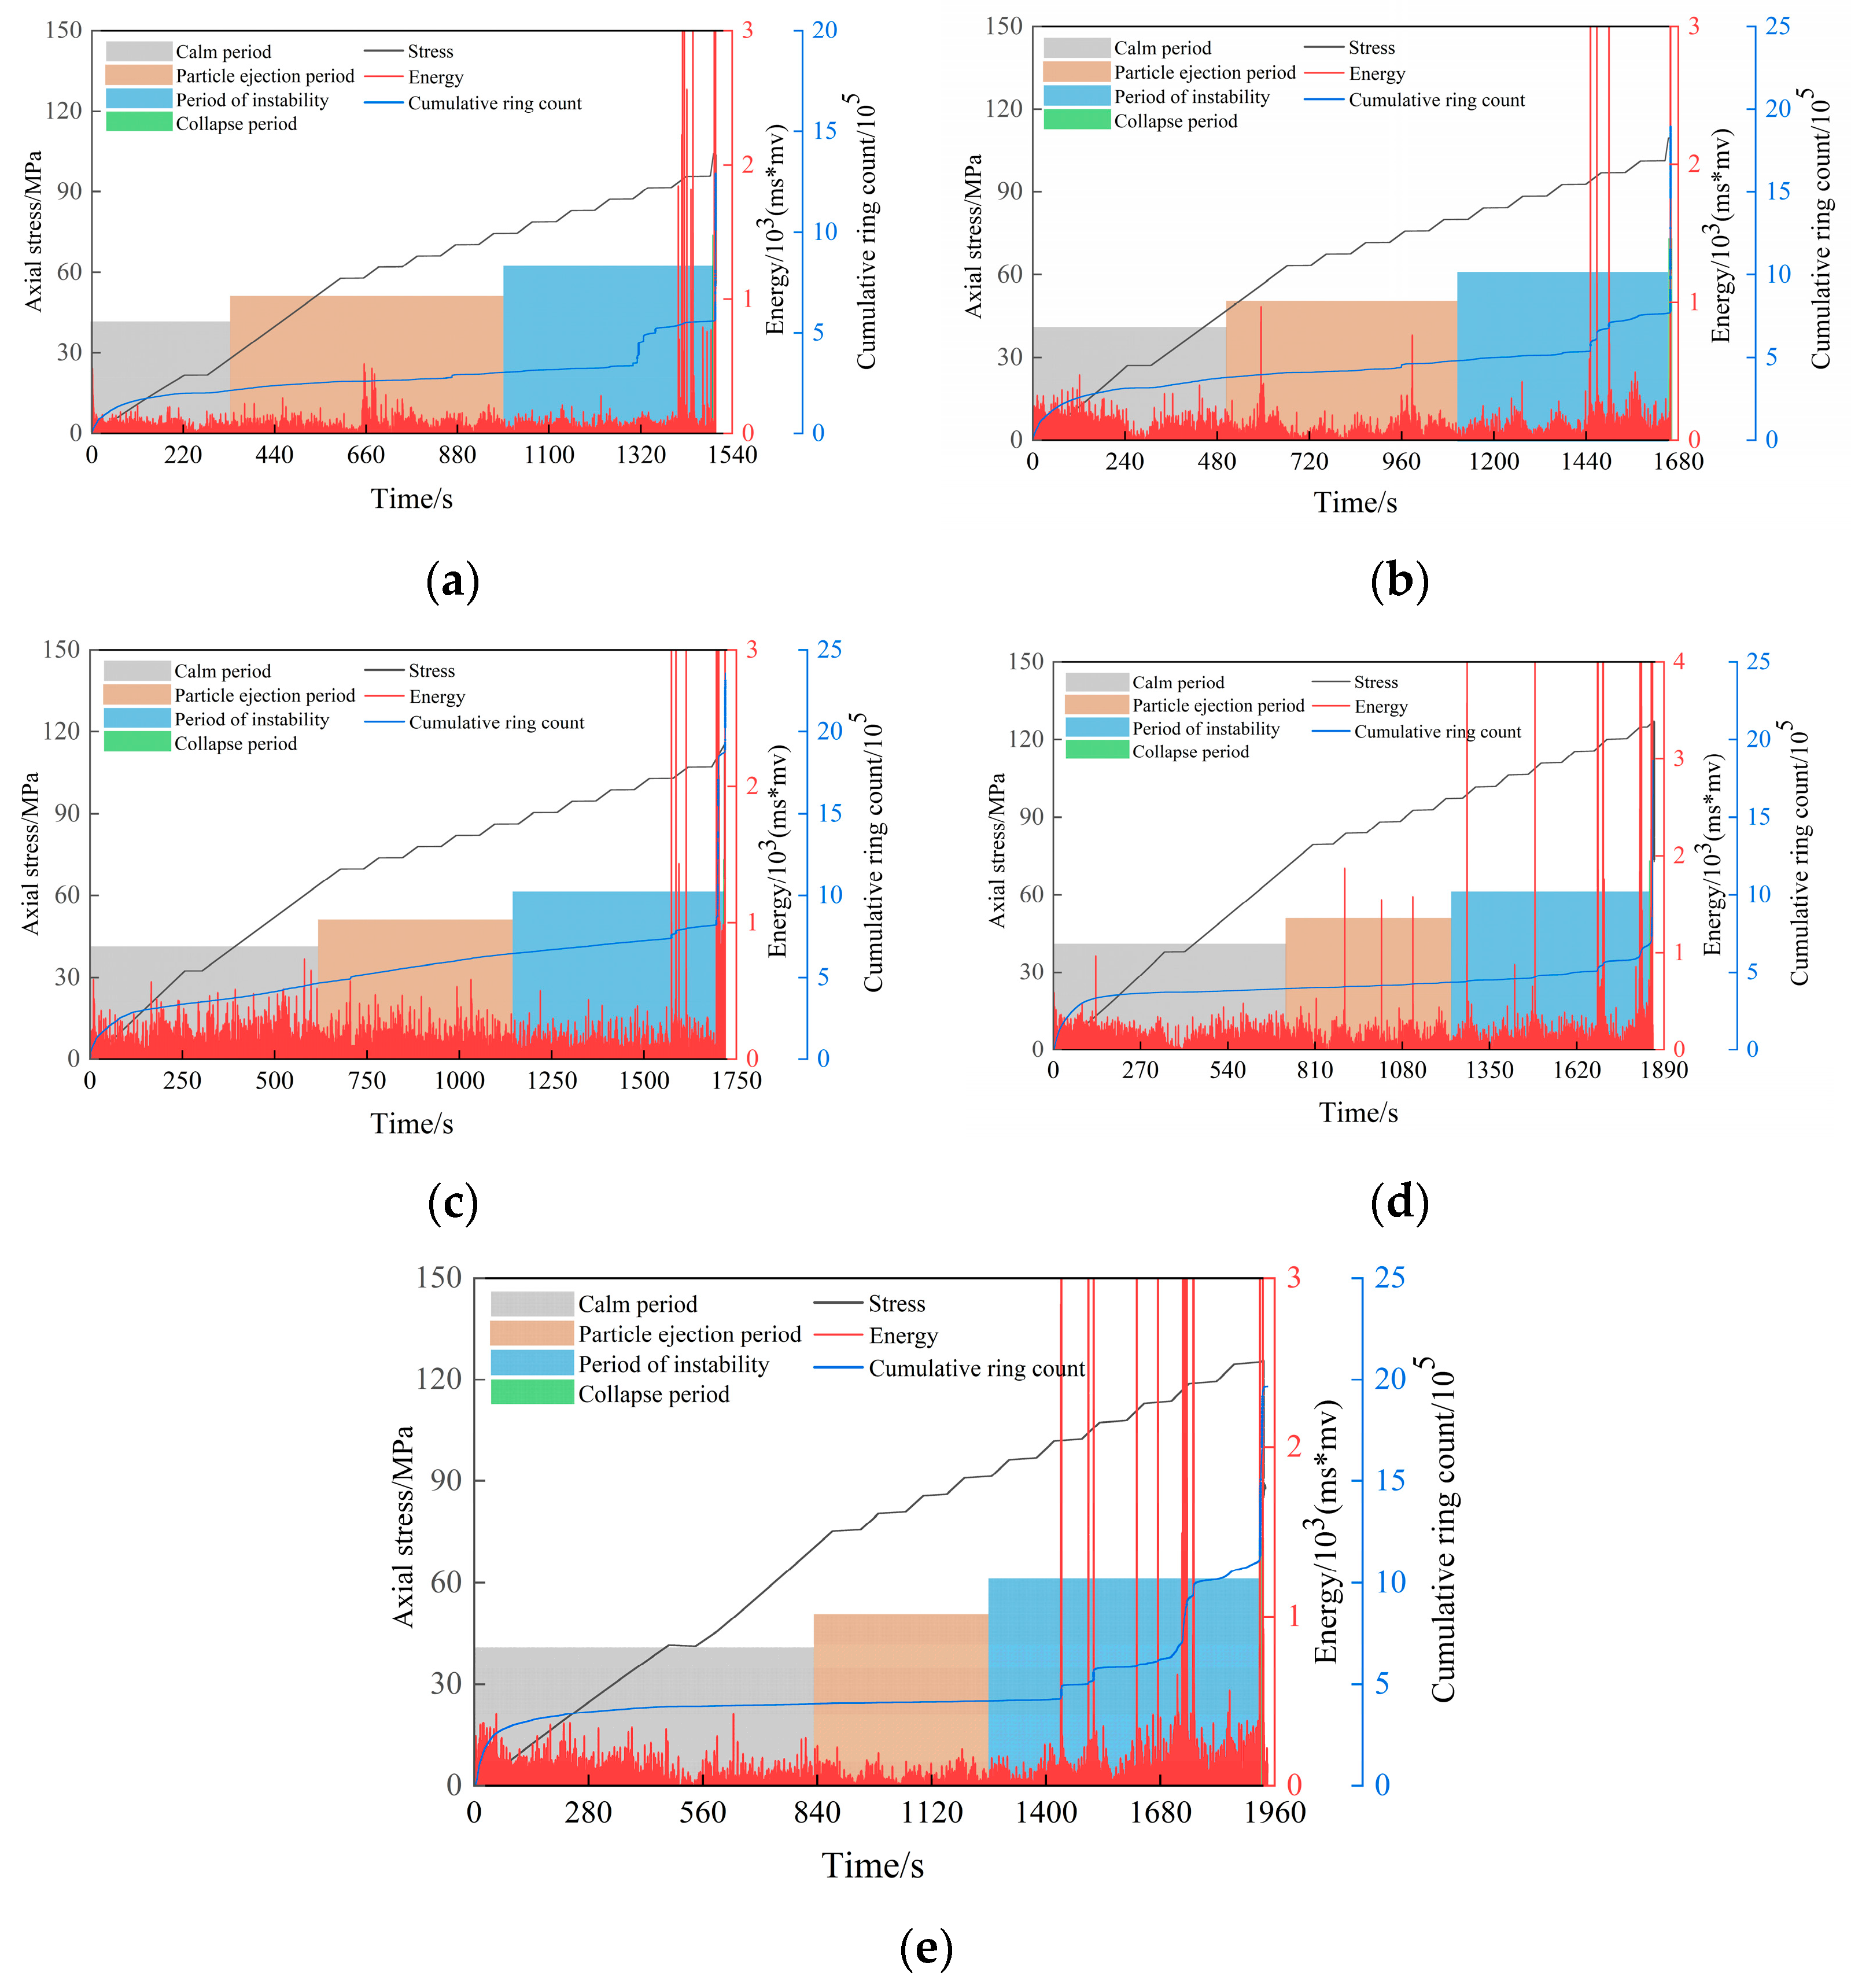
Acoustic emission is widely used for monitoring internal damage in rocks, and the evolutionary patterns of its parameters effectively reflect the damage characteristics of rocks. Under different stress conditions, the evolutionary patterns of acoustic emission signals during the damage process of specimens exhibit similarities, as shown in Figure 12. During the quiescent period, S-1 exhibits sustained low-amplitude energy, with the cumulative ring count growth rate initially increasing rapidly and then slowing down. When entering the particle ejection phase, the cumulative ring count reaches 34.69% of the peak stress, the energy remains at a low amplitude, and the cumulative ring count growth rate is low. At 92.97% of the peak stress, it enters the stable failure period, where the energy shows low-amplitude growth followed by multiple sudden increases, the cumulative ring count rises in a stepwise manner, and near the peak, the energy surges, the cumulative ring count increases linearly, and the specimen fails after 5.2 s.
During the calm period, S-2 has low energy, and the cumulative ring count growth rate slows down. When it reaches 45.49% of peak stress, it enters the particle ejection period, where energy remains low and the cumulative ring count increases at a constant rate. During the stable failure period, it reaches 77.17% of peak stress. High-energy events occur intermittently, with the cumulative ring count increasing rapidly. When the peak stress is reached, the energy and cumulative ring count enter the calm phase, remaining stable for 4.2 s before the hole collapses. During the calm phase, energy and cumulative ringing counts increase slowly. At 57.51% of peak stress, the sample enters the particle ejection phase, with energy and cumulative ringing counts gradually increasing. At the stable failure phase, energy and cumulative ringing counts reach 78.07% of peak stress. Energy and cumulative ring count continue to increase steadily. As the peak stress is approached, energy and cumulative ring count enter a brief stable phase, and the hole collapses after 3.6 s.
During the calm period, energy continues to appear, and the cumulative ring count gradually increases. When loaded to 56.99% of peak stress, it enters the particle ejection period, during which energy continues to increase, and three sudden increases occur. The cumulative ring count increases steadily. At 78.60% of peak stress, the stable failure phase begins, with energy showing multiple significant increases. The cumulative ring count gradually approaches vertical growth, entering the calm phase before the collapse phase. The specimen fails after 3.2 s. During the calm phase, the energy of S-5 continues to increase steadily, and the cumulative ringing count gradually increases. At 56.85% of peak stress, the particle ejection phase begins, with the growth trends of energy and cumulative ringing count remaining stable. At 79.93% of peak stress, the stable failure phase is reached. Energy exhibits intermittent peak-like increases, and the cumulative ringing count shows a stepwise growth pattern. After approximately 2.9 s of the calm phase, the specimen fails.
In summary, the peak stress triggered during the particle ejection phase exhibits a trend of first increasing and then decreasing, with the S-3, S-4, and S-5 specimens concentrated in the 56–57% range; while the peak stress during the stable failure phase first decreases and then stabilises, with the S-2, S-3, S-4, and S-5 specimens entering the accelerated failure phase when the peak stress reaches 77–80%. The duration of the calm phase before unstable failure for sandstone specimens was 5.2 s for specimen S-1, 4.2 s for specimen S-2, 3.6 s for specimen S-3, 3.2 s for specimen S-4, and 2.9 s for specimen S-5. This indicates that as burial depth increases, the calm time before unstable failure gradually decreases, showing an overall negative correlation trend.
During the instability process of the test specimen, the cumulative ring count and energy changes in acoustic emission exhibit distinct phasic characteristics. During the quiescent phase, microcrack activity causes the cumulative ring count to increase slowly. Upon entering the particle ejection and spalling phase, the acoustic emission signal continues to intensify, the growth rate of the cumulative ring count accelerates, and energy continues to increase. When stress concentration leads to rock mass failure entering a stable development stage, the cumulative ring count curve exhibits multiple instances of sharp increases followed by gradual flattening, while the energy curve shows stair-step growth. The brief calm period following severe failure serves as a precursor to imminent overall collapse of the specimen; during this phase, the cumulative ring count temporarily accelerates slightly before the cavity collapses. Therefore, by analysing the growth patterns of cumulative ringing counts and energy, it is possible to effectively determine the stage of instability of the surrounding rock and assess its risk status. The brief period of calm following severe damage serves as a critical early warning signal for predicting hole collapse.

4. Discussion

This study fills a research gap in understanding the failure mechanisms of porous sandstone under high-stress conditions by conducting true triaxial tests. Compared to uniaxial and biaxial tests, true triaxial tests better simulate the stress conditions of underground rock masses. The experiments indicate that under high confining pressure conditions, failure transitions from tensile failure to shear failure as the dominant mode, which aligns with the actual stress state of mine tunnels. The shift in failure modes caused by burial depth provides a theoretical basis for optimising deep mine tunnel support systems. Future research should focus on conducting multi-physics coupling tests and exploring digital twin warning models.

5. Conclusions

(1)
The peak strength of porous sandstone specimens increases quadratically with increasing burial depth. From a macro perspective, the pore failure process of sandstone specimens can be divided into four stages: the calm period, the particle ejection period, the stable failure period, and the total collapse period.
(2)
Under high-stress conditions, the failure of porous sandstone specimens is primarily shear. As burial depth increases, the failure mode of sandstone specimens changes from a composite failure of tensile–shear cracks to shear crack-dominated failure. During the particle ejection period and stable failure period, shear cracks and tensile cracks exhibit quadratic growth and decreasing trends, respectively. But the possible influence of specimen anisotropy and hole machining tolerance should be included as a caveat.
(3)
The particle ejection phase is characterised by low-frequency, low-amplitude signals, corresponding to crack initiation phenomena, and this stage is classified as small- to medium-scale damage. The stable damage phase is characterised by low-frequency, high-amplitude signals, reflecting macro-scale crack propagation characteristics, and this period is classified as medium- to large-scale damage. Continuous, dense multi-frequency signals can serve as an indicator of rock mass instability. The number of locating points in the four phases shows a trend of increasing from a few to many. During the complete collapse phase, the locating points exhibit penetrating oblique shear failure centred around the holes.
(4)
The peak stress during the particle ejection phase exhibits a trend of first increasing and then decreasing, with specimens S-3, S-4, and S-5 concentrated in the 56–57% peak stress range. The peak stress during the stable failure phase first decreases and then stabilises, with specimens S-2, S-3, S-4, and S-5 entering the accelerated failure phase at 77–80% peak stress. The duration of the calm phase before unstable failure shows a significant negative correlation with burial depth, decreasing from 5.2 s for the S-1 specimen to 2.9 s for the S-5 specimen.

Author Contributions

The overarching research goals were developed by Z.L., G.Z. and X.X., Z.L., X.X. and W.X. provided the experimental methods and data and analysed the experimental data. The initial draft of the manuscript was written by Z.L. and G.Z., W.X., C.L. and S.H. revised and reviewed the manuscript. All authors have read and agreed to the published version of the manuscript.

Funding

This research was funded by the National Key Research and Development Program, grant number: 2023YFC2907602.

Data Availability Statement

Data are contained within the article.

Acknowledgments

We would like to thank all the scholars in the references for their contributions to their respective research fields, as well as the open source data provided by various data websites.

Conflicts of Interest

The authors declare no conflicts of interest.

References

  1. Kang, H.; Xu, G.; Wang, B.; Wu, Y.; Jiang, P.; Pan, J.; Ren, H.; Zhang, Y.; Pang, Y. Forty years development and prospects of underground coal mining and strata controltechnologies in China. J. Min. Strat. Control Eng. 2019, 1, 013501. [Google Scholar]
  2. Xie, H. Research review of the state key research development program of China: Deep rock mechanics and mining theory. J. China Coal Soc. 2019, 44, 1283–1305. [Google Scholar]
  3. Gu, J.; Guo, J.; Zhu, Z.; Sun, F.; He, B.; Zhang, H. Sensitivity Analysis on Influential Factors of Strain Rockburst in Deep Tunnel. Buildings 2024, 14, 2886. [Google Scholar] [CrossRef]
  4. He, M.; Xie, H.; Peng, S.; Jiang, Y. Study on rock mechanics in deep mining Engineering. J. Rock Mech. Eng. 2005, 24, 2803–2813. [Google Scholar]
  5. Li, X.; Weng, L.; Xie, X.; Wu, H. Study on the degradation of hard rock with a pre-existing opening under static-dynamic loadings using nuclear magnetic resonance technique. J. Rock Mech. Eng. 2015, 34, 1985–1993. [Google Scholar]
  6. Ali, S.; Côme, C.; Abbas, K.; Alireza, S. Evaluation of the Effect of Geomechanical Parameters and In Situ Stress on Tunnel Response Using Equivalent Mohr-Coulomb and Generalized Hoek-Brown Criteria. Geosciences 2022, 12, 262. [Google Scholar]
  7. He, M. Research progress of deep shaft construction mechanics. J. China Coal Soc. 2021, 46, 726–746. [Google Scholar]
  8. Yuan, L.; Xue, J.; Liu, Q.; Liu, B. Surrounding rock stability control theory and support techniquein deep rock roadway for coal mine. J. Coal Sci. Eng. 2011, 36, 535–543. [Google Scholar]
  9. Zhao, J.; Li, C.; Huang, W. Long-Term Anisotropic Mechanical Characterization of Layered Shale—An Experimental Study for the BaoKang Tunnel of the Zhengwan Railway, China. Processes 2025, 13, 1900. [Google Scholar] [CrossRef]
  10. Kang, H. Analysis on types and interaction of stress fileds in underground coal mines. J. Coal Sci. Eng. 2008, 33, 1329–1335. [Google Scholar]
  11. Du, M.; Jing, H.; Su, H. Study on the influence of elliptical hole on strengthand deformation characteristics of sandstone sample. J. Min. Saf. Eng. 2017, 34, 141–147. [Google Scholar]
  12. Zhu, T.; Jing, H.; Su, H.; Yin, Q.; Du, M. Mechanical behavior of sandstone containing double circularcavities under uniaxial compression. J. Geotech. Eng. 2015, 37, 1047–1056. [Google Scholar]
  13. Dong, Z.; Cai, M.; Ma, C.; Wang, P.; Li, P. Rock damage and fracture characteristics considering the interaction between holes and joints. Theor. Appl. Fract. Mech. 2024, 133, 104628. [Google Scholar] [CrossRef]
  14. Li, D.; Liu, M.; Han, Z.; Zhou, Z. Dynamic compressive mechanical properties of bedding sandstone with pre-existing hole. J. China Coal Soc. 2019, 44, 1349–1358. [Google Scholar]
  15. Zhao, G.; Wang, E.; Wu, H.; Qiu, J.; Dai, Y. Micro-fracture evolution rule of sandstone specimens with a single hole under uniaxial compression. J. Cent. South Univ. Nat. Sci. Ed. 2019, 50, 1891–1900. [Google Scholar]
  16. Liu, H.; Feng, X.; Liu, L.; Li, T.; Tang, C. Mechanical properties and failure characteristics of anisotropic shale with circular hole under combined dynamic and static loading. Int. J. Rock Mech. Min. Sci. 2023, 170, 105524. [Google Scholar] [CrossRef]
  17. Du, K.; Niu, T.; Sun, Y.; Zhou, J.; Liu, J.; Wang, S.; Liu, K. Crack Evolution and Failure Mechanisms of Rock Specimens with Oblique Cylindrical Holes in Biaxial Compression Tests. Rock Mech. Rock Eng. 2024, 57, 3257–3280. [Google Scholar] [CrossRef]
  18. Shi, L.; Li, C.; Zhang, X. Laboratory Tests of Strain Burst in Boreholes of Four Types of Rocks Under Biaxial Loading. Rock Mech. Rock Eng. 2024, 58, 301–319. [Google Scholar] [CrossRef]
  19. Miao, S.; Shang, X.; Chang, N.; Ma, Y.; Yang, J. Mechanical properties and fracture mechanism of porous sandstoneunder biaxial compression. J. Min. Strat. Control Eng. 2025, 7, 023041. [Google Scholar]
  20. Bi, R.; Liu, M.; Li, G.; Zhou, J.; Du, K. Mechanical properties and risk characterization of surrounding rocks containing various blocks of arch-shaped holes under biaxial compression. Eng. Fail. Anal. 2024, 158, 107983. [Google Scholar] [CrossRef]
  21. Taherdangkoo, R. Study on the characteristics of crack initiation in deep dense shale containing circular hole under varying stress conditions. J. Cent. South Univ. 2025, 32, 244–261. [Google Scholar]
  22. Wei, J.; Liu, S.; Wu, L.; Huang, J.; Zhang, Y.; Tian, B. Comparative analysis on different AE parameters in biaxial loading of hole rock. J. Min. Saf. Eng. 2015, 32, 1017–1025. [Google Scholar]
  23. Yang, S. Experimental study on deformation, peak strength and crack damage behavior of hollow sandstone under conventional triaxial compression. Eng. Geol. 2016, 213, 11–24. [Google Scholar] [CrossRef]
  24. Wang, S.; Wang, J.; Xiong, X.; Chen, Z.; Yan, S.; Zhou, J. Zonal disintegration phenomenon based on triaxial dynamic load test of hollow cylindrical sandstone specimens. J. Cent. South Univ. 2023, 30, 1311–1324. [Google Scholar] [CrossRef]
  25. Zhao, G.; Liu, Z.; Meng, X.; Zhang, R.; Gu, Q.; Qi, M. Energy evolution of sandstone under true triaxial cyclic principal stress. Rock Soil Mech. 2023, 44, 1875–1890. [Google Scholar]
  26. Liu, C.; Zhao, G.; Xu, W.; Meng, X.; Huang, S.; Zhou, J.; Wang, Y. Experimental investigation on failure process and spatio-temporal evolution of rockburst in granite with a prefabricated circular hole. J. Cent. South Univ. 2020, 27, 2930–2944. [Google Scholar] [CrossRef]
  27. Feng, X.; Haimson, B.; Li, X.; Chang, C.; Ma, X.; Zhang, X.; Ingraham, M.; Suzuki, K. ISRM Suggested Method: Determining Deformation and Failure Characteristics of Rocks Subjected to True Triaxial Compression. Rock Mech. Rock Eng. 2019, 52, 2011–2020. [Google Scholar] [CrossRef]
  28. Xie, H.; Lu, J.; Li, C.; Li, M.; Gao, M. Experimental study on the mechanical and failure behaviors of deep rock subjected to true triaxial stress: A review. Int. J. Min. Sci. Technol. 2022, 32, 915–950. [Google Scholar] [CrossRef]
  29. Huang, L.; Yang, S.; Cui, X.; Chen, Q.; Yao, R. Analysis of characteristics of measured stress and stability of faults in North China. Rock Soil Mech. 2013, 34 (Suppl. S1), 204–213. [Google Scholar]
  30. Huang, D.; Huang, R.; Zhang, Y. Experimental investigations on static loading rate effects on mechanical properties and energy mechanism of coarse crystal grain marble under uniaxial compression. J. Rock Mech. Eng. 2012, 31, 245–255. [Google Scholar]
  31. Liu, Y.; Feng, D. A review of experimental and theoretical research on the deformation and failure behavior of rocks subjected to cyclic loading. J. Rock Mech. Geotech. Eng. 2021, 13, 1203–1230. [Google Scholar] [CrossRef]
  32. Gong, F.; Luo, Y.; Li, X.; Si, X.; Tao, M. Experimental simulation investigation on rockburst induced by spalling failure in deep circular tunnels. Tunn. Undergr. Space Technol. 2018, 81, 413–427. [Google Scholar] [CrossRef]
  33. Shen, B.; Barton, N. Rock fracturing mechanisms around underground openings. Geomech. Eng. 2018, 16, 35–47. [Google Scholar]
  34. Du, K.; Luo, X.; Liu, M.; Liu, X.; Zhou, J. Understanding the evolution mechanism and classification criteria of tensile -shear cracks in rock failure process from acoustic emission (AE) characteristics. Eng. Fract. Mech. 2024, 296, 109864, Erratum in Eng. Fract. Mech. 2024, 302, 110063. [Google Scholar] [CrossRef]
  35. Bi, J.; Zhao, Y.; Wu, Z.; Li, J.; Wang, C. Research on crack classification method and failure precursor index based on RA-AF value of brittle rock. Theor. Appl. Fract. Mech. 2024, 129, 104179. [Google Scholar]
  36. Zhu, L.; Cui, S.; Pei, X.; Sun, P.; Liang, Y.; Sun, M. Characteristics of fatigue damage in secondary cemented rock mass based on acoustic emission spectrum. J. Cent. South Univ. Sci. Technol. 2024, 55, 2763–2779. [Google Scholar]
  37. Wang, J.; Yuan, G. Acoustic emission and fracture characteristics of deep sandstone under different loading rates. J. Min. Strat. Control Eng. 2023, 5, 65–76. [Google Scholar]
  38. Li, S.; Xu, F.; Li, L.; Wang, W.; Zhang, W.; Zhang, Q.; Shi, S. State of the art: Challenge and methods on large deformation in tunnelengineering and introduction of a new type supporting system. J. Rock Mech. Eng. 2016, 35, 1366–1376. [Google Scholar]
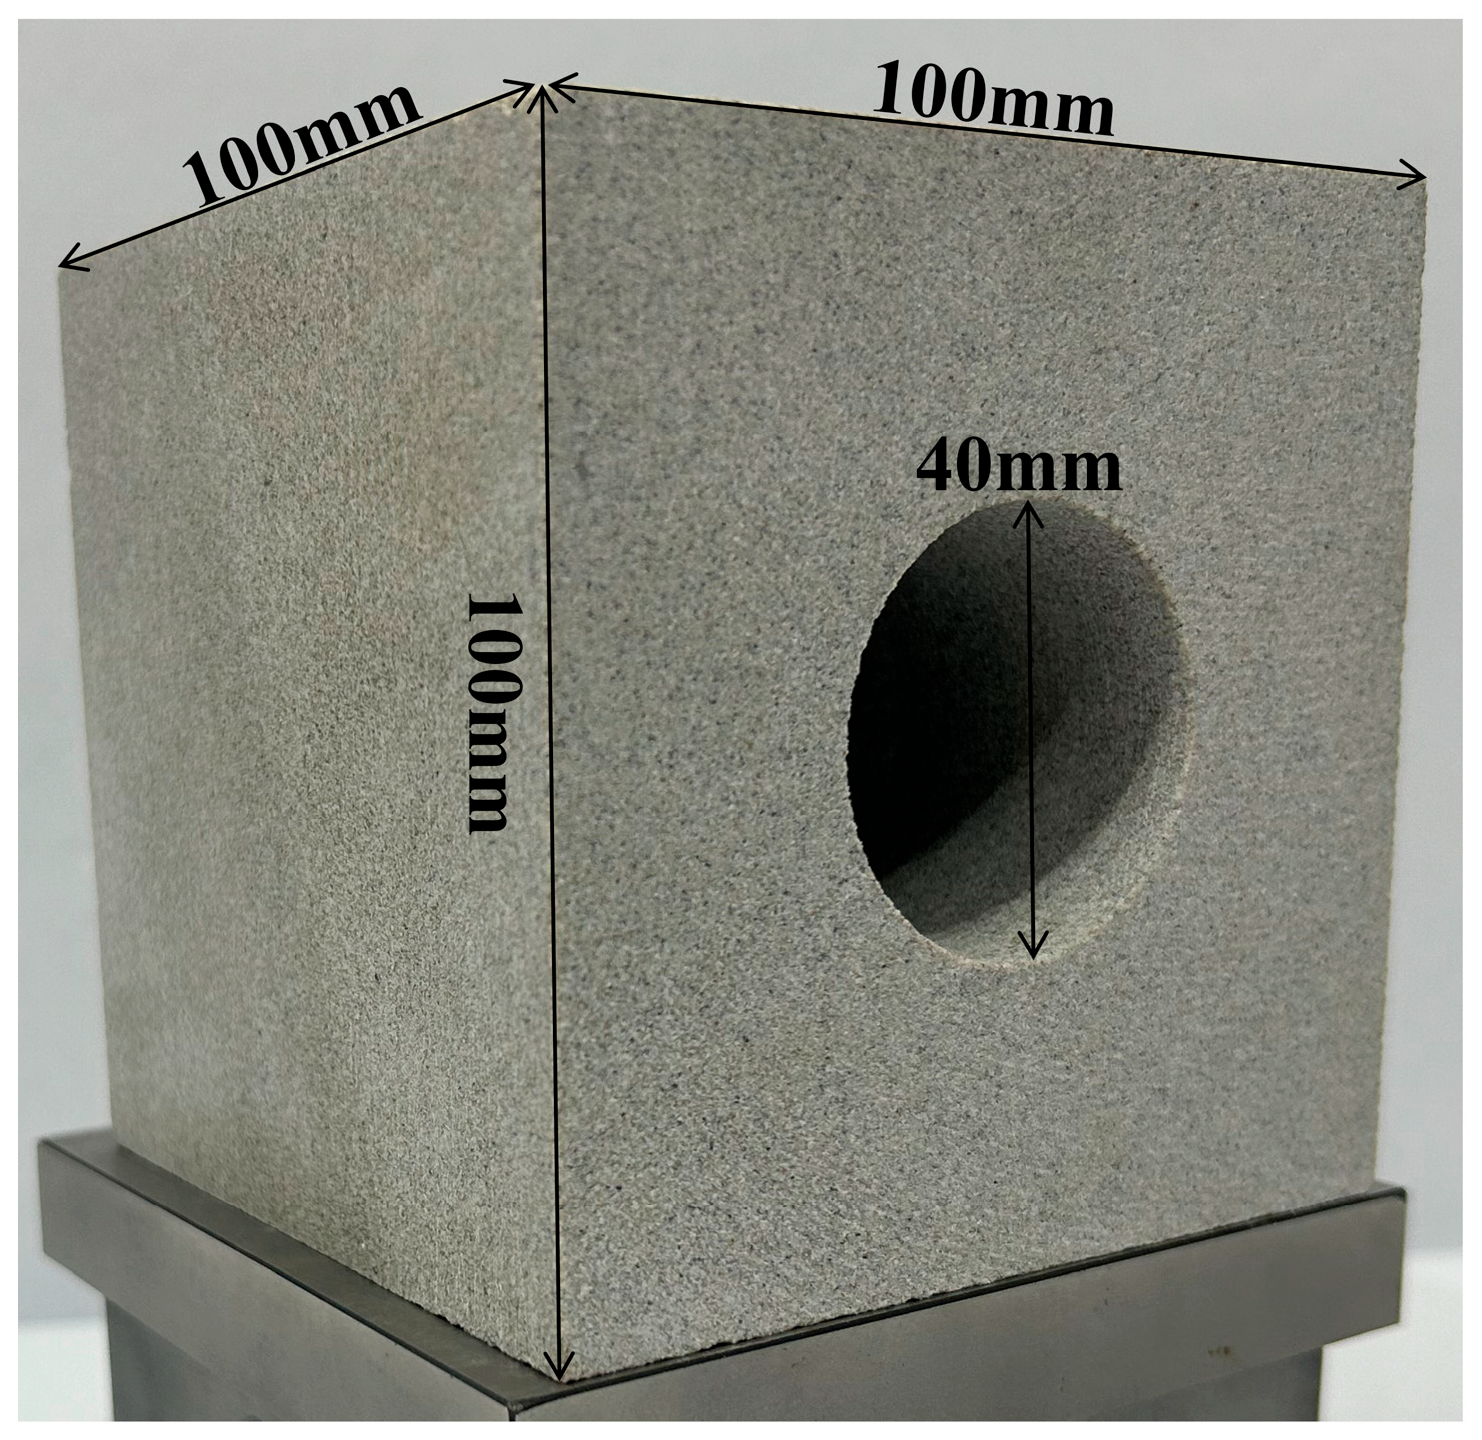
Figure 1. Test specimen.
Infrastructures 10 00236 g001
Figure 2. Test equipment and loading path. (a) Test equipment. (b) Loading path.
Infrastructures 10 00236 g002
Figure 3. Stress distribution of surrounding rock during tunnel excavation.
Infrastructures 10 00236 g003
Figure 4. Axial stress–strain curves of porous sandstone at different burial depths.
Infrastructures 10 00236 g004
Figure 5. Overall failure mode of test specimen. (a) S-1; (b) S-2; (c) S-3; (d) S-4; (e) S-5.
Infrastructures 10 00236 g005
Figure 6. Specimen failure process: (a) 432 s (σ1 = 43.2 MPa); (b) 835.2 s (σ1 = 70.35 MPa); (c) 1032.1 s (σ1 = 80.73 MPa); (d) 1233.7 s (σ1 = 91.13 MPa); (e) 1326.1 s (σ1 = 96.39 MPa); (f) 1507.3 s (σ1 = 104.58 MPa); (g) 1603.2 s (σ1 = 108.58 MPa); (h) 1711.7 s (σ1 = 114.16 MPa); (i) 1784.9 s (σ1 = 119.06 MPa); (j) 1907.5 s (σ1 = 125.05 MPa); (k) 1920.3 s (σ1 = 125.17 MPa); (l) 1932.3 s (σ1 = 125.73 MPa).
Infrastructures 10 00236 g006
Figure 7. Planar stress distribution of the surrounding rock.
Infrastructures 10 00236 g007
Figure 8. RA-AF point density map under different stress conditions. (a) S-1 800 m; (b) S-2 1000 m; (c) S-3 1200 m; (d) S-4 1400 m; (e) S-5 1600 m.
Infrastructures 10 00236 g008
Figure 9. Proportion of crack distribution under different stress conditions. (a) Particle ejection period. (b) Period of instability.
Infrastructures 10 00236 g009
Figure 10. Relationship curve between acoustic emission main frequency, vertical load and time. (a) S-1; (b) S-2; (c) S-3; (d) S-4; (e) S-5.
Infrastructures 10 00236 g010
Figure 11. Spatial–temporal evolution characteristics of S-5 sound emission. (a) Calm period. (b) Particle ejection period. (c) Period of instability. (d) Period of total collapse. (e) Overall failure mode of S-5 specimen.
Infrastructures 10 00236 g011
Figure 12. Evolutionary law of acoustic emission from tunnel rock mass failure under different stress conditions. (a) S-1; (b) S-2; (c) S-3; (d) S-4; (e) S-5.
Infrastructures 10 00236 g012
Table 1. Basic physical parameters of sandstone materials.
Density
(g·cm−3)
P-Wave Velocity (m·s−1)S-Wave Velocity (m·s−1)Porosity (%)Poisson RatioTensile Strength
(MPa)
Modulus
of Elasticity (GPa)
2.41251915030.470.282.9227.1
Table 2. Initial ground stress at different burial depths.
Specimen NumberBurial DepthInitial Stress
σ1σ2σ3
S-1800 m21.6 MPa23.3 MPa15.1 MPa
S-21000 m27.0 MPa28.0 MPa18.3 MPa
S-31200 m32.4 MPa32.6 MPa21.5 MPa
S-41400 m37.8 MPa37.3 MPa24.8 MPa
S-51600 m43.2 MPa41.9 MPa28.0 MPa
Disclaimer/Publisher’s Note: The statements, opinions and data contained in all publications are solely those of the individual author(s) and contributor(s) and not of MDPI and/or the editor(s). MDPI and/or the editor(s) disclaim responsibility for any injury to people or property resulting from any ideas, methods, instructions or products referred to in the content.