1. Introduction
Ensuring safe and accessible pedestrian infrastructure is a critical mandate under the Americans with Disabilities Act (ADA), which defines geometric requirements for sidewalk elements, such as running slopes, cross slopes, and vertical discontinuities, between pavement segments [
1]. Accurate and timely assessments of these features are essential for identifying noncompliant conditions that pose safety risks—particularly for individuals who use wheelchairs or other mobility devices. This paper presents a novel 3D reconstruction framework based on neural radiance field (NeRF) that enables automated extraction of ADA compliance metrics—including the running slope, the cross slope, and vertical displacements—from a monocular video. The goal was to evaluate NeRF’s accuracy, scalability, and practicality compared to traditional manual surveys and LiDAR-based methods.
Municipalities have traditionally relied on manual field surveys to assess sidewalk geometry, employing tools such as digital levels, dual-axis tilt sensors (DASs), and measuring tapes [
2,
3,
4]. Digital levels are typically used for evaluating slopes near curb ramps; however, irregular spatial sampling often leads to missed subtle variations [
5]. Although DAS sensors are inexpensive and easy to operate, their high sensitivity to minor movements and vibrations undermines measurement precision [
6]. Measuring tapes, commonly used for identifying trip hazards, frequently yield inconsistent results due to variability in user technique [
7]. More advanced instruments, like GIS-integrated rolling-level systems, improve workflow efficiency but are often cost-prohibitive, with unit prices reaching up to USD 7500 [
8]. Consequently, manual methods remain labor-intensive, time-consuming, and error-prone—making them unsuitable for large-scale or repeated sidewalk evaluations [
9]. For instance, the City of Novi, Michigan, reportedly spent USD 68,000 to manually inspect 220 miles of sidewalks, at a cost of approximately USD 309 per mile [
10].
In response to these limitations, researchers and practitioners have investigated vision-based alternatives, such as photogrammetry and LiDAR. LiDAR systems can produce high-resolution point clouds suitable for detailed geometric assessments, but their high cost and operational complexity limit their broader adoption [
11]. Photogrammetry presents a more cost-effective solution but often lacks the precision to detect fine-scale elevation differences, particularly on low-texture surfaces, such as concrete [
12]. Both approaches also demand controlled data acquisition conditions and extensive post-processing, which further restricts their scalability for routine ADA compliance evaluations.
Recent advances in 3D computer vision offer a new path forward. NeRF is an emerging technique that reconstructs 3D scenes from 2D images by learning a continuous volumetric representation of the environment [
13]. Unlike traditional photogrammetry, which triangulates discrete points, a NeRF model the color and density of a scene as a function of spatial coordinates and viewing direction. This enables the generation of dense, photo-realistic 3D models from a monocular video, even in casual or uncontrolled capture conditions [
14]. While NeRF has shown promise in domains such as robotics and augmented reality, its application in civil infrastructure—particularly for sidewalk condition assessments—remains largely unexplored.
This study introduces a NeRF-based 3D reconstruction framework that leverages consumer-grade monocular video input to extract ADA-relevant geometric metrics, including the running slope, the cross slope, and vertical displacements. The primary objective was to evaluate NeRF’s feasibility as a low-cost, scalable alternative to manual and LiDAR-based methods. A comparative analysis was conducted across three data collection techniques—manual, LiDAR, and NeRF—benchmarked on real-world sidewalk and curb ramp scenarios. Each method was assessed based on measurement accuracy, cost, level of automation, and scalability, with the goal of informing future practices in sidewalk asset management and accessibility compliance monitoring.
The remainder of this paper is organized as follows.
Section 2 provides a review of related work in sidewalk assessment technologies, including manual, LiDAR, and vision-based methods.
Section 3 details the study area, data collection procedures, and the proposed NeRF-based 3D reconstruction and metric extraction framework.
Section 4 presents the evaluation metrics and experimental results, including a comparative analysis of accuracy, cost, and scalability across all methods. Finally,
Section 5 discusses the implications of the findings and offers conclusions and recommendations for future research and practical deployment.
2. Review of Sidewalk Assessment Techniques
A variety of tools have been developed to assess sidewalk conditions for ADA compliance, ranging from handheld instruments to advanced 3D modeling systems. This review summarizes key approaches across sensor-based platforms, 2D vision models, and 3D reconstruction technologies, with an emphasis on their ability to extract ADA-relevant geometric metrics, such as the running slope, the cross slope, and vertical displacements. The limitations of these methods—particularly in terms of cost, automation, and precision—motivate the need for a scalable alternative, such as NeRF.
2.1. Sensor- and Vision-Based Methods
Low-cost sensor-based systems aim to improve the efficiency of sidewalk inspections compared to manual surveys. Ultra-Light Inertial Profilers (ULIPs), which integrate laser sensors and accelerometers, can detect surface slopes and irregularities more quickly than traditional tools [
15]. Similarly, GPS-enabled devices, including “Sidewalk Surface Testers” and tablets mounted on wheelchairs, provide on-the-go measurements of slope and elevation [
16]. While these systems increase operational efficiency, their resolution is insufficient to capture localized slope transitions and minor vertical displacements critical for ADA compliance. Parallel developments in 2D computer vision have produced deep learning models for defect detection using RGB imagery. For example, YOLO [
17] and Sidewalk Defect Detection Models (SDDMs) [
18] offer fast, automated crack identification from UAV or mobile device footage. These tools are affordable and scalable but lack depth data, which limits their capacity to measure slope or elevation changes—rendering them unsuitable for full ADA geometric assessments.
2.2. Three-Dimensional Reconstruction: Photogrammetry and LiDAR
Three-dimensional (3D) modeling techniques provide enhanced geometric details for infrastructure assessments. Among these, photogrammetry, based on Structure-from-Motion (SfM) and Multi-View Stereo (MVS), reconstructs 3D surfaces from overlapping image sets and is widely adopted due to its affordability and accessibility [
19]. However, its performance is highly dependent on surface texture, lighting conditions, and camera quality. In texture-poor environments, such as concrete sidewalks, photogrammetry often fails to detect the millimeter-scale elevation differences required for ADA compliance assessments [
20].
LiDAR technologies address many of these limitations by generating lighting-independent, high-resolution 3D point clouds. High-end terrestrial LiDAR systems can achieve sub-centimeter accuracy and are frequently employed for slope and trip hazard analysis [
21,
22]. Nevertheless, these systems are expensive, demand multiple scan positions, and require manual point cloud registration, making them challenging to deploy in typical sidewalk environments [
23]. Mobile LiDAR offers partial automation and supports semantic segmentation; however, it remains constrained by occlusions [
24], uneven terrain [
25], and limited fields of view [
26]. While occlusion-handling algorithms have been developed [
27], they are primarily effective in regular or planar scenes and often require manual parameter tuning. Low-cost LiDAR devices, including those embedded in smartphones, offer portability but suffer from reduced depth resolution and a limited sensing range, making them more suitable for supplementary validation [
28]. Other methods, such as CAD-based 3D reconstructions, rely on idealized input and substantial manual effort, restricting their scalability across varied infrastructure types [
29]. As emphasized by Sestras et al. [
12], both photogrammetry and LiDAR continue to face significant challenges in achieving scalable, millimeter-level elevation mapping.
2.3. Neural Radiance Field (NeRF) for 3D Sidewalk Modeling
Recent advances in neural rendering introduce NeRF as a promising alternative for 3D modeling. A NeRF learns a continuous volumetric function that maps 3D coordinates and viewing directions to color and density, enabling photorealistic 3D reconstructions from a sparse, monocular video [
30]. Unlike SfM, a NeRF does not rely on feature triangulation or dense input and is robust to surface textures and lighting variations—making it well-suited for reconstructing real-world sidewalk scenes [
14]. Recent studies have demonstrated NeRF’s utility in civil engineering and urban applications, including damage detection [
31], 3D documentation of building interiors [
32], and reconstruction of complex urban environments [
33]. Qin et al. [
34] applied crowd-sourced imagery and NeRF to generate street-level 3D scenes for autonomous vehicle navigation. Despite its demonstrated potential, NeRF has not yet been investigated for pedestrian-scale applications, like ADA sidewalk audits, particularly for measuring slopes and vertical displacements.
2.4. Slope and Elevation Estimation from 3D Data
Even with accurate 3D reconstructions, extracting slope and displacement measurements remains challenging. End-to-End (E2E) methods estimate slope based on elevation changes between segment endpoints but assume planar surfaces—an oversimplification that leads to errors in curb ramps and irregular terrains [
35]. Linear regression techniques, while more robust, perform best on uniform pavement and may underperform on curved or discontinuous segments [
36]. To address this limitation, some researchers have adopted Principal Component Analysis (PCA) to estimate cross slopes more accurately in such complex geometries as curved ramps [
37]. Alternative approaches using Google Street View (GSV) depth maps convert panoramic imagery into digital terrain models (DTMs), enabling slope estimations without field data. However, due to noise and resolution limits in consumer-grade cameras, GSV-derived slopes often fail to capture fine elevation changes required for ADA compliance [
38]. Other researchers have explored vertical displacement detection using point cloud projections. Jiang [
39] proposed a method for detecting vertical displacement and mapping sidewalk deficiencies using mobile LiDAR-derived elevation data and orthophotos. Yu [
40] extracted crack lines from elevation maps using clustering and skeletonization algorithms. While effective for displacement and defect analysis, these methods are not easily adaptable for slope extraction and often require significant preprocessing.
In summary, while current technologies offer partial solutions for sidewalk geometry assessments, no existing method simultaneously achieves high precision, low cost, automation, and scalability for ADA compliance evaluations. Manual methods lack coverage. LiDAR is accurate but expensive. Photogrammetry and 2D vision approaches are limited in vertical fidelity. NeRF presents a compelling alternative, but its effectiveness for sidewalk-scale applications has not been validated. This study addresses this gap by evaluating NeRF’s capability to extract ADA-relevant slope and displacement metrics and by comparing its performance to established LiDAR and manual survey methods.
3. Methodology
This study evaluates the effectiveness of a NeRF for sidewalk geometry assessment and compares its performance against traditional manual measurements and LiDAR-based techniques. The methodology included three main phases: data collection, 3D model generation, and performance evaluation.
Figure 1 illustrates the overall workflow. In the data collection phase, sidewalk and curb ramp segments were surveyed using three categories of tools: (1) a consumer-grade monocular video (for NeRF); (2) high-end terrestrial and smartphone-based LiDAR sensors; and (3) traditional manual instruments, including digital levels, dual-axis tilt sensors (DASs), and measuring tapes. These tools were used to capture geometric information relevant to ADA compliance, including the running slope, the cross slope, and vertical displacements.
For the NeRF-based workflow, a GoPro camera was used to capture a monocular video around each sidewalk segment. These videos were processed through a NeRF pipeline to generate high-fidelity 3D point clouds. In parallel, LiDAR data were collected both using a stationary high-end terrestrial scanner and a mobile device (iPhone), while manual measurements were conducted on-site using field instruments. The second phase involved extracting ADA-relevant parameters from the 3D point clouds and manual data sources. For each method, the cross slope, the running slope, and vertical displacements were computed using tailored extraction techniques. These measurements were aligned with ADA thresholds to determine compliance levels. In the final phase, results from the three survey methods were evaluated across several criteria: measurement accuracy (with LiDAR serving as a reference standard), operational cost, time requirements, degree of automation, and scalability. This comparative framework allows for a comprehensive analysis of each method’s strengths and limitations in the context of large-scale sidewalk assessments.
3.1. Study Area and Data Collection
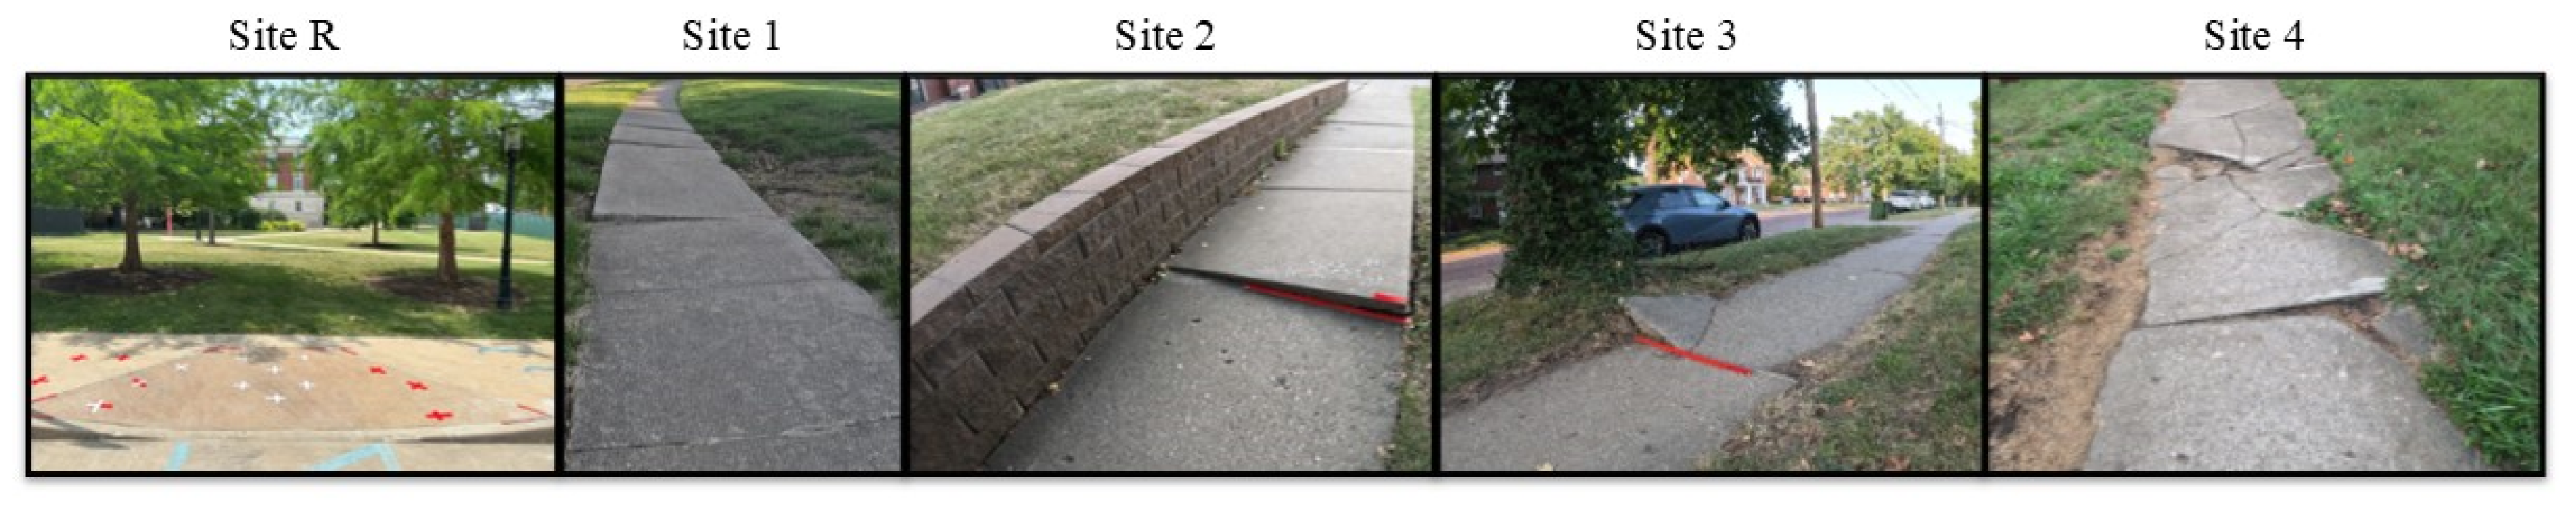
To evaluate the proposed NeRF-based method alongside traditional and LiDAR-based techniques, five sidewalk scenarios were selected from the University of Missouri campus. The study area includes four sidewalk segments and one curb ramp (Sites 1–4 and Site R-curb ramp), chosen to represent a diverse set of conditions, including sloped terrains, cracks, vertical displacements, root intrusions, land subsidence, and irregular curb ramp profiles. These sites are illustrated in
Figure 2.
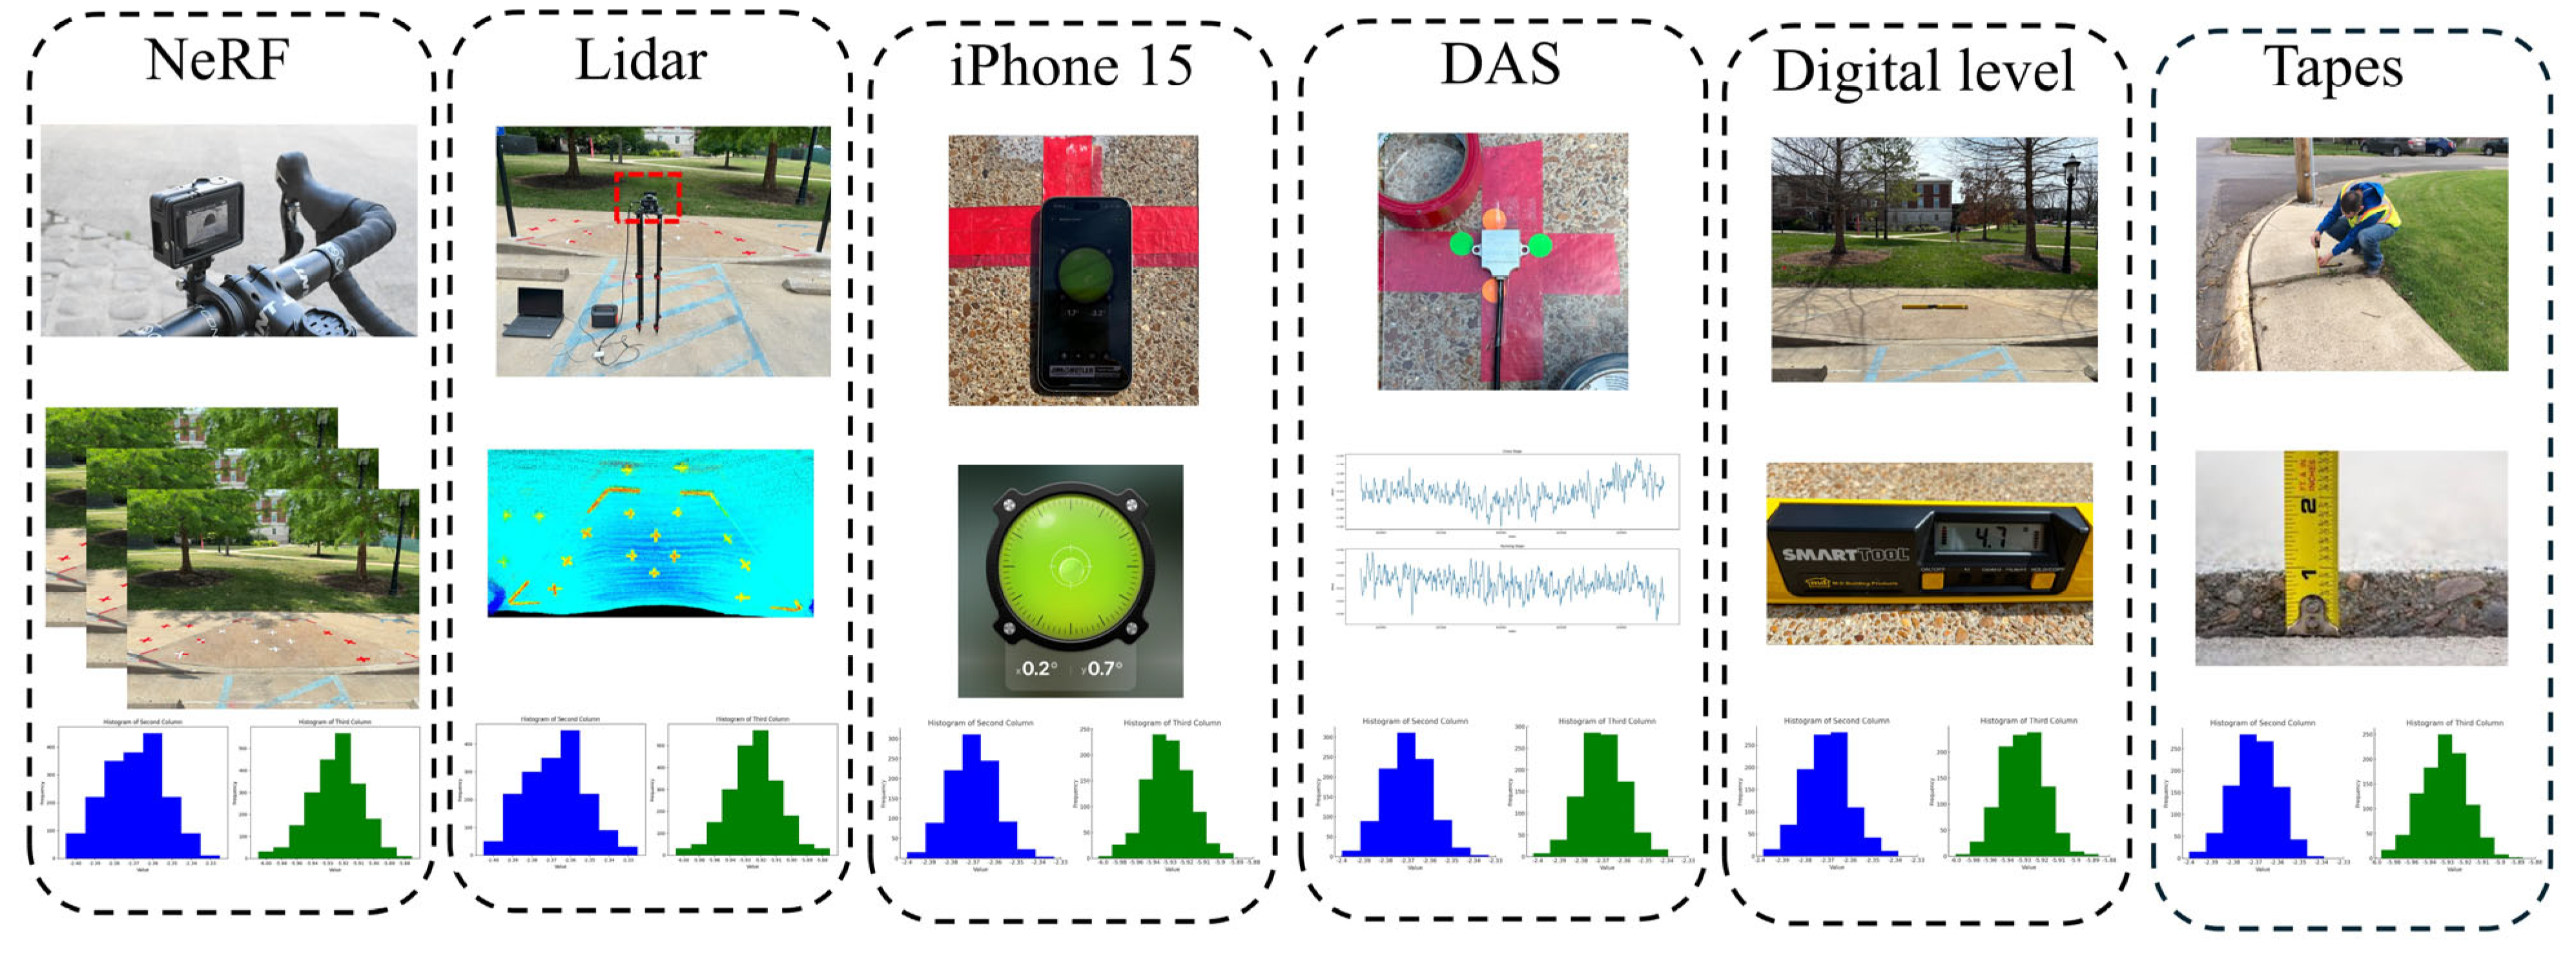
Figure 3 presents an overview of the data collection methods used in this study. Each sidewalk segment was surveyed using the following: (
a) traditional manual tools (digital levels, DAS sensors, and tape measures), (
b) LiDAR systems (high-end terrestrial and low-end smartphone-integrated systems), and (
c) a monocular vision setup for NeRF reconstruction. All three approaches aimed to extract ADA-relevant geometric metrics—the running slope, the cross slope, and vertical displacements—for later comparison.
3.2. Manual Survey Procedures
Manual data collection followed ADA field guidelines using a digital level, DAS sensor, and measuring tape. The digital level was aligned perpendicular or parallel to the direction of pedestrian travel to measure the cross and running slope, respectively. DAS sensors were placed on the sidewalk surface for approximately one minute. Fluctuating sensor readings were treated statistically: if the approximated distribution was normal, the mode was recorded as the representative slope value. In addition, a smartphone-based inclinometer app (iPhone 15 “Bubble Level”) was used to estimate slope angles. The app leverages onboard accelerometers and gyroscopes to provide real-time inclination readings. While it lacks the precision of dedicated sensors, its ease of use made it a useful supplementary tool for validating measurements in the field and ensuring consistency across multiple runs. Vertical displacements between adjacent sidewalk slabs were measured at height discontinuities using a tape measure, consistent with municipal field practices. These manual measurements served both as baseline observations and for validating automated techniques.
3.3. LiDAR Survey Procedures
For high-end data acquisition, a Livox HAP TX sensor was deployed on a fixed tripod 1 m above the sidewalk. The sensor, integrated with a Robot Operating System (ROS), captured point cloud and IMU data over a 20 s interval. This configuration provided a spatial resolution of 0.18° (horizontal) and 0.23° (vertical), with a data acquisition rate of 452,000 points per second—comparable to 144-line LiDAR systems. All LiDAR frames were later merged to reduce sparsity in the point cloud. The resulting datasets, shown in
Figure 4b, were processed using the slope and displacement extraction routines described in
Section 3.4.4 and
Section 3.4.5.
To detect vertical displacements (trip hazards), both manual and automated methods were employed. Reflective tape was applied to the top and bottom of known elevation discontinuities to facilitate accurate identification in the point cloud. Manual measurements involved selecting top and bottom points and calculating the Euclidean distance between their average coordinates. The automated pipeline applied the same logic to LiDAR-derived data without manual intervention. The procedures for automated displacement extraction are detailed in
Section 3.4.5.
3.4. Monocular Vision-Based Approach Using NeRF
The third data collection method employed a monocular vision-based workflow using a NeRF to reconstruct high-fidelity 3D models of sidewalk environments from consumer-grade video footage. A GoPro camera was mounted on a bicycle at a height of approximately 1 m and used to record approximately one minute of continuous video while circling each site at a steady speed of 1.4–1.5 m/s (see
Figure 5). This setup allowed for efficient and flexible data collection under natural lighting conditions without the need for specialized 3D sensors.
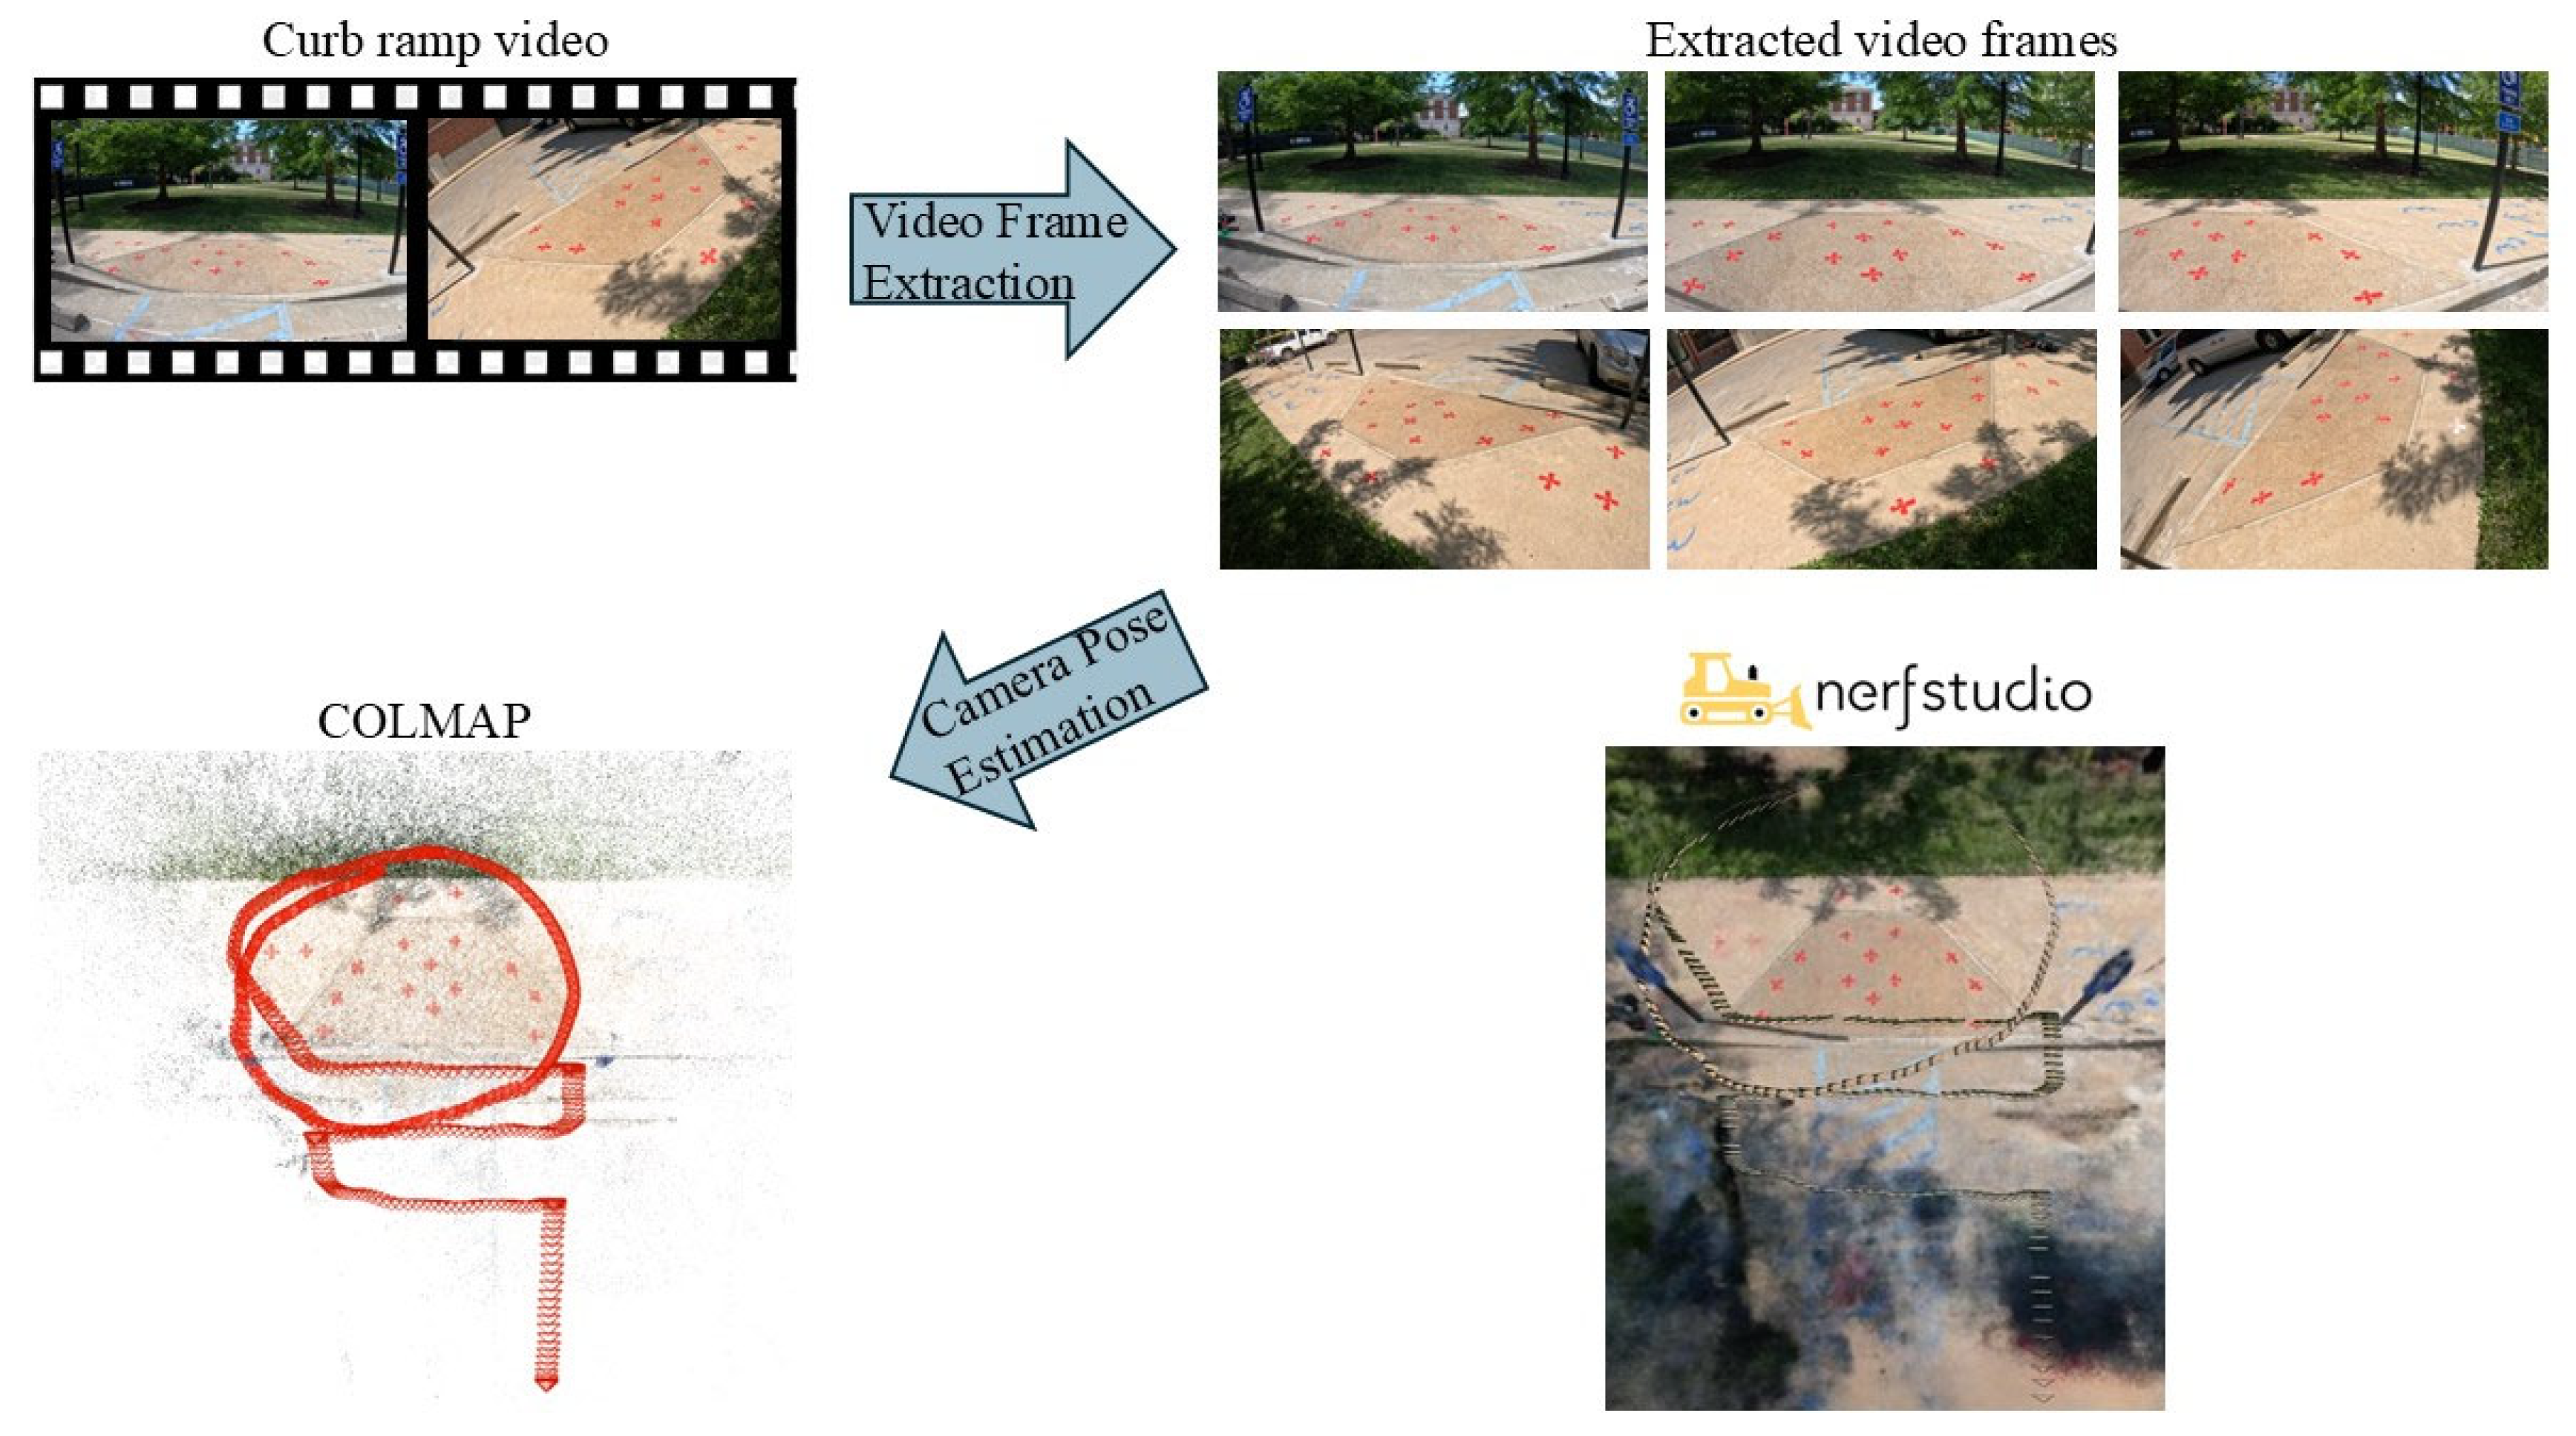
3.4.1. Preprocessing and Camera Pose Estimation
The recorded video was processed using nerfstudio, an open-source framework for NeRF training and rendering. Still frames were extracted from the video at regular intervals to ensure even spatial coverage of the scene. To enable accurate 3D reconstruction, camera poses for each frame were estimated using the Structure-from-Motion (SfM) pipeline implemented in COLMAP. This process included detecting image features, matching key points across frames, and performing bundle adjustments to refine camera intrinsics and extrinsics. Each extracted frame was also resized and normalized for brightness and contrast to maintain consistent visual quality across the training dataset. These preprocessing steps were essential for ensuring reliable NeRF model performance and scene fidelity.
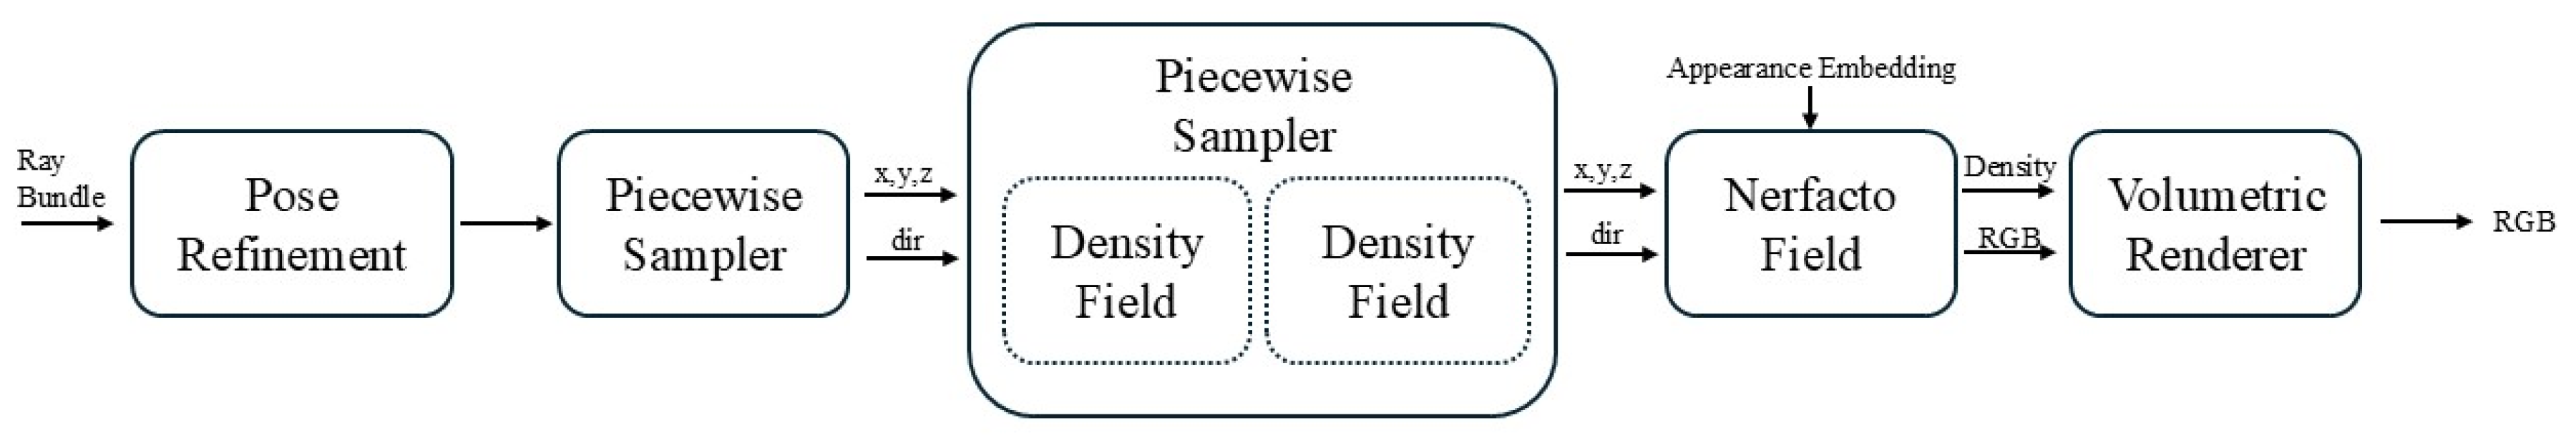
3.4.2. NeRF Model Training and 3D Reconstruction
The preprocessed frames and camera poses were used to train a volumetric scene representation using the Nerfacto architecture within nerfstudio. Nerfacto maps 3D spatial coordinates and camera viewing directions to RGB color and volumetric density (following the volumetric rendering formulation outlined in
Appendix A), enabling a photorealistic rendering of the scene from arbitrary viewpoints [
41]. As illustrated in
Figure 6, the training pipeline consists of ray sampling, pose refinement, and volumetric field optimization. The model was trained with a learning rate of 0.0005, using 4096 rays per batch, over 1,000,000 iterations. Training was performed on a high-performance workstation equipped with an Intel Core i9-13900 CPU, an NVIDIA GeForce RTX 4080 GPU, and 32 GB of RAM. Each training session required approximately 20 min per site. Upon completion, a dense 3D point cloud was extracted and exported in standard formats (e.g., .ply, .las) for further analysis.
3.4.3. Metric Extraction and Evaluation
From the NeRF-generated point clouds, three ADA-relevant geometric metrics were automatically extracted: the running slope, the cross slope, and vertical displacements. The same post-processing techniques developed for LiDAR-based data (detailed in
Section 3.4.4 and
Section 3.4.5) were applied to the NeRF outputs to ensure methodological consistency across all data sources. To assess the geometric accuracy of NeRF reconstructions, the extracted metrics were compared against those derived from high-end terrestrial LiDAR, treated as ground truth. Evaluation criteria included precision, recall, and F1 scores for 3D alignment. In addition, the visual fidelity of NeRF-generated 2D renderings was assessed using the peak signal-to-noise ratio (PSNR), Structural Similarity Index (SSIM), and Learned Perceptual Image Patch Similarity (LPIPS). The robustness of the NeRF pipeline under varying lighting conditions was also tested to evaluate performance consistency in real-world scenarios. Quantitative results for these evaluations are provided in the Results
Section 4.4 and
Appendix B and
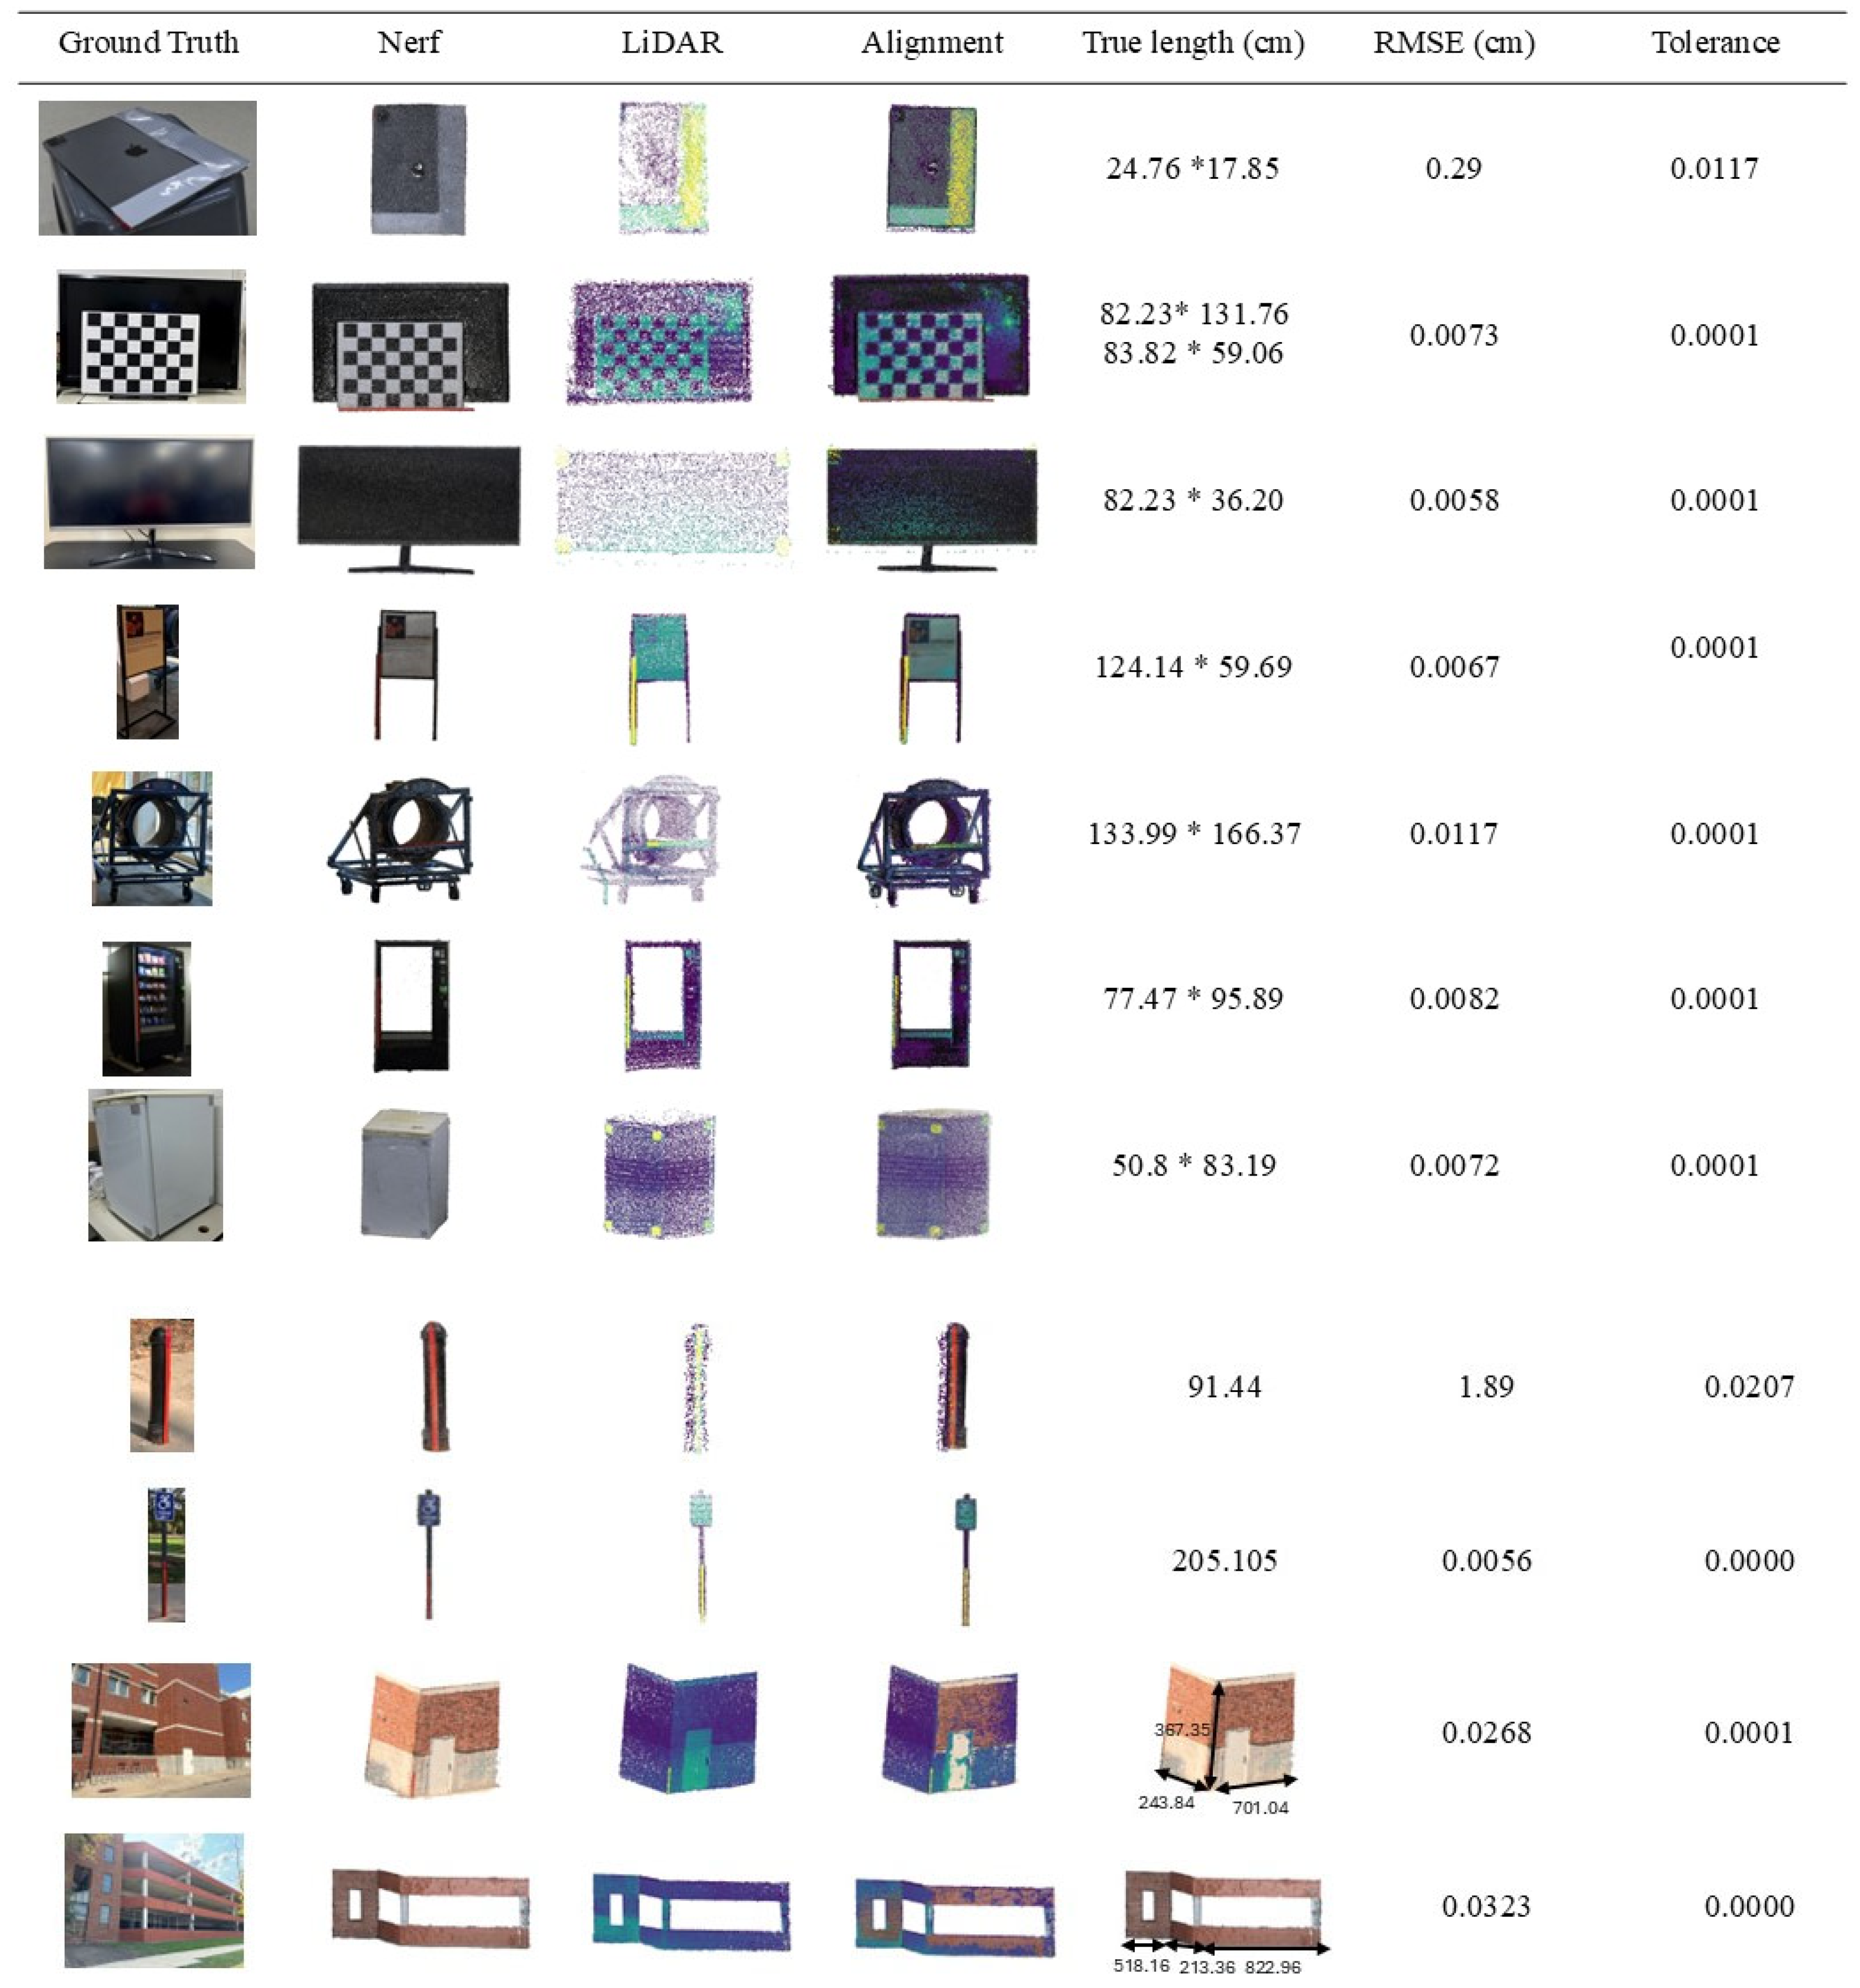
Appendix C. A validation study using high-end LiDAR ground truth assessed NeRF’s accuracy in capturing geometric features across diverse environments and spatial scales; the results are provided in
Appendix D.
3.4.4. Slope Detection from NeRF Point Clouds
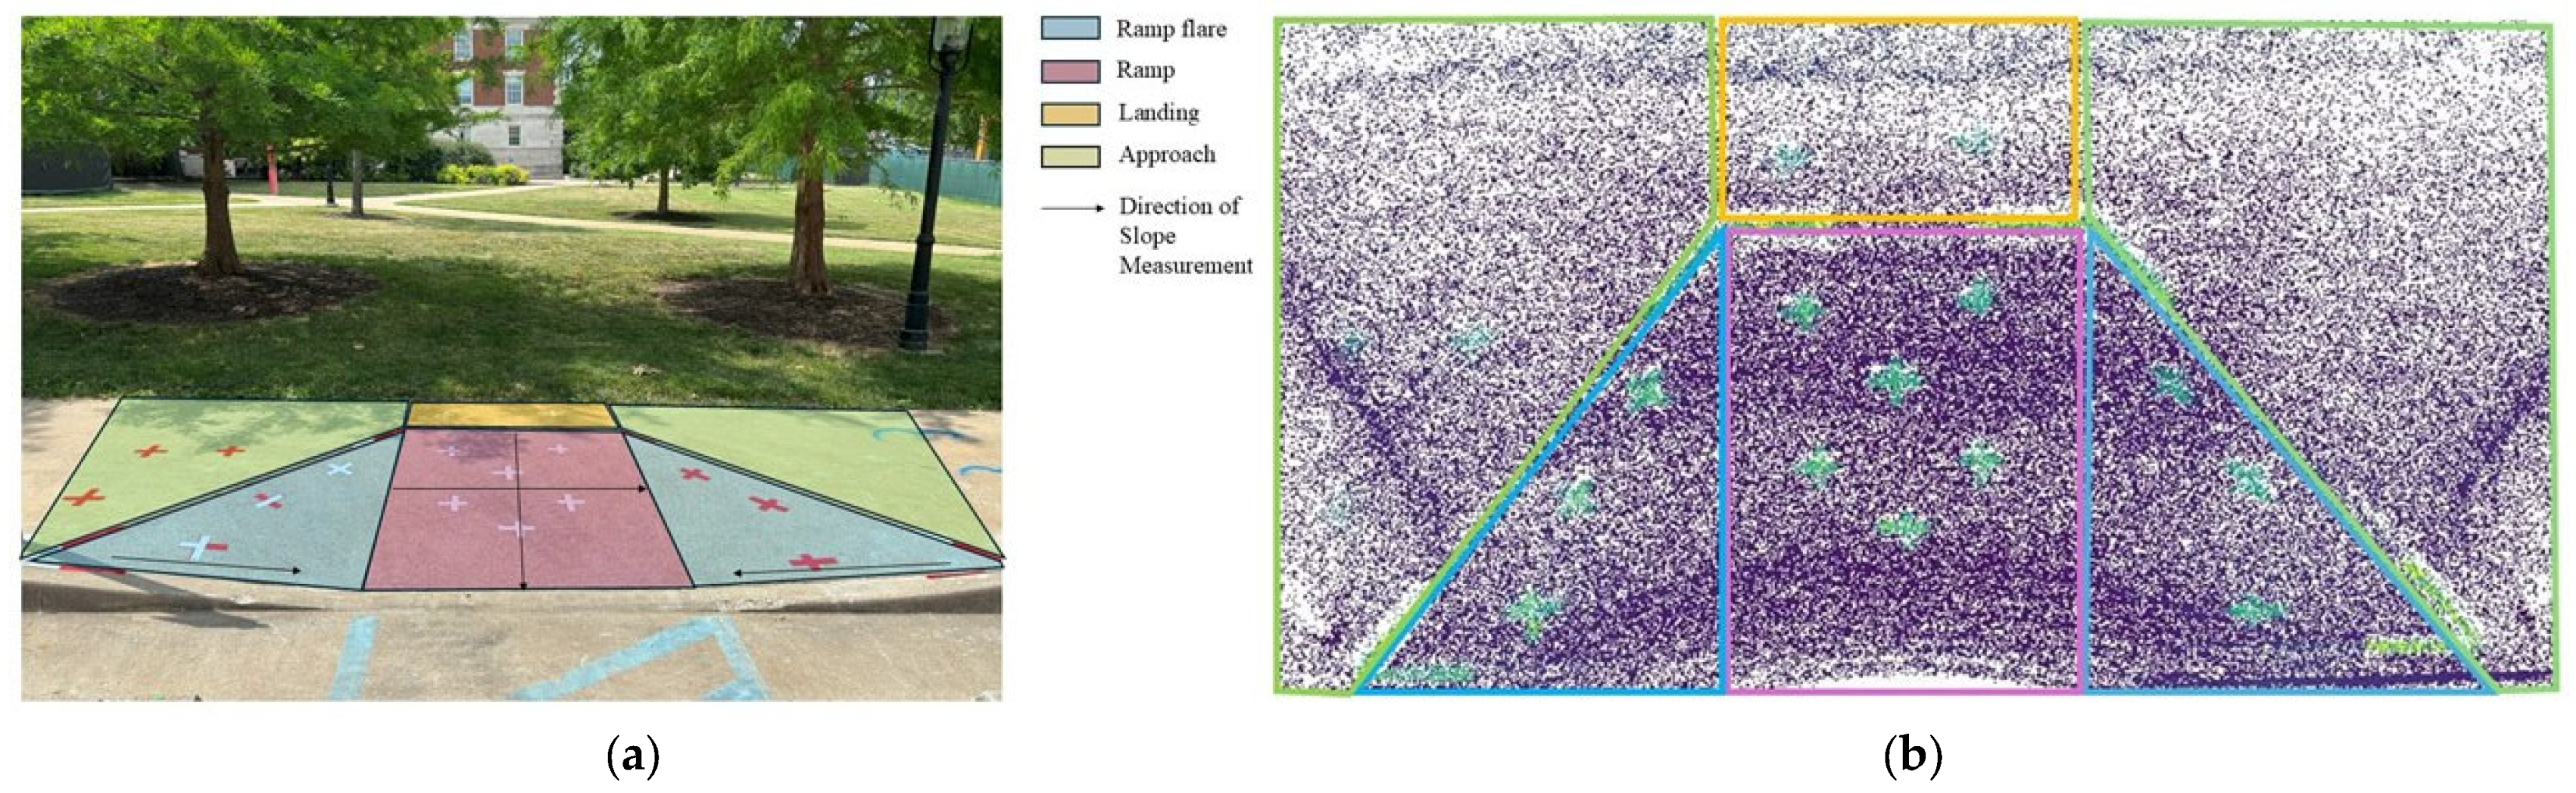
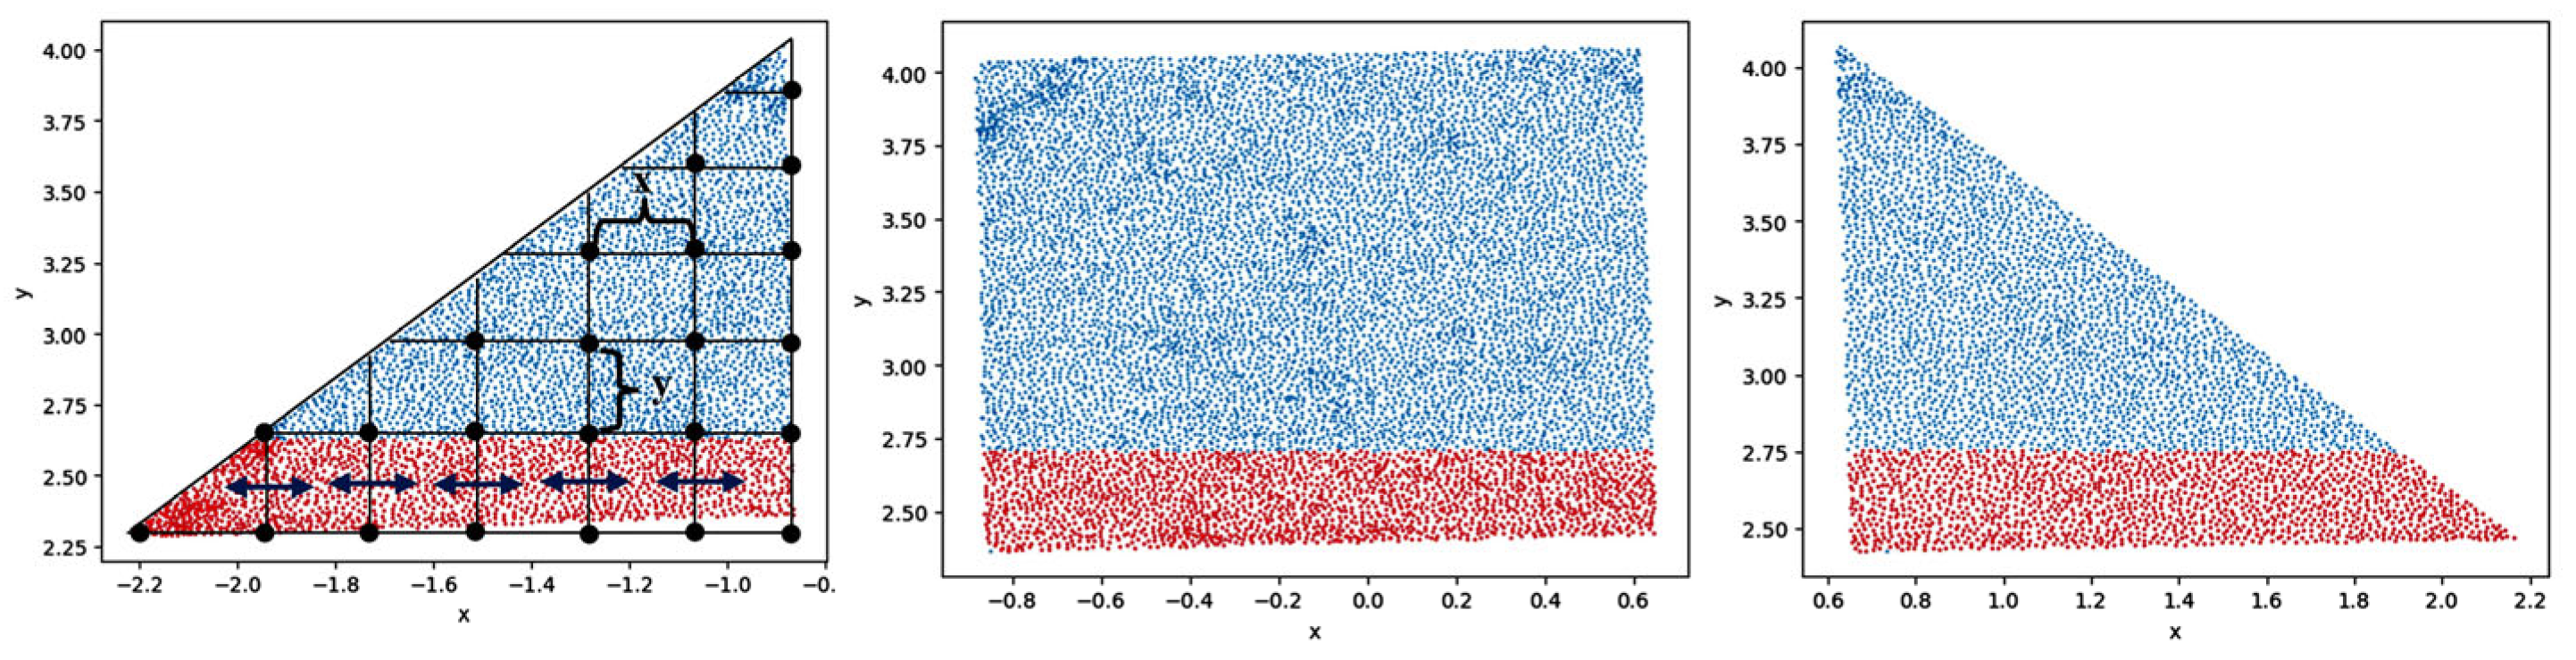
After point cloud reconstruction, the cross slope and running slope were extracted using an enhanced End-to-End (E2E) method designed to better capture localized geometric variations in complex surfaces, such as curb ramps and flares.
To compute the slope, multiple transect lines were defined across each ramp surface. Each line was subdivided into a series of uniform bins based on the aspect ratio of the surface to ensure even spatial coverage. Within each line, adjacent bins were used to calculate segment slopes, which were then averaged to represent the overall slope along the line. The final slope estimate for the ramp was obtained by averaging the slopes across all transects. This enhancement allowed for the detection of small-scale slope changes that may be missed by single-point tools, like digital levels or dual-axis tilt sensors. By aggregating across multiple local segments, this method also reduced the influence of noise or irregular pavement. The slope between two bins was calculated using the following:
where (
,
) and (
,
,
) represent the average coordinate values of neighboring bins.
Figure 7 shows an example of a selected line across a flare surface, divided into six bins, with slope vectors computed between each pair.
3.4.5. Vertical Displacements and Trip Hazard Detection
To enable vertical displacement detection in NeRF-generated point clouds, a 12-inch reference ruler was placed at each scene. This ruler was used to compute a voxel-to-real-world scaling factor:
A vertical displacement was then computed as follows:
Manual measurements were also extracted for validation, and a comparison between NeRF and LiDAR measurements at a specific point is provided in
Table 1. The small absolute differences observed suggest that NeRF can serve as a reliable alternative to LiDAR for detecting trip hazards.
Automatic hazard detection using elevation gradients: To automate trip hazard identification, the z-axis elevation values were reshaped into a 1D array and binned into 255 intervals to analyze vertical change distributions. Vertical displacement gradients were computed using the Sobel operator in the y-direction. A threshold-based filter was applied to flag areas exceeding ADA limits:
The detection method estimated the slope using the gradient:
where
p is the resolution, defined as 1 cm per pixel;
σ = 3 pixels (based on the crack width); and
T is the detection threshold.
The 3 × 3 Sobel kernel used for computing gradients in the y-direction is as follows:
The y-gradient of the z-channel was computed as follows:
Significant changes were detected by applying a threshold:
This approach enabled efficient pre-screening of large sidewalk areas for vertical discontinuities without requiring manual input.
4. Evaluation
This section presents two sets of evaluations. First, we assess the geometric and visual fidelity of the NeRF reconstructions compared to high-resolution LiDAR point clouds. Second, we evaluate sidewalk segments for ADA compliance using extracted slope and elevation metrics from NeRF, LiDAR, and manual methods. Five performance dimensions—accuracy, cost, time, automation, and scalability—were used to compare methods.
4.1. Visualization of Curb Ramp and Sidewalk
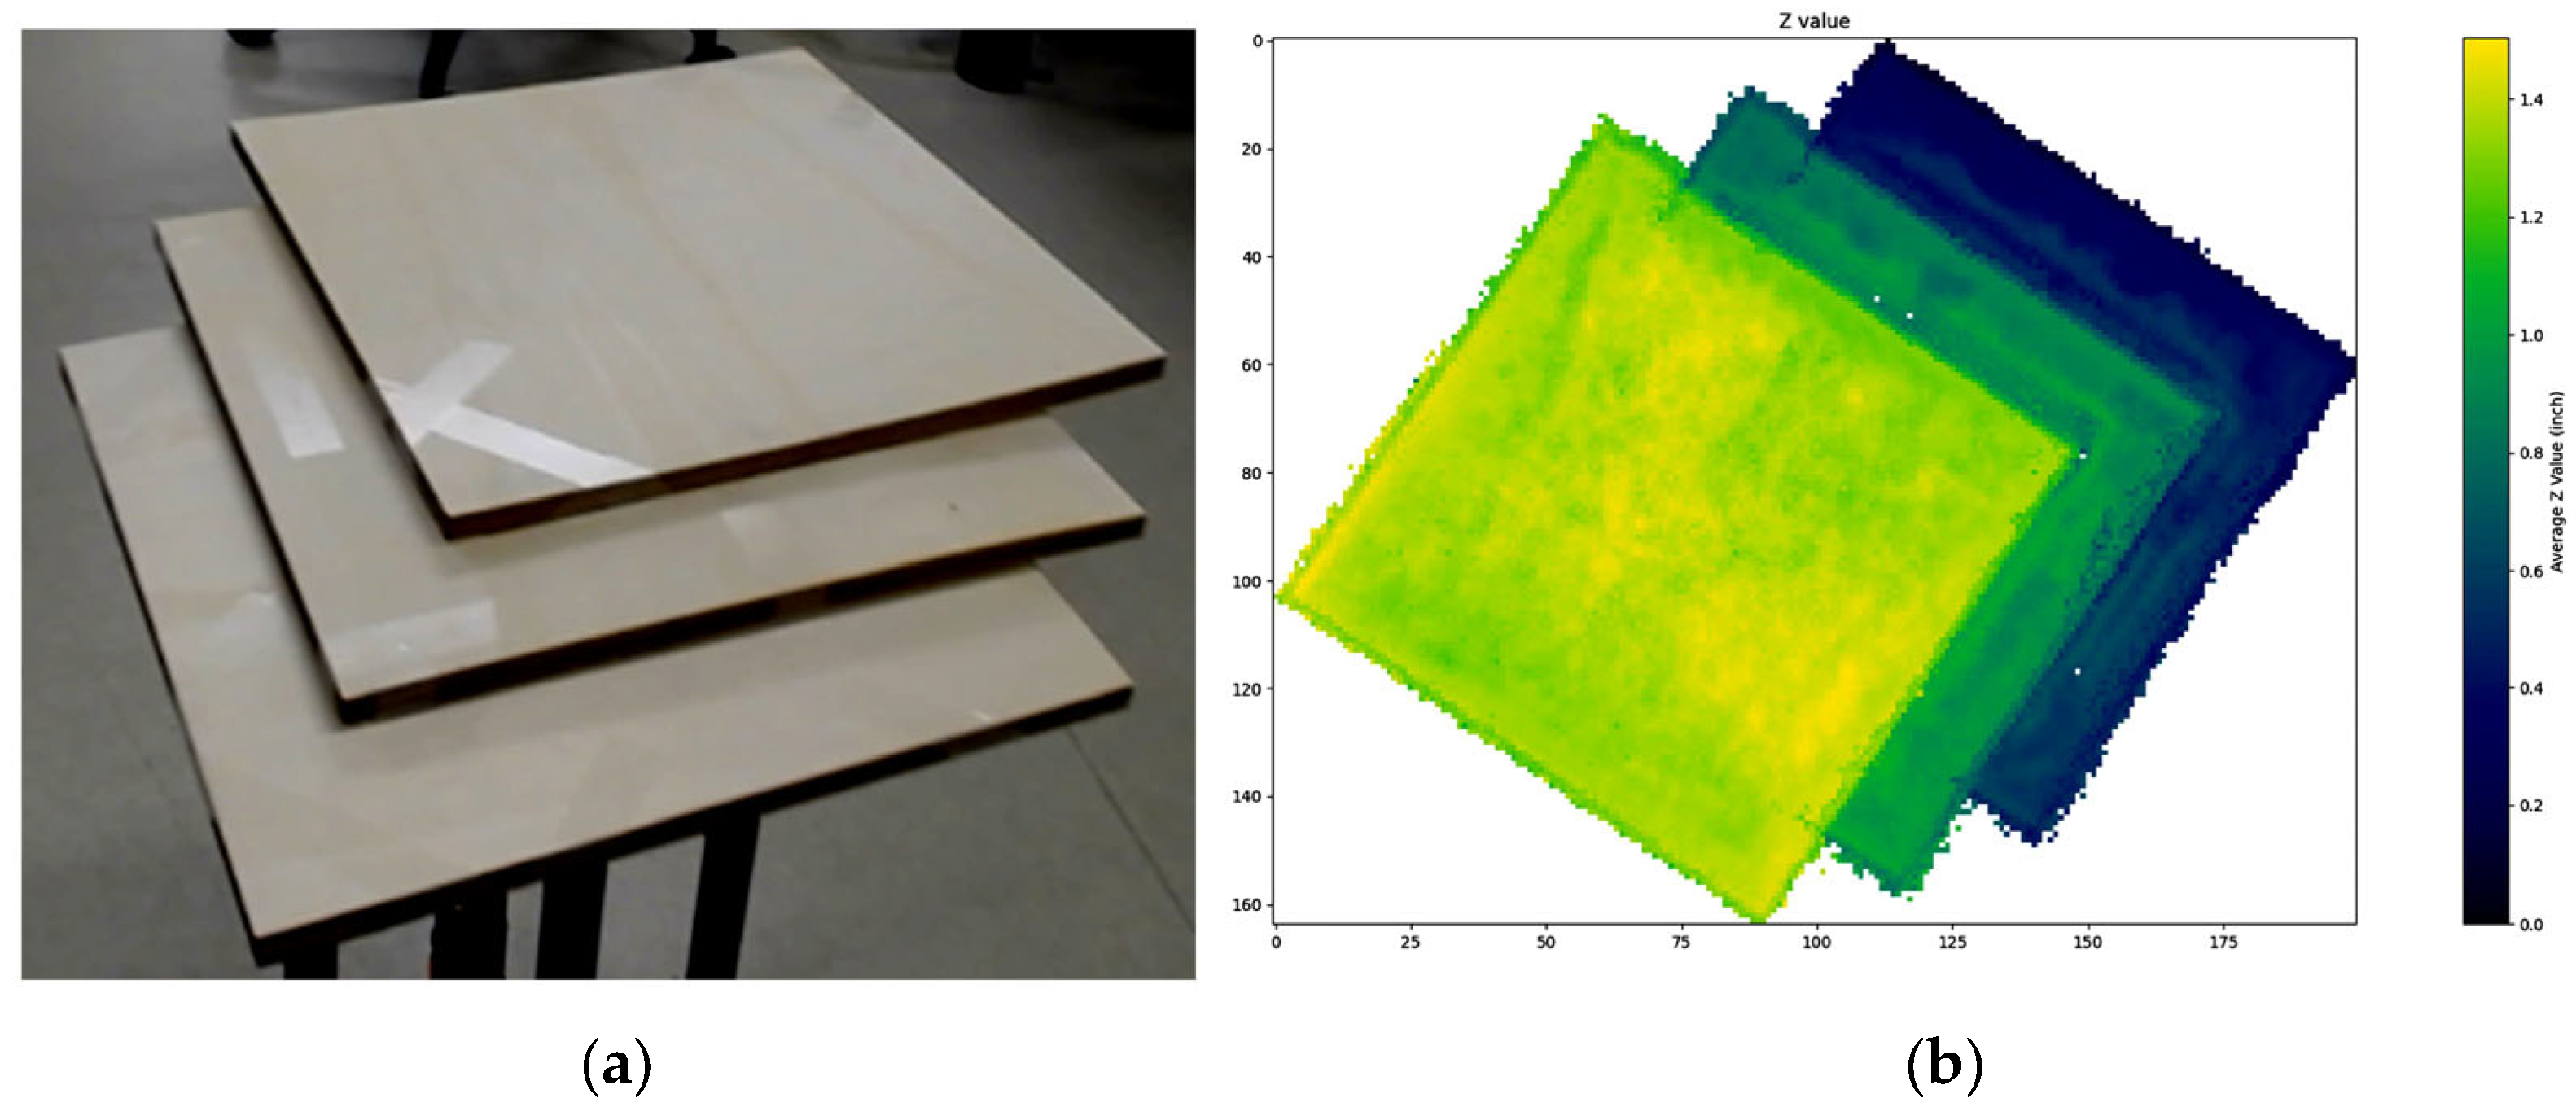
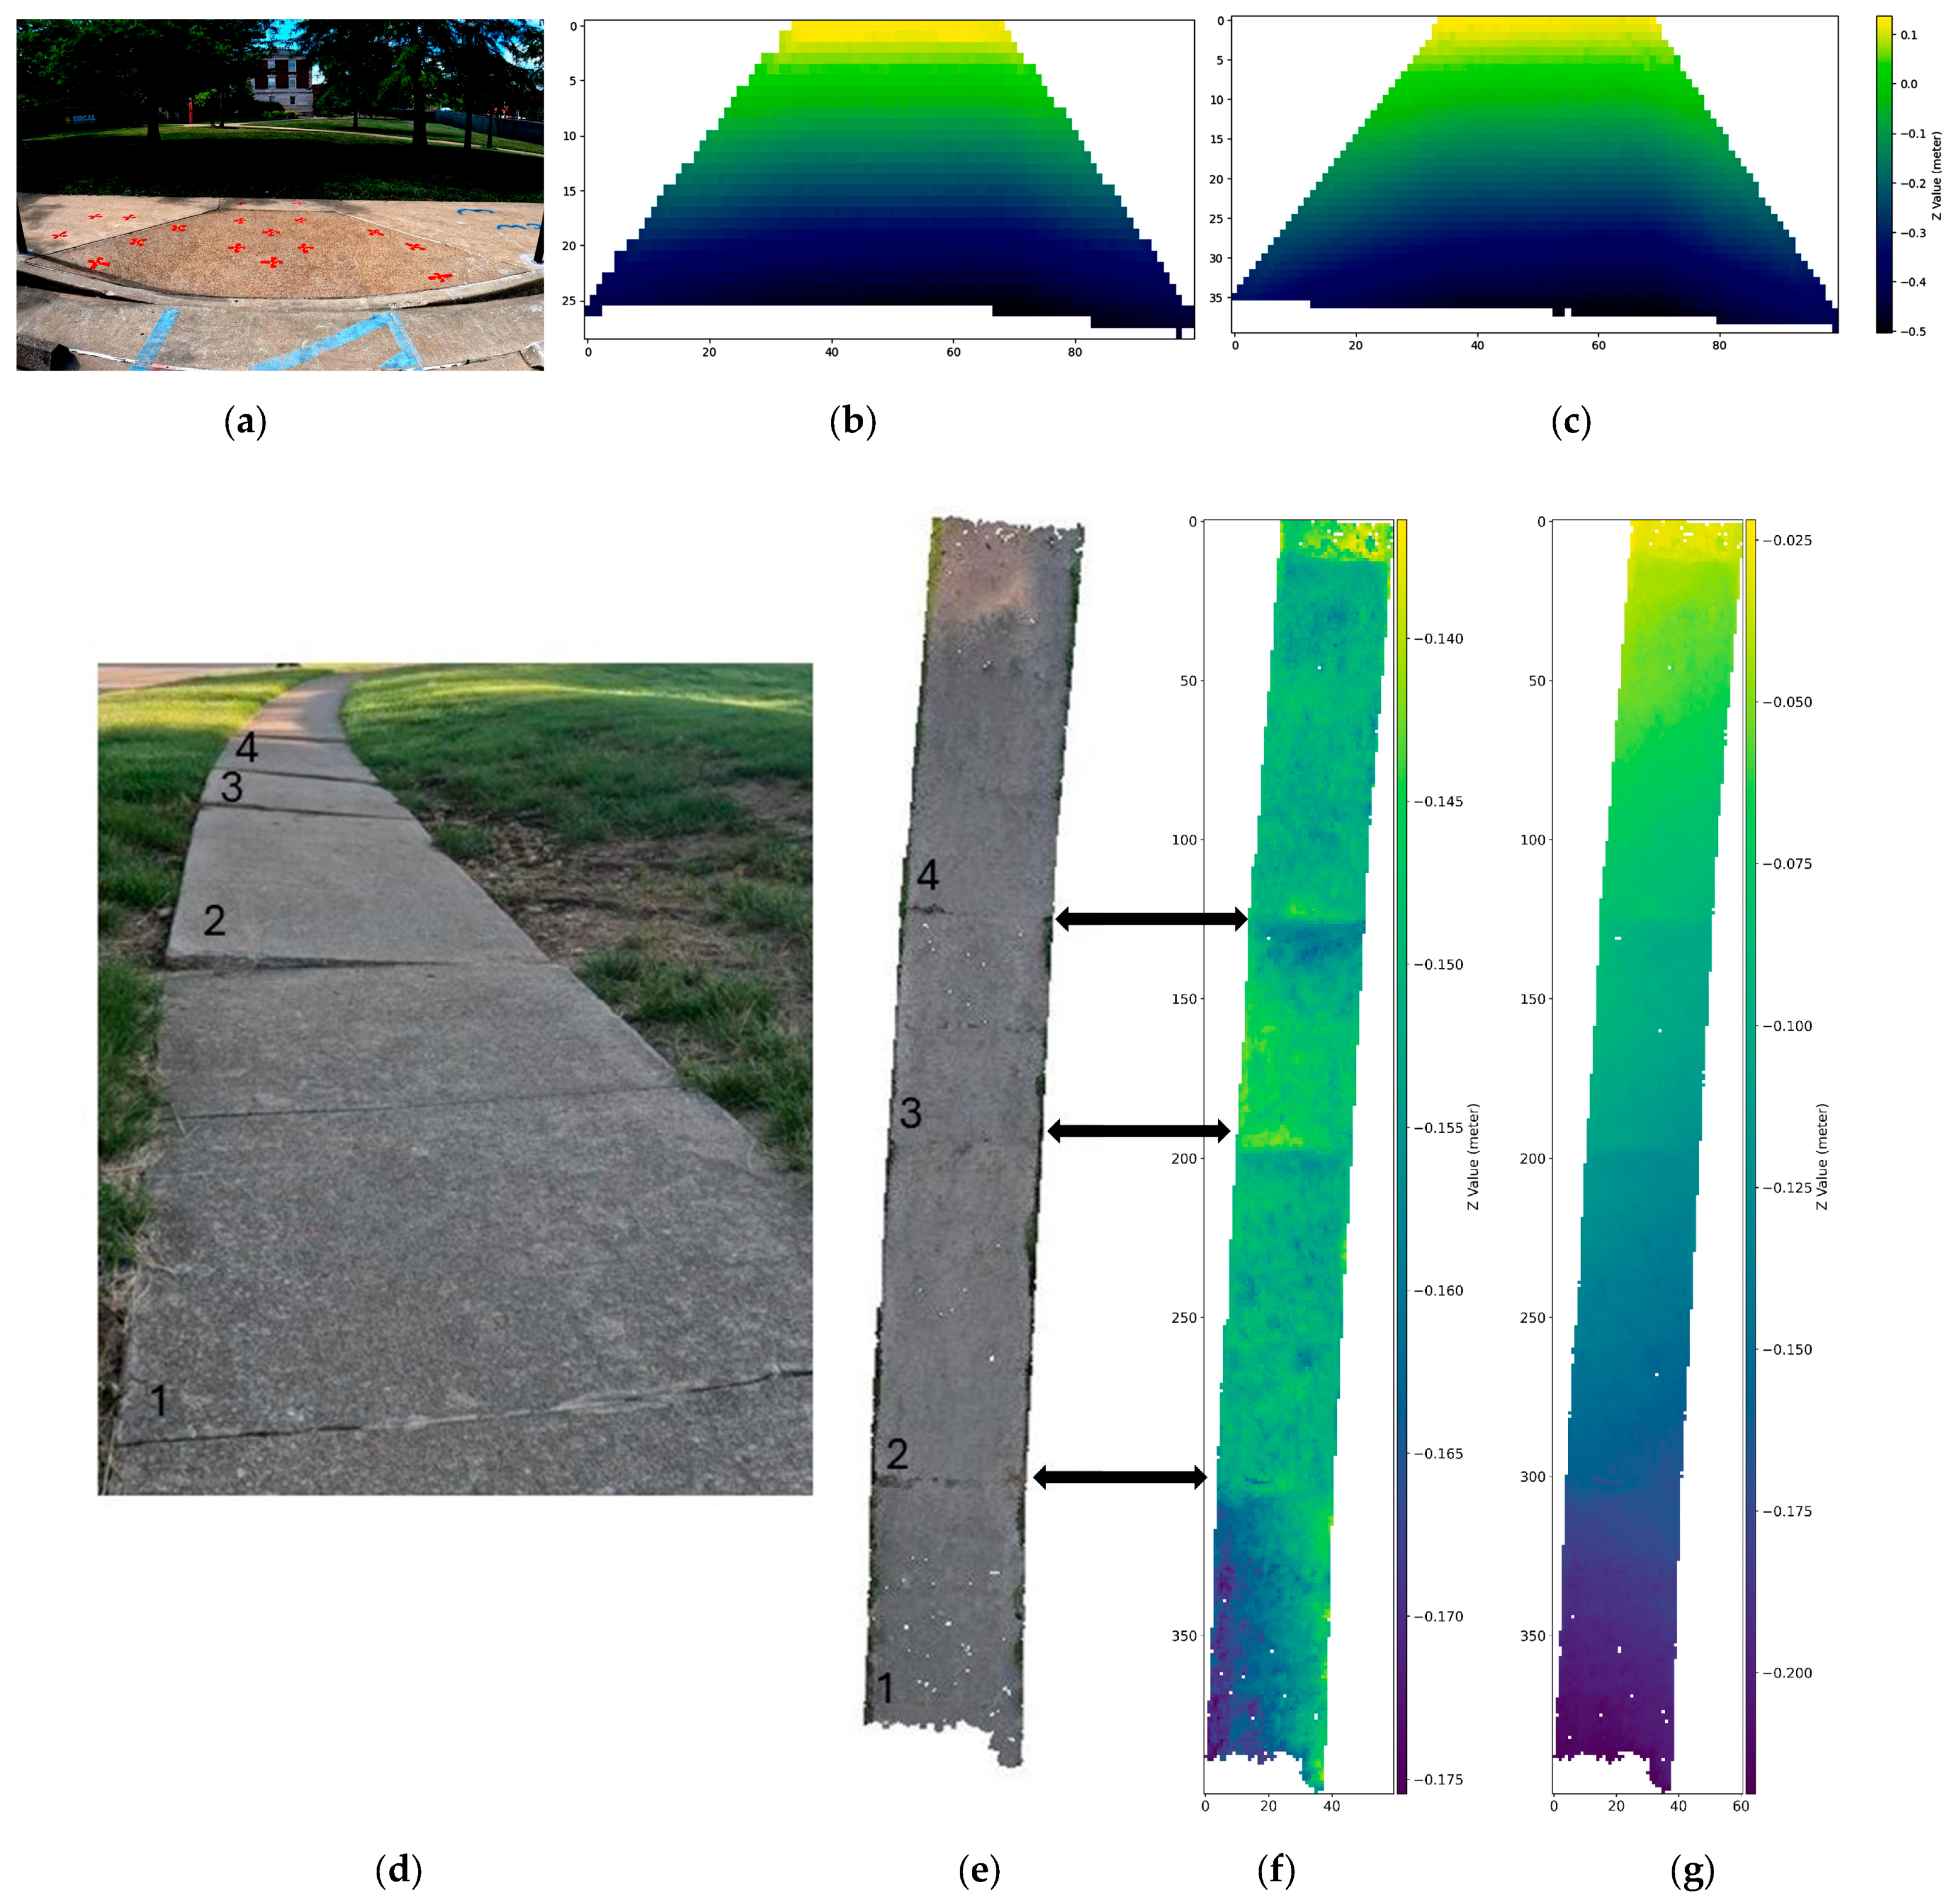
To support the interpretation of geometric surface features, the average elevation (z-value) within each spatial bin was computed and visualized using a color gradient, where lighter shades indicate higher elevations. This technique enabled clear visual comparisons of cross and running slopes across different sidewalk segments. For the curb ramp, elevation profiles generated from both NeRF and LiDAR point clouds showed strong agreement, as seen in
Figure 8b,c. This close alignment suggests that a NeRF is capable of providing LiDAR-equivalent geometric measurements in complex sidewalk geometries. For Sidewalk 1, cross slope analysis was performed by first rotating the point cloud to remove the influence of the running slope. This top-down segmentation, shown in
Figure 8e,f, revealed clearly defined slab boundaries. The first slab section showed noticeable subsidence (indicated by darker colors), while the left edge of the third section exhibited an elevated terrain (lighter colors), consistent with field observations.
When both the running and cross slopes were visualized together (
Figure 8g), Sidewalk 4 exhibited a smooth color gradient from dark to light, representing a continuous elevation change. This gradient reflected the sidewalk’s sloped profile and confirmed agreement between the 3D reconstruction and the known site conditions. These visualizations demonstrate that a NeRF is not only capable of capturing slope and elevation variations with high fidelity but can also outperform LiDAR in producing denser, more continuous surface models. The higher point density in NeRF-generated reconstructions enhances the visibility of subtle features—such as slab transitions, elevation drops, and surface deformations—that are critical for evaluating ADA compliance.
4.2. NeRF Performance Metrics
4.2.1. Three-Dimensional Reconstruction Accuracy
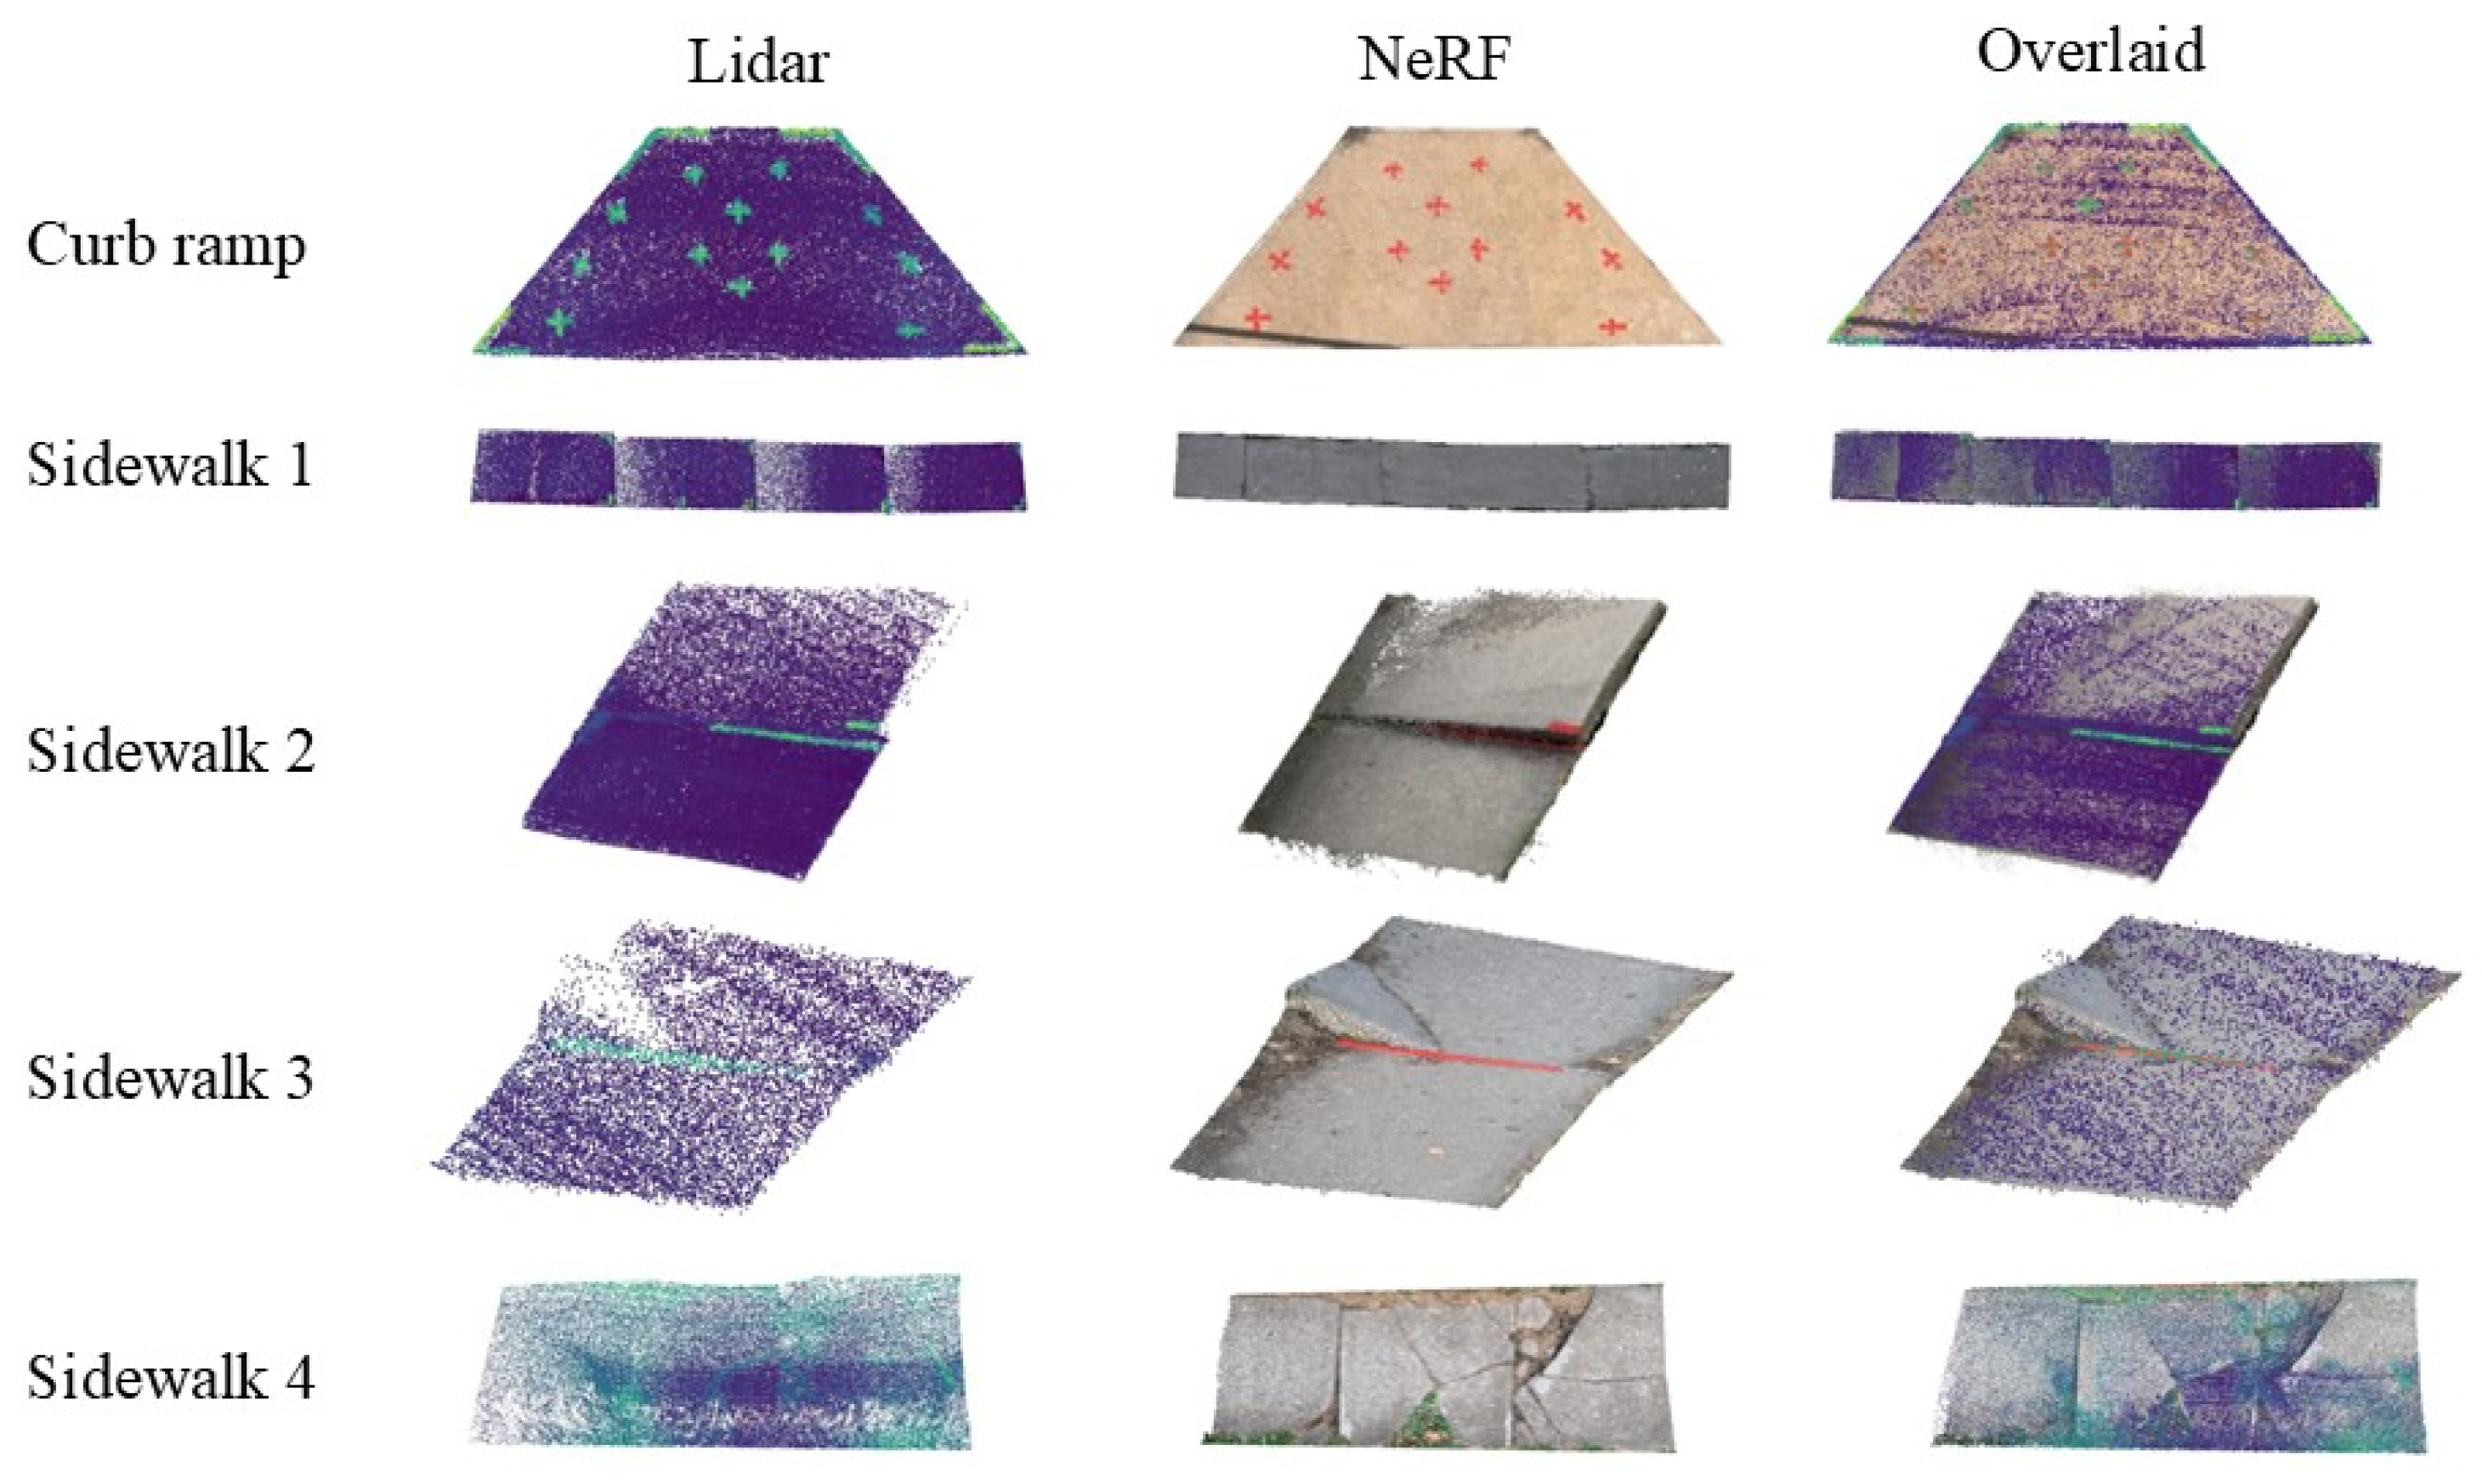
To evaluate geometric accuracy, the NeRF point clouds were manually aligned with ground truth LiDAR scans in CloudCompare using twelve reflective control points. The alignment was refined with a rigid transformation matrix, allowing for scale, rotation, and translation normalization.
Figure 9 illustrates the aligned point clouds from the NeRF and LiDAR. We assessed geometric similarity using the following:
Precision: the percentage of NeRF points within a threshold distance of the nearest LiDAR point.
Recall: the percentage of LiDAR points that were captured within a threshold by NeRF.
F1 score: the harmonic mean of precision and recall.
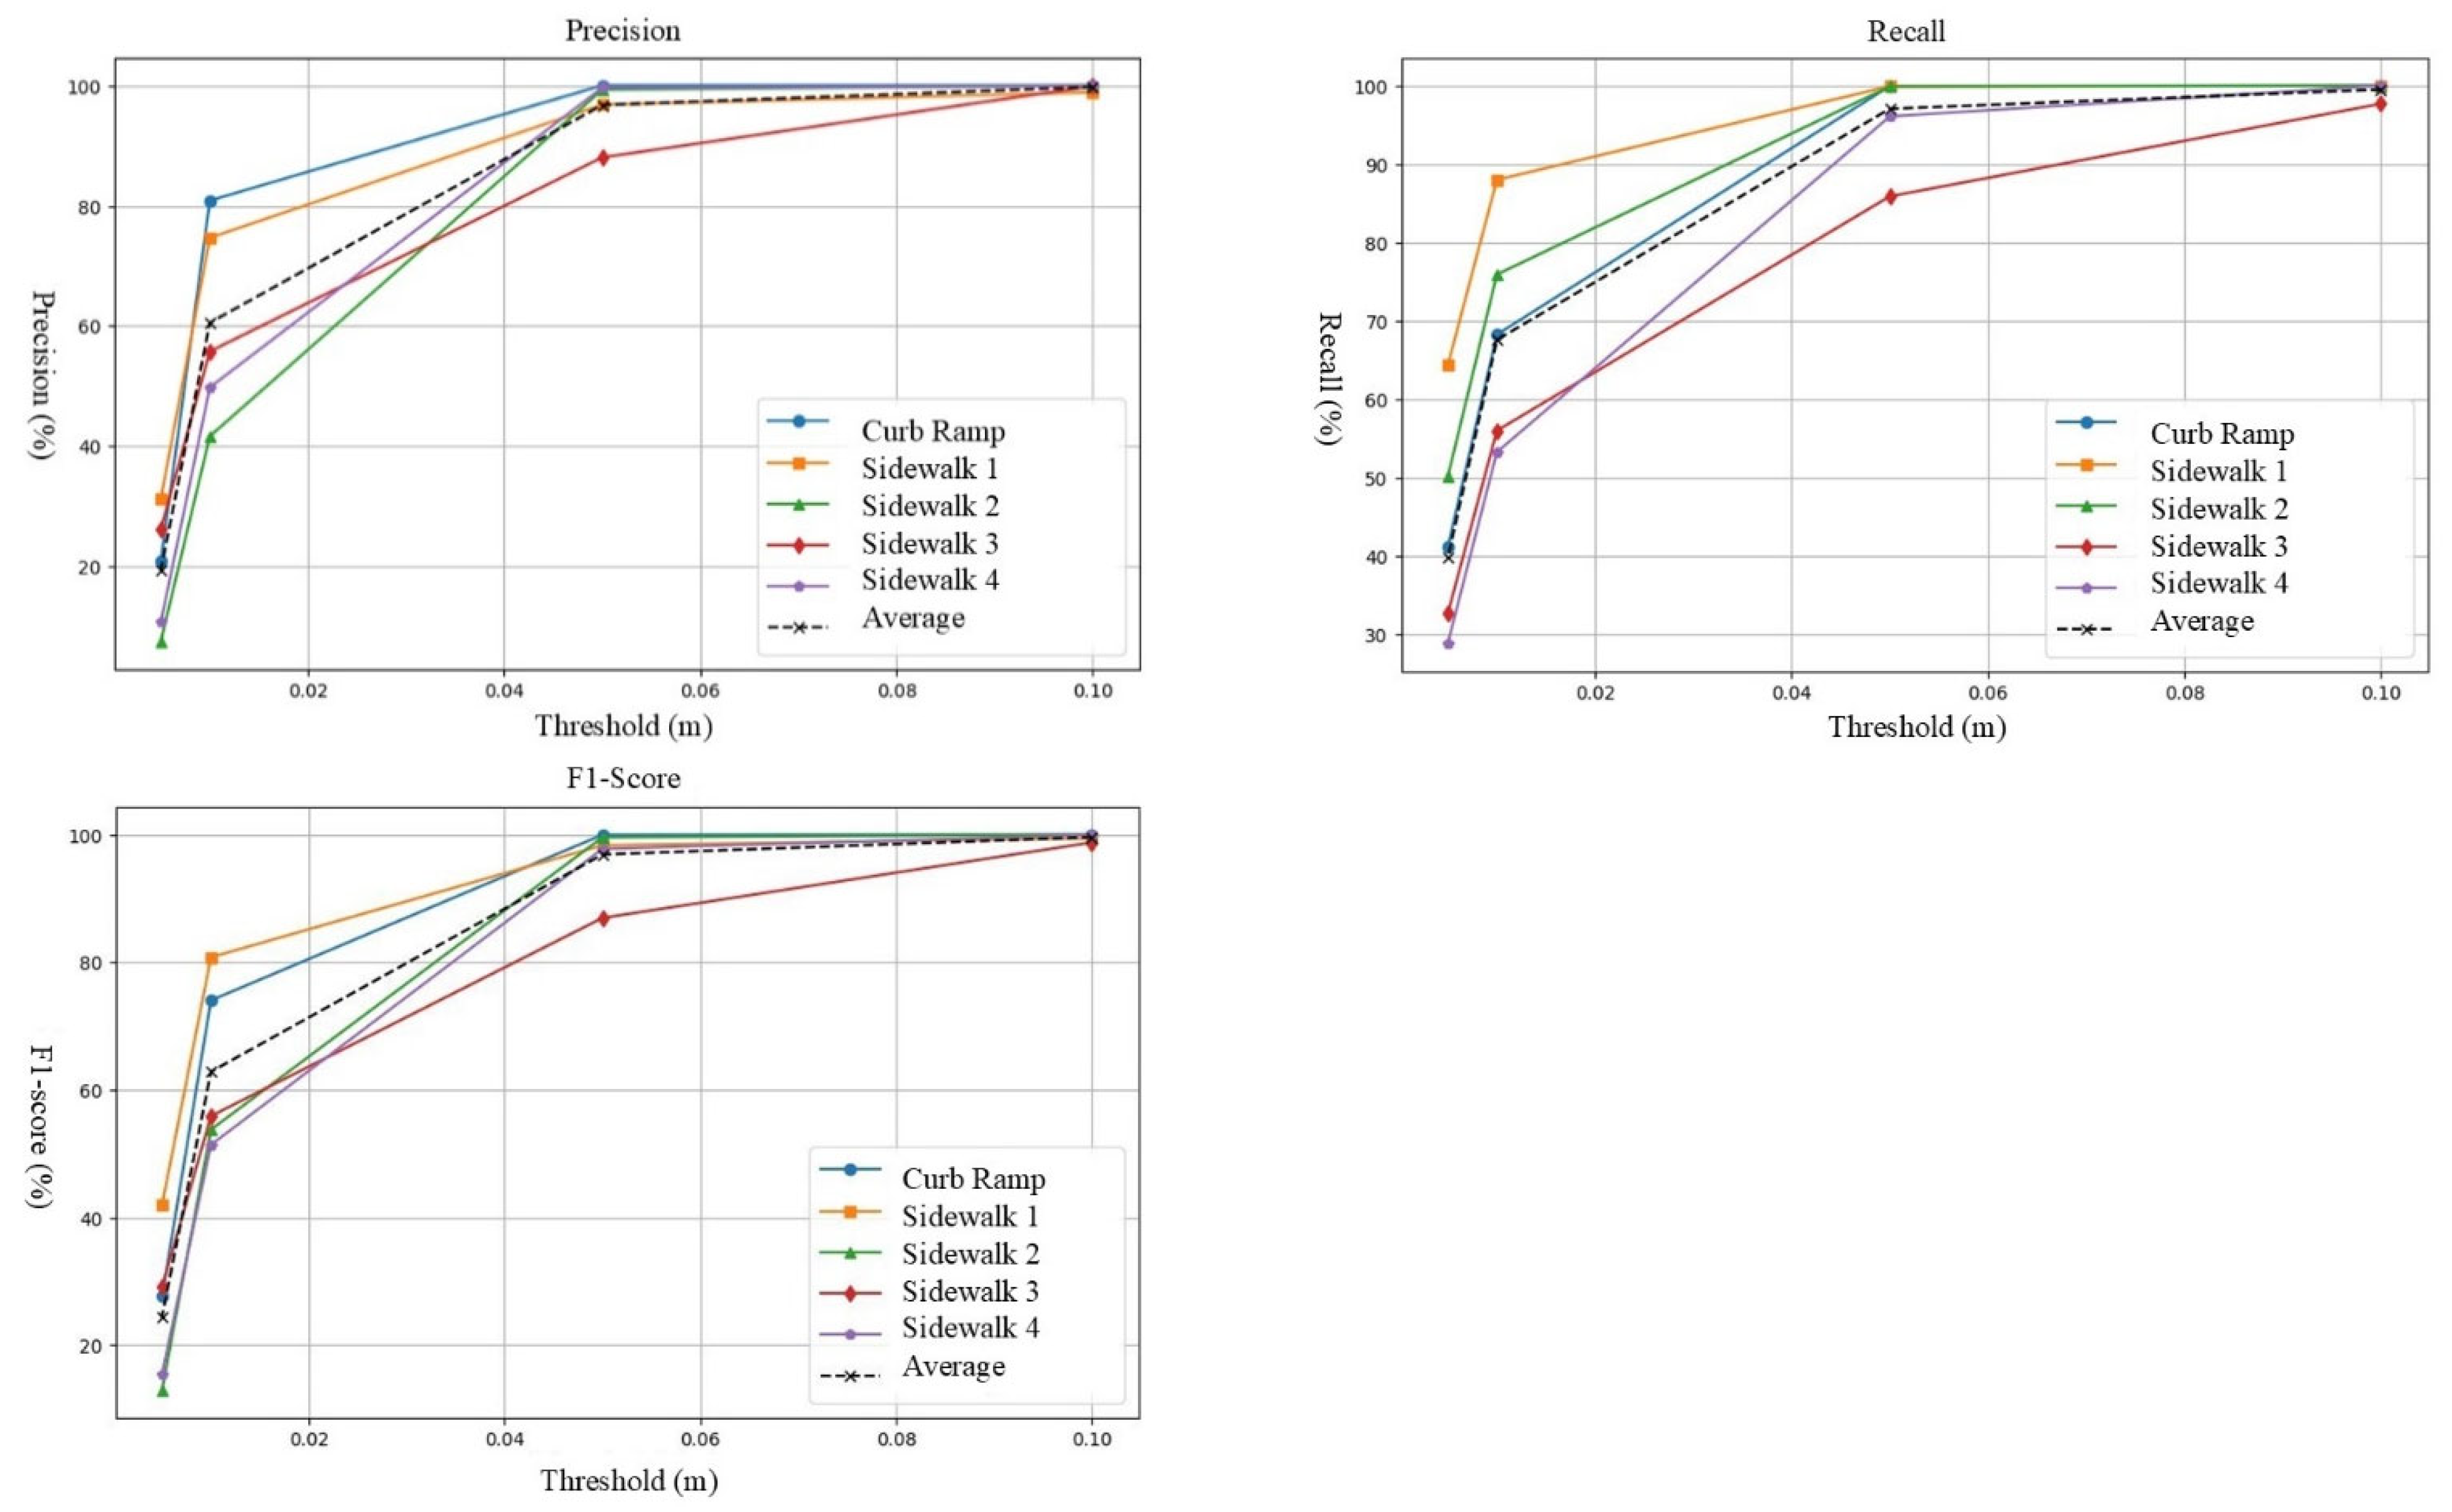
Thresholds of 1 cm and 5 cm were used to assess alignment sensitivity across resolutions. Precision and recall both exceeded 90% at 5 cm, demonstrating that NeRF reconstructions capture sidewalk geometry at a resolution suitable for engineering use.
4.2.2. Visual Rendering Accuracy
In addition to geometric accuracy, we evaluated NeRF’s ability to generate photorealistic 2D renderings using the following metrics:
PSNR (peak signal-to-noise ratio): measures pixel-level fidelity.
SSIM (Structural Similarity Index): evaluates perceptual similarity across luminance and structure.
LPIPS (Learned Perceptual Image Patch Similarity): measures high-level perceptual differences using deep feature maps.
A higher PSNR and SSIM and a lower LPIPS indicate higher visual fidelity. These metrics are summarized in
Appendix B.
4.3. ADA Compliance Benchmarking
Table 2 summarizes the ADA slope and displacement thresholds used for compliance evaluation. For each segment and curb ramp, the slope and vertical displacements were computed from NeRF reconstructions and validated against LiDAR and manual measurements.
Each method was evaluated based on the following:
Accuracy: alignment with LiDAR ground truth.
Cost: equipment, software, and labor.
Time: collection and processing durations.
Automation: extent of manual intervention required.
Scalability: suitability for citywide sidewalk audits.
Table 2 provides slope ranges, compliance thresholds, and repair recommendations in alignment with MoDOT ADA standards [
8].
4.4. Results
4.4.1. NeRF Performance
To comprehensively evaluate the NeRF reconstruction framework, both geometric accuracy and visual quality were assessed across all test sites.
Figure 10 presents the sample reconstruction outputs, while
Table 3 reports the average precision, recall, and F1 scores across multiple spatial thresholds.
Table 4 summarizes the 2D image quality metrics—PSNR, SSIM, and LPIPS—which reflect fidelity to the input video frames. Higher PSNR and SSIM values denote superior visual quality, while lower LPIPS scores indicate closer perceptual similarity to ground truth images.
Across all sidewalk segments and curb ramps, the NeRF consistently demonstrated strong reconstruction performance. As expected, geometric precision and recall improved as the distance threshold for evaluation widened. Among the five surveyed sites, the curb ramp yielded the highest geometric precision, followed closely by Sidewalk 1, which also achieved high recall and F1 scores. These results suggest strong agreement between NeRF- and LiDAR-derived ground truth in these areas.
Sidewalk 3, however, exhibited the lowest precision and recall. While this might initially suggest poorer performance, the 2D image quality metrics tell a different story. Sidewalk 3 achieved the highest SSIM score (0.5712) and one of the lowest LPIPS scores (0.3337), indicating that the NeRF preserved fine structural and textural details more effectively than LiDAR in that location. This apparent discrepancy likely reflects limitations in the LiDAR ground truth, which may have under-sampled sharp discontinuities, like large trip hazards, which were captured more accurately in the NeRF reconstruction. Consequently, the reduced geometric overlap should not be interpreted as NeRF failure but rather as a challenge in benchmarking vision-based methods against sparse or occlusion-limited LiDAR data.
Among all evaluated locations, Sidewalk 1 emerged as the strongest candidate for benchmarking. It demonstrated excellent alignment with LiDAR in geometric terms and achieved top-tier scores across all image-based metrics. These findings suggest that a NeRF can deliver LiDAR-comparable reconstructions with high visual fidelity, offering a scalable and low-cost solution for sidewalk condition monitoring and ADA compliance assessments.
4.4.2. Slope and Vertical Displacement Measurement Results
To evaluate slope estimation accuracy on irregular surfaces, slope measurements for individual segments of the curb ramp were computed using the enhanced E2E method applied to both NeRF and LiDAR point clouds. These automated results were then compared with manual measurements collected using a digital level, a dual-axis tilt (DAS) sensor, and a smartphone (iPhone 15), as presented in
Table 5. The NeRF, LiDAR, and digital-level measurements demonstrated strong agreement across all ramp components, consistently yielding the same ADA compliance classifications. This consistency reinforces the validity of NeRF as a reliable and accurate method for geometric slope assessments, comparable to high-end LiDAR systems.
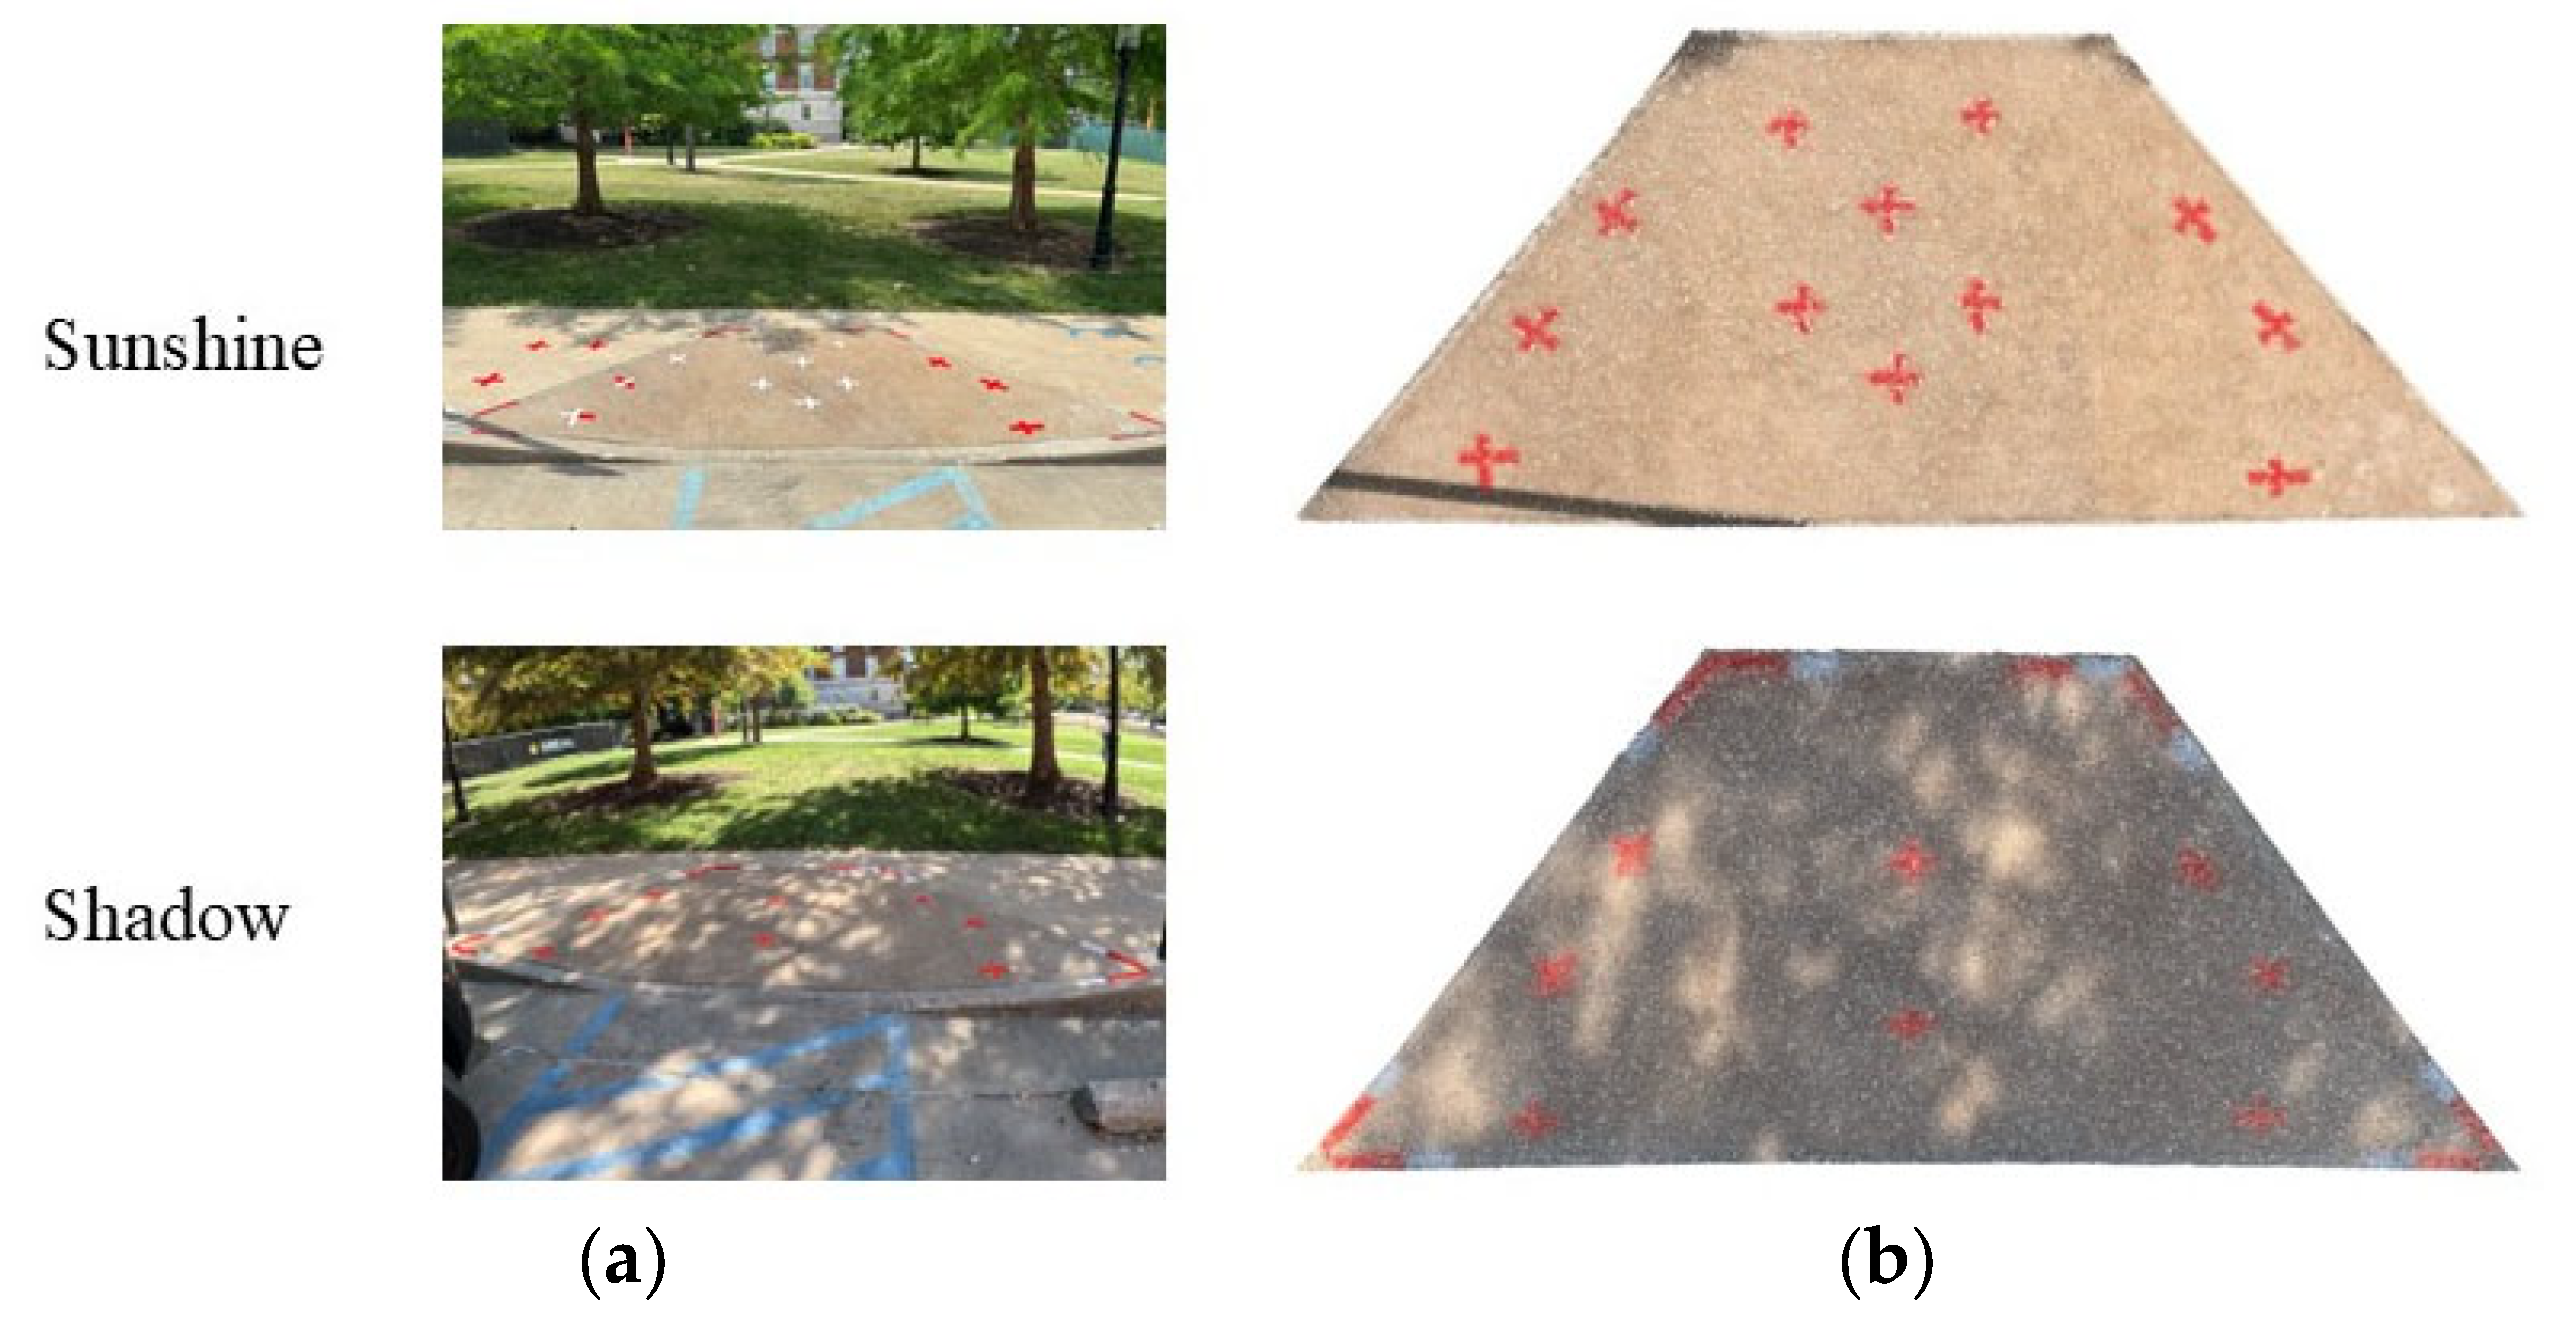
In contrast, measurements obtained from the DAS and smartphone deviated notably from the NeRF and LiDAR baselines. The DAS exhibited substantial variability, likely due to its high sensitivity to minor positional changes and vibrations. Likewise, the smartphone’s built-in inclinometer produced less reliable results, underestimating slope values even in segments with clearly defined inclines. These inconsistencies highlight the limitations of consumer-grade devices and low-cost sensors in environments requiring high geometric precision. To further assess robustness, NeRF and LiDAR slope measurements were repeated under two lighting conditions—full sunlight and partial shade—on the same curb ramp. As detailed in
Appendix C, both conditions yielded compliant results, with slightly reduced errors under shaded conditions. This outcome confirms the stability and reliability of NeRF- and LiDAR-derived slope estimates under variable illumination.
Table 6 presents the slope measurements for Sidewalk 1, which was divided into four segments to facilitate localized comparisons. Measurements were obtained using five methods: NeRF, high-end LiDAR (used as the reference standard), a digital level, a dual-axis tilt (DAS) sensor, and a smartphone (iPhone 15). The segmentation of the sidewalk was necessary to accommodate the limited spatial coverage of the LiDAR system and to isolate localized geometric variations that could affect compliance.
The NeRF and LiDAR produced closely aligned results across all segments, with a mean absolute difference of 0.49° for cross slopes and 0.95° for running slopes. This high degree of agreement demonstrates a NeRF’s capacity to capture slope geometry with near-LiDAR precision. Importantly, both the NeRF and LiDAR consistently detected noncompliant slope conditions across all segments, supporting their reliability for ADA compliance evaluations.
By comparison, the digital level showed greater variability, particularly in Segments 1 and 4, where it failed to identify noncompliant running slopes that were clearly detected by the NeRF and LiDAR. These discrepancies are likely due to the digital level’s reliance on discrete point measurements, which can miss subtle or localized slope variations—especially when the pavement is irregular or warped. Measurements from the DAS sensor and smartphone were the least accurate. Both methods frequently underestimated slope magnitudes and failed to detect several noncompliant conditions, particularly for running slopes. These errors likely stem from the DAS’s susceptibility to motion-induced noise and the smartphone’s limited angular resolution. Overall, the NeRF provided highly accurate and reliable slope assessments, aligning closely with LiDAR and significantly outperforming lower-cost alternatives. These findings highlight NeRFs’ promise as a scalable and cost-effective solution for detailed sidewalk compliance assessments, especially in settings where traditional survey instruments may be impractical or inaccessible.
Sidewalk segments 2, 3, and 4 presented challenging conditions for detecting abrupt or localized elevation changes—commonly associated with vertical trip hazards. In the LiDAR datasets (see
Figure 8), sparse point density and the reliance on precise sensor positioning limited the resolution of fine surface features. Even with reflective tape markers, significant anomalies, such as the large trip hazard on Sidewalk 3 and a surface crack on Sidewalk 4, were poorly defined or incompletely captured.
In contrast, the NeRF-based reconstructions delivered higher spatial coverage and resolution without requiring constrained viewing angles. This flexibility enabled the model to detect fine-scale vertical features with greater fidelity, as evidenced by the detailed reconstructions shown in
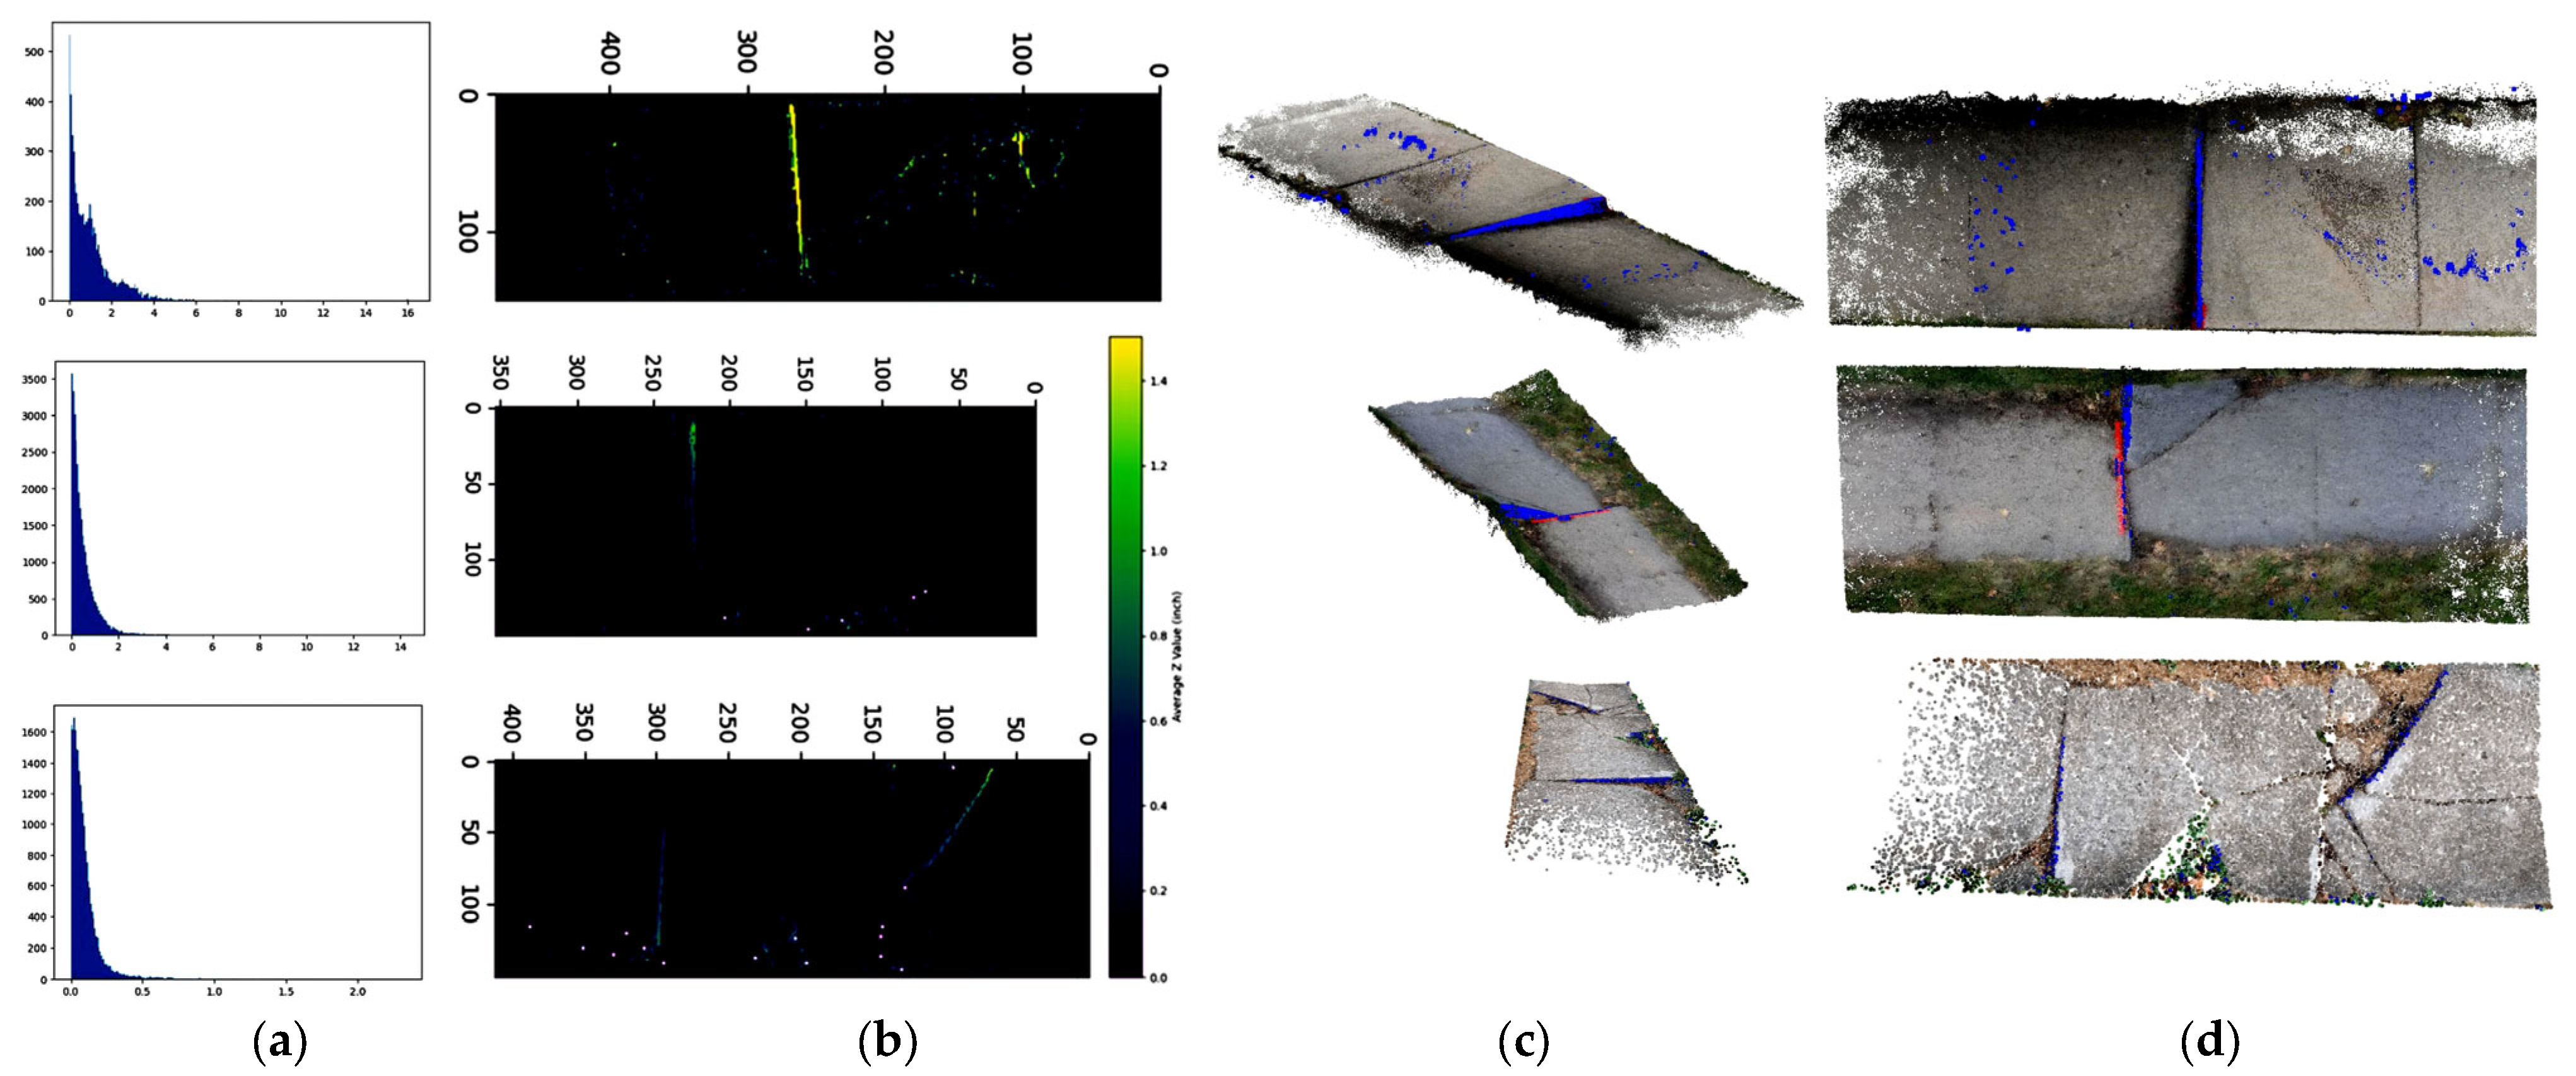
Figure 8. Ground-truthing was performed using a tape measure to identify trip hazards exceeding ADA thresholds—specifically, displacements greater than 4 inches (10.16 cm) on Sidewalks 2 and 3 and smaller displacements above 0.5 inch (1.27 cm) on Sidewalk 4. To visualize the distribution of vertical changes, a histogram of elevation gradients was generated (
Figure 11a), with larger displacements appearing toward the right tail of the distribution.
To automate hazard detection, vertical gradient magnitudes were computed along the
y-axis, and points exceeding thresholds of 4 inches and 0.5 inch were flagged. These points were color-coded based on height (
Figure 11b) and overlaid on the original point cloud for spatial interpretation. A side-view projection further validated the accurate capture of elevation discontinuities. To corroborate the method’s accuracy, an idealized reference model was constructed, with details provided in
Appendix E. The color comparison between the model’s known elevation profile and the NeRF-detected hazard locations confirmed that the NeRF reliably captured both the location and magnitude of trip hazards. These findings demonstrate NeRF’s effectiveness as an automated tool for identifying vertical displacement features critical to ADA compliance.
5. Comparative Analysis of Survey Methods
Table 7 presents a side-by-side comparison of manual, LiDAR-based, and NeRF-based sidewalk survey methods based on five key criteria: accuracy, cost, time efficiency, data volume and handling requirements, level of automation, and scalability. Each method demonstrates unique strengths and limitations that influence its suitability for ADA compliance monitoring at different scales.
Scalability is defined as the overall effort required to perform data collection, including equipment cost, data volume, and time efficiency. This consideration is particularly relevant for large-scale sidewalk assessments, where repeated data acquisition across multiple locations is necessary.
Table 7 summarizes the average data acquisition time per site for each method, accounting for both setup and measurements. Site R required measurements at three locations, including two flares and one ramp; Site 1 contained four slabs; Sites 2 and 3 each contained two slabs; and Site 4 contained three slabs. Each slab measured 1.5 × 1.2 m. Manual surveying typically involves 1 min for setup and 1 min per slab for measurement, resulting in an average of 5.6 min per site. High-resolution LiDAR scanning, such as with the Livox HAP sensor, requires an average of 5 min for equipment setup and 20 s of scanning per slab. For longer sidewalks, multiple scans are necessary—as in Site 1, where four separate scans were conducted—resulting in an average of 14.9 min per site. In contrast, smartphone-based LiDAR systems require only 1 min per slab for measurement with no setup time, resulting in an average of 2.8 min per site. NeRF-based acquisition involves recording a continuous video, requiring approximately 0.5 min per slab without setup, with an average acquisition time of 1.4 min per site.
Regarding data volume and handling effort, manual surveying relies on handwritten or typed entry of measurements. DAS methods generate approximately 4 GB of data per slab, totaling 11.2 GB per site. The Livox HAP outputs approximately 452,000 points per second, producing around 5 GB of point cloud data per scan and typically requiring a synchronized camera for contextual visual information—about 14 GB per site. Smartphone-based methods display results directly via mobile applications, though some manual input may still be required. NeRF-based acquisition produces a 0.5 min video averaging 0.25 GB per slab, totaling 0.7 GB per site, which can be directly used for 3D reconstruction with minimal handling effort.
Manual techniques—such as digital levels and measuring tapes—remain highly accurate for localized assessments but are labor-intensive and time-consuming. Their dependence on human operation and point-by-point measurements significantly limits their scalability, making them ill-suited for large-area or repeat assessments. High-end terrestrial LiDAR offers exceptional geometric precision and has long served as the benchmark for 3D spatial data. However, it entails considerable equipment costs, setup times, and technical expertise. These constraints limit its practicality for widespread or frequent field deployment, particularly for smaller municipalities. In contrast, smartphone-integrated LiDAR provides a portable and low-cost alternative, but its limited spatial resolution and insensitivity to movement reduce its reliability—especially for detecting subtle vertical discontinuities or assessing slopes with ADA-required precision.
NeRF-based monocular vision methods strike a favorable balance across the evaluation dimensions. When paired with automated 3D reconstruction and metric extraction pipelines, a NeRF achieves competitive accuracy in both slope and elevation measurements, while requiring only low-cost video input. In addition to reducing equipment costs, a NeRF also significantly shortens the data collection time: entire sidewalk segments can be captured in minutes using a simple walk-through. Its high degree of automation, rapid capture process, and flexibility under varied lighting conditions position it as a promising solution for scalable, cost-effective sidewalk evaluations. These features make them well-suited for large or complex sidewalk networks. Overall, this comparative analysis highlights the trade-offs between traditional accuracy, operational burden, and technological scalability. NeRF-based methods, in particular, offer a compelling pathway toward automated and repeatable infrastructure assessments—especially in contexts where time, cost, data volume, and accessibility are critical considerations.
6. Conclusions and Discussion
This study demonstrates that NeRF, when trained on monocular video data, can accurately reconstruct 3D sidewalk geometry and extract ADA-relevant compliance metrics—including the running slope, the cross slope, and vertical displacements. The proposed framework bridges a key gap in pedestrian infrastructure monitoring by offering a low-cost, scalable alternative to both manual surveys and high-end LiDAR systems.
Quantitative comparisons revealed that a NeRF achieves precision and recall levels approaching those of LiDAR, with slope measurement deviations averaging less than 1° in most cases. Furthermore, the NeRF outperformed other low-cost methods (e.g., smartphone and DAS sensors) in identifying noncompliant features and detecting trip hazards, thanks to its dense, high-resolution reconstructions. Visual quality assessments confirmed that a NeRF’s 2D renderings are perceptually faithful, supporting dual use in visualization and measurements.
The NeRF pipeline proved particularly useful in situations where traditional sensors underperform—such as detecting localized cracks, surface heaving, and slab deformations. Its ability to work with consumer-grade cameras, along with the reduced need for field time, significantly lowers deployment barriers for resource-limited municipalities. These strengths make it well-suited for repeatable, city-scale ADA audits or integration into autonomous inspection systems.
However, several challenges and limitations persist. The reconstruction quality is sensitive to the image quality, lighting conditions, and environmental clutter. Computational demands for NeRF training remain high, posing obstacles for real-time use or deployment on embedded platforms. Additionally, generalizations across diverse urban scenes—especially those with occlusions or low-texture surfaces (e.g., tiles or asphalt)—require further validation. This study also lacks a quantitative comparison with other deep learning-based reconstruction methods. Larger-scale case studies and more automated pose estimations will be necessary to extend the method’s applicability to longer sidewalk corridors and more complex environments.
In summary, the proposed NeRF-based framework offers a promising path forward for cost-effective, automated sidewalk assessments in support of ADA compliance. By enabling detailed 3D reconstructions from a monocular video, it democratizes access to high-resolution infrastructure monitoring and could serve as a valuable tool for cities seeking to improve pedestrian accessibility. Future work will focus on enhancing automation, improving robustness to real-world variability, and integrating this method into mobile survey platforms to support continuous and scalable deployment.


