Article

Machine Learning-Based Highway Pavement Performance Prediction in Xinjiang

1
School of Business, Xinjiang University, Urumqi 830017, China
2
Xinjiang Transportation Investment (Group) Co., Ltd., Urumqi 830001, China
3
Engineering Technology and Transportation Industry in Arid Desert Areas, Urumqi 830001, China
*
Author to whom correspondence should be addressed.
Infrastructures 2025, 10(7), 189; https://doi.org/10.3390/infrastructures10070189
Submission received: 4 June 2025 / Revised: 12 July 2025 / Accepted: 15 July 2025 / Published: 21 July 2025

Abstract

Assessing highway pavement condition is crucial for ensuring transportation safety and optimizing infrastructure maintenance. In Xinjiang, China, extreme climatic and traffic conditions pose significant challenges to pavement performance. This study introduces a machine-learning-based framework to predict asphalt pavement performance in Xinjiang. We integrate various factors (design, materials, environment, traffic, and maintenance) into regression models, creating a region-specific pavement performance decay model. Our data preprocessing methodology effectively addresses outliers and missing data, ensuring the model’s robustness. The findings offer insights into asphalt pavement behavior in Xinjiang and provide guidance for maintenance strategies. The proposed model enhances highway infrastructure safety and cost-effectiveness. Future research will focus on refining the model with more data and exploring complex variable interactions.

1. Introduction

1.1. Development of Pavement Performance Evaluation

The inaugural pavement performance evaluation model, PSI (Present Serviceability Index), was introduced by AASHTO in the United States during the 1960s [1]. This model was developed based on nearly a decade of experimental observations. The service performance of cement pavements was primarily assessed through four key aspects: pavement smoothness, dispersion, cracks, and repair conditions. A multiple regression approach was utilized to establish relationships between these indicators and the PSI value, thereby providing a reflection of the pavement’s actual condition to a certain extent [2].
In the 1970s, the US Army Engineering Research Laboratory pioneered the PCI evaluation model [3,4], employing a deduction method to quantify pavement conditions. The UK’s Road Condition Index (RCI) was derived from the PSI model [5]. It serves as a comprehensive evaluation framework for assessing pavement performance, focusing on pavement damage and evaluating it from four distinct aspects. A threshold-based approach is used to assess pavement damage by setting upper and lower limits for sub-item indicators. The evaluation is conducted using a 10 m statistical unit, and the comprehensive RCI is calculated by multiplying each RCI value with its corresponding weight and reliability factor, followed by summation.
During the 1980s, the Japan Road Association [6] modeled its approach on the US AASHTO PSI model. By analyzing extensive disease data, they identified the characteristics of road disease damage forms in Japan and established a PSI model tailored to the country’s road conditions. Iijima et al. drew on the PSI models of both Japan and the United States, segmenting the variables associated with pavement damage. They composed evaluation models based on single factors and combined multiple models to assess the actual condition of pavements, leading to the development of the maintenance management index (MCI). A commonality with the US PSI evaluation index is the use of mathematical methods to link pavement damage with expert evaluations. While the PSI evaluates from the perspective of road users, the MCI does so from the standpoint of road managers.
China’s journey in developing evaluation indicators for highway pavements commenced in the 1980s [7]. Building upon the US PCI model, relevant data was gathered through road experiments and surveys. This data was then used to establish a Pavement Condition Index (PCI) evaluation model that catered to the unique characteristics of China’s roads. In 1994, China promulgated the “Highway Maintenance Quality Inspection and Evaluation Standard” (JTJ075-1994) [8], marking the early standards for inspecting and evaluating the quality of highway maintenance in the country. The “Highway Maintenance Technical Specification” (JTJ073-1997) [9] was introduced in 1996, further regulating the technical requirements for highway maintenance. The “Technical Specification for Cement Concrete Pavement Maintenance of Highways” (JTJ073.1-2001) [10] was formulated in 2001, specifically addressing the maintenance technology for cement concrete pavements. The “Highway Maintenance Technical Specification” (JTGH 10-2009) [11] was released in 2009, superseding the previous JTJ 073-1997 standard and providing a comprehensive update to the technical specifications for highway maintenance. In 2007, the “Highway Technical Condition Evaluation Standard” (JTG H20-2007) [12] was established, offering an evaluation standard for the technical condition of highways. This standard was revised in 2018, resulting in the new “Highway Technical Condition Evaluation Standard” (JTG H20-2018) [8], which came into effect on 1 May 2019, and the 2007 version was subsequently abolished. The current “Highway Technical Condition Evaluation Standard” (JTG 5210-2018) [13] clearly defines the pavement maintenance quality index (PQI) as a comprehensive indicator for assessing the overall condition of pavements [14].

1.2. Application of Machine Learning in Pavement Performance Evaluation

Recent advancements in machine learning (ML) have significantly improved the accuracy and interpretability of pavement performance prediction models. A comprehensive synthesis of methodologies reveals distinct approaches to data management, model selection, and interpretability. Over the past few years, ML techniques have evolved from simple empirical models to more sophisticated and interpretable approaches, demonstrating a clear trajectory of progress in this field.
In the early stages, studies primarily focused on traditional ML algorithms such as Decision Trees (DTs) and Random Forests (RFs). Marcelino, Pedro et al. (2021) [15] achieved high prediction accuracy (R2 > 0.90) for IRI prediction using a tuned RF model based on large datasets (>10,000 data points) retrieved from the LTPP database. However, the model’s complex structure, consisting of 500 trees and a complicated set of input variables, made actual implementation challenging. Sandamal et al. (2023) [16] employed five machine learning models (Random Forest, Decision Tree, XGBoost, Support Vector Machine, K-Nearest Neighbor) and a statistical model for IRI prediction of asphalt concrete pavement in Sri Lankan arterial roads, using two predictor variables (pavement age and cumulative traffic volume) and a dataset of 259 data points. The statistical model achieved a coefficient of determination (R2) of 0.53 for the testing dataset. In contrast, the machine learning algorithms demonstrated superior performance, with all except SVM achieving R2 values greater than 0.75. Among them, the Random Forest model, leveraging its extrapolation and global optimization capabilities, provided the best prediction with an R2 of 0.906 and a mean absolute error (MAE) of 0.310 for the testing dataset. Additionally, SHapley Additive exPlanations (SHAP) analysis was used to interpret factor importance, revealing that pavement age had the most significant positive impact on IRI progression.
As research progressed, neural networks began to be widely applied in pavement performance prediction. Mers et al. (2023) [17] compared multiple models for pavement performance forecasting, including traditional models (MLR, FCNN) and recurrent neural networks (RNN, GRU, LSTM), as well as a hybrid LSTM-FCNN model. Using a 31-year historical pavement dataset from Florida, they found that RNN-based models and the hybrid model significantly outperformed traditional models. The hybrid LSTM-FCNN model, in particular, demonstrated superior performance in capturing complex spatiotemporal relationships, providing a notable improvement over the traditional approaches in predicting time-series pavement conditions. Similarly, Choi and Do (2019) [18] developed a recurrent neural network (RNN) algorithm to predict road pavement deterioration in Korea, reducing prediction errors and achieving high determination coefficients. This advancement allowed for more optimized maintenance timing and budget allocation. Yao et al. (2020) [7] proposed a framework for modeling the evolution of pavement performance using techniques such as BorutaShap for feature selection, Bayesian Neural Networks (BNNs) for model development and uncertainty quantification, and Shapley Additive Explanations (SHAP) for model interpretation. This framework provided not only accurate predictions but also enhanced model interpretability, addressing a critical limitation of earlier black-box models.
In recent years, ensemble learning and hybrid models have gained prominence. Song et al. (2022) [19] proposed an ensemble model using Thunder GBM with SHAP to predict asphalt pavement IRI. Data from LTPP included 2699 samples and 20 features. The model achieved test-set R2 = 0.88 and RMSE = 0.08, running 86× faster than ANN and 2.3× faster than RF. SHAP analysis identified key factors, reducing features to six core ones, improving efficiency, and reducing data collection effort. This supports evidence-based pavement maintenance decisions by balancing prediction performance and practical data needs. Similarly, Baykal et al. (2024) [20] developed an ensemble machine-learning approach to estimate asphalt pavement IRI using a 70-sample dataset with AGE, sum ESALs, and SN as inputs. Random Forest performed best (test R2 = 0.996, RMSE = 0.103, MAE = 0.013, MAPE = 4.519). SHAP analysis showed AGE was the most influential factor, while sum ESALs had minimal impact. Compared to the literature ANFIS, Random Forest outperformed in accuracy and error metrics, offering an interpretable model to support data-driven pavement maintenance decisions.
Automated machine learning (AutoML) has also emerged as a promising technique. Liu et al. (2022) [21] developed machine learning models with dimensionality reduction to predict asphalt pavement alligator (AC, R2 = 0.84) and longitudinal cracking (LC, R2 = 0.83), optimizing mix design. Using 579 AC/474 LC samples with 33 features from NCHRP/LTPP, they built six basic models (SVR/ANN, etc.) and eighteen hybrid models (AE/PCA/RFE) tuned via Bayesian optimization. PCA-ANN performed best, with SHAP analysis highlighting the asphalt surface course as the key factor. A case study recommended a 5.1% asphalt mix, offering an efficient, data-driven approach to assess crack resistance in pavement design.
Despite these advancements, three critical research gaps persist. First, data scarcity in developing regions restricts model transferability, as most studies rely on Long-Term Pavement Performance (LTPP) or region-specific datasets. Second, limitations in temporal resolution hinder real-time adaptation, as few models incorporate continuous sensor data from smart pavement systems. Third, unresolved trade-offs in interpretability, particularly for deep learning architectures, remain a challenge. Future efforts must prioritize hybrid models that integrate physics-based constraints with machine learning (ML) to enhance generalizability across climatic and material variations.
The purpose of this work is to develop a comprehensive and accurate pavement performance prediction model that addresses the existing research gaps. Specifically, we aim to create a model that can effectively utilize available data, even in regions with data scarcity, and incorporate real-time sensor data for improved adaptability. Additionally, we aim to balance predictive accuracy with interpretability, ensuring that the model provides actionable insights for infrastructure managers. The significance of this work lies in its potential to enhance the efficiency and effectiveness of pavement maintenance and management, ultimately contributing to the sustainability and safety of highway systems. Our hypothesis is that by integrating advanced machine learning techniques with domain-specific knowledge and addressing the limitations of existing models, we can develop a superior pavement performance prediction tool. This study builds upon the foundational work of previous researchers while pushing the boundaries of what is currently achievable in pavement performance prediction.

2. Methodology

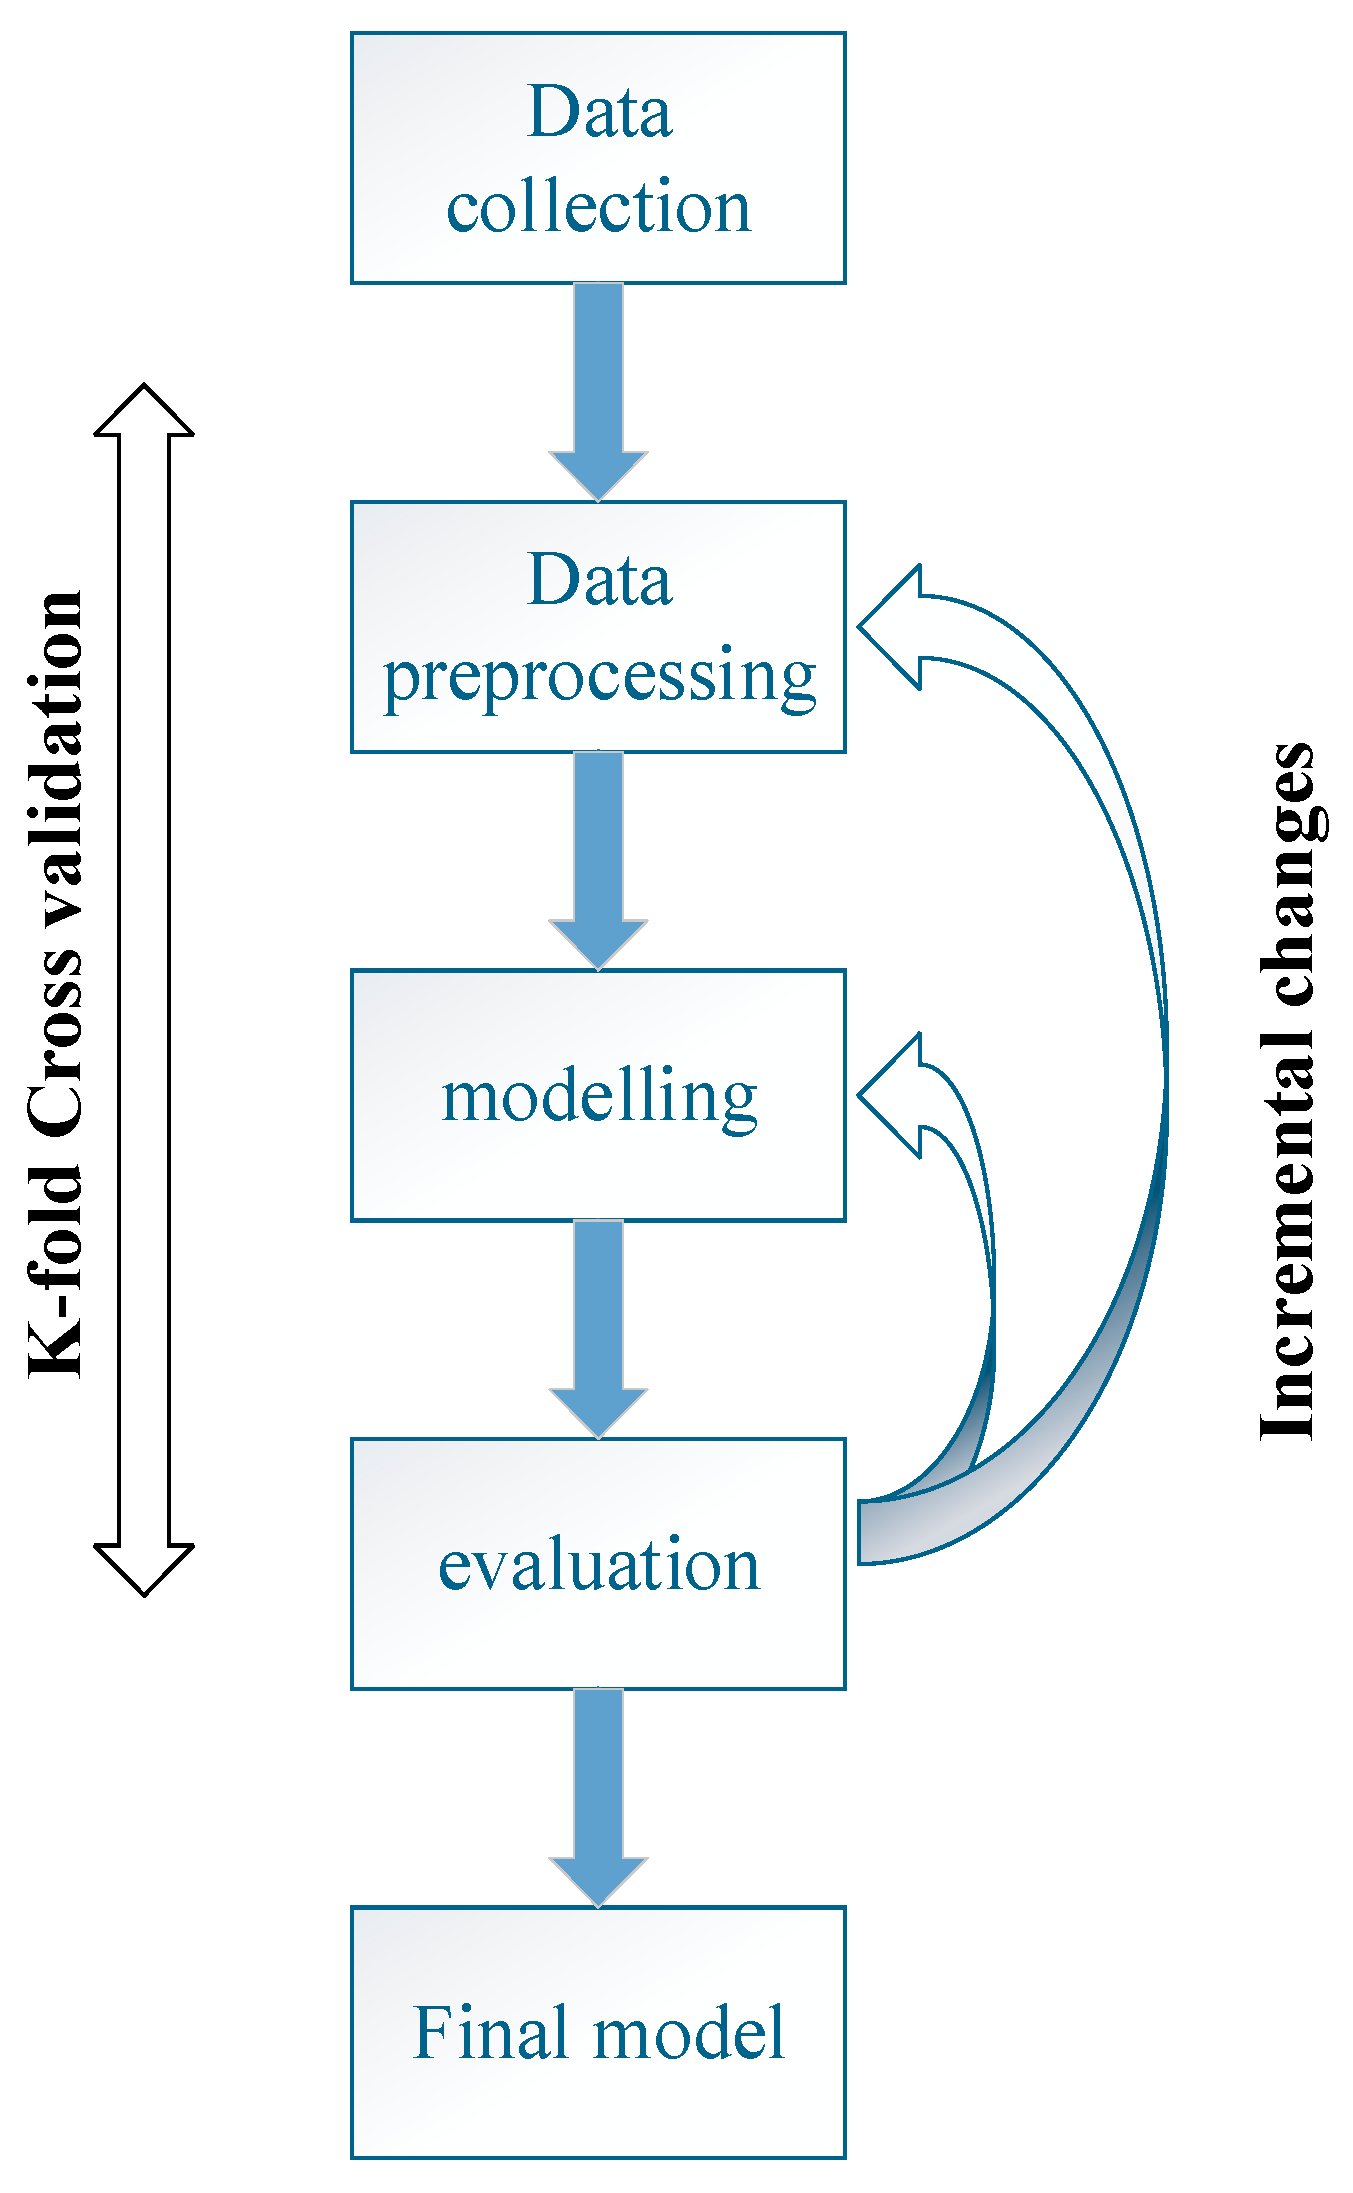
2.1. Machine Learning Framework and Computational Process

The machine learning framework for pavement performance prediction comprised three stages: data preprocessing, model development, and performance evaluation. The proposed machine-learning framework for pavement-performance prediction is illustrated in Figure 1.
The following Table 1 summarizes the key components and hyperparameters of the four ML models:

2.1.1. BP Neural Network

The BP (backpropagation) neural network is a multi-layer feed-forward neural network trained using the error backpropagation algorithm. It consists of an input layer, one or more hidden layers, and an output layer. Each layer contains a variable number of nodes, and the connections between layers are characterized by weights. The BP algorithm adjusts the weights and biases to minimize the output error, enabling the network to model complex non-linear relationships. In recent years, BP neural networks have been widely used in pavement performance prediction due to their ability to handle multi-variable inputs and non-linear problems [22].

2.1.2. PSO-BP Neural Network

The PSO-BP neural network combines the Particle Swarm Optimization (PSO) algorithm with the BP neural network. PSO is an evolutionary computing technique based on swarm intelligence, which simulates the collaborative search behavior of particle swarms to optimize the parameters of complex models, such as the weights and thresholds of BP neural networks. By optimizing the initial weights and thresholds of the BP neural network, PSO can effectively improve the network’s convergence speed and prediction accuracy. This hybrid approach not only enhances the network’s ability to avoid local minima but also improves its overall performance and generalization ability [23].

2.1.3. Random Forest

Random Forest is an ensemble learning method that constructs multiple Decision Trees during training and outputs the mode of the classes for classification or the mean prediction for regression. Each tree is built using a bootstrap sample of the data, and at each node, a random subset of features is selected to split the data. This randomness helps to reduce overfitting and improve the model’s generalization ability. Random Forest has been widely applied in pavement performance prediction due to its robustness and ability to handle high-dimensional data.

2.1.4. Convolutional Neural Network

Convolutional Neural Networks (CNNs) are a class of deep learning models designed to process data with a grid-like topology, such as images. CNNs consist of convolutional layers, pooling layers, and fully connected layers. Convolutional layers apply filters to the input data to extract local features, while pooling layers reduce the spatial dimensions of the feature maps, retaining the most important information. Fully connected layers then integrate these features to produce the final output. CNNs have been successfully applied in various fields, including pavement performance prediction, due to their powerful feature extraction capabilities and ability to capture local structural characteristics of data [24].

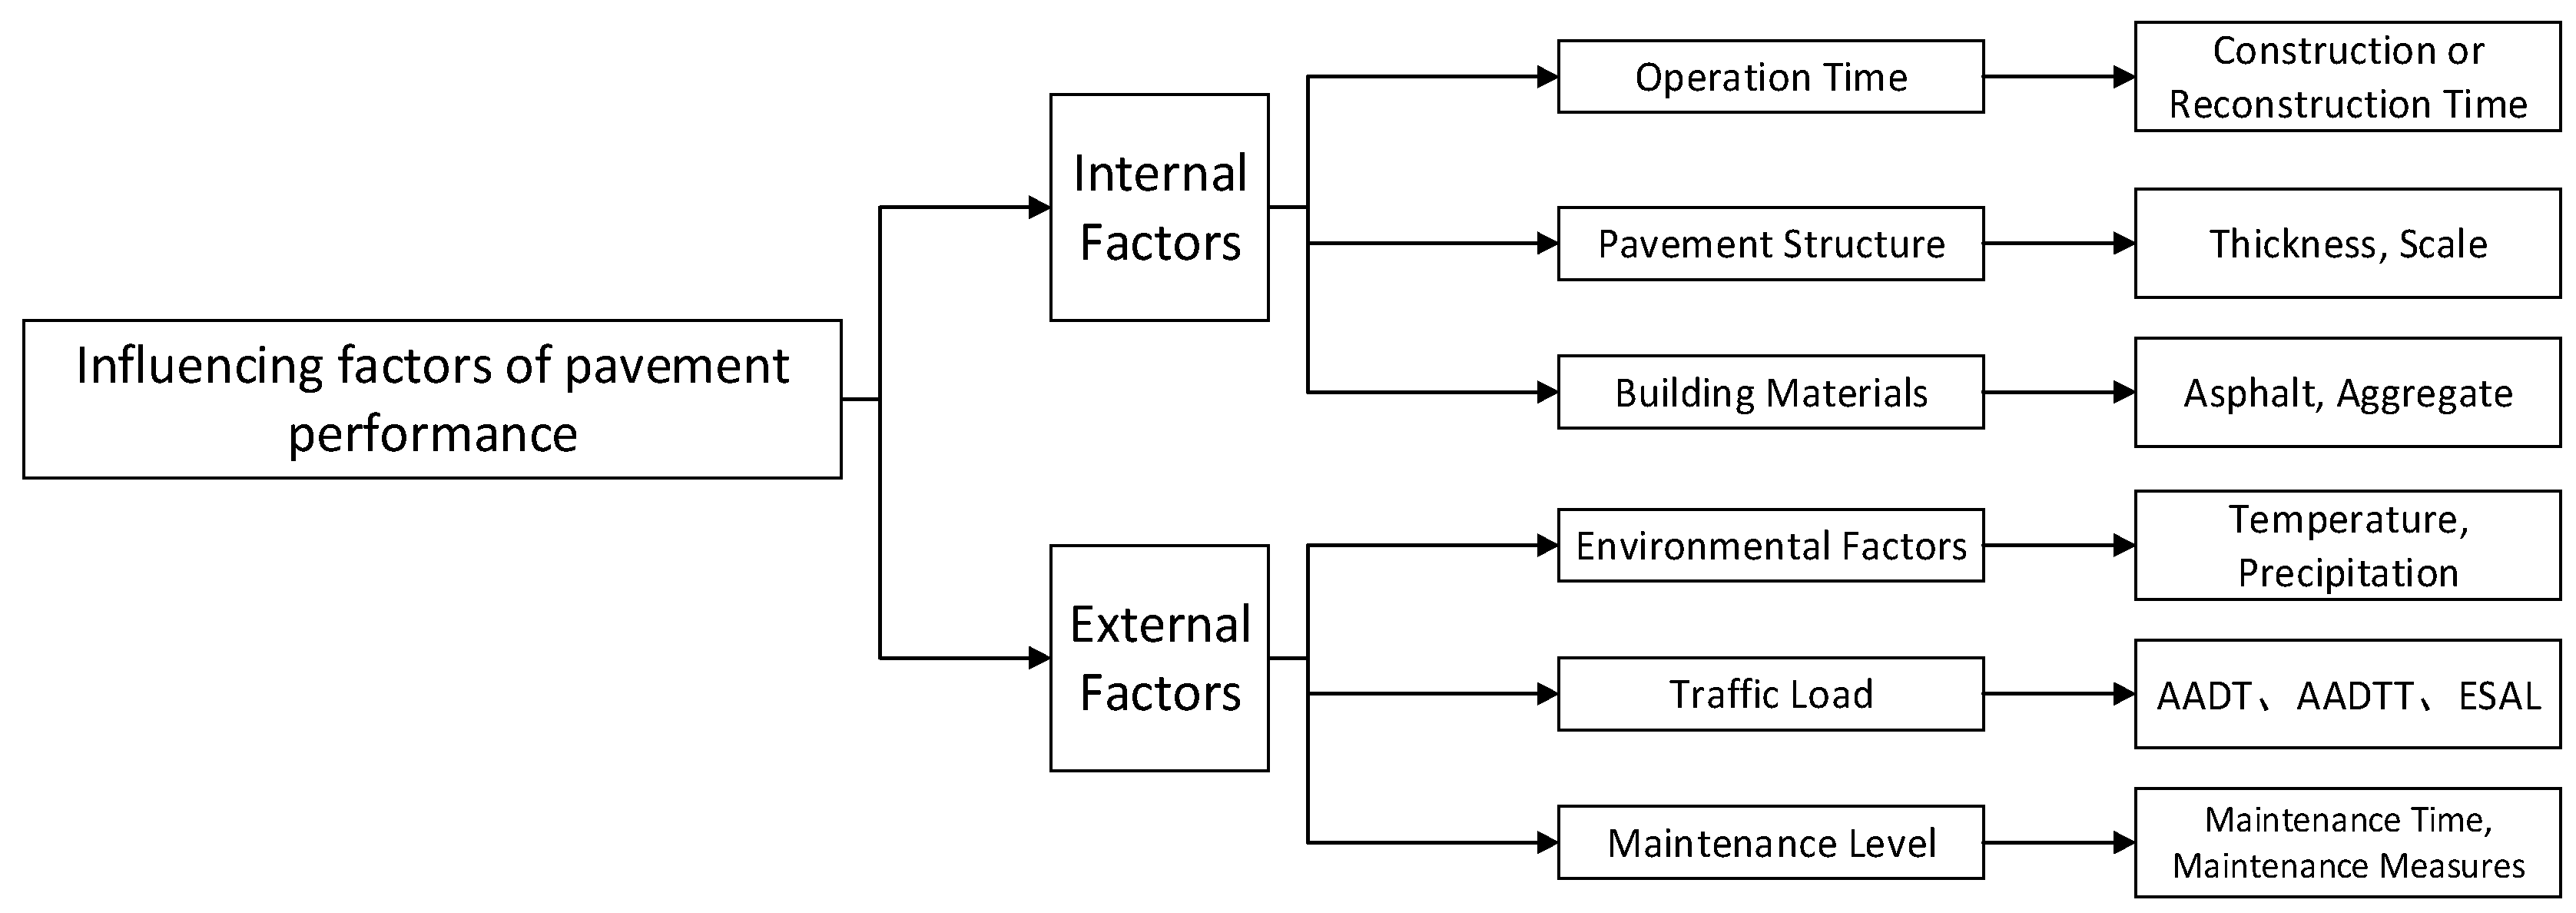
2.2. Data Collection and Indicator Determination

The primary challenge in developing pavement deterioration models is the multitude of factors that influence pavement condition, all of which must be meticulously considered in the model’s formulation. These factors include the age of the pavement, traffic loading, climatic impacts, initial design and construction quality, and the effectiveness of maintenance interventions. The parameters used in this study, which serve as inputs for the deterioration model, are outlined in the following subsections, providing a comprehensive framework for understanding their individual and collective contributions to pavement performance degradation.
The data utilized in this study were meticulously sourced from multiple reliable channels to ensure a comprehensive and multifaceted understanding of the various factors influencing pavement performance. Specifically, detailed information on road design specifications, traffic load characteristics, maintenance records, and pavement condition indices—including the Pavement Condition Index (PCI), Pavement Quality Index (PQI), Rutting Depth Index (RDI), and Road Quality Index (RQI)—was obtained from the Xinjiang Transportation Investment Group. These data collectively provide critical insights into the construction, operational history, and current state of the roads under investigation. Additionally, meteorological data, encompassing temperature, precipitation, and evaporation rates, were sourced from the Xinjiang Meteorological Bureau. These environmental data offer an essential context for understanding the climatic conditions that significantly impact pavement performance. The integration of these diverse data sources ensures a robust and holistic basis for the analysis and modeling of pavement performance in the study region.
A total of 15 features were used, categorized as Table 2:
The intrinsic factors influencing the performance of highway asphalt pavement primarily include pavement structure and construction materials. The pavement structure is mainly categorized into the surface course and the base course, with variations in type and thickness significantly affecting performance. Construction materials, conversely, reflect the properties of local resources, including asphalt and aggregate materials. These materials exhibit regional variations, resulting in corresponding differences in pavement performance.
The extrinsic factors affecting pavement performance include climatic conditions, traffic load, construction quality, and maintenance practices, among others. The impact of climatic conditions on pavement performance is primarily evident in temperature fluctuations, rainfall, and evaporation rates. The asphalt surface layer is particularly sensitive to temperature variations; extremely low temperatures can lead to low-temperature shrinkage, while excessively high temperatures can accelerate asphalt aging, resulting in rutting. Rainfall influences both the surface and base layers; in regions with significant rainfall, water infiltration through cracks can exacerbate pavement distress, and excessive rainfall can diminish the adhesion between asphalt and aggregates. The effect of traffic load on pavement performance is primarily reflected in traffic volume and the proportion of heavy vehicles; as traffic volume increases and the number of heavy vehicles rises, the likelihood of fatigue damage to the asphalt pavement also increases. Studies conducted both domestically and internationally assess the impact of traffic loads on pavement performance by measuring the cumulative number of standard axle loads.
The factors influencing the road surface indicators selected in this paper are shown in Figure 2.

2.3. Performance Indicators

In this study, we have identified four key performance parameters of asphalt pavement, which are detailed in Table 3 in accordance with the Highway Performance Assessment Standards of China. The Pavement Condition Index (PCI), Pavement Quality Index (PQI), Rutting Depth Index (RDI), and Road Quality Index (RQI) quantify the extent of pavement deterioration, surface roughness, rutting depth, and the pavement’s anti-skid capability, respectively. Corresponding to these indices, the Damage Rate (DR), International Roughness Index (IRI), and Rutting Depth (RD) serve as empirical measures for the aforementioned variables. The PCI, PQI, RDI, and RQI are scaled from 0 to 100, with a score of 100 indicating optimal pavement condition. Pavement conditions are broadly categorized into five grades: excellent, good, fair, poor, and very poor, with thresholds set at 90, 80, 70, and 60, respectively. The Pavement Quality Index (PQI), which reflects the overall performance of the road surface, is derived from a weighted aggregation of the individual indices mentioned. The formulation of these equations and the parameter values align with the provisions of the JTG 5210-2018 Standards.

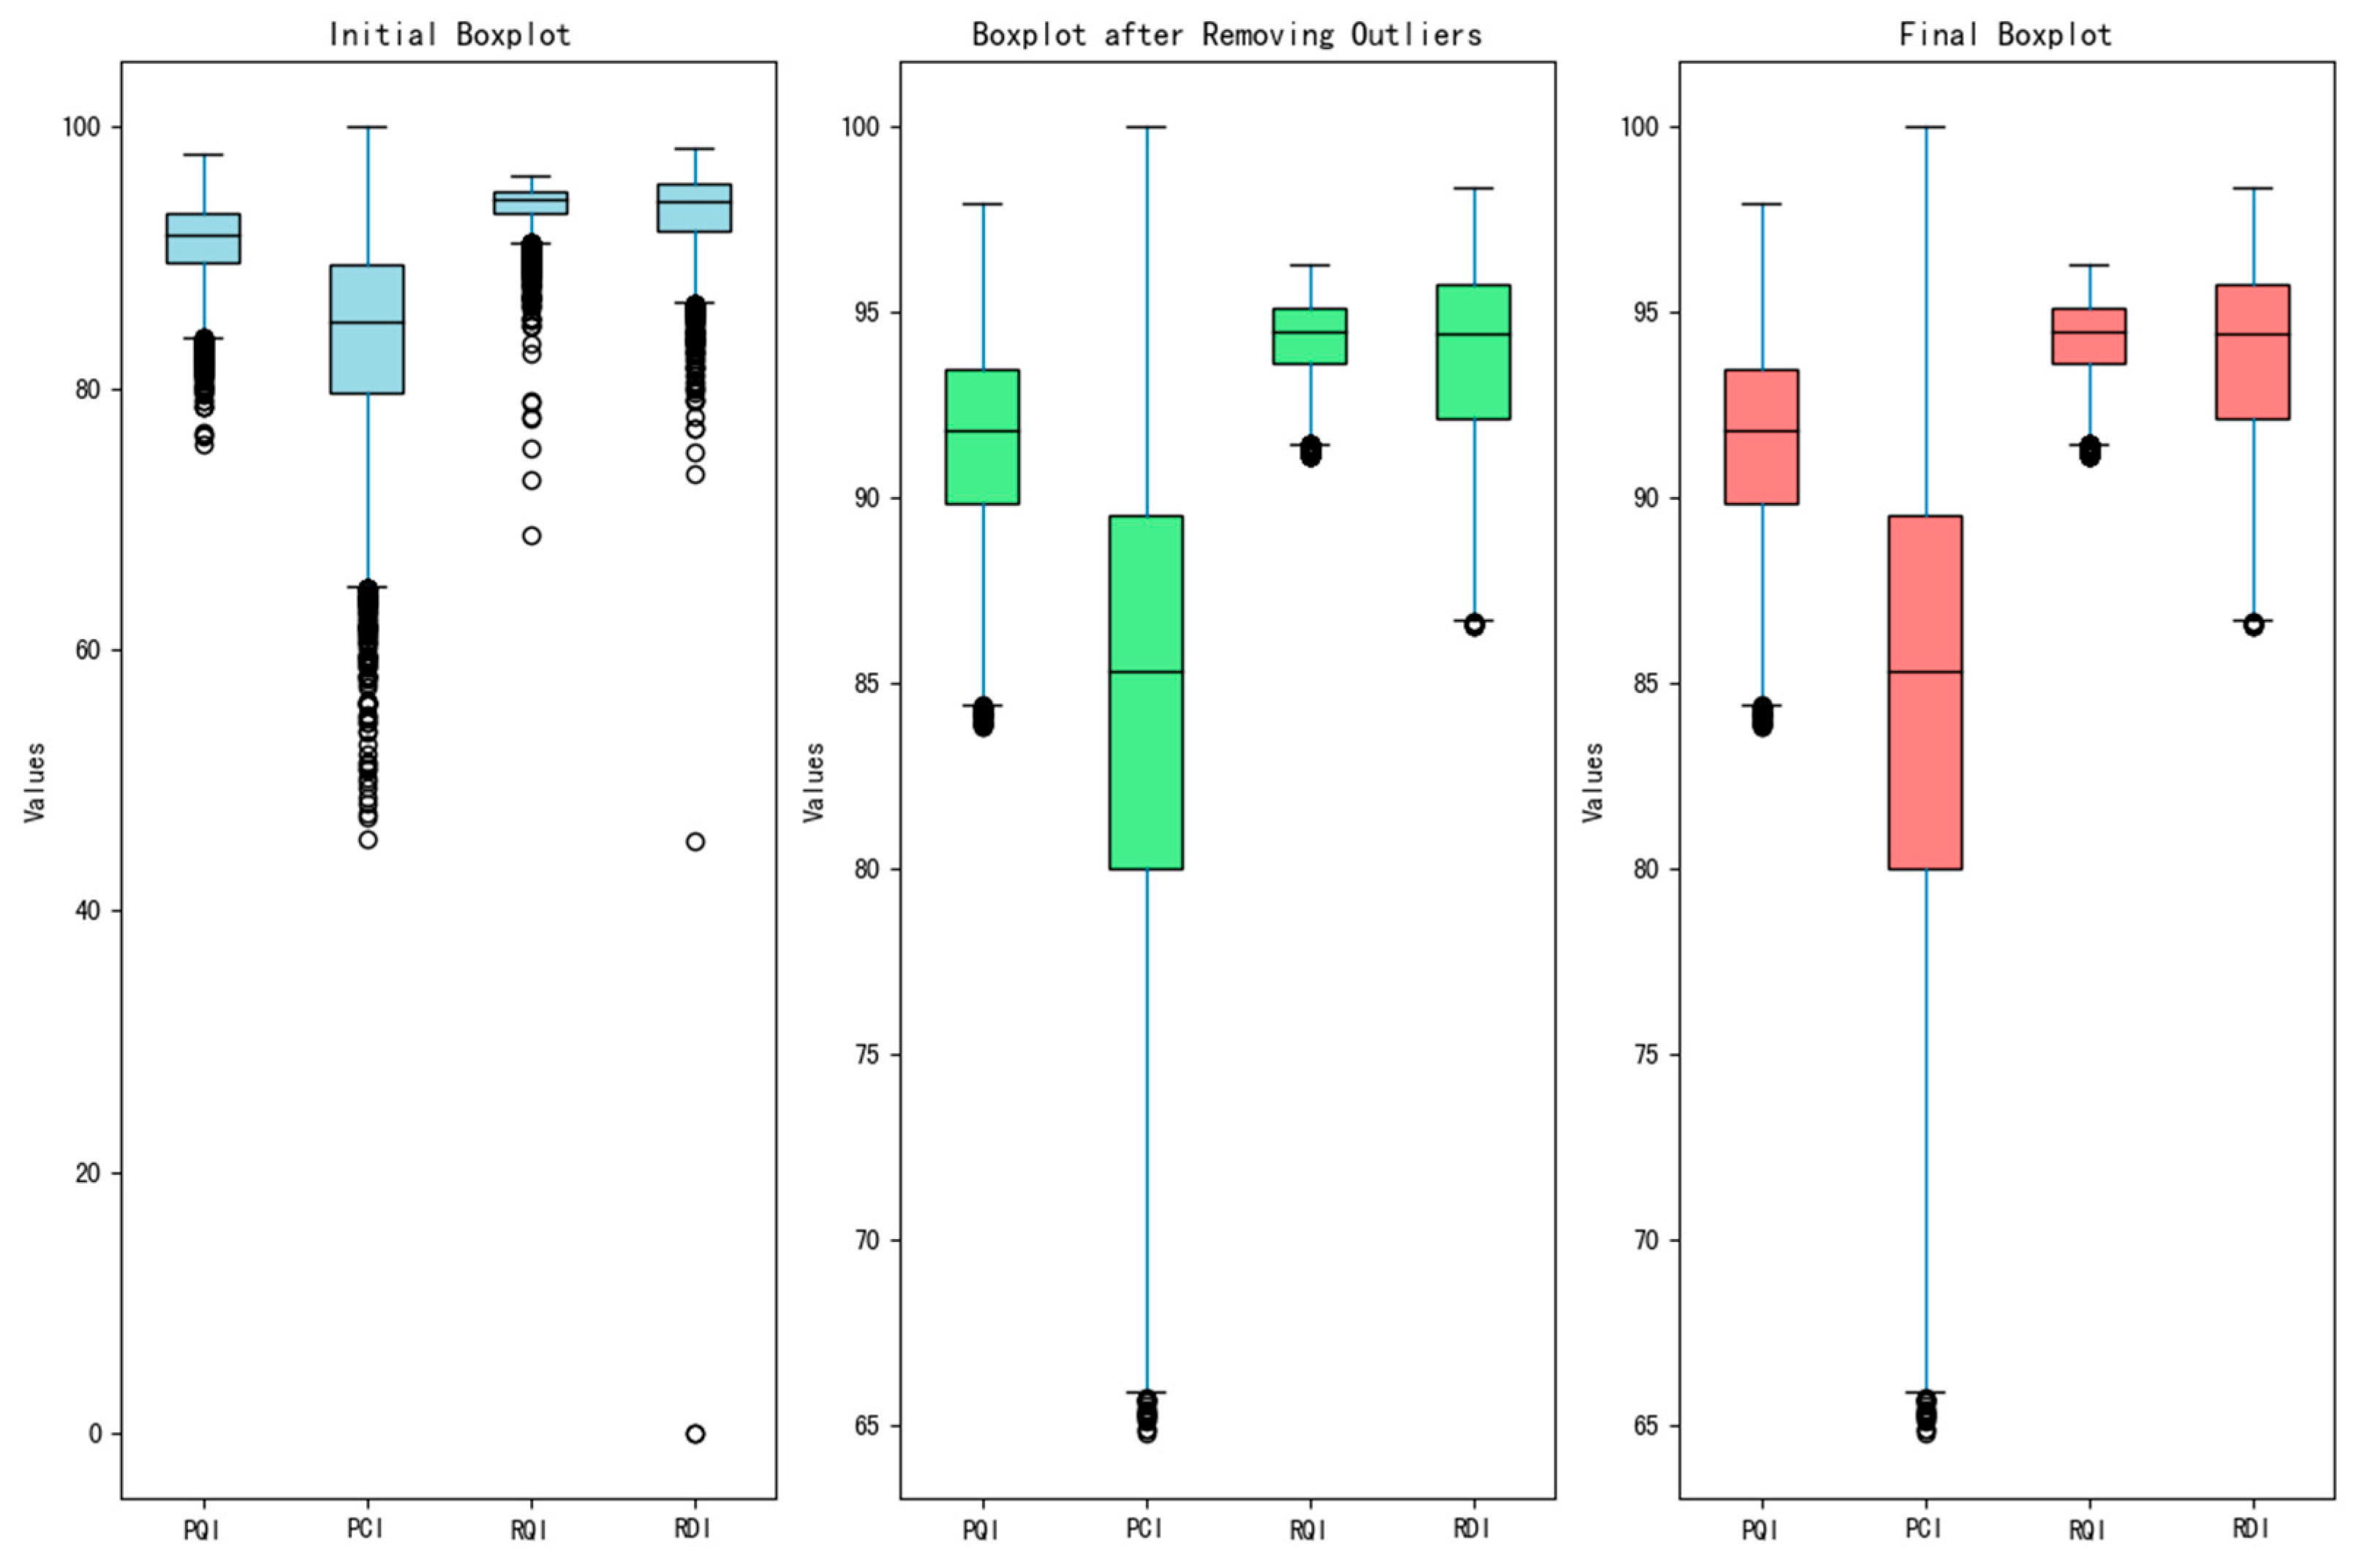
2.4. Data Preprocessing

The integrity and precision of the pavement performance database are foundational for analyzing and forecasting pavement performance. However, the extended time frame over which pavement performance data is collected often results in a large dataset susceptible to biases arising from testing methodologies, storage equipment, and human factors. These elements can introduce inaccuracies, necessitating a thorough assessment of the database’s quality before initiating any performance-related studies. Such an analysis is essential to distill a more comprehensive and accurate dataset, thereby establishing a solid foundation for subsequent investigative efforts.
In this research, a meticulous evaluation of the pavement performance database was conducted to identify any aberrant or missing data within the initial dataset. This quality assessment was critical to ensure the reliability and validity of the subsequent analyses. After a thorough examination and cross-referencing of the relevant information, it was confirmed that the construction data, environmental climate data, traffic load data, and maintenance history data were all free of anomalies or omissions. Consequently, the primary focus of the quality analysis was directed toward the pavement performance index test data. This targeted approach ensures that the dataset utilized for the forthcoming research is not only comprehensive but also accurately reflects the true characteristics of pavement performance, thereby enhancing the accuracy and reliability of the study’s outcomes.
To identify outliers in the dataset, the study employed the box plot method, which is based on the principles of quartile partitioning and interquartile distances. This method was selected for its simplicity and effectiveness in visualizing data distribution, as well as its ability to highlight observations that deviate significantly from the norm. Box plots are particularly useful for detecting outliers in continuous variables, as they rely on quartiles and the interquartile range (IQR), which are robust measures of spread. While some machine learning algorithms, such as tree-based models (e.g., Random Forests), are inherently robust to outliers, others (e.g., linear regression, neural networks) can be sensitive to extreme values, which may lead to biased parameter estimates or reduced predictive performance [25]. Therefore, outlier detection and handling are critical steps in ensuring the reliability and accuracy of the models employed in this study. The use of box plots aligns with standard practices in exploratory data analysis and has been widely adopted in pavement performance studies to ensure data quality. By addressing outliers and ensuring data quality, the study aimed to enhance the robustness and reliability of the subsequent pavement performance prediction models.
After identifying and removing outliers using the box plot method, the dataset contained a small proportion of missing values (approximately 1.7% of the total samples). To address this, we employed the Multiple Imputation by Chained Equations (MICE) technique to impute the missing values. MICE operates under the assumption that the missing data are Missing at Random (MAR) and iteratively imputes missing values using regression models that account for the relationships among all variables in the dataset. Specifically, we generated five imputed datasets, each of which was analyzed using the same machine learning models. The results from these imputed datasets were then pooled to obtain a single set of parameter estimates, thereby reducing the uncertainty and bias introduced by the missing data. This approach ensured the robustness of our model while preserving the statistical properties of the original dataset [26].
Figure 3 displays side-by-side box plots comparing the distributions of raw, processed, and interpolated data.

3. Results

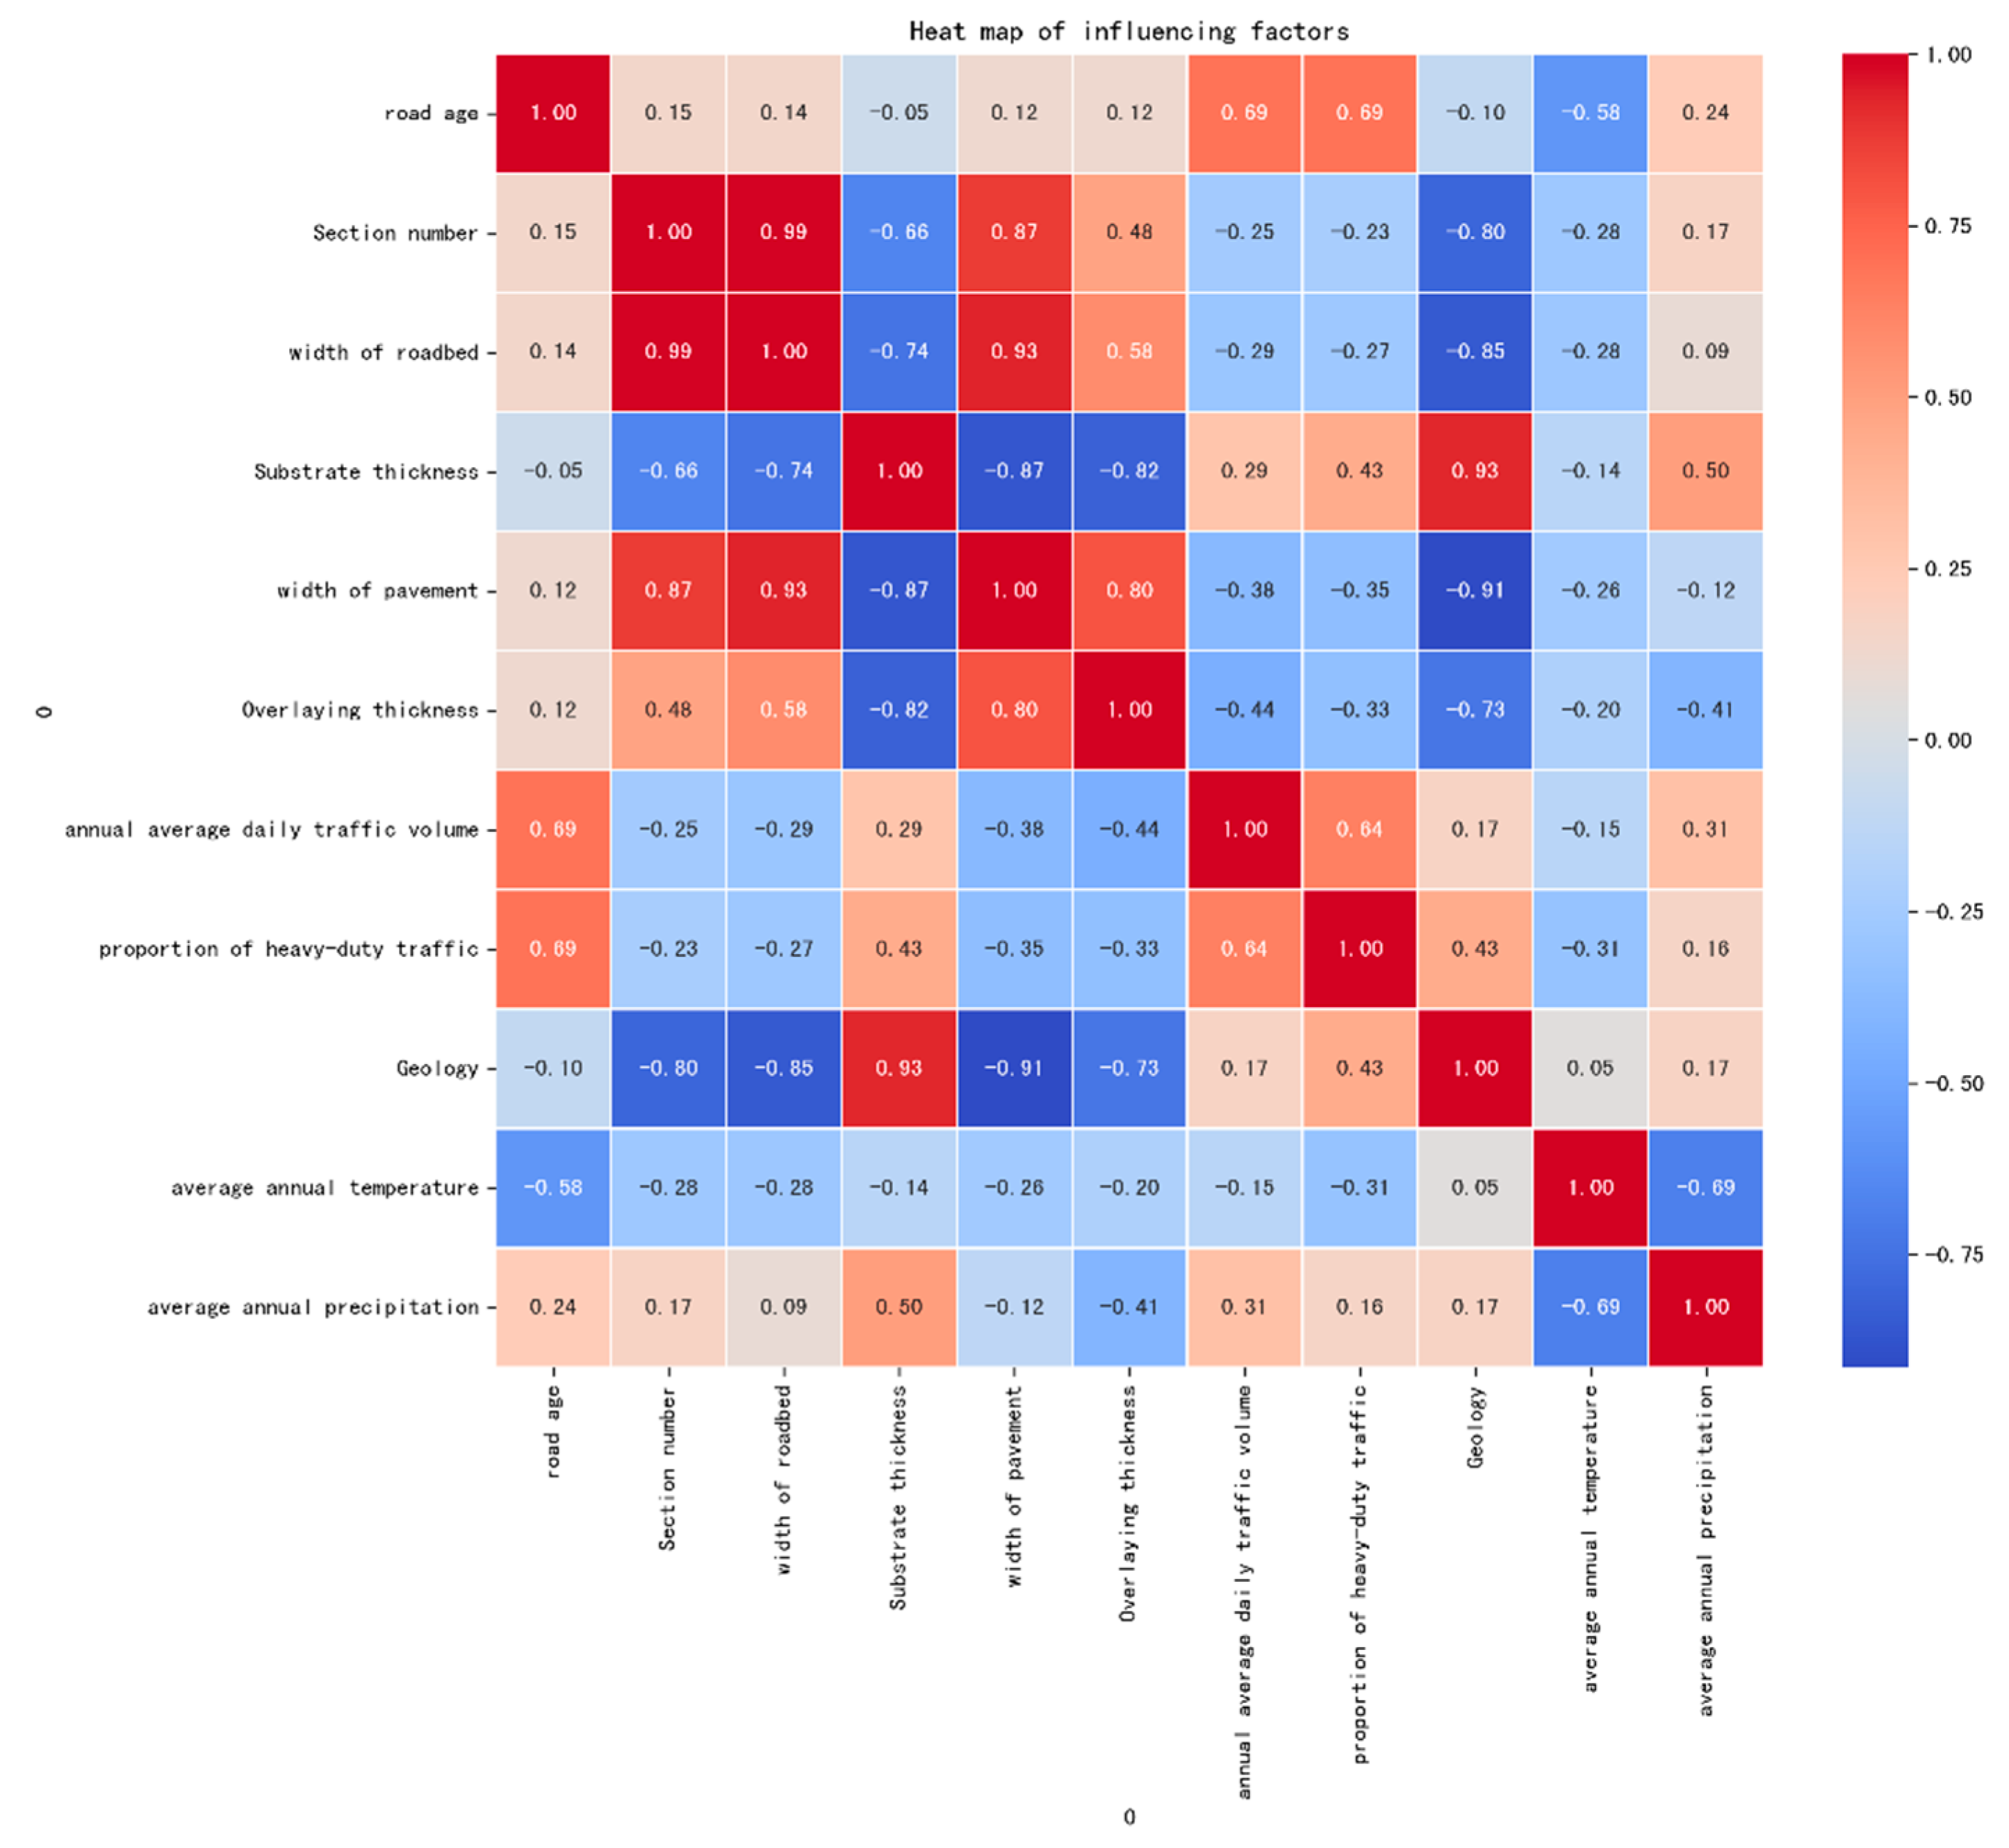
3.1. Analysis of Influencing Factors

In the pavement performance data, numerous data features coexist, often revealing underlying patterns of association. Features such as average temperature and average rainfall demonstrate a degree of correlation that is not merely coincidental but indicative of an inherent relationship. These correlated features interact in a way that introduces significant uncertainty into the predictive modeling process, potentially resulting in increased model complexity and reduced computational accuracy. Therefore, a comprehensive analysis of inter-feature correlations is essential, as it enables the quantification of these relationships and the discovery of deeper data-driven insights. Such an analysis serves as a foundational basis for the subsequent selection of algorithmic models.
Correlation analysis fundamentally examines the interplay between two variables and assesses the significance of their influence on one another. Typically, variables do not exhibit a strict one-to-one correspondence or functional mapping; instead, they demonstrate a relationship characterized by mutual influence. This relationship often manifests as a consistent co-occurrence, which can be empirically observed and quantified. The absence of a rigid functional relationship does not preclude the presence of a discernible pattern that can be utilized for analytical purposes.
To accurately express the degree of linear correlation between variables, the correlation coefficient is a crucial metric. Among the various correlation coefficients available, the Pearson correlation coefficient and the Spearman rank correlation coefficient are especially well-suited for analyzing pairwise variables. These coefficients not only quantify the strength and direction of the linear relationship but also provide a statistical framework for assessing the significance of observed correlations. This, in turn, informs the development and refinement of predictive models in the context of pavement performance analysis.
The application of Spearman’s rank correlation coefficient is typically reserved for scenarios where the relationship between two variables is strictly monotonic and the data points are evenly distributed across their logical range. Given these stringent preconditions, the utility of this method is somewhat limited, which restricts its widespread adoption. Furthermore, empirical evidence has demonstrated that, under the assumption of normally distributed data, the efficiency of Spearman’s rank correlation coefficient is comparable to that of Pearson’s correlation coefficient. Notably, in the context of continuous measurement functions, the Pearson correlation coefficient exhibits superior performance. Therefore, in the present study, we have chosen to employ the Pearson correlation coefficient to analyze the pavement performance data. This choice is informed by the coefficient’s greater efficacy in scenarios characterized by continuous variables, aligning with the nature of our dataset and the analytical objectives of this research.
r = n x y x y n x 2 ( x ) 2 n y 2 ( y ) 2
Heat map of internal correlations between influencing factors, as shown in Figure 4.
The following Table 4 shows the corresponding highly correlated factors and their correlation coefficients:

3.2. The Importance of Influencing Factors

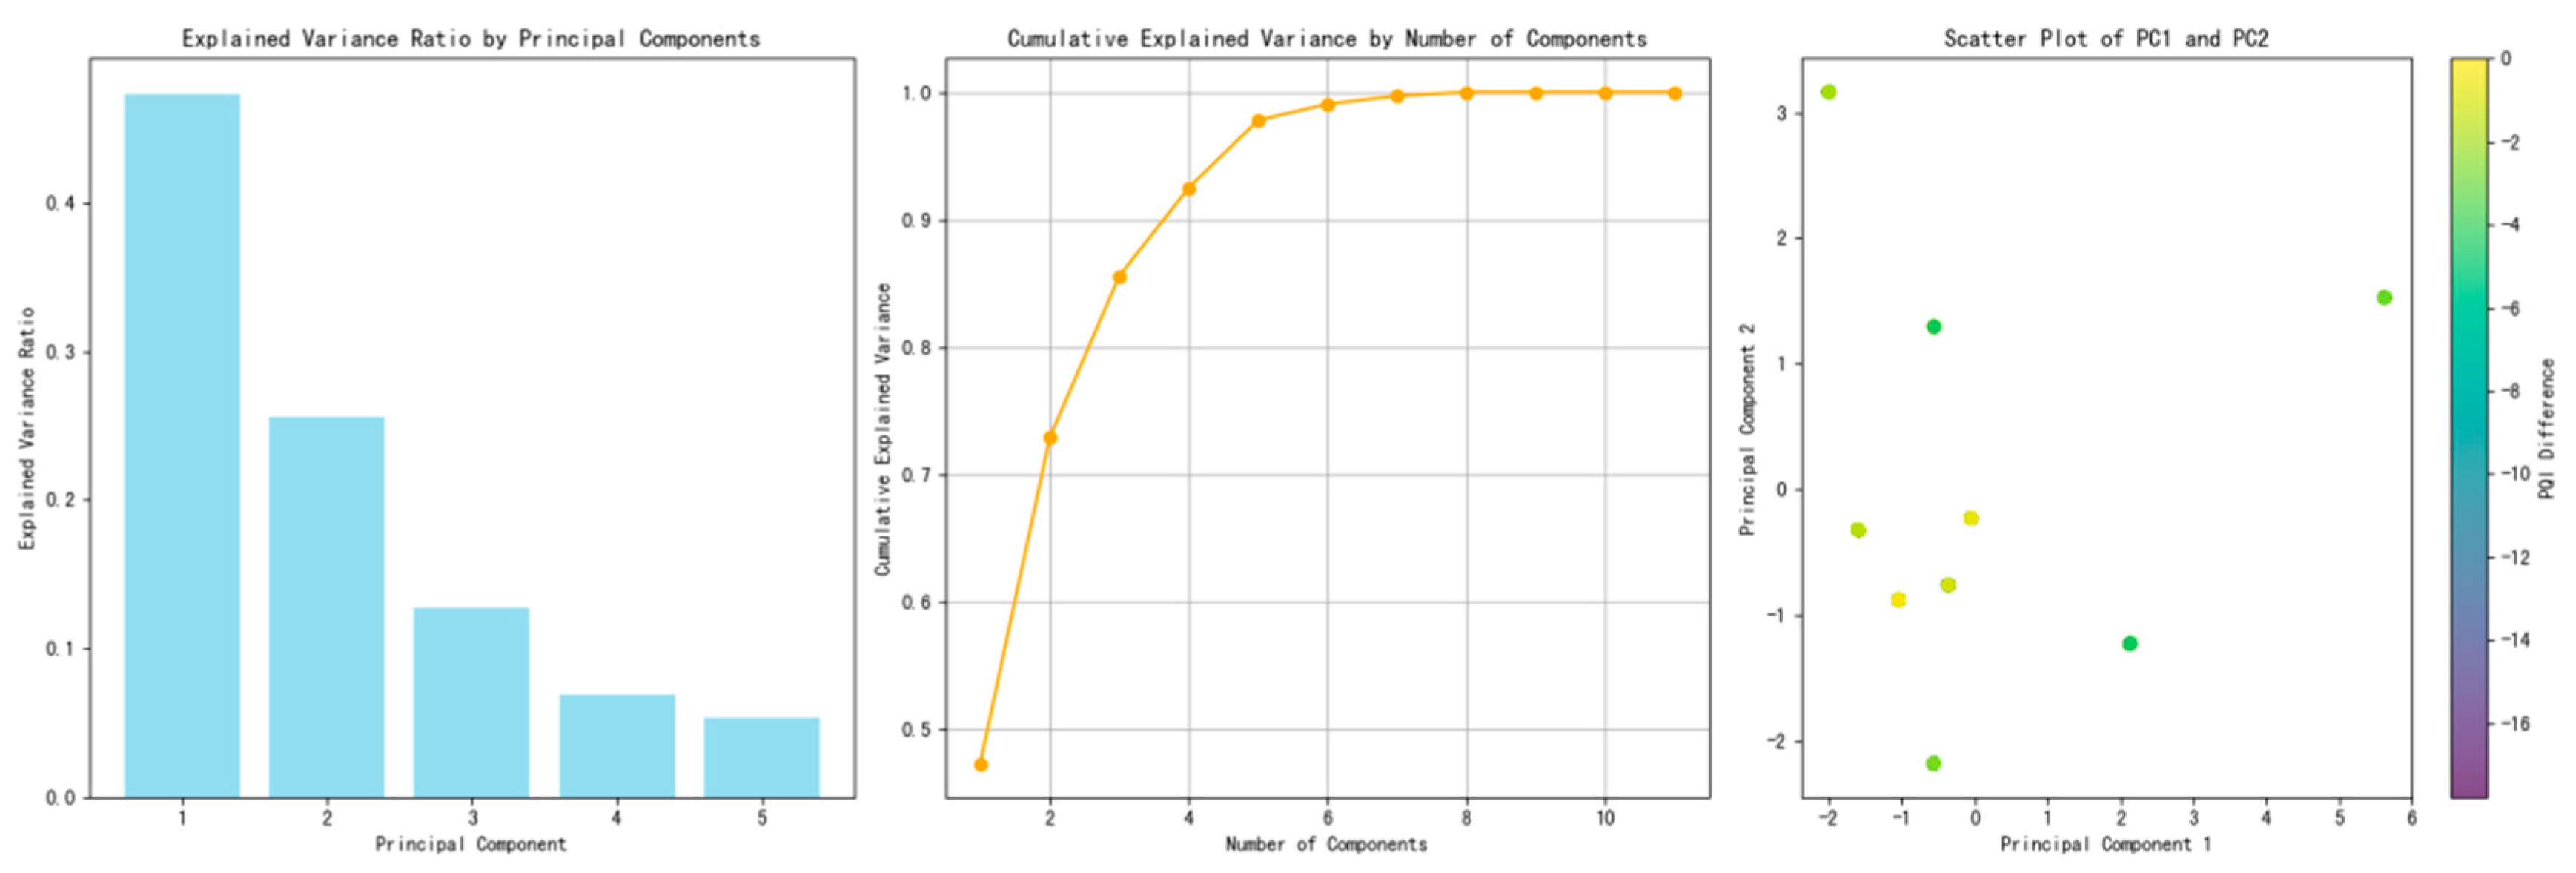
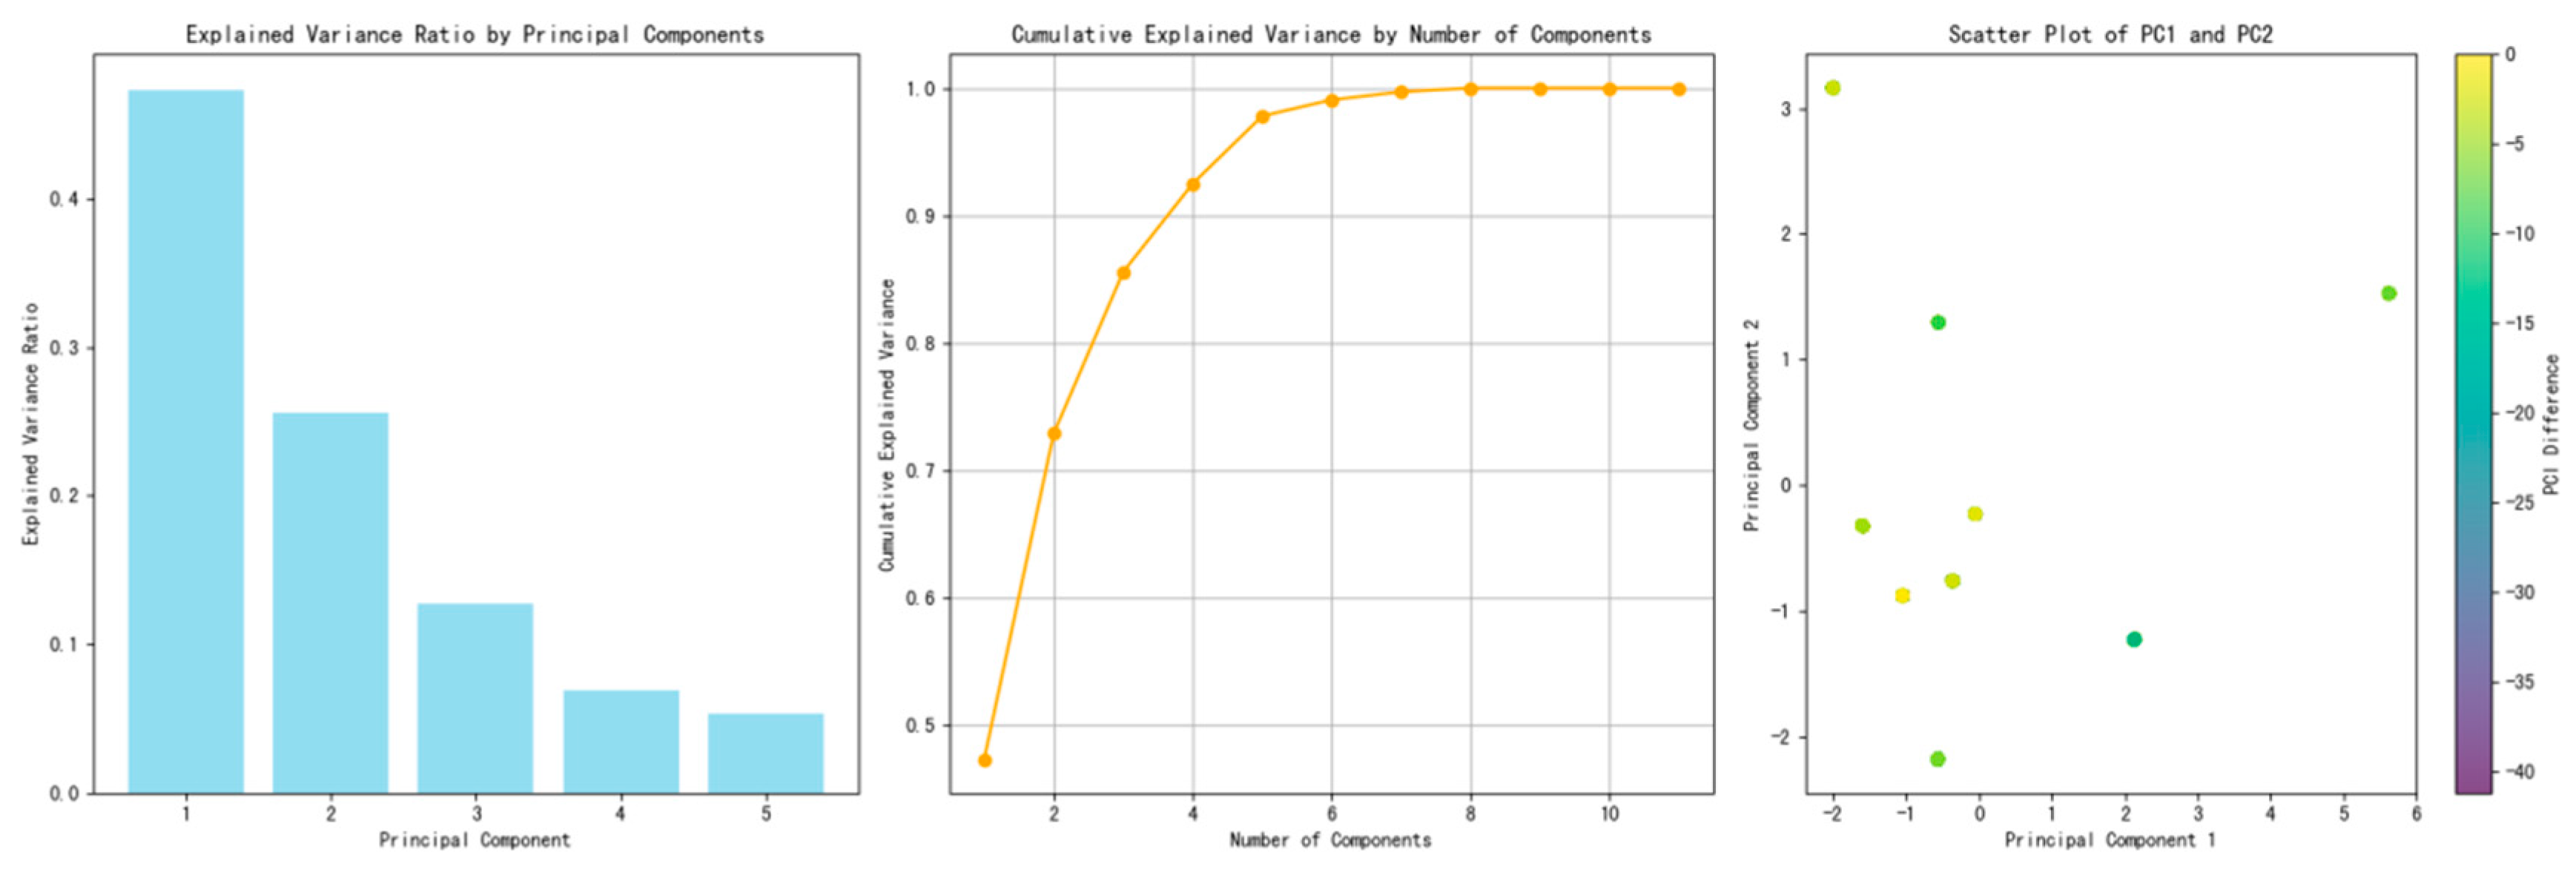
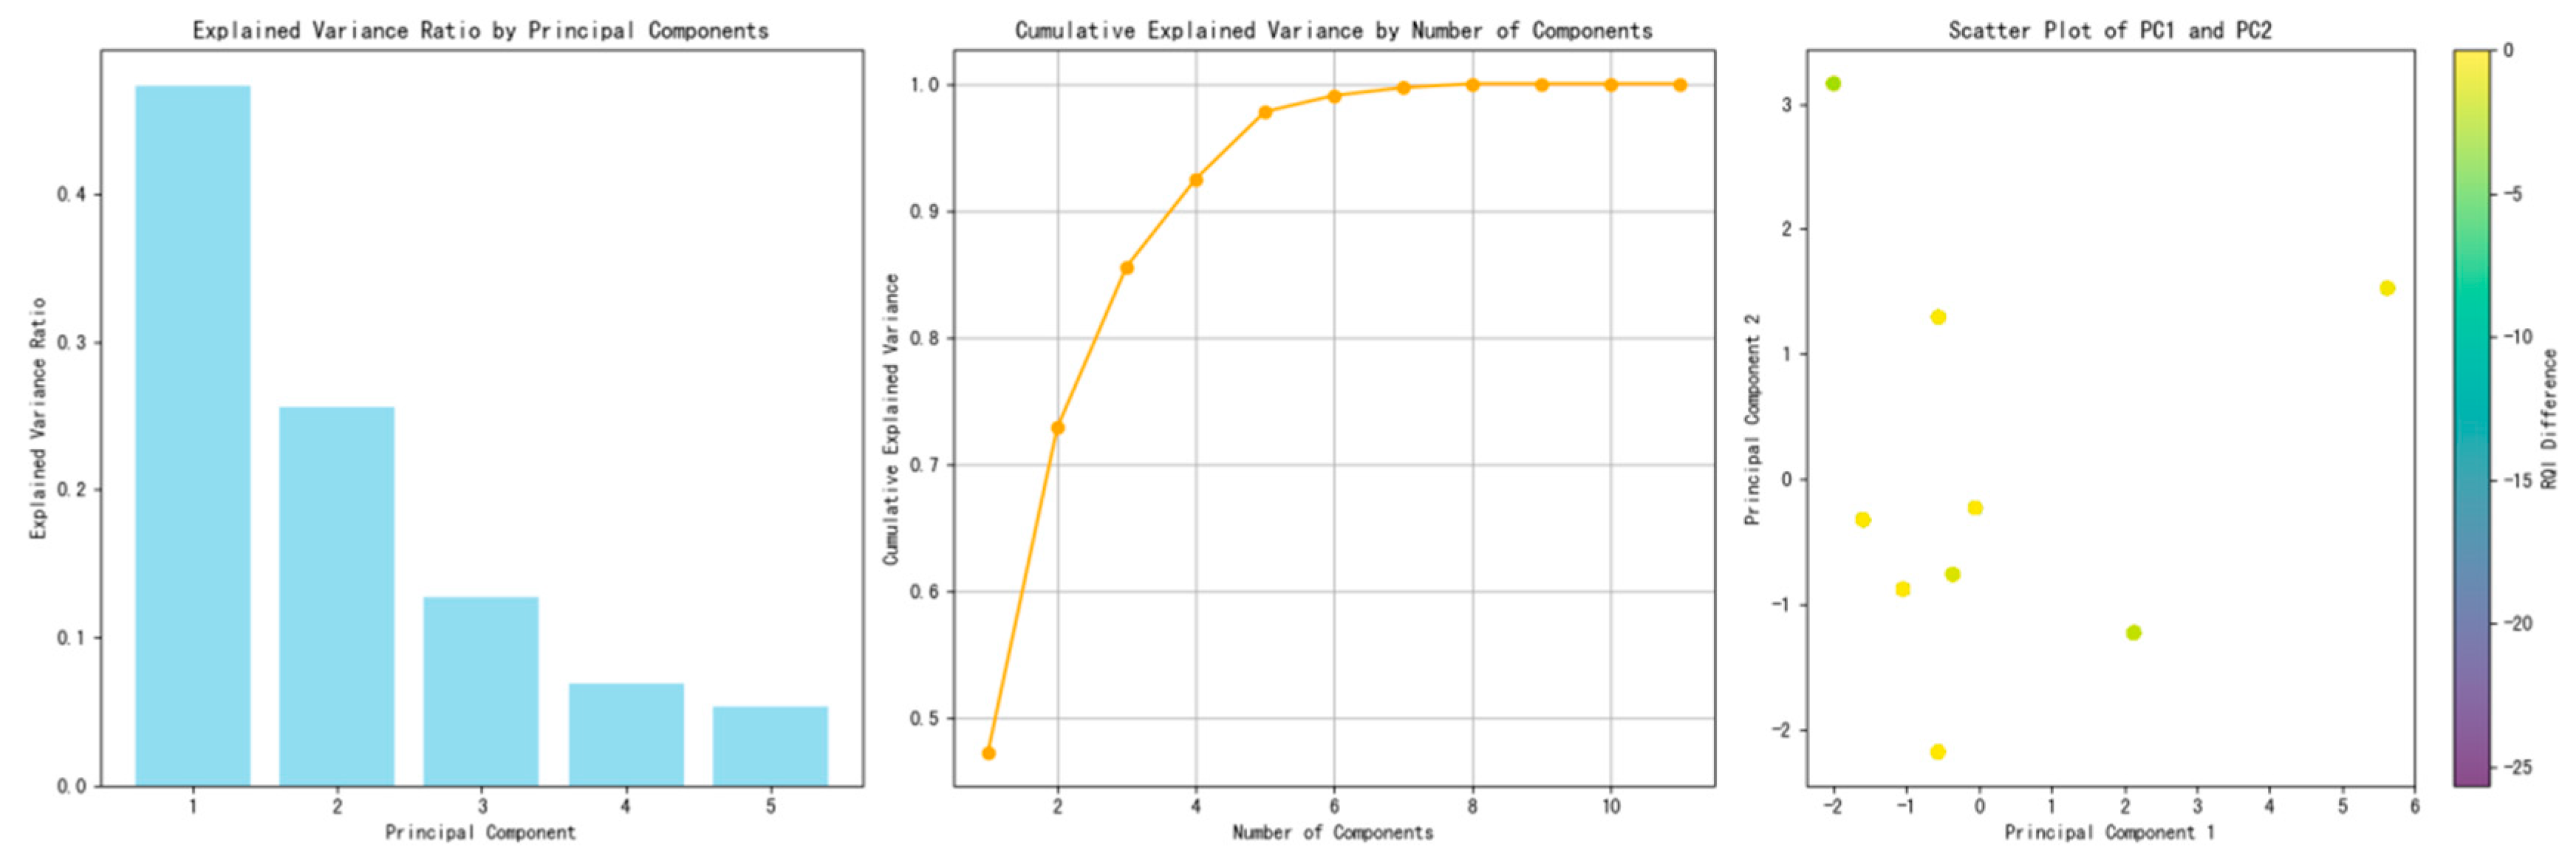
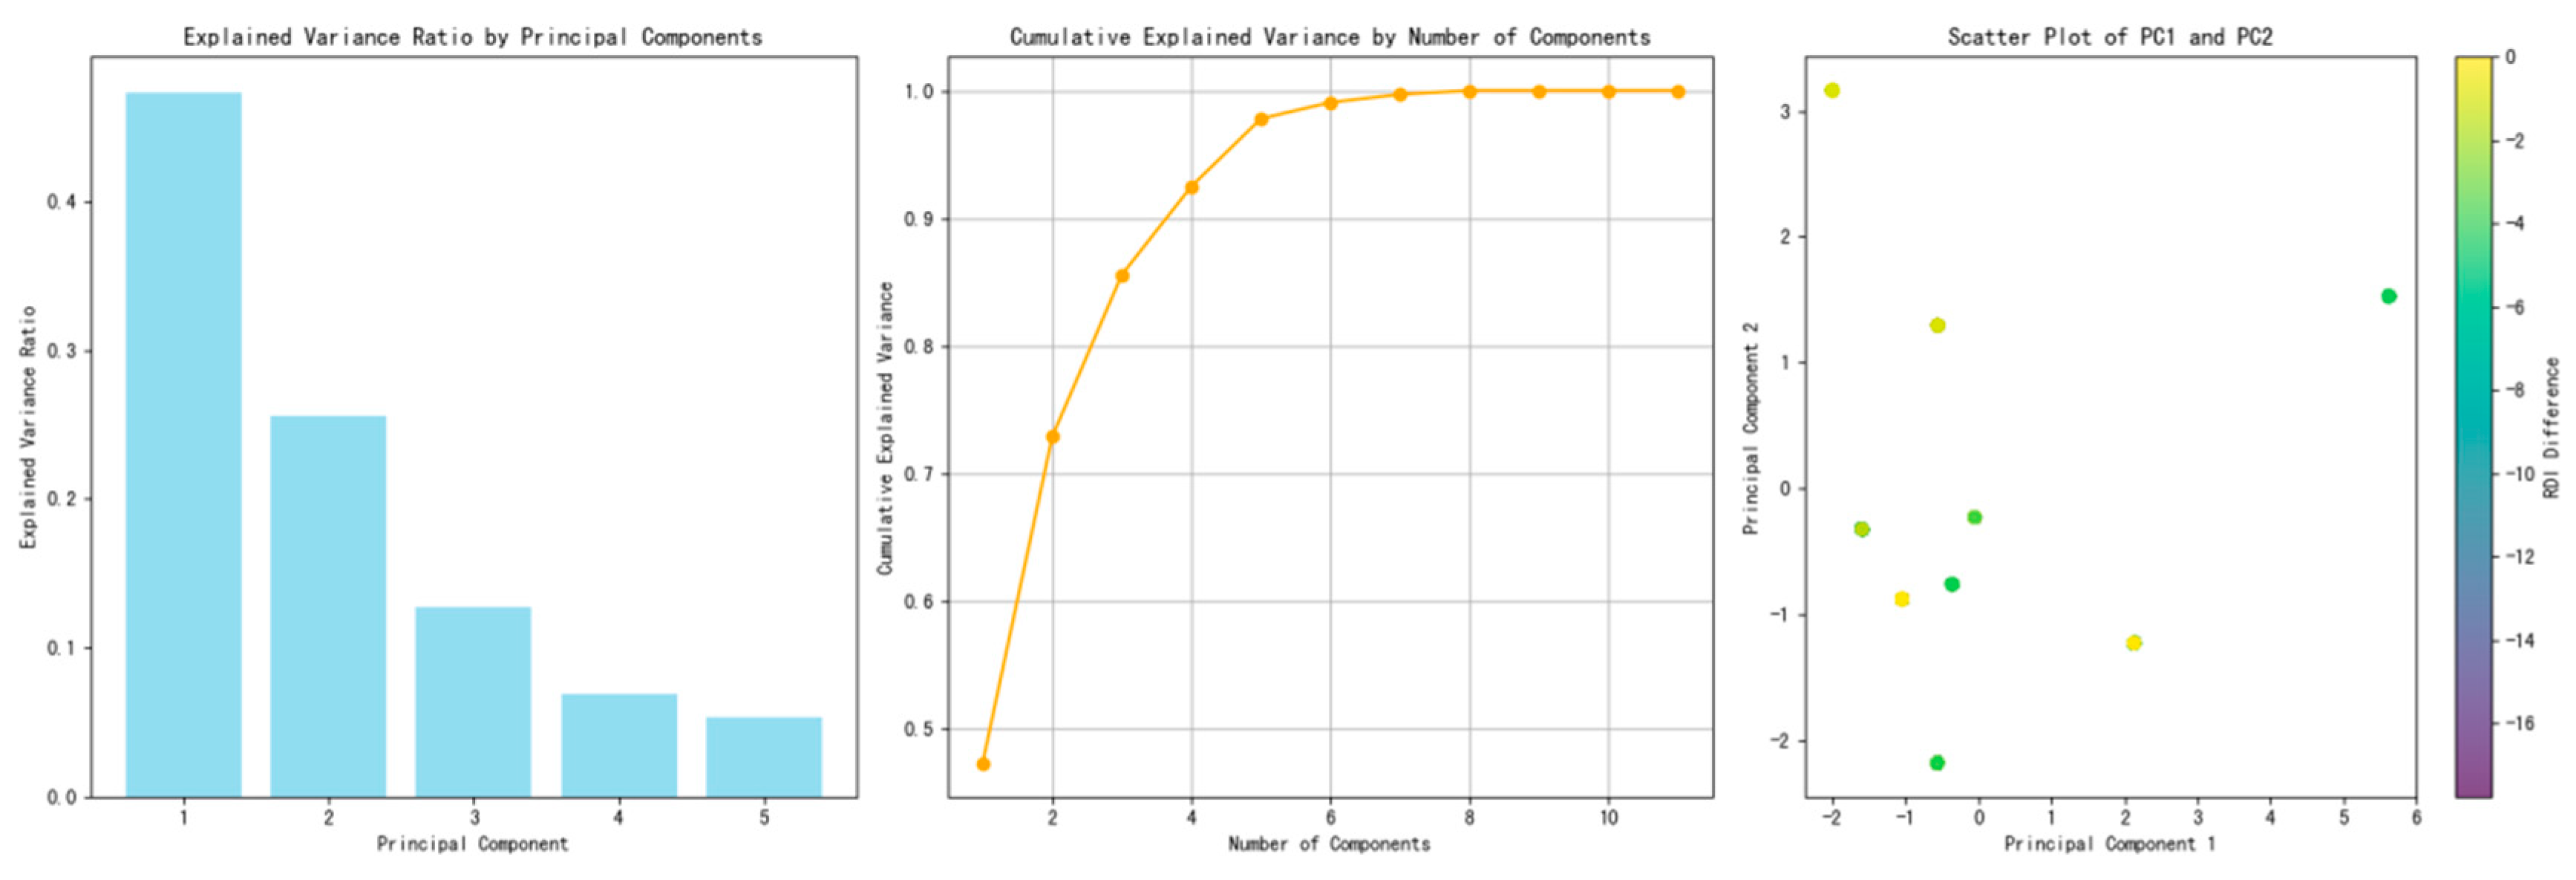
3.2.1. Principal Component Analysis

Principal Component Analysis (PCA) is an advanced technique for dimensionality reduction that transforms a complex set of intercorrelated variables into a more concise set of orthogonal variables, known as principal components. These components are linear combinations of the original variables designed to retain the maximum variance within the dataset. The application of PCA is multifaceted, serving various analytical objectives:
  • Identification of Variance Contributors: Principal Component Analysis (PCA) facilitates the identification of variables that predominantly contribute to the variance within the dataset, thereby elucidating the most influential factors.
  • Simplification of Data Structure: By reducing the complexity of the data structure, Principal Component Analysis (PCA) makes the analytical process more manageable and computationally efficient.
Visualization of High-Dimensional Data: Principal Component Analysis (PCA) is crucial for visualizing complex, high-dimensional data. This technique is essential for uncovering latent patterns or clusters that may not be apparent in the original dataset.
In the context of this investigation, Principal Component Analysis (PCA) was utilized to examine the intrinsic structure of 11 influential factors. This analysis aimed to identify those factors exhibiting the most significant variance and to assess their potential impact on pavement performance. The results are shown in Figure 5, Figure 6, Figure 7 and Figure 8.

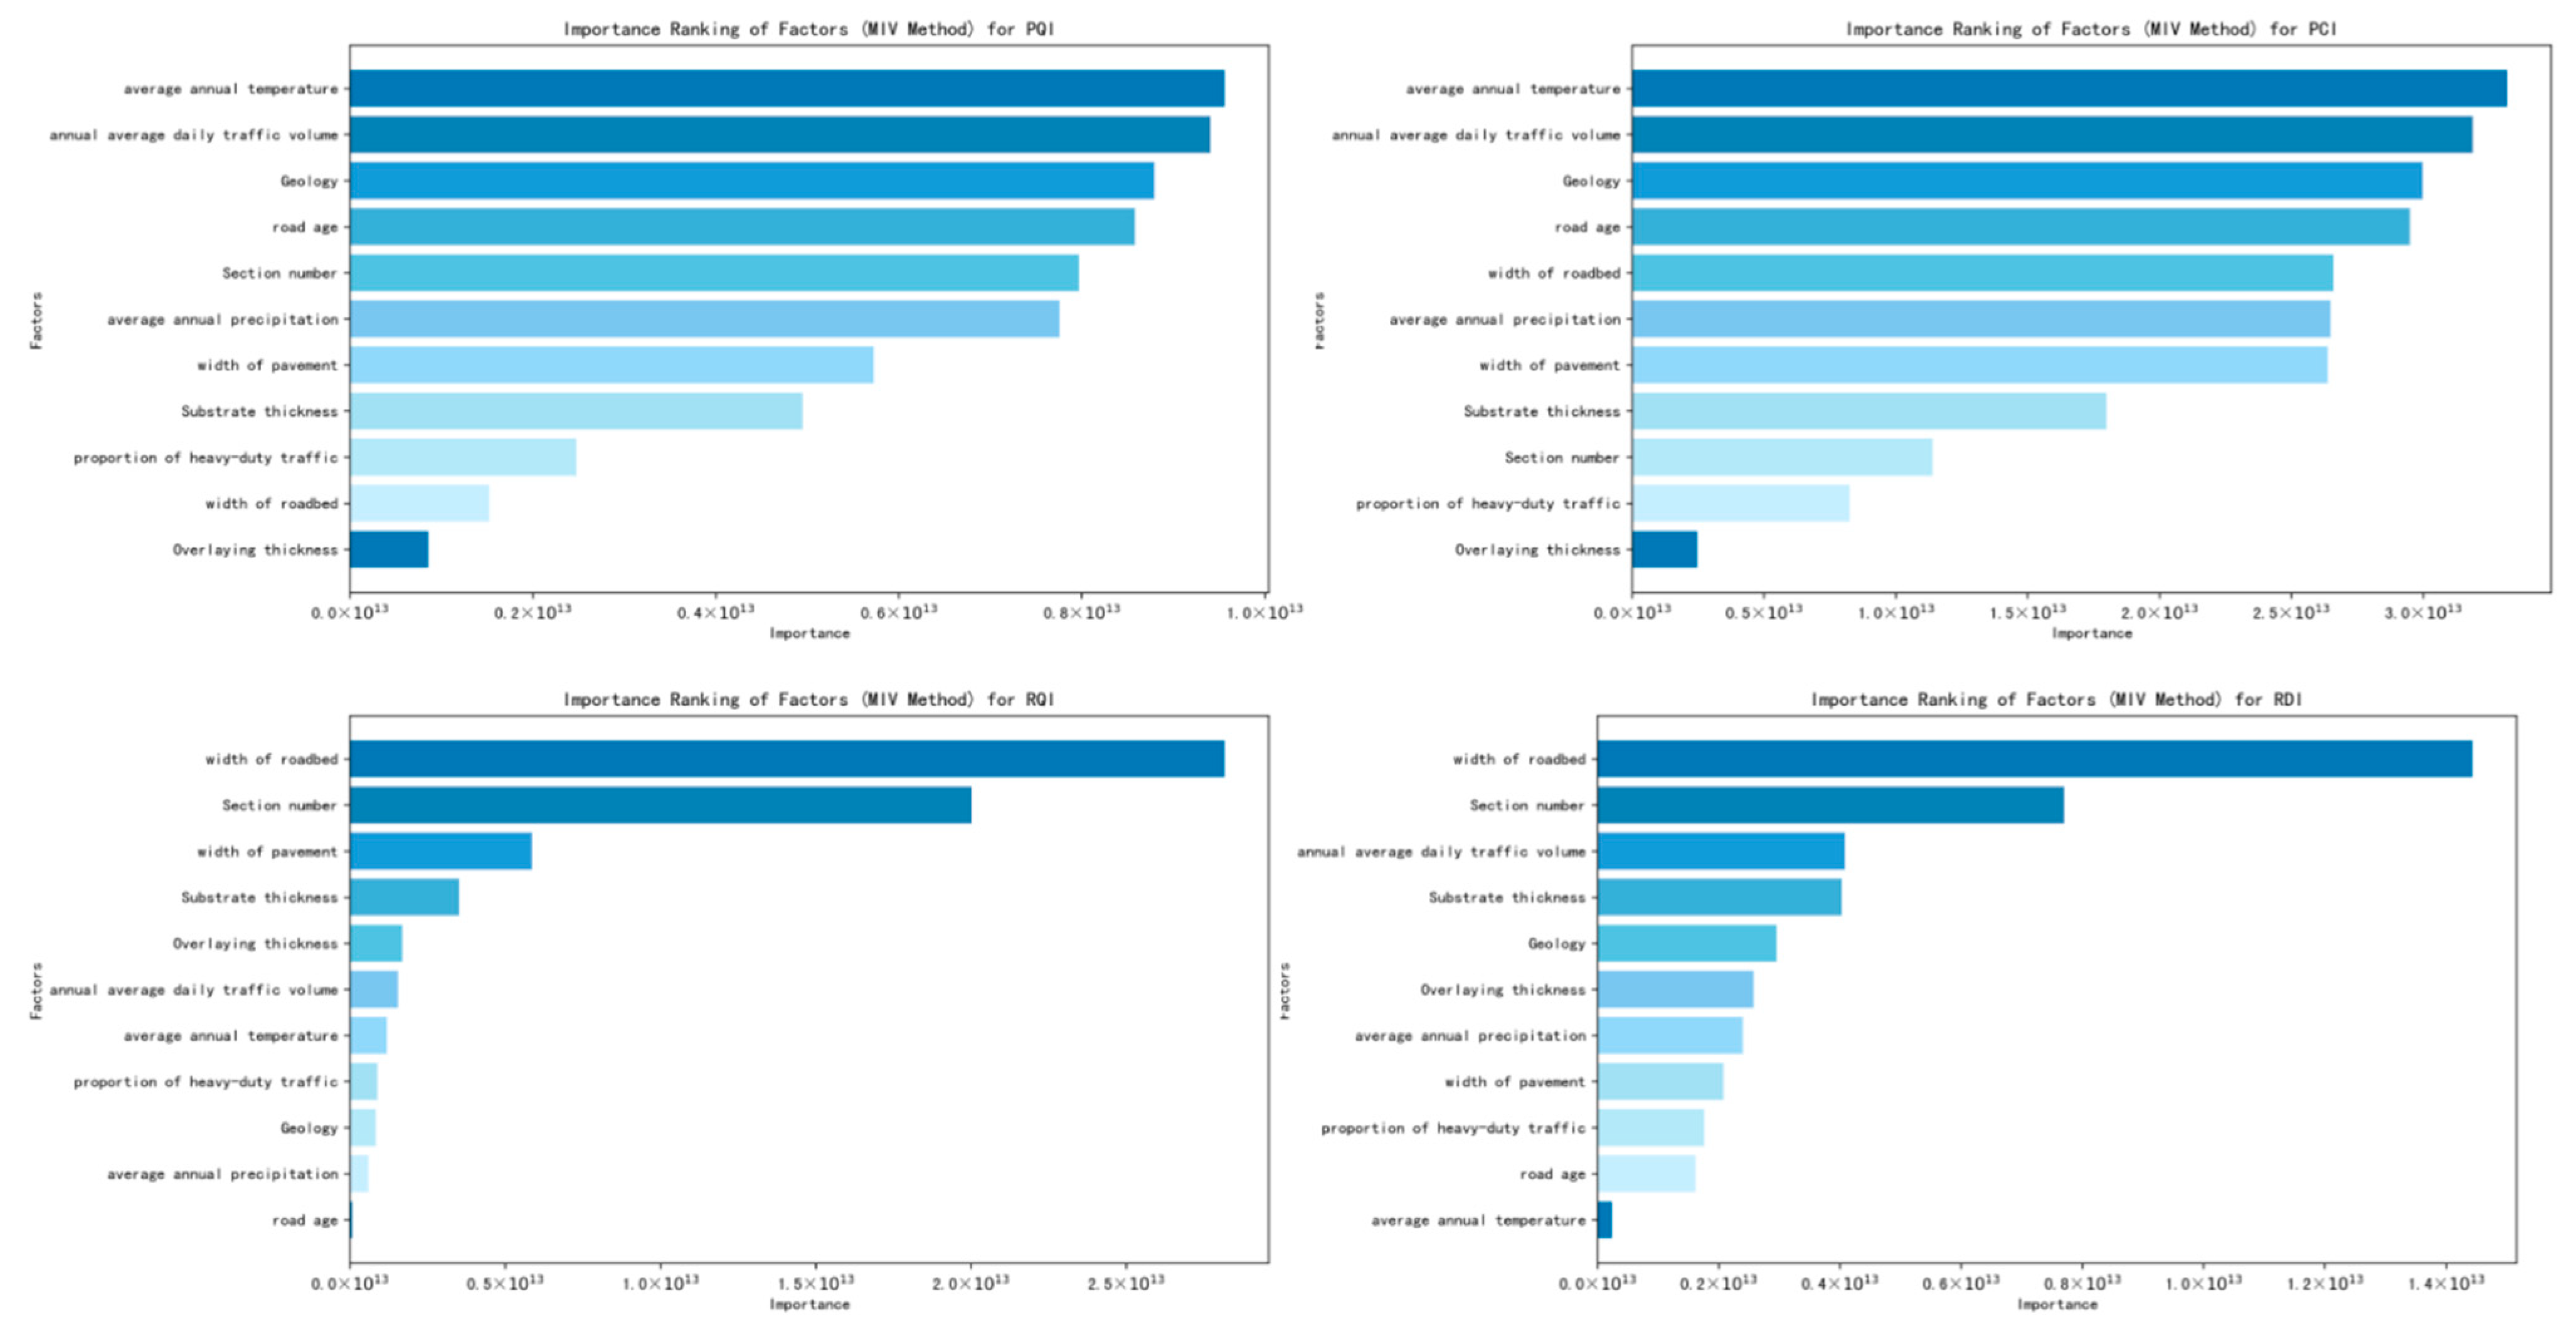
3.2.2. Feature Importance Analysis

Feature Importance Analysis, specifically through the Mean Decrease Impurity (MDI) metric, employs machine learning models such as Random Forest Regression to evaluate the significance of each factor in relation to the target variable, which, in this study, is the pavement performance metric. The Random Forest Regression model improves predictive accuracy and mitigates the risk of overfitting by aggregating predictions from multiple Decision Trees. The MDI metric quantifies the contribution of each variable to the model’s performance as follows:
  • Model Training: A Random Forest regression model is trained for each evaluation metric (PCI difference, RQI difference, RDI difference), treating each as the dependent variable.
  • Importance Scoring: Importance scores are assigned to each influencing factor, reflecting the average contribution of each variable across the ensemble of Decision Trees.
  • Influence Assessment: A higher score indicates a greater influence of the factor on the model’s predictive capacity.
Feature importance analysis offers a quantifiable assessment of the relative significance of each influencing factor concerning various pavement performance metrics. This analysis informs and enhances road maintenance and management strategies. The importance ranking of factors affecting the four road surface indicators is shown in the Figure 9.

3.2.3. Synergistic Analysis

The integration of Principal Component Analysis (PCA) and Multivariate Influence Variables (MIVs) offers a dual-pronged analytical approach. PCA provides a macroscopic understanding of the overall structure of the data, while MIV delivers a detailed ranking of specific influential factors. This combined methodology serves as a robust analytical framework for a comprehensive examination of the factors affecting pavement performance, equipping stakeholders with the insights necessary for data-driven decision-making in road maintenance and management.

3.3. Neural Network Modeling

In light of neural network theory, a comprehensive evaluation model for the performance of expressway asphalt pavements has been developed. Through an in-depth analysis of existing theories and extensive training simulations using collected data, this performance evaluation model has emerged. Neural networks, a key area within artificial intelligence, possess the remarkable ability to replicate the cognitive processes of the human brain and the evolutionary mechanisms observed in biology. This capability allows them to accurately capture the dynamic changes in road performance. Consequently, the application of such an intelligent approach as the evaluation model for expressway pavement performance is not only theoretically sound but has also proven to be highly effective in practice.

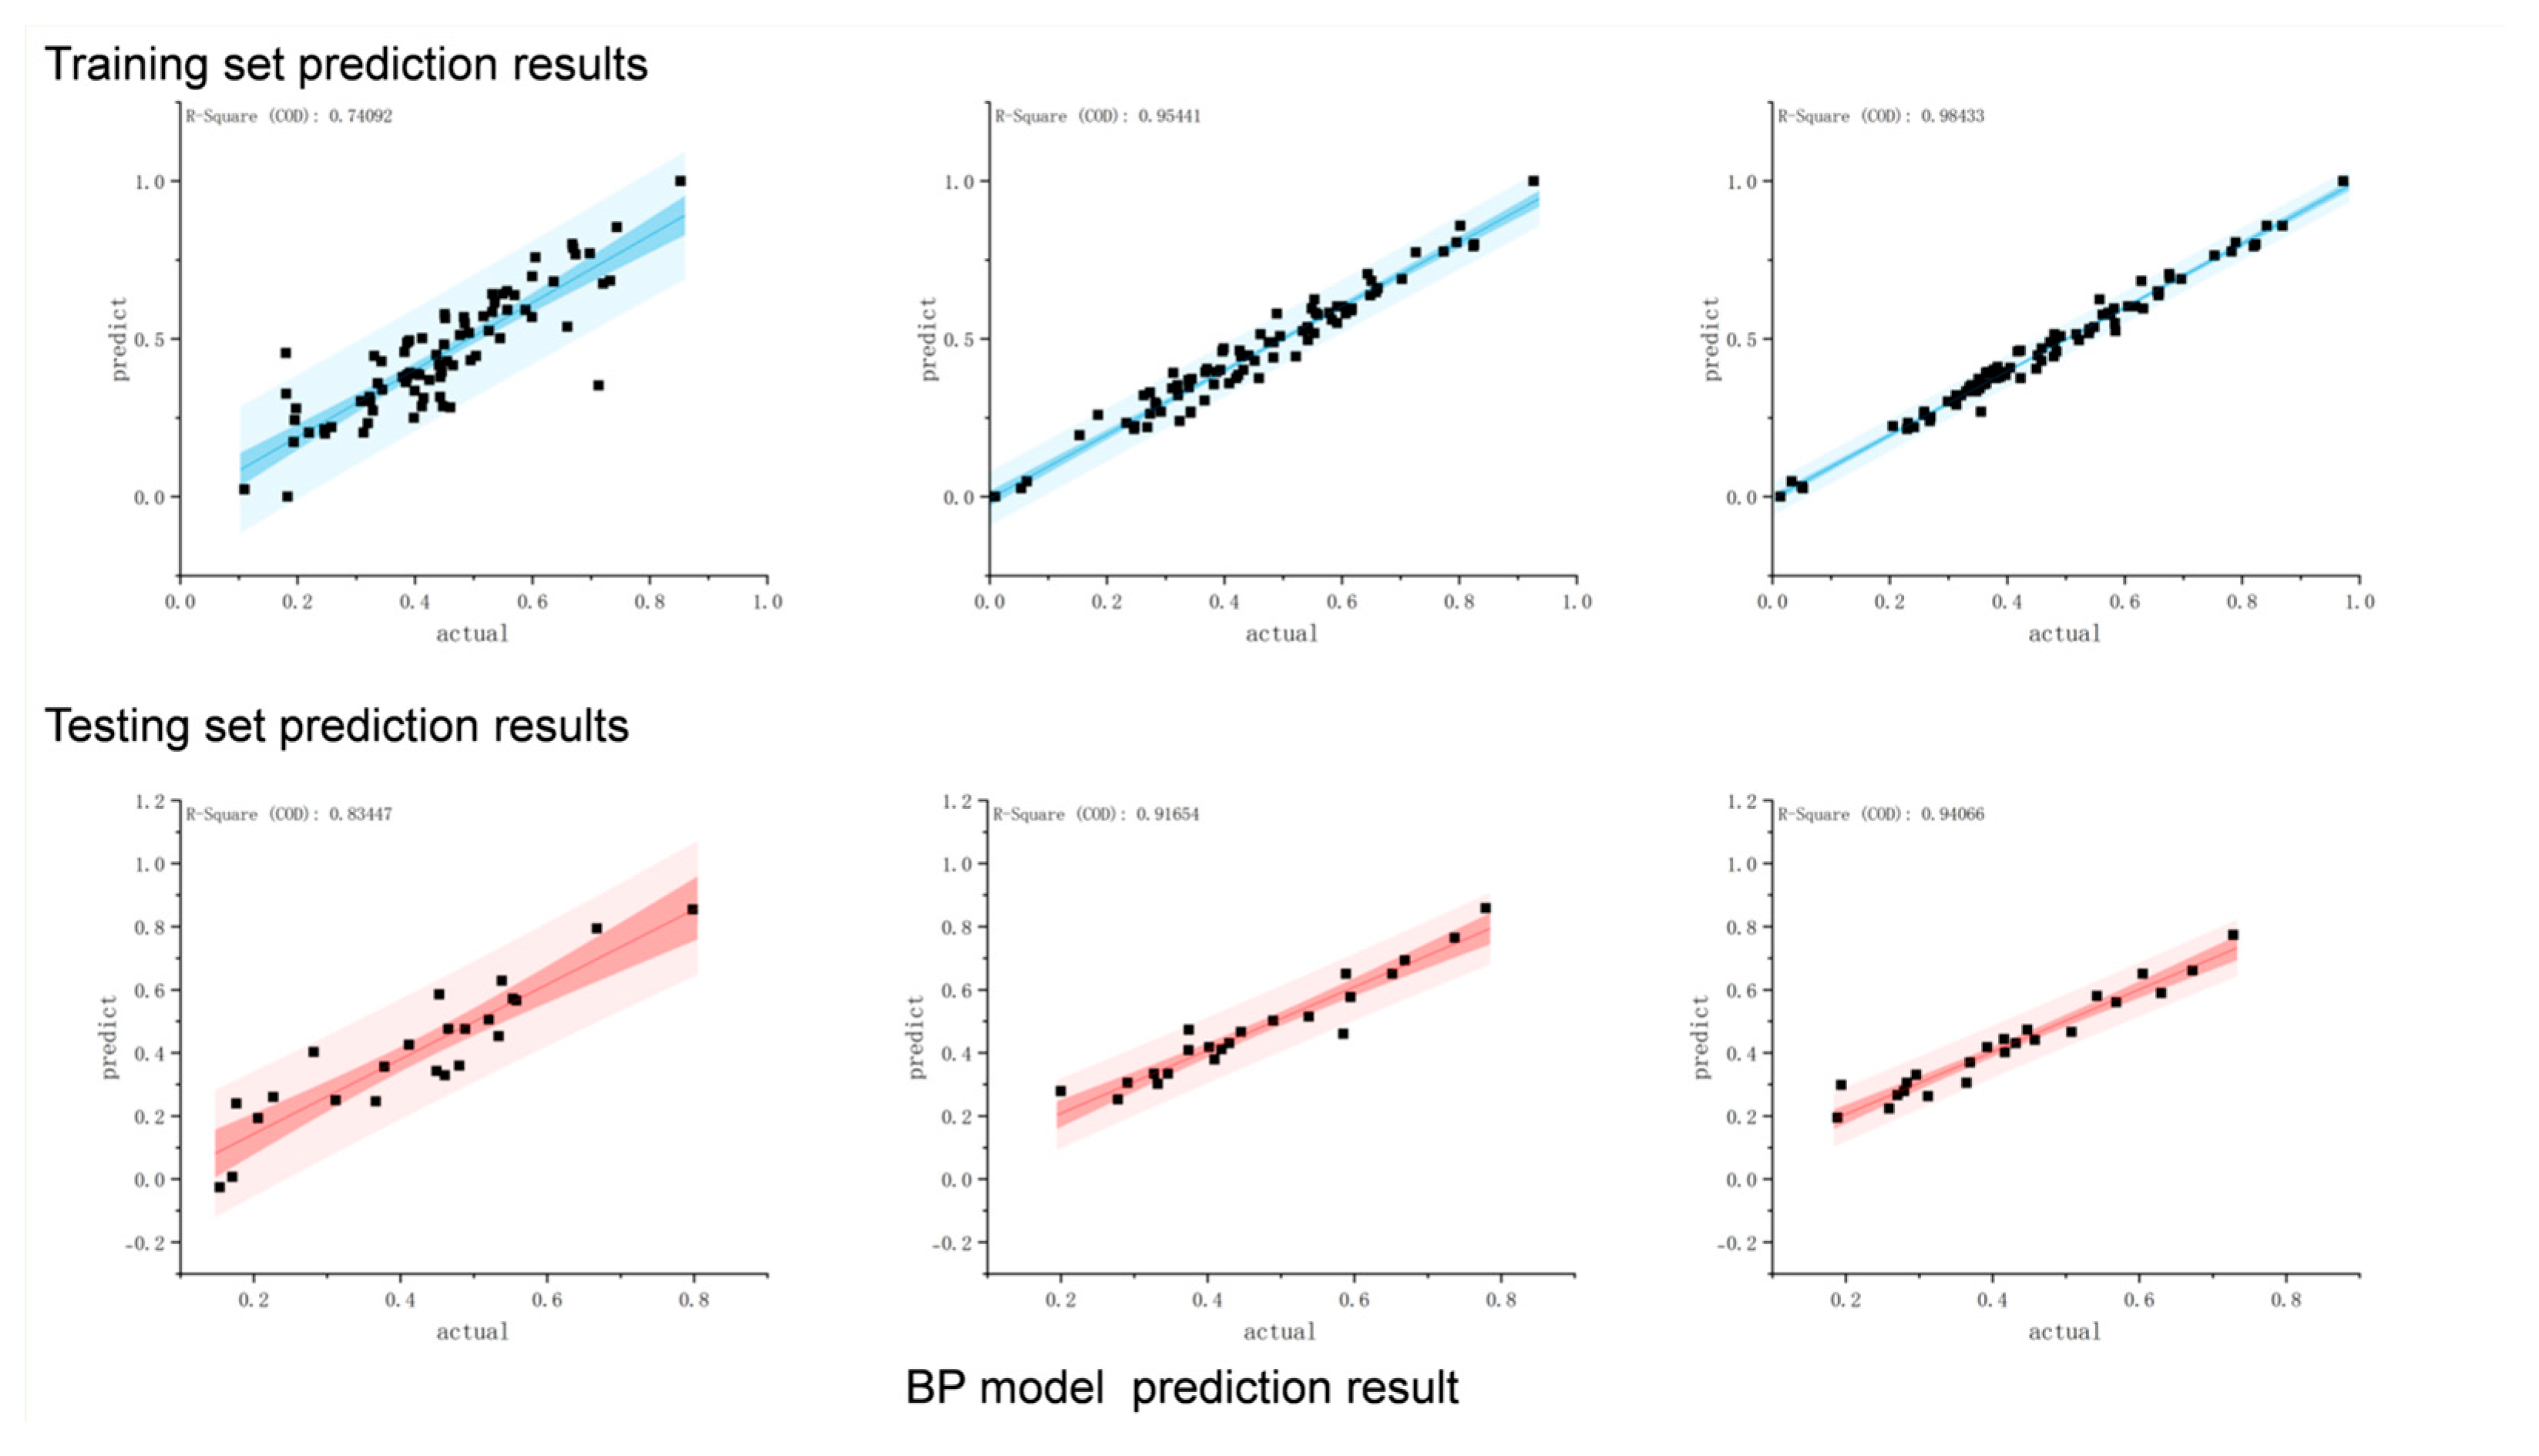
3.3.1. BP Neural Network

The backpropagation (BP) neural network, a multi-layer feed-forward neural network, is trained using the error backpropagation algorithm. It stands as one of the most extensively utilized neural network architectures. First conceptualized in 1986 by a team of scientists led by Rumelhart and McClelland, the BP neural network has significantly influenced the field of artificial intelligence and machine learning.
Structurally, the BP neural network is a quintessential non-linear algorithm. It is composed of an input layer, one or more hidden layers (also referred to as intermediate layers), and an output layer. Each layer contains a variable number of nodes, and the inter-layer connectivity of these nodes is characterized by weights. These weights determine the strength of the signal transmission between nodes in adjacent layers, playing a crucial role in the network’s learning process and its ability to model complex relationships within data. BP model prediction result is shown in the Figure 10.

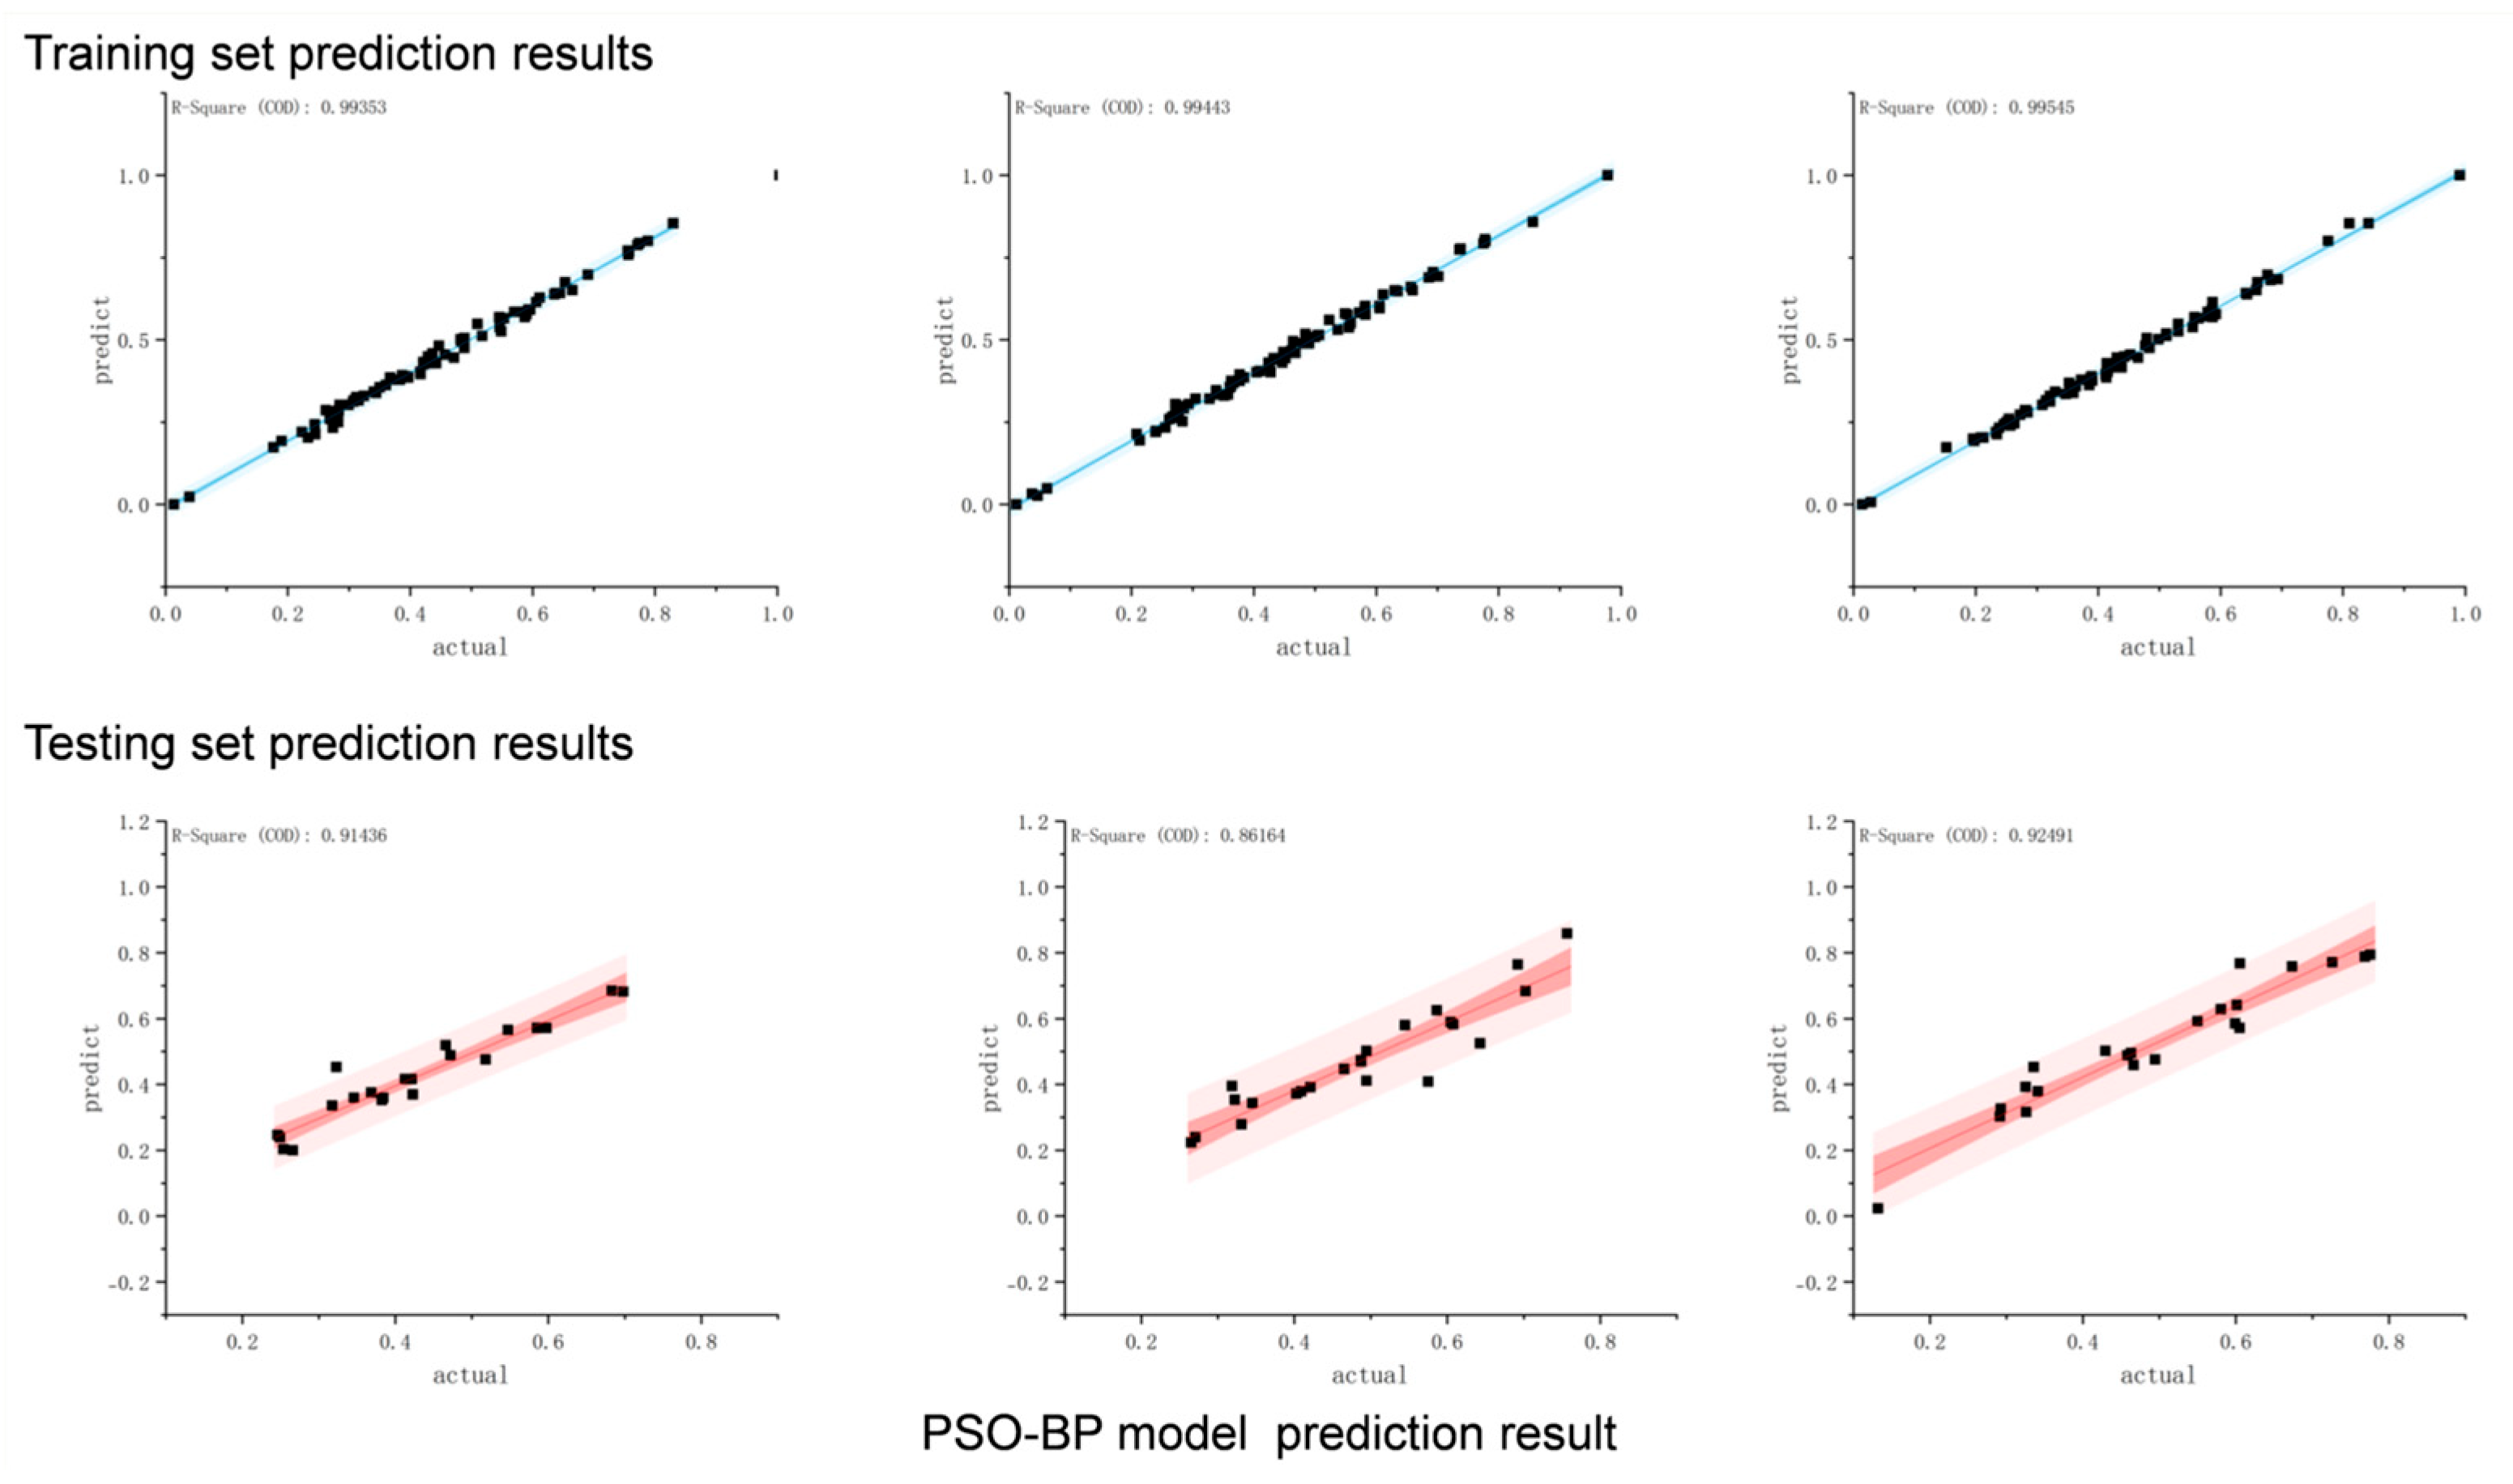
3.3.2. PSO-BP Neural Network

In a backpropagation (BP) neural network, the number of hidden nodes is typically determined through repeated forward propagation and backpropagation processes. By modifying or constructing the training method to adjust the number of hidden nodes, the corresponding initial weights and thresholds will also change, which, in turn, affects the convergence and learning efficiency of the network.
To mitigate these influences, a BP neural network model based on the Particle Swarm Optimization (PSO) algorithm is employed to optimize the adjustment of weights and thresholds. This optimization approach aims to accelerate the convergence speed of the network and enhance its learning efficiency. Specifically, the PSO algorithm, with its ability to search for optimal solutions in a multi-dimensional space through the collective behavior of particles, can effectively explore a more suitable combination of weights and thresholds for the BP neural network. By integrating PSO into the BP neural network, the network can avoid getting trapped in local minima more effectively during the training process and, thus, achieve faster convergence and higher learning performance. This combination of PSO and BP neural networks provides a more robust and efficient approach for dealing with complex problems that require accurate modeling and prediction. PSO-BP model prediction result shown in Figure 11.

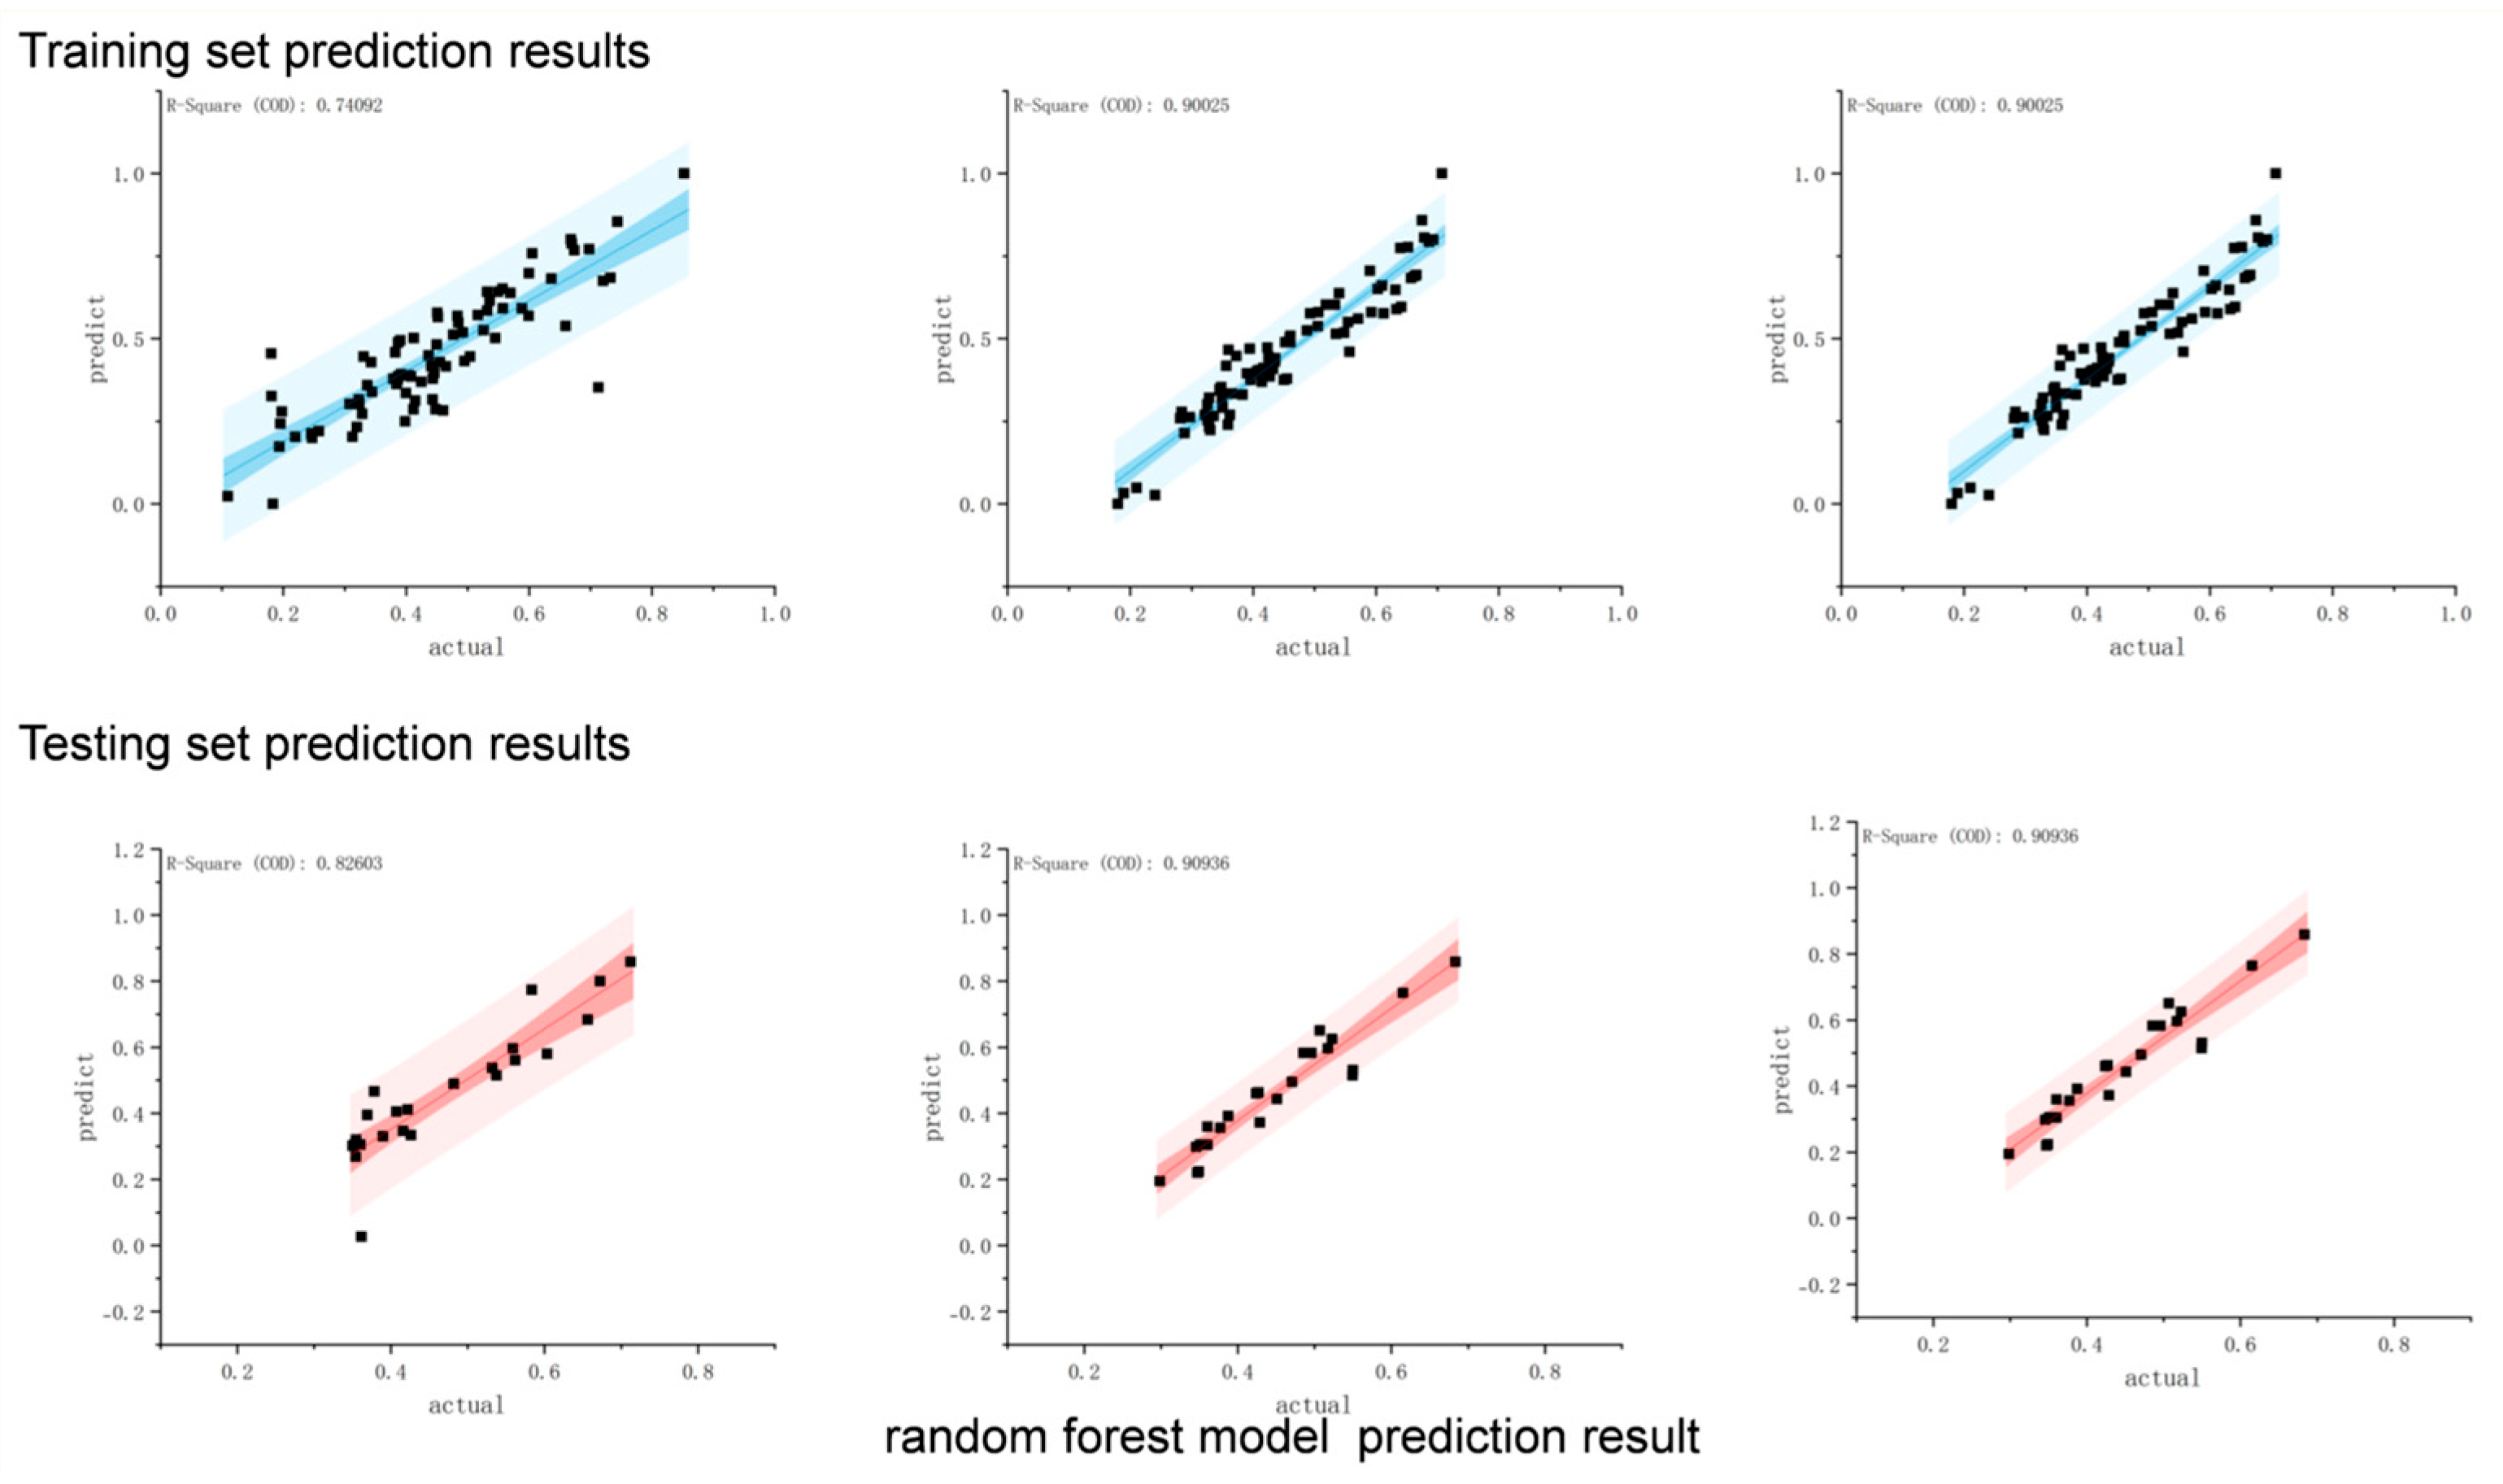
3.3.3. Random Forest

Random Forest, an ensemble learning technique in the realm of machine learning, enhances the accuracy and generalization ability of a model through the construction of multiple Decision Trees that incorporate randomness for classification or regression tasks.
Specifically, Random Forest aggregates multiple Decision Trees, each of which is built upon a self-sampled dataset (bootstrapped sample). During the tree-splitting process, a random subset of features is selected at each node. This dual-randomness mechanism effectively reduces the correlation among individual trees while maintaining their diversity. For classification problems, the final prediction is obtained through a majority voting scheme across the predictions of all trees, while for regression tasks, the predictions of individual trees are averaged. This ensemble approach not only mitigates the overfitting risk inherent in single Decision Trees but also significantly improves the overall performance in terms of prediction accuracy and generalization to unseen data, making Random Forest a powerful and widely adopted method in various data-driven applications. The random forest model prediction result is shown in Figure 12.

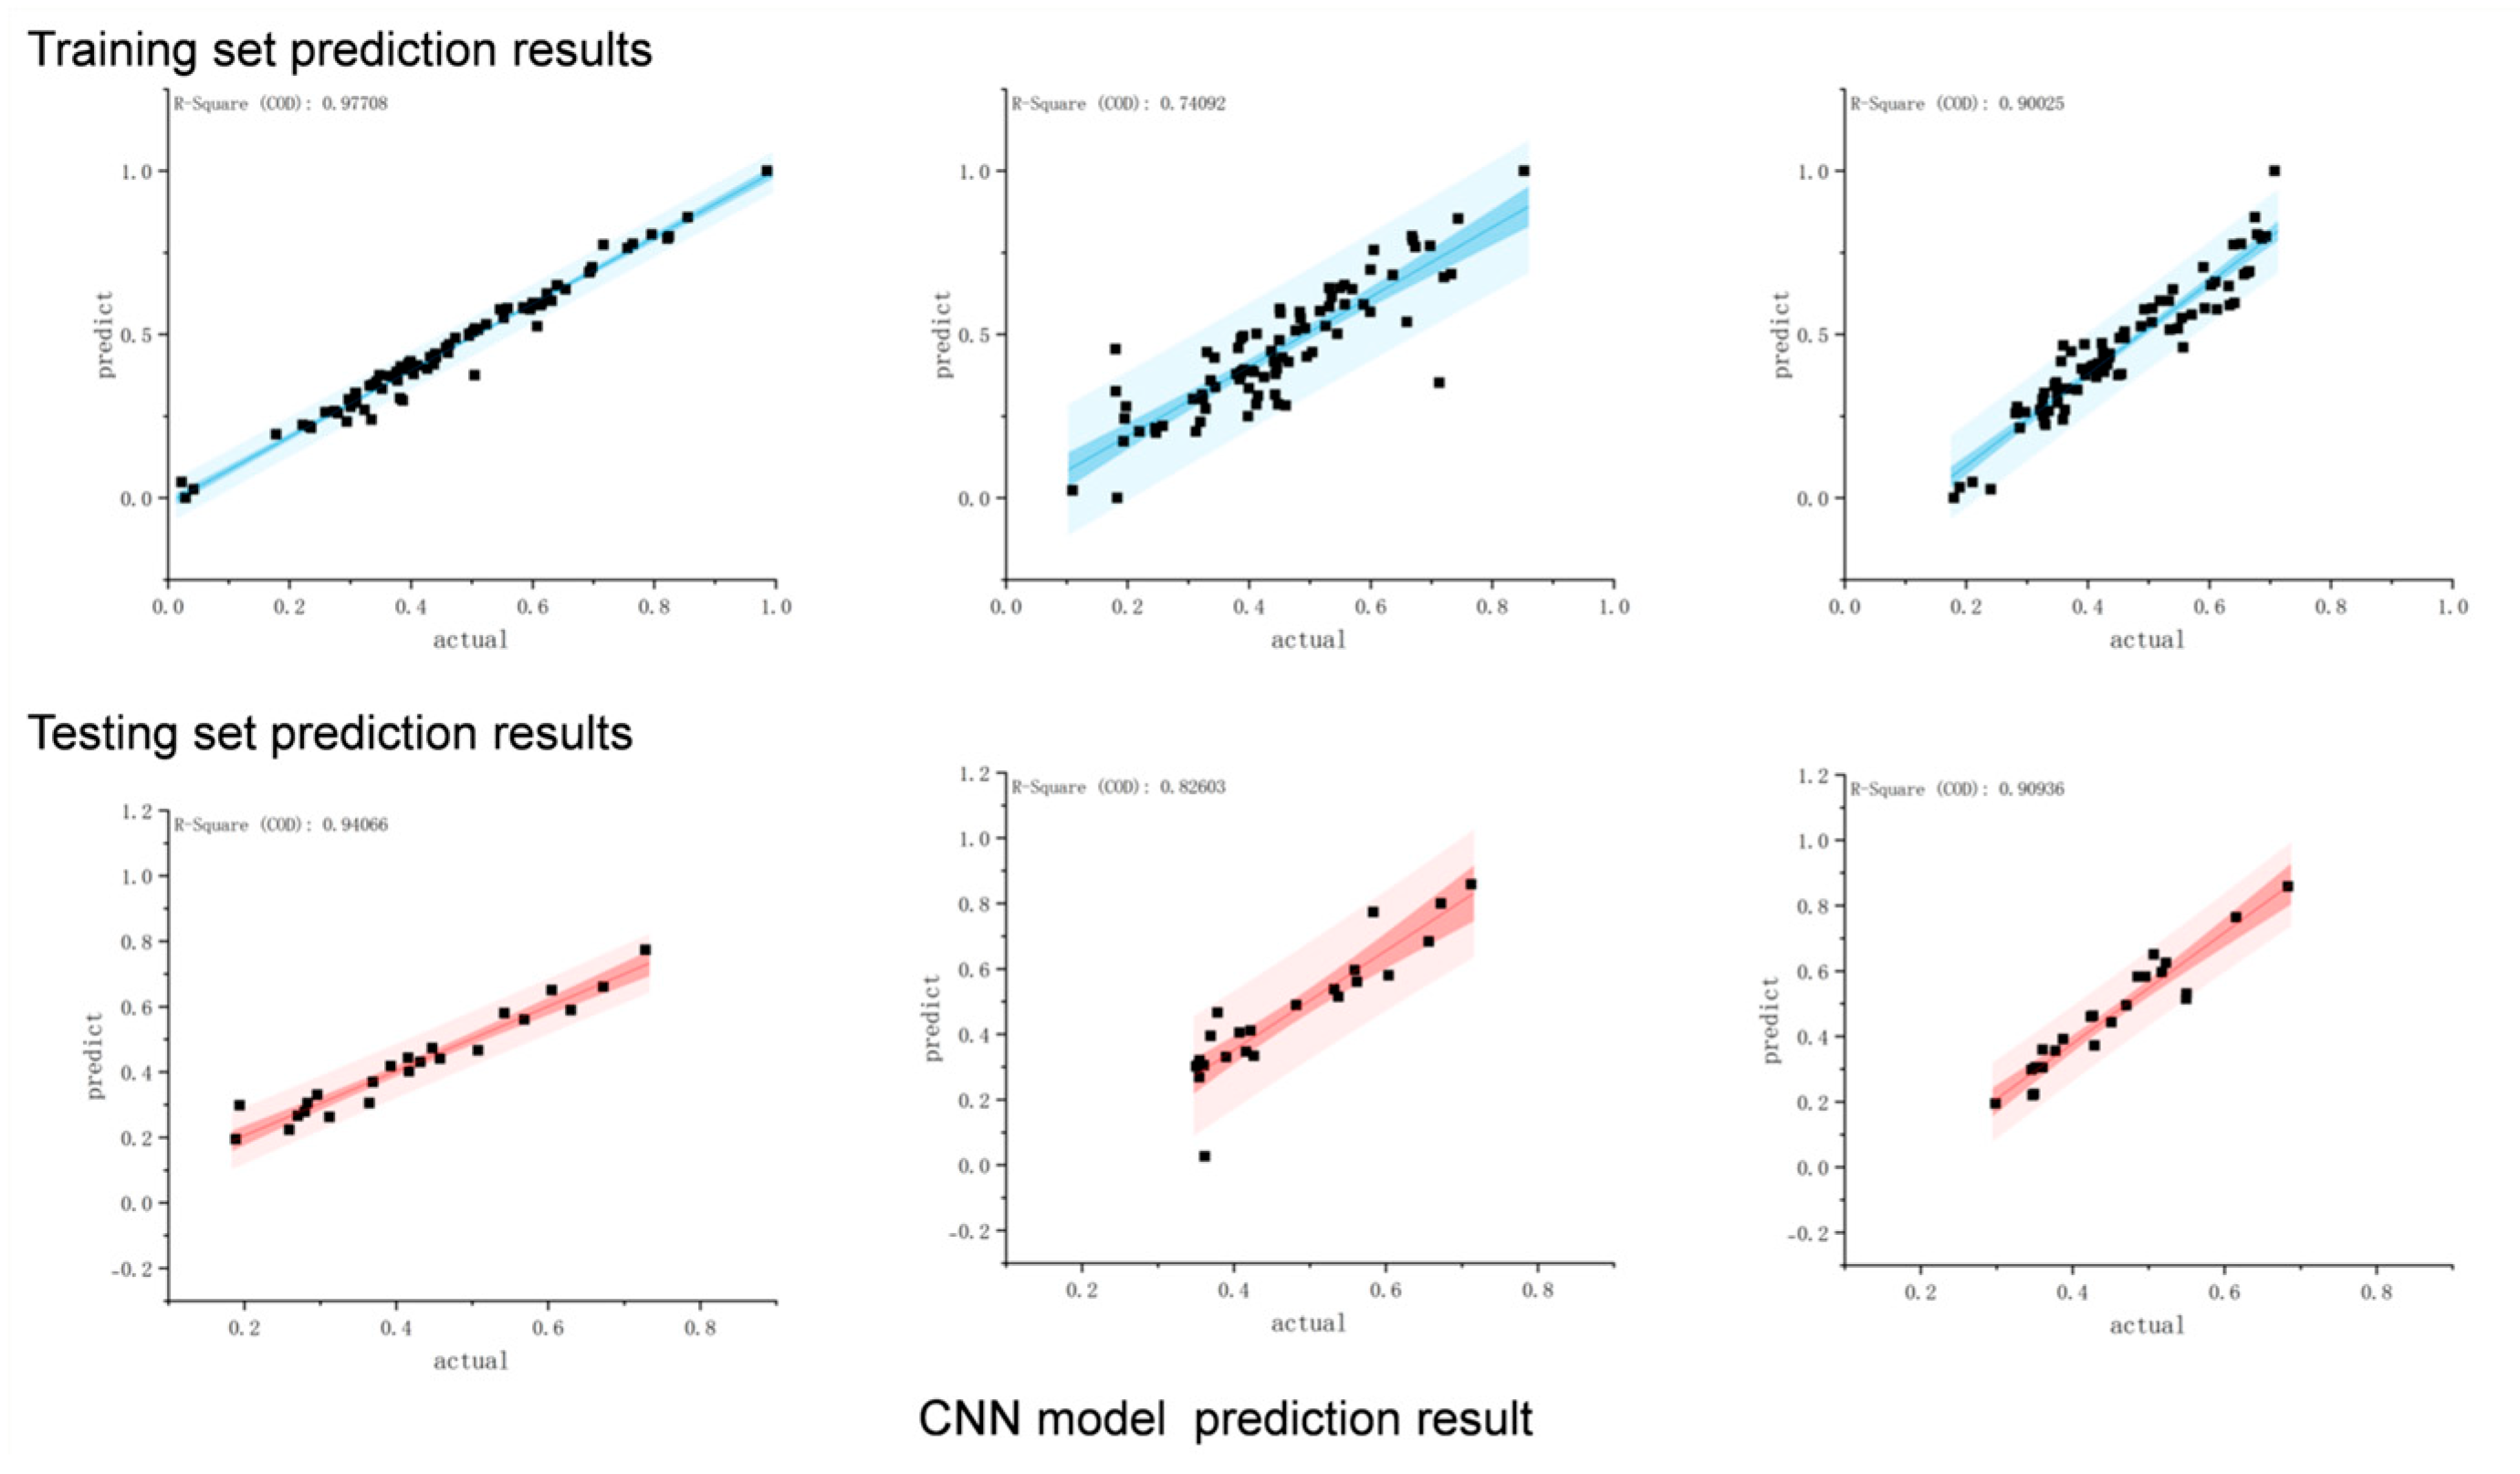
3.3.4. Convolutional Neural Network

Convolutional Neural Network (CNN), a pivotal technology within the realm of deep learning, has manifested remarkable performance across diverse domains. Leveraging its potent feature extraction capabilities and adeptness at capturing the local structural characteristics of data, CNNs have become a cornerstone in modern artificial intelligence research and applications.
CNNs extract local features from data autonomously through convolutional operations. This mechanism significantly reduces the number of model parameters, thereby enhancing both computational efficiency and the model’s generalization ability. By capitalizing on the inherent spatial correlations within data, CNNs can effectively distill hierarchical representations, enabling them to handle complex patterns with reduced computational overhead compared to traditional neural network architectures.
The core architecture of CNNs comprises three primary components: convolutional layers, pooling layers, and fully connected layers. Convolutional layers are responsible for detecting various local patterns in the input data through the application of learnable filters. Pooling layers, on the other hand, downsample the feature maps generated by convolutional layers, reducing their spatial dimensions while retaining the most salient features. This downsampling process not only decreases computational complexity but also mitigates overfitting. Finally, fully connected layers integrate the processed features and map them to the appropriate output classes, enabling the CNN to perform classification or regression tasks. These layers work in concert to facilitate the extraction, transformation, and classification of input data, thereby enabling CNNs to achieve state-of-the-art performance in a wide range of computer vision, speech recognition, and natural language processing tasks. The prediction result is shown as Figure 13.

3.3.5. Characterization of Model Performance

The performance of the neural network models, including BP (backpropagation), PSO-BP (Particle Swarm Optimization–backpropagation), Random Forest, and Convolutional Neural Network, was evaluated using various metrics. The metrics chosen for this study were R-squared (R2), mean absolute error (MAE), and mean bias error (MBE). These metrics provide insights into the model’s ability to capture the variability and trends in the data, as well as its accuracy in predicting pavement performance.
R-squared (R2): This metric measures the proportion of the variance in the dependent variable that is predictable from the independent variables. An R2 value closer to 1 indicates a better fit of the model to the data.
Mean absolute error (MAE): MAE measures the average magnitude of the errors between predicted and actual values without considering their direction. A lower MAE indicates better model performance.
Mean bias error (MBE): MBE indicates the average difference between predicted and actual values. A model with a small MBE is preferred, as it suggests that the predictions are neither systematically too high nor too low.

3.3.6. Model Comparison

In the performance comparison of prediction models, notable differences emerge across three indices (PCI, RQI, RDI) in training and testing datasets. For the coefficient of determination (R2), PSO-BP shows stable excellence in PCI (R2 = 0.983/0.968) and RDI (R2 = 0.971/0.982), while CNN achieves a top training R2 of 0.998 for RQI but drops to 0.93 in testing, indicating generalization variability. Random Forest maintains testing R2 > 0.9 across all indices, whereas BP lags with lower values (e.g., PCI testing R2 = 0.808).
In mean absolute error (MAE), Random Forest leads in PCI (testing MAE = 0.419) and RDI (training MAE = 0.097), showcasing strong error control; PSO-BP excels in RQI (testing MAE = 0.342). CNN has a higher MAE for PCI/RDI, especially RDI testing (MAE = 2.8265). For mean bias error (MBE), Random Forest (PCI training MBE = 0.0068) and PSO-BP (RQI training MBE = 0.008) show minimal bias. CNN has an anomalous RDI testing MBE, while BP has a larger PCI bias (training MBE = 0.541).
The comparison results of all methods are shown in Table 5. Overall, PSO-BP offers stable high-precision fitting, Random Forest excels in error control, CNN shows strong training performance but variable testing generalization, and BP lags.

4. Discussion

The study develops a regionalized deterioration model for Xinjiang’s highway pavements by integrating the international literature, domestic specifications, and a comprehensive field dataset covering structural design, material composition, environmental stressors, traffic loading, and maintenance interventions. Principal Component Analysis and permutation-based variable importance revealed road age and macro-climatic indicators (mean annual temperature and precipitation) as the dominant predictors for all four performance indices (PQI, PCI, RQI, RDI), corroborating previous tropical findings while demonstrating that Xinjiang’s extreme diurnal temperature differentials accelerate asphalt oxidative aging and its episodic precipitation regime intensifies moisture-induced stripping. Empirical evaluation showed that a PSO-optimized backpropagation neural network achieved the highest predictive accuracy (PCI R2 = 0.977; RDI R2 = 0.982) by efficiently navigating the province’s complex covariate interactions, whereas a Random Forest regressor provided the tightest error control (PCI MAE = 0.419). Data integrity was ensured through IQR-based outlier excision, mitigating the impact of anomalous observations. Despite these strengths, the model’s geographic specificity—confined to Xinjiang’s arid–continental climate—limits its direct applicability to humid or permafrost regions; maintenance records remain coarse because high-resolution, real-time data from smart-pavement sensor networks were unavailable. Future work should, therefore, expand the dataset through multi-region collaborations, integrate IoT-enabled continuous sensing to capture dynamic load–environment interactions, and embed physics-informed constraints within machine-learning architectures to enhance cross-regional generalizability.

5. Conclusions

This study successfully developed a regionalized pavement performance decay model tailored to the unique conditions of Xinjiang Province. The findings provide valuable insights into the factors influencing asphalt pavement performance and offer practical guidance for road maintenance and management strategies. The model can be used to predict pavement performance and inform maintenance decisions, thereby improving road safety and reducing maintenance costs. While the study addresses several critical challenges, such as outliers and missing data, its limitations primarily lie in the regional specificity of the data and the complexity of interactions between input parameters. Despite these limitations, the model represents a significant advancement in understanding pavement performance in arid and semi-arid regions. Future research should focus on expanding the dataset and refining the model to account for additional variables and interactions, ultimately enhancing its applicability and effectiveness in real-world scenarios.

Author Contributions

Conceptualization, Q.Y. and W.T.; methodology, Q.Y.; software, Q.Y.; validation, Q.Y., W.T. and X.D.; formal analysis, Q.Y.; investigation, Q.Y.; data curation, Q.Y.; writing—original draft preparation, Q.Y.; writing—review and editing, X.D.; visualization, Q.Y.; supervision, X.D.; project administration, X.D.; funding acquisition, W.T. All authors have read and agreed to the published version of the manuscript.

Funding

This study is jointly found by the Science and Technology Projects of Xinjiang Communications Investment Group Co., Ltd. (XJJTZKX-FWCG-202401-0044), the Xinjiang Key R&D Program Projects (2022B03033-1), the project of Dr. Tianchi in Xinjiang Uygur Autonomous Region and Xinjiang Natural Science Foundation, grant number: 2024D01A53.

Data Availability Statement

Data will be made available upon request.

Conflicts of Interest

Author Xiaomin Dai is employed by Xinjiang Key Laboratory of Green Construction and Maintenance of Transportation Infrastructure and Intelligent Traffic Control. Author Wei Tian is employed by Xinjiang Transportation Investment (Group) Co., Ltd., Engineering Technology and Transportation Industry in Arid Desert Areas, and Xinjiang Transportation Investment (Group) Co., Ltd. Author Qi Yang declares no financial or non-financial conflicts of interest. The remaining authors certify that no commercial, personal, or professional relationships influenced the research design, data interpretation, or conclusions of this study. All funding sources are disclosed in the Funding section.

References

  1. Chan, C.Y.; Huang, B.; Yan, X.; Richards, S. Relationship Between Highway Pavement Condition, Crash Frequency, and Crash Type. J. Transp. Saf. Secur. 2009, 1, 268–281. [Google Scholar] [CrossRef]
  2. Aleadelat, W.; Saha, P.; Ksaibati, K. Development of Serviceability Prediction Model for County Paved Roads. Int. J. Pavement Eng. 2018, 19, 526–533. [Google Scholar] [CrossRef]
  3. Isradi, M.; Prasetijo, J.; Aden, T.S.; Rifai, A.I. Relationship of Present Serviceability Index for Flexible and Rigid Pavement in Urban Road Damage Assessment Using Pavement Condition Index and International Roughness Index. E3S Web Conf. 2023, 429, 03012. [Google Scholar] [CrossRef]
  4. Nur, W.; Subagio, B.S.; Hariyadi, E.S. Relationship between the Pavement Condition Index (PCI), Present Serviceability Index (PSI), and Surface Distress Index on Soekarno Hatta Road, Bandung. J. Tek. Sipil 2019, 26, 111–120. [Google Scholar] [CrossRef]
  5. Abed, A.; Rahman, M.; Thom, N.; Hargreaves, D.; Li, L.; Airey, G. Predicting Pavement Performance Using Distress Deterioration Curves. Road Mater. Pavement Des. 2024, 25, 1174–1190. [Google Scholar] [CrossRef]
  6. Morisugi, H. Evaluation Methodologies of Transportation Projects in Japan. Transp. Policy 2000, 7, 35–40. [Google Scholar] [CrossRef]
  7. Yao, L.; Dong, Q.; Jiang, J.; Ni, F. Deep Reinforcement Learning for Long-term Pavement Maintenance Planning. Comput. Aided Civ. Eng. 2020, 35, 1230–1245. [Google Scholar] [CrossRef]
  8. JTJ 075-94; Quality Inspection and Evaluation Standards for Highway Maintenance. China Communications Press: Beijing, China, 1994.
  9. JTJ 073-1996; Highway Maintenance Technical Specifications. China Communications Press: Beijing, China, 1996.
  10. JTJ 073.1-2001; Technical Specifications of Cement Concrete Pavement Maintenance for Highway. China Communications Press: Beijing, China, 2001.
  11. JTG H10-2009; Technical Specifications of Maintenance for Highway. China Communications Press: Beijing, China, 2009.
  12. JTG H20-2007; Highway Performance Assessment Standards. China Communications Press: Beijing, China, 2007.
  13. JTG 5210-2018; Highway Performance Assessment Standards. Issued 2018-12-25, Effective 2019-05-01. China Communications Press: Beijing, China, 2018.
  14. Qureshi, W.S.; Hassan, S.I.; McKeever, S.; Power, D.; Mulry, B.; Feighan, K.; O’Sullivan, D. An Exploration of Recent Intelligent Image Analysis Techniques for Visual Pavement Surface Condition Assessment. Sensors 2022, 22, 9019. [Google Scholar] [CrossRef] [PubMed]
  15. Marcelino, P.; De Lurdes Antunes, M.; Fortunato, E.; Gomes, M.C. Machine Learning Approach for Pavement Performance Prediction. Int. J. Pavement Eng. 2021, 22, 341–354. [Google Scholar] [CrossRef]
  16. Sandamal, K.; Shashiprabha, S.; Muttil, N.; Rathnayake, U. Pavement Roughness Prediction Using Explainable and Supervised Machine Learning Technique for Long-Term Performance. Sustainability 2023, 15, 9617. [Google Scholar] [CrossRef]
  17. Mers, M.; Yang, Z.; Hsieh, Y.-A.; Tsai, Y. Recurrent Neural Networks for Pavement Performance Forecasting: Review and Model Performance Comparison. Transp. Res. Rec. J. Transp. Res. Board 2023, 2677, 610–624. [Google Scholar] [CrossRef]
  18. Choi, S.; Do, M. Development of the Road Pavement Deterioration Model Based on the Deep Learning Method. Electronics 2019, 9, 3. [Google Scholar] [CrossRef]
  19. Song, Y.; Wang, Y.D.; Hu, X.; Liu, J. An Efficient and Explainable Ensemble Learning Model for Asphalt Pavement Condition Prediction Based on LTPP Dataset. IEEE Trans. Intell. Transport. Syst. 2022, 23, 22084–22093. [Google Scholar] [CrossRef]
  20. Baykal, T.; Ergezer, F.; Eriskin, E.; Terzi, S. Using Ensemble Machine Learning to Estimate International Roughness Index of Asphalt Pavements. Iran. J. Sci. Technol. Trans. Civ. Eng. 2024, 48, 2773–2784. [Google Scholar] [CrossRef]
  21. Liu, J.; Liu, F.; Gong, H.; Fanijo, E.O.; Wang, L. Improving Asphalt Mix Design by Predicting Alligator Cracking and Longitudinal Cracking Based on Machine Learning and Dimensionality Reduction Techniques. Constr. Build. Mater. 2022, 354, 129162. [Google Scholar] [CrossRef]
  22. Xue, K.; Wang, J.; Chen, Y.; Wang, H. Improved BP Neural Network Algorithm for Predicting Structural Parameters of Mirrors. Electronics 2024, 13, 2789. [Google Scholar] [CrossRef]
  23. Mulumba, D.M.; Liu, J.; Hao, J.; Zheng, Y.; Liu, H. Application of an Optimized PSO-BP Neural Network to the Assessment and Prediction of Underground Coal Mine Safety Risk Factors. Appl. Sci. 2023, 13, 5317. [Google Scholar] [CrossRef]
  24. Wang, Y.; Ge, Q.; Lu, W.; Yan, X. Well-Logging Constrained Seismic Inversion Based on Closed-Loop Convolutional Neural Network. IEEE Trans. Geosci. Remote Sens. 2020, 58, 5564–5574. [Google Scholar] [CrossRef]
  25. Hassanat, A.B.; Alqaralleh, M.K.; Tarawneh, A.S.; Almohammadi, K.; Alamri, M.; Alzahrani, A.; Altarawneh, G.A.; Alhalaseh, R. A Novel Outlier-Robust Accuracy Measure for Machine Learning Regression Using a Non-Convex Distance Metric. Mathematics 2024, 12, 3623. [Google Scholar] [CrossRef]
  26. Miettinen, O. Protostellar Classification Using Supervised Machine Learning Algorithms. Astrophys. Space Sci. 2018, 363, 197. [Google Scholar] [CrossRef]
Figure 1. Breakdown of the workflow.
Infrastructures 10 00189 g001
Figure 2. Influencing factors.
Infrastructures 10 00189 g002
Figure 3. Pavement indicator box chart.
Infrastructures 10 00189 g003
Figure 4. Heat map of influencing factors.
Infrastructures 10 00189 g004
Figure 5. Results of Principal Component Analysis of PQI.
Infrastructures 10 00189 g005
Figure 6. Results of Principal Component Analysis of PCI.
Infrastructures 10 00189 g006
Figure 7. Results of Principal Component Analysis of RQI.
Infrastructures 10 00189 g007
Figure 8. Results of Principal Component Analysis of RDI.
Infrastructures 10 00189 g008
Figure 9. Ranking of the importance of factors.
Infrastructures 10 00189 g009
Figure 10. BP model prediction result.
Infrastructures 10 00189 g010
Figure 11. PSO-BP model prediction result.
Infrastructures 10 00189 g011
Figure 12. Random Forest model prediction result.
Infrastructures 10 00189 g012
Figure 13. CNN model prediction result.
Infrastructures 10 00189 g013
Table 1. Comparison of machine learning methods.
ModelArchitecture/ParametersOptimization Method
BP Neural Network
-
Layers: input (15 nodes) → hidden 1 (64, ReLU) → hidden 2 (32, ReLU) → output (linear)
Adam optimizer (learning rate = 0.001)
-
Loss: mean squared error (MSE)
Batch size: 32
PSO-BP
-
BP architecture
Particle Swarm Optimization:
-
PSO parameters: 50 particles, 100 iterations, cognitive/social weights = 1.5
global best-guided velocity update
Random Forest
-
Number of trees: 100
Gini impurity criterion
-
Max depth: 10; min samples per leaf: 5
Bootstrap sampling
Convolutional Neural Network
-
Iteration
-
RMSE/LOSS
Iteration > 500
Table 2. Feature factors for pavement performance prediction.
Factor CategorySpecific FactorsUnit
IntrinsicPavement structure type-
Base course thicknessmm
Asphalt binder type-
Aggregate gradation%
ExtrinsicRoad ageyears
Cumulative traffic volume (ESALs)million
Average annual temperature°C
Annual rainfallmm
Width of roadbedm
Width of pavementm
Overlying thicknessmm
Last maintenance yearyear
Maintenance method-
Table 3. Indicators for pavement evaluation.
Index NameAbbr.Measurement IndexMeanStd DevMinFormulaDescription
Pavement Quality IndexPQIDR, IRI, RD90.823.8344.57 PQI = w pci PCI + w pqi RQI + w rdi RDI Comprehensive performance
Pavement Condition IndexPCIDR83.419.1624.66 PCI = 100 a DR b Road damage degree
Riding Quality IndexRQIIRI93.913.2611.30 RQI = e α IRI Surface roughness
Rutting Depth IndexRDIRD92.109.600.00 RDI = 100 β RD Rutting depth
Table 4. Highly correlated factors.
Factor 1Factor 2Correlation Coefficient
Road ageSection number0.99
Width of roadbedSection number0.99
Width of pavementSection number0.87
Width of pavementWidth of roadbed0.93
Overlying thicknessWidth of pavement0.80
Table 5. Method Comparison.
MODELR2MAEMBE
Training DatasetTesting DatasetTraining DatasetTesting DatasetTraining DatasetTesting Dataset
PCIBP0.740920.834470.0740.074−0.0050.016
PSO-BP0.952410.977081.4571.739−1.73970.2597
Random Forest0.740920.826030.3360.4190.00680.317
Convolutional Neural Network0.993530.914361.23131.84220.08490.5711
RQIBP0.954410.916540.5580.546−0.478−0.467
PSO-BP0.97870.953840.898761.3392−0.165710.56496
Random Forest0.900250.909362.45222.8408−0.030240.49321
Convolutional Neural Network0.994430.861640.4311.89−0.00010.4298
RDIBP0.984330.940660.0190.0020.029−0.003
PSO-BP0.97470.943840.898761.3392−0.165710.56496
Random Forest0.896480.780992.05452.76840.0399430.97489
Convolutional Neural Network0.995450.924911.21072.8265−0.451.59
Disclaimer/Publisher’s Note: The statements, opinions and data contained in all publications are solely those of the individual author(s) and contributor(s) and not of MDPI and/or the editor(s). MDPI and/or the editor(s) disclaim responsibility for any injury to people or property resulting from any ideas, methods, instructions or products referred to in the content.

