1. Introduction
In recent years, with the rapid development of bridge construction in China, the application of digital technology in this field has been continuously deepened [
1]. However, quality supervision in bridge engineering still mainly relies on 2D drawings and manual measurement, with relatively lagging technical means. At present, for the convenience of on-site operation by staff, traditional tools such as tape measures are commonly used for dimensional acceptance at construction sites. Nevertheless, traditional tape measure measurement is affected by multiple factors such as material deformation, temperature changes, and manual operation, which is prone to large errors. For example, metal tape measures are prone to thermal expansion and contraction at high temperatures, uneven tension, the limitation of only measuring component end faces, or non-straight measurement paths, which may also affect accuracy. Errors are likely to accumulate, especially in complex structures or large-scale scenarios.
Due to their special composite structure, higher cost-effectiveness, and lighter installation weight, CFST arch bridges have seen significant construction in China despite fierce competition in bridge engineering. Incomplete statistics show that nearly 500 CFST arch bridges have been built over the last three decades, with nearly 100 constructed in the past four years alone, mainly used in long-span bridge projects such as river crossings and mountainous canyon crossings [
2]. This demonstrates the extremely wide application of CFST bridges in China. However, the structures of CFST arch bridges are typically formed by rolling and welding thick steel plates into cylindrical tubes, characterized by a large wall thickness, large cross-sectional dimensions, and weights often exceeding dozens of tons. During construction, formwork deformation can cause surface geometric deviations. Taking the CFST arch bridge in this project as an example, relying solely on traditional tools such as tape measures can lead to only collecting the edge information of components, making it difficult to fully reflect their true geometric morphology and thus affecting the accuracy of quality evaluation. Therefore, introducing efficient and precise intelligent inspection technologies has become an urgent task to improve the level of quality supervision [
3,
4,
5].
At present, 3D laser scanning technology [
6,
7,
8], with its high efficiency, high precision, and multi-parameter detection capabilities, is widely applied in practical engineering, such as in deformation monitoring [
9] and 3D reconstruction [
10]. Compared with the current LiDAR SLAM digital measurement technology with centimeter-level accuracy, the accuracy of 3D laser scanning technology can reach sub-millimeter levels [
11], meeting the measurement accuracy requirements of this bridge engineering project. Using 3D laser scanning technology, we were able to accurately evaluate the geometric deviations of components, making up for the shortcomings of traditional tape measure measurements in the structural inspection of this CFST arch bridge. This not only improves the accuracy and efficiency of acceptance work but also provides reliable technical support for construction quality control in CFST arch bridges, with broad engineering application prospects. However, when applying 3D laser scanning technology in the measurement of CFST arch bridges, there are obvious problems to be solved in geometric parameter fitting. Specifically, when using traditional methods to fit point clouds, the fitting is affected by sparse or uneven massive point clouds, and these points are treated as outliers for elimination, which reduces the measurement accuracy.
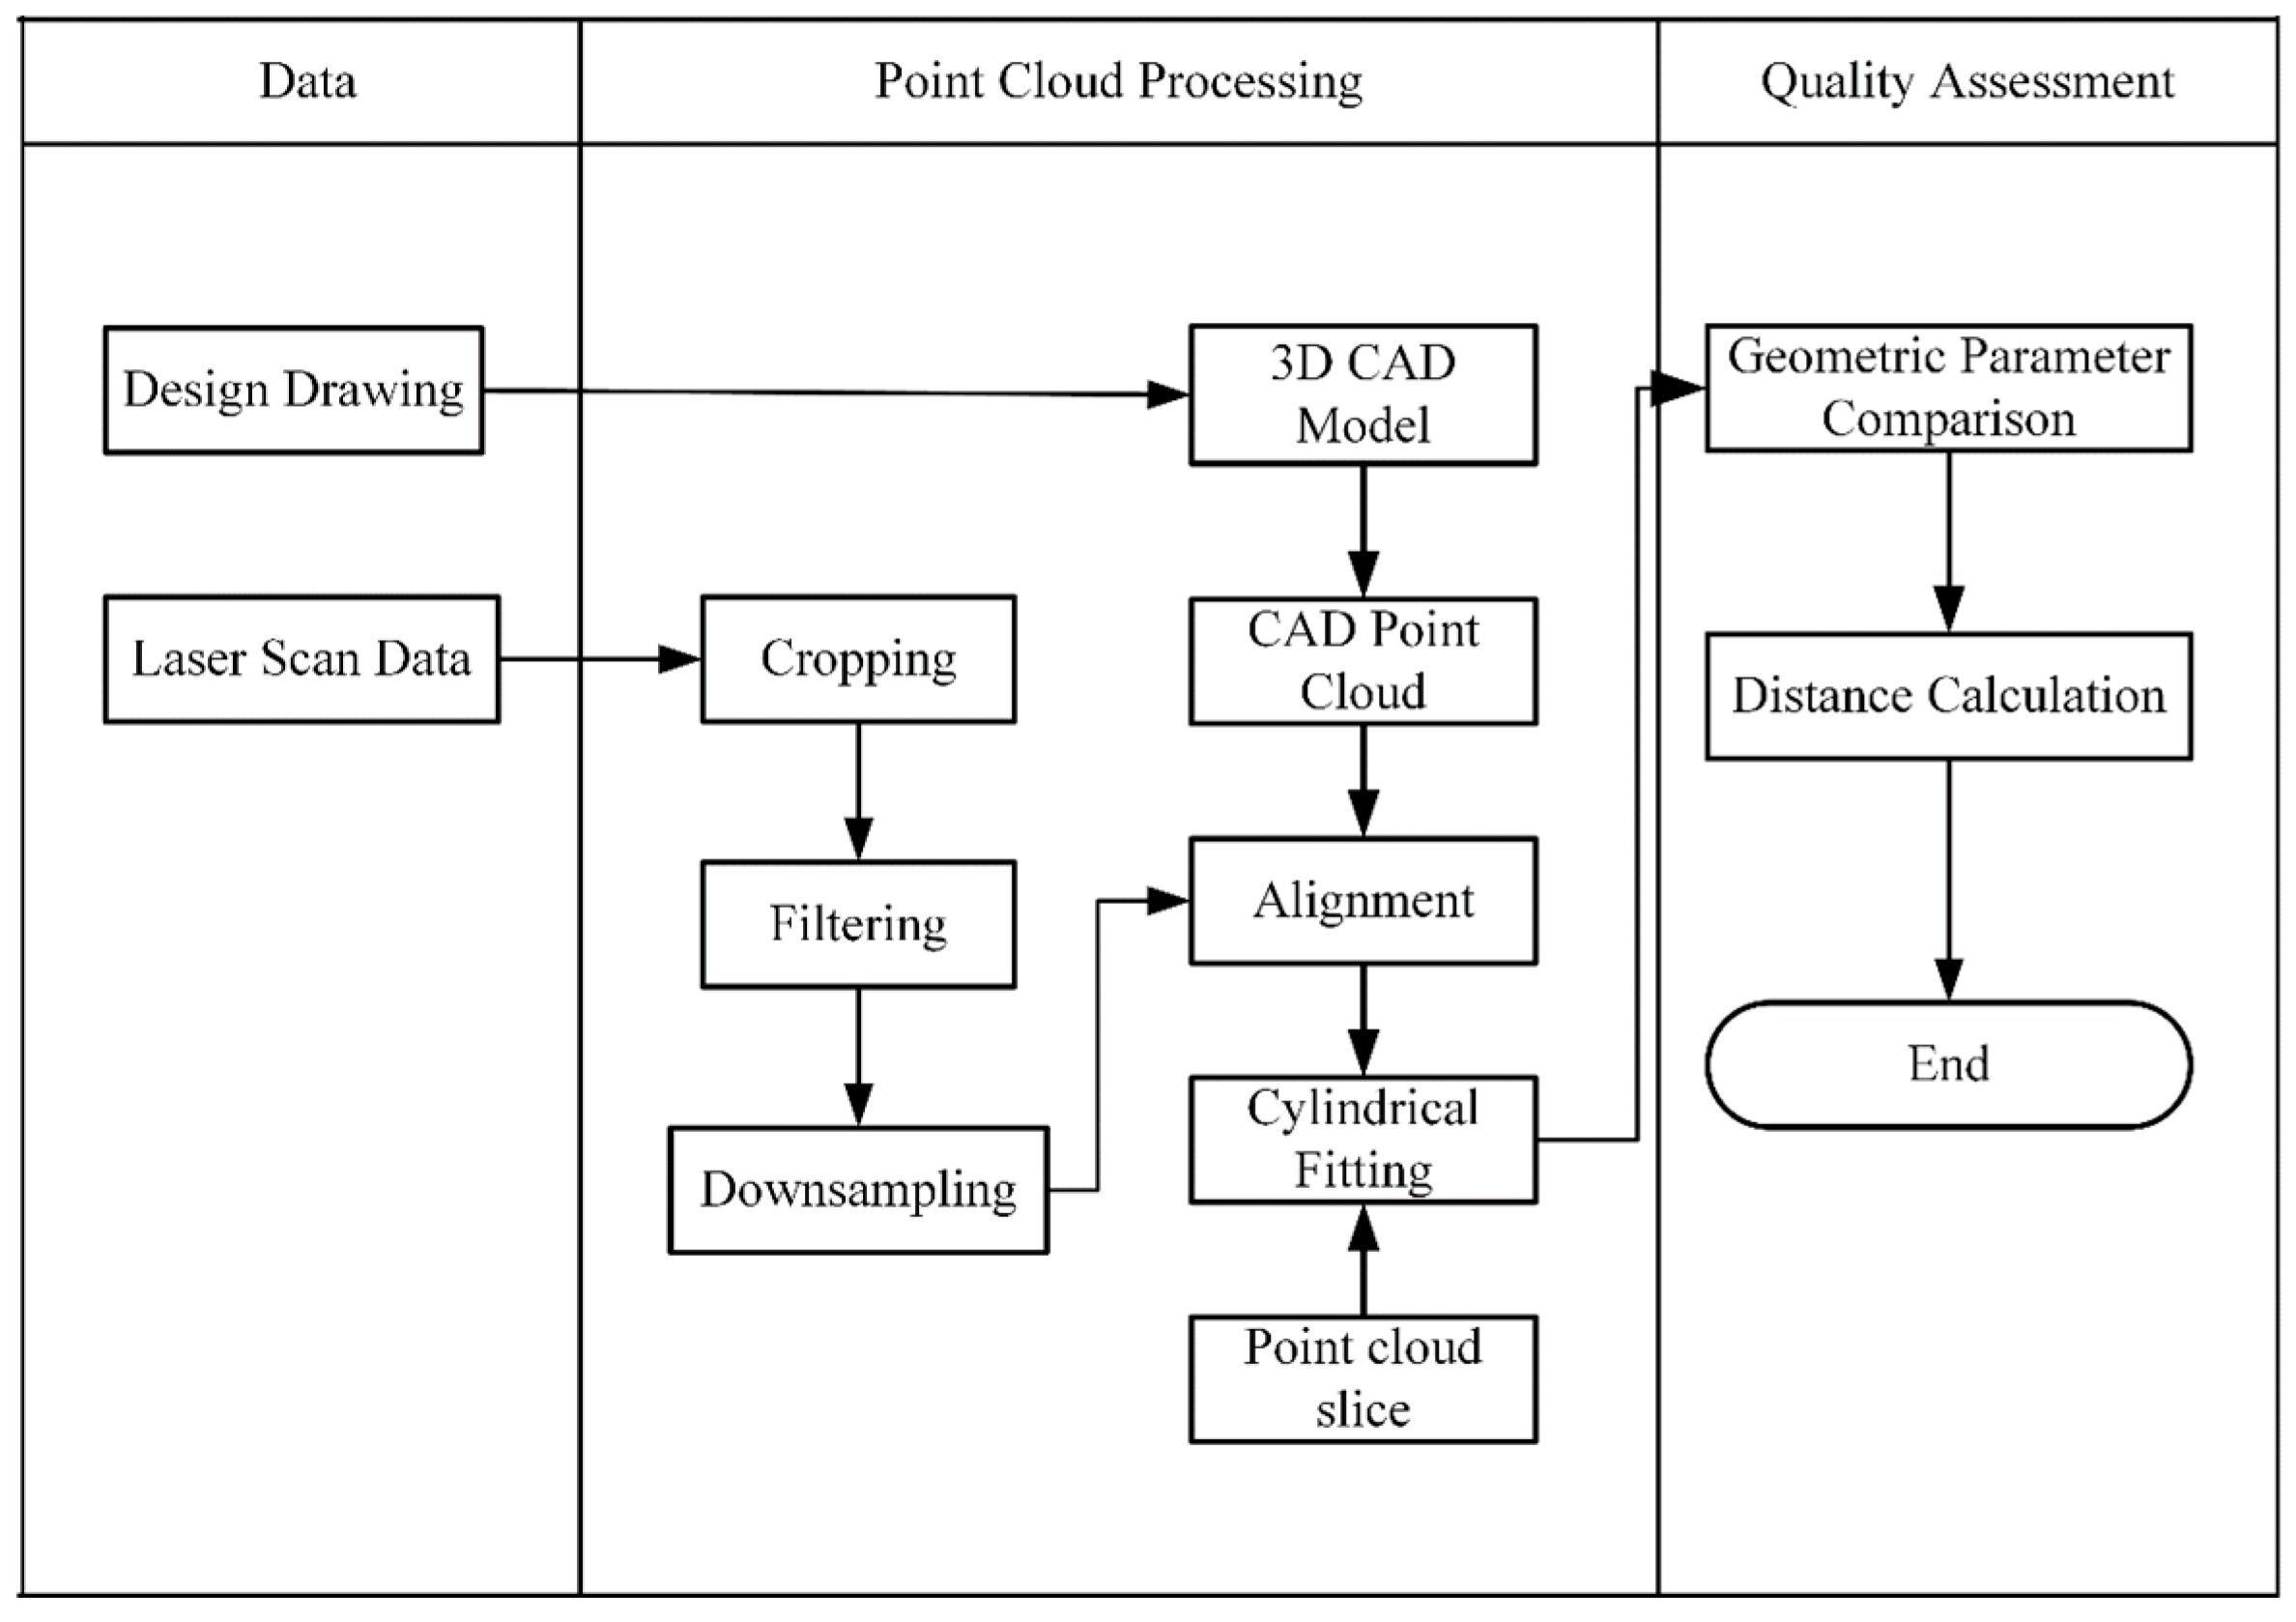
Therefore, this study proposes a digital measurement method for the main arch ribs of CFST arch bridges based on laser point clouds. The overall process consists of five steps, point cloud acquisition, data preprocessing, model registration, geometric parameter extraction, and quality evaluation, as shown in
Figure 1. First, the actual point cloud data of the main arch ribs are collected through 3D laser scanning technology, and the corresponding CAD point cloud is generated using a CAD model. The actual point cloud is then preprocessed and precisely registered with the CAD point cloud. Second, when performing cylindrical fitting on components to extract geometric parameters, the measurement point cloud is segmented by axial slicing to overcome the noise interference caused by massive unevenly distributed point cloud data, which effectively improves the accuracy of component radius estimation and the overall geometric reconstruction effect. Finally, key geometric parameters of the components and point-to-distance data are extracted to achieve the quantitative evaluation of their dimensional deviations.
To verify the accuracy of the proposed method, the detection results were compared and analyzed with manual measurement data. The results show that the method has significant advantages in terms of accuracy and stability. The unique contributions of this paper are as follows: (1) A digital measurement method for the main arch ribs of CFST arch bridges based on 3D laser scanning technology is proposed. While ensuring the required measurement accuracy, the 3D laser scanning technology can address the measurement issues encountered in traditional methods, improve measurement efficiency, and reduce costs. (2) A point cloud slicing processing method utilizing the geometric characteristics of the main arch rib components of CFST arch bridges is proposed.
The structural overview of this paper is as follows:
Section 2 introduces the relevant research background.
Section 3 presents the framework of the point cloud digital measurement method.
Section 4 presents the practical engineering application and verification.
Section 5 evaluates the dimensional quality results of the components. Finally,
Section 6 summarizes the full text, analyzes the limitations, and proposes future research directions.
2. Research Background
In this section,
Section 2.1 introduces the application of 3D laser scanning technology in bridge engineering. Next,
Section 2.2 provides a literature review of point cloud processing. Finally,
Section 2.3 presents the application of cylindrical fitting in point clouds.
2.1. The Application of 3D Laser Scanning Technology in Bridge Engineering
Shang et al. [
12] proposed a method for measuring the geometric shape of concrete arch bridge structures based on 3D laser scanning technology. A deep learning segmentation method using image–point cloud feature matching was employed to automatically extract bridge components from reconstructed point clouds, enabling the rapid geometric measurement of structural units to achieve the 3D geometric inspection and evaluation of arch deformation and lateral inclination in arch bridges. Jian et al. [
13] proposed fusing TLS point clouds with UAV aerial point clouds to create 3D models of CFST arch bridges for inspecting the condition of piers, arch ribs, and other components. Sun et al. [
14] developed an intelligent construction monitoring method for large complex steel structures such as bridges, converting BIM into mesh and point cloud models and comparing as-built point clouds obtained by 3D laser scanning with BIM design data to analyze distance deviations for monitoring construction processes and quality. Chang [
15] proposed an automatic flatness evaluation method for precast concrete beams based on TLS, which intuitively evaluates flatness quality and measures the manufacturing quality and structural performance of precast components through axis calibration, target surface segmentation, and flatness deviation calculation. Yin et al. [
16] presented a framework for virtual pre-assembly performed among point clouds, BIM, and finite element methods, aiming to accurately predict manufacturing deviations and structural stress states in concrete-filled steel tube arch bridges after forced assembly. Zhang et al. [
17] proposed a method for measuring the geometric dimensions and defects of T-shaped bridge structures based on 3D laser scanning technology, acquiring the geometric information of cross-sectional profiles to provide data support for subsequent finite element simulation and structural inspection experiments. Guo et al. [
18] fused UAV images with 3D laser point clouds, calculated spatial transformation parameters through feature global registration and bundle adjustment models and monitored bridge component deformation using a spherical node multi-rod center point algorithm. Guo et al. [
19] proposed a pipeline geometric parameter control method based on 3D laser scanning and digital models, which can accurately extract component surfaces or cross-sections through point cloud data processing to achieve effective geometric quality control. Xia et al. [
20] proposed a combined method based on local descriptors and machine learning for automatically detecting bridge structural components from point clouds to monitor the health status of existing bridges.
However, while the abovementioned TLS has been widely applied in the deformation monitoring, geometric dimension measurement, defect detection, and construction monitoring of bridges, there remains a research gap in its application in shape and dimension measurements for the main arch ribs of CFST arch bridges. Most researchers have primarily focused on the surface deviation analysis of bridge components, neglecting the measurement and verification of the main radius parameters of CFST arch bridge main arch ribs. Additionally, in practical project investigations, we have not found reports on the application of three-dimensional laser scan point cloud technology for the digital dimension measurement of a large number of steel tube bridge prefabricated components. Therefore, we aim to propose a method for evaluating the surface and shape dimensions of numerous steel tube bridge prefabricated components to overcome issues such as low measurement efficiency, high costs, and insufficient fitting accuracy in practical engineering, where the measurement accuracy of components still faces certain challenges.
2.2. Point Cloud Processing
As a key part of the measurement of the main arch ribs of CFST arch bridges, point cloud processing technology mainly includes steps such as point cloud downsampling, registration, and slicing, which can improve the efficiency and accuracy of subsequent geometric fitting and model registration.
Although point clouds are a common representation of 3D data, they may contain noise interference, so filtering is required before processing. Jin et al. [
21] proposed a denoising method combining statistical filtering and bilateral filtering, which could effectively remove outliers in laser point clouds. Zhao et al. [
22] used an irregular triangular network progressive encryption filtering algorithm to process point clouds fusing single and last echoes, preserving more information on topographic detail. Li et al. [
23] combined voxel filtering with radius filtering to construct large-scale and small-scale models for adaptive processing, and experiments showed a good suppression of drift noise. Wen et al. [
24] studied point cloud data denoising in autonomous driving scenarios through bilateral filtering, providing useful references for other application fields. Ren et al. [
25] used Gaussian filtering to process signal intensity values and introduced the DBSCAN algorithm to remove noise points and boundary points. Chen et al. [
26] proposed a multidimensional statistic denoising algorithm based on Gaussian mixture models, which can utilize multiple point cloud statistics simultaneously and avoid the manual selection of denoising thresholds.
Point cloud downsampling is a core step in the point cloud processing pipeline, which can effectively reduce the data volume, lower the computational complexity, and improve the overall processing speed. Although deep learning-based downsampling methods are still in their infancy, some studies have preliminarily verified their effectiveness. Yu et al. [
27] proposed the SIEV-Net network, introducing a height information compensation module to reduce information loss during feature aggregation in voxel networks. Wang et al. [
28] constructed the SVGA-Net sparse voxel attention network, combining a voxel graph module with a sparse density regression module to achieve efficient 3D detection using LiDAR data. Fu et al. [
29] proposed VoxelContext-Net for compressing static and dynamic point clouds. Nguyen et al. [
30] developed a point cloud geometric downsampling method based on masked convolutional neural networks, learning voxel probability distributions to achieve the sparse representations of static point clouds. Zhou et al. [
31] adopted a K-means-based clustering strategy, dividing majority-class samples into clusters with sizes comparable to minority-class samples and selecting cluster centers as new sampling points. Xiao et al. [
32] proposed a downsampling strategy based on hierarchical voxel segmentation, achieving the balanced compression of point cloud data by increasing voxel division layers. In summary, point cloud downsampling methods cover multiple approaches such as deep learning, clustering, and voxel strategies. Considering the relatively regular geometric morphology of the experimental data, it is more appropriate to prioritize simple-to-operate voxel downsampling.
Point cloud registration plays a central role in the 3D point cloud processing framework, aiming to determine a rigid spatial transformation that aligns datasets captured from different viewpoints of the same object [
33,
34,
35,
36]. Common registration algorithms include Random Sample Consensus (RANSAC), Signature of Histograms of Orientations (SHOT), Iterative Closest Point (ICP), and their variants. Segal et al. [
37] proposed the Generalized ICP algorithm, which incorporates a probabilistic model into error metrics and combines point-to-point and plane-to-plane strategies to enhance registration accuracy and robustness while reducing iteration counts. Yang et al. [
38] introduced the Globally Optimal ICP (Go-ICP) algorithm, which achieves global optimality in registration through a branch-and-bound strategy, avoiding local minima and improving the convergence reliability.
2.3. The Application of Cylindrical Fitting in Point Clouds
To efficiently detect cylindrical structures using point clouds, researchers have proposed a variety of cylinder detection methods over the past decades [
39,
40]. Among them, the Random Sample Consensus (RANSAC) algorithm is a widely used model fitting approach. Its core principle lies in randomly sampling a minimal subset of data points to fit a geometric model [
41,
42]. Chaperon et al. [
43] combined Gaussian sphere representation with the RANSAC method to detect cylinders within point clouds and estimate their parameters. Their method divides cylinder extraction into two stages: first, a plane is estimated on the Gaussian image to infer the orientation of the cylinder; then, random sampling is applied to estimate the scale and position of the structure. Tran et al. [
44] incorporated a validation step within the RANSAC framework to enable the simultaneous extraction of multiple cylindrical elements. Liu et al. [
45] projected the point cloud onto a 2D plane and identified circular contours on the projection to detect cylindrical shapes. Araújo et al. [
46] projected the point cloud onto a unit hemisphere from multiple directions, detecting circular projections to extract cylindrical structures. Maalek et al. [
47] simplified the extraction of pipe-like structures by identifying circular contours on a 2D plane. Ahmed et al. [
48] proposed a method combining the sliced resampling of the point cloud with the Hough Transform for circle detection, demonstrating its feasibility and effectiveness in detecting cylinders within 3D point clouds.
3. Research Method
3.1. Acquisition of Scan Point Cloud Data
The scan point cloud data was acquired using 3D laser scanning in a steel structure prefabrication yard. To ensure accuracy and stability in data collection, the research team conducted multiple rounds of precision comparison experiments on the components of CFST arch bridges before undertaking the official data acquisition. These experiments mainly focused on different scanning devices, scanning parameters, and acquisition environments. Through comparative analysis, optimal equipment configurations and parameter settings were finally selected to minimize errors in measurement results caused by environmental factors.
Considering the potential reflection interference on the CFST surface during laser scanning, the component surfaces were meticulously cleaned in advance to ensure that no impurities or oil stains were present. Additionally, as the materials used for the main arch ribs of CFST arch bridges are highly sensitive to environmental temperature changes, especially during the day, when solar radiation and temperature differences can easily cause minor component deformations that affect the accuracy of point cloud data, the formal scanning operations were scheduled for nighttime, specifically from 00:00 to 04:00. During this period, the environmental temperature remained relatively stable, with fluctuations controlled within ±1 °C, effectively avoiding error interference caused by temperature changes and ensuring high precision and repeatability in the scan data.
3.2. Acquisition of CAD Point Cloud Data
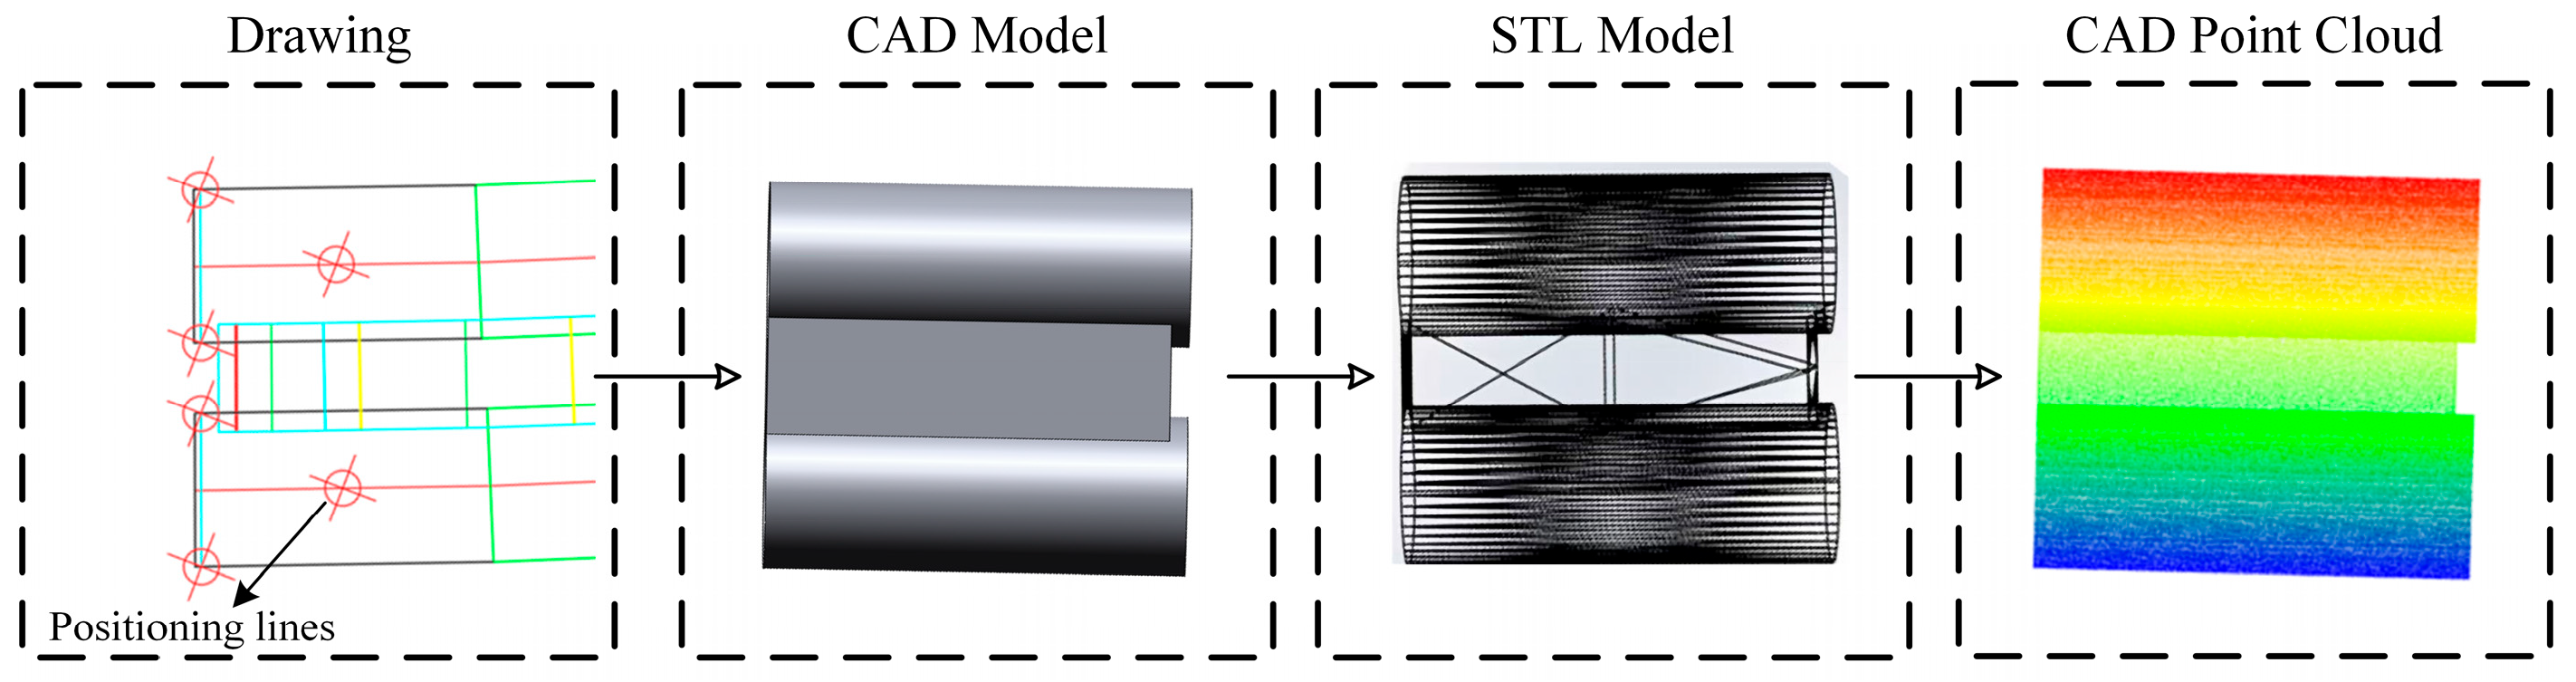
According to the design drawings of the main arch rib, its 3D geometric model is first constructed in SolidWorks 2019 to accurately restore the structural shape and geometric features, serving as the basis for subsequent point cloud generation and registration. After modeling, the model is meshed and exported in STL format for subsequent processing. Then, the STL model is discretized using PCL (Point Cloud Library) to convert the continuous geometric surface into point cloud data with spatial distribution characteristics. By adjusting the sampling density and distribution strategy, we ensure that the generated point cloud fully reflects the details of the original model in shape while having good visualization effects and geometric fidelity. Finally, the discretization result is exported in PLY format to form the “CAD point cloud” defined in this paper, which is used for registration and error analysis with the scan point cloud. The specific process is shown in
Figure 2.
3.3. Preprocessing
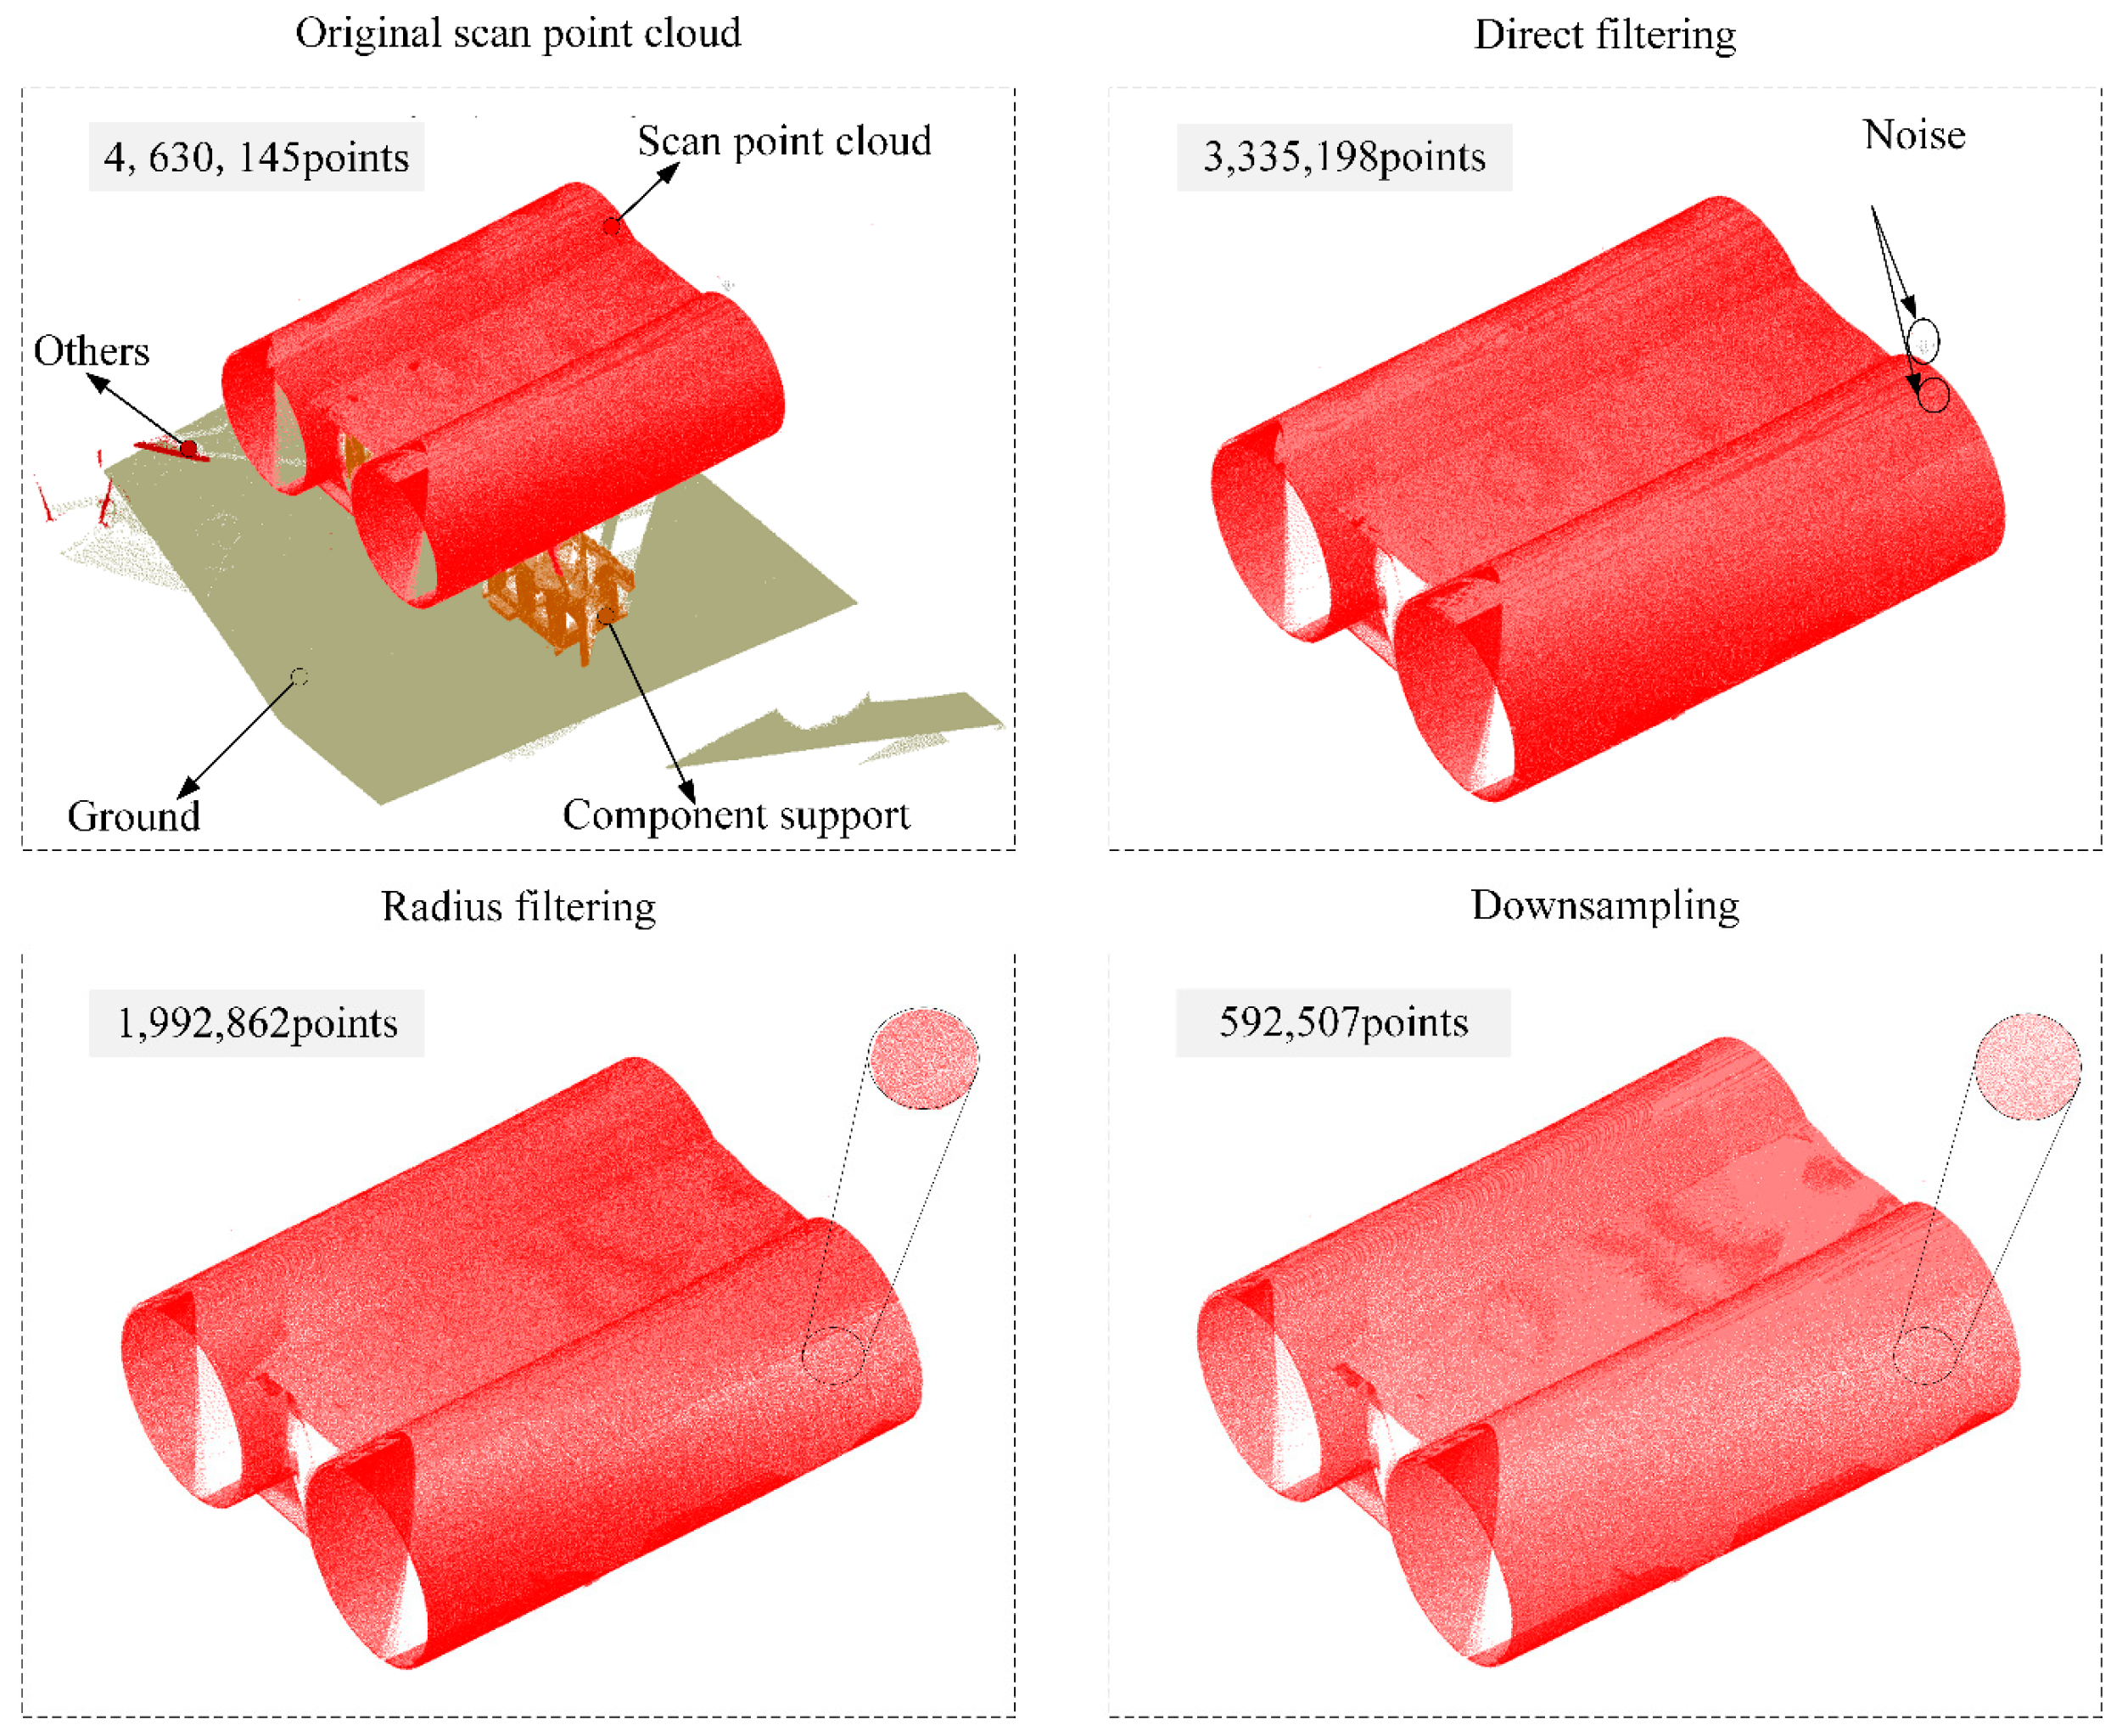
When 3D laser scanning equipment is used to collect the 3D point cloud data of the main arch rib steel tube component area, the original point cloud data typically has high density and rich spatial information but may also contain noise, voids, or areas irrelevant to the research objectives. Therefore, preprocessing operations on the originally collected point cloud data are required to reduce the data volume and computational costs. The preprocessing operations adopted in this paper mainly include steps such as data region clipping, denoising, and downsampling. Specifically, the direct filtering algorithm is first used to set the value range of the X, Y, and Z coordinates of the point cloud data of the main arch rib steel tube components, effectively removing irrelevant point cloud data such as the ground and sky outside the preset area. Then, the radius filtering algorithm is used to process each point by setting a radius threshold based on the number of neighborhood points within a specified radius to maintain the structural integrity of the component point cloud data.
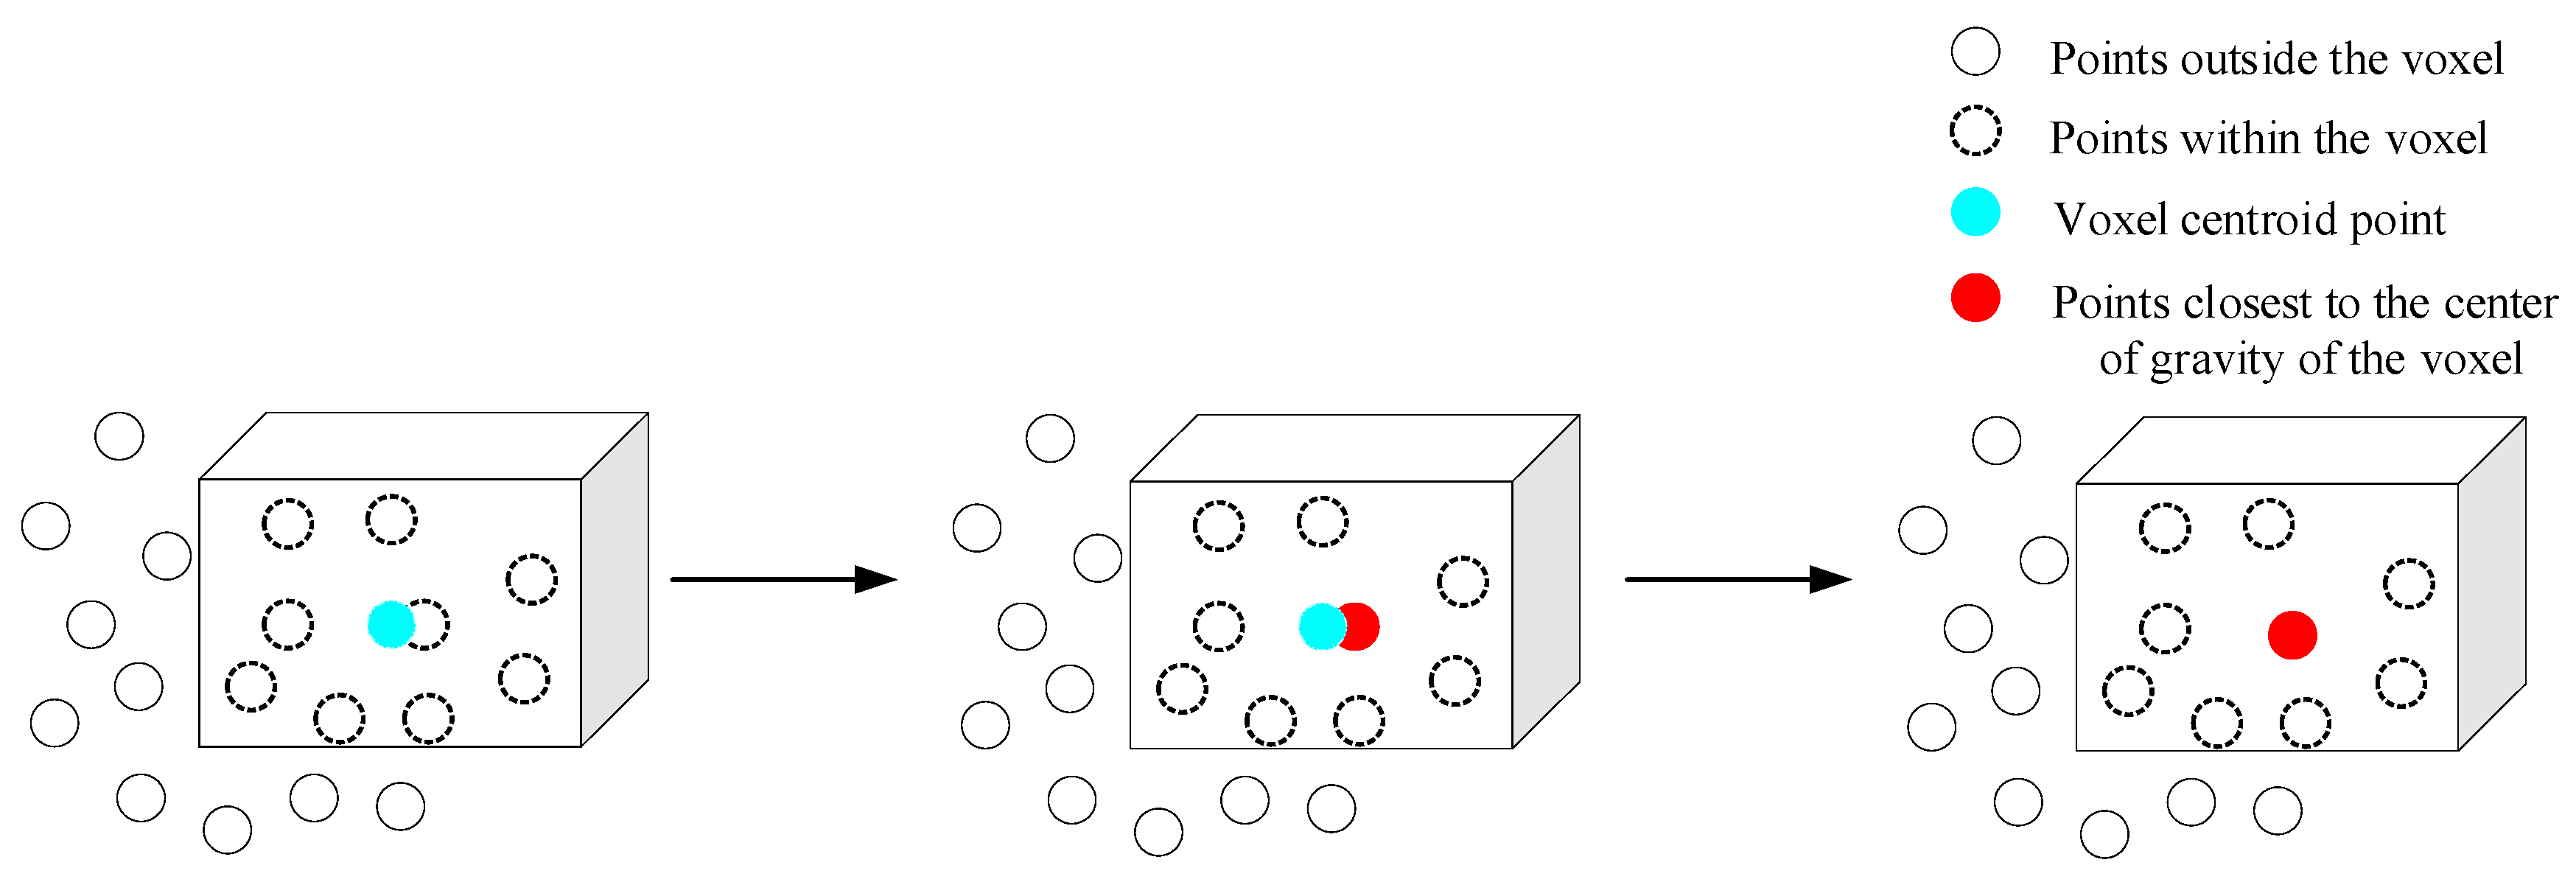
Traditional point cloud downsampling and simplification processes create a 3D voxel grid from input point cloud data, approximating other points in each voxel using the voxel’s center or centroid, with all points in the voxel ultimately represented by one centroid or central point. While this achieves downsampling, the centroid may not be a point from the original point cloud, potentially losing the fine features of the original point cloud. Therefore, this paper proposes a voxel filtering method based on centroid-nearest points. The method uses the KD-tree algorithm to replace the voxel centroid with the point closest to the centroid in the original point cloud for point cloud simplification, preserving the original surface features of the point cloud data. The schematic diagram is shown in
Figure 3.
3.4. Registration
Due to the different sources of the scanned point cloud data collected on-site and the CAD point cloud, the two are usually in different coordinate systems in space, and direct comparative analysis will cause large errors. Therefore, coordinate unification between the two groups of point clouds, i.e., point cloud registration, must be performed first. The registration process aims to accurately align the scanned point cloud with the CAD point cloud in 3D space through rigid transformations (including rotation and translation). To ensure accuracy and efficiency in registration, the registration process is divided into two stages, coarse registration and fine registration, and the overall process is shown in
Figure 4.
For the coarse registration stage, this paper employs the Fast Point Feature Histograms (FPFH) descriptor [
49] for feature matching. As an efficient local geometric feature description method, FPFH can extract the spatial structure information of key points in point clouds to assist in establishing preliminary correspondence between point clouds. To enhance the representativeness of feature points and the accuracy of initial registration values, the Internal Shape Signature (ISS) algorithm [
50] is further introduced to extract key points from the two groups of point clouds, respectively. The ISS algorithm has good stability and repeatability, which can effectively capture geometrically significant regions on component surfaces and enhance the robustness of feature matching.
After extracting key points and calculating the corresponding FPFH descriptors, the Sample Consensus Initial Alignment (SAC-IA) algorithm [
51] based on sampling consensus is used for coarse registration. This algorithm, inspired by the RANSAC principle, searches for the optimal rigid transformation among numerous candidate transformations to achieve the rough overlap of two point clouds with large distances and significant pose differences, providing a good initial condition for subsequent fine alignment.
In the fine registration stage, the Point-to-Plane Iterative Closest Point (ICP) algorithm [
52] optimized by the least squares method is used to further adjust the coarse registration results. Compared with the traditional point-to-point ICP algorithm, Point-to-Plane ICP pays more attention to the geometric relationship between points and their corresponding planes during registration, thus demonstrating higher registration accuracy and convergence speed in scenarios where components have obvious surface structures.
The entire registration pipeline adopts the Root Mean Square Error (RMSE) as the evaluation metric to quantify the alignment error between the two point clouds. When the RMSE falls below a predefined threshold and convergence criteria are satisfied, the optimal transformation matrix
(Equations (1) and (2)) is output, enabling high-precision alignment between the CAD point cloud and scan point cloud. This process establishes a solid data foundation for subsequent deviation analysis, component quality assessment, and precision control.
= the rotation matrix; = the three-dimensional translation vector.
3.5. Slicing
The main arch rib structure of CFST arch bridges is typically composed of multiple standard cylindrical segments sequentially spliced by straight-line substitution for curved welding, forming a continuous curved shape overall while exhibiting obvious cylindrical geometric features locally. If unified linear fitting is performed at the overall scale, the fitted curve is often too smooth to reflect the independent geometric characteristics of each cylindrical segment. Especially in the welded connection areas, structural mutation information is easily ignored, affecting the accurate evaluation of component local morphology, assembly errors, and manufacturing precision.
To address this issue, this paper proposes a point cloud slicing method based on the geometric structure characteristics of arch ribs, which uses a segmented processing strategy to perform a refined analysis of point cloud data for higher-precision parameter extraction and error analysis. The core idea is as follows: the point clouds of the main arch ribs are sliced and segmented along the axial direction of the components, the geometric features of each cylindrical segment are fitted segment by segment, and then local parameter features are extracted and welding position differences are identified. This effectively avoids the error accumulation caused by local distortion or noise in overall fitting, thereby improving the local sensitivity and overall adaptability of detection. The specific implementation is as follows:
First, the registered scan point cloud and CAD point cloud data are reduced dimensionally and projected parallel to the XOZ plane to obtain the two-dimensional geometric distribution characteristics of the point cloud on the plane.
The Alpha shape [
53] algorithm is used to extract the boundary point cloud of the abovementioned point cloud data, and the value of the radius of the rolling circle is determined by experimental comparison to extract the boundary line.
The fitting line is obtained using the least squares method by minimizing the perpendicular distances from the extracted boundary point cloud to the line, thereby optimizing the direction vector.
Based on the calculated straight-line data of the boundary point cloud on both sides of the bridge component, the average direction vector of the two lines is computed to reduce errors. Using this vector and its projection onto the XOZ plane, the normal vector of the plane is derived via cross-product calculation, thereby determining the orientation of the bridge component’s end cross-sections and allowing us to obtain the corresponding end cross-sections.
Based on the boundary point cloud and its average orientation, two planes (P1, P2) can be constructed, with the distance between P1 and P2 representing the thickness of the point cloud slice. By comparing the x-value fields, the point cloud data of each slice can be extracted, so as to achieve the slicing processing of the point cloud.
Finally, taking the
X-axis direction as an example, point cloud slicing is performed: slicing planes are uniformly generated along the
X-axis. The number of slices
, slice thickness
, and plane specifications
are as follows:
and represent the maximum and minimum values of the point cloud along the X-axis, denotes the slicing interval, is the floor function, and indicates the index of the point cloud slice.
3.6. Quality Assessment
3.6.1. Geometric Parameter Extraction
Aiming to elucidate the structural characteristics of multi-segment splicing and significant local distortion of CFST arch bridge main arch rib components, this paper proposes a segmented cylindrical fitting method based on point cloud slicing to overcome a problem seen in traditional overall fitting, i.e., that it tends to ignore local features. Specifically, combining the arch rib point cloud slicing method proposed in
Section 3.5, the RANSAC algorithm is used to fit the cylindrical model for local point clouds and extract key geometric parameters of each component segment, including the radius r, direction (dx, dy, dz), and axis position (x, y, z). RANSAC has strong robustness, which can stably extract data satisfying the model hypothesis from point clouds containing noise and outliers, effectively eliminate interference, and ensure fitting accuracy. The model parameters are gradually optimized through iterative sampling and consistency evaluation to obtain the optimal solution. This method is particularly suitable for the cylindrical CFST arch bridge components in this experiment, enabling each segment of point clouds to maintain geometric integrity in space while having higher local responsiveness, especially for structural segments with welds, bending, or elliptical deformation.
3.6.2. Dimensional Quality Assessment
After completing the spatial registration of the scan point cloud and CAD point cloud, this paper further conducts dimensional quality evaluation and analysis based on distance deviation and geometric parameters. First, the Mean Distance Deviation (MDE) index [
54] is used to quantitatively evaluate the geometric fitting accuracy of the overall component morphology by calculating the average Euclidean distance between corresponding point pairs after registration.
However, due to environmental noise, equipment blind spots, and changes in material reflectivity, scan point clouds often have missing data and errors, limiting the stability and accuracy of MDE in local area judgments. Therefore, relying solely on global deviation indices cannot fully reflect the geometric status of components.
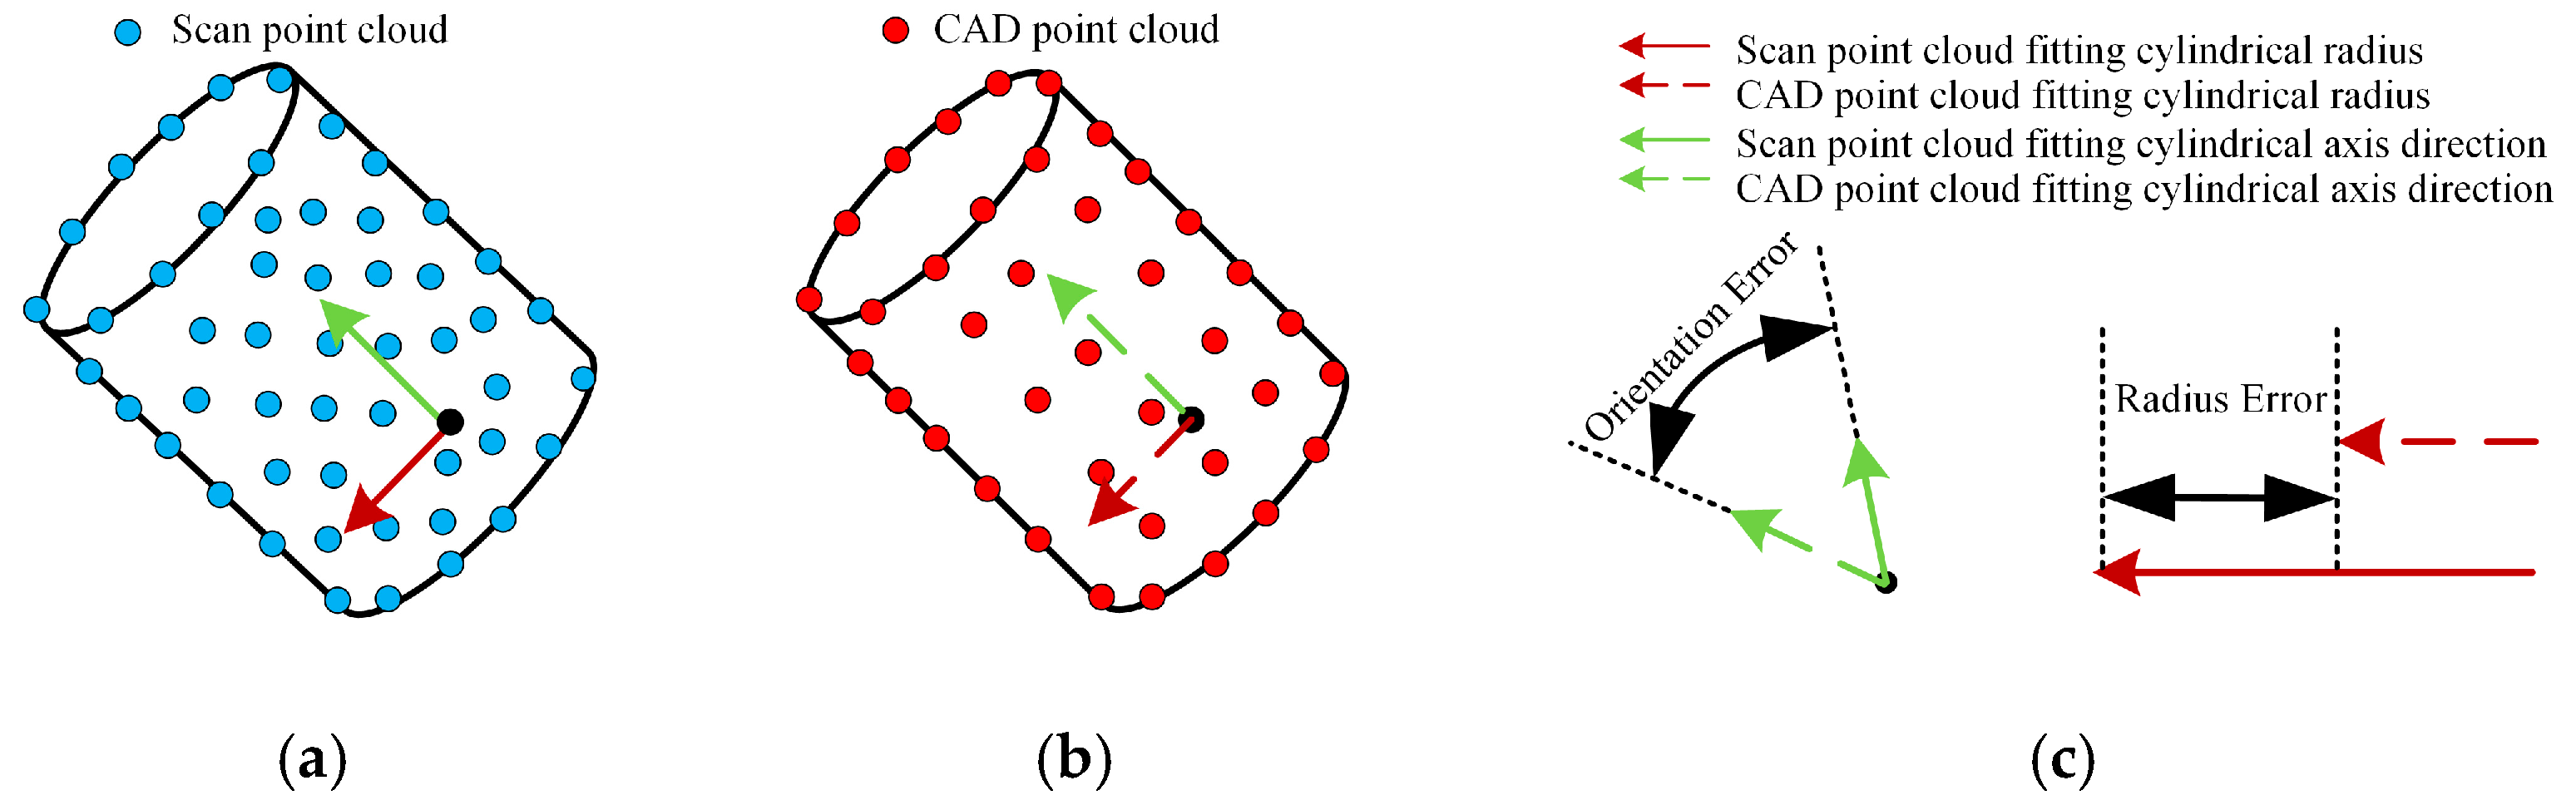
To improve the comprehensiveness of the evaluation, this paper introduces a geometric parameter comparison method combined with the structural characteristics of the main arch ribs to extract and analyze the axial direction and cross-sectional radius of key cylindrical segments. By extracting corresponding cylindrical parameters from the registered measured point cloud and CAD point cloud, a difference model between the axial direction vector and radius is constructed to evaluate the deviation performance of components in dimensional control and installation positioning.
Using a combination of global deviation and geometric parameter dual indices can effectively identify overall deviation trends and local deformation issues in components, providing data support for processing quality evaluation, error tracing, and construction precision control. The comparison results of component geometric parameters are shown in
Figure 5.
4. Results
4.1. Engineering Background
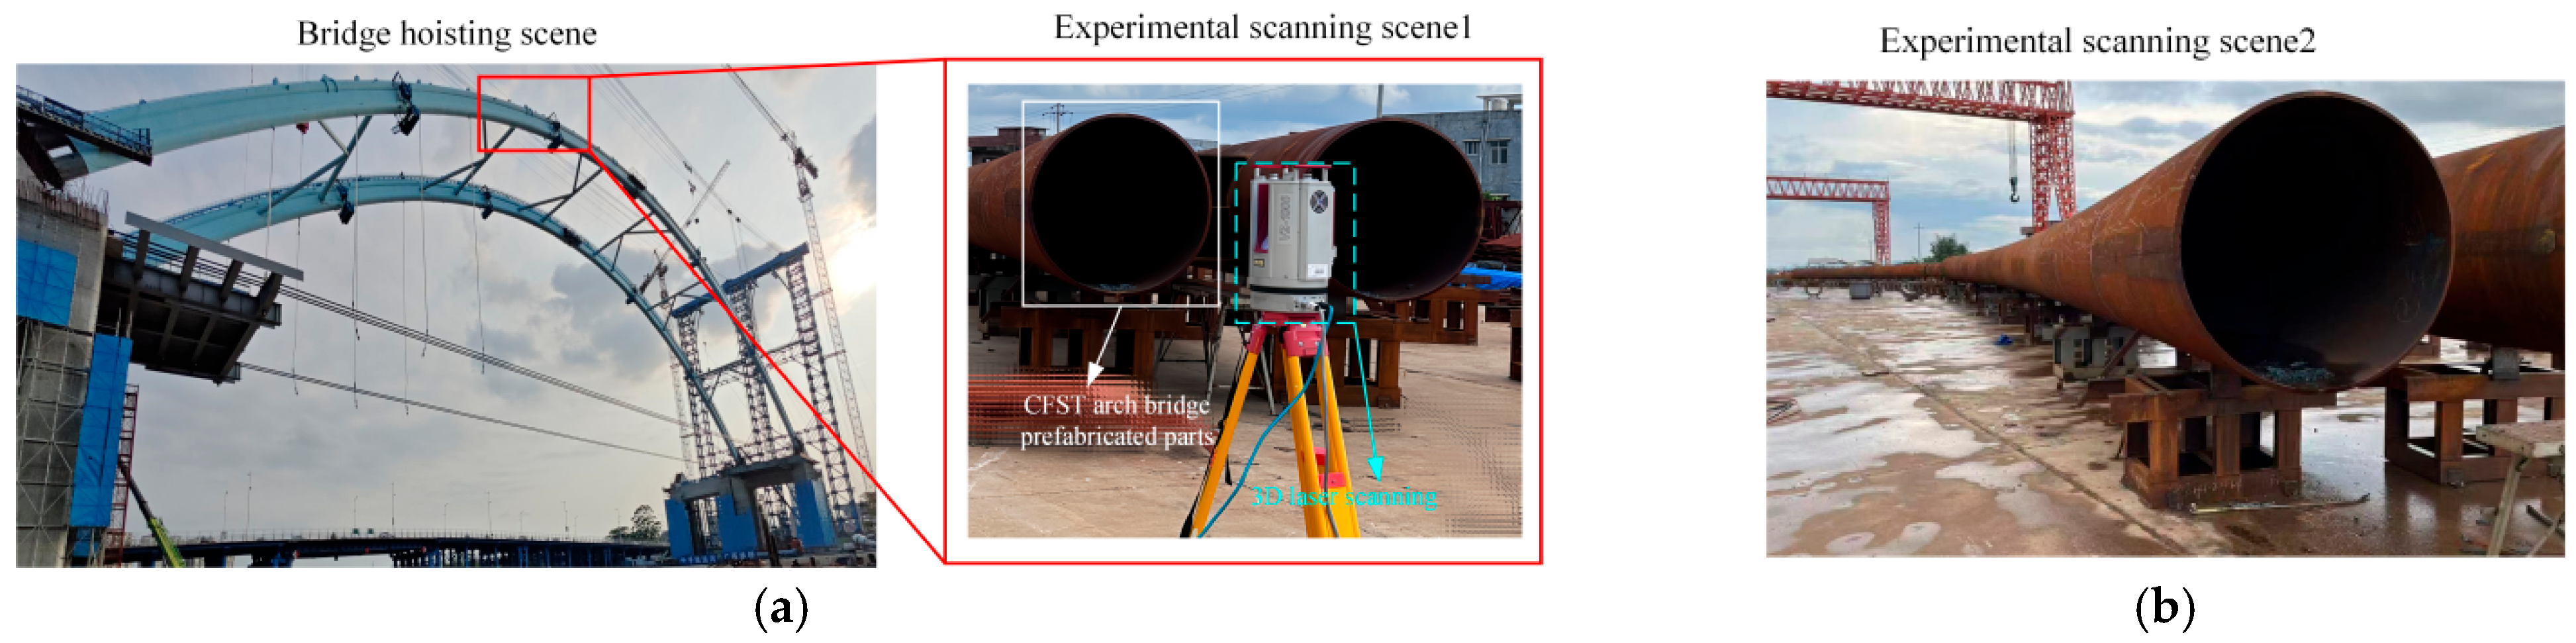
The experiment conducted in this study is based on prefabricated components from two CFST arch bridges with distinct structural configurations, both fabricated at a steel structure plant in Guangxi, China. These bridges were selected to improve the applicability of the proposed method and the reliability of the validation results, by reducing randomness and enhancing representativeness. As shown in
Figure 6a, Bridge 1 is a large-span CFST arch bridge with a designed span of 180 m. Each arch rib is divided into six segments, and each segment is welded from 28 cylindrical steel pipes with a diameter of 1300 mm, representing a typical structure with high segment density and large-scale assembly. In contrast,
Figure 6b shows Bridge 2, a medium-span arch bridge with a span of 112 m. Its arch ribs are divided into four segments, and each segment consists of 22 steel pipes with a diameter of 1200 mm, featuring a more compact and simplified configuration. The two bridges differ significantly in terms of segment quantity, pipe diameter, and welding techniques. Experimental verification was conducted under these varying engineering conditions, demonstrating the adaptability of the proposed method to different types of CFST arch rib components. The selection strategy enhances the engineering relevance of the validation process and provides a technical reference for the application of the method to similar bridge types in future projects.
4.2. Preprocessing
The experimental hardware environment includes an Intel(R) Core(TM) i7-9700 processor(Intel Corporation, Santa Clara, CA, USA), 16 GB of memory, and a 64-bit Windows 10 operating system. Point cloud data processing was completed on the Visual Studio 2022 platform, with data processing and algorithm implementation using PCL1.14.0. Three-dimensional modeling was performed using SOLIDWORKS 2019, while point cloud clipping and visualization relied on Cloud Compare 2.13 software to clearly display component geometries and assist in quality evaluation and data verification.
This experiment utilized a RIEGL VZ-1000 high-precision portable 3D laser scanner (RIEGL Laser Measurement Systems GmbH, Horn, Austria) was used in this study. The equipment was provided by the authors’ institution., which features high-frequency scanning capabilities at a speed of up to 1,000,000 points per second, a field of view of 360° × 100°, and a scanning accuracy of 1 mm/10 m. It can cover large-scale 3D spaces while ensuring the accurate capturing of detailed structures. Scanning parameters were flexibly adjusted according to component shapes and on-site environments to obtain high-quality point cloud data.
After the completion of the point cloud acquisition of the CFST arch rib components, Cyclo REGISTER 360 PLUS 2023.0.3 was employed to align and register the raw point cloud data collected from multiple scan stations, ensuring high-precision alignment with a registration accuracy controlled within 0.3 mm. The registered point cloud for Bridge 1 contained 45,097,601 points and required approximately 1 h for processing, while the dataset for Bridge 2 consisted of 38,764,258 points and was processed in about 40 min. These results demonstrate that the proposed point cloud processing workflow exhibits strong engineering adaptability and high operational efficiency, capable of handling high-density data from large-scale structural components in a time-effective manner. Following registration, Cloud Compare software was used to segment and export the processed point clouds, generating scan point cloud datasets for subsequent analysis. Given that the CFST arch rib components were fabricated by welding cylindrical steel tubes, and that Bridge 1 had completed trial lifting and was available for on-site validation, two segments from Bridge 1 were selected for experimental verification. As Bridge 2 was still under fabrication, one segment was selected for evaluation. The selected segments and corresponding processing results are illustrated in
Figure 7.
After the relevant preprocessing steps of the point cloud, the final experimental data were obtained. These data are sorted and listed in
Table 1. Taking one of the segments as an example, the processed point cloud data are visually displayed in
Figure 8 to intuitively understand the three-dimensional morphology and geometric characteristics of the actual components.
4.3. Registration
The main parameter settings of the ISS algorithm used in this experiment [
55] are shown in
Table 2.
The RMSE accuracies obtained from the registration of the two segments are 1.668 mm, 1.568 mm, and 1.897 mm in sequence.
Figure 9 shows the flow chart of the registration example for the first group of point cloud data, and the optimal transformation matrix
obtained is as follows:
4.4. Slicing
4.4.1. Boundary Extraction
The Alpha shape algorithm adopted in this paper performs boundary recognition on registered point cloud data, with its basic principle being as follows: setting a rolling circle (Rolling Ball) with a radius of α to roll on the 2D projection plane of the point cloud. When the circle slides between points, any point that can be externally contacted by the circle is considered a boundary point.
Considering that the main arch rib components have obvious regular geometric structures and complex local features, this paper conducted multiple groups of experiments on the rolling circle radius parameter. The boundary extraction effects of the three groups of point cloud data under different radius settings are shown in
Table 3.
The experimental results show that the selection of the rolling circle radius has a significant impact on the boundary point extraction effect. When the rolling circle radius is set to be too large, the algorithm tends to ignore local features at smaller scales during boundary point extraction, causing the extracted boundary lines to become overly smooth and the number of boundary points to decrease significantly, which fails to accurately reflect the true shape of the component contour. Conversely, when the rolling circle radius is set to be too small, although more details can be extracted, it is prone to misidentifying some non-boundary internal points as boundary points, leading to noise interference in the boundary extraction results and reducing the overall recognition accuracy.
Figure 10 analyzes the variation trends of boundary extraction effects under different parameter settings for the first group of point cloud data. By comprehensively considering the balance between the retention degree of boundary features and computational efficiency, the final determined parameters
can significantly improve the processing speed on the basis of ensuring contour recognition accuracy.
4.4.2. Slicing Results
The number of slices has a significant impact on the fitting accuracy of the main arch rib cylinder, which is particularly critical when using the RANSAC algorithm for parameter extraction. Considering that the designed radius of the main arch rib in this project is 650 mm and the dimensional inspection accuracy needs to be controlled at the millimeter level, the fitting radius should be accurate to two decimal places.
To determine the optimal slicing scheme, this paper comprehensively evaluates the fitting accuracy and computational efficiency under different segmentation methods. On one hand, the error between the fitted radius in each segment and the actual end-face measurement value is compared; on the other hand, the point cloud of the CAD model is compared with the parameters of the design drawings to verify the fitting accuracy. Meanwhile, a trade-off analysis is conducted by combining the number of slices with the processing time (see
Table 4 for details).
Experiments show that dividing the point cloud into five segments can significantly reduce the calculation time while ensuring fitting accuracy, demonstrating good engineering applicability. This scheme not only enhances the responsiveness to local deformation and welding deviations but also effectively avoids the error diffusion problem in overall fitting, improving the accuracy and stability of dimensional evaluation.
Figure 11 shows the slicing processing and fitting effects, verifying that the method can highlight local features while maintaining the continuity of the overall structure.
4.5. Geometric Parameter Extraction
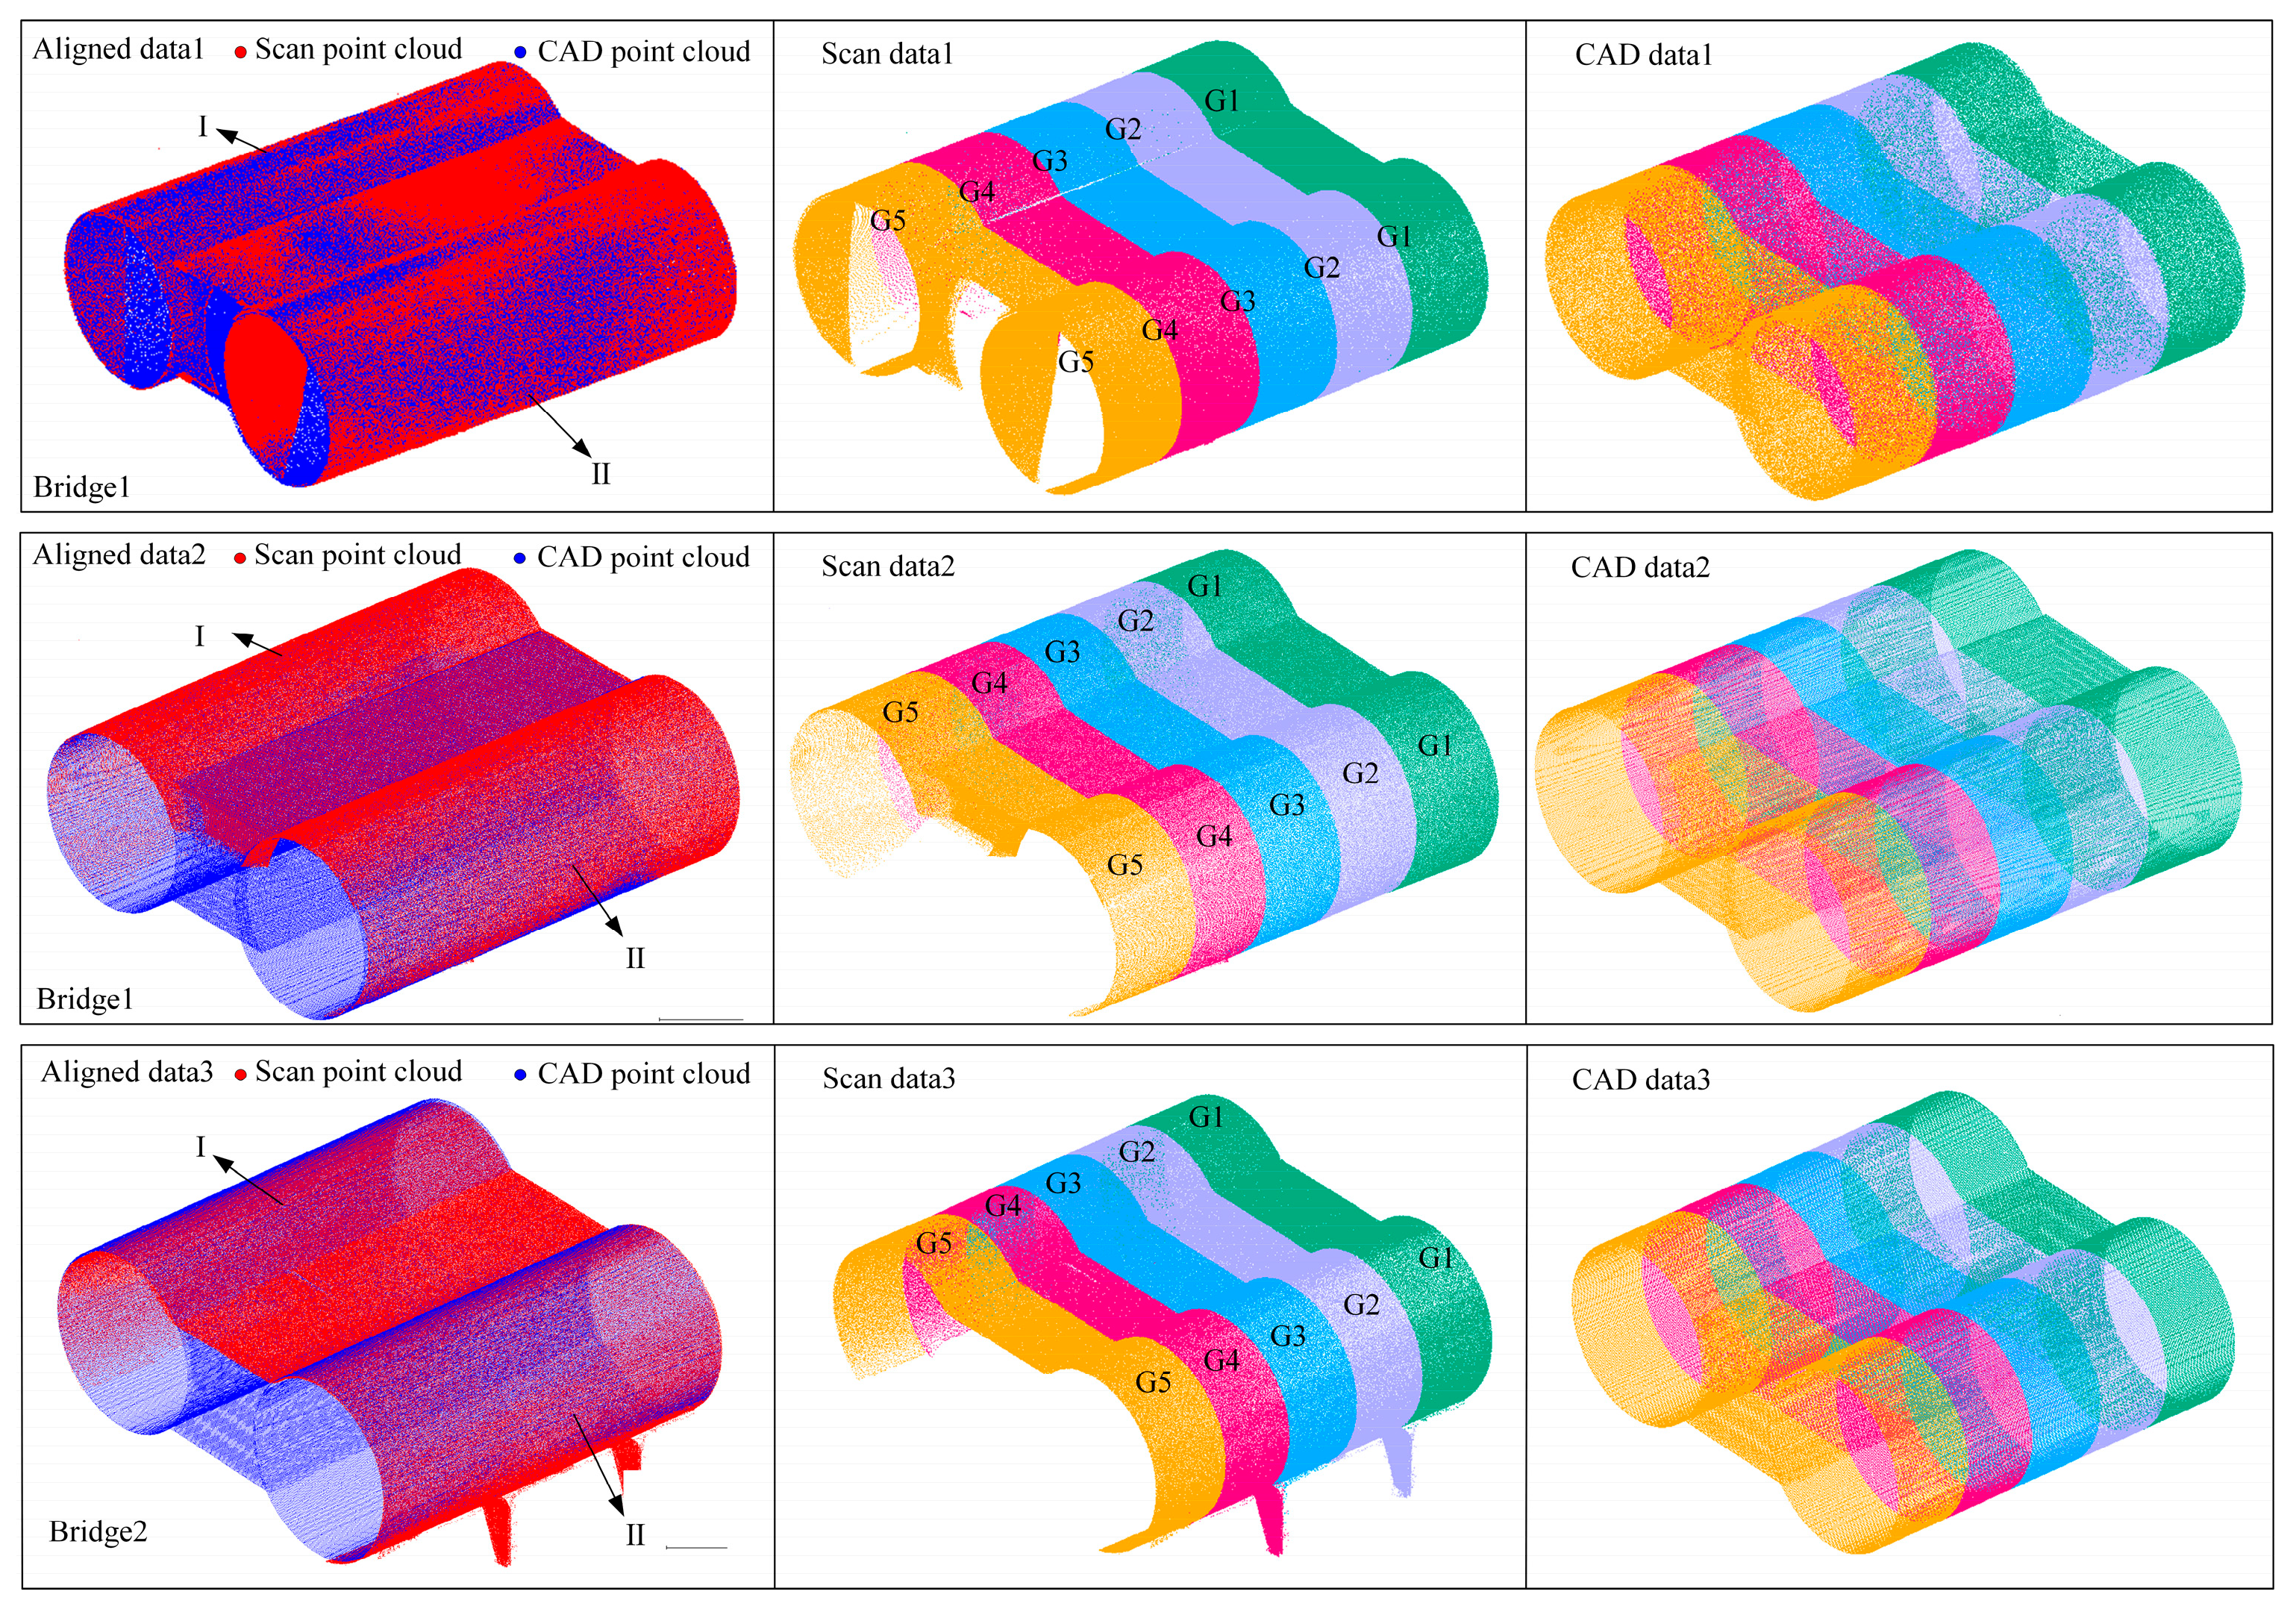
Taking the component G2 in segment I of
Figure 12 as a representative for analysis, the cylindrical fitting algorithm for point clouds calculates the fitted radius of the CAD point cloud as 649.71 mm, with only a minor difference of 0.29 mm from the 650.00 mm specified in the design drawings. This indicates that the algorithm has high reliability and practicality in fitting accuracy, effectively approximating the design dimensions. Meanwhile, the fitted direction vector is (−0.99984, 0.00460271, −0.0167597), showing that the component axis is basically consistent with the theoretical direction, further verifying the method’s high adaptability to CAD point clouds.
In the same region, a cylindrical fitting was performed on the actual scanned point cloud data. The results show a fitted radius of 653.54 mm and a direction vector of (−0.99986, −0.000610437, −0.0166092), indicating a certain deviation from the design parameters. This reflects potential dimensional and alignment errors introduced during the fabrication or installation processes of the actual components. The comparison not only intuitively reveals the geometric discrepancies between the as-built component and the design model, it also provides quantitative support for subsequent deviation analysis and quality assessment. The fitting results for the main arch rib components for the remaining segments are summarized in
Table 5.
To verify the accuracy and reliability of the proposed point cloud-based geometric dimension detection method, traditional measurement tools—namely, tape measures and total stations—were selected as comparative references. Manual measurements were conducted on key cross-sections for validation purposes, and the results are summarized in
Table 6. Tape measure measurement, as one of the most commonly used traditional methods, offers advantages such as simplicity and low cost. However, it is limited to linear distance measurements at specific locations, suffers from low efficiency, and is constrained by structural obstructions and spatial limitations, making it unsuitable for measuring arbitrary positions. In contrast, the total station enables high-precision coordinate measurements and is applicable to spatial localization at selected key cross-sections. Nevertheless, it also faces limitations due to the restricted density of measurement points, which makes it difficult to achieve a full coverage of the entire component surface. For cross-sectional areas that could not be accessed by tape or total station measurements due to structural complexity or environmental obstructions, a “—” symbol is used in the results table to indicate that no valid measurements could be obtained using traditional methods.
To verify the feasibility and accuracy of the fitting method proposed in this paper, taking the actual tape measure values at the G1 position of Segments I and II of data1 as references, comparative analyses were conducted using multiple typical point cloud cylindrical fitting algorithms (
Table 7 for details). When partial data suffered from occlusion, edge defects, and other issues, the least squares-based KASA algorithm was overly sensitive to anomalies, yielding significantly smaller fitting results that struggled to effectively characterize local geometric features. In contrast, robust fitting methods such as LMedS, RMSAC, and RANSAC improved the fitting conformity to actual structures to some extent but still exhibited large deviations. The primary reason is that weld areas often involve local distortion, sparse point clouds, or data gaps, causing these regions to be misclassified as outliers and excluded at the point cloud scale of this experimental data, thereby affecting the overall cylindrical radius fitting effect. The angle-projection-based method [
56] demonstrated strong performance in fitting cylindrical radii from large-scale and unevenly distributed sparse point clouds, effectively overcoming the impacts of sparse or missing point clouds. However, local distortions caused by multiple thick welds led to excessively large projections of point cloud data, compromising fitting accuracy and ultimately resulting in the overestimation of cylindrical parameters.
Compared with the overall fitting method, the segmented processing strategy in this paper demonstrates better improvements in structural decoupling, error control, and fitting accuracy enhancement. Taking segment I as an example, the fitting error of the proposed algorithm is only 0.09 mm under the same data conditions, compared with the traditional RANSAC fitting method (error: 0.35 mm), representing a 74.29% error reduction rate and improving the accuracy of cylindrical parameter extraction and fitting performance.
5. Discussion
According to the Technical Code for CFST Arch Bridges (GB 50923-2013)[
57], the allowable diameter deviation of bridge components should be controlled within D/500, where D refers to the design diameter of the component. In practical engineering applications, the allowable deviations for Bridges 1 and 2 should not exceed ±2.6 mm and ±2.4 mm, respectively, to meet the required precision standards. As shown in the analysis results in
Table 8, the Maximum Diameter Error (MDE) of the arch rib components investigated in this study was controlled within 1.6 mm, which fully demonstrates the reliability of the proposed method in practical applications. To further validate the accuracy of the proposed measurement method, we conducted a comparative analysis using measurements obtained from both tape measures and a high-precision total station. The comparison results are presented in
Table 8 and
Table 9.
As shown in the comparative analysis in
Table 10, the average fluctuation radius calculated using the proposed slicing-based fitting method was significantly less than ±0.3 mm when compared with traditional measurement approaches. This result fully verifies the accuracy and reliability of the proposed method for geometric dimension inspection. It indicates that the slicing-based fitting approach not only meets high-precision measurement requirements but also has the potential to effectively replace manual measurements in practical engineering scenarios, thereby improving the automation and efficiency of arch rib component inspection for CFST arch bridges.
It is worth noting that some measurement data exhibited fluctuations slightly exceeding 0.3 mm. This is primarily attributed to the high sensitivity of steel structures to ambient temperature variations. Changes in environmental conditions such as sunlight exposure and wind speed can lead to thermal expansion or contraction, resulting in minor dimensional variations in the components. Such deviations fall within the expected range of normal physical responses.
As shown in
Figure 13, a comparative analysis was conducted between the sliced fitting data of the main arch rib components obtained from 3D laser scanning and the corresponding CAD point cloud. The following conclusions were drawn: for Bridge 1, according to data 1, in segment I, member G1 met the current inspection standards and satisfied the design requirements, while members G2, G3, G4, and G5 exhibited manufacturing errors and failed to meet the standards, thus requiring a rework. In segment II, members G1, G2, and G3 met the inspection standards, whereas members G4 and G5 did not and also required a rework. According to data 2 for Bridge 1, segment I, members G1, G3, G4, and G5 met the current inspection standards, while member G2 showed manufacturing deviations and failed to meet the requirements, thus requiring a rework. In segment II, all sections from G1 to G5 met the standards and required no rework. Ijn Bridge 2, both segment I and segment II satisfied the current inspection standards, and no rework was necessary.
To evaluate the stability of point cloud data fitting accuracy, this paper calculates the mean value, standard deviation, and 95% confidence interval for the above fitting results. For the point cloud experimental data collected in this study for Bridge 1, the fitting average value is 2.02 mm, the standard deviation is 1.24 mm, and the confidence interval at the 95% confidence level is [1.44 mm, 2.60 mm]. For the point cloud experimental data collected in this study for Bridge 2, the fitting average value is 1.21 mm, the standard deviation is 0.66 mm, and the confidence interval at the 95% confidence level is [0.74 mm, 1.68 mm]. This indicates that the fitting method has certain fluctuations within the sample, and combined with the comparison data from traditional tape measures, the overall stability and confidence level are of reference value.
In addition, to quantitatively assess the measurement efficiency of the proposed method, the total measurement time for Bridge 1 (comprising 28 welded segments) and Bridge 2 (comprising 22 welded segments) was recorded and compared with that of traditional measurement approaches. Taking Bridge 1 as an example, conventional tape measurements require three-directional measurements at both ends of each segment, with each direction taking approximately 40 s. As a result, the total time required for a single segment is around 240 s, and the cumulative time for all 28 segments reaches 6720 s (
Table 11). In contrast, the automated point cloud-based measurement method proposed in this study required a total of 6383.94 s, representing an approximate 5% improvement in efficiency. Although total stations offer higher measurement precision, their reliance on manual station setup and point-by-point data acquisition significantly reduces the overall efficiency compared to both the tape measurements and the proposed method. Overall, the analysis demonstrates that the proposed method significantly enhances the measurement efficiency while maintaining an acceptable accuracy, indicating strong engineering adaptability and practical application value.
6. Conclusions
This paper takes the main arch rib components of CFST arch bridges as the research object and proposes a digital measurement method based on geometric parameters to accurately evaluate the geometric accuracy of arch bridge components. In this method, we first perform the precise registration of the actually scanned point cloud data with the CAD point cloud to ensure they are in the same coordinate system. The method uses projection slicing for point cloud geometric parameter fitting to reduce the impact of sparse and uneven massive point clouds and improve the measurement accuracy of traditional algorithm fitting. Through comparative experiments among multiple groups, the optimal number of slices is determined to achieve the segmented processing of the main arch rib components. Finally, cylindrical fitting is performed on the sliced point cloud data to extract the radius information of each segment, which is used to compare and analyze whether the scanned main arch rib components meet the design standards. Based on the experimental analysis of this study, the following conclusions are drawn:
(1) During actual scanning, there are regions with a certain degree of noise and poor point cloud quality. Traditional fitting methods such as the RANSAC algorithm are affected by outliers. Although their fitting effects are not poor, they struggle to meet the measurement accuracy requirements for subsequent experiments in this study. To address this issue, this paper proposes a segmented cylindrical fitting method based on point cloud slicing. By dividing the main arch rib components into multiple small segments for separate fitting, this method effectively reduces the impact of noise on fitting results. Compared with traditional algorithms, the fitting error using this method under the same data conditions is 0.09 mm, representing a 76.32% reduction in error and a significant optimization of the measurement results.
(2) Through comparison with traditional manual tape measure methods, the digital measurement method proposed in this paper demonstrates higher accuracy in measuring the radius of main arch rib components, with radius deviation fluctuations less than ±0.3 mm, fully meeting the measurement accuracy requirements. Meanwhile, the MDE value of the main arch ribs ≤ 1.6 mm, further indicating that the point cloud data of each sliced segment from scanning highly matches the point cloud data of the design CAD model. Additionally, in terms of efficiency, our method improves upon traditional tape measure methods by 5%, verifying the reliability and effectiveness of this method in practical applications.
In our future research, we plan to introduce higher-precision spatial SLAM (Simultaneous Localization and Mapping) techniques to enhance the integrity and consistency of point cloud data acquisition. Additionally, we will address the issue that current scan point clouds still contain partially irrelevant regions, semantic segmentation, and region recognition technologies fused with deep learning, to achieve the automatic identification and elimination of non-target areas, thereby effectively improving the data processing efficiency and component recognition accuracy.
In summary, this paper proposes and implements a digital measurement method for CFST arch bridge main arch ribs based on laser point clouds. This method not only significantly improves the measurement accuracy but also provides an efficient and reliable technical means for the component inspection of CFST arch bridges. It can effectively replace traditional manual measurement methods and has broad application prospects for future engineering practices.
Author Contributions
Conceptualization, Z.H. and C.K.; methodology, Z.H.; software, Z.H.; validation, Z.H., C.K. and H.Z.; formal analysis, Z.H.; investigation, Z.H.; resources, Z.H.; data curation, Z.H.; writing—original draft preparation, Z.H.; writing—review and editing, C.K.; visualization, Z.H.; supervision, C.K.; project administration, J.L.; funding acquisition, C.K. All authors have read and agreed to the published version of the manuscript.
Funding
This research received no external funding.
Data Availability Statement
The data are not publicly available due to project confidentiality, but may be made available from the corresponding author upon reasonable request and with permission from the project sponsor.
Conflicts of Interest
The authors declare no conflict of interest with Guangxi Guitong Engineering Management Group Co., Ltd.
References
- Whang, W.; Zhang, R.; Song, X.; Zhang, W.; Zhou, M. Comprehensive Transportation Statistics System Design and Implementation Strategy in China. In Proceedings of the CICTP 2023, Beijing, China, 14–17 July 2023; pp. 2149–2158. [Google Scholar]
- Zheng, J. Recent Construction Technology Innovations and Practices for Large-Span Arch Bridges in China. Engineering 2024, 41, 110–129. [Google Scholar] [CrossRef]
- Sun, H.; Burton, H.V.; Huang, H. Machine learning applications for building structural design and performance assessment: State-of-the-art review. J. Build. Eng. 2021, 33, 101816. [Google Scholar] [CrossRef]
- Wu, A.N.; Stouffs, R.; Biljecki, F. Generative Adversarial Networks in the built environment: A comprehensive review of the application of GANs across data types and scales. Build. Environ. 2022, 223, 109477. [Google Scholar] [CrossRef]
- Liao, W.; Lu, X.; Fei, Y.; Gu, Y.; Huang, Y. Generative AI design for building structures. Autom. Constr. 2024, 157, 105187. [Google Scholar] [CrossRef]
- Gailevičius, D.; Paipulas, D.; Hada, S.; Kretkowski, M.; Mizeikis, V. Form birefringent polymeric structures realized by 3D laser printing. Opt. Lett. 2023, 48, 5775–5778. [Google Scholar] [CrossRef]
- Thomas, A.R.; Soe, H.H.K.; Silva, C.S.; Kaur, H.; Ganendrah, L.D.; Gomez, L.M. Comparison of accuracy and reliability of CBCT and 3D laser scanner in the volumetric assessment of the root canal space. Am. J. Dent. 2023, 36, 246–250. [Google Scholar]
- Zhang, K.; Wang, C.; Li, Q.; Wang, Z. Characterization of the nozzle ablation rate based on 3D laser scanning system. Aerospace 2023, 10, 172. [Google Scholar] [CrossRef]
- Sun, Z.; Zhao, S.; Liang, B.; Liu, Z. Structure Deterioration Identification and Model Updating for Prestressed Concrete Bridges Based on Massive Point Cloud Data. Appl. Sci. 2024, 14, 10007. [Google Scholar] [CrossRef]
- Qin, G.; Zhou, Y.; Hu, K.; Han, D.; Ying, C. Automated reconstruction of parametric BIM for bridge based on terrestrial laser scanning data. Adv. Civ. Eng. 2021, 2021, 8899323. [Google Scholar] [CrossRef]
- Zhu, Y.; Brigham, J.C.; Fascetti, A. LiDAR-RGB Data Fusion for Four-Dimensional UAV-Based Monitoring of Reinforced Concrete Bridge Construction: Case Study of the Fern Hollow Bridge Reconstruction. J. Constr. Eng. Manag. 2025, 151, 05024016. [Google Scholar] [CrossRef]
- Jiang, S.; Yang, Y.; Gu, S.; Li, J.; Hou, Y. Bridge Geometric Shape Measurement Using LiDAR–Camera Fusion Mapping and Learning-Based Segmentation Method. Buildings 2025, 15, 1458. [Google Scholar] [CrossRef]
- Li, J.; Peng, Y.; Tang, Z.; Li, Z. Three-dimensional reconstruction of railway bridges based on unmanned aerial vehicle–terrestrial laser scanner point cloud fusion. Buildings 2023, 13, 2841. [Google Scholar] [CrossRef]
- Sun, W.; Wang, J.; Jin, F.; Li, G.; Xu, F. Intelligent construction monitoring method for large and complex steel structures based on laser point cloud. Buildings 2023, 13, 1749. [Google Scholar] [CrossRef]
- Xu, C.; Xiong, W.; Tang, P.; Cai, C.S. Automated flatness assessment for large quantities of full-scale precast beams using laser scanning. Comput.-Aided Civ. Infrastruct. Eng. 2024, 39, 1868–1885. [Google Scholar] [CrossRef]
- Zhou, Y.; Han, D.; Hu, K.; Qin, G.; Xiang, Z.; Ying, C.; Hu, X. Accurate virtual trial assembly method of prefabricated steel components using terrestrial laser scanning. Adv. Civ. Eng. 2021, 2021, 9916859. [Google Scholar] [CrossRef]
- Zhang, Z.; Shi, G.; Hou, L.; Zhou, L. Geometric dimension and imperfection measurements of box-T section columns using 3D scanning. J. Constr. Steel Res. 2021, 183, 106742. [Google Scholar] [CrossRef]
- Guo, M.; Sun, M.; Pan, D.; Huang, M.; Yan, B.; Zhou, Y. High-precision detection method for large and complex steel structures based on global registration algorithm and automatic point cloud generation. Measurement 2021, 172, 108765. [Google Scholar] [CrossRef]
- Guo, J.; Wang, Q.; Park, J.H. Geometric quality inspection of prefabricated MEP modules with 3D laser scanning. Autom. Constr. 2020, 111, 103053. [Google Scholar] [CrossRef]
- Xia, T.; Yang, J.; Chen, L. Automated semantic segmentation of bridge point cloud based on local descriptor and machine learning. Autom. Constr. 2022, 133, 103992. [Google Scholar] [CrossRef]
- Jin, Y.; Yuan, X.; Wang, Z.; Zhai, B. Filtering processing of LIDAR point cloud data. In IOP Conference Series: Earth and Environmental Science, Proceedings of the 2nd International Conference on Geology, Mapping and Remote Sensing, Zhangjiajie, China, 23–25 April 2021; IOP Publishing: Bristol, UK; Volume 783, p. 012125.
- Zhao, X.; Su, Y.; Li, W.; Hu, T.; Liu, J.; Guo, Q. A comparison of LiDAR filtering algorithms in vegetated mountain areas. Can. J. Remote Sens. 2018, 44, 287–298. [Google Scholar] [CrossRef]
- Li, Y.; Wang, J.; Li, B.; Sun, W.; Li, Y. An adaptive filtering algorithm of multilevel resolution point cloud. Surv. Rev. 2021, 53, 300–311. [Google Scholar] [CrossRef]
- Wen, G.; Zhang, H.; Guan, Z.; Su, W.; Jia, D. Bilateral filter denoising of Lidar point cloud data in automatic driving scene. Infrared Phys. Technol. 2023, 131, 104724. [Google Scholar]
- Ren, J.; Bao, K.; Zhang, G.; Chu, L.; Lu, W. LANDMARC indoor positioning algorithm based on density-based spatial clustering of applications with noise–genetic algorithm–radial basis function neural network. Int. J. Distrib. Sens. Netw. 2020, 16, 1550147720907831. [Google Scholar] [CrossRef]
- Chen, S.; Nie, S.; Xi, X.; Xia, S.; Zhu, F.; Wang, C.; Zhu, X. A Novel Multi-Dimensional Statistics Denoising Algorithm Based on Gaussian Mixture Model for Photon-counting LiDAR Data. IEEE J. Sel. Top. Appl. Earth Obs. Remote Sens. 2024, 17, 13308–13323. [Google Scholar] [CrossRef]
- Yu, C.; Lei, J.; Peng, B.; Shen, H.; Huang, Q. SIEV-Net: A structure-information enhanced voxel network for 3D object detection from LiDAR point clouds. IEEE Trans. Geosci. Remote Sens. 2022, 60, 1–11. [Google Scholar] [CrossRef]
- He, Q.; Wang, Z.; Zeng, H.; Zeng, Y.; Liu, Y. Svga-net: Sparse voxel-graph attention network for 3d object detection from point clouds. In Proceedings of the AAAI Conference on Artificial Intelligence, Online, 22 February–1 March 2022; Volume 36, pp. 870–878. [Google Scholar]
- Fu, C.; Li, G.; Song, R.; Gao, W.; Liu, S. Octattention: Octree-based large-scale contexts model for point cloud compression. In Proceedings of the AAAI Conference on Artificial Intelligence, New York, NY, USA, 7–12 February 2022; Volume 36, pp. 625–633. [Google Scholar]
- Nguyen, D.T.; Quach, M.; Valenzise, G.; Duhamel, P. Learning-based lossless compression of 3d point cloud geometry. In Proceedings of the ICASSP 2021-2021 IEEE International Conference on Acoustics, Speech and Signal Processing (ICASSP), Toronto, ON, Canada, 6–11 June 2021; pp. 4220–4224. [Google Scholar]
- Zhou, Q.; Sun, B. Adaptive K-means clustering based under-sampling methods to solve the class imbalance problem. Data Inf. Manag. 2024, 8, 100064. [Google Scholar] [CrossRef]
- Xiao, Z.; Gao, J.; Wu, D.; Zhang, L. Voxel grid downsampling for 3D point cloud recognition. Modul. Mach. Tool Autom. Manuf. Tech. 2021, 43–47. [Google Scholar] [CrossRef]
- Zhang, X.; Zou, Z.; Li, Z.; Li, H. Deep multi-modal fusion in object detection for autonomous driving. CAAI Trans. Intell. Syst. 2020, 15, 1–14. [Google Scholar]
- Chen, K.; Hong, L.; Xu, H.; Li, Z.; Yeung, D.Y. Multisiam: Self-supervised multi-instance siamese representation learning for autonomous driving. In Proceedings of the IEEE/CVF International Conference on Computer Vision, Montreal, QC, Canada, 10–17 October 2021; pp. 7546–7554. [Google Scholar]
- Ma, G.; Wei, H. A novel sketch-based framework utilizing contour cues for efficient point cloud registration. IEEE Trans. Geosci. Remote Sens. 2023, 61, 1–16. [Google Scholar] [CrossRef]
- Perez-Gonzalez, J.; Luna-Madrigal, F.; Piña-Ramirez, O. Deep learning point cloud registration based on distance features. IEEE Lat. Am. Trans. 2019, 17, 2053–2060. [Google Scholar] [CrossRef]
- Segal, A.; Haehnel, D.; Thrun, S. Generalized-icp. In Proceedings of the Robotics: Science and systems, Seattle, WA, USA, 28 Jun–1 July 2009; Volume 2, p. 435. [Google Scholar]
- Yang, J.; Li, H.; Jia, Y. Go-icp: Solving 3d registration efficiently and globally optimally. In Proceedings of the IEEE International Conference on Computer Vision, Sydney, Australia, 1–8 December 2013; pp. 1457–1464. [Google Scholar]
- Li, L.; Sung, M.; Dubrovina, A.; Guibas, L.J. Supervised fitting of geometric primitives to 3d point clouds. In Proceedings of the IEEE/CVF Conference on Computer Vision and Pattern Recognition, Long Beach, CA, USA, 15–20 June 2019; pp. 2652–2660. [Google Scholar]
- Birdal, T.; Busam, B.; Navab, N.; Ilic, S.; Sturm, P. Generic primitive detection in point clouds using novel minimal quadric fits. IEEE Trans. Pattern Anal. Mach. Intell. 2019, 42, 1333–1347. [Google Scholar] [CrossRef] [PubMed]
- Schnabel, R.; Wahl, R.; Klein, R. Efficient RANSAC for point-cloud shape detection. In Computer Graphics Forum; Blackwell Publishing Ltd.: Oxford, UK, 2007; Volume 26, pp. 214–226. [Google Scholar]
- Bolles, R.C.; Fischler, M.A. A RANSAC-based approach to model fitting and its application to finding cylinders in range data. IJCAI 1981, 1981, 637–643. [Google Scholar]
- Chaperon, T.; Goulette, F. Extracting cylinders in full 3D data using a random sampling method and the Gaussian image. In Proceedings of the Vision Modeling and Visualization Conference 2001 (VMV-01), Stuttgart, Germany, 21–23 November 2001. [Google Scholar]
- Tran, T.T.; Cao, V.T.; Laurendeau, D. Extraction of cylinders and estimation of their parameters from point clouds. Comput. Graph. 2015, 46, 345–357. [Google Scholar] [CrossRef]
- Liu, Y.J.; Zhang, J.B.; Hou, J.C.; Ren, J.C.; Tang, W.Q. Cylinder detection in large-scale point cloud of pipeline plant. IEEE Trans. Vis. Comput. Graph. 2013, 19, 1700–1707. [Google Scholar] [CrossRef]
- Araújo, A.M.C.; Oliveira, M.M. Connectivity-based cylinder detection in unorganized point clouds. Pattern Recognit. 2020, 100, 107161. [Google Scholar] [CrossRef]
- Maalek, R.; Lichti, D.D.; Walker, R.; Bhavnani, A.; Ruwanpura, J.Y. Extraction of pipes and flanges from point clouds for automated verification of pre-fabricated modules in oil and gas refinery projects. Autom. Constr. 2019, 103, 150–167. [Google Scholar] [CrossRef]
- Ahmed, M.F.; Haas, C.T.; Haas, R. Automatic detection of cylindrical objects in built facilities. J. Comput. Civ. Eng. 2014, 28, 04014009. [Google Scholar] [CrossRef]
- Rusu, R.B.; Blodow, N.; Beetz, M. Fast point feature histograms (FPFH) for 3D registration. In Proceedings of the 2009 IEEE International Conference on Robotics and Automation, Kobe, Japan, 12–17 May 2009; IEEE: New York, NY, USA; pp. 3212–3217. [Google Scholar]
- Zhong, Y. Intrinsic shape signatures: A shape descriptor for 3D object recognition. In Proceedings of the 2009 IEEE 12th International Conference on Computer Vision Workshops, ICCV Workshops, Kyoto, Japan, 27 September–4 October 2009; IEEE: New York, NY, USA; pp. 689–696. [Google Scholar]
- Liu, B.; Liu, L.; Tian, F. An Improved SAC-IA Algorithm Based on Voxel Nearest Neighbor Search. Crit. Rev. Biomed. Eng. 2022, 50, 35–46. [Google Scholar] [CrossRef]
- Low, K.L. Linear Least-Squares Optimization for Point-To-Plane Icp Surface Registration; University of North Carolina at Chapel Hill: Chapel Hill, NC, USA, 2004; Volume 4, pp. 1–3. [Google Scholar]
- Wu, J.; Li, Z.; Zhang, J.; Wang, T.; Wang, H.; Tang, J. Adaptive positioning repair method for aero-engine blades by using speckle vision measurement. IEEE Access 2020, 8, 73307–73319. [Google Scholar] [CrossRef]
- Nguyen, C.H.P.; Choi, Y. Comparison of point cloud data and 3D CAD data for on-site dimensional inspection of industrial plant piping systems. Autom. Constr. 2018, 91, 44–52. [Google Scholar] [CrossRef]
- Li, R.; Yuan, X.; Gan, S.; Bi, R.; Luo, W.; Chen, C.; Zhu, Z. Automatic Coarse Registration of Urban Point Clouds Using Line-Planar Semantic Structural Features. IEEE Trans. Geosci. Remote Sens. 2024, 62, 1–24. [Google Scholar] [CrossRef]
- Wu, Q.; Li, Z.; Liu, J.; Li., Z. Cylindrical Fitting of Sparse Point Clouds Based on Angular Projection. Modul. Mach. Tool Autom. Manuf. Tech. 2022, 9, 139–142. (In Chinese) [Google Scholar]
- GB 50923-2013Technical code for concrete-filled steel tube structures [S].; Ministry of Housing and Urban-Rural Development of the People’s Republic of China: Beijing, China, 11 April 2025. Available online: http://www.mohurd.gov.cn (accessed on 11 April 2025).
Figure 1.
Digital measurement process.
Figure 1.
Digital measurement process.
Figure 2.
CAD data processing.
Figure 2.
CAD data processing.
Figure 3.
Downsampling principle.
Figure 3.
Downsampling principle.
Figure 4.
Registration process.
Figure 4.
Registration process.
Figure 5.
Geometric parameter comparison. (a) Scan point clouds to fit cylinders; (b) CAD point cloud fits the cylinder; (c) geometric parameter comparison.
Figure 5.
Geometric parameter comparison. (a) Scan point clouds to fit cylinders; (b) CAD point cloud fits the cylinder; (c) geometric parameter comparison.
Figure 6.
Experimental scene: (a) Bridge 1 experimental scene; (b) Bridge 2 experimental scene.
Figure 6.
Experimental scene: (a) Bridge 1 experimental scene; (b) Bridge 2 experimental scene.
Figure 7.
Experimental data.
Figure 7.
Experimental data.
Figure 8.
Point cloud processing.
Figure 8.
Point cloud processing.
Figure 9.
Registration process.
Figure 9.
Registration process.
Figure 10.
Comparison map of point cloud boundary extraction.
Figure 10.
Comparison map of point cloud boundary extraction.
Figure 11.
Point cloud slicing processing result.
Figure 11.
Point cloud slicing processing result.
Figure 12.
RANSAC sample diagram of fitting geometric parameters.
Figure 12.
RANSAC sample diagram of fitting geometric parameters.
Figure 13.
Bridge 1 and Bridge 2 analysis of radius measurement results.
Figure 13.
Bridge 1 and Bridge 2 analysis of radius measurement results.
Table 1.
Point cloud processing.
Table 1.
Point cloud processing.
| CAD Data (PLY) | Scan Data (PLY) |
|---|
| Numbers | Size (kB) | Before Processing | After Processing |
|---|
| Numbers | Size (kB) | Numbers | Size (kB) |
|---|
| 592,172 | 19,617 | 4,630,145 | 234,941 | 592,507 | 28,821 |
| 488,522 | 17,176 | 2,883,016 | 166,801 | 501,397 | 28,948 |
| 320,908 | 11,494 | 1,856,841 | 99,733 | 516,584 | 25,729 |
Table 2.
ISS key points and main parameters.
Table 2.
ISS key points and main parameters.
| Data | Meaning of the Main Parameters | Value (m) |
|---|
| Source | The radius for non-maximum suppression | 4 pr* | 0.0164/0.0185/0.0178 |
| The radius used for computing the salient features of each point | 6 pr* | 0.0246/0.0277/0.0267 |
| Target | The radius for non-maximum suppression | 4 pr* | 0.0246/0.0261/0.0289 |
| The radius used for computing the salient features of each point | 6 pr* | 0.0369/0.0391/0.0433 |
Table 3.
Projection point cloud boundary extraction test.
Table 3.
Projection point cloud boundary extraction test.
| No. | | Extract Numbers | Time (s) |
|---|
| 1 | 0.005 | 72,599/96,607/39,228 | 3.73/3.91/3.82 |
| 2 | 0.01 | 1842/2739/2658 | 3.69/3.72/3.80 |
| 3 | 0.02 | 1765/1786/1956 | 3.65/3.66/3.90 |
| 4 | 0.04 | 1103/1304/1509 | 3.71/3.61/3.62 |
| 5 | 0.08 | 880/962/1025 | 3.70/3.84/3.81 |
Table 4.
Slice fitting results.
Table 4.
Slice fitting results.
| n | Scan Data | CAD Data |
|---|
| Absolute Deviation of Radius (mm) | Time (s) | Absolute Deviation of Radius (mm) | Time (s) |
|---|
| 1 | 0.35/0.18/0.31 | 19.12/18.73/18.85 | 0.32/0.33/0.07 | 20.81/21.35/15.25 |
| 2 | 0.34/0.23/0.28 | 31.09/30.21/30.54 | 0.27/0.28/0.12 | 33.73/34.20/26.89 |
| 3 | 0.32/0.20/0.35 | 42.11/41.40/41.98 | 0.24/0.25/0.09 | 45.53/46.50/38.02 |
| 4 | 0.52/0.18/0.41 | 53.42/52.86/52.97 | 0.23/0.22/0.23 | 57.52/58.67/50.28 |
| 5 | 0.09/0.16/0.16 | 64.70/63.95/64.78 | 0.21/0.09/0.05 | 69.70/70.84/66.92 |
| 6 | 0.24/0.22/0.18 | 77.37/75.91/74.90 | 0.27/0.26/0.14 | 83.22/83.45/82.88 |
| 7 | 0.16/0.17/0.29 | 89.39/87.34/84.81 | 0.46/0.44/0.10 | 96.15/96.71/92.67 |
| 8 | 0.12/0.14/0.13 | 100.13/99.08/101.46 | 0.25/0.26/0.06 | 107.52/108.30/96.73 |
| 9 | 0.39/0.21/0.46 | 111.50/110.76/104.89 | 0.27/0.29/0.27 | 119.76/120.55/101.85 |
| 10 | 0.54/0.26/0.51 | 122.78/121.85/115.58 | 0.53/0.25/0.19 | 131.78/133.13/113.71 |
Table 5.
Measured radius of bridge member (mm).
Table 5.
Measured radius of bridge member (mm).
| Member | I | II |
|---|
| Scan Data | CAD Data | Scan Data | CAD Data |
|---|
| G1 | 652.09/649.76/598.24 | 649.79/650.09/599.95 | 650.58/651.05/599.47 | 650.28/649.77/599.93 |
| G2 | 653.54/652.90/599.76 | 649.71/650.11/599.92 | 649.48/649.92/597.86 | 649.76/650.06/599.94 |
| G3 | 653.98/651.96/600.83 | 650.23/649.88/599.92 | 647.78/652.35/598.52 | 649.84/649.85/599.93 |
| G4 | 652.96/652.18/601.14 | 649.78/649.73/599.92 | 646.47/650.21/601.36 | 649.83/650.12/599.94 |
| G5 | 653.19/651.42/600.62 | 650.15/649.80/599.96 | 646.65/651.73/602.01 | 649.75/649.90/599.95 |
Table 6.
Tradition method radius measurement (mm).
Table 6.
Tradition method radius measurement (mm).
| Member | Tape Measure | Total Station |
|---|
| I | II | I | II |
|---|
| G1 | 652.00/649.60/598.40 | 650.50/650.90/599.60 | 652.02/649.58/598.42 | 650.48/650.91/599.58 |
| G2 | — | — | 653.31/652.88/599.92 | 649.62/649.75/598.05 |
| G3 | 654.01/651.68/600.75 | 647.83/652.64/598.31 |
| G4 | 653.22/652.31/601.04 | 646.32/650.03/601.18 |
| G5 | 653.00/651.30/600.50 | 646.50/651.60/602.20 | 652.99/651.29/600.49 | 646.52/651.61/602.18 |
Table 7.
Comparison results for algorithm radius fitting (mm).
Table 7.
Comparison results for algorithm radius fitting (mm).
| Bridge Data | KASA | LMedS | Projection | RANSAC | Proposed | Practical |
|---|
| I | Scan data | 584.28 | 654.68 | 656.74 | 652.38 | 652.09 | 652.00 |
| CAD data | 657.22 | 649.37 | 650.23 | 649.36 | 649.79 | 650.00 |
| II | Scan data | 596.36 | 649.13 | 651.86 | 649.98 | 650.58 | 650.50 |
| CAD data | 649.78 | 649.78 | 650.12 | 649.78 | 650.28 | 650.00 |
Table 8.
Bridge member measurement results.
Table 8.
Bridge member measurement results.
| Member | Absolute Deviation of Radius (mm) | Orientation (°) | MDE (mm) |
|---|
| I | II | I | II |
|---|
| G1 | 2.30/0.33/1.71 | 0.30/1.28/0.46 | 0.05/0.18/0.15 | 0.29/0.24/0.30 | 1.45/1.39/1.50 |
| G2 | 3.83/2.79/0.16 | 0.28/0.14/2.08 | 0.20/0.20/0.18 | 0.28/0.10/0.16 | 1.40/1.41/1.32 |
| G3 | 3.75/2.08/0.91 | 2.06/2.50/1.41 | 0.16/0.17/0.22 | 0.26/0.25/0.10 | 1.55/1.37/1.34 |
| G4 | 3.18/2.45/1.22 | 3.36/0.09/1.42 | 0.19/0.14/0.23 | 0.39/0.19/0.20 | 1.39/1.40/1.56 |
| G5 | 3.04/1.62/0.66 | 3.10/1.83/2.06 | 0.19/0.18/0.14 | 0.34/0.22/0.13 | 1.49/1.38/1.48 |
Table 9.
Measurement results for traditional method bridge components (mm).
Table 9.
Measurement results for traditional method bridge components (mm).
| Member | Tape Measure | Total Station |
|---|
| I | II | I | II |
|---|
| G1 | 2.00/0.40/1.60 | 0.50/0.90/0.40 | 2.02/0.48/1.58 | 0.48/0.91/0.42 |
| G2 | — | — | 3.31/2.88/0.08 | 0.38/0.25/1.95 |
| G3 | 4.01/1.68/0.75 | 2.17/2.64/1.69 |
| G4 | 3.22/2.31/1.04 | 3.68/0.03/1.18 |
| G5 | 3.00/1.30/0.50 | 3.50/1.60/2.20 | 2.99/1.29/0.49 | 3.48/1.61/2.18 |
Table 10.
Method accuracy calibration and comparison.
Table 10.
Method accuracy calibration and comparison.
| Member | Tape Measure | Total Station |
|---|
| I | II | I | II |
|---|
| G1 | 0.30/0.07/0.11 | 0.20/0.38/0.06 | 0.28/0.15/0.13 | 0.18/0.37/0.04 |
| G2 | — | — | 0.52/0.08/0.08 | 0.10/0.11/0.13 |
| G3 | 0.26/0.40/0.16 | 0.11/0.14/0.28 |
| G4 | 0.04/0.14/0.18 | 0.35/0.06/0.24 |
| G5 | 0.04/0.32/0.16 | 0.40/0.23/0.14 | 0.05/0.33/0.17 | 0.38/0.22/0.12 |
Table 11.
Measurement efficiency comparison (s).
Table 11.
Measurement efficiency comparison (s).
| Time | Proposed | Tape Measure | Total Station |
|---|
| Bridge 1 | Bridge 2 | Bridge 1 | Bridge 2 | Bridge 1 | Bridge 2 |
|---|
| Splicing | 3600.00 | 2400 | 6720 | 5280 | 43,680 | 34,320 |
| Preprocessing | 132.30 | 85.84 |
| Registration | 761.04 | 517.22 |
| Geometric extraction | 1890.60 | 1453.67 |
| Total | 6383.94 | 4456.73 | 6720 | 5280 | 43,680 | 34,320 |
| Disclaimer/Publisher’s Note: The statements, opinions and data contained in all publications are solely those of the individual author(s) and contributor(s) and not of MDPI and/or the editor(s). MDPI and/or the editor(s) disclaim responsibility for any injury to people or property resulting from any ideas, methods, instructions or products referred to in the content. |
© 2025 by the authors. Licensee MDPI, Basel, Switzerland. This article is an open access article distributed under the terms and conditions of the Creative Commons Attribution (CC BY) license (https://creativecommons.org/licenses/by/4.0/).


