Article

Numerical Modelling and Parametric Study of Steel-Concrete Composite Slim-Floor Flexural Beam Using Dowel Shear Connectors

Faculty of Engineering and Digital Technologies, University of Bradford, Bradford BD7 1DP, UK
*
Authors to whom correspondence should be addressed.
Infrastructures 2025, 10(6), 146; https://doi.org/10.3390/infrastructures10060146
Submission received: 20 March 2025 / Revised: 2 June 2025 / Accepted: 9 June 2025 / Published: 13 June 2025
(This article belongs to the Section Infrastructures and Structural Engineering)

Abstract

The use of steel-concrete composite slim-floor beams with dowel shear connectors is uncommon, and the design rules provided in Eurocode 4 for composite construction are not directly applicable to the slim-floor composite beam. In this paper, a finite element model is developed, followed by a parametric study that examines the effects of various shear connector parameters on the structural behaviour of composite beams. The comparison and analysis show that the load-bearing capacity increases with a bigger concrete dowel, as long as the shear connection degree is less than 100% and the dowel diameter is not greater than 80 mm; the load-bearing capacity goes up about 5–10% for every 10 N/mm2 increase in concrete strength and about 2% for every 4 mm increase in rebar diameter in the dowel; also, the dowel central spacing has a big impact on the structural behaviour. The composite beams showed great flexibility, with the end slip at the highest load being more than 6 mm and the maximum load declining by less than 15% when the midspan deflection reached L/30. The proposed calculation method for bending moment resistance is more than 90% accurate for composite beams that have a shear connection degree greater than 40%. The findings from this research provided more profound insights into the behaviour of this type of slim-floor composite beam.

1. Introduction

Steel-concrete composite beams are widely adopted in construction practices [1]; however, the composite action of most traditional composite beams used for steel-framed buildings is primarily achieved through shear connectors that are welded to the top flange of the steel beam and embedded in the concrete slab. This type of composite beam with a downstand steel section may facilitate the arrangement of other building services, but the floor structural depth is relatively larger [2,3]. A steel-concrete composite slim-floor beam with dowel shear connectors may partially incorporate the main steel beam into the structural floor to achieve a minimum floor depth, thus increasing the usable net space or reducing the overall building height [1,4,5]. Research on the steel-concrete composite slim-floor beams is still limited compared to traditional steel-concrete composite beams, particularly composite beams utilising dowel shear connectors. As a significant member of the composite structure family, composite slim-floor beams utilising dowel shear connectors represent an innovative and economical evolution of conventional composite systems [4]. The key composite action of this type of beam is facilitated through concrete dowel shear connectors that connect the steel section to the concrete slab. Currently, there is no specific code to guide the design of these composite slim-floor beams. The design rules provided in Eurocode 4 [6] for composite construction are not directly applicable to this slim-floor composite beam system. A lack of understanding regarding the interaction between different composite members and the effects of these members on the structural behaviour of composite systems may hinder the full utilisation of the potential of the slim-floor beam system. Therefore, further research on the structural behaviour of slim-floor composite beams is essential for developing reliable design calculation methods.
The slim-floor composite beam using dowel shear connectors incorporates multiple mechanisms that contribute to its composite action, including purpose-built shear connectors, friction, and clamping between steel and concrete. This is different from a traditional composite beam with the concrete slab sitting on the top flange of the steel beam, in which the shear force is mainly transferred by the welded shear studs and friction between the top flange and slab bottom surfaces. While in a slim-floor composite beam using dowel shear connectors through the steel web, the shear force is transferred through the concrete dowel, dowel reinforcement bar, and friction and clamping between concrete and steel. This makes the interaction between steel and concrete members more complicated. In recent years, numerous researchers have advanced the understanding of slim-floor composite structures. Ahmed and Tsavdaridis [1] reviewed the evolution of composite flooring systems, discussing testing, modelling, applications, and the advantages and disadvantages of typical slim floors. Their study demonstrated that the dowel shear connection is essential for maintaining the integrity of the composite system and boosting its load-bearing capability. Hosseinpour et al. [7] conducted push-out tests and numerical simulations on pure concrete dowel shear connectors used in slim-floor composite beams. They discovered that the size, shape, and spacing of the dowels and the strength of the concrete affect the maximum shear strength, and they suggested formulas to predict the maximum resistance of dowel shear connectors that are circular and square in shape. Coldebella et al. [8] investigated the shear force transfer of dowel shear connectors through push-out tests, and they found that steel bars in openings contributed significantly to shear resistance and reduced slip; the steel bar diameter and concrete strength influenced the resistance capacity and slip behaviour. Mesquita et al. [9] evaluated the structural behaviour of composite slim-floor beams with openings in the web; they found that the spacing between the openings, the number of openings, and the diameter of the reinforcing steel bars determined the behaviour of the connection. Tsavdaridis et al. [10] investigated the bending behaviour of a partially enclosed ultra-shallow floor beam (USFB) with two types of lightweight concrete. They concluded that the deflections of the composite beam could be predicted accurately by the elastic properties, and the failure mode was concrete crushing before the plastic bending resistance of the composite section had been developed. Baldassino et al. [11] looked at how slim-floor composite beams performed under normal and maximum loads, focusing on how creep and shrinkage affected them. They discovered that the steel bars, which were placed through the holes in the steel web to act as shear connectors, bent in specific spots at the web, and this bending became much worse near the ends of the samples, while creep did not affect the overall performance. Sheehan et al. [12] conducted a series of tests on slim-floor composite shear beams and flexural beams with various arrangements of shear connectors to evaluate the impact of the shear connection degree and the load-bearing capacity of this type of composite beam. They found that the steel bars passing through web holes play an important role in the shear connectors, and the diameter of the web hole affected the resistance of the composite beam; the way the load was applied also influenced the performance. Dai et al. [13] conducted a parameter study to further investigate the effects of dowel shear connectors on the behaviour of shear beams. They found that a larger dowel increased the load-bearing capacity; however, an optimum dowel size existed, as a larger dowel reduced the steel section more and lowered the capacity of the steel beam. Additionally, the diameter of the rebar and the strength of the concrete influenced both load capacity and end slip behaviour. Junior et al. [14] developed a finite element model (FE) and conducted a parametric study to explore the flexural behaviour of steel–concrete ultra-shallow floor beams (USFBs) with precast hollow-core slabs. They discovered that concrete strength, the thickness of the concrete topping, and the bottom flange of the steel section influenced the resistance and stiffness of the composite beam, while an increase in the area of the concrete dowel did not increase the resistance of the USFBs. Alali and Tsavdaridis [15] investigated the flexural behaviour of prefabricated ultra-shallow steel-concrete composite slabs through experiments, demonstrating that the shear connection system, which comprised web-welded shear studs and horizontal steel dowels, was highly effective in bending and exhibited significant resistance to longitudinal shear between the steel sections and concrete. Lin et al. [16] reviewed available experimental results and developed analytical formulas to predict the bending capacity of shallow steel-beam-concrete composite decks at yield and ultimate levels, achieving good agreement with experimental data. Xia et al. [17] conducted a testing study to observe the effect of shear connectors on the ultimate flexural capacity of composite slim-floor beams with horizontal headed studs, transverse steel bar shear connectors, and without shear connectors, revealing that composite beams with headed studs exhibited the highest flexural strength. Chen et al. [18] studied slim-floor beams utilising innovative transverse shear connectors, finding that they provided an efficient solution by combining the tensile strength of tie bars with the compressive strength of concrete. Lam et al. [19] presented a design method for slim-floor construction that integrates a steel beam within the depth of a concrete or composite floor slab, with special attention given to the forms of shear connection between the steel and concrete. Limazie and Chen [20] investigated the flexural behaviour of composite slim floor beams with varying parameters, such as material strength and geometry. They found that the thickness and yielding strength of the steel bottom flange affected the strength and stiffness of the beam the most, while the thickness and yielding strength of the encased steel web and the strength of concrete had little influence on the beam strength. Huo and D’Mello [21] explored the shear transfer mechanisms in a composite shallow cellular floor beam with web openings. The results showed that the behaviour and shear resistance of the concrete infill-only and tie-bar shear connections were completely different. Limazie and Chen [22,23] developed FE models based on experimental studies and further examined the flexural behavior and load-bearing capacity of composite slim-floor beams and the mechanisms of shear connection through parametric studies.
Although an amount of research literature exists on slim-floor composite beams utilizing dowel shear connectors, it remains limited for fully understanding the structural behavior of those innovative composite beams, particularly regarding the development of design methods and the enhancement of the Eurocodes. The research presented in this paper aims to develop a finite element model using ABAQUS 2022 [24] and conduct a parameter study. This study will examine various factors, including the diameter of the dowel through the beam web, the diameter of the rebar in the dowel, and the concrete strength grades, among others. The goal is to gain a deeper understanding of the structural behavior of slim-floor composite beams and ultimately develop a calculation method for predicting the maximum bending moment capacity of flexural slim-floor composite beams that utilize dowel shear connectors.

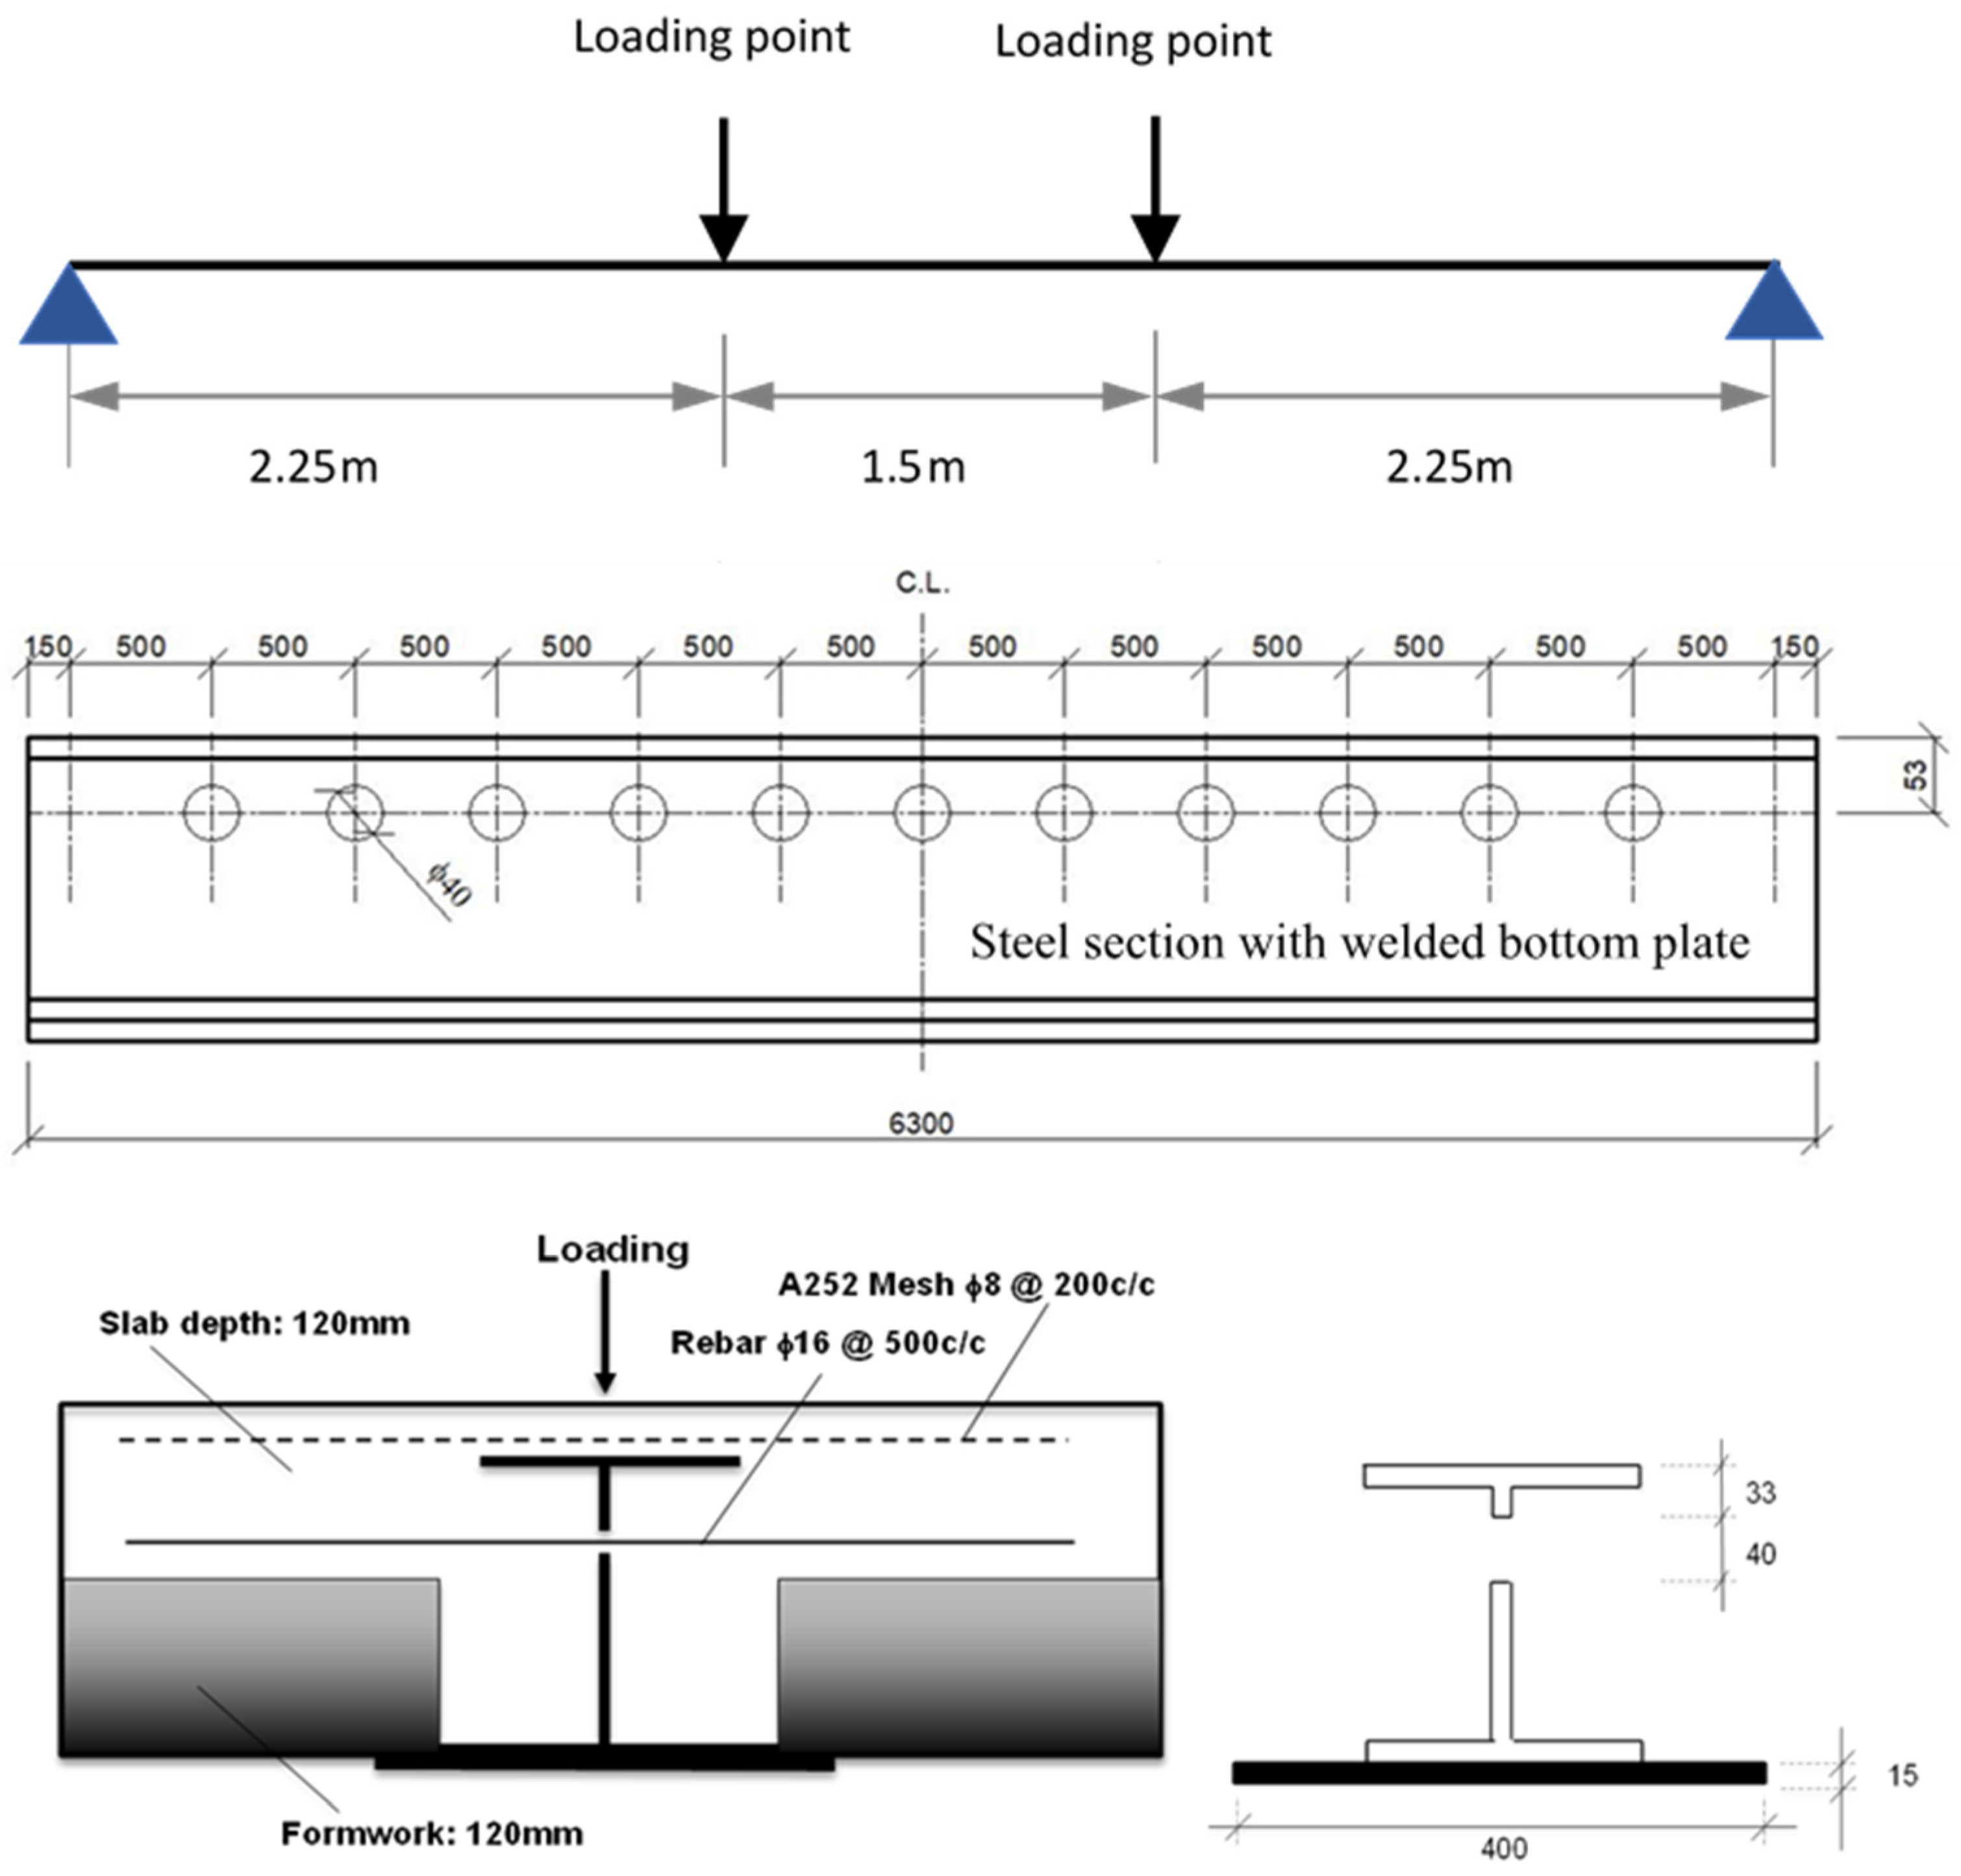
2. Brief Introduction to Experimental Study

Nine full-scale composite beams were tested at the University of Bradford to investigate their flexural structural behaviours and to observe the failure modes of steel-concrete composite slim-floor beam systems. The study included two loading regimes (concentric and eccentric loading), two diameters of dowel shear connectors (40 mm and 80 mm), and configurations without shear connectors. Additionally, two overall composite beam depths (200 mm and 240 mm) and six degrees of shear connection (0%—no shear connection, 25%, 40%, 50%, 64%, and 100%) were examined. Each composite beam had an overall length of 6.3 m, with a beam span of 6.0 m (the distance between the two supports).
The composite beam comprised a steel beam constructed from an HEB 200 steel section, to which a steel plate (400 mm wide and 15 mm thick) was welded to the bottom flange. It also included a concrete slab, concrete dowels with or without rebar, and reinforcement steel mesh within the slab. The HEB 200 steel section was embedded in the concrete slab, which had a width of 1.5 m and an overall depth of either 240 mm (with a 120 mm upper slab depth and a 120 mm formwork depth) or 200 mm (with an 80 mm upper slab depth and a 120 mm formwork depth). An A252 steel mesh (with a mesh size of 200 mm × 200 mm and a bar diameter of 8 mm) was positioned near the top of the concrete slab, above the flange of the steel section, to prevent premature cracking of the concrete due to the hogging moment near the top of the composite beam. Concrete dowels, with or without reinforcing bars, were employed as shear connectors to transfer shear forces between the concrete and the steel profile. Figure 1 illustrates the dimensions and loading approach of a typical specimen. Key features of the slim-floor composite beam test specimens are summarised in Table 1. A detailed experimental procedure, along with a comparison and analysis of the results, can be found in reference (Sheehan T et al. [12]).

3. Development of FE Model and Validation

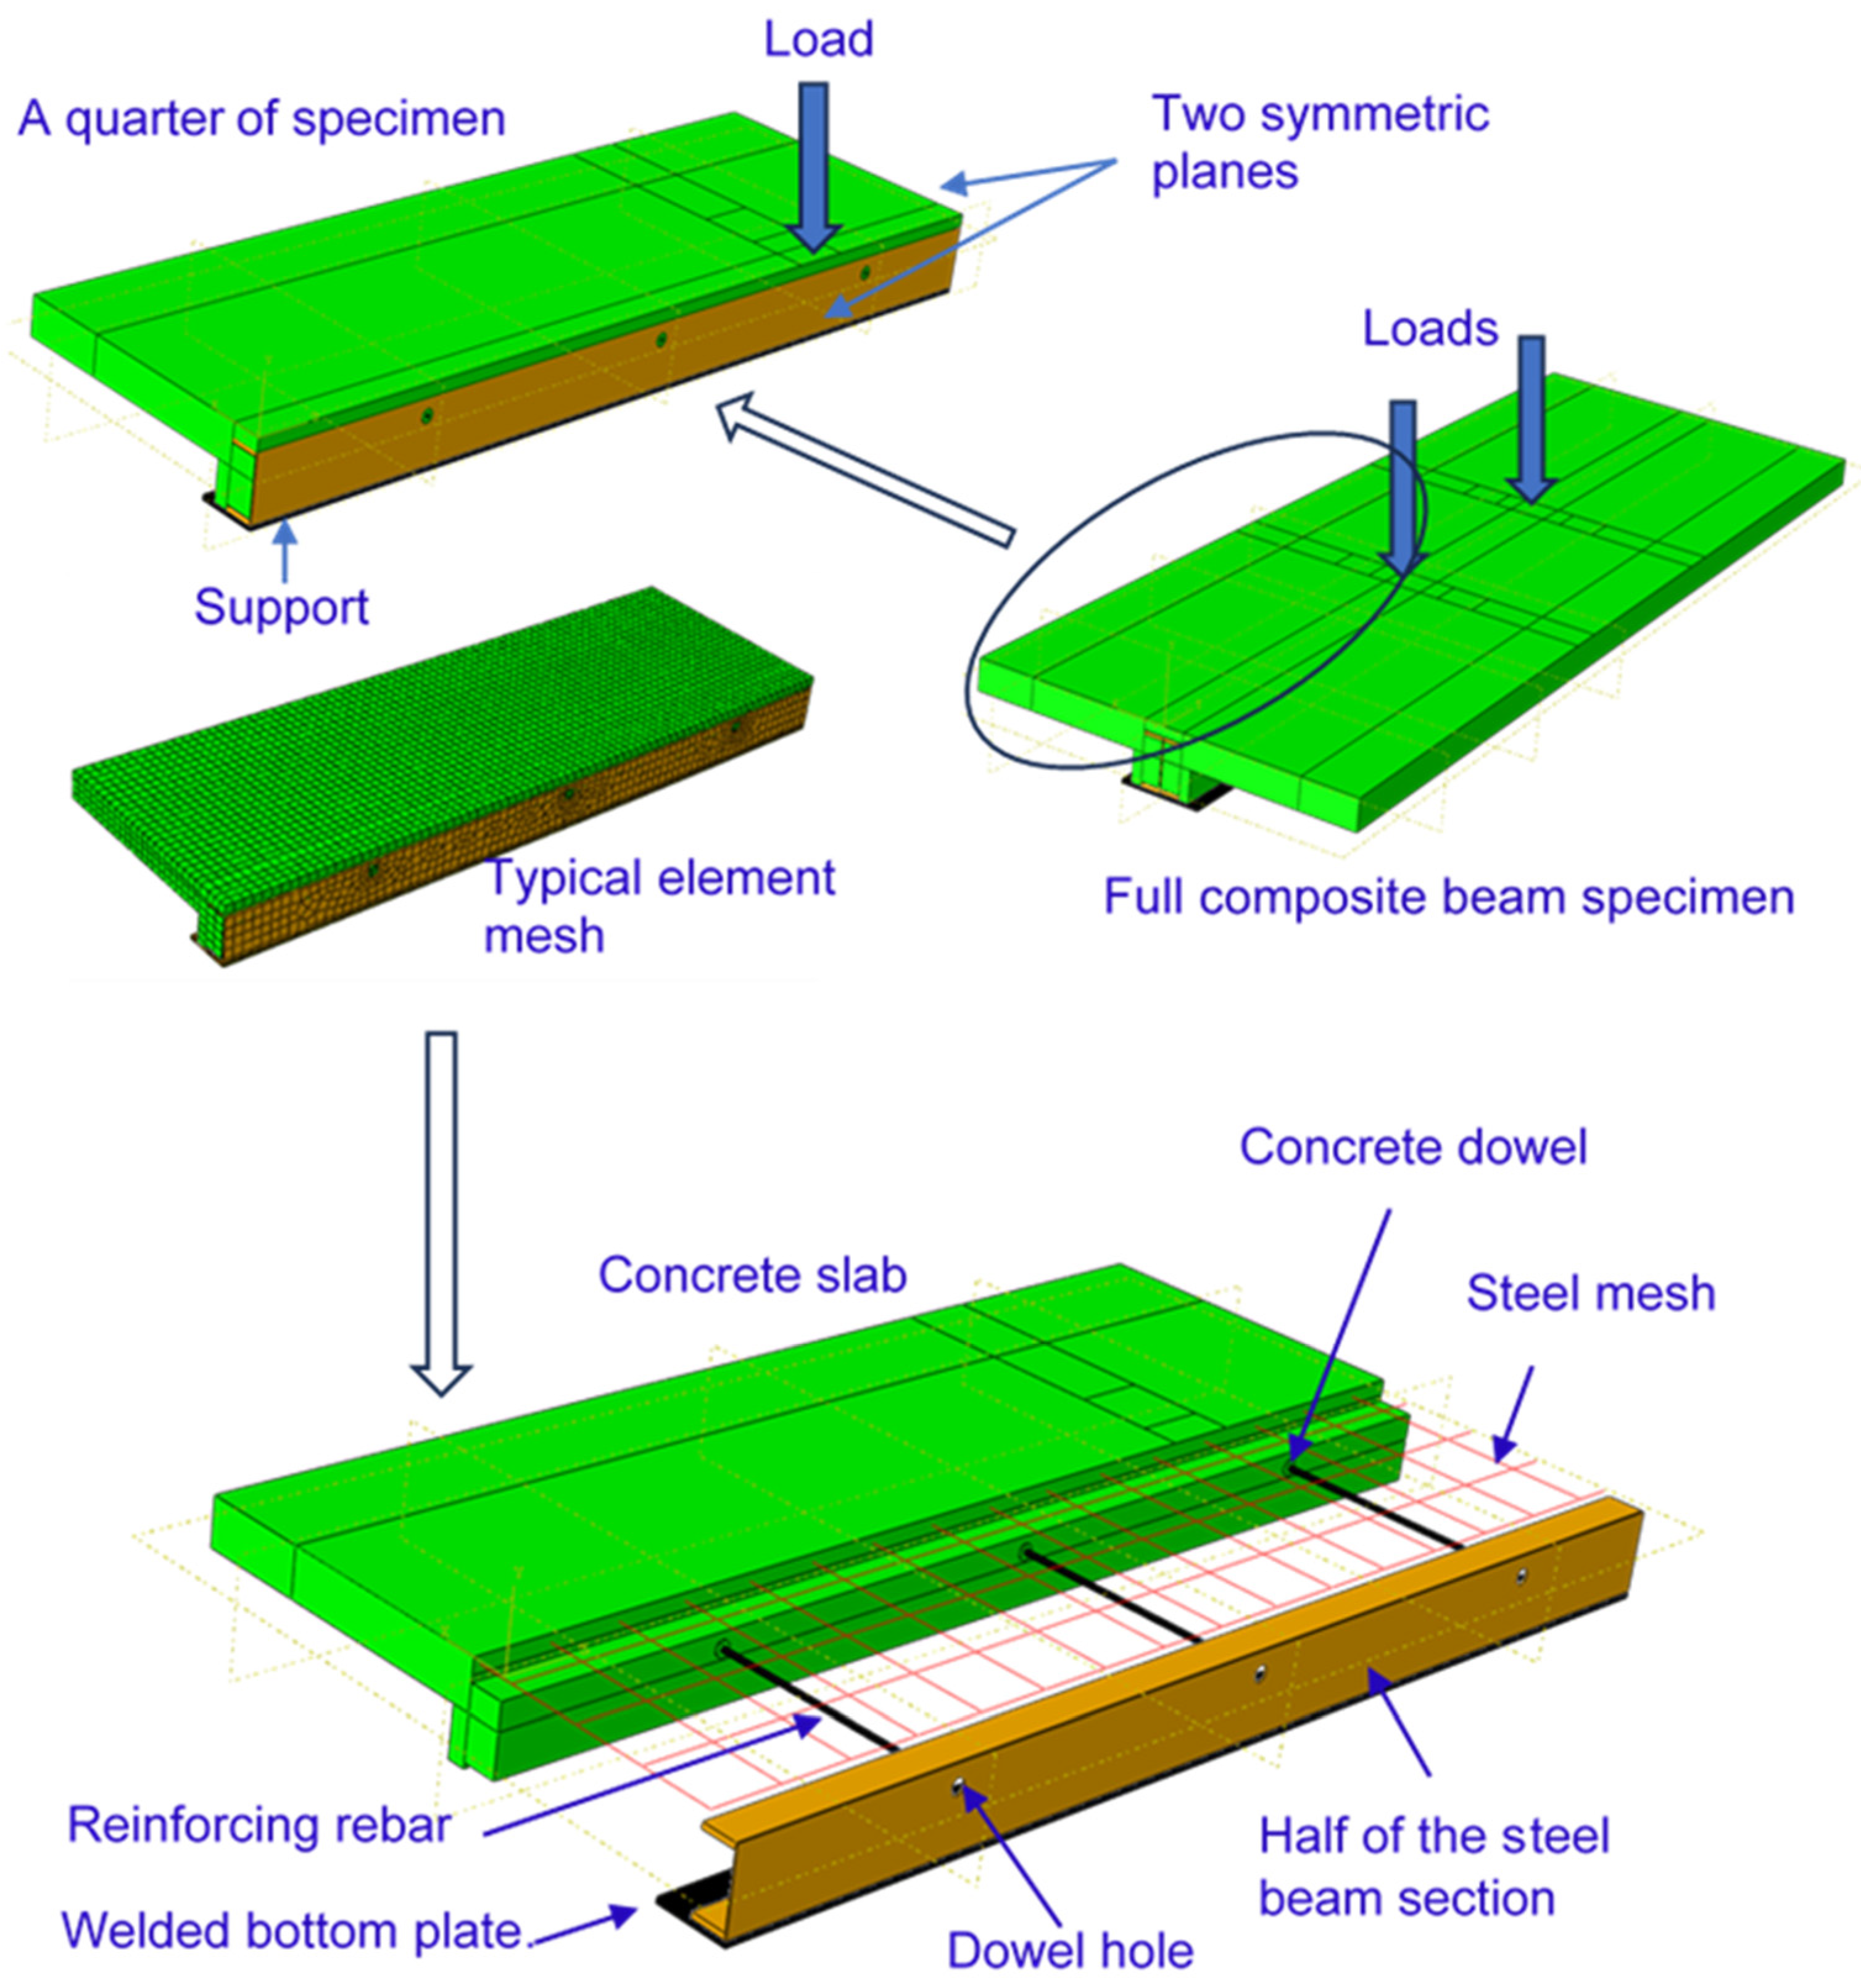
3.1. Description of Finite Element Model

The development of the finite element (FE) model through ABAQUS [24] was based on the test specimens. Considering the symmetrical geometry of the composite beam and to optimise computation time, only a quarter of the test specimen was modelled. The components of the FE model include a concrete slab, a reinforcement steel mesh, a steel beam section with a welded bottom plate, and concrete dowels with or without a reinforcing bar. Test specimen BT4 was utilised to illustrate the development of the FE model. As shown in Figure 2, all components were created separately and then assembled. The model included a steel section (HEB 200) with a 400 × 15 mm steel plate welded to the bottom flange (steel grade S355), a concrete slab with a compressive cubic strength of 43.1 N/mm2 at the time of beam specimen testing, and a concrete dowel with a diameter of 40 mm. The dowel contained a reinforcing bar with a diameter of 16 mm, which passed through the centre of the dowel and had a central spacing of 1000 mm. An A252 steel mesh, with a grid size of 200 × 200 mm and a bar diameter of 8 mm, was placed 20 mm below the top surface of the concrete and above the top flange of the steel beam. The overall length of the composite beam was 6.3 m, with 6.0 m between the two supports. The width of the slab was 1.5 m, with a depth of 120 mm, and the overall depth of the composite beam was 240 mm (comprising a 120 mm upper slab depth and 120 mm formwork with a width of 300 mm).

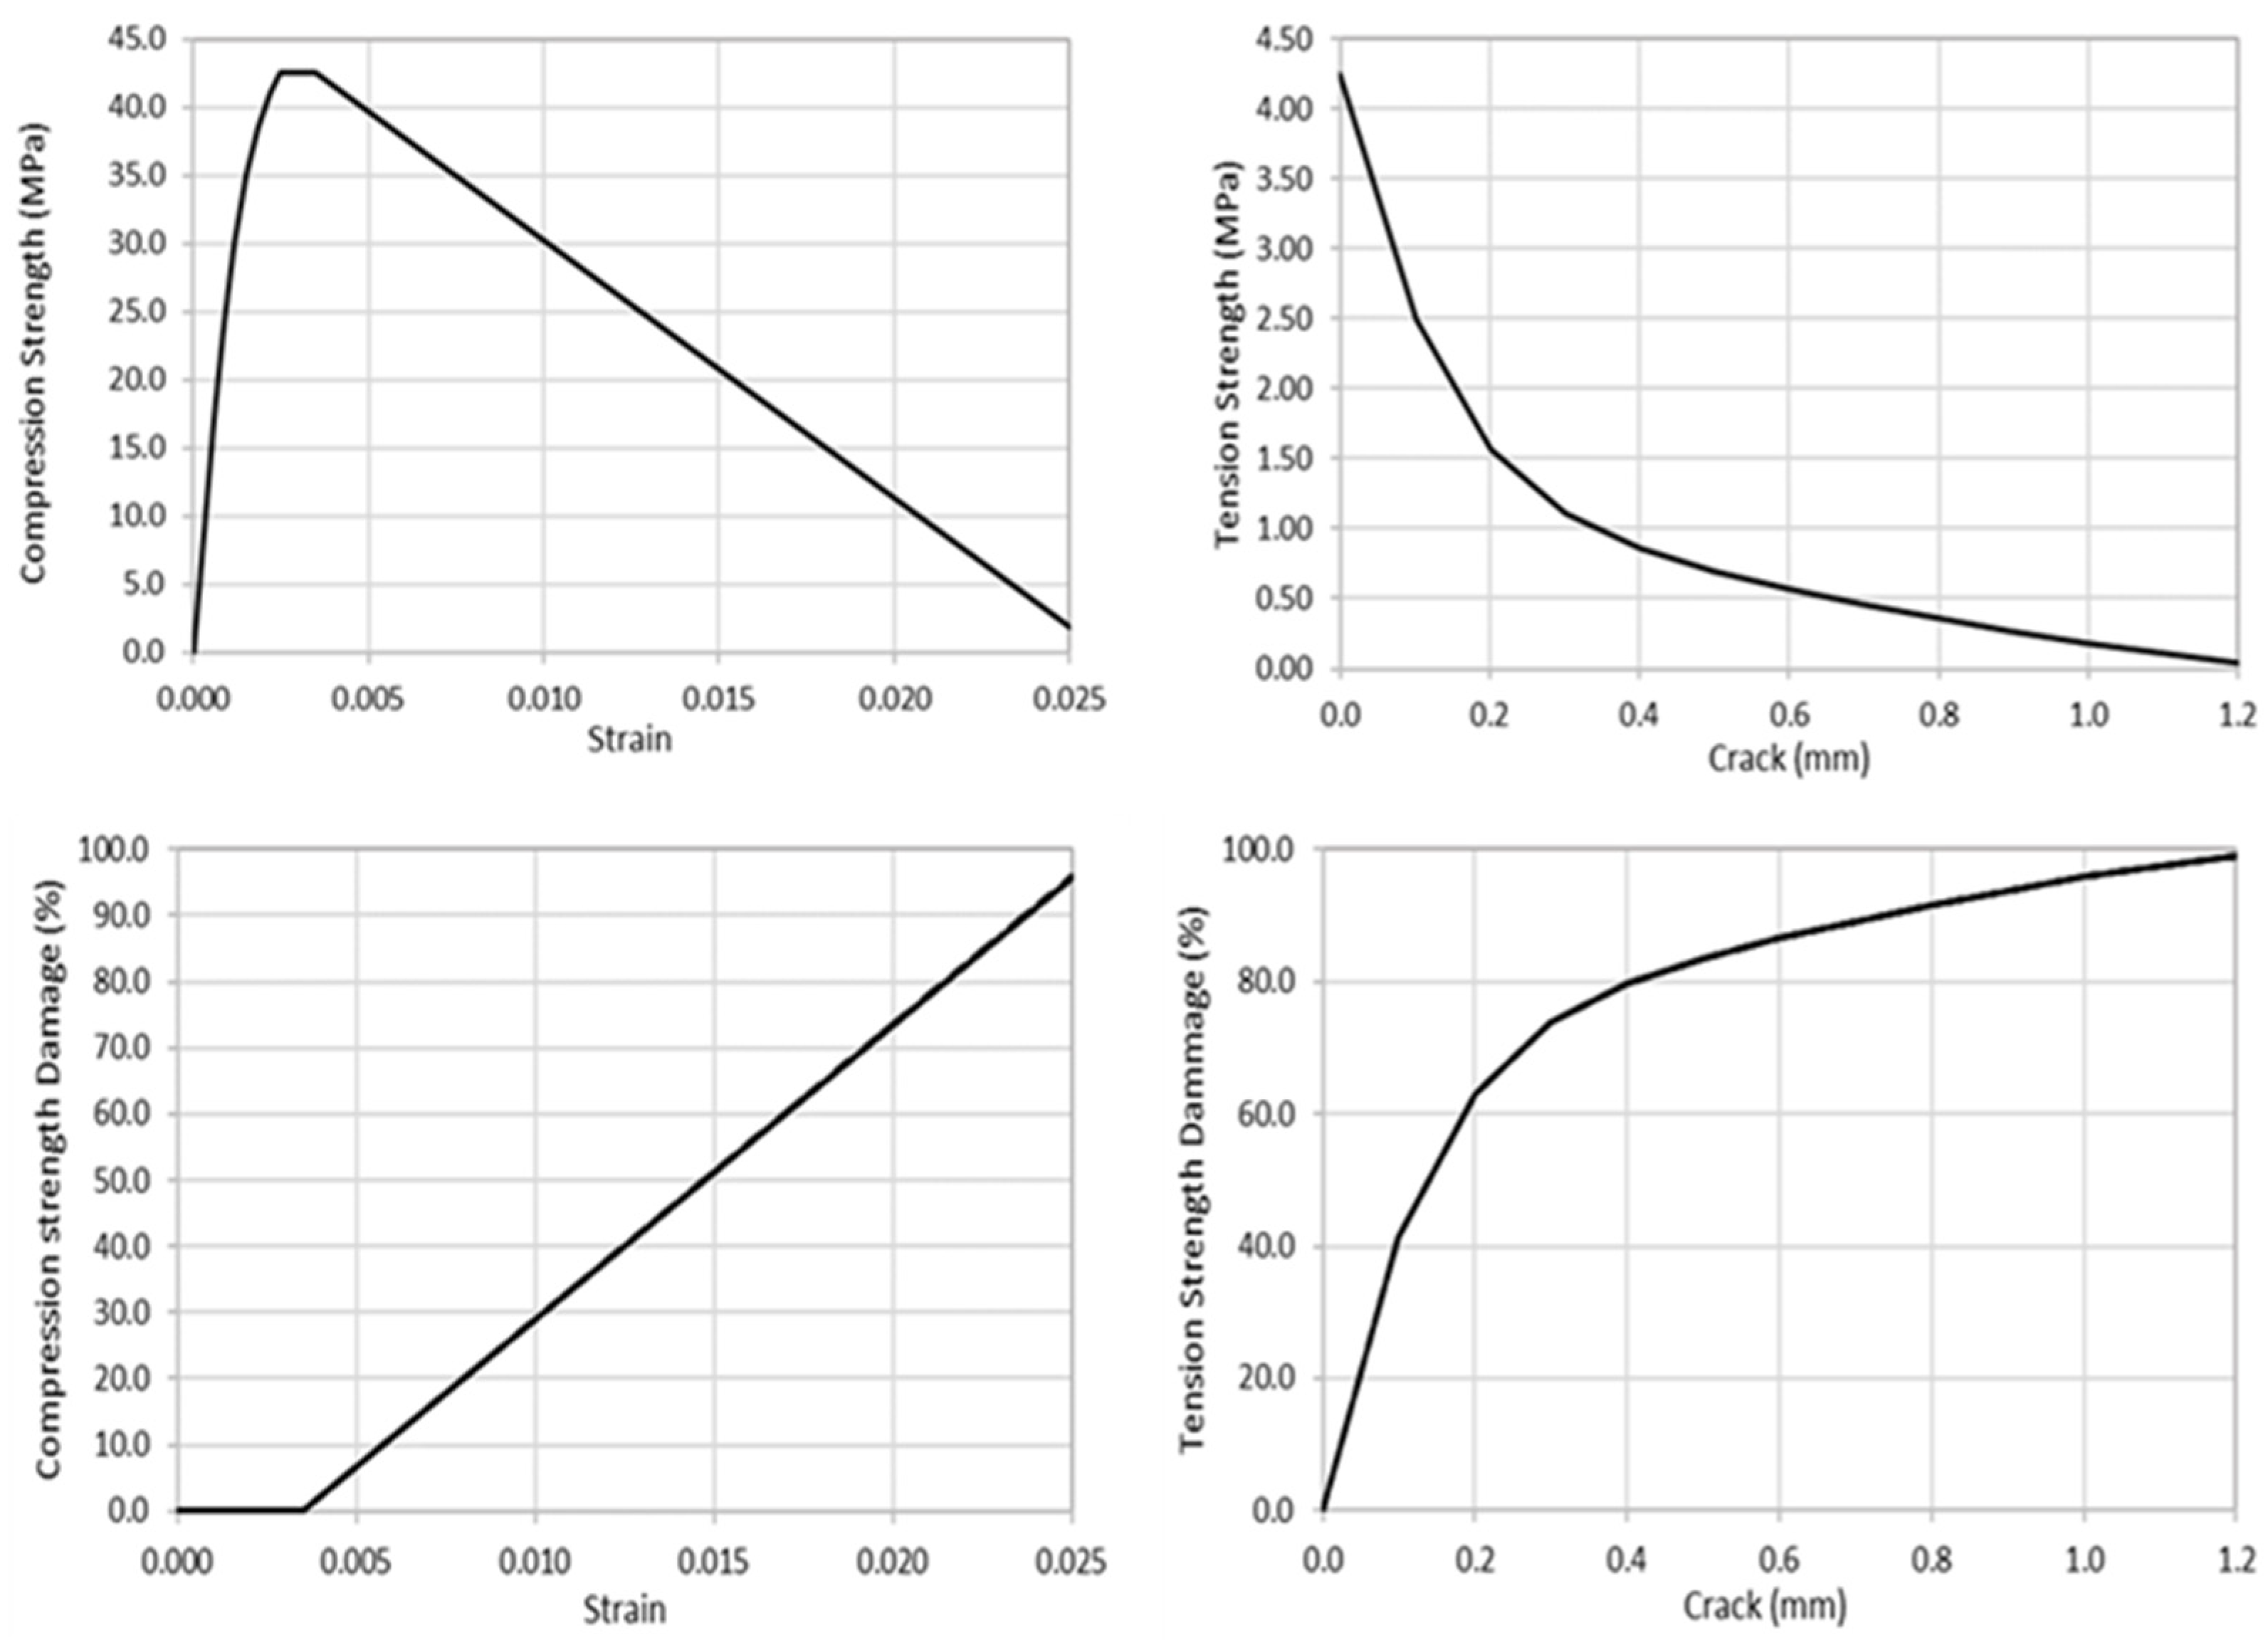
3.2. Material Properties

The elastoplastic bilinear constitutive model was employed for steel materials in the finite element (FE) models. The steel section HEB 200 and the welded bottom plate were made of grade S355, with a yield stress of  f y = 355   N / mm 2 , Young’s modulus of 210 GPa, Poisson’s ratio of 0.3, and a specific density of  7800   kg / m 3 . For the reinforcing bars in the concrete dowels and the steel mesh in the slab, it was assumed that the yield stress  f y = 500   N / mm 2 , Young’s modulus of 210 GPa, Poisson’s ratio is 0.3, and a specific density of  7800   kg / m 3 .
The concrete damage plasticity model was employed in the simulation. The cubic compressive strength of the concrete for the BT4 specimen was measured as 43.1 N/mm2. The cylinder compressive strength of the concrete was assumed to be 80% of the cubic compressive strength, resulting in a value of 34.5 N/mm2. This value was used to calculate the mean compressive strength of the concrete according to Table 3.1 of Eurocode 2 [25], yielding a value of 42.5 N/mm2, which was incorporated into the modelling. The tensile strength of the concrete was assumed to be 10% of the compressive strength, with Young’s modulus calculated at 31.75 GPa. Poisson’s ratio of 0.2 and a specific density of 2400 kg/m3 were also assumed. Figure 3 illustrates the concrete’s mechanical properties and damage mechanisms. In which the compressive vs. strain relation was determined for non-linear structural analysis according to Eurocode 2 [25], and the mechanical mechanism of damage followed the method developed by Qureshi J. et al. [26]. Other parameters utilised for the concrete damage plastic model in the FE model include a dilation angle  θ    = 40°, selected based on a sensitivity study involving angles of 20°, 25°, 30°, 35°, and 40°. The use of 40° yielded the best results when compared to experimental data. The flow potential eccentricity is set at  ϵ  = 0.1, which is the default value in Abaqus. The ratio of initial equibiaxial compressive yield stress to initial uniaxial compressive yield stress is  σ b o / σ c o  = 1.16, also default value in Abaqus. The ratio of the second stress invariant on the tensile meridian to that on the compressive meridian is  K c    = 0.6667, which is the default value in Abaqus. The viscosity parameter is set at  μ    = 0.0003, determined through a sensitivity analysis using values of 0, 0.0001, 0.0003, 0.0005, and 0.001. The choice of 0.0003 effectively suppressed numerical instability and demonstrated good agreement between the modelling results and experimental outcomes.

3.3. Element Type and Mesh

A three-dimensional eight-node solid brick element (C3D8R) was used in the FE model; it has eight nodes and uses reduced integration with hourglass control to prevent shear locking during complex stress simulations. As a solid element, C3D8R excels in simulating structures with non-linear material and contacts, resulting in increased accuracy. Therefore, the C3D8R element was used to mesh the concrete slab, concrete dowel, steel beam, welded bottom plate, and reinforcing rebar in the concrete dowel. Based on a sensitivity analysis of element size, a compatible size of hexahedral mesh elements was determined for the concrete slab and steel beam; the general dimension was 45–50 mm in the axial direction and 30–35 mm in the transverse directions. The selected mesh sizes prevented mesh failure and ensured that the coupling between each mesh was effective, and a satisfactory result was obtained compared with the experimental results. Because of the high stress and complicated contact near the shear connector, smaller hexahedral elements were used for the dowel and its surroundings to make sure the model worked well and provided accurate simulation results. A two-node truss element (T3D2) was used to simulate the reinforcement steel mesh in the slab. Figure 2 displays a typical specimen mesh.

3.4. Interaction and Constraint

For this type of composite slim-floor beam, the main shear resistance between steel and concrete is achieved by shear connectors and shear bond/friction between the concrete surface and the steel surface. The interaction between the dowel concrete and reinforcing rebar also affects the shear resistance of the dowel connector; therefore, the modelling of these interactions and constraints may have a substantial influence on the FE model and result in accuracy.
To simulate the interaction between the steel and concrete components, surface-to-surface contacts were defined. Normal contact property and tangential contact property were assigned to surface-to-surface contacts. Contact in the normal direction was considered as hard contact, which allows no penetration between the master surface and the slave surface. Penalty friction behaviour was adopted to define the friction interaction between the contact of the concrete element and steel element. A range of friction coefficients from 0.1 to 0.5 was considered in the sensitivity analysis, and 0.15 was found to obtain the best accuracy. So, for the interactions between the steel beam and concrete slab, dowel concrete, and reinforcing rebar, hard contact was used in the normal direction, and a penalty friction of 0.15 was applied in the tangential direction. To simplify the simulation, the reinforcement steel mesh was embedded in the concrete slab. The steel plate was tied to the steel beam section to model the bottom plate welded to the bottom flange of the steel section.
Specimen BT7, which utilised horizontal shear studs, is different from other specimens that either used dowel shear connectors or had no shear connector at all. In the FE model, the shear studs were embedded into concrete, and the bottom of the stud was tied to the steel beam web to simulate horizontal studs welded to the web of the steel section.

3.5. Loading and Boundary Conditions

Figure 2 illustrates the application of two identical point loads to the specimen, reflecting the centric loading regime. In the FE modelling, two compressions were applied at the top of the concrete slab on an area of 150 × 150 mm by coupling, similar to the hydraulic actuators loading the specimen through two 150 × 150 × 40 mm steel plates. Like the experimental study, the distance from the loading centre to the nearest support was 2250 mm (as shown in Figure 1). The beam support positions were located at the welded plate and 150 mm away from the ends of the composite beam. Since the shape is symmetrical, only a quarter of the composite beam was modelled; the support’s movement in the transverse direction was restrained, and two symmetrical planes were assigned along the central lines in the quarter model to reflect the symmetric conditions, as shown in Figure 2.

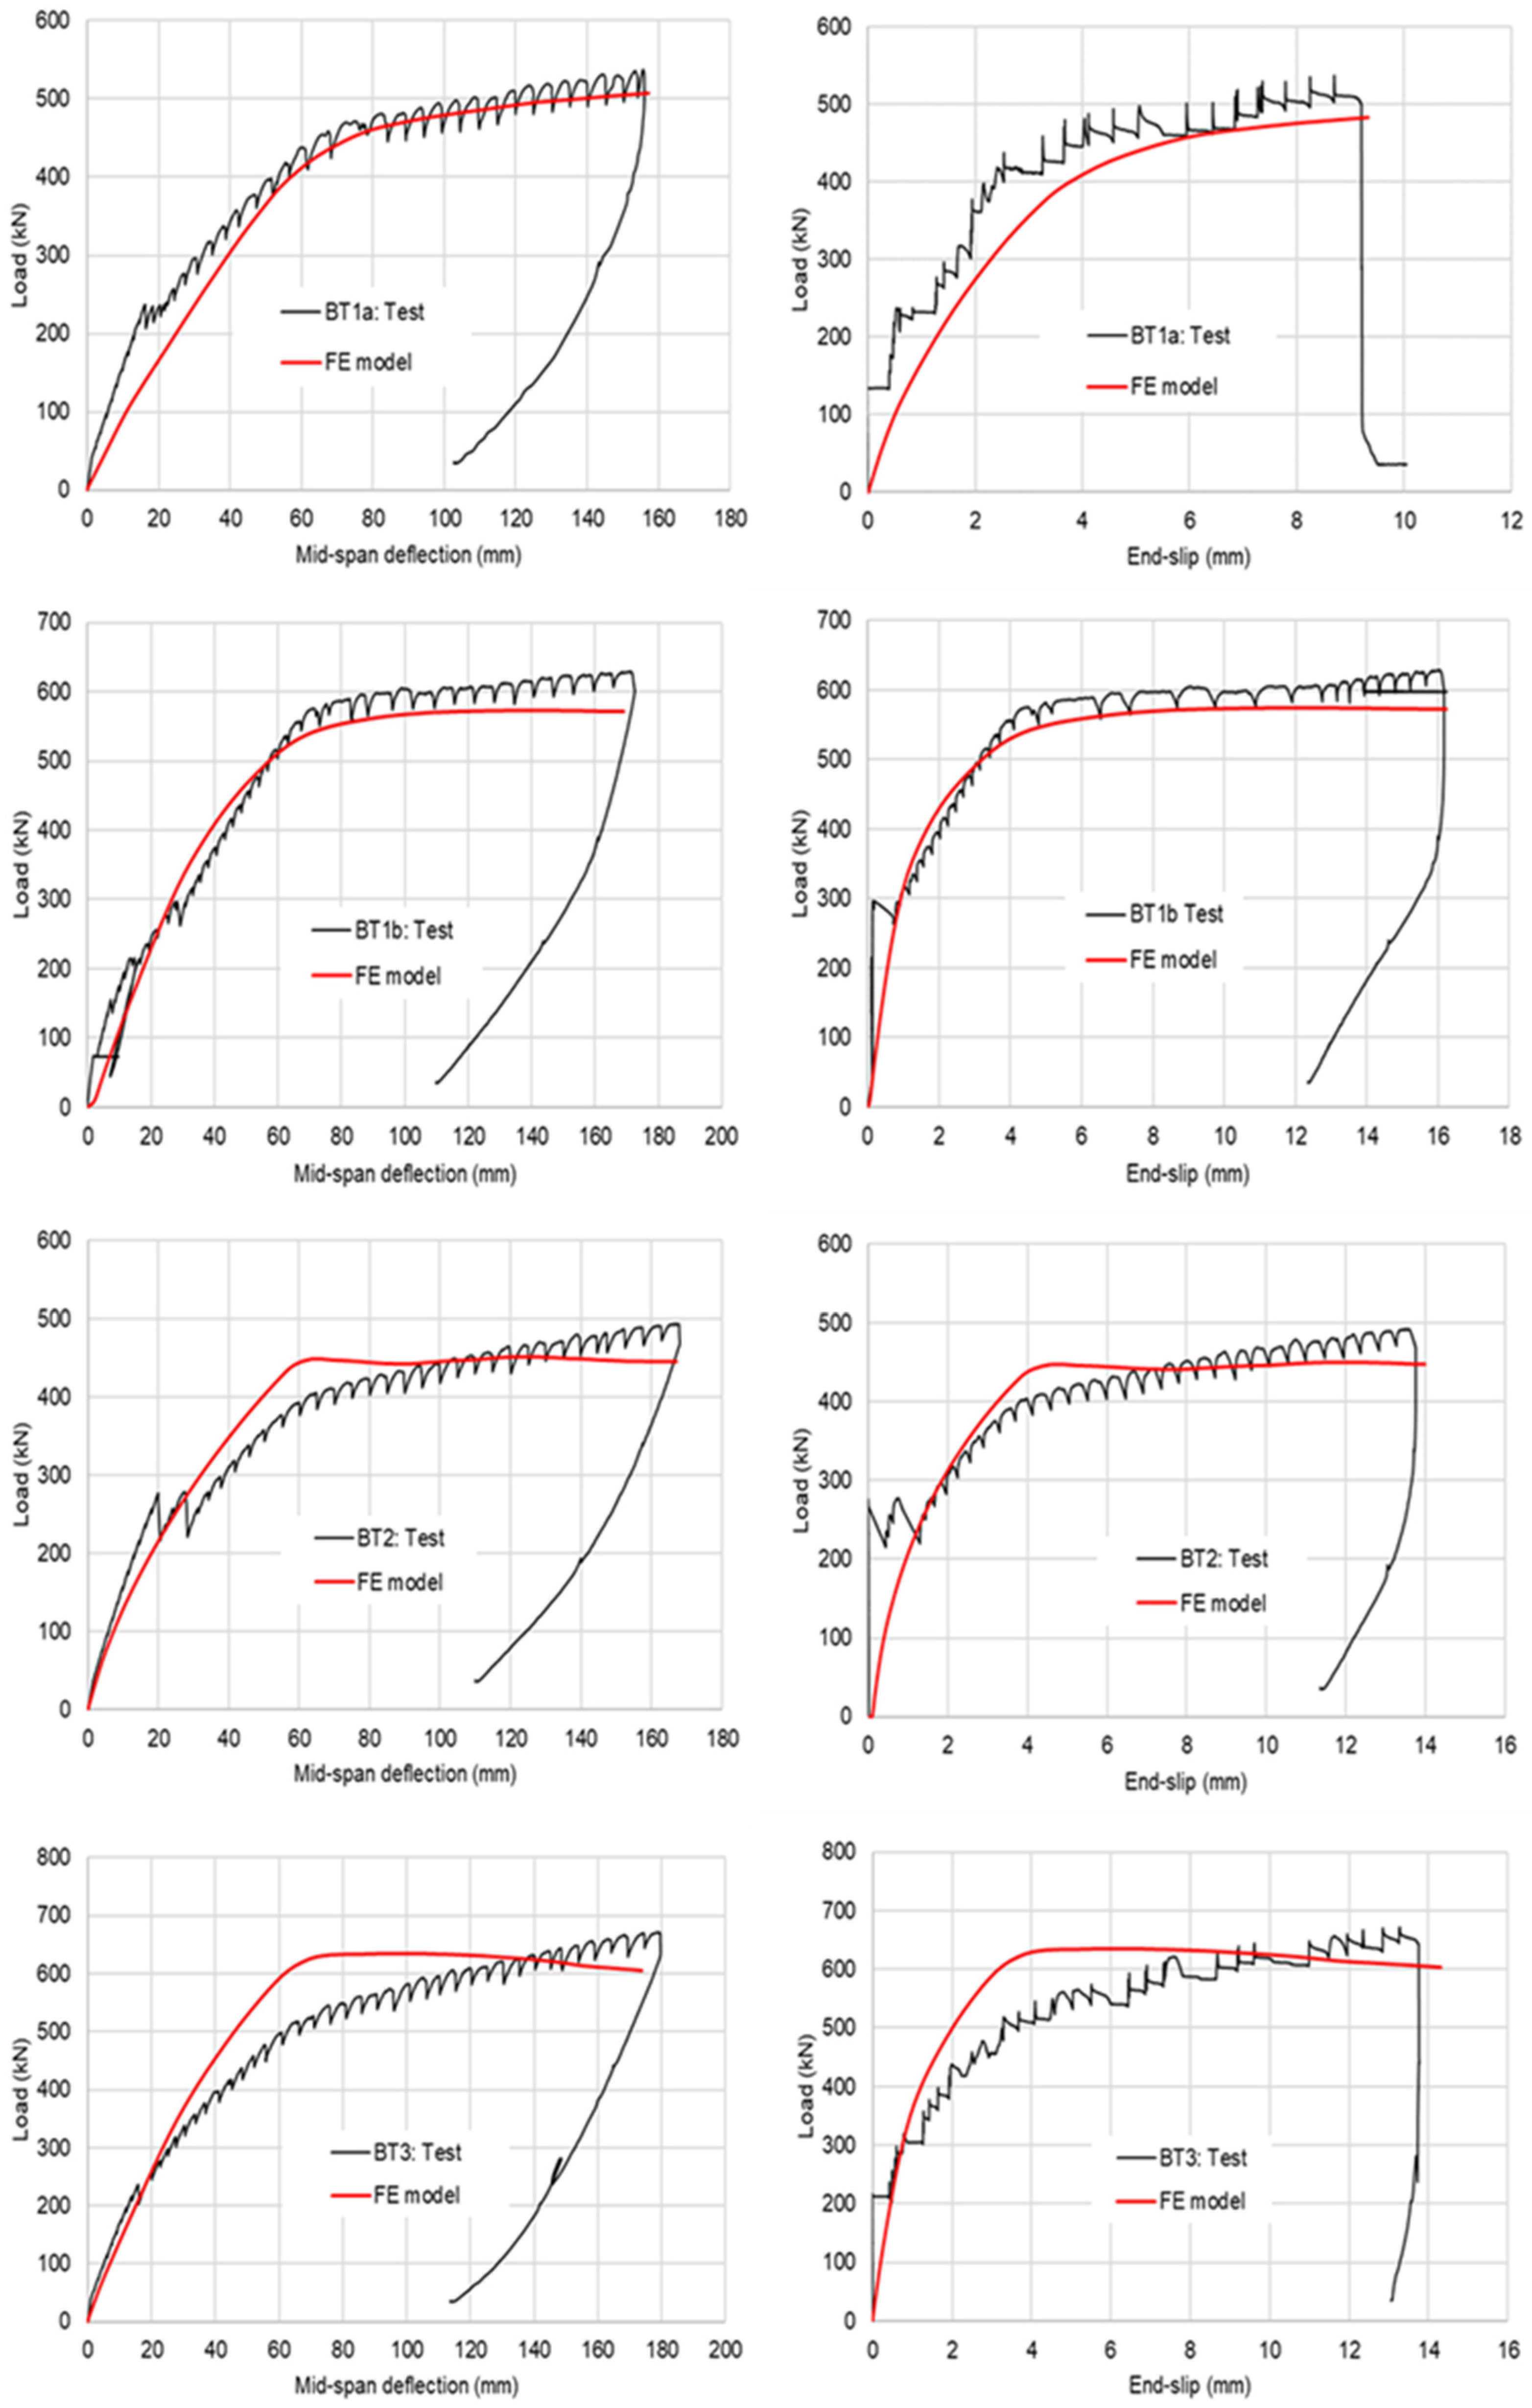
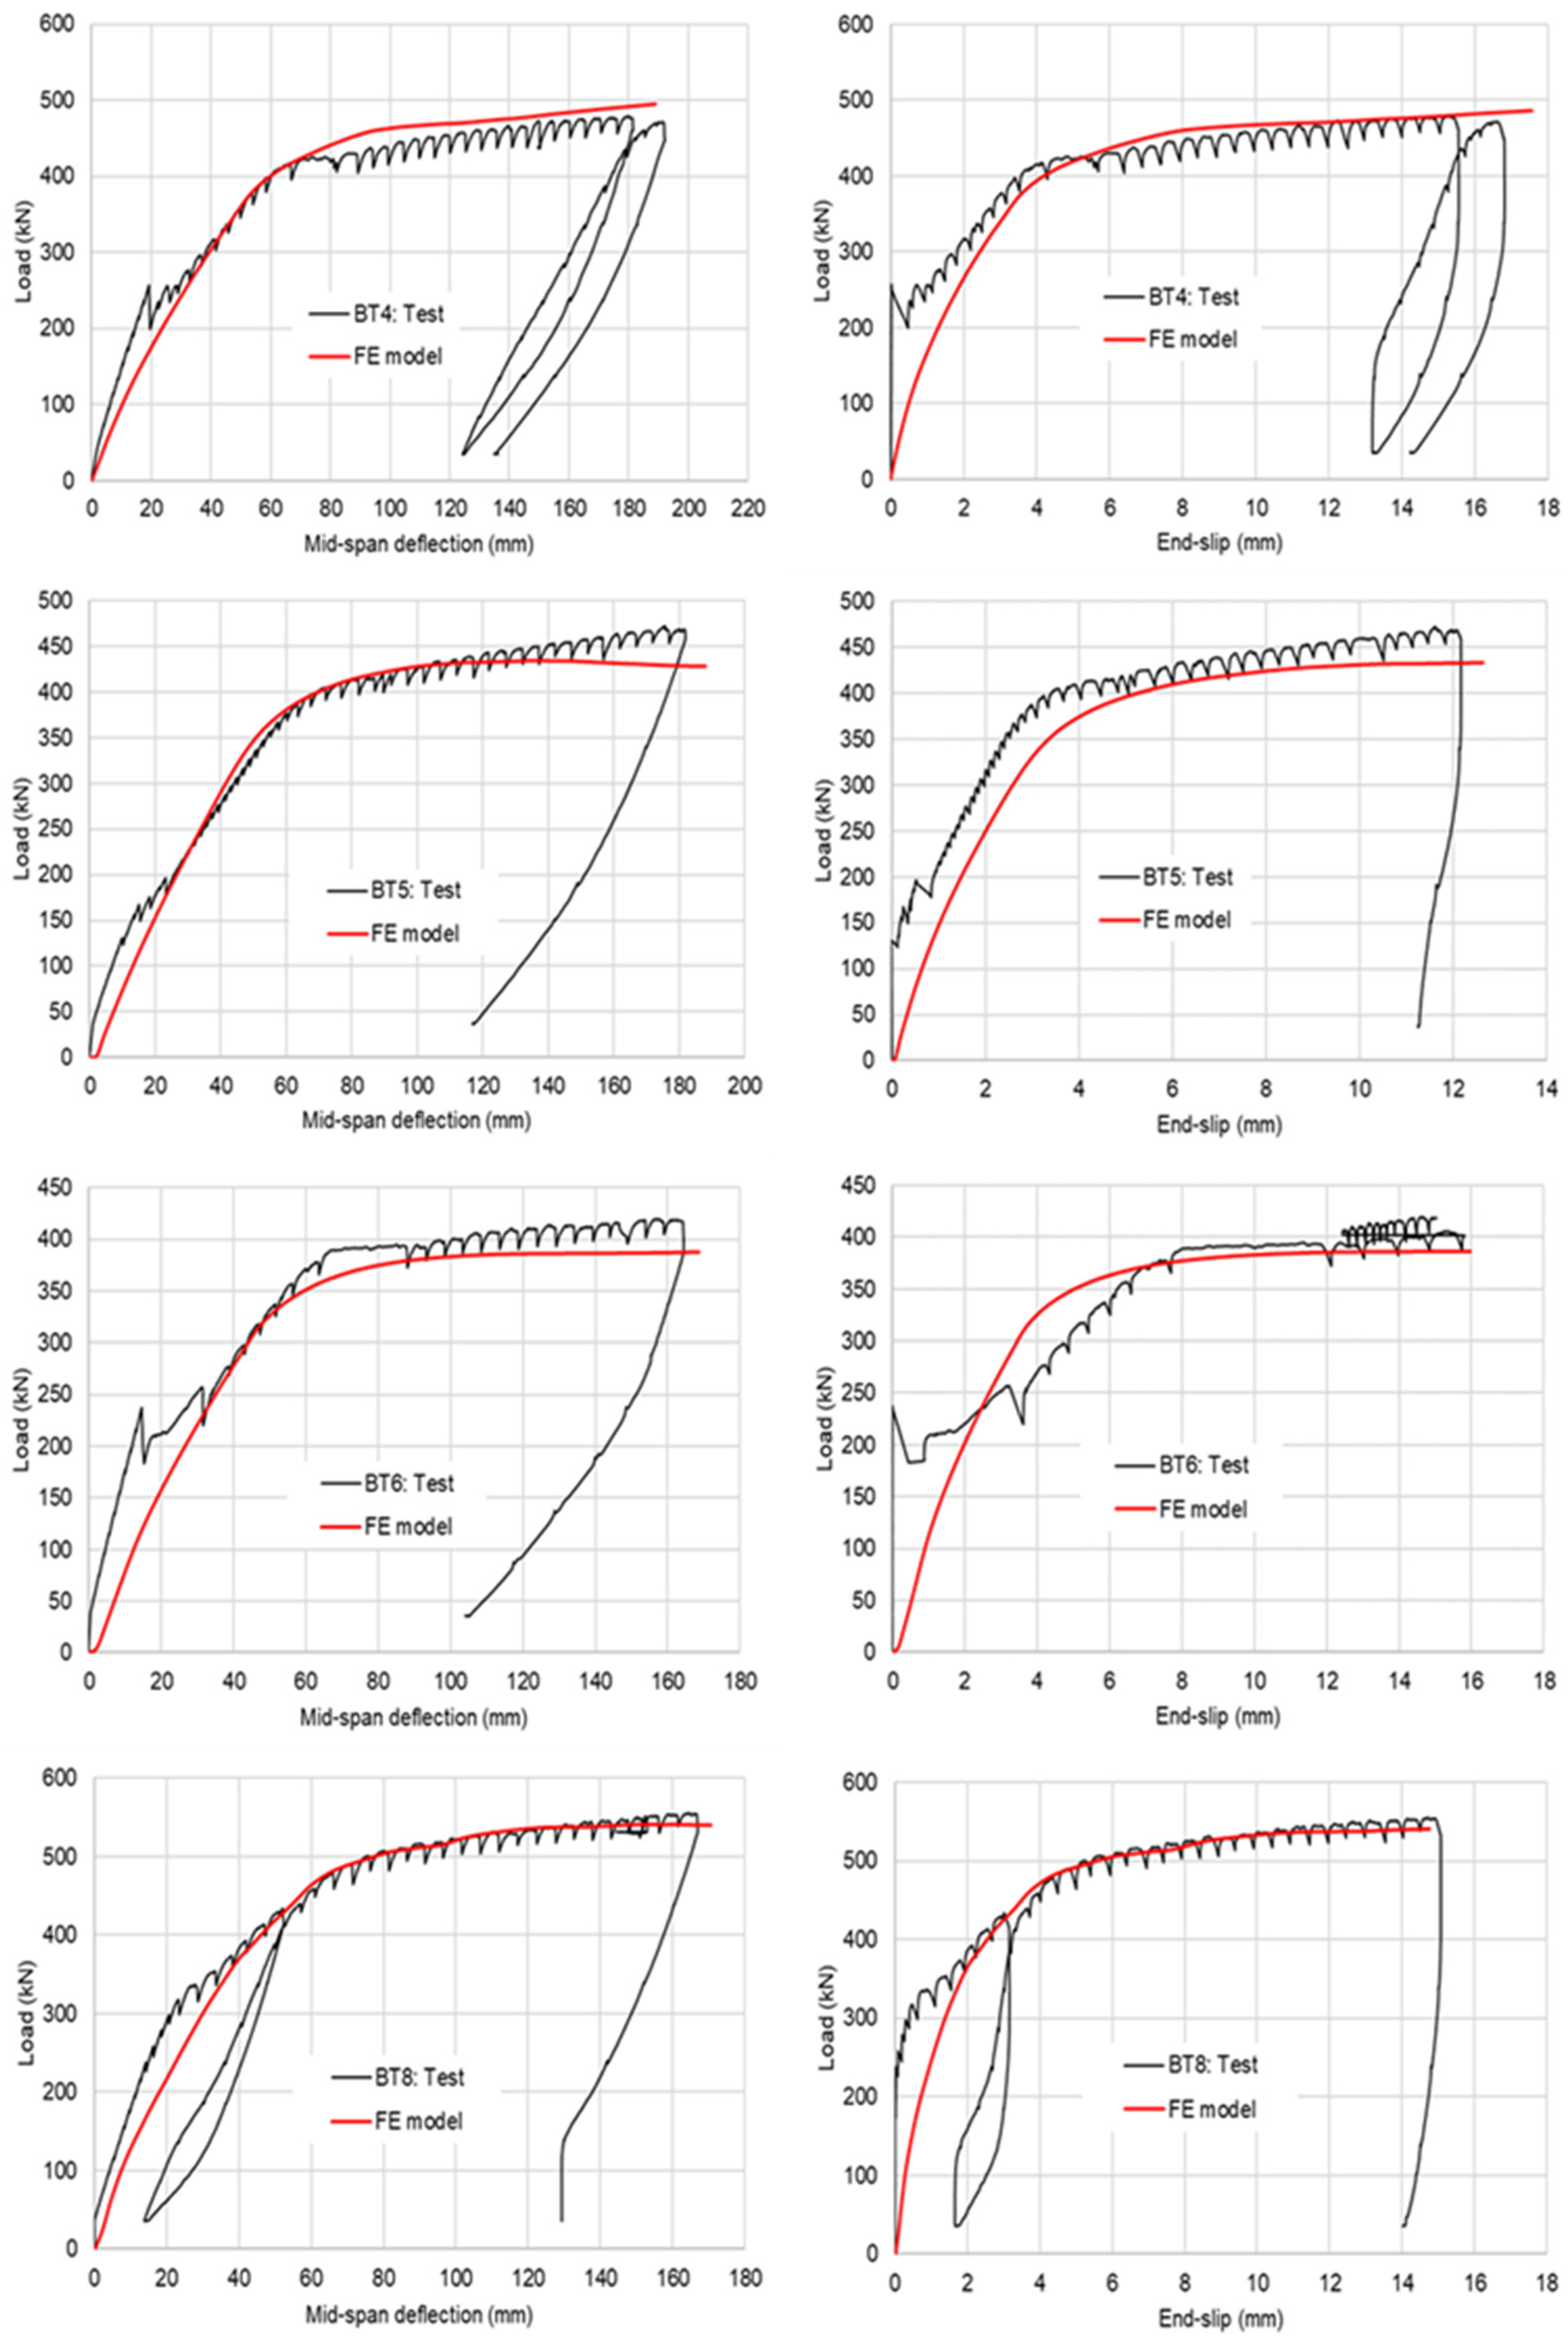
3.6. Validation of FE Model

Simulation results were compared to the experimental results to validate the FE models. Figure 4 shows comparisons of load vs. mid-span deflection and load vs. end-slip relationships of tested specimens. Good agreements were achieved for most specimens, although for some specimens the FE modelling did not fully reproduce the load vs. mid-span deflection or load vs. end-slip curves obtained from the experimental study. Such as in specimens BT2 and BT3, the FE modelling results show that the highest load-bearing capacity occurred at 60–80 mm mid-span deflection, but this is different from experimental observation in which the mid-span deflection was much higher. This is possibly due to the material properties of concrete adopted in modelling not fully reflecting the real concrete properties of the tested specimens. In some specimens, the load vs. end-slip curve shows a difference between the test and model at the early loading stage. This is likely due to the interacting mechanism discrepancy in the test specimens and the FE model. In tests, the end slips only occurred when the bond resistance and static friction resistance between steel and concrete contacts were overcome, but this mechanism could not be simulated in the FE model. It can be seen from Figure 4 that the bond resistance and static friction resistance between steel and slab were overcome by applied loads from 120 kN to 250 kN. This value changed from specimen to specimen. When the shear load is lower than this shear resistance, there is no visible end-slip between the steel section and concrete slab. The bond resistance and static friction resistance also show their impact on the load through mid-span deflection curves, where the stiffness slightly drops, and some load changes are noticeable. The test devices’ (LVDTs) accuracy may also explain why they were not sensitive enough to record the small slip at the start of the test when the load was small. However, in numerical modelling, both bond resistance and friction resistance between the steel section and concrete were reflected by the contact surface interaction property adopted; the contact shear resistance exists once the normal contact compressive force is above zero.
Table 2 summarises the maximum loads and loads corresponding to 6 mm end-slip obtained from tests and predicted by FE modelling. In addition, loads corresponding to mid-span deflection of 30 mm (L/200) and 60 mm (L/100) are given in the table. The ratios of experimental results to modelling results are in the range 0.8–1.2; the average ratio ranges from 0.95 to 1.06 with a standard deviation of 0.01 to 0.11. Obviously, the discrepancy is within an acceptable range.
Figure 5 and Figure 6 compare the deformation and failure modes of a typical composite beam predicted by modelling and observed from the experimental study. The prediction of the concrete slab crack position, distribution pattern, and end-slip between steel and concrete was reasonable. The predicted concrete cracks (identified by tensile damage) shown on the slab through modelling well corresponded to the cracks observed in the vicinity of the loading position during testing. The end-slip between the steel section and concrete was also accurately reproduced in the modelling.
The validation and comparison show that the FE model can accurately predict load capacity, vertical deflection, concrete cracking, end-slip between the concrete and steel section, etc. The effectiveness and feasibility of the modelling method are clearly demonstrated. This supports the development of the FE model and the modelling method being employed for the parameter study of similar slim-floor composite beam systems.

4. Parametric Study

The validation in the aforementioned section confirmed that the developed FE model can successfully capture the key structural behaviours of the flexural composite slim-floor beams that utilise dowel shear connectors and suggested the use of the developed FE model for parametric study. The parametric study in this paper encompasses various dowel diameters, concrete strengths, reinforcing rebar diameters, and dowel central spacings. Test specimens BT4 and BT8 were selected as basic specimens, with component parameters altered to investigate their effects on the structural performance of these composite beams. For composite beams that were based on specimen BT4, the diameters of the concrete dowels were 0 mm (no dowel), 40 mm, 50 mm, 60 mm, and 70 mm; the concrete strengths included C20/25, C30/37, C40/50, and C50/60; the diameters of the reinforcing bars were 0 mm (no reinforcing rebar), 12 mm, 16 mm, 20 mm, and 24 mm; and the distances between dowels were set at 250 mm, 375 mm, 500 mm, and 1000 mm. For composite beams originating from specimen BT8, the concrete dowel sizes were 0 mm (no dowel), 40 mm, 60 mm, 80 mm, 100 mm, and 120 mm; the concrete strength grades were the same as those for specimens based on BT4; the reinforcing rebar sizes were 0 mm (no rebar), 12 mm, 16 mm, 20 mm, and 24 mm; and the distances between dowels were 125 mm, 250 mm, 375 mm, 500 mm, and 1000 mm. The following sections explain the effects of various parameters on the structural behaviours of flexural composite slim-floor beams.

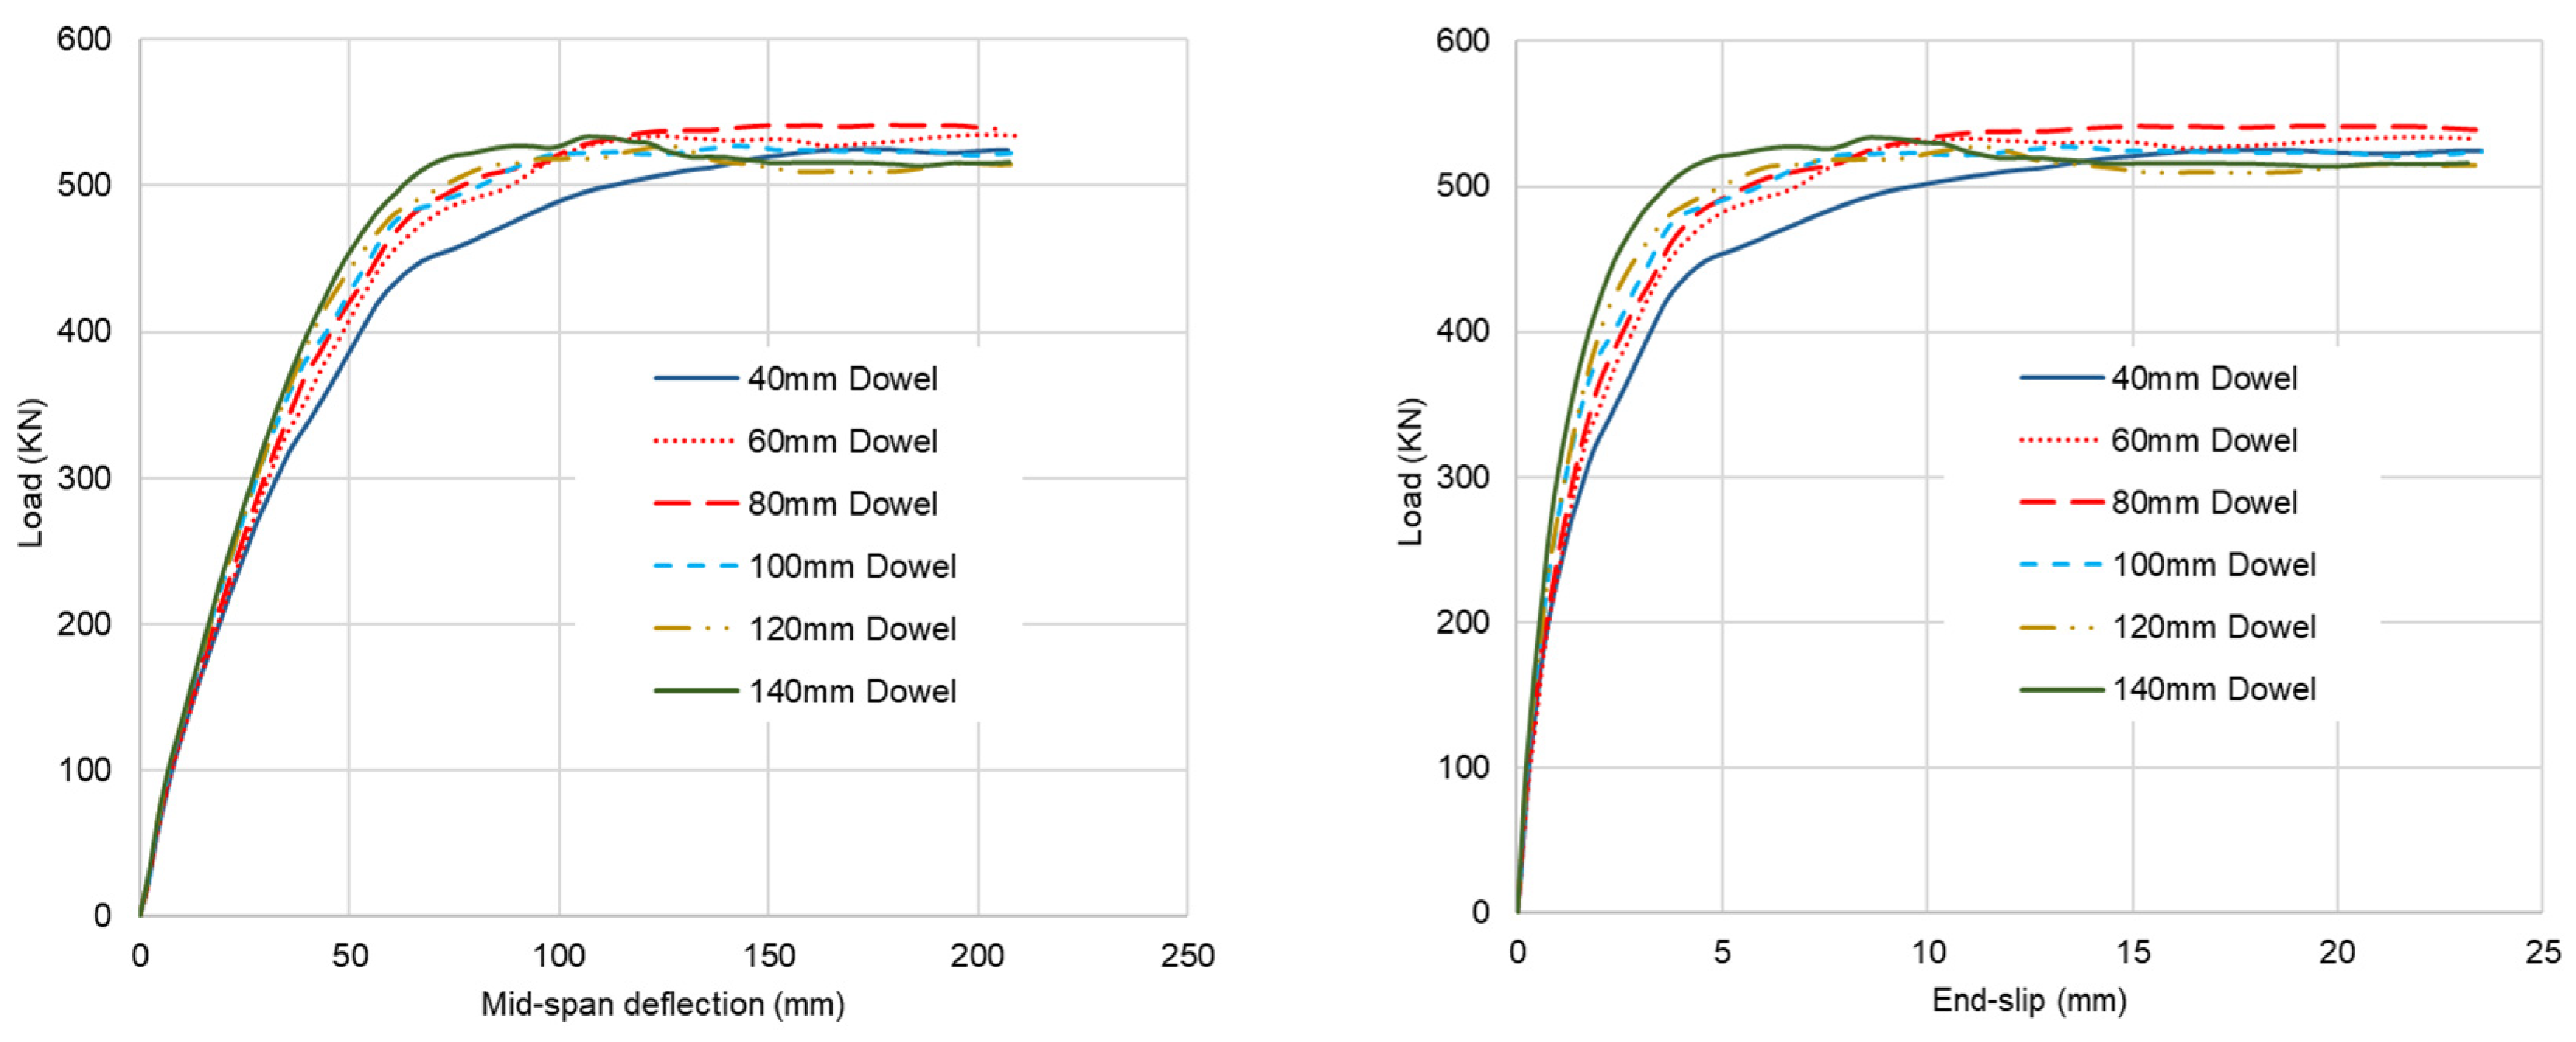
4.1. Effect of Concrete Dowel Diameter

Figure 7 and Figure 8 compare the effect of concrete dowel diameters on the structural performance of composite beams with varying dowel diameters. In composite beams utilising a concrete dowel with a reinforcing bar (Figure 7), the maximum load increased with the dowel’s diameter, although the increase in stiffness was marginal. For composite beams featuring larger dowels, the load-bearing capacity declined more rapidly after reaching the maximum load. When the middle span deflection exceeded 150 mm, the strength of composite beams with larger dowels, such as 60 and 70 mm, seemed to be worse than that of composite beams with smaller dowels. This can be explained as a larger opening on the web to accommodate a larger dowel may lead to a reduction in the resistance of the steel section. While a direct relationship between dowel diameter and load-bearing capacity cannot be conclusively established, it is evident that concrete dowels have a considerable impact on the structural behaviour of this type of composite beam. A similar trend was observed for composite beams using concrete dowel shear connectors without reinforcing rebar (Figure 8); however, the increase in load capacity with larger diameters is less pronounced compared to those composite beams with reinforcing rebar in the dowel. It appears that a dowel with an 80 mm diameter provides the highest load capacity. When the dowel diameter exceeds 80 mm, the load-bearing capacity of composite beams decreases after reaching the maximum load. The comparison and analysis indicate that a bigger dowel diameter improves shear resistance but reduces the load-bearing capacity of the steel section, so it is important to consider the best dowel diameter when designing.
Irrespective of whether there is reinforcing rebar in the dowel, the midspan deflection corresponding to the maximum load exceeded 100 mm, or L/60 mm. Most modelled composite beams demonstrated a stable load-bearing capacity until midspan deflection over 200 mm, or L/30 mm. Although for some composite beams with larger dowels, the load-bearing capacity decreased after reaching the maximum value, the reduction is less than 15%. Regrettably, all runs were terminated when the midspan deflection slightly exceeded 200 mm. Regarding sliding behaviour, the end slip between concrete and steel is greater than 8 mm at the maximum load. It is greater than the minimum requirement of 6 mm according to Eurocode 4 [6]. All composite beams with different dowel sizes displayed excellent ductility.

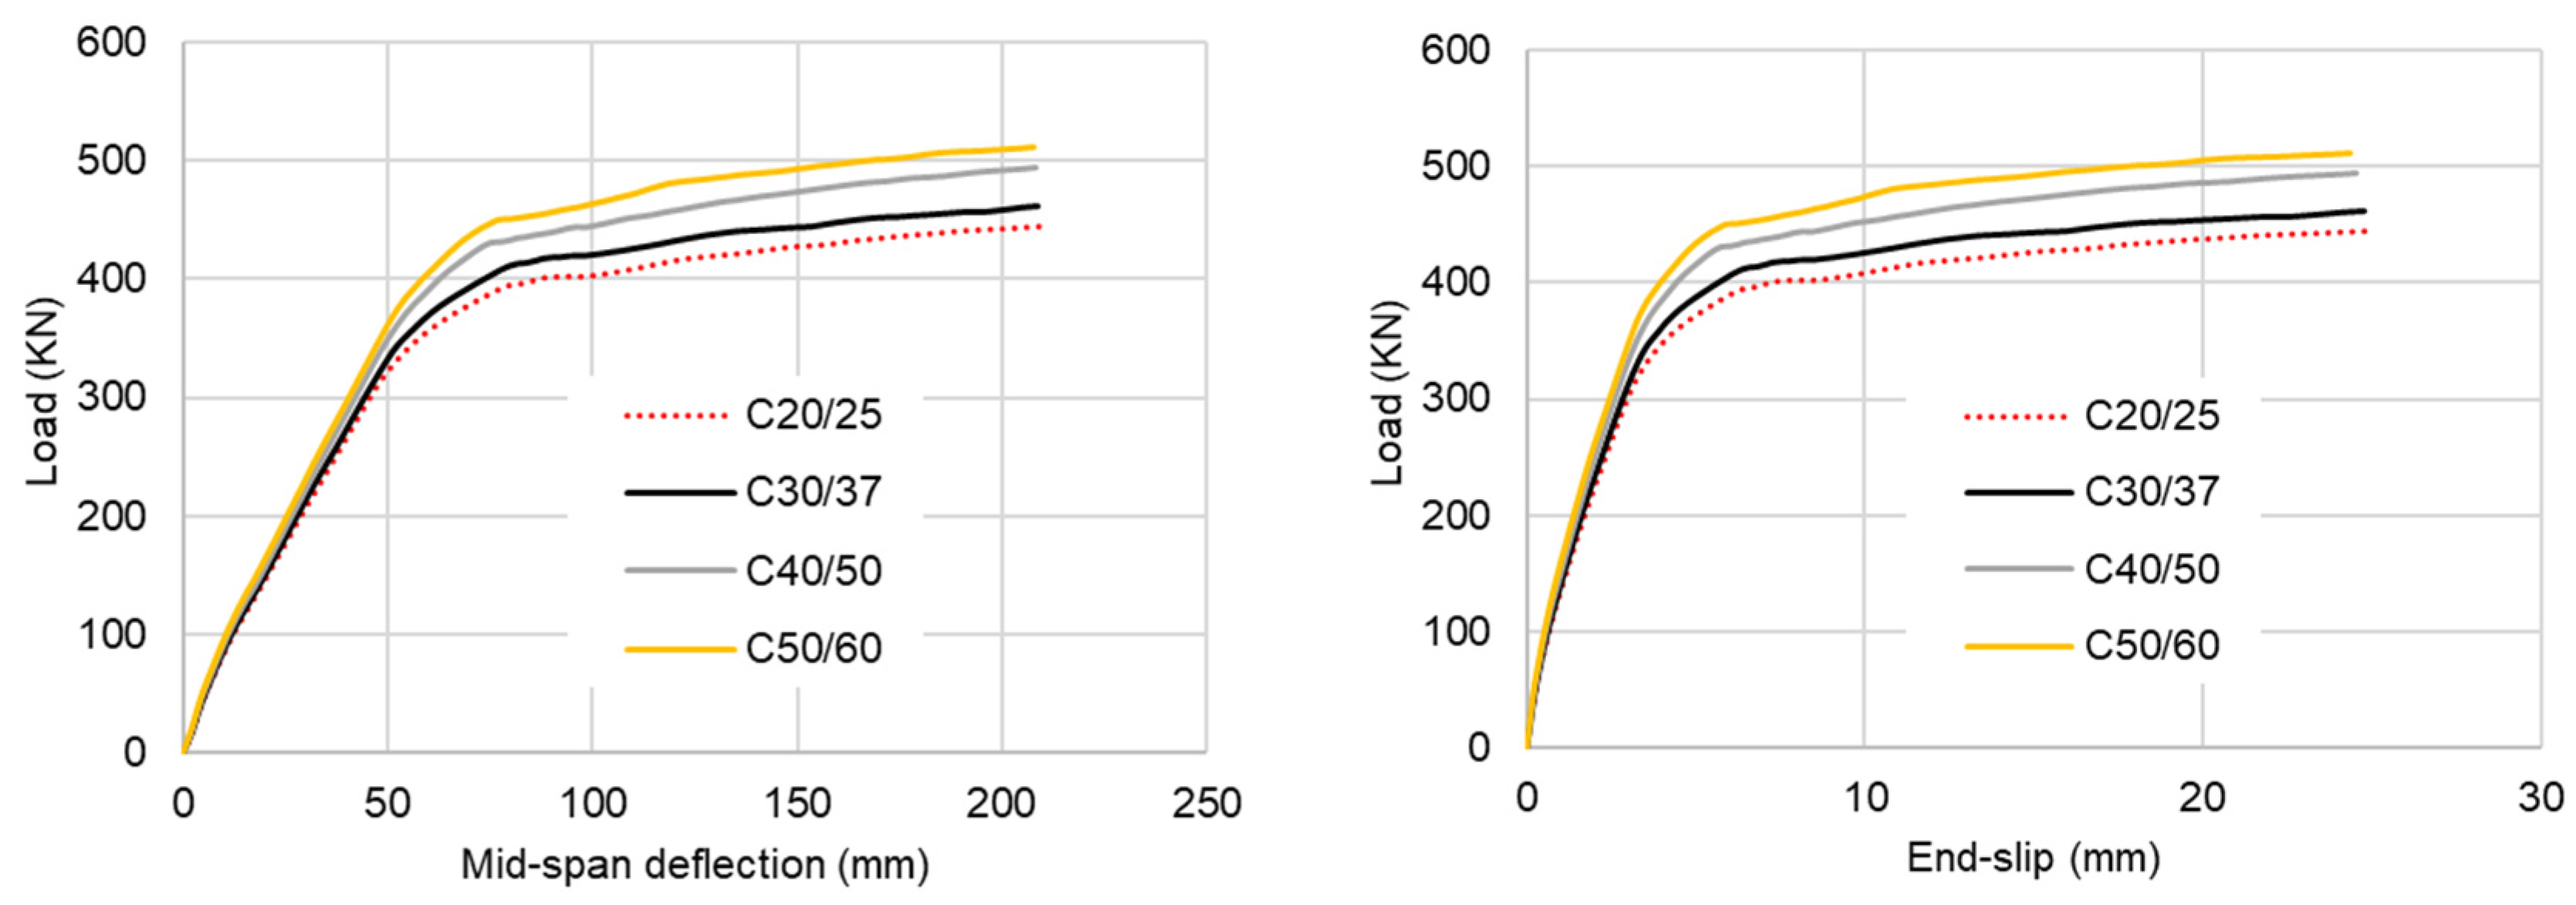
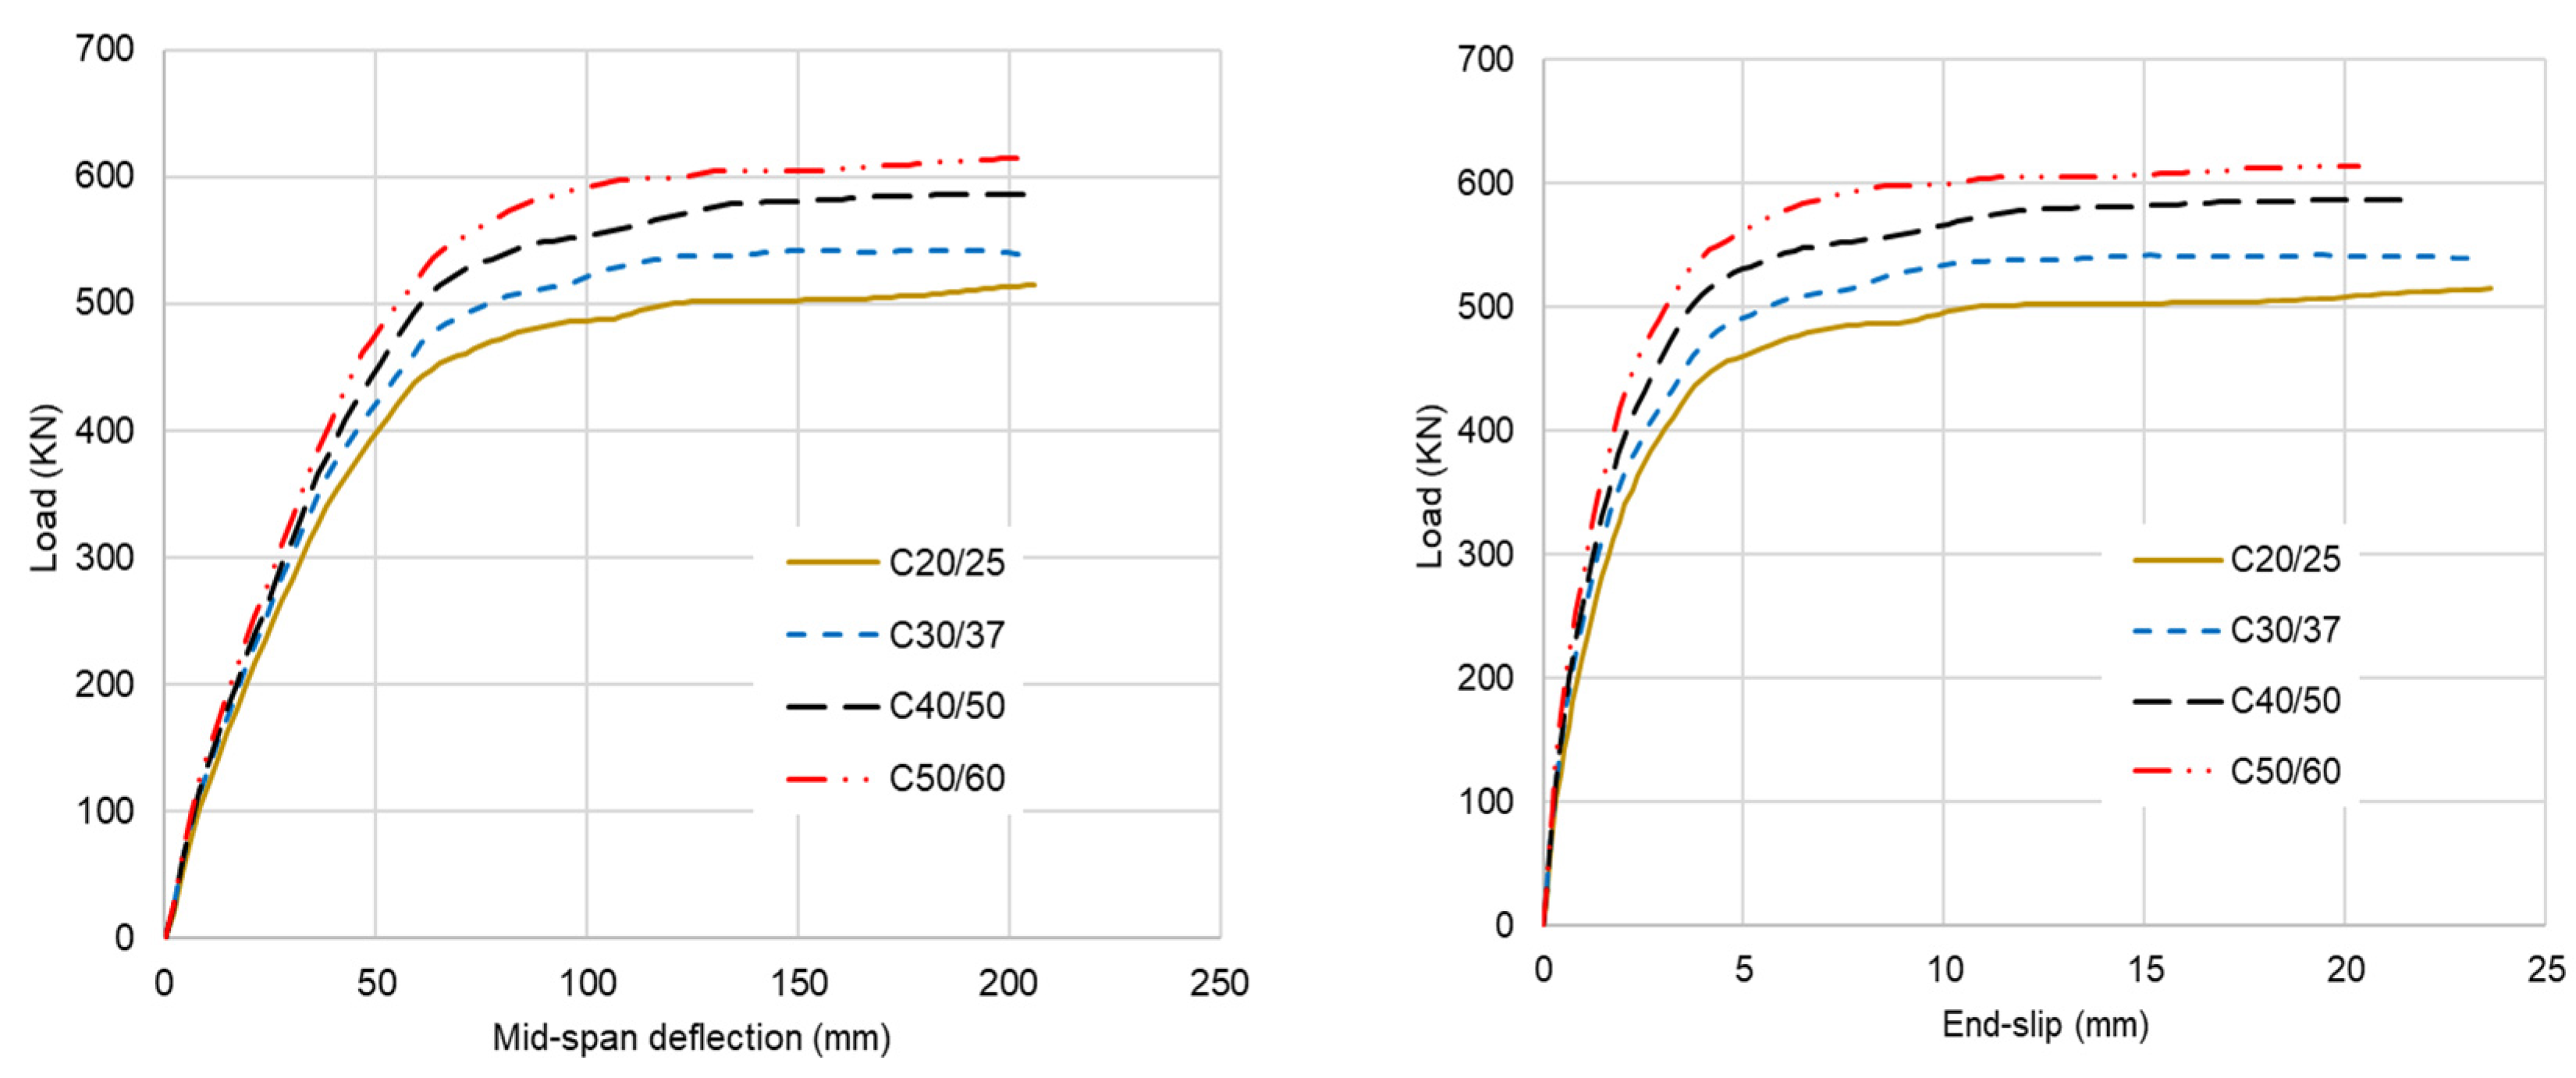
4.2. Effect of the Concrete Strengths

Figure 9 and Figure 10 compare the effect of concrete strengths on the structural performance of composite beams with varying concrete strengths. As expected, stronger concrete provides a higher load-bearing capacity, whether there are reinforcing bars in the concrete dowels; however, the stiffness of composite beams with dowel shear connectors that include reinforcing bars did not increase as much as the stiffness of composite beams that only used concrete dowels as shear connectors. In addition, for composite beams with rebar in dowels, the late stiffness is slightly higher than those composite beams with no rebar in dowels. This evidence suggests that the combined action of concrete and rebar in dowels makes the structural performance different. Unfortunately, the model runs were terminated when the midspan slightly exceeded 200 mm, so the composite beams with rebar in concrete dowels did not reach the maximum load-bearing capacity, but the load vs. deflection graphs in Figure 9 and Figure 10 clearly illustrate how the load-bearing capacity varies with different concrete grades. Approximately, when the concrete strength increases by 10 MPa, the load-bearing capacity of composite beams rises by about 5–10%.
Regardless of the concrete grades and whether there is reinforcing rebar in the dowel, the composite beams show excellent ductile behaviour. There was no decrease in load, even though the midspan deflection was over 200 mm, or L/30 mm. The end slip between concrete and steel exceeded 20 mm at the maximum load.

4.3. Effect of Diameter of Reinforcing Bar

Figure 11 and Figure 12 display the load vs. midspan deflection and load vs. end slip graphs for composite beams utilising different rebar diameters in dowels. Whether the composite beams use a dowel diameter of 40 mm or 80 mm, the size of the reinforcing bars does not significantly impact the stiffness of the composite beams. For composite beams with a dowel diameter of 40 mm, the load-bearing capacity increases by about 2% with the diameter of rebar increasing by 4 mm. However, for composite beams with a dowel diameter of 80 mm, the load-bearing capacity shows little change when the rebar diameter increases from 12 mm to 24 mm. In contrast, there is a significant increase in load-bearing capacity when comparing composite beams without rebar to those with a rebar diameter of 12 mm or bigger. The rebar diameter has a small impact on the load-bearing capacity of composite beams with 80 mm dowels. This difference is possibly because composite beams with larger dowels have their shear resistance primarily controlled by the concrete, which makes the role of rebar in that resistance less significant. Furthermore, when a bigger dowel was used, the shear connection degree of the composite beams was higher, maybe close to 100% or higher in some cases; therefore, increasing the diameter of the reinforcing bar did not affect the composite beam capacity evidently. The above finding illustrates that the effect of rebar sizes on the load-bearing capacity of composite beams depends on the dowel size and the degree of shear connection.
Like those composite beams with different dowel diameters and dowel concrete grades, the composite beams with different reinforcing rebar diameters show excellent ductility. For composite beams with a dowel diameter of 40 mm, the load-bearing capacity remains stable with midspan deflection from about 100 mm to over 200 mm. The end slip between steel and concrete is up to 25 mm. As well, excellent ductility for composite beams with a dowel diameter of 80 mm was observed.

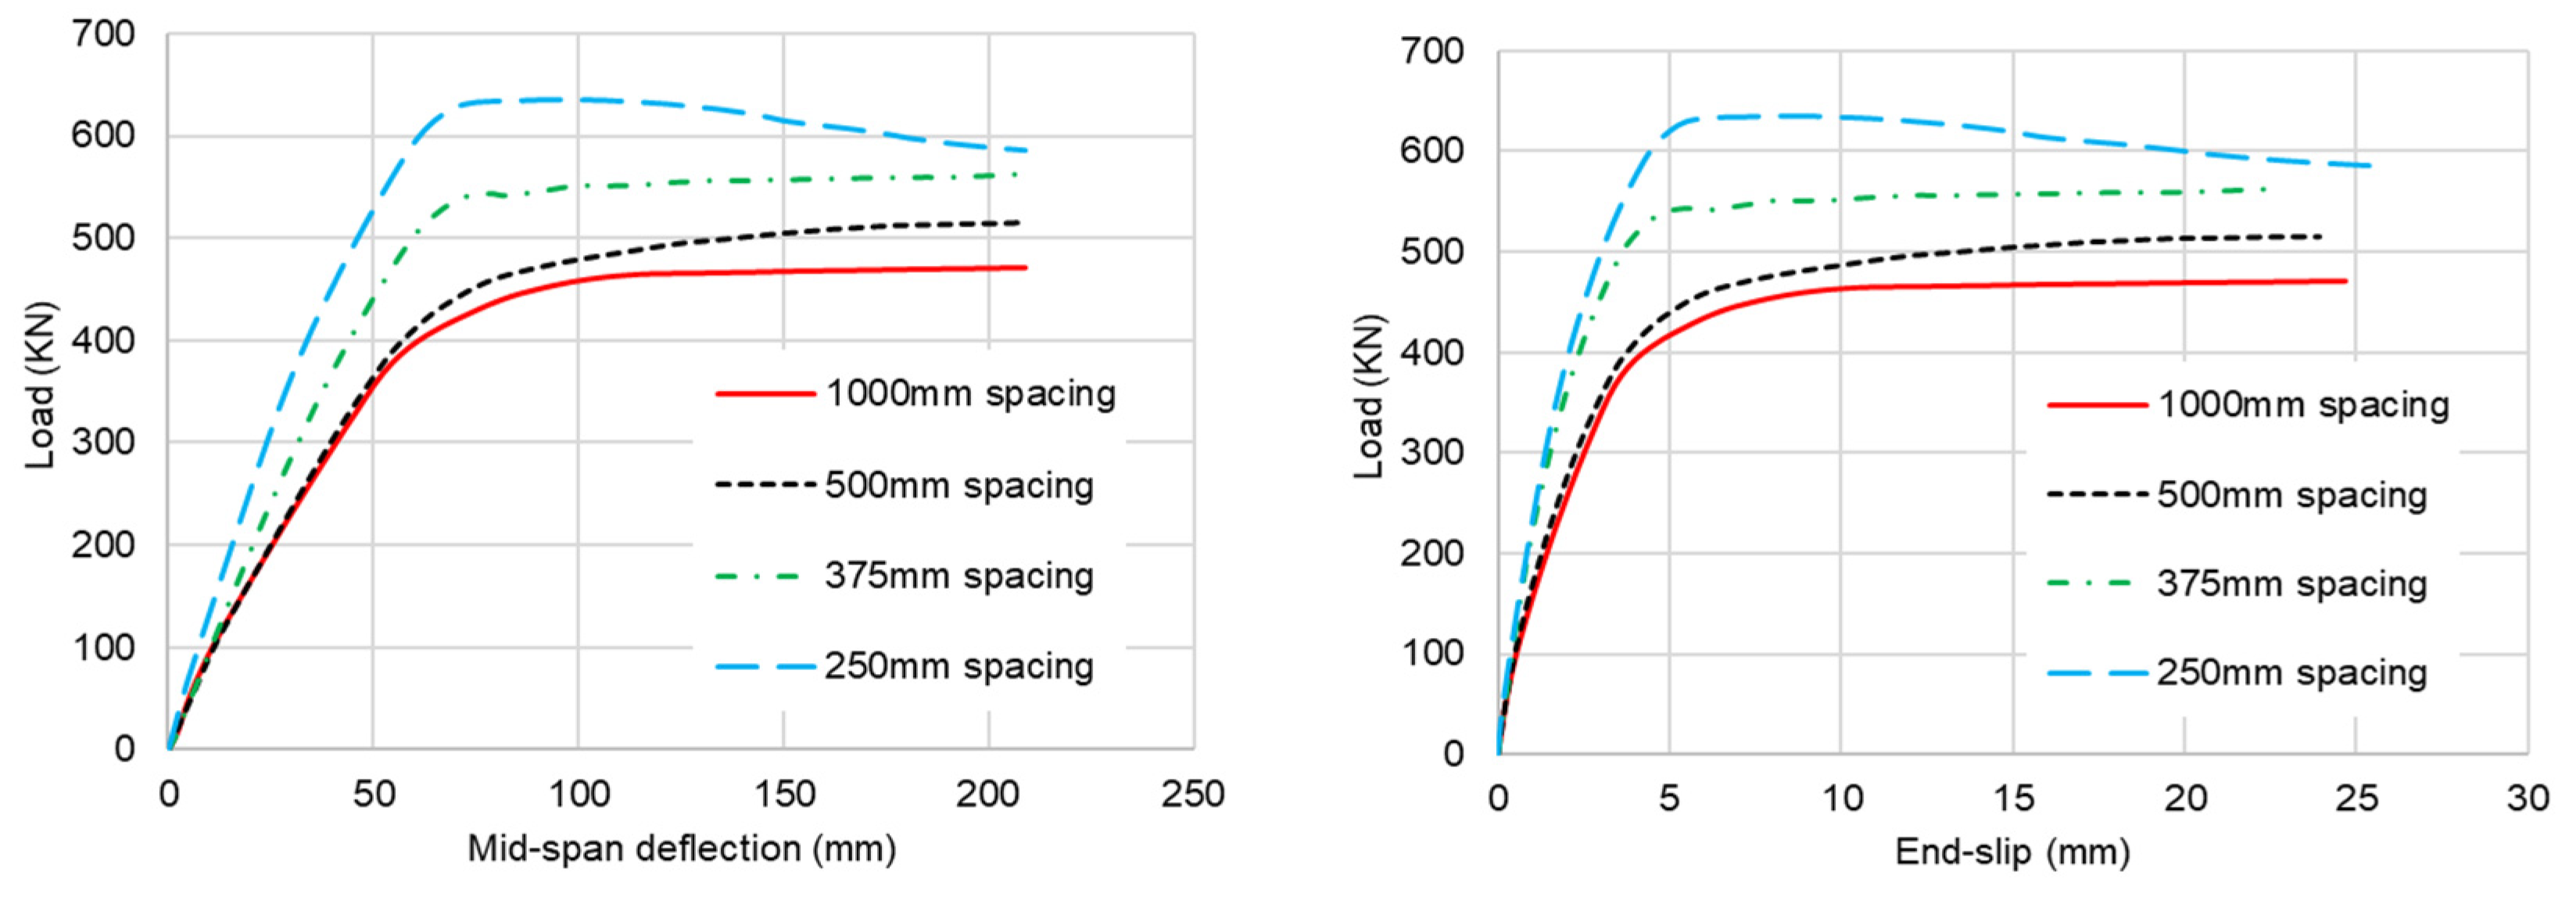
4.4. Effect of Concrete Dowel Spacing

Figure 13 and Figure 14 illustrate the load vs. midspan deflection and load vs. end-slip curves of composite beams with varying dowel central spacing. It is found that the load-bearing capacity of composite beams increases as the dowel central spacing is reduced. This enhancement is attributed to an increase in the shear connection degree within the composite beam as the dowel central spacing diminishes. However, for composite beams with lower dowel spacing, the load-bearing capacity decreased after reaching the maximum load. This is possibly due to the smaller dowel spacing creating more holes in the steel web, which significantly impaired the load capacity of the steel beam. When the dowel central spacing decreased, a significant increase in stiffness for composite beams using dowels with a diameter of 40 mm was observed. However, for composite beams using dowels with a diameter of 80 mm, the change in stiffness is minimal, despite the decrease in dowel central spacing. This is possibly because a larger dowel can withstand more shear resistance than a smaller dowel, resulting in a higher shear connection degree for a composite beam with a larger dowel diameter, which approaches 100%. The comparison and analysis show that reducing the dowel central spacing increases the shear connection degree of the composite beam, which in turn boosts the load capacity and stiffness if the shear connection degree stays under 100%.
The dowel central spacing appears to have an evident impact on the composite beams; however, for all specimens selected in the modelling, the end slip between steel and concrete corresponded to an end slip greater than 5 mm. The maximum load reduction is less than 15% of the peak load, despite the end slip exceeding 20 mm.

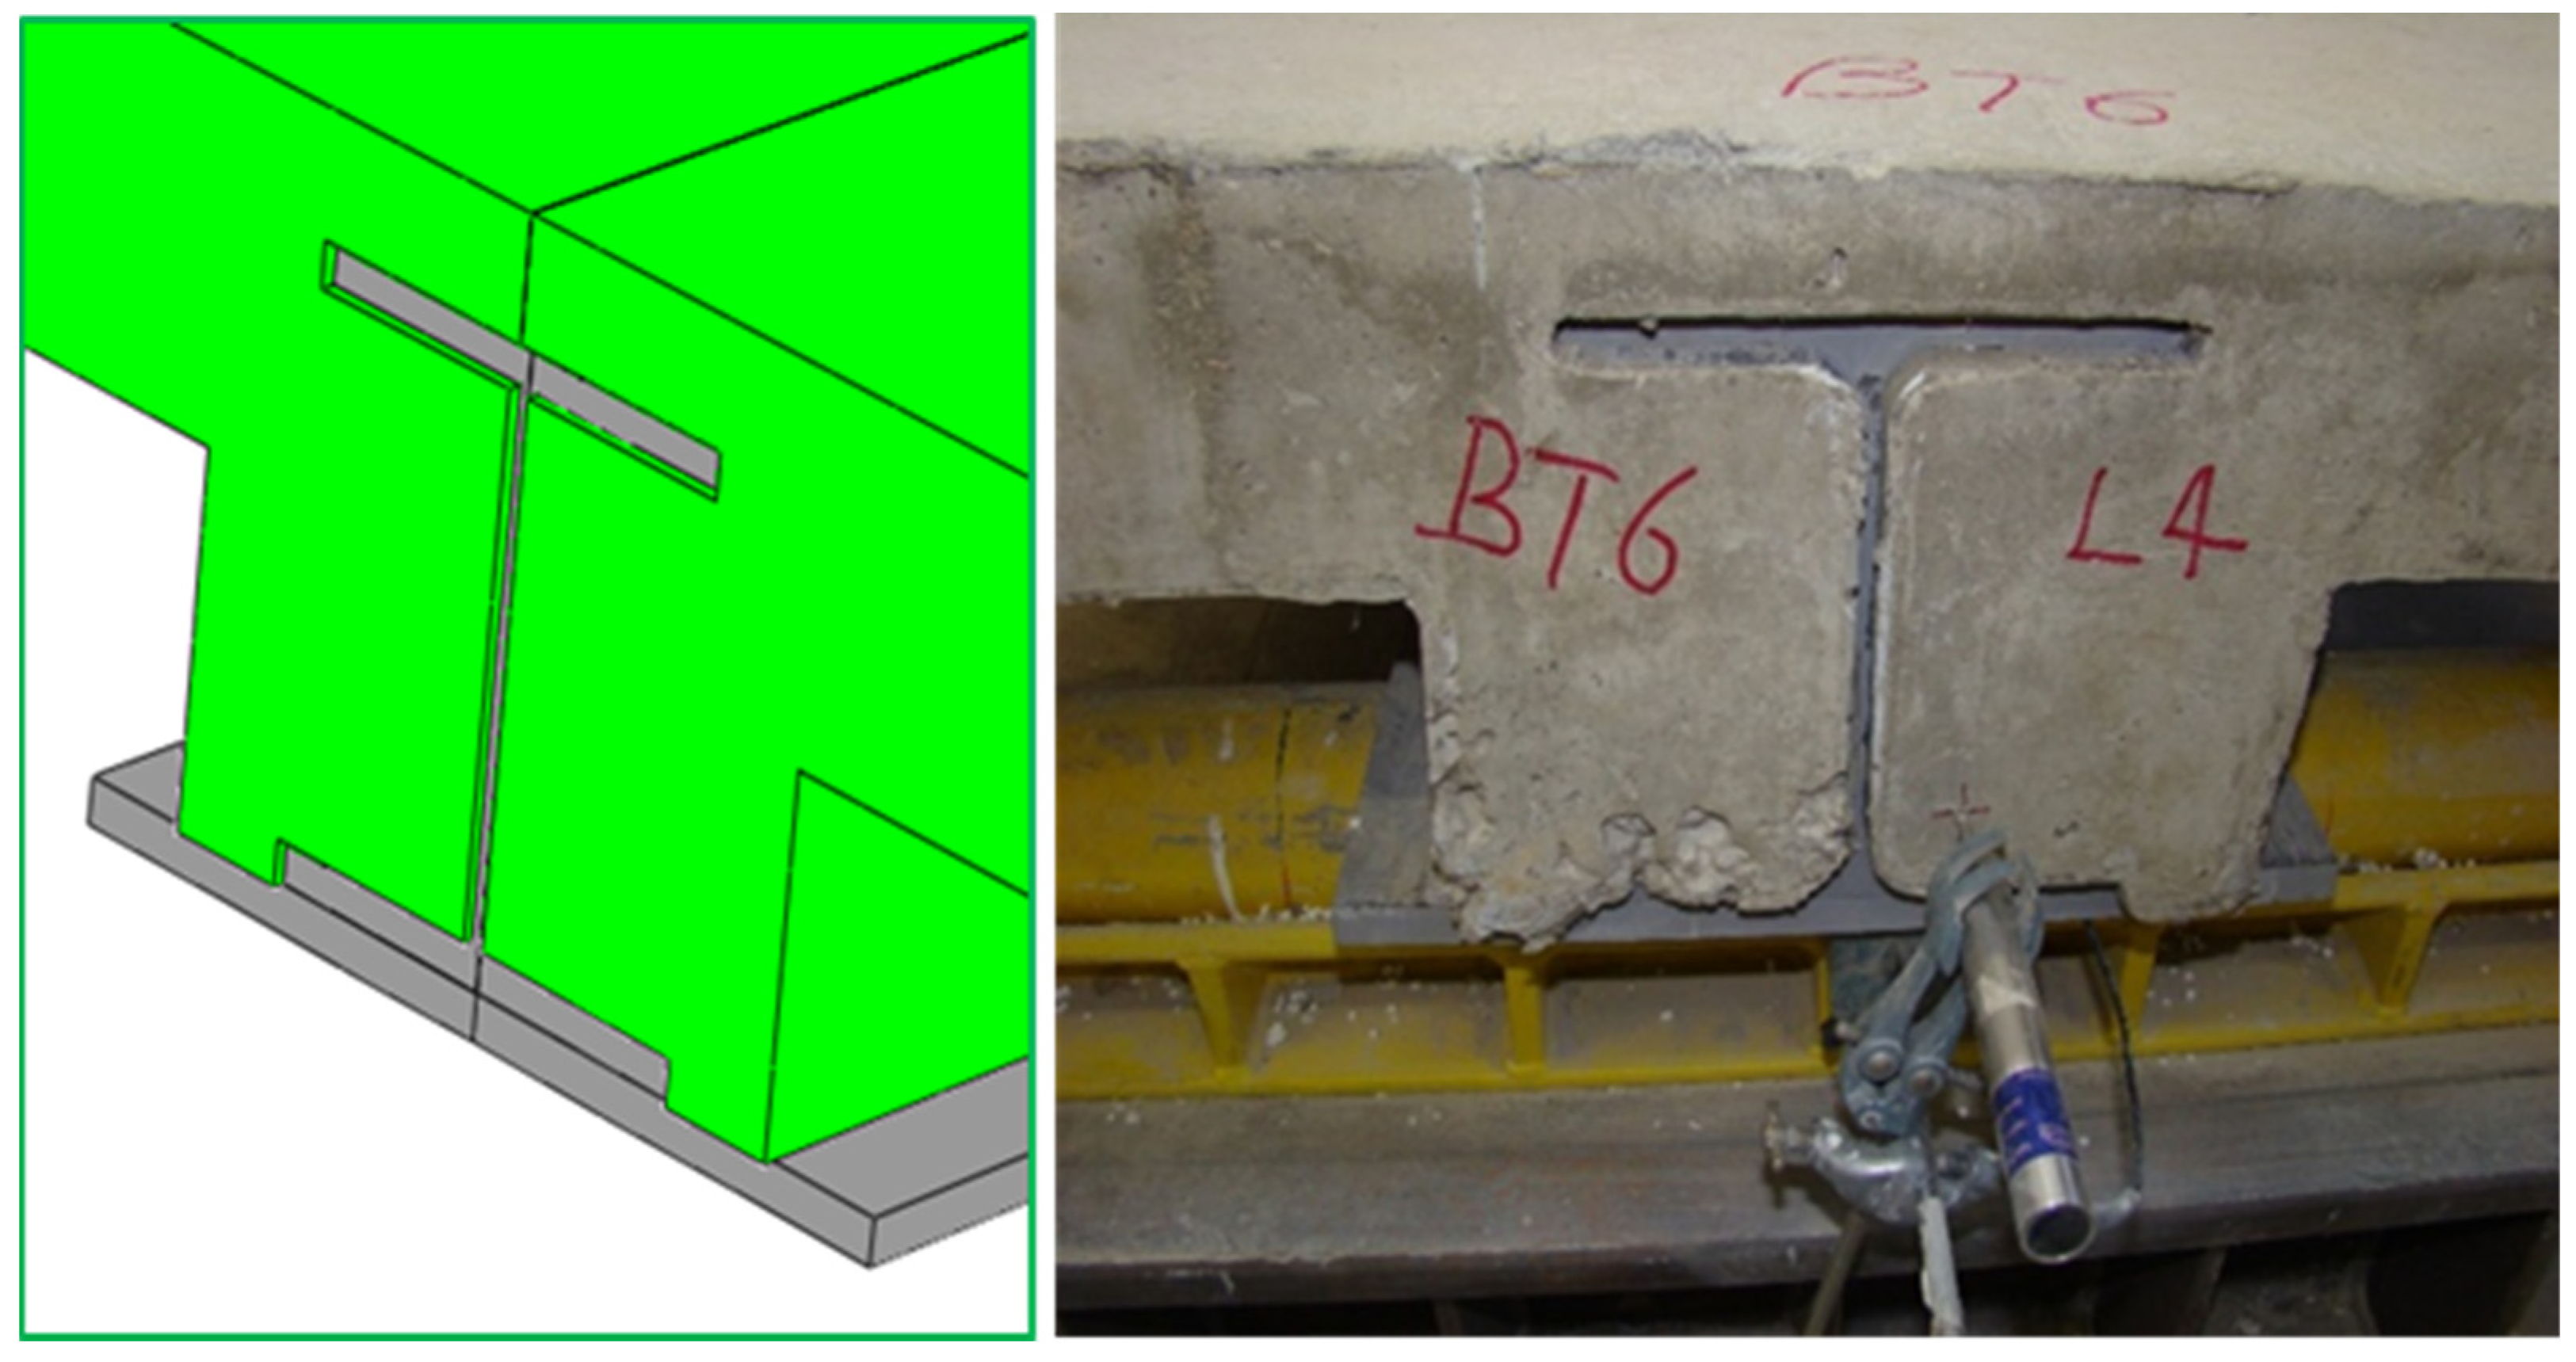
4.5. Failure of Slim-Floor Composite Beam

Concrete dowel shear connectors combine the steel beam section and the concrete slab to form a slim-floor flexural composite beam. The failures of concrete, steel, and shear connectors affect the failure patterns of composite beams. The differing mechanical properties of steel and concrete materials lead to the first observed failure of concrete. When a flexural slim-floor composite beam bends, the top surface of the slab experiences crushing, while the bottom surface of the slab and concrete surrounding the steel beam experience tensile cracking. This results in a reduction in the load-bearing capacity of the concrete slab and the shear resistance of the concrete dowel, which ultimately diminishes the overall strength of the composite beam due to the impairment of the shear connectors and concrete slab. The experimental study and numerical simulation demonstrate these failure patterns in Figure 5 and Figure 6.

5. Prediction of Maximum Bending Moment Capacity

In this paper, a prediction method for bending moment resistance of slim-floor composite beams is developed according to the bending moment resistance of the critical cross-section in the ultimate limit state. The bending moment resistance ( M R d ) of the composite beam considers the bending moment resistance ( M p l , R d ) of the composite slim-floor beam with full shear connection, the bending moment resistance ( M p l , a , R d ) of the steel profile without a concrete slab, and the shear connection degree ( η ) of the composite beam. The resistance to the bending moment  M R d  is expressed as
M R d = M P l , a , R d + η × ( M P l , R d M P l , a , R d )
where the shear connection degree is determined by  η = n P s c P c . In which  P c  is the smaller value between the compressive strength of the concrete slab cross-section and the plastic tensile strength of the steel profile section.  P s c  is the shear resistance of a single concrete dowel shear connector with or without rebar, and  n  is the number of dowel shear connectors. Since the steel part has a welded bottom plate and a hole for the shear dowel on the web of the steel section, it is important to consider the effects of the welded plate and dowel hole on the bending moment resistance ( M p l , a , R d ). The following sections present the calculation formulas for  M p l , a , R d  and  M p l , R d  based on the stress block method.

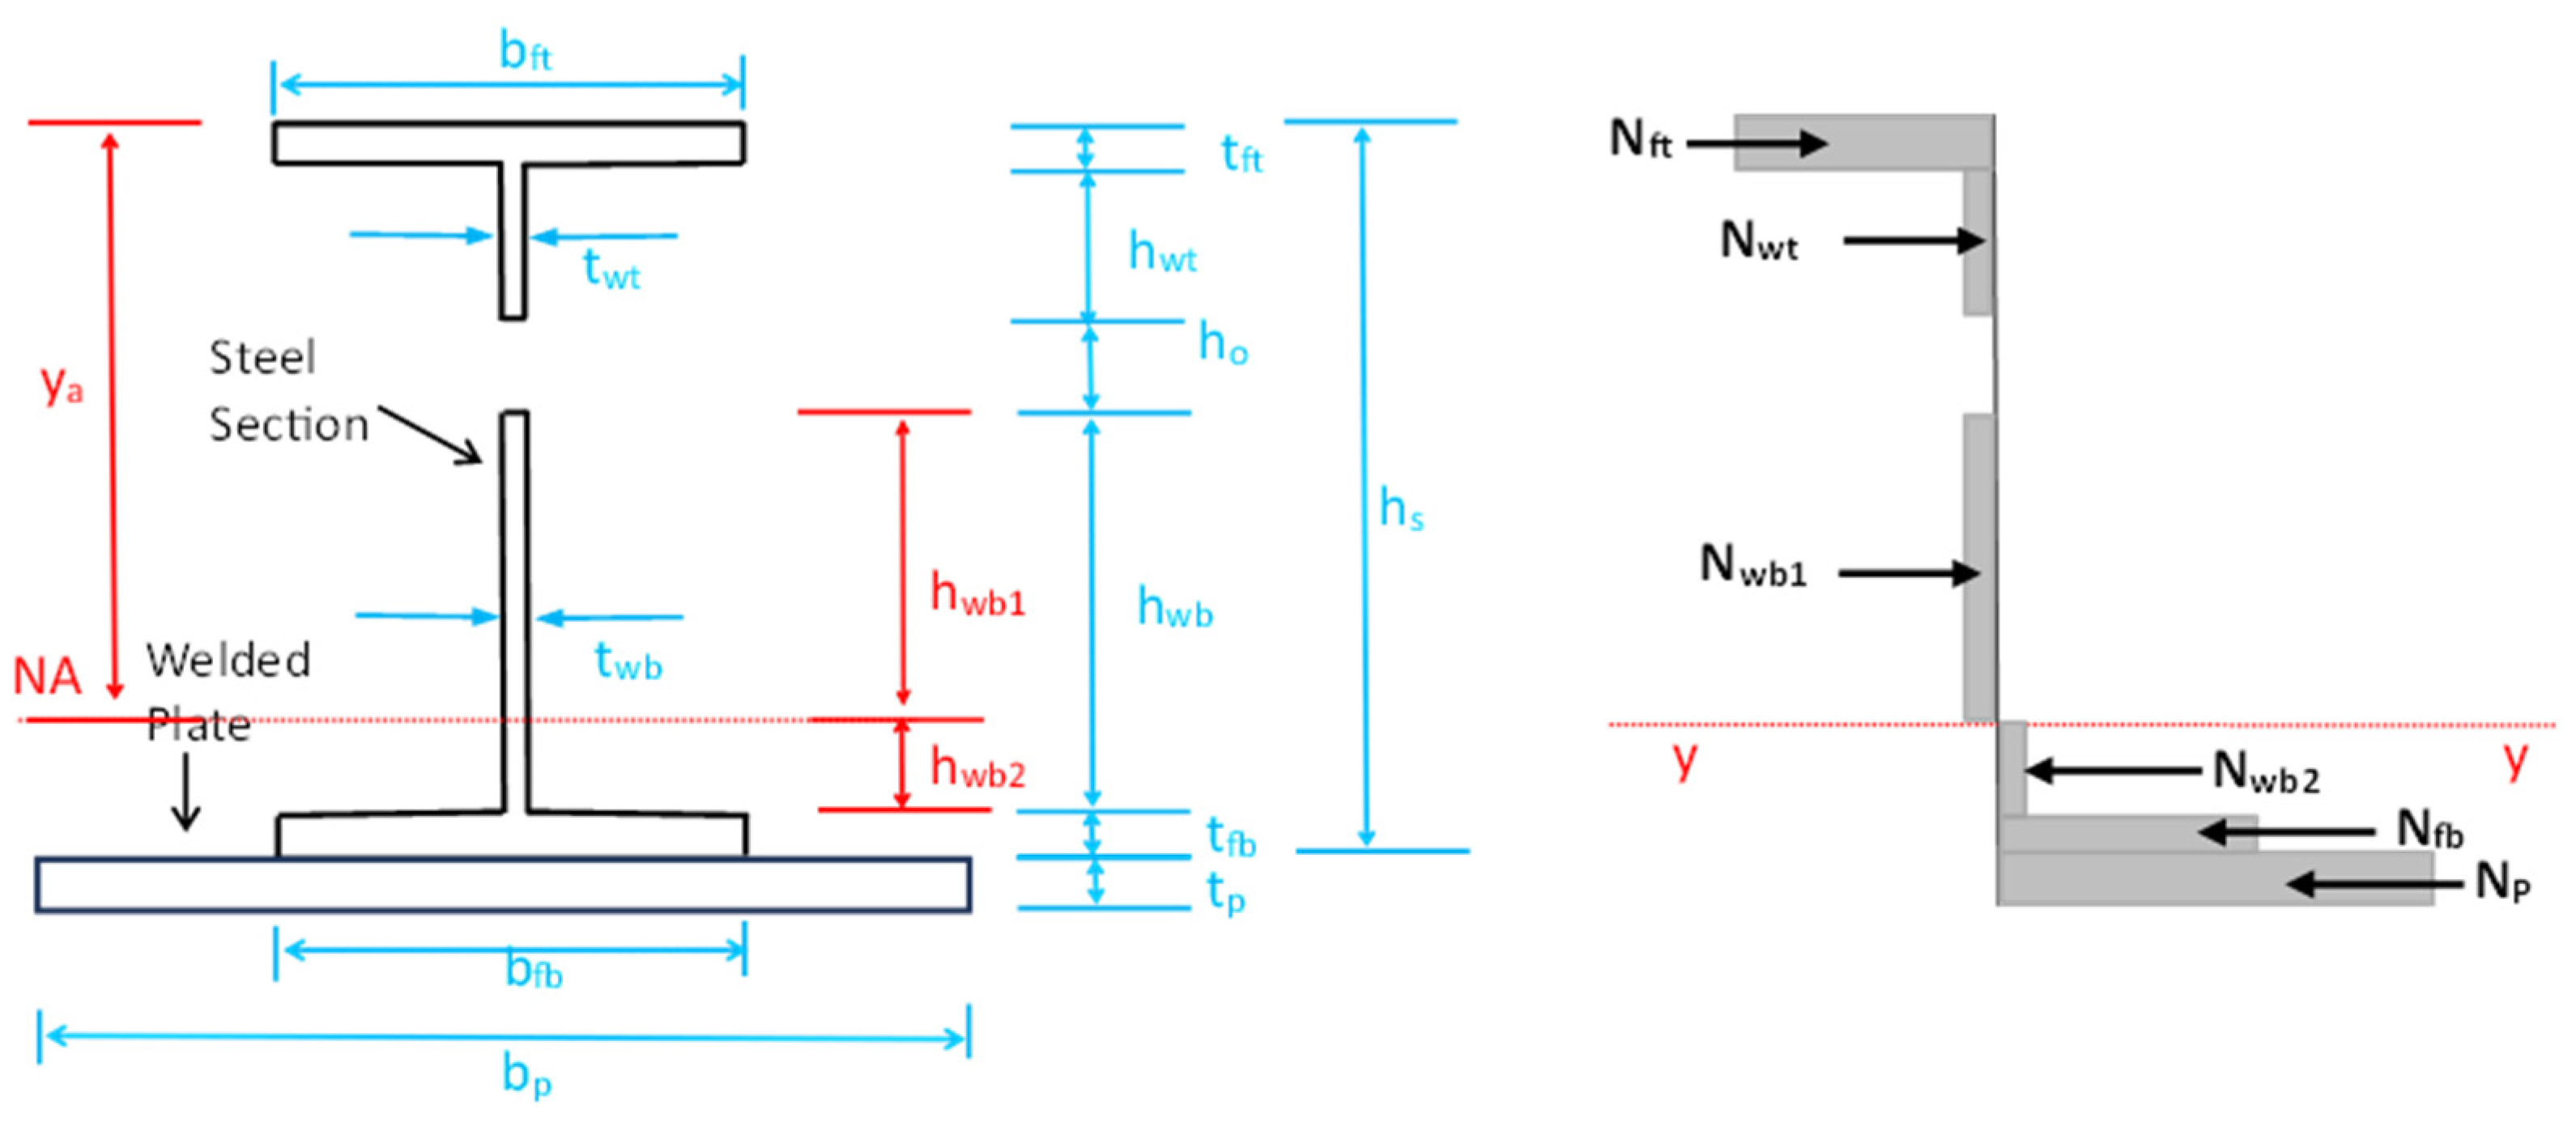
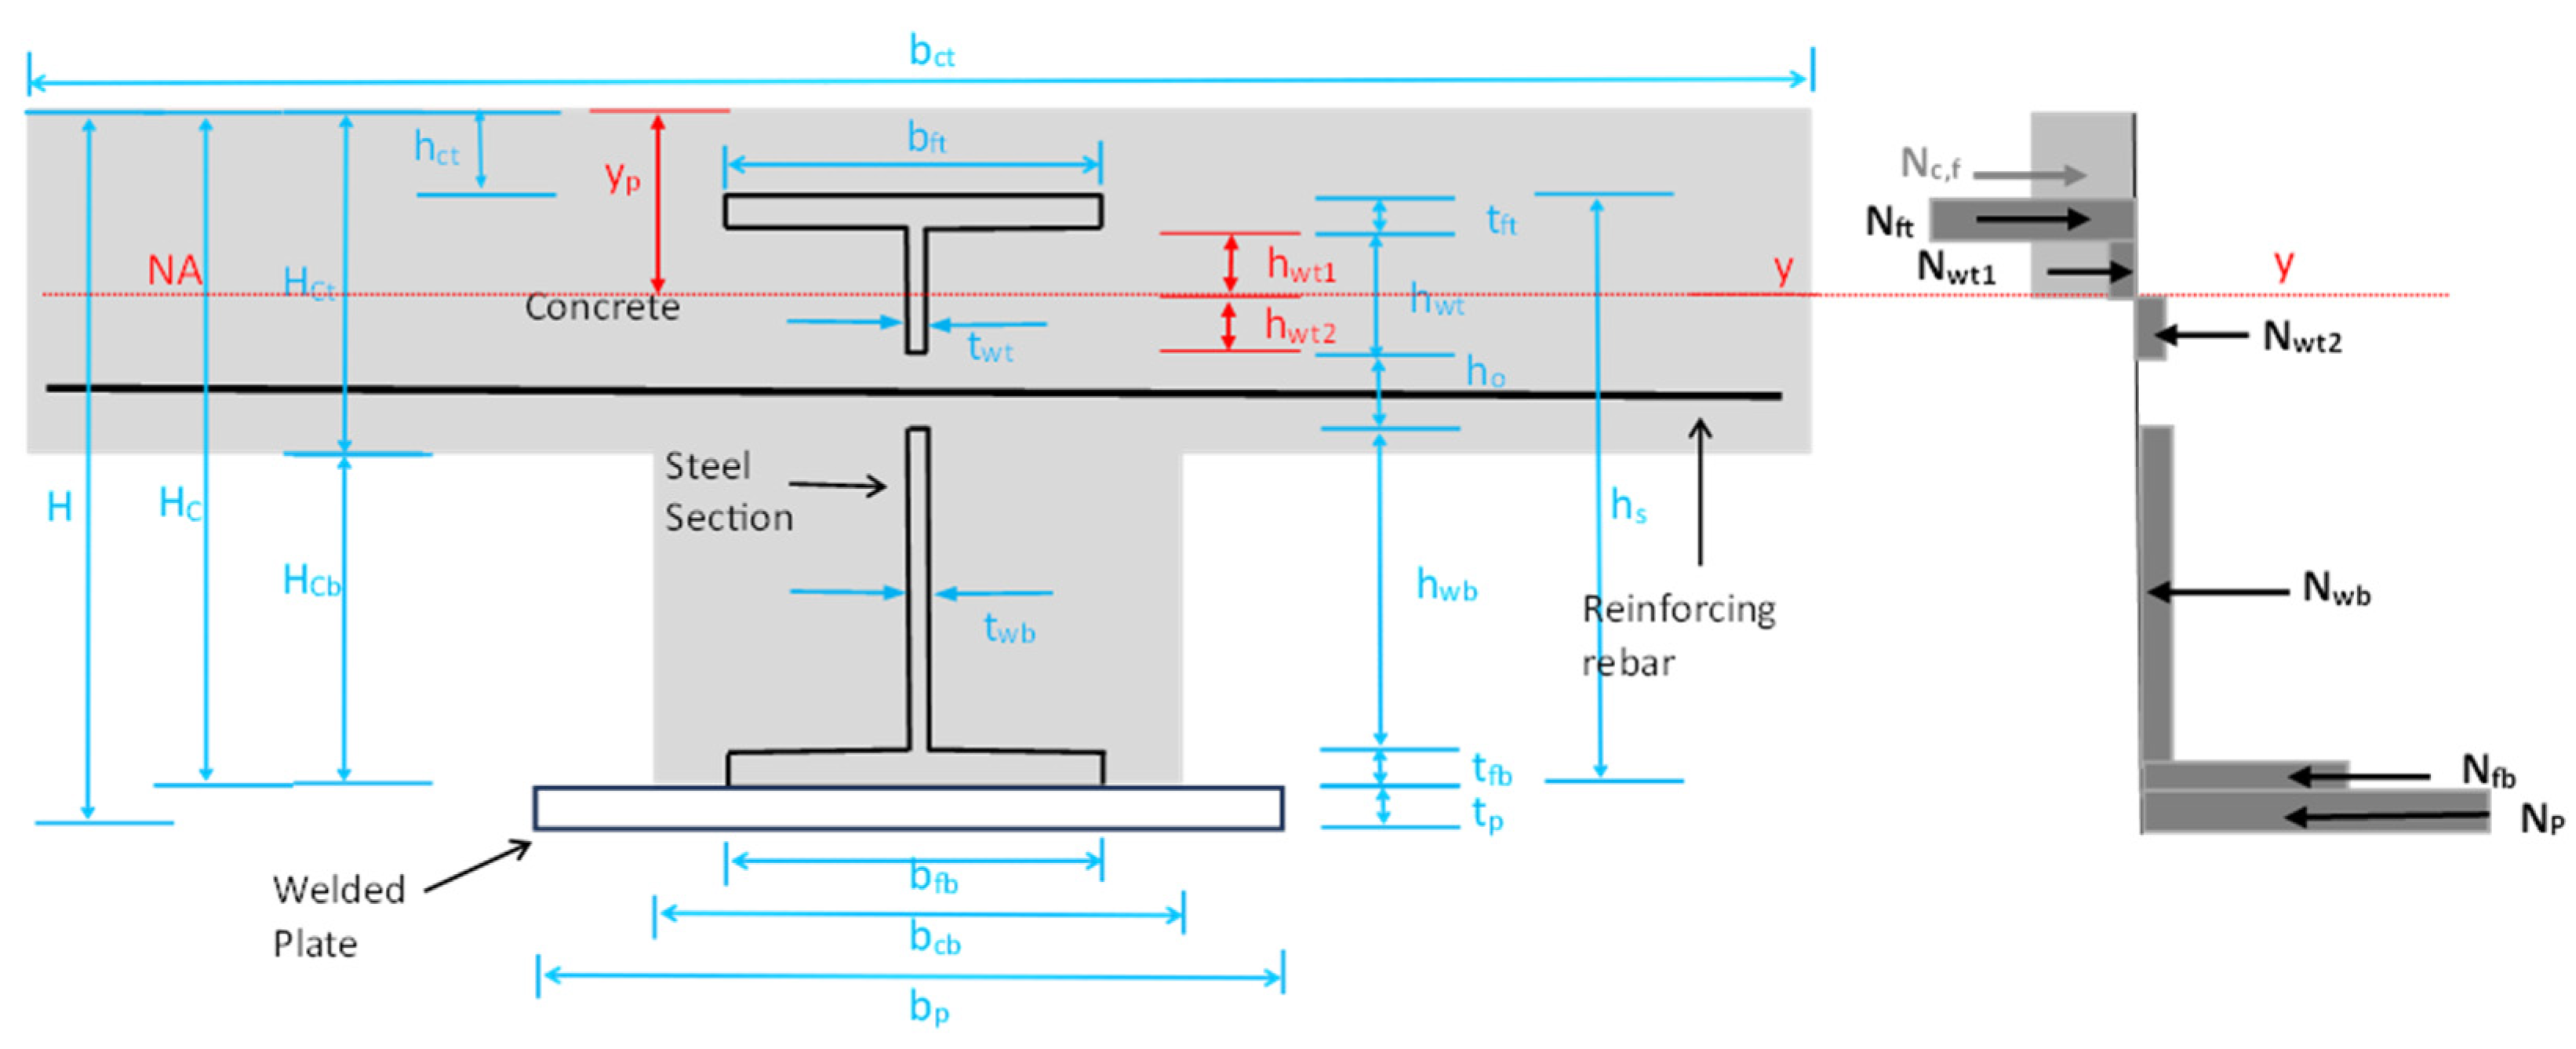
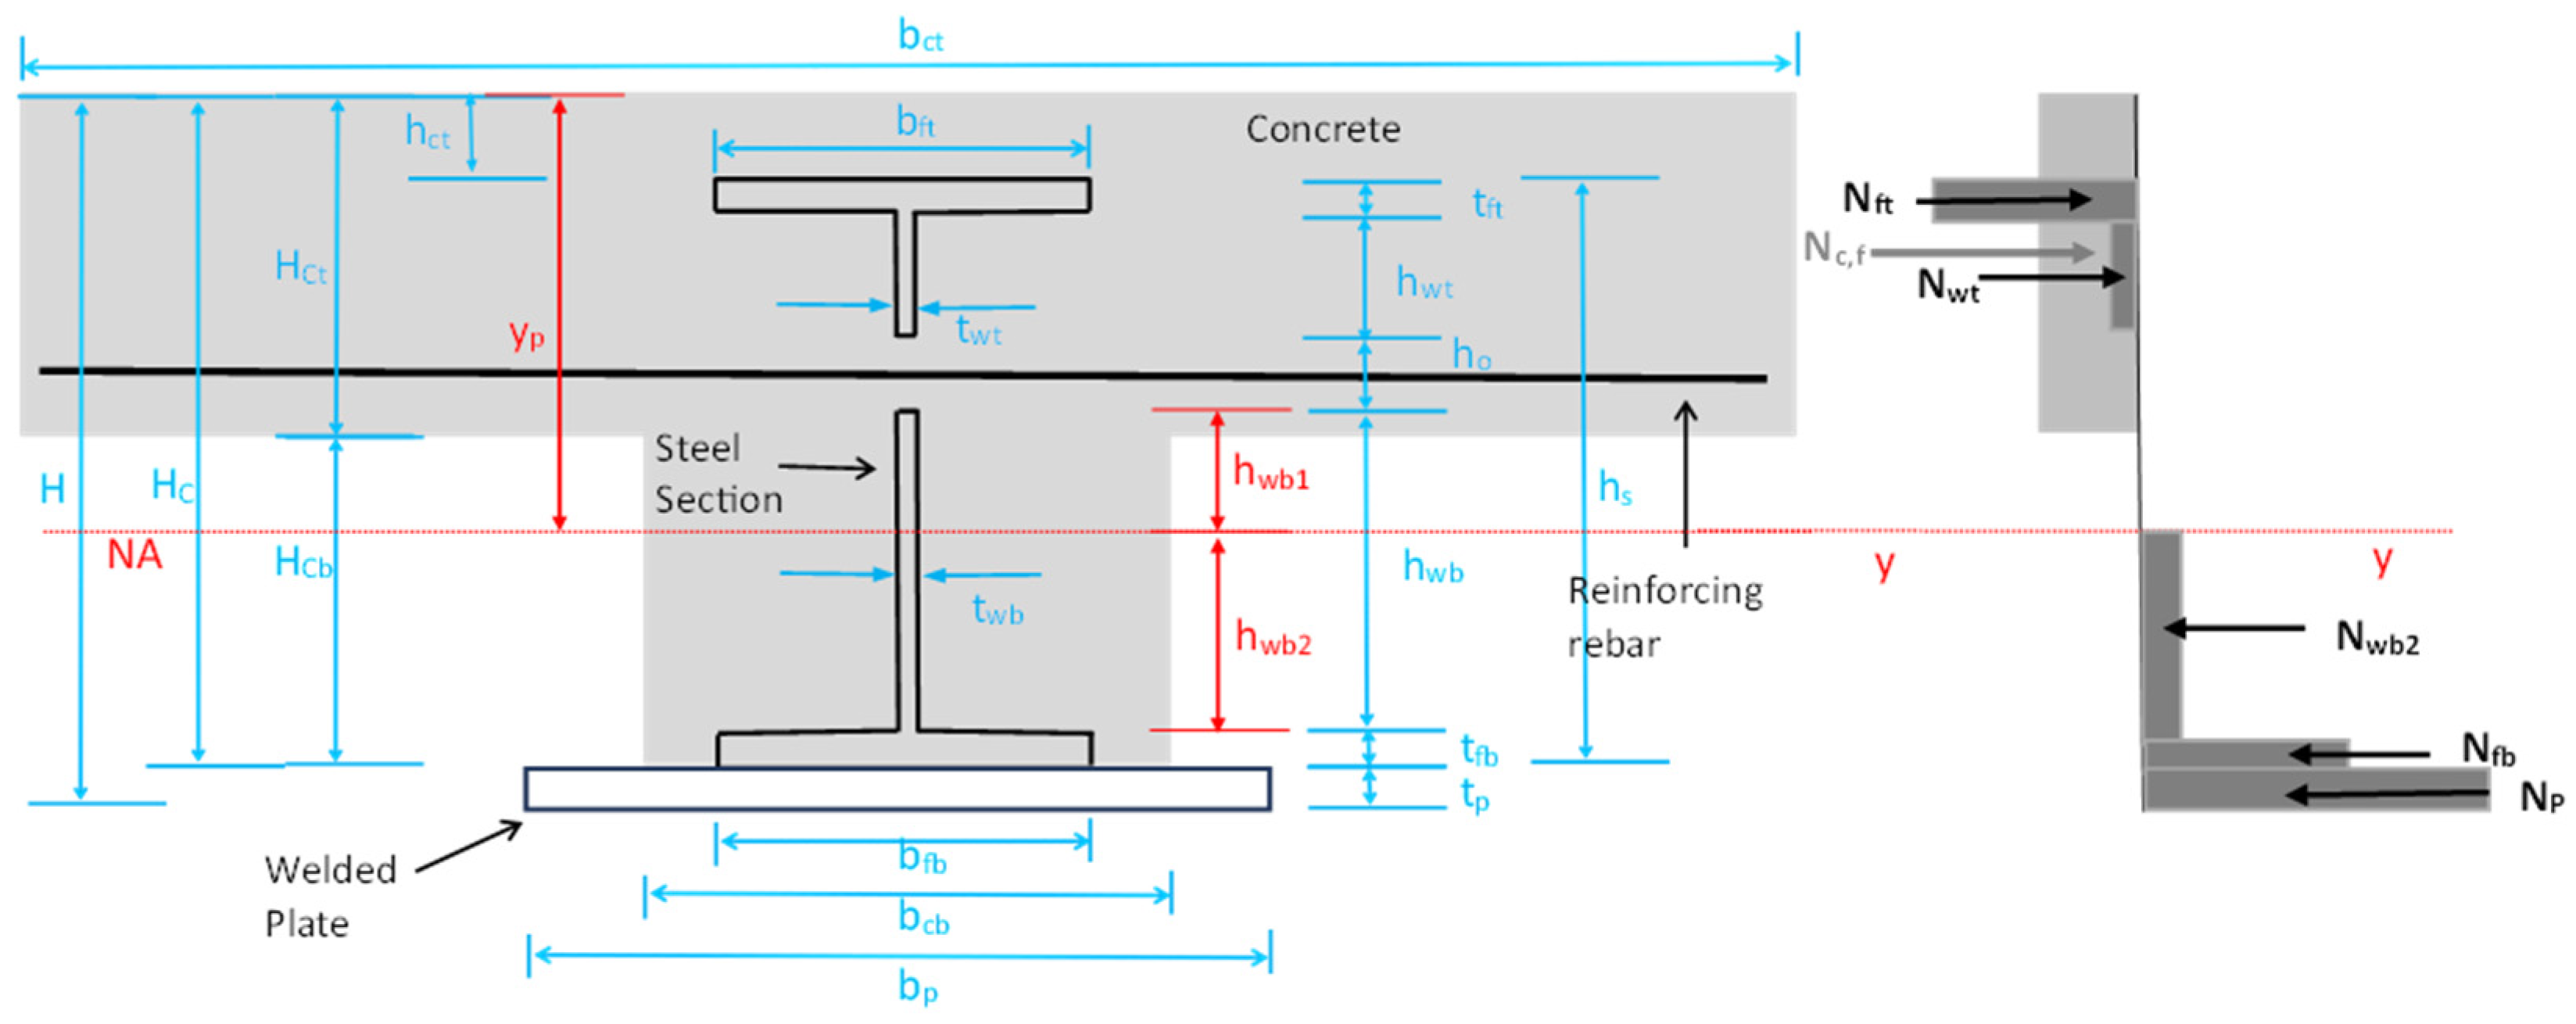
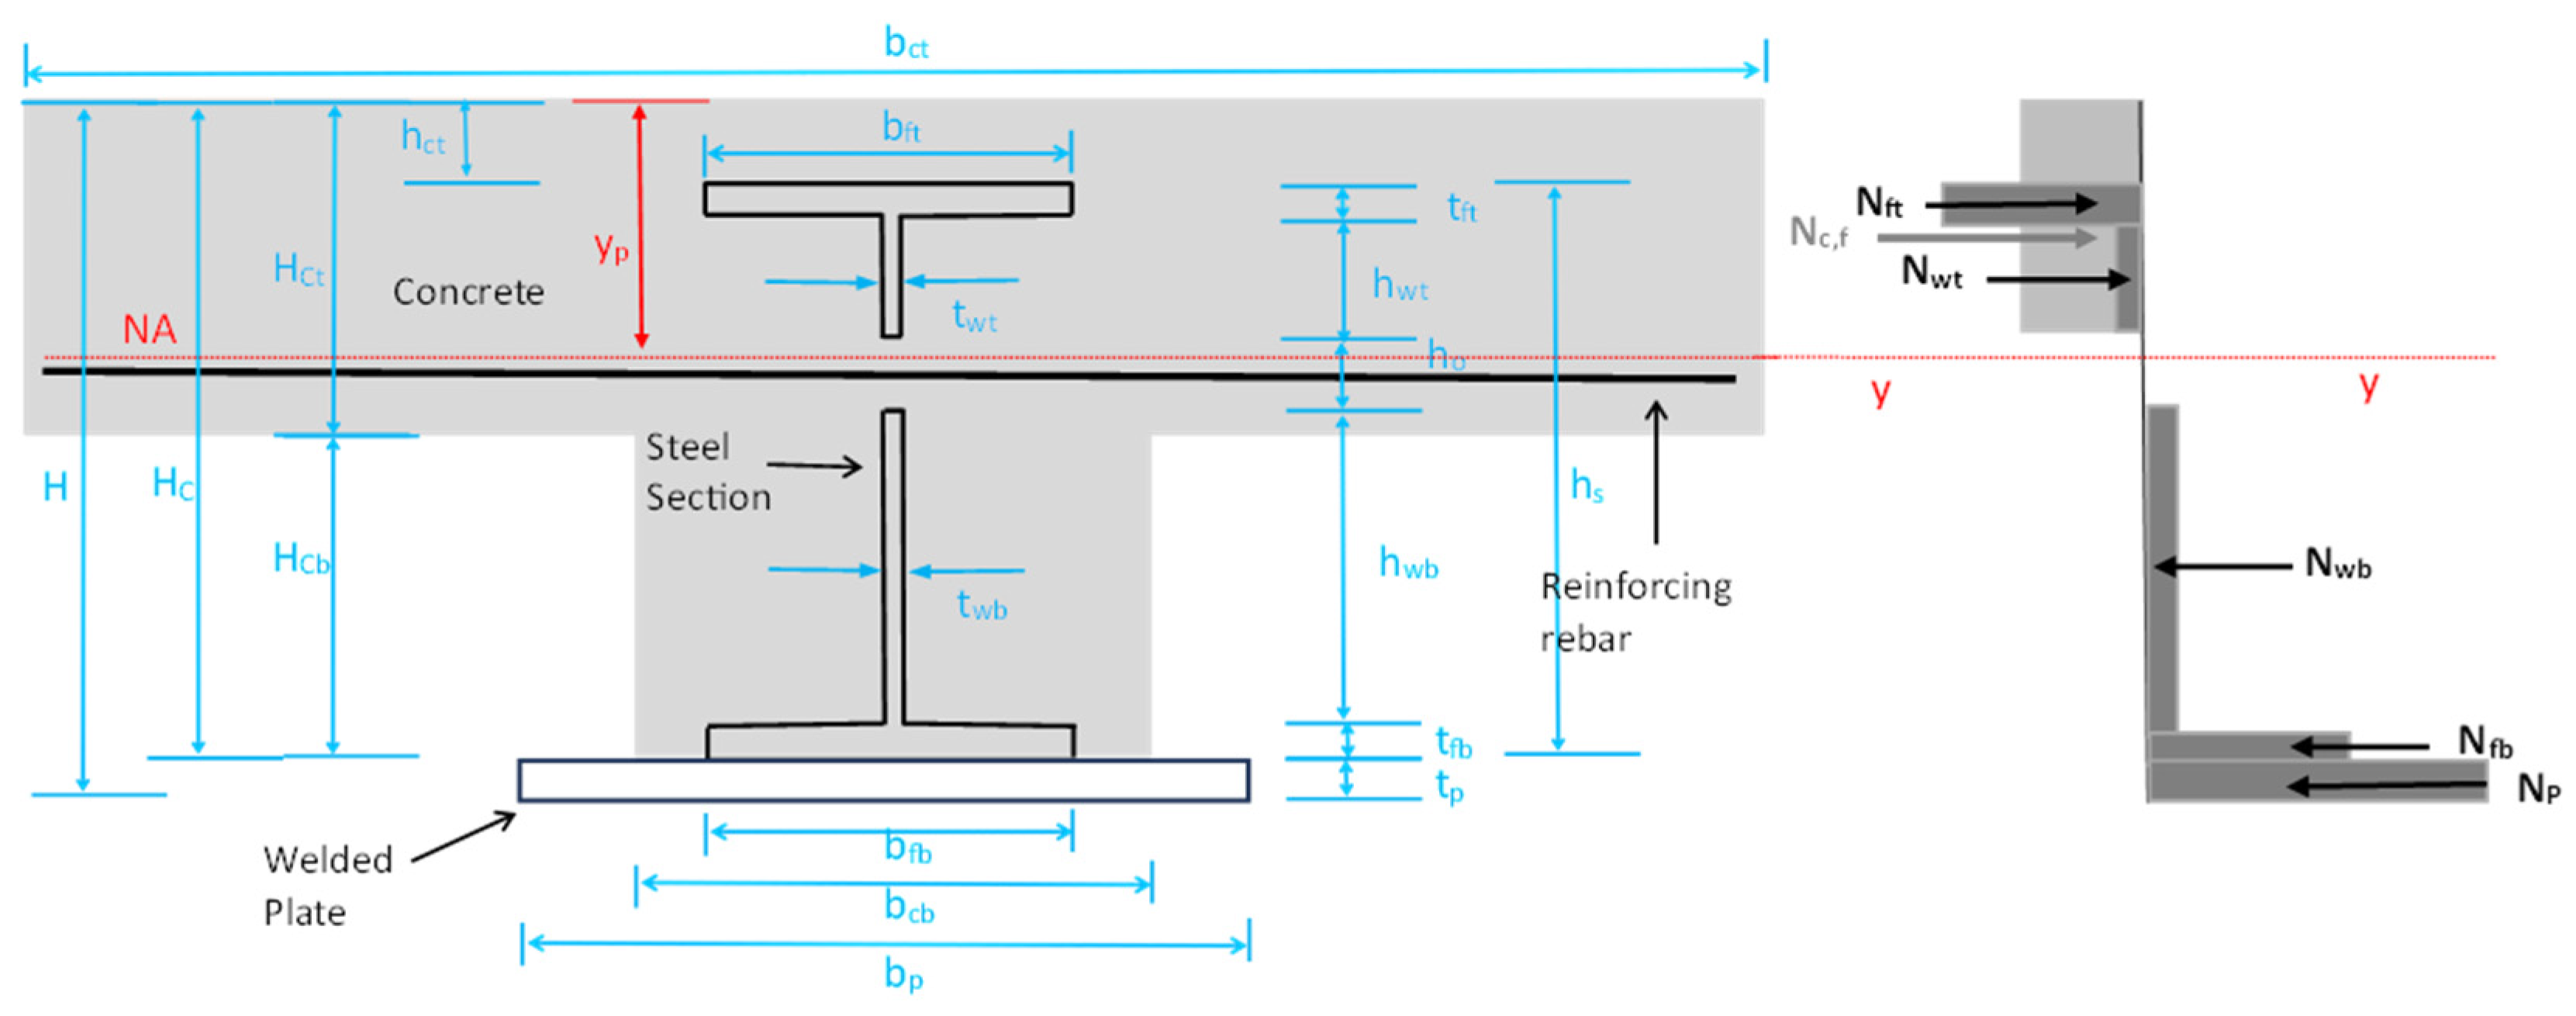
5.1. Bending Moment Resistance of Steel Profile

The plastic neutral axis (NA) of the steel cross-section may be located at either the web or the bottom flange of the steel beam, depending on the size of the welded bottom plate. The position of NA is determined by examining the balance of forces across the entire steel cross-section, which indicates that the total pulling force equals the total pushing force when the steel beam bends. In the current research, two scenarios regarding the position of NA are considered: The NA in the web of the steel beam, below the dowel hole, and the NA in the bottom flange of the steel beam.
As shown in Figure 15, take  N f t = b f t t f t f y N w t = h w t t w t f y N w b = t w b h w b f y N f b = b f b t f b f y N p = b p t p f y . If  N f t + N w t +   N w b  >  N f b N p , the NA will be in the web below the dowel hole, referred to as the lower web. Therefore, part of the lower web will be under compression  N w b 1 , and part of the lower web will be under tension  N w b 2 . The NA position  y a  calculation will be based on the equilibrium equation  N f t + N w t +   N w b 1  =  N w b 2  +  N f b N p , where  N w b 1 = ( y a t f t h w t h o ) t w b f y N w b 2 = ( h s y a + t f b ) t w b f y .
If  N f t + N w t +   N w b  <  N f b N p , the NA will be in the bottom flange as shown in Figure 16; then part of the bottom flange is under compression  N f b 1 , and part of the bottom flange is under tension  N f b 2 . The NA position  y a  is calculated based on the equilibrium equation  N f t + N w t +   N w b +   N f b 1  =  N f b 2 N p , where  N f b 1 = ( y a + t f b h s ) b f b f y , and  N f b 2 = ( h s y a ) b f b f y .
Therefore, for the NA at the lower web of the steel beam as shown in Figure 15, the NA position  y a  and plastic bending moment resistance  M p l , a , R d  are determined by
y a = h s t w b + b p t p t f b t w b + b f b t w b + t w b t f b + t w b h w t + t w b h o b f t t f t t w t h w t 2 b f b
M p l ,   a , R d = N f t ( y a t f t 2 ) + N w t ( y a t f t h w t 2 ) + N w b 1 ( y a t f t h w t h o ) 2 + N w b 2 ( h s y a t f b ) 2 + N f b ( h s y a t f b 2 ) + N p ( h s y a + t p 2 )
For the NA at the bottom flange of the steel beam, as shown in Figure 16, the NA position  y a  and plastic bending moment resistance  M p l , a , R d  are determined by
y a = 2 h s b f b + b p t p t f b b f b b f t t f t t w t h w t t w b h w b 2 b f b
M p l ,   a , R d = N f t ( y a t f t 2 ) + N w t ( y a t f t h w t 2 ) + N w b ( y a t f t h w t h o h w b 2 ) + N f b 1 ( y a + t f b h s ) 2 + N f b 2 ( h s y a ) 2 + N p ( h s y a + t p 2 )

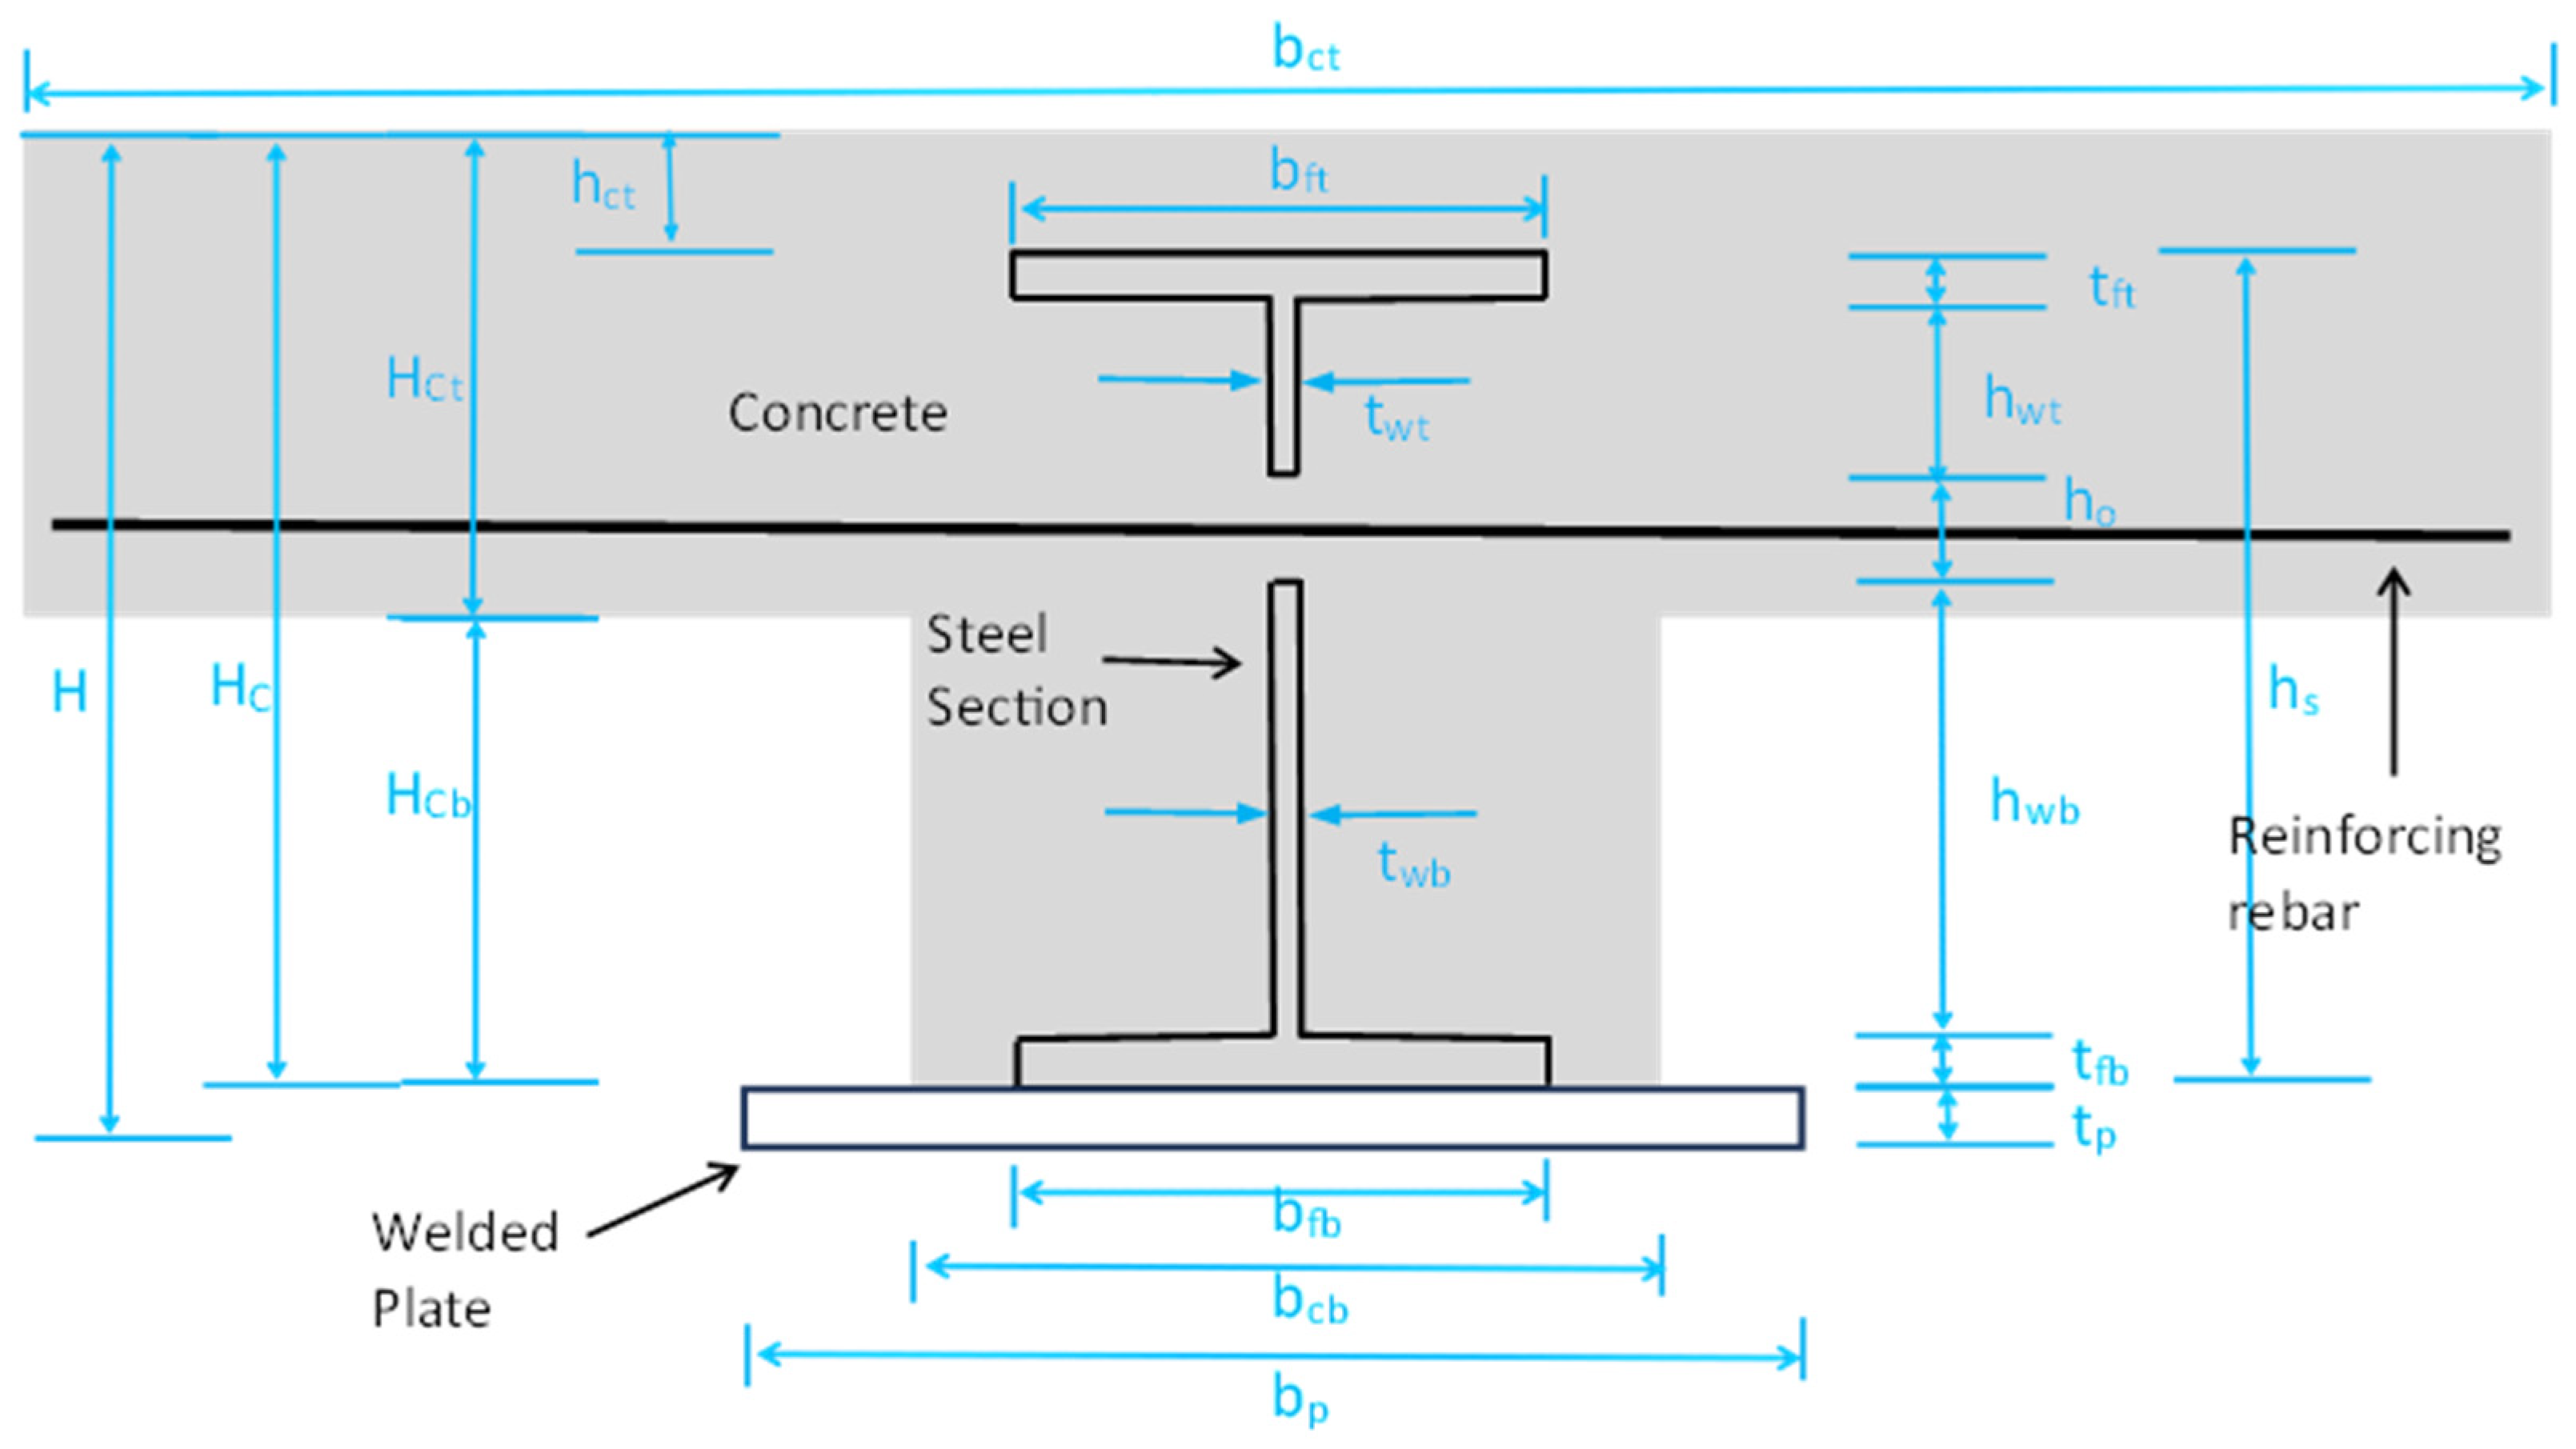
5.2. Bending Moment Resistance of Composite Beam with Full Shear Connection

A key advantage of a steel-concrete composite beam is that it effectively uses the strength of concrete under compression and steel under tension; however, the shear connector and shear connection degree of the composite beam are crucial, as they determine how the steel and concrete work together to enhance the beam’s strength. As shown in Figure 17, if there is a complete shear connection and no sliding between the steel and concrete when the composite beam bends, the plastic neutral axis (NA) of the composite cross-section can be either above, below, or right in the web dowel hole.
The location of the plastic neutral axis (NA) in a composite section is found by balancing the plastic strengths of the steel and concrete parts; however, the strength of the concrete in tension, the impact of the reinforcing rebar in the dowel, and the influence of the steel mesh in the concrete slab are not considered. Three possible positions for the NA are taken into consideration in this study: NA passing the web of the steel section above the dowel hole, passing the web below the dowel hole, and passing through the dowel hole.
In Figure 18, Figure 19 and Figure 20, the strengths of different parts of the composite section are calculated by  N c , f = 0.85 y p b c t f c y 1.5 N f t = b f t t f t f y N w t = h w t t w t f y N w b = h w b t w b f y N f b = b f b t f b f y N p = b p t p f y . The neutral axis (NA) position is determined by the following rules.
(1). Let  y p = h c t + t f t + h w t , if  N c , f + N f t + N w t  >  N w b + N f b  +  N p , then NA in the web above the dowel hole (upper web);
(2). Let  y p = h c t + t f t + h w t   + h o , if  N c , f + N f t + N w t  <  N w b + N f b  +  N p , then NA in the web below the dowel hole (lower web);
(3). Let  y p = h c t + t f t + h w t , if  N c , f + N f t + N w t  <  N w b + N f b  +  N p , and let  y p = h c t + t f t + h w t   + h o , if  N c , f + N f t + N w t  >  N w b + N f b  +  N p , then NA in the dowel hole. The expressions of NA position  y p  and bending moment capacity of the composite section with full shear connection are
(1) For NA in the upper web, or above the dowel hole as shown in Figure 18, the NA position  y p  and plastic bending moment resistance  M p l , R d  can be calculated by
y p = ( 2 h c t t w t + 2 t w t t f t b f t t f t + t w t h w t + t w b h w b + b f b t f b + b p t p ) f y 0.567 f c y b c t + 2 t w t f y
M p l , R d = N c , f y p 2 + N f t ( y p h c t t f t 2 ) + N w t 1 ( y p h c t t f t ) 2 + N w t 2 ( h s + h c t y p t f b h w b h 0 ) 2 + N w b ( h s + h c t y p t f b h w b 2 ) + N f b ( h s + h c t y p t f b 2 ) + N p ( h s + h c t y p + t p 2 )
In   which ,   N w t 1 = ( y p h c t t f t ) t w t f y ,   and   N w t 2 = ( h w t + h c t + t f t y p ) t w t f y .
(2) For NA in the lower web, or below the dowel hole as shown in Figure 19, the NA position  y p  and plastic bending moment resistance  M p l , R d  can be calculated by
y p = ( 2 h c t t w b + t w b h w b + b f b t f b + b p t p b f t t f t t w t h w t ) f y 0.567 f c y b c t + 2 t w b f y
M p l , R d = N c , f y p 2 + N f t ( y p h c t t f t 2 ) + N w t ( y p h c t t f t h w t 2 ) + N w b 1 ( y p h c t t f t h w t h o ) 2 + N w b 2 ( h s + h c t y p t f b ) 2 + N f b ( h s + h c t y p t f b 2 ) + N p ( h s + h c t y p + t p 2 )
In   which ,   N w b 1 = ( y p h c t t f t h w t h o ) t w b f y ;   and   N w b 2 = ( h s + h c t y p + t f b ) t w b f y .
(3) For NA in the dowel hole as shown in Figure 20, the NA position  y p  and the plastic bending moment resistance  M p l , R d  can be calculated by
y p = ( t w b h w b + b f b t f b + b p t p b f t t f t t w t h w t ) f y 0.567 f c y b c t
M p l , R d = N c , f y p 2 + N f t ( y p h c t t f t 2 ) + N w t ( y p h c t t f t h w t 2 ) + N w b ( h s + h c t y p t f b h w b 2 ) + N f b ( h s + h c t y p t f b 2 ) + N p ( h s + h c t y p + t p 2 )

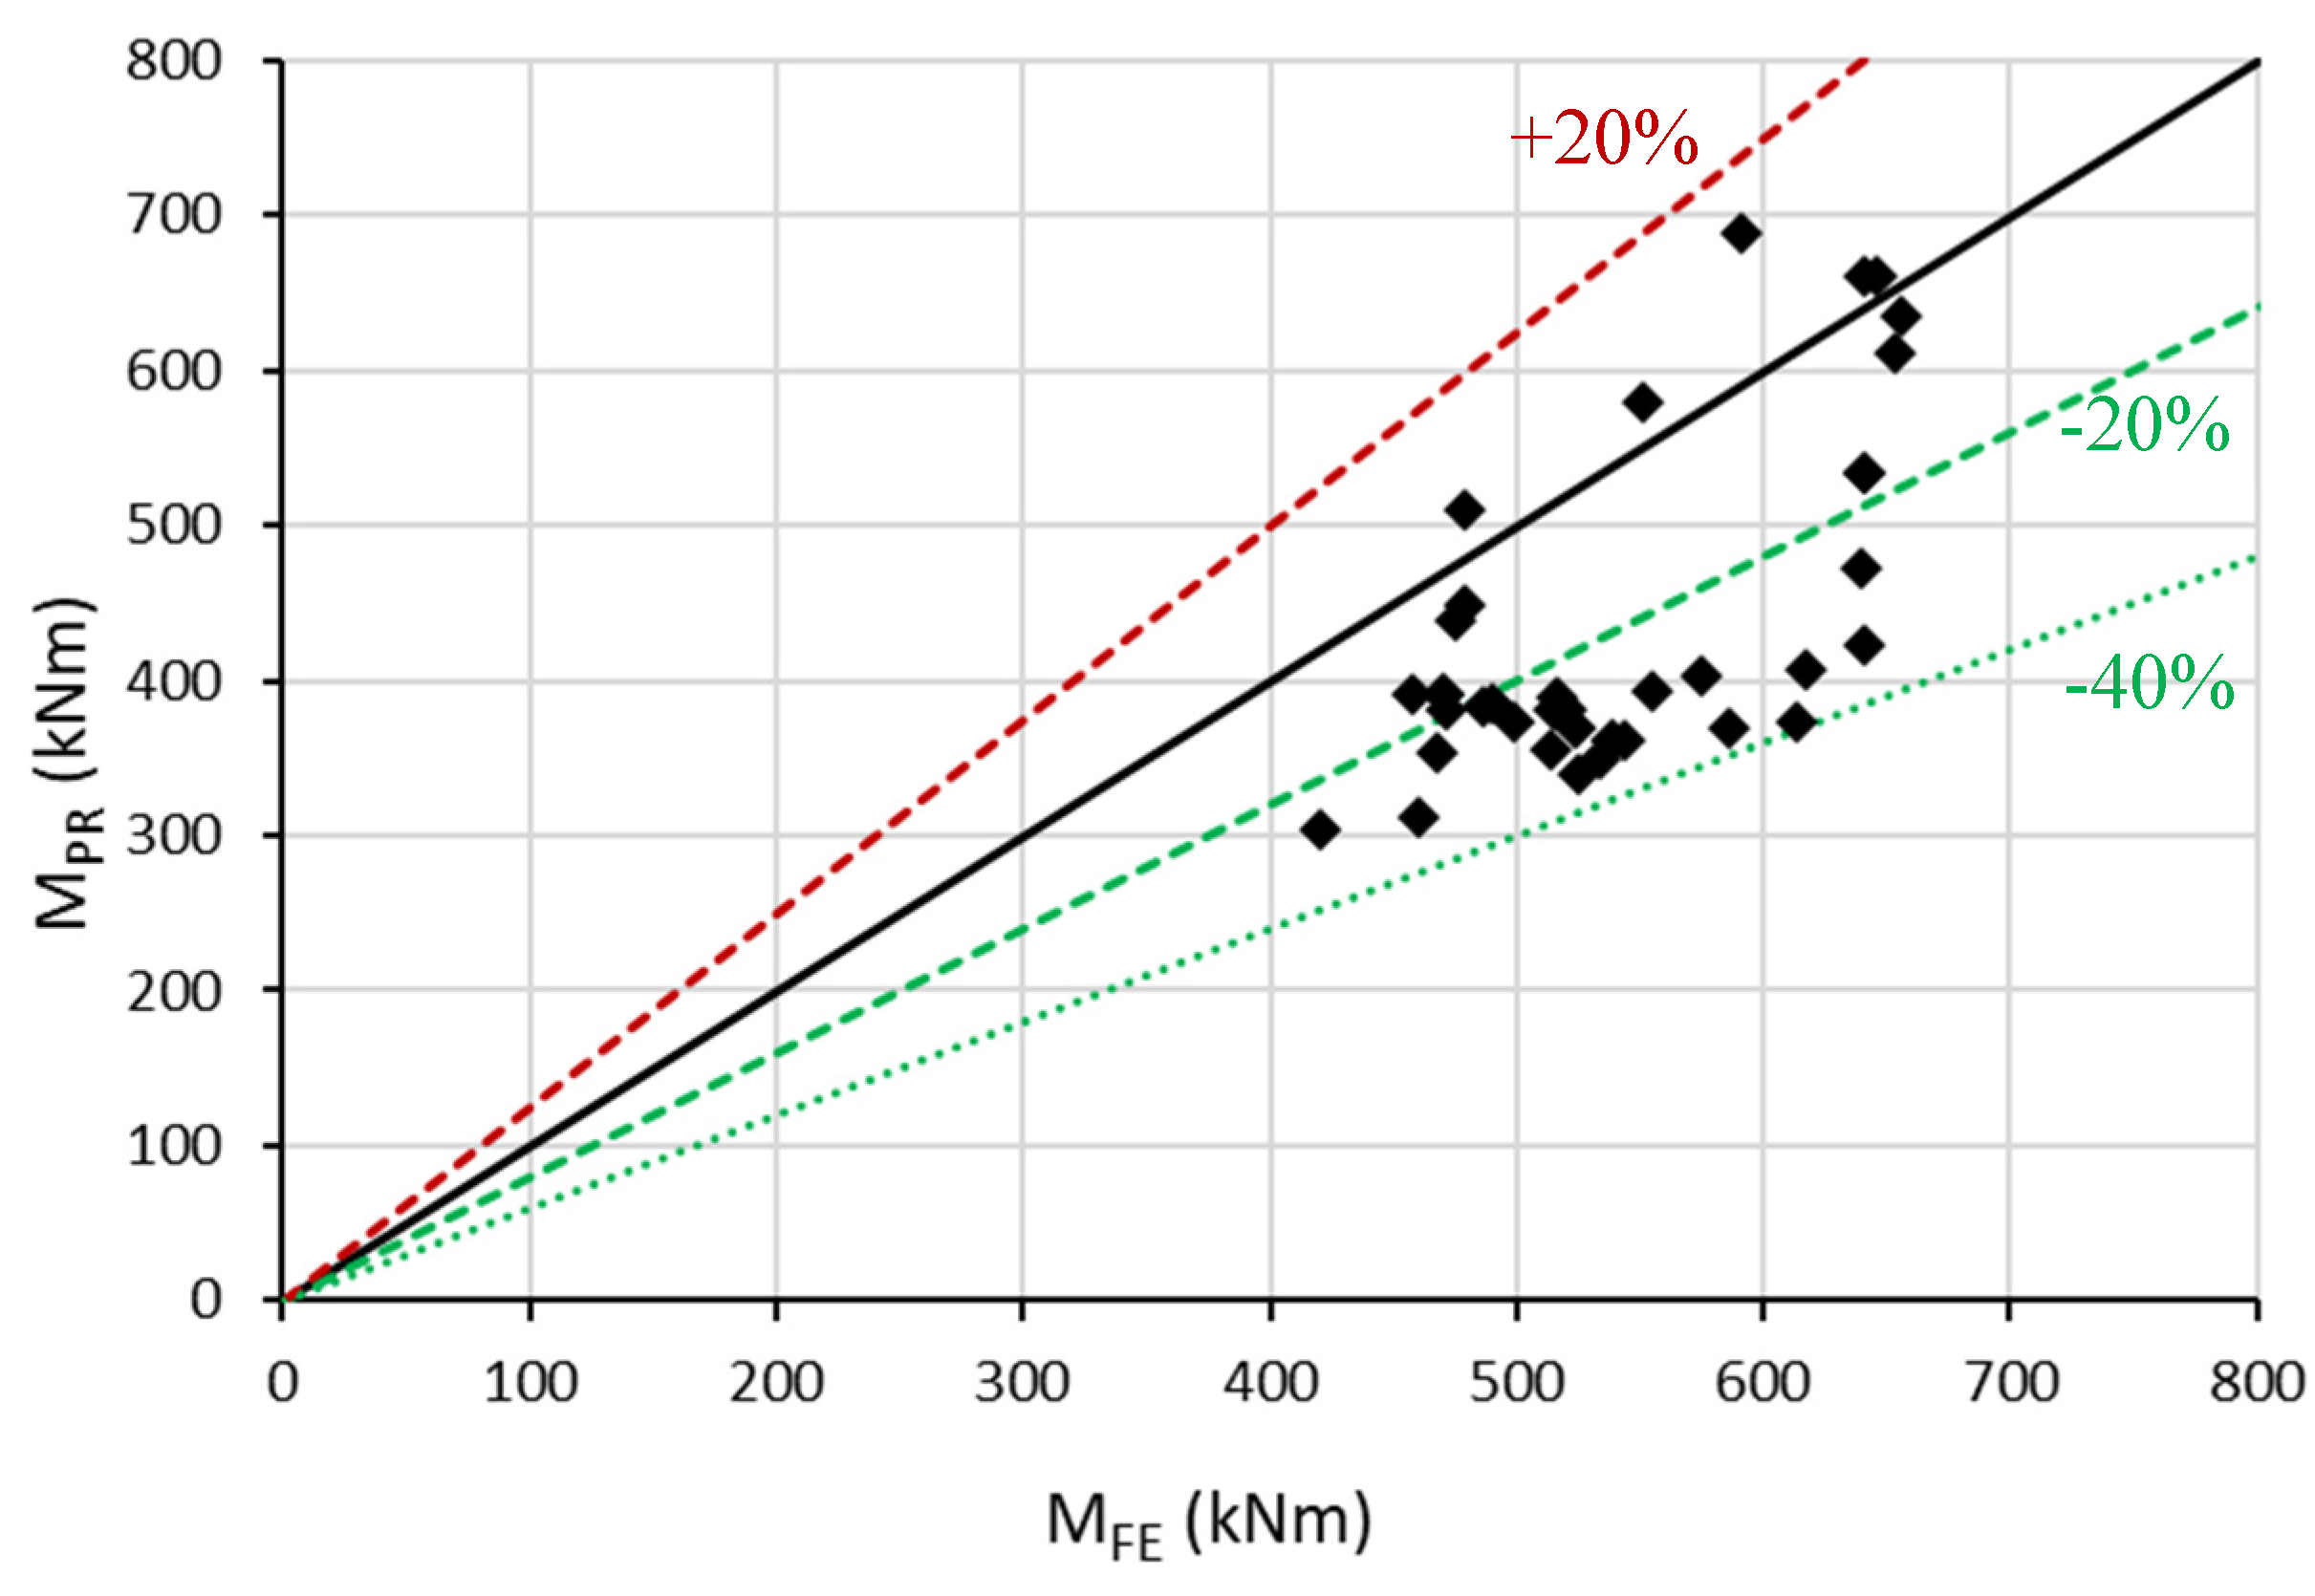
5.3. Validation of the Proposed Expressions

The formulas proposed in the above sections were used to predict the bending moment resistance of tested composite slim-floor beams with or without dowel shear connectors, as listed in Table 1. Table 3 and Figure 21 show the comparisons of the bending moment resistances ( M P R ) predicted by the proposed formula (1) with the maximum bending moments (MEX) observed in the experimental study. The predicted bending moment resistances are lower than the maximum bending moments obtained from the experimental study, with an average MPR/MTEST ratio of 0.891 and a standard deviation of 0.086. The maximum discrepancy is from the BT4 specimen with a low design shear connection degree of 25%. For other specimens with a dowel shear connection degree greater than 40% or without shear connectors, the MPR/MTEST ratio is from 0.82 to 1.00, with an average MPR/MTEST ratio of 0.912 and a standard deviation of 0.064. The comparison illustrates that the proposed method is conservative for the prediction of the bending moment resistance, but it is on the safe side for design.
To further check the accuracy of the proposed calculation method, the proposed formulas were used to predict the bending moment capacity of the composite slim-floor beams adopted in the parameter study. Table 4 and Figure 22 compare the bending moment resistance ( M P R ) calculated using the proposed formulas with the maximum bending moment (MFE) predicted by FE modelling in the parameter study; overall, the predicted bending moment resistance from the proposed formulas is on the safe side, with an average MPR/MFE ratio of 0.79 and a standard deviation of 0.14. Overall, the difference between bending moments predicted by proposed formulas and predicted by FE simulation is less than 40%. The accuracy of the formula prediction is dependent on the shear connection degree and other structural features of the composite beams; however, the proposed formulas provide a safe prediction. The difference between the proposed formula prediction and FE modelling might contribute to the fact that the formula prediction does not consider the effect of the reinforcement mesh in the concrete slab and reinforcing rebar in the concrete dowel. Also, the formula method used a specific approach that only looked at the most important section and did not consider how the structure behaves along its length, like the varying contribution of shear connectors in different positions. Again, it is noted that the predicted resistances by the proposed method are more conservative for composite beams with a shear connection degree less than 40% than those of composite beams with a higher shear connection degree. For those composite beams with a shear connection degree higher than 40%, the formula prediction gave very good agreement compared to the FE modelling prediction; the average MPR/MFE ratio is 0.94 with a standard deviation of 0.14. Therefore, the proposed method may be recommended for predicting the bending moment resistance of composite slim-floor beams with a shear connection degree greater than 40%.

6. Conclusions

This paper presents the development of FE models of flexural composite slim-floor beams utilizing dowel shear connectors. After confirming the FE model’s accuracy, a parametric study covering the diameter of the concrete dowel, diameter of the reinforcing bar in the dowel, concrete strength, and shear connector central spacing was conducted to investigate the effects of these parameters on the structural behaviours of this type of composite beam. A calculation method based on the stress block method was developed to predict the bending moment capacity of flexural composite slim-floor beams using dowel shear connectors. The following main conclusions may be drawn:
  • The finite element (FE) model developed using ABAQUS [24] for the flexural composite slim-floor beam utilising dowel shear connectors can be used to predict the load-bearing capacity, deflection, end-slip, and failure patterns.
  • The load-bearing capacity of the composite beam increases with a bigger dowel diameter if the shear connection degree is less than 100%, no matter whether there is a reinforcing bar or not. However, the load-bearing capacity diminishes when the concrete dowel diameter exceeds 80 mm in the absence of reinforcing rebar. For composite beams with dowels that incorporate reinforcing rebar, the load-bearing capacity decreases sharply after reaching the maximum load when the dowel diameter exceeds 50 mm. This finding suggests that while a larger concrete dowel enhances the shear resistance of composite beams, it adversely affects the load-bearing capacity of steel beams. Consequently, an optimal dowel size should be considered in the design process. Regardless of dowel size, the composite beam shows excellent ductility. The maximum load corresponds to a midspan deflection over L/60. When the midspan deflection exceeds L/30, the reduction of maximum load capacity is less than 15%.
  • Concrete strength significantly influences the load-bearing capacity of the composite beams but not stiffness. The load-bearing capacity increases by approximately 5–10% for every 10 N/mm2 rise in concrete compressive strength. Importantly, when there is rebar in the dowel, the strength of the concrete has a smaller impact on the load-bearing capacity of composite beams because it is primarily the rebar that determines the strength of the shear connector. In terms of ductility, concrete strength appears to have minimal impact.
  • The diameter of the reinforcing rebar in the concrete dowel influences the load-bearing capacity but not the stiffness. The load-bearing capacity increases by approximately 2% when the diameter of the rebar is increased by 4 mm for composite beams with a dowel diameter of 40 mm. However, for composite beams with a dowel diameter of 80 mm, there is no noticeable increase in load-bearing capacity because, in larger concrete dowels, the concrete primarily governs the dowel shear resistance, making the rebar diameter less significant. The composite beams exhibit excellent ductility, with the maximum load remaining stable from L/60 midspan deflection to L/30 midspan deflection.
  • Both the load-bearing capacity and stiffness of composite beams increase with the dowel spacing reduction due to shear connection degree increases. The increase is more significant for composite beams with a smaller diameter of dowel because the shear connection degree is boosted quicker when dowel spacing is reduced. Furthermore, the distance between dowels influences the load-bearing capacity of the composite beam after it has reached the highest load, but the decrease in load capacity is less than 15% when the midspan deflection is from L/60 to L/30 and the end slip is more than 20 mm.
  • The proposed prediction method showed higher accuracy for those composite beams with a shear connection degree exceeding 40%. The average prediction-to-simulation ratio is 0.94 with a standard deviation of 0.14, although the overall average prediction-to-simulation proportion is 0.79, accompanied by a standard deviation of 0.14. Therefore, the proposed prediction method can be used for estimating the bending moment resistance of composite slim-floor beams with a shear connection degree above 40%.
  • The research has provided a deep comprehension of how various parameters influence the structural performance of slim-floor composite beams, and the suggested prediction method has proven to be accurate enough. However, the range of parameters considered is limited; in particular, the overall dimensions of composite beams, such as length, width, and thickness, are constant. Therefore, further research into the structural behaviour of slim-floor beams through experiments and numerical simulations employing a wider range of parameters is essential. Additionally, it would help with design if a prediction method could be developed that considers how the strength of shear connectors changes in different places along the composite beam.

Author Contributions

Conceptualization, D.L. and X.D.; methodology, X.X., X.D. and D.L.; validation and numerical simulation, X.X.; formal analysis, X.X. and X.D.; investigation, X.X.; data curation, X.X.; writing—original draft preparation, X.X. and X.D.; writing—review and editing, X.X. and X.D.; supervision, X.D. and D.L.; project administration, X.D.; All authors have read and agreed to the published version of the manuscript.

Funding

This research received no external funding.

Data Availability Statement

All data generated or analyzed in this research are included in this article.

Conflicts of Interest

The authors declare no conflict of interest.

References

  1. Ahmed, I.M.; Tsavdaridis, K.D. The evolution of composite flooring systems: Applications, testing, modelling and eurocode design approaches. J. Constr. Steel Res. 2019, 155, 286–300. [Google Scholar] [CrossRef]
  2. Simms, W.I.; Hughes, A.F. Composite Design of Steel Framed Buildings (SCI P359); The Steel Construction Institute: Ascot, UK, 2011; Available online: https://www.steelconstruction.info/images/c/c7/SCI_P359.pdf (accessed on 30 May 2025).
  3. Lawson, M.; Hicks, S.J. Design of Composite Beams with Large Web Openings (SCI P355); The Steel Construction Institute: Ascot, UK, 2022; Available online: https://www.steelconstruction.info/images/e/e7/SCI_P355.pdf (accessed on 30 May 2025).
  4. ArcelorMittal Europe—Long Products and Sections and Merchant Bars. Slim-Floor, an Innovative Concept for Floors. 2017. Available online: https://sections.arcelormittal.com/repository2/Sections/5_5_1_SlimFloor.pdf (accessed on 30 May 2025).
  5. Tsavdaridis, K.D.; D’Mello, C.; Huo, B.Y. Experimental and computational study of the vertical shear behaviour of partially encased perforated steel beams. Eng. Struct. 2013, 56, 805–822. [Google Scholar] [CrossRef]
  6. BS EN 1994-1-1; Eurocode 4—Design of Composite Steel and Concrete Structures. Part 1-1: General Rules and Rules for Buildings. European Committee for Standardization (CEN): Brussels, Belgium, 2005.
  7. Hosseinpour, E.; Baharom, S.; Badaruzzaman, W.H.W.; Al Zand, A.W. Push-out test on the web opening shear connector for a slim-floor steel beam: Experimental and analytical study. Eng. Struct. 2018, 163, 137–152. [Google Scholar] [CrossRef]
  8. Coldebella, G.; Ferreira, F.P.V.; De Nardin, S. Shear forces transfer in steel-concrete slim floor with circular web opening and PCHCS. Structures 2022, 38, 1295–1307. [Google Scholar] [CrossRef]
  9. Mesquita, L.C.; Marques, M.G.; Paes, J.L.R. Evaluation of the structural behavior of composite slim-floor beams with openings in the web. Eng. Proc. 2023, 53, 6. [Google Scholar] [CrossRef]
  10. Tsavdaridis, K.D.; McKinley, B.; Kacaroglu, B.N.; Corfar, D.; Lawson, R.M. Bending test of long-span ultra-shallow floor beam (USFB) with two lightweight concretes. Structures 2024, 66, 106895. [Google Scholar] [CrossRef]
  11. Baldassino, N.; Roverso, G.; Ranzi, G.; Zandonini, R. Service and Ultimate Behaviour of Slim Floor Beams: An Experimental Study. Structures 2019, 17, 74–86. [Google Scholar] [CrossRef]
  12. Sheehan, T.; Dai, X.; Yang, J.; Zhou, K.; Lam, D. Flexural behaviour of composite slim floor beams. Structures 2019, 21, 22–32. [Google Scholar] [CrossRef]
  13. Dai, X.; Lam, D.; Sheehan, T.; Yang, J.; Zhou, K. Effect of dowel shear connector on performance of slim-floor composite shear beams. J. Constr. Steel Res. 2020, 173, 106243. [Google Scholar] [CrossRef]
  14. Junior, S.E.P.; Ferreira, F.P.V.; Tsavdaridis, K.D.; De Nardin, S. Flexural behavior of steel–concrete ultra-shallow floor beams (USFBs) with precast hollow-core slabs. Eng. Struct. 2023, 278, 115524. [Google Scholar] [CrossRef]
  15. Allali, A.A.; Tsavdaridis, K.D. Experimental investigation on flexural behaviour of prefabricated ultra-shallow steel concrete composite slabs. J. Constr. Steel Res. 2024, 217, 108632. [Google Scholar] [CrossRef]
  16. Lin, Z.; Monti, G.; Wu, Z. Composite action in Shallow Steel-beam-Concrete Composite decks. Eng. Struct. 2023, 286, 116114. [Google Scholar] [CrossRef]
  17. Xia, Y.; Han, C.; Zhou, D.; Wang, Y.; Wang, P. Ultimate flexural strength analysis of composite slim floor beam. Adv. Struct. Eng. 2021, 24, 2214–2226. [Google Scholar] [CrossRef]
  18. Chen, S.; Limazie, T.; Tan, J. Flexural behavior of shallow cellular composite floor beams with innovative shear connections. J. Constr. Steel Res. 2015, 106, 329–346. [Google Scholar] [CrossRef]
  19. Lam, D.; Dai, X.; Kuhlmann, U.; Raichle, J.; Braun, M. Slim-floor construction—Design for ultimate limit state. Steel Constr. 2015, 8, 79–84. [Google Scholar] [CrossRef]
  20. Limazie, T.; Chen, S. Numerical procedure for nonlinear behavior analysis of composite slim floor beams. J. Constr. Steel Res. 2015, 106, 209–219. [Google Scholar] [CrossRef]
  21. Huo, B.Y.; D’Mello, C.A. Shear Transferring Mechanisms in a Composite Shallow Cellular Floor Beam with Web Openings. Structures 2017, 9, 134–146. [Google Scholar] [CrossRef]
  22. Limazie, T.; Chen, S. FE modeling and numerical investigation of shallow cellular composite floor beams. J. Constr. Steel Res. 2016, 119, 190–201. [Google Scholar] [CrossRef]
  23. Limazie, T.; Chen, S. Effective shear connection for shallow cellular composite floor beams. J. Constr. Steel Res. 2017, 128, 772–788. [Google Scholar] [CrossRef]
  24. Dassault Systèmes. Abaqus/CAE 2022; Dassault Systèmes SIMULIA Corp.: Cleveland, OH, USA, 2022. [Google Scholar]
  25. BS EN 1992-1-1:2004; Eurocode 2—Design of Concrete Structures-Part 1-1. General Rules and Rules for Buildings. British Standards Institution (BSI): London, UK, 2010.
  26. Qureshi, J.; Lam, D.; Ye, J. Effect of shear connector spacing and layout on the shear connector capacity in composite beams. J. Constr. Steel Res. 2011, 67, 706–719. [Google Scholar] [CrossRef]
Figure 1. Dimensions of specimen (BT 1a) and centric loading diagram.
Infrastructures 10 00146 g001
Figure 2. Composite beam components, assembling, loading regime, and boundary conditions in the FE model (corresponding to test specimen BT4).
Infrastructures 10 00146 g002
Figure 3. Concrete compressive/tensile stress vs. strain relationships and damage mechanisms (for BT4).
Infrastructures 10 00146 g003
Figure 4. Comparison of load vs. mid-span deflection and load vs. end-slip curves obtained from tests (Sheehan T et al. [12]) and predicted by FE models.
Infrastructures 10 00146 g004aInfrastructures 10 00146 g004b
Figure 5. Comparison of concrete slab crack position and distribution predicted by FE model and observed from test.
Infrastructures 10 00146 g005
Figure 6. Comparison of end slip predicted by FE model and observed from test.
Infrastructures 10 00146 g006
Figure 7. Comparison of load vs. mid-span deflection and load vs. end-slip relationships of composite slim-floor beams using different concrete dowel diameters (with reinforcing rebar 16 mm).
Infrastructures 10 00146 g007
Figure 8. Comparison of load vs. mid-span deflection and load vs. end-slip relationships of composite slim-floor beams using different concrete dowel diameters (without reinforcing rebar).
Infrastructures 10 00146 g008
Figure 9. Comparison of load vs. mid-span deflection and load vs. end-slip relationships of composite slim-floor beams using different concretes (40 mm diameter dowel with 16 mm reinforcing bar).
Infrastructures 10 00146 g009
Figure 10. Comparison of load vs. mid-span deflection and load vs. end-slip relationships of composite slim-floor beams using different concretes (80 mm diameter dowel without reinforcing bar).
Infrastructures 10 00146 g010
Figure 11. Comparison of load vs. mid-span deflection and load vs. end-slip relationships of composite slim-floor beams using different reinforcing bars in dowels of 40 mm diameter.
Infrastructures 10 00146 g011
Figure 12. Comparison of load vs. mid-span deflection and load vs. end-slip relationships of composite slim-floor beams using different reinforcing bars in dowels of 80 mm diameter.
Infrastructures 10 00146 g012
Figure 13. Comparison of load vs. mid-span deflection and load vs. end-slip relationships of composite slim-floor beams with different dowel spacing (dowel diameter 40 mm with 16 mm rebar).
Infrastructures 10 00146 g013
Figure 14. Comparison of load vs. mid-span deflection and load vs. end-slip relationships of composite slim-floor beams with different dowel spacing (dowel diameter 80 mm with 16 mm rebar).
Infrastructures 10 00146 g014
Figure 15. Neutral axis NA at the web of the steel beam.
Infrastructures 10 00146 g015
Figure 16. Neutral axis NA at the bottom flange of the steel beam.
Infrastructures 10 00146 g016
Figure 17. Composite beam cross-section with dowel holes in the web.
Infrastructures 10 00146 g017
Figure 18. NA in steel web above the dowel hole.
Infrastructures 10 00146 g018
Figure 19. NA in steel web below the dowel hole.
Infrastructures 10 00146 g019
Figure 20. NA passing through the dowel hole.
Infrastructures 10 00146 g020
Figure 21. Comparison of bending moment resistances predicted by the proposed formulas and those obtained from experimental study.
Infrastructures 10 00146 g021
Figure 22. Comparison of bending moment resistances predicted by proposed formulas and by FE modelling.
Infrastructures 10 00146 g022
Table 1. Summary of the key features of test specimens.
Specimen
ID
Loading Regime (mm)Shear Connector TypeDowel Diameter (mm)Rebar Diameter (mm)Beam Depth (mm)SC Spacing (mm)Design Shear Connection Degree
BT 1aConcentricDowel401624050040%
BT 1bConcentric---240-0
BT 2EccentricDowel401624050040%
BT 3ConcentricDowel4016240250100%
BT 4ConcentricDowel4016240100025%
BT 5ConcentricDowel401620050050%
BT 6Eccentric---240-0
BT 7ConcentricStud--24037540%
BT 8ConcentricDowel80-24050064%
Note: SC spacing is the centre-to-centre spacing of shear connectors.
Table 2. Comparison of loads at different deformations obtained from tests and predicted by FE models.
Specimen IDMaximum LoadLoad at 6 mm End SlipLoad at 30 mm Mid-Span DeflectionLoad at 60 mm Mid-Span Deflection
PEX-M (KN)PFE-M (KN)PEX-M/PFE-MPEX-6 (kN)PFE-6 (kN)PEX-6/PFE-6PEX-30 (kN)PFE-30 (kN)PEX-30/PFE-30PEX-60 (kN)PFE-60 (kN)PEX-60/PFE-60
BT1a5355071.0554764611.0332963210.9224364081.069
BT1b6305741.0985885581.0542783360.8255065130.986
BT24924511.0914204440.9462462870.8573924430.885
BT36686341.0545416350.8523373700.9114976960.714
BT44794940.9704304360.9862612461.0613984020.990
BT54694341.0814124091.0072252270.9913763800.989
BT64193871.0833263630.8982512201.1413713501.060
BT76986541.0676786531.0383403790.8975306160.860
BT85535311.0415054901.0313352981.1244564561.000
Average 1.060 0.983 0.970 0.950
SD 0.036 0.066 0.108 0.0106
Note: PEX-M and PFE-M are maximum loads obtained from the test and FE model, respectively; PEX-6 and PFE-6 are loads corresponding to 6 mm end slip, obtained from the test and FE model, respectively; PEX-30 and PFE-30 are loads corresponding to 30 mm mid-span deflection, obtained from the test and FE model, respectively; and PEX-60 and PFE-60 are loads corresponding to 60 mm mid-span deflection, obtained from the test and FE model, respectively.
Table 3. Comparison of maximum bending moments predicted by the proposed method and those observed in the experimental study.
Specimen
ID
Rebar Diameter (mm)Dowel Hole Diameter
(mm)
Concrete Strength (N/mm2)SC Spacing (mm)Design Shear Connection Degree M T E S T
(kNm)
M P R
(kNm)
M P R / M T E S T
BT1a16404150040%604.1499.80.827
BT1b--27.5-0455.3455.11.000
BT2164035.650040%554.6497.70.897
BT3164044.5250100%725.6715.50.986
BT4164043.1100025%539.4397.30.737
BT5164038.450050%531.9496.70.934
BT6--47.9-0455.6399.70.877
BT8-8047.950064%624.2536.80.860
Average 0.891
SD 0.086
Table 4. Comparison of bending moments predicted by proposed expressions and by FE modelling.
FE Model IDRebar Diameter (mm)Dowel Hole Diameter (mm)Concrete StrengthSC Spacing (mm)SC Degree (%) M F E   ( k N m ) M P R   ( k N m ) M P R / M F E
BT4-11640C25/30100028499.5372.780.75
BT4-21640C30/37100029519.75380.450.73
BT4-31640C40/50100030555.3393.150.71
BT4-41640C50/60100031574.875403.050.70
BT4-51640C38250100591.148689.561.17
BT4-61640C3837574550.828578.961.05
BT4-71640C3850055479.568449.440.94
BT4-81640C38100030458.212391.780.86
BT4-9160C3810000419.98303.690.72
BT4-101640C38100030470.896391.780.83
BT4-111650C38100029490.832384.420.78
BT4-121660C38100029471.756381.430.81
BT4-131670C38100030486.592382.880.79
BT4-14040C38100011460.132310.950.68
BT4-151240C38100021467.624353.490.76
BT4-161640C38100030470.896391.780.83
BT4-172040C38100041475.1438.570.92
BT4-182440C38100058478.74510.891.07
BT5-1x40C30/3750019524.72340.350.65
BT5-2x60C30/3750023533.448350.340.66
BT5-3x80C30/3750027538.928361.290.67
BT5-4x100C30/3750030524.248368.790.70
BT5-5x120C30/3750034515.26380.720.74
BT5-6x140C30/3750037516.54388.650.75
BT5-7x80C25/30100027514.336355.680.69
BT5-8x80C30/37100027538.928361.290.67
BT5-9x80C40/50100027585.576368.330.63
BT5-10x80C50/60100027614.076372.790.61
BT5-11x80C30/37100027543.884361.290.66
BT5-121280C30/37100042641.412422.680.66
BT5-131680C30/37100054640.088471.790.74
BT5-142080C30/37100069641.564533.180.83
BT5-152480C30/37100088653.412610.930.93
BT5-162080C30/37125100641.196660.041.03
BT5-172080C30/37250100646.512660.041.02
BT5-182080C30/3737594655.424635.490.97
BT5-192080C30/3750069641.564533.180.83
BT5-202080C30/37100038617.864406.310.66
Average 0.79
SD 0.14
Disclaimer/Publisher’s Note: The statements, opinions and data contained in all publications are solely those of the individual author(s) and contributor(s) and not of MDPI and/or the editor(s). MDPI and/or the editor(s) disclaim responsibility for any injury to people or property resulting from any ideas, methods, instructions or products referred to in the content.

