Article

Dynamic Response of Bottom-Sitting Steel Shell Structures Subjected to Underwater Shock Waves

1
Defense Engineering Institute, Academy of Military Sciences (AMS), People’s Liberation Army of China (PLA), Beijing 100850, China
2
School of Aeronautical Engineering, Air Force Engineering University, Xi’an 710038, China
*
Author to whom correspondence should be addressed.
Infrastructures 2025, 10(6), 130; https://doi.org/10.3390/infrastructures10060130
Submission received: 28 April 2025 / Revised: 20 May 2025 / Accepted: 26 May 2025 / Published: 28 May 2025

Abstract

This study examines the dynamic response of bottom-sitting steel shell structures subjected to underwater shock waves. A computational framework integrating the Arbitrary Lagrangian Eulerian (ALE) method was implemented in finite-element analysis to simulate three-dimensional interactions between shock waves and curved shell geometries (hemispherical and cylindrical configurations). An analysis of the impacts of shock-wave propagation media, explosive distance, charge equivalence, hydrostatic pressure, and shell thickness on the dynamic response of these bottom-sitting shell structures is conducted. The findings reveal that the deformation of semi-spherical steel shells subjected to underwater shock waves is significantly greater than that of shells subjected to air shock waves, with effective stress reaching up to 831.4 MPa underwater. The mechanical deformation of curved steel shells exhibits a gradual increase with increasing explosive equivalents. The center displacement of the hemispherical shell at 800 kg equivalent is 6 times that at 50 kg equivalent. Within the range of 0 to 2.0092 MPa, hydrostatic pressure leads to an approximate 26.34% increase in the center vertical displacement of the semi-cylindrical shell compared with 0 MPa, while restricting horizontal convex deformation. Increasing thickness from 0.025 m to 0.05 m results in a reduction of approximately 60% in the center vertical displacement of the semi-cylindrical shell. These quantitative correlations provide critical benchmarks for enhancing the blast resilience of underwater foundation systems.

1. Introduction

Underwater structures, such as pipelines and tunnels, confront substantial dangers from surface or underwater explosions, as evidenced by both experimental research and actual occurrences [1,2]. For instance, the North Stream Pipeline endured substantial harm from an underwater explosion [3], leading to a major leakage. An explosion may generate excessive stresses and strains within the structure, potentially undermining its integrity and causing localized damage and possible collapse. Thus, evaluating the structural damage resulting from underwater explosions is of utmost importance.
The advancement of underwater civil engineering has led to structures like the North Stream Pipeline. However, these face extreme explosive loads. Scholars have studied the shell structures’ dynamic response. Hung et al. [4] used a small-tank explosion test to investigate three cylindrical shell structures, emphasizing the coupled effect of primary shock waves and bubble pulsation. Li et al. [5] further studied interlayer water-bearing bilayer cylindrical shells, quantifying shockwave–bubble pulsation coupling, complementing Hung’s work. Kristoffersen et al. [6] evaluated underwater floating tunnels, showing geometric effects but neglecting fluid–structure interactions. Brett et al. [7,8] first found that near-field explosions affecting thin-walled cylinders induced a deformation rate surge at R/W1/3 = 3, highlighting the shock wave intensity’s role. Then, they revealed bubble collapse-generated micro-jets causing over 300 MPa of stress at cylinder ends, proving secondary fluid dynamics’ critical role. However, these studies overlooked hydrostatic pressure and other key factors. Huang et al. [9] compared O-type and T-type reinforced double cylindrical shells, showing O-type’s better compressive performance under large plastic deformation. Zhang et al. [10] used an underwater shock tube on spherical shells. Considering tests’ high-cost drawbacks, numerical simulation is becoming an effective way.
Recent advances in structural damage identification provide cross-disciplinary insights in underwater structure research. Li et al. [11] pioneered dynamic strain-based damage assessment for steel frames, offering a methodological foundation for shock-wave-induced damage analysis in underwater shells. Razavi et al. [12] systematically compared damage-identification techniques, emphasizing their applicability to data analysis in underwater explosion scenarios. Danai et al. [13] developed a damage-localization method, demonstrating the versatility of dynamic response approaches in underwater damage assessment, which directly aids our analysis of shell deformations. Numerical simulation has become indispensable for studying structural dynamics in response to underwater explosions, requiring analysis of both structural and fluid responses and their interaction. Kwon et al. [14,15] combined numerical and experimental methods to investigate the nonlinear responses of cylindrical shells to far-field underwater explosions, highlighting the complexity of fluid–structure interactions. Nayak et al. [16] innovatively integrated machine learning with multiscale finite element simulation to predict the near-field responses of clad composite cylindrical shells, enhancing predictive accuracy for complex structures. Gannon [17] employed the coupled Euler–Lagrange (CEL) method to model reinforced cylindrical shells under near-field explosions, capturing dynamic stress distributions. Praba et al. [18,19] utilized LS-DYNA to simulate annular reinforced cylindrical shells, explicitly considering fluid–structure coupling, strain rate effects, and geometric/material nonlinearity, which are critical for high-fidelity modeling. Yin et al. [20] numerically analyzed the damping effects of surface protections on double-layered cylindrical shells, validating their model through non-contact explosion experiments to ensure reliability. Peng et al. [21] applied coupled SPH and RKPM methods to simulate near-field explosion damage, quantifying dynamic responses with particle-based techniques. Yang et al. [2,22,23] systematically studied immersed tube tunnels under various explosion loads, providing insights into damage mitigation for large-scale underwater structures. Brochard et al. [24], building on Wierzbicki and Fatt’s tandem method [25], developed a simplified approach for deeply immersed cylinders, verified via LS-DYNA to balance accuracy and computational efficiency. Numerical simulation’s ability to replicate explosion physics while saving costs has driven its adoption. The Lagrangian method excels in tracking material interfaces but struggles with large deformations, whereas the Eulerian method handles fluid flows efficiently but faces interface-tracking challenges. The ALE method, combining both advantages via adaptive node motion [26,27,28,29], is therefore employed here to investigate bottom-sitting shell dynamics subjected to underwater shock waves, ensuring robust modeling of complex interactions.
Existing research highlights spherical and cylindrical pressure-resistant shells as dominant in underwater structures, with spherical shells used in deep-sea submersibles [30,31] and sonar covers for their optimal weight-displacement ratio and stress analysis advantages, though limited by internal layout complexity and fluid resistance. Cylindrical shells, widely applied in immersed tube tunnels and pipelines, offer processing and space-utilization benefits but suffer from high weight-to-displacement ratios and require rib reinforcement under high pressure [32]. Material selection for such shells balances cost and performance: high-strength marine steel, used in ‘Star One’ and ‘Kuroshio-2’ submersibles [33,34], provides design flexibility and economy, in contrast to titanium/aluminum alloys’ higher processing costs [35]. Ceramic materials, despite their damage resistance, are restricted by cost and brittleness. Thus, steel is chosen for bottom-sitting semi-spherical/cylindrical shells to optimize material efficiency [36]. Bottom-sitting structures, fixed in position, face dual threats from precision strikes and far-field underwater shock waves. Studying their deformation patterns and vertical displacement under such loads is critical for constructing safe underwater infrastructure components like space stations, as these responses directly impact structural integrity and operational safety.
Unlike explosions in air or rock, underwater shock waves exhibit distinct characteristics—high overpressure peaks, slow attenuation, and a broad propagation range—leading to more severe damaging impacts on adjacent structures in water than on land [37,38]. In addition, research on the dynamic response of shell structures under underwater explosion shock waves rarely considers the effect of hydrostatic pressure [24]. However, Gupta et al. [39] discovered that substantial hydrostatic pressure has a notable impact on the dynamic response of a cylinder when exposed to a shock wave. Even a weak shock wave could lead to significant damage, potentially causing the entire structure to collapse. Thus, to advance the construction of underwater bottom-sitting shell structures and the evolution of their protective technologies, this study examines the influences of explosive distance, explosive equivalent, hydrostatic pressure, and shell thickness on the dynamic responses of semi-spherical and semi-cylindrical bottom-sitting steel shells under underwater shock waves. These results intend to offer a scientific foundation for the engineering design and enhancement of protective measures for marine bottom-sitting structures.

2. Materials

2.1. Explosive

The detonation of TNT initiates a rapid phase transition from condensed solid to high-energy gas, governed thermodynamically by the Jones–Wilkins–Lee (JWL) equation of state:
P = A ( 1 ω R 1 V ) e R 1 V + B ( 1 ω R 2 V ) e R 2 V + ω E 0 V
In this equation, P represents the pressure; A, B, and ω act as pressure coefficients; V denotes the specific volume; E0 represents the initial specific internal energy; and R1 and R2 define eigenvalues governing expansion dynamics. The specific parameters for the explosive are presented in Table 1 [40].

2.2. Water

Water was characterized using the Gruneisen equation of state (EOS), where pressure is defined as
p = ρ 0 C 2 μ 1 + ( 1 γ 0 2 ) μ a 2 μ 2 1 ( S 1 1 ) μ S 2 μ 2 μ + 1 S 3 μ 3 ( μ + 1 ) 2 + ( γ 0 + a μ ) E μ > 0 ρ 0 C 2 μ + ( γ 0 + a μ ) E μ < 0
Here, the specific volume is given by μ = ρ/ρ0 − 1, where ρ denotes the water density, and ρ0 serves as the reference density. C denotes the intercept of the particle velocity curve vs(vp). S1, S2, and S3 are dimensionless Hugoniot slope coefficients. γ0 represents the Gruneisen coefficient, and a is a dimensionless first-order volumetric correction term. Experimentally calibrated EOS parameters for freshwater, validated against shock tube data [3], are summarized in Table 2.
The fluid–structure coupling interface is handled by the ALE algorithm, satisfying the following governing equations:
u = 0
ρ v t + u u = p + μ 2 u + f
where u is particle velocity, p stands for fluid pressure, μ denotes dynamic viscosity, and f signifies body force. At the coupling interface, fluid pressure and structural stress satisfy the equilibrium condition p fluid = σ structure n , where σstructure is the shell stress tensor, and n is the interface normal vector.

2.3. Air

The air is described by the linear polynomial equation of state, as follows:
P = C 0 + C 1 μ + C 2 μ 2 + C 3 μ 3 + ( C 4 + C 5 μ + C 6 μ 2 ) E 0
Here, the specific volume μ is defined as μ = ρ/ρ0 − 1, with ρ denoting the air density and ρ0 the reference density. The constants C0C6 serve as the coefficients of the equation of state (EOS), and E0 represents the initial internal energy per unit reference volume of air. The parameters for the air material are presented in Table 3 [41].

2.4. Q690 Steel

The constitutive behavior of Q690 steel was characterized using the Johnson–Cook plasticity model [42], which integrates strain hardening, rate sensitivity, and thermal softening effects:
σ = A + B ( ε p ) n 1 + C · ln ε p ε 1 ( 1 + T * m )
Here, A represents the initial yield stress; B and n stand for the strain hardening coefficient and exponent, respectively; C is the strain rate sensitivity coefficient; εp and εp are the plastic strain and plastic strain rate (set to the default value of 1s-1 in LS-DYNA), respectively; is the equivalent plastic strain and strain rate; and T*m = (TTr)(TmTr) is the homologous temperature. Since this study focuses on dynamic responses at room temperature, temperature effects were not included, and the parameter m was not activated (marked as ‘-’ in Table 4). The detailed parameters are presented in Table 4 [42].

3. Validation of the Numerical Simulation Method and Related Parameters

Shock wave pressure decays exponentially in the water domain, and the peak shock wave pressure has the most significant effect on the underwater structure. This validation of shock wave pressure is pivotal, as it serves as the core foundation for the entire numerical model. The accuracy of Cole’s formula verification not only ensures the correctness of pressure values, but also confirms the model’s capability to capture the propagation laws of shock waves, such as attenuation characteristics and spherical diffusion, which are prerequisites for fluid–structure coupling analysis. Hence, an ALE numerical model for underwater explosion in a 3D infinite water free-field was developed. The accuracy of the numerical simulation approach and associated parameters was validated using Cole’s peak shock wave pressure empirical formula, as presented in Equation (7) [43].
The schematic of the measurement point arrangement for a 3D infinite water free-field underwater explosion is depicted in Figure 1. Using LS-DYNA SMP R11.1.0 software, a 3D infinite water free-field underwater explosion ALE model was created, as illustrated in Figure 2. The water domain is a cylinder having a bottom radius of 4 m and an axial length of 13 m. Air, water, and TNT were modeled using Euler’s method. The explosive was configured in volume-fraction form, and a 300 kg spherical TNT charge was chosen for this analysis. Nodes on the one-fourth symmetrical surface of the model were assigned symmetrical constraints, and the outer surface of the water domain was defined as non-reflecting. To guarantee numerical reliability and computational efficiency, a mesh sensitivity analysis was performed using three schemes (coarse: 0.14 m, medium: 0.13 m, fine: 0.12 m). In this research, the explosive distances of the pressure test points were set as 3 m, 4 m, 5 m, 6 m, 7 m, 8 m, and 9 m. Comparison of the numerical simulation and theoretical calculation of the peak shock wave pressure under different explosion distances are shown in Table 5.
The propagation of shock waves from underwater explosions in water follows nonlinear hydrodynamic laws, with peak pressure decay characteristics described by Cole’s theory. For TNT explosives, the decay formula for shock wave overpressure Pm with standoff distance is
P m = k W 1 / 3 R α
where W is the mass of explosives (kg); R is the standoff distance (m); and k = 53.3 and α = 1.13 (they are dimensionless fitting coefficients calibrated for underwater blast propagation).
The numerical simulation findings, which are displayed in Table 5, indicate that the shock wave’s peak pressure does not significantly alter as the grid size changes. Table 5 displays the discrepancy between the theoretical and simulated values with different grid sizes. The numerical simulation findings have a good degree of consistency with the theoretical calculation results, as evidenced by the less than 9.77% difference between the simulated and theoretical values. The applicability of the numerical simulation method and the accuracy of material parameter selection were verified.

4. Discussion and Analysis of Results from Numerical Simulation

By employing the verified numerical simulation method and relevant parameters, a finite element model was constructed to explore how shock wave transmission medium, explosive distance, explosive equivalent, hydrostatic pressure, and shell thickness affect the dynamic behavior of semi-spherical and semi-cylindrical bottom-sitting shell structures under underwater shock waves.

4.1. Numerical Model

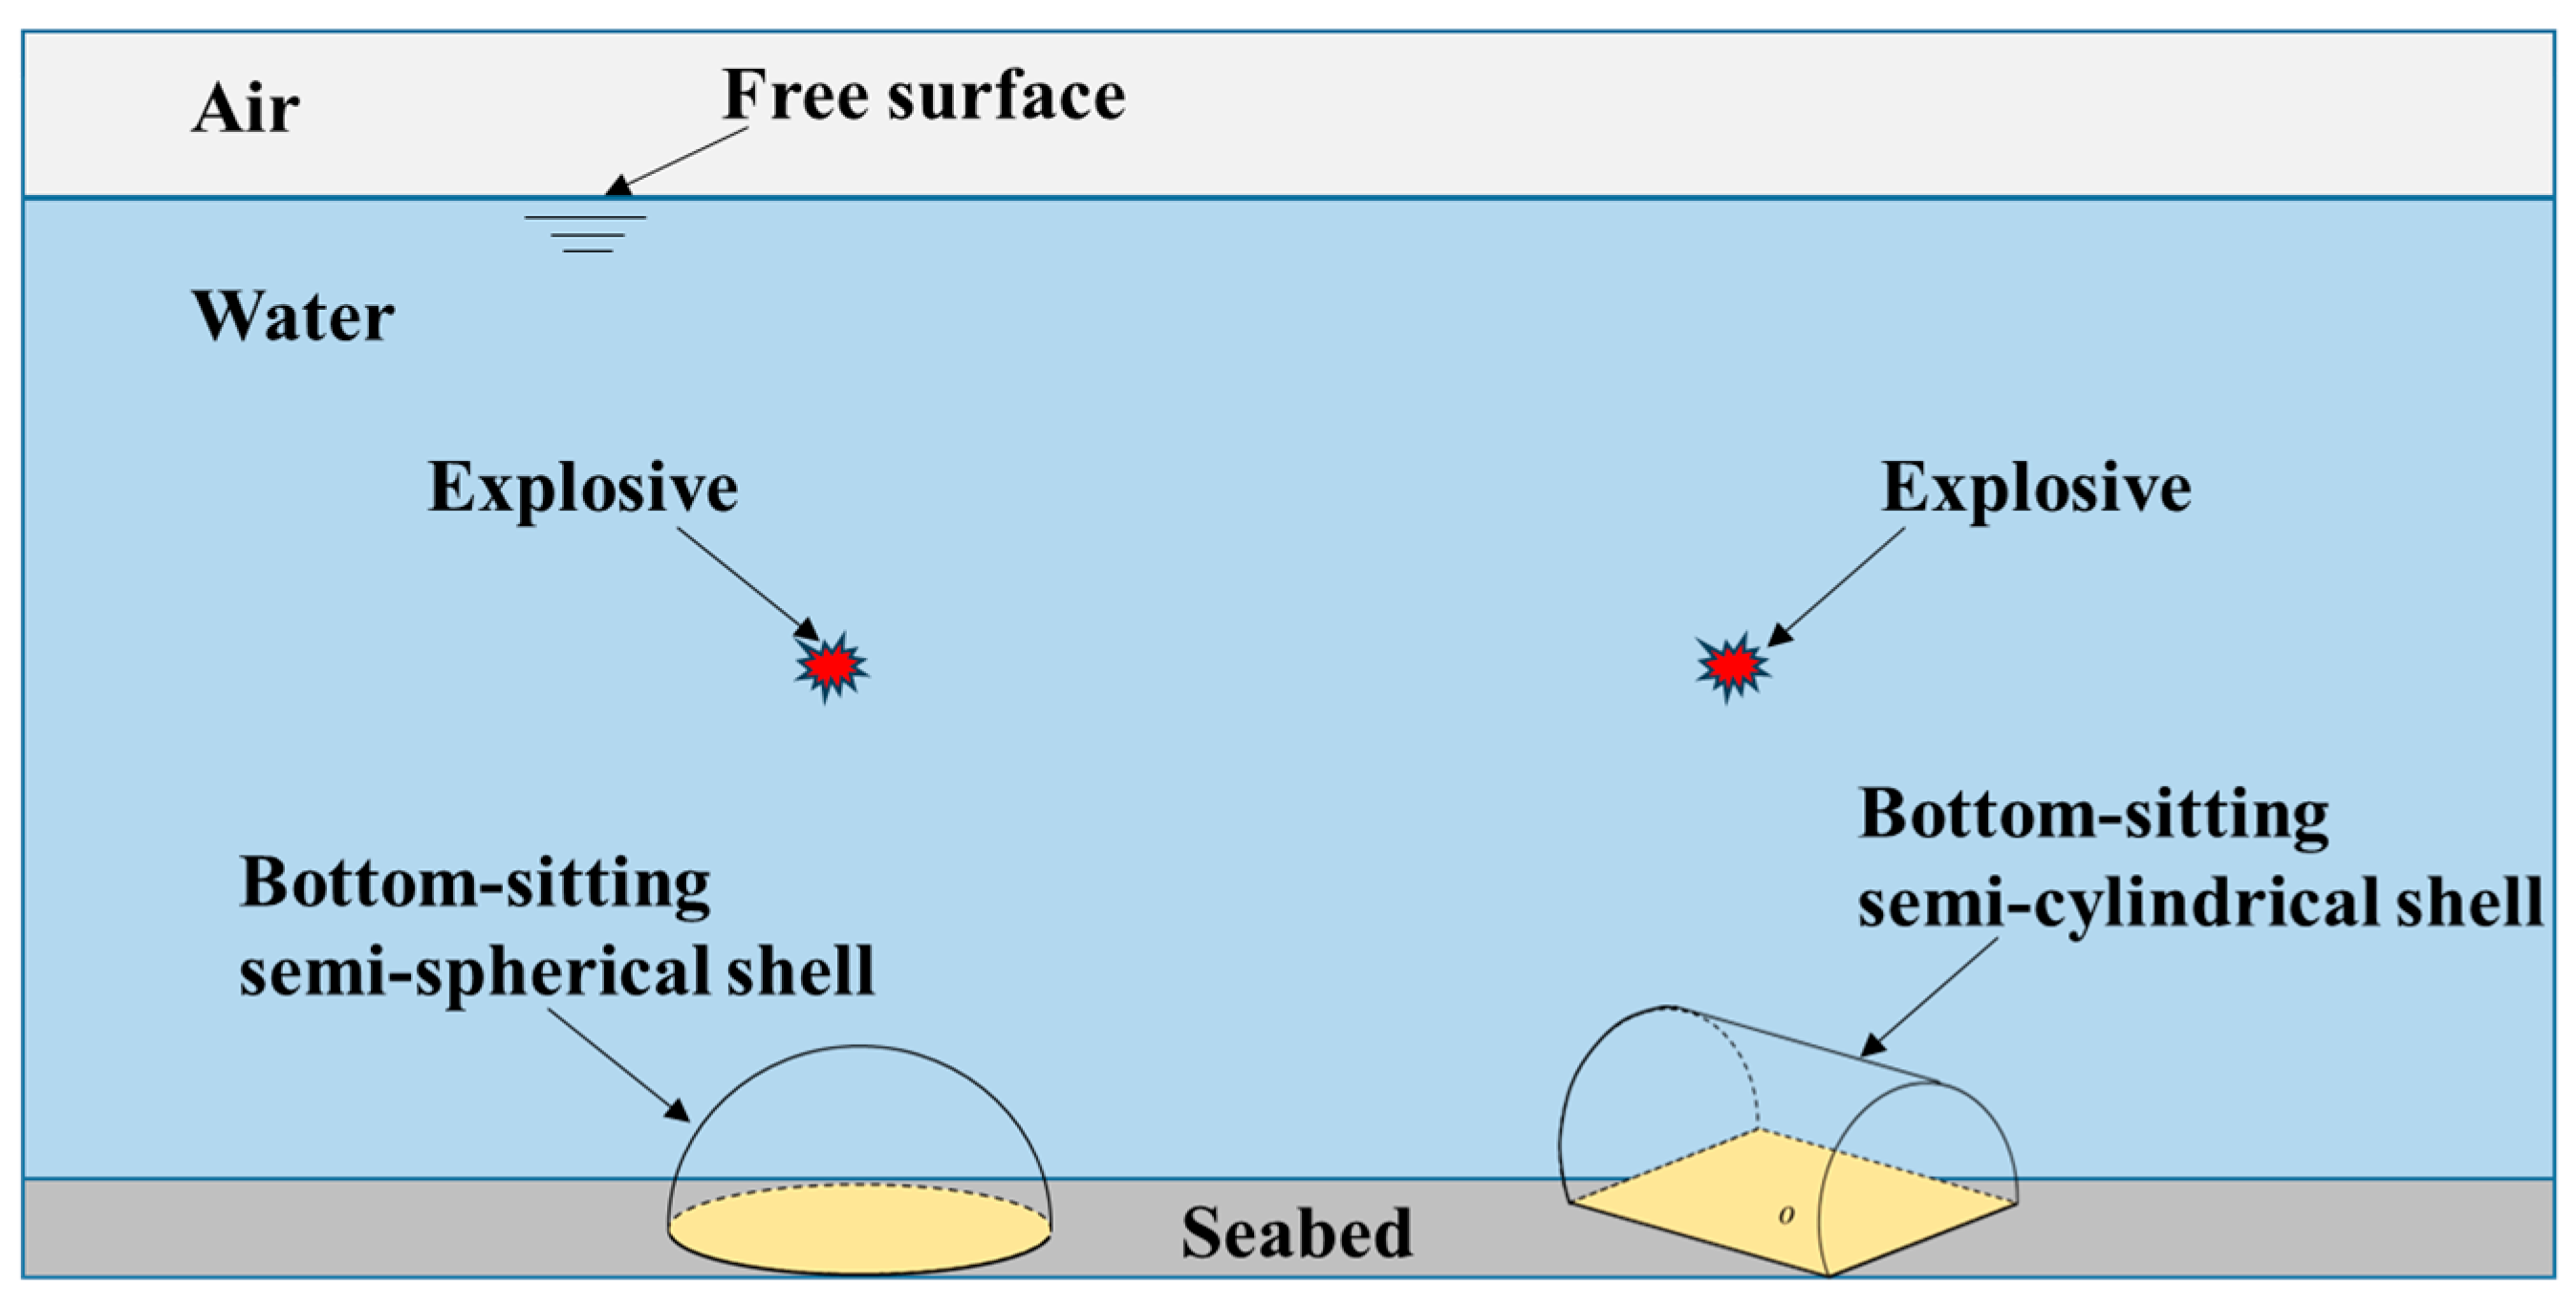
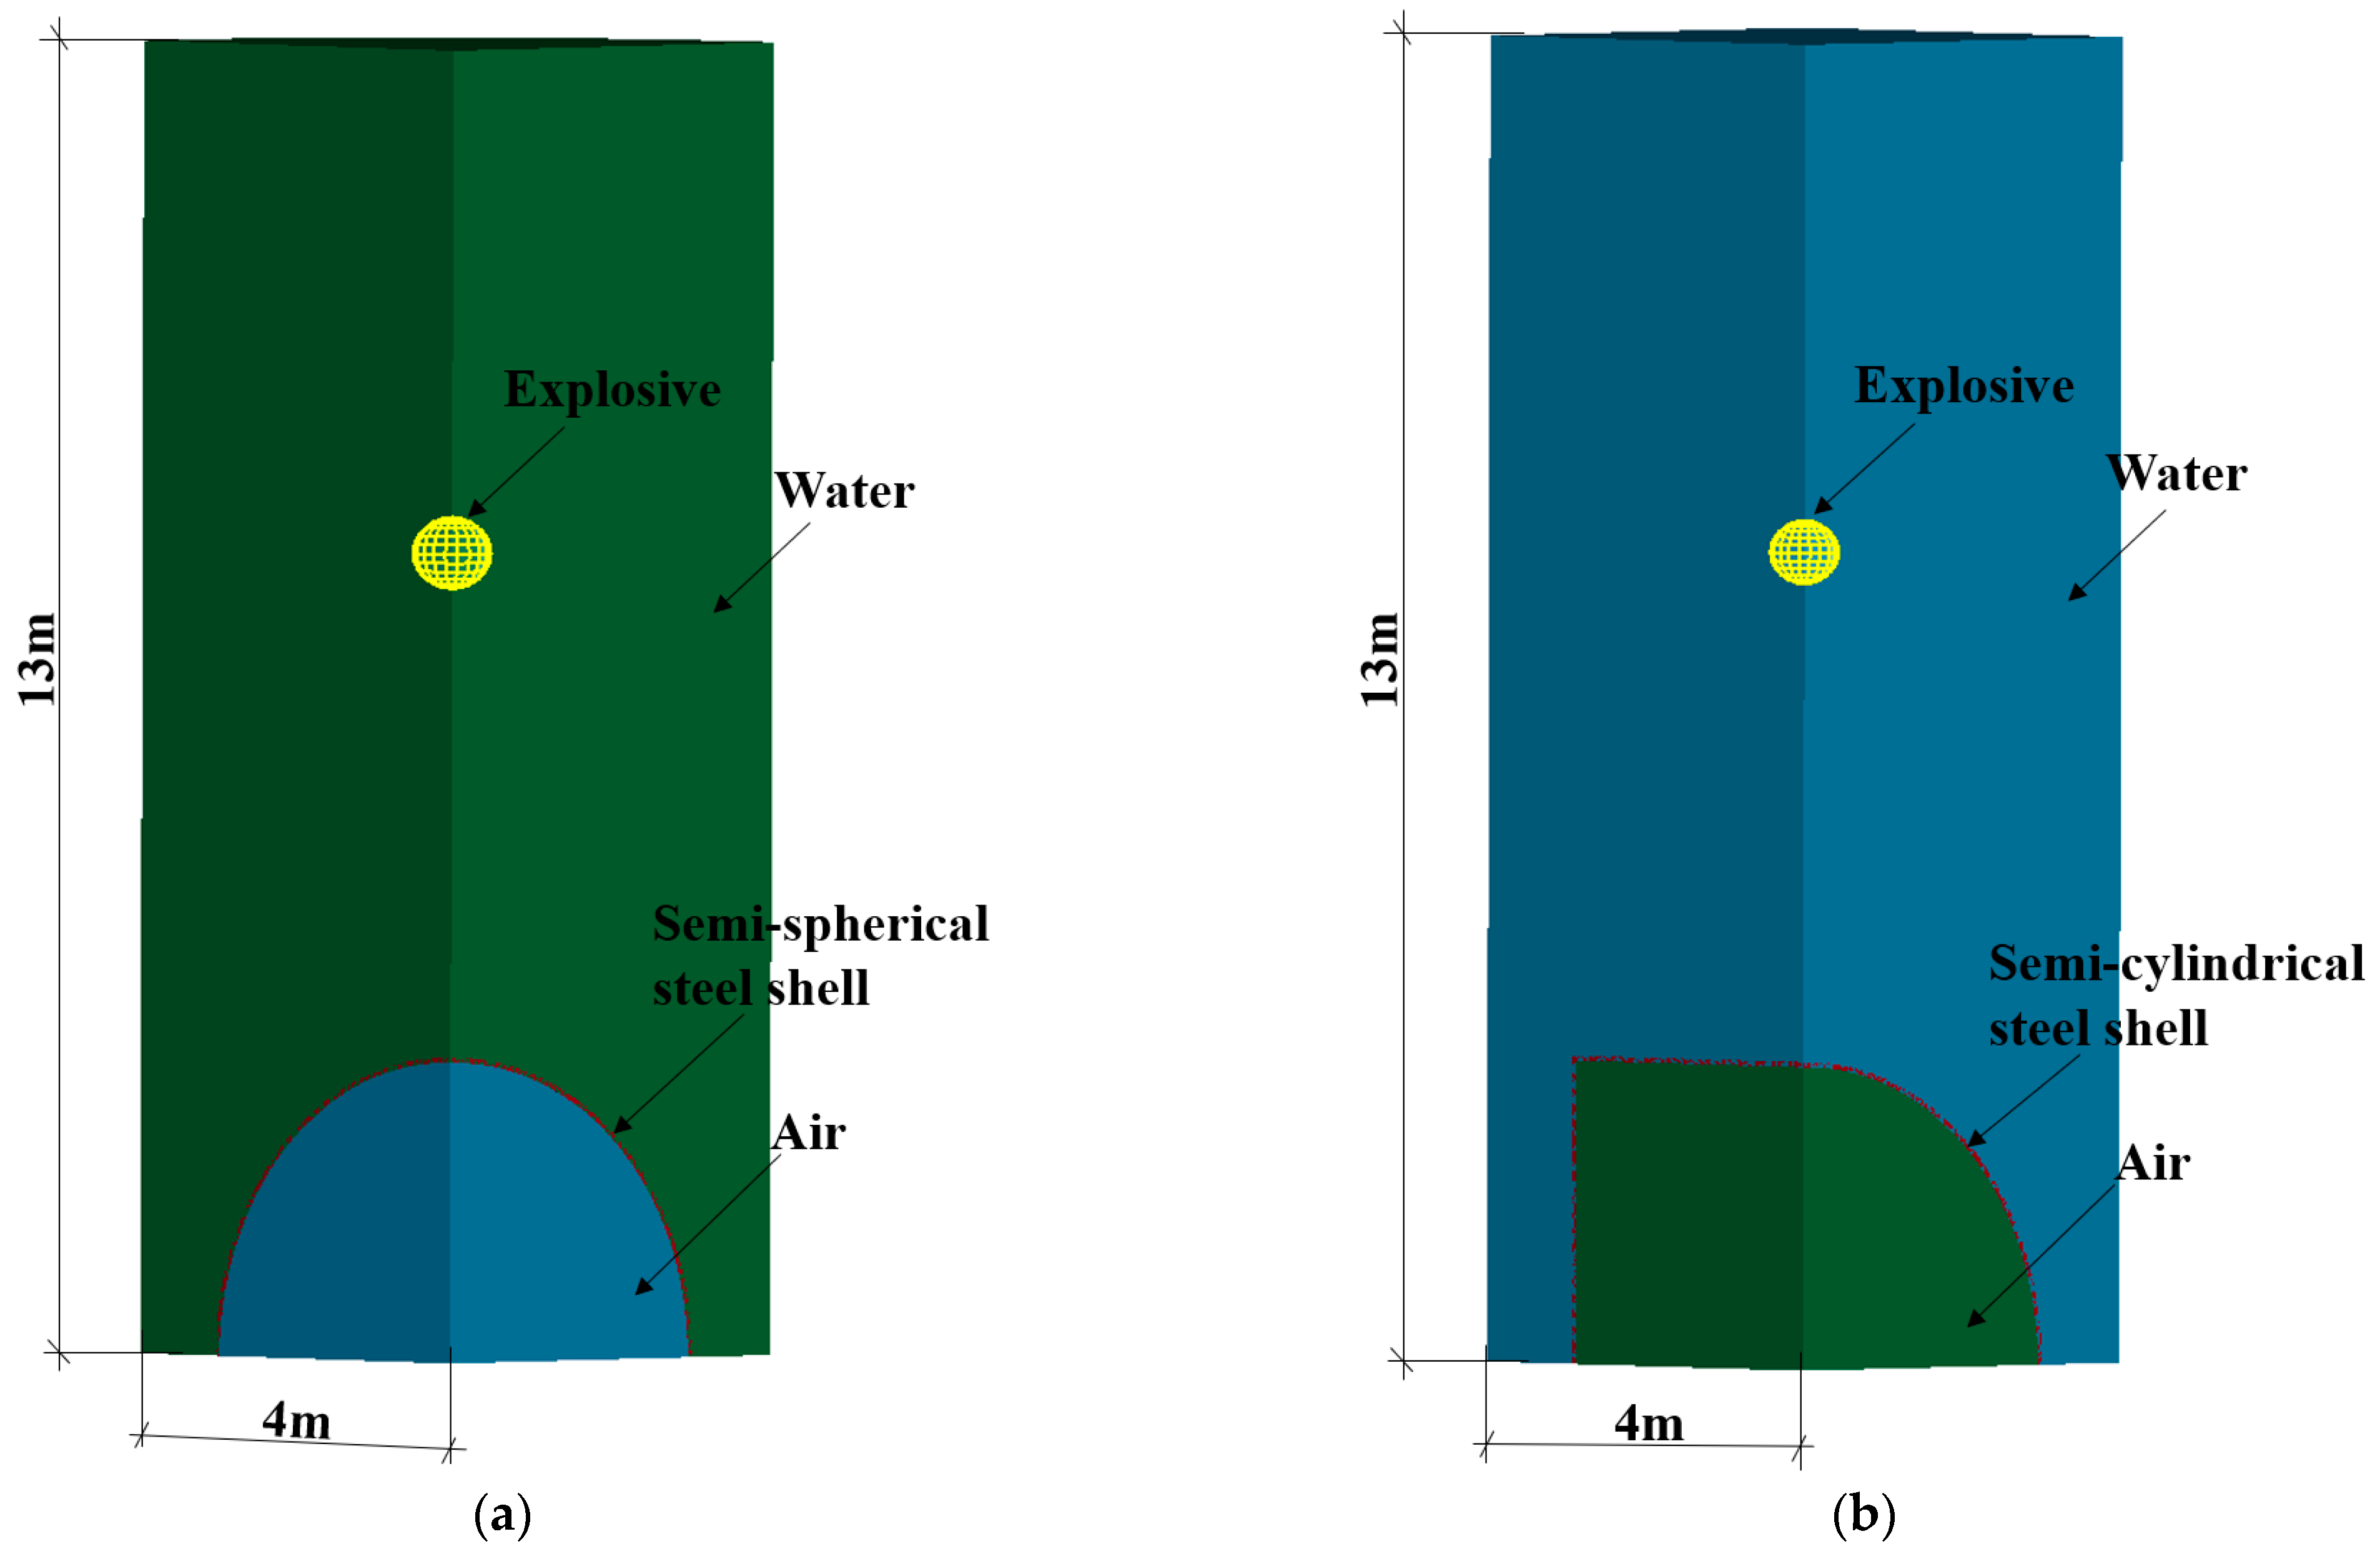
Figure 3 shows a schematic of underwater bottom-sitting shell structures and explosive load configuration. Leveraging the physical model’s symmetry, a one-fourth coupled numerical model of the bottom-sitting steel shell-water-explosion system was built in LS-DYNA finite element software via the validated ALE numerical simulation method and parameters, as depicted in Figure 4. For the one-fourth semi-spherical steel shell structure–water–explosion shock wave coupling model, the water domain has a bottom radius of 4 m and a vertical length of 13 m. In contrast, for the one-fourth semi-cylindrical counterpart, the water domain features a bottom width of 4 m with the same 13 m vertical length. Symmetrical constraints are imposed on the nodes on the one-fourth symmetrical surface of the model, and the outer surface of the water domain is set as non-reflecting. Displacements in the x, y, and z directions at the bottom of both semi-spherical and semi-cylindrical bottom-sitting steel shells are fixed at zero. The dimensions of the semi-spherical and semi-cylindrical steel shell structures are presented in Figure 5 and Figure 6, respectively. The steel shell is modeled using the Lagrange algorithm, while air, water, and TNT are represented with the Euler algorithm. The explosive is configured in volume–fraction form, and a fluid–structure coupling approach simulates interactions between the shell and water.

4.2. Influence of Shock Wave Transmission Medium on the Dynamic Response of Semi-Spherical and Semi-Cylindrical Bottom-Sitting Steel Shells

The attenuation law of shock waves in air and water was found to have a significant impact on the structural response to the explosion, owing to fundamental differences in fluid properties. Water’s higher density and sound speed result in slower energy dissipation (exponential decay coefficient α = 1.13 for water vs. α = 1.5 for air), leading to higher peak pressures and longer loading durations. For example, underwater explosions generate shock waves with peak effective stresses up to 831.4 MPa, due to reduced compressibility and bubble pulsation energy loss in water. The dynamic response of semi-spherical and semi-cylindrical bottom-sitting steel shells was investigated in response to an underwater explosion with a 7 m explosive distance and 300 kg explosive equivalent, which are representative values within the validated parameter range and typical of mid-range underwater blast scenarios, balancing computational feasibility and real-world applicability for analyzing shock wave attenuation and structural deformation patterns.
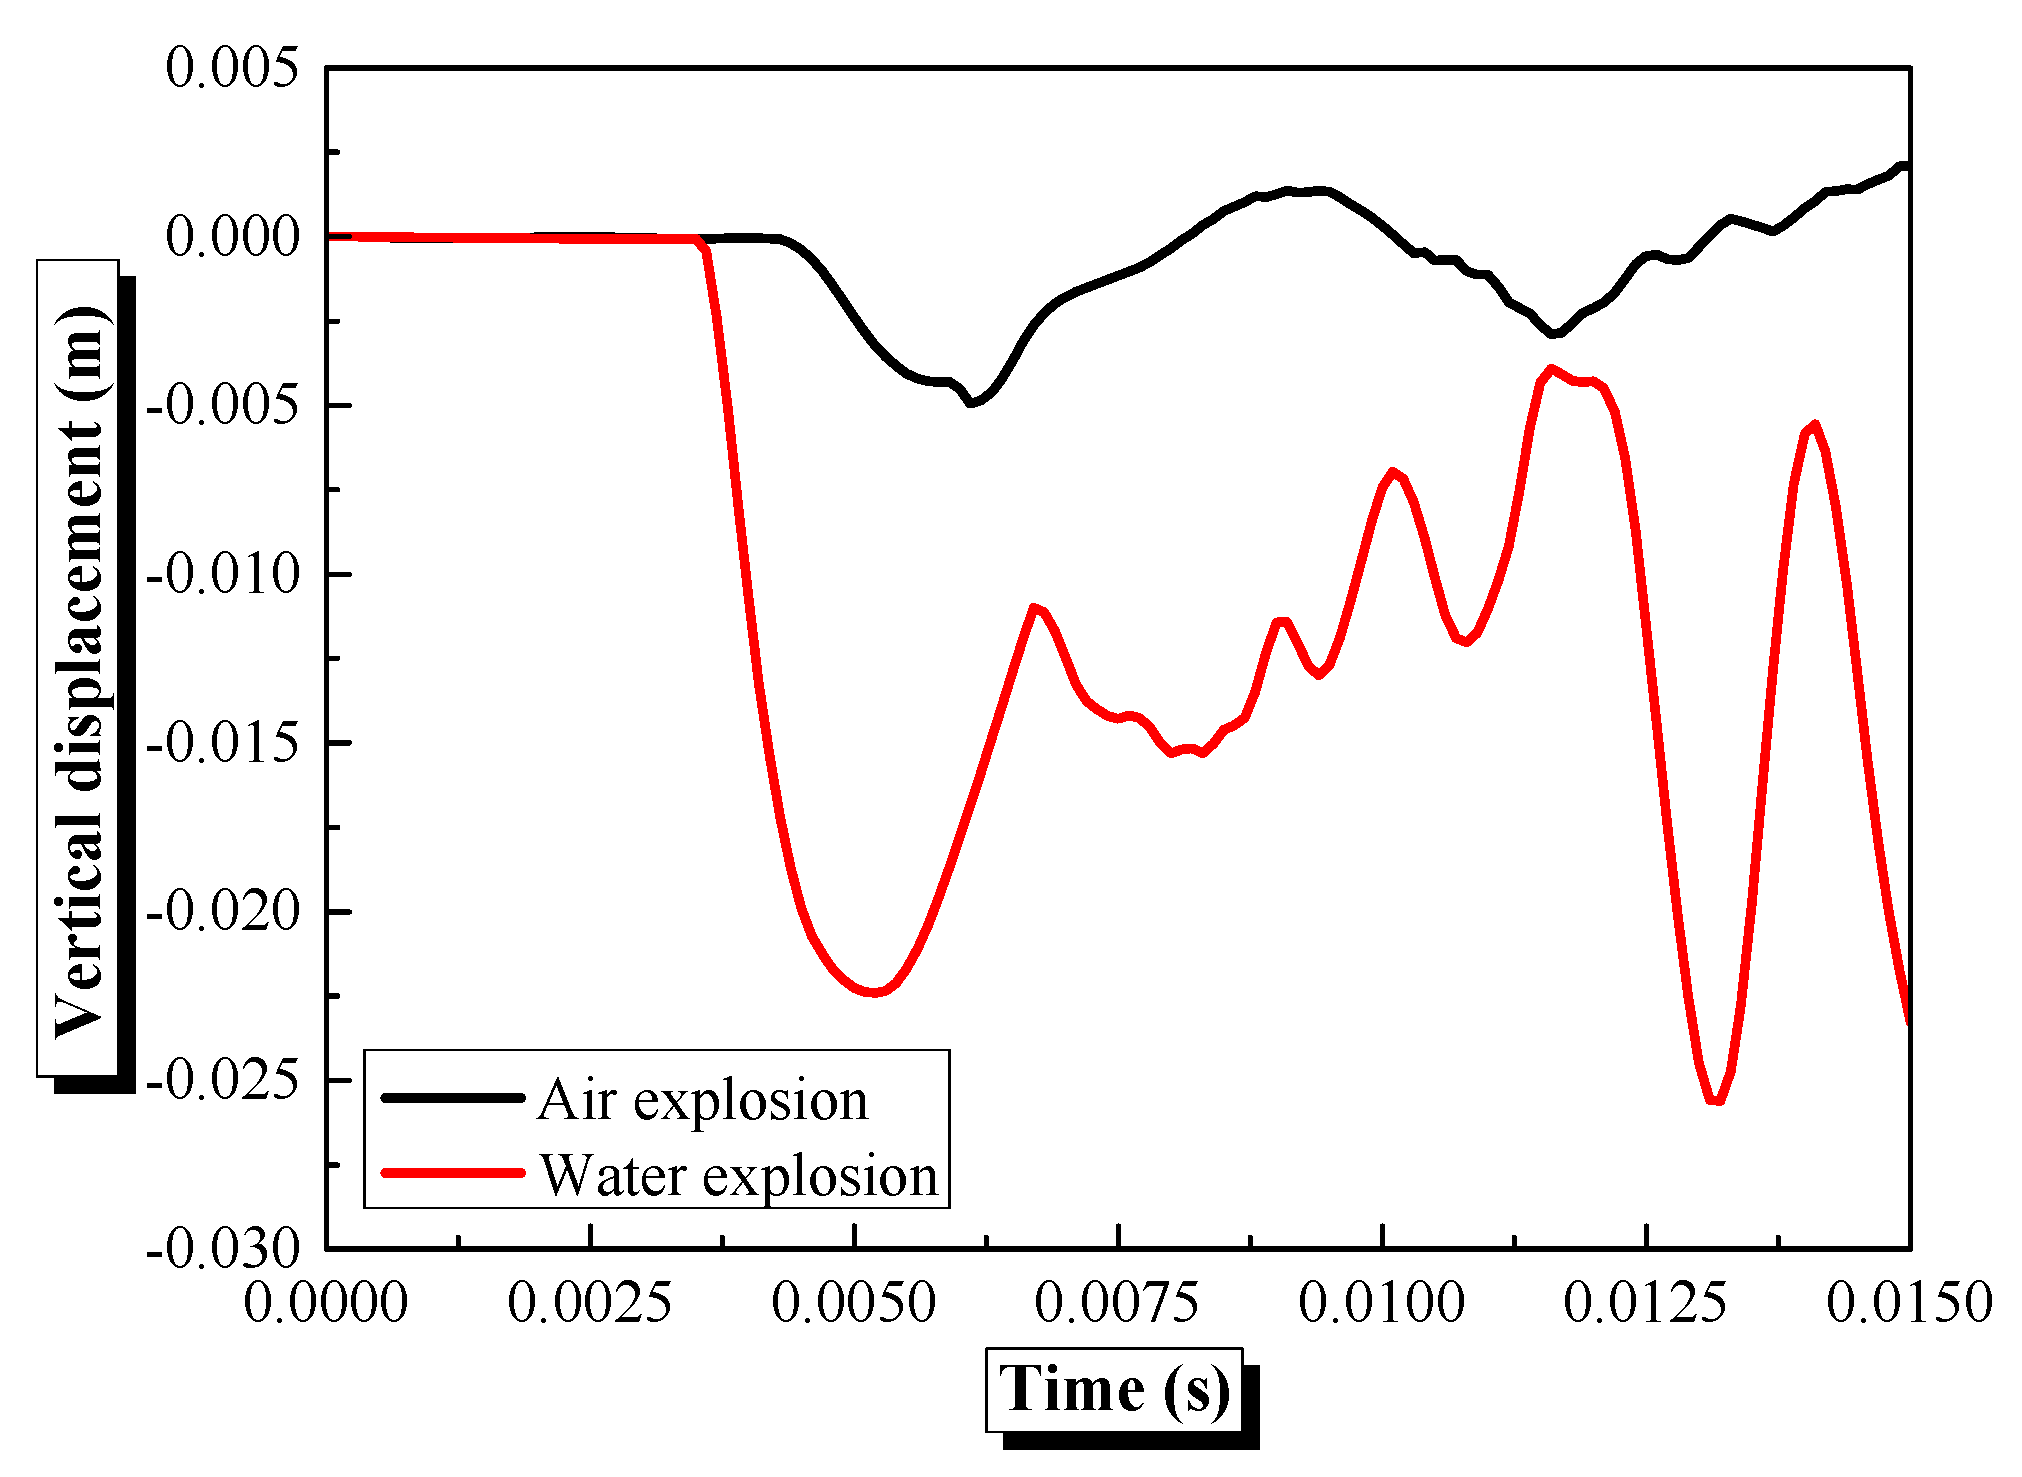
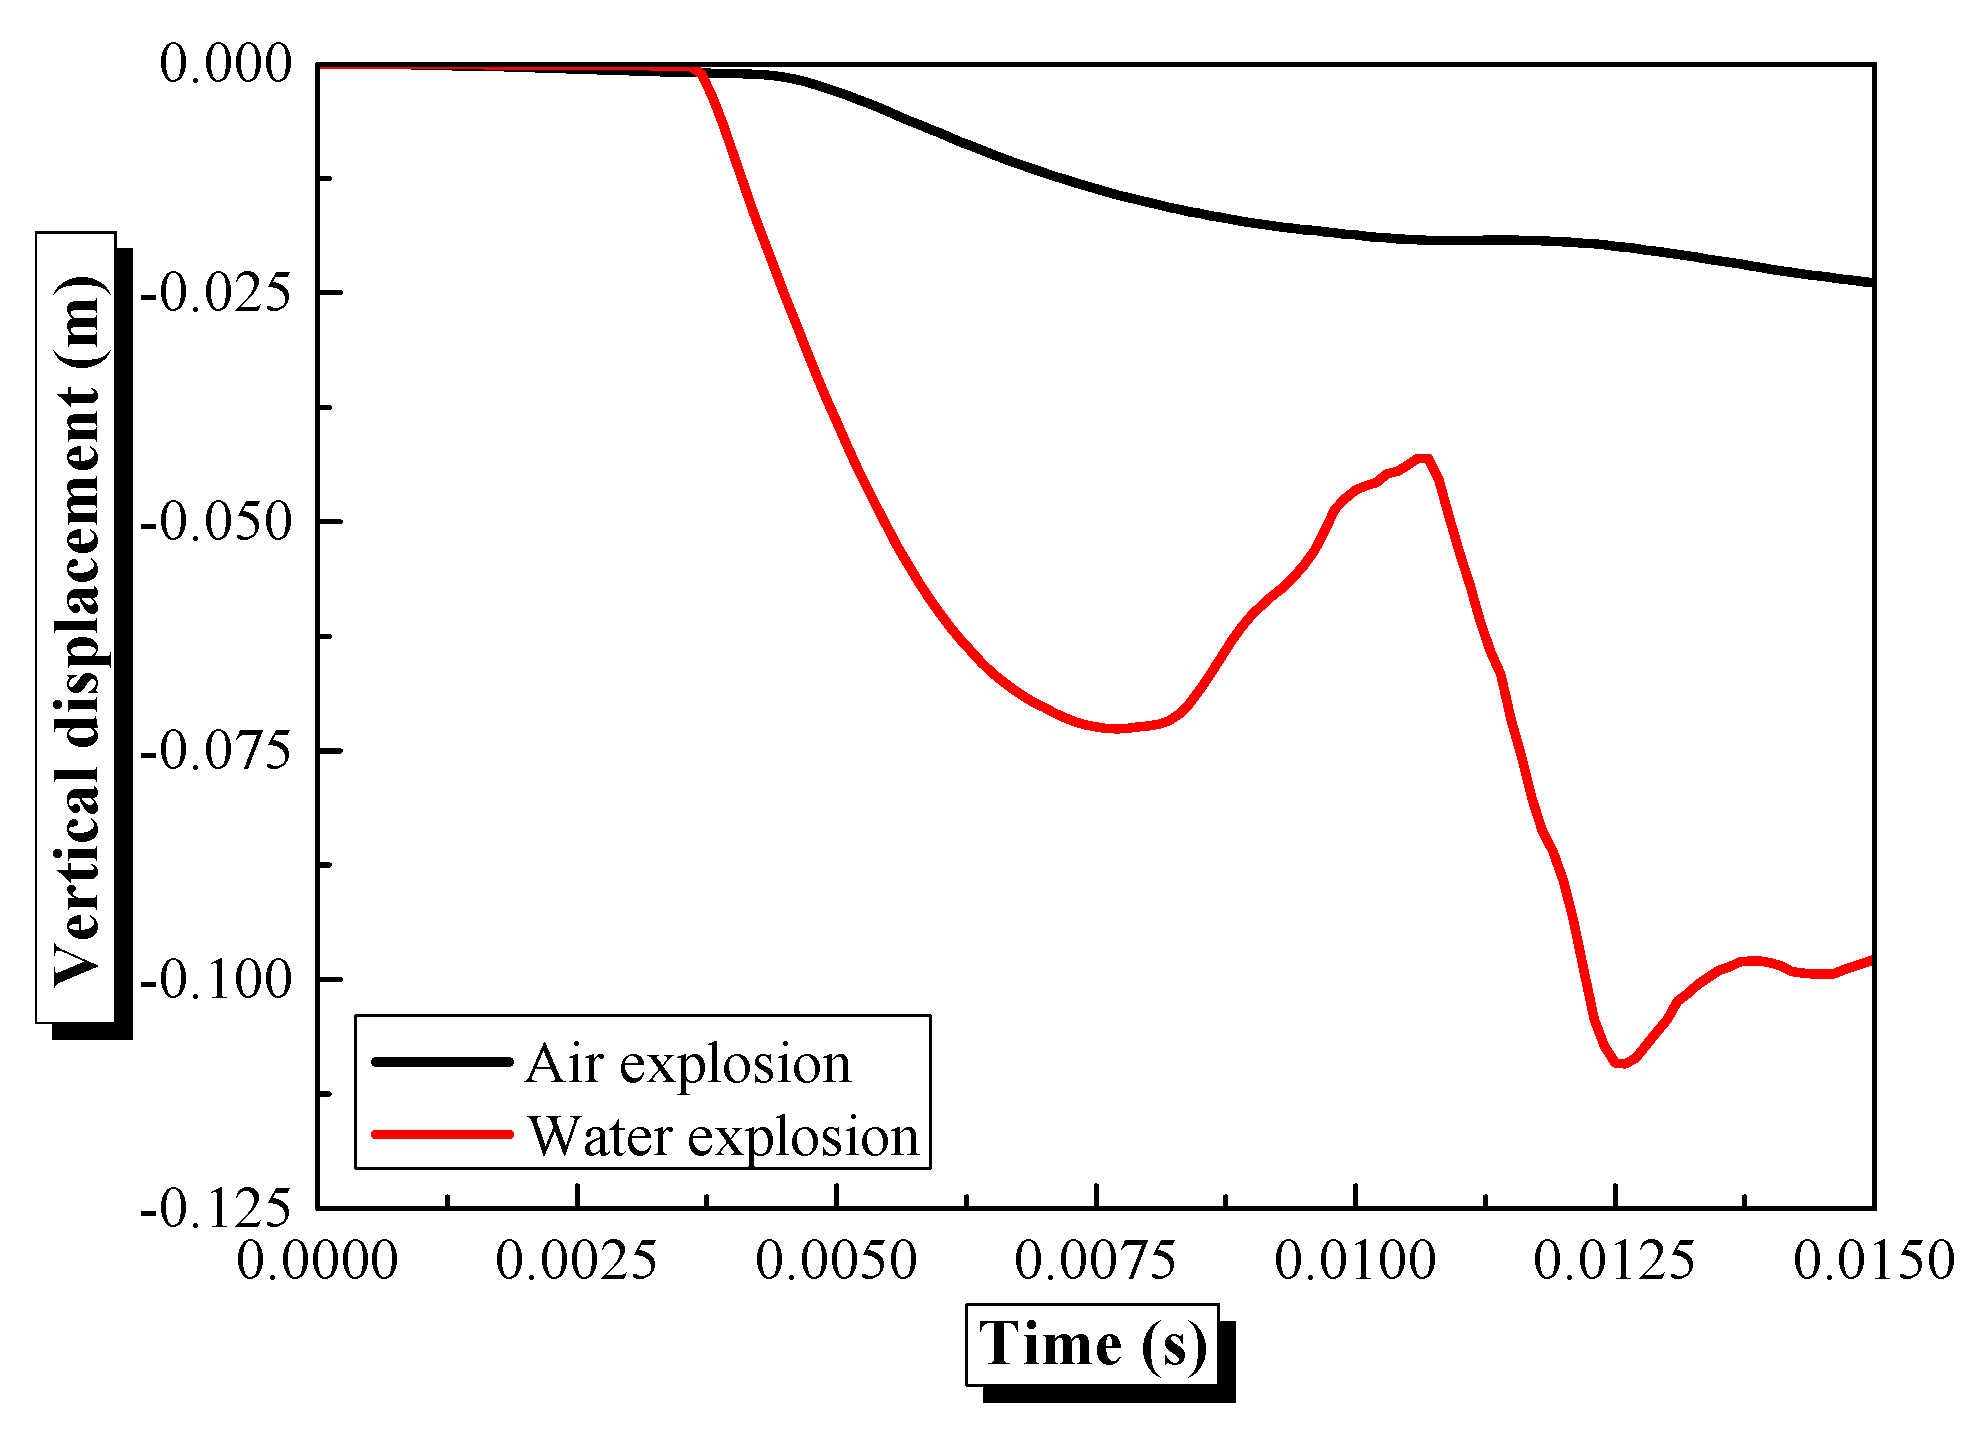
Figure 7 illustrates the effective stress distribution cloud diagram of the semi-spherical steel shells subjected to air and water explosions with a 7 m explosive distance and 300 kg explosive equivalent. The effective stress of the shells subjected underwater shock waves surpasses that of the shells subjected to air shock waves, with maximum values of approximately 831.4 MPa and 191 MPa, respectively. Although the shell’s deformation is not substantial, the higher effective stress under underwater conditions indicates more severe dynamic loading. Figure 8 presents the center vertical displacement curves of the semi-spherical steel shell over time for the two explosion conditions. The first peak vertical displacement at the center reaches 22.53 mm in response to underwater shock waves, significantly larger than the 4.39 mm in response to air shock waves, highlighting the pronounced deformation response induced by underwater explosions. This phenomenon originates from the physical property differences between water and air. The density (1000 kg/m3) and bulk modulus of water are much higher than those of air, resulting in higher energy density and slower attenuation of underwater shock waves (according to Cole’s law, the peak pressure attenuation index α = 1.13 in water medium, about 1.2 in air). Additionally, the incompressibility of water enables more efficient energy transfer to the structure, forming a sustained load effect, while air shock waves attenuate faster due to rapid diffusion. As shown in Figure 7, the effective stress of the hemispherical shell reaches 831.4 MPa in response to underwater explosion (only 191 MPa in air), confirming that the structure in water bears higher stress loads. Specifically, the maximum effective stress reaches approximately 831.4 MPa under underwater conditions, which is 335.3% higher than the 191 MPa reached in response to air shock waves. The first peak vertical displacement of the center exhibits a dramatic difference: 22.53 mm in response to underwater shock waves, which is 413.21% larger than the 4.39 mm in response to air shock waves.
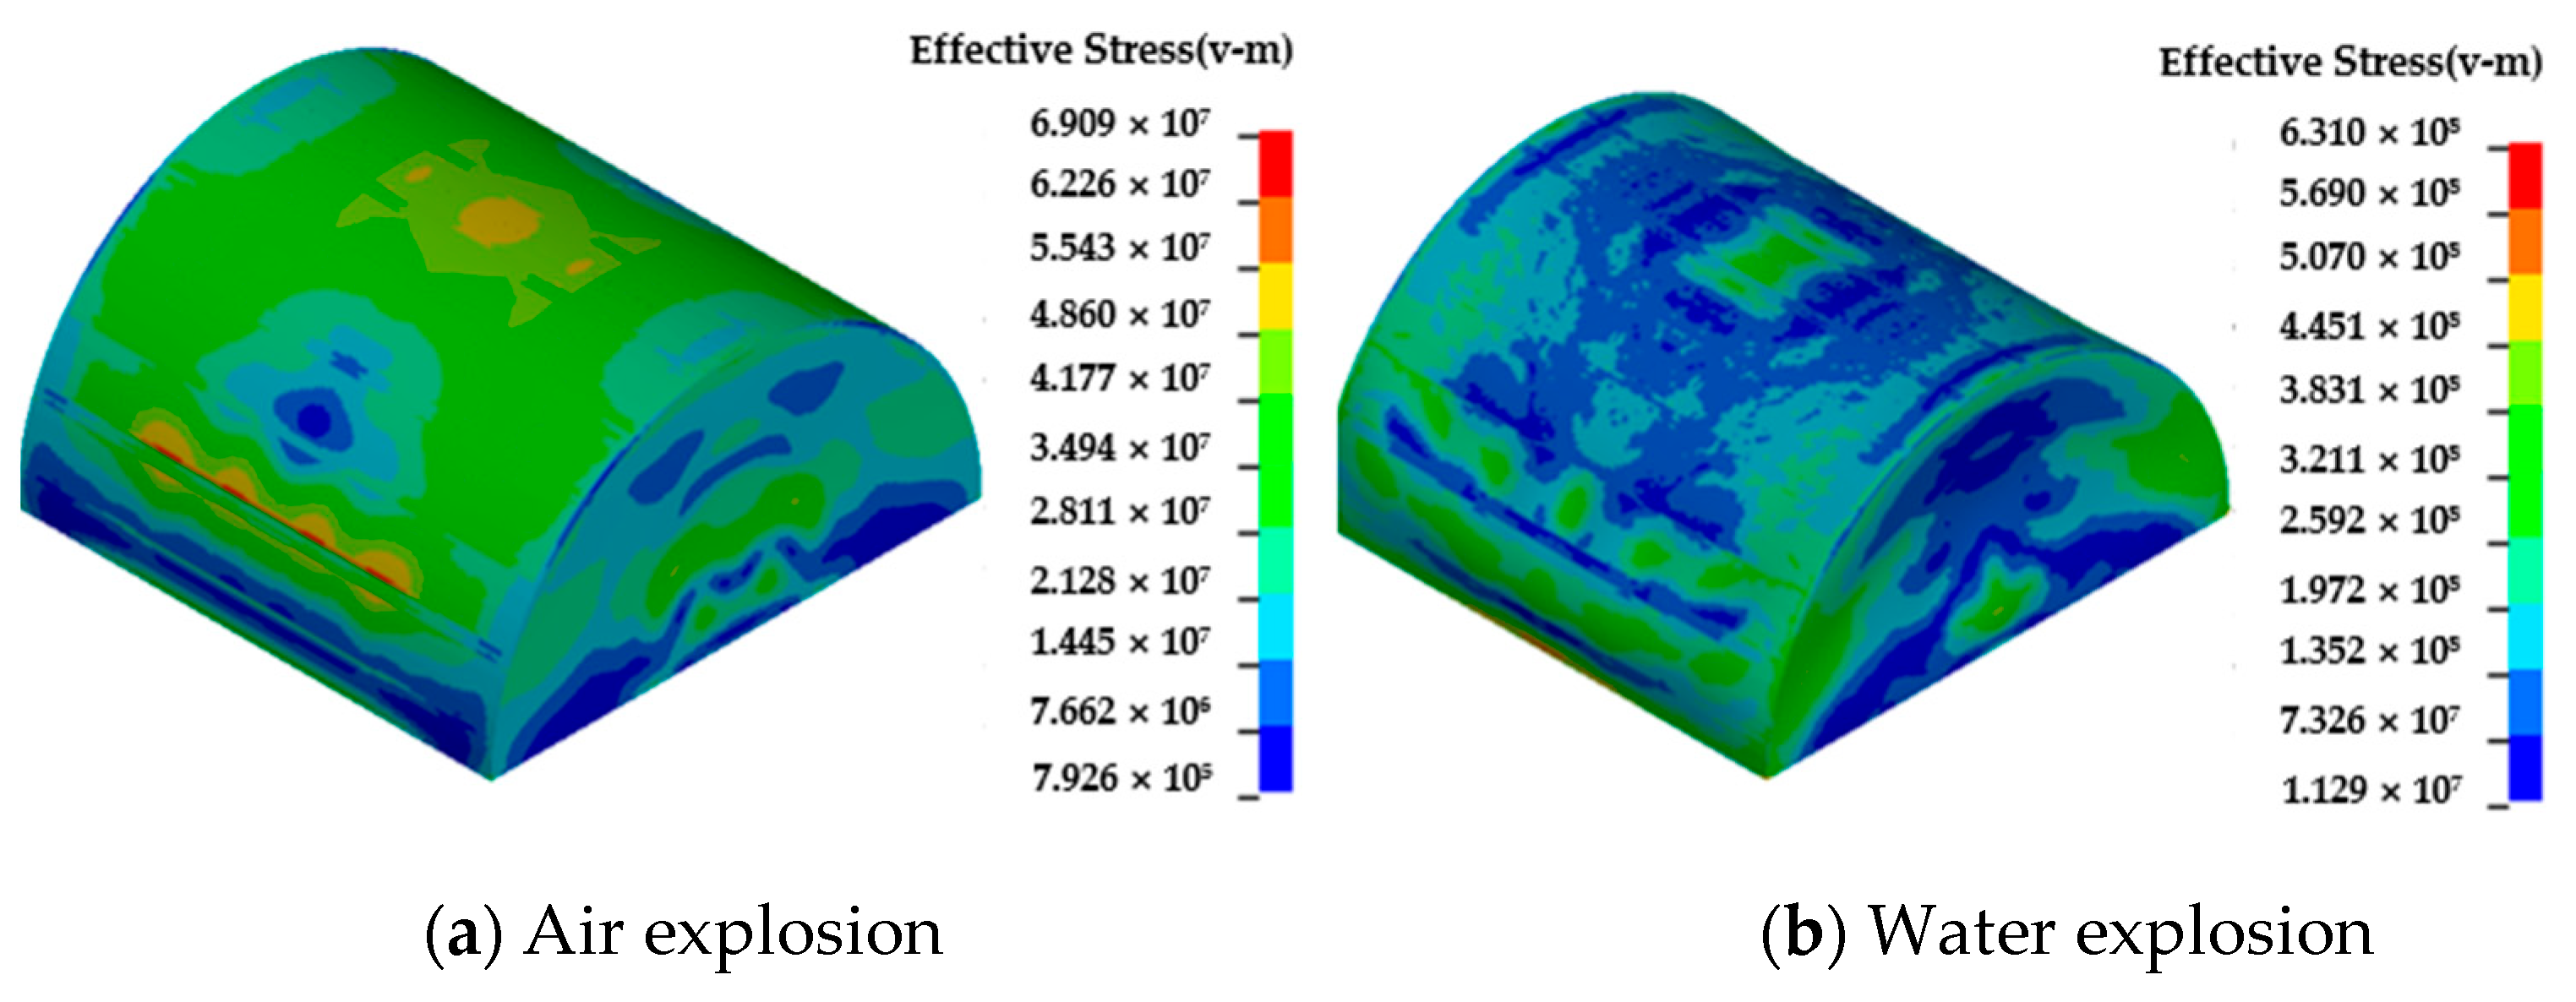
Figure 9 shows a cloud diagram of the effective stress distribution of semi-cylindrical steel shells subjected to air and water explosions with a 7 m explosive distance and 300 kg explosive equivalent. Figure 9b shows the deformations of the semi-cylindrical steel shell subjected to an underwater explosion shock wave, which consists of convex deformation at the bottom, concave deformation of the sidewalls at both ends, and concave deformation at the center. In contrast to the semi-spherical shell (Figure 7), the semi-cylindrical shell exhibits a more complex deformation pattern, with stress concentrations at the flat bottom and sidewall junctions due to its linear geometry. Figure 10 displays the curves of the center vertical displacement over time for a semi-cylindrical steel shell subjected to air and water explosions at an explosive distance of 7 m and an equivalent of 300 kg. The effective stress, deformation, and center vertical displacement of the semi-cylindrical steel shell subjected to underwater shock waves are notably larger than those of shells subjected to air shock waves. Underwater shock waves result in maximum effective stress on the semi-cylindrical steel shell, reaching approximately 631 MPa, and its center maximum vertical displacement is around 97.82 mm, roughly 4.2 times that of the semi-spherical shell under the same conditions. In response to air shock waves, the maximum effective stress of the semi-cylindrical steel shell is about 69.09 MPa, and the center maximum vertical displacement of the semi-cylindrical steel shell is about 23.9 mm, indicating that the semi-cylindrical structure is more vulnerable to deformation due to its reduced circumferential stiffness compared to the semi-spherical shape.
Water exhibits greater resistance than air, causing the shock wave to attenuate more slowly in water. This leads to more significant pressure being exerted on the structure, resulting in increased structural deformation. As a result, both semi-spherical and semi-cylindrical steel shells deform more significantly when subjected to underwater shock wave loads compared to air shock wave loads.
The disparity in dynamic response between the two shell types can be attributed to their geometric configurations. Semi-spherical shells leverage their curved surfaces to distribute shock wave pressures through membrane action, converting normal loads into tangential stresses that mitigate local deformation—a mechanism known as the ‘hoop effect’ (see Section 4.5). This curvature-induced stiffness reduces outward bulging, as evidenced by the semi-spherical shell’s smaller vertical displacement (0.02326 m underwater) despite higher effective stress (831.4 MPa). In contrast, semi-cylindrical shells lack the continuous circumferential curvature of spheres, leading to asymmetric stress distribution. The flat bottom and straight sidewalls act as stress concentrators, inducing convex–concave deformation patterns (Figure 9b). Without the hoop effect, the semi-cylindrical shell relies more on bending resistance, which is less efficient in dissipating explosive energy. This results in larger displacements (0.09782 m underwater), even though its maximum effective stress is 24% lower than the semi-spherical shell’s.

4.3. Influence of Explosive Distance on the Dynamic Behaviors of Semi-Spherical and Semi-Cylindrical Bottom-Sitting Steel Shells

Explosive distance is a key factor in determining structural deformation and dynamic response. These distances (3 m, 5 m, 7 m, and 9 m) were selected, aligning with typical scenarios such as naval ordnance detonations or maritime accident blast zones. As validated in Section 3, the numerical model demonstrated reliable accuracy (errors < 9.77%) across this range using a 300 kg charge, ensuring applicability to real-world blast conditions. This selection allows systematic analysis of shock wave attenuation (following Cole’s law with α = 1.13) and structural responses under varying loading intensities, balancing computational feasibility with engineering relevance. Therefore, explosive distances of 3 m, 5 m, 7 m, and 9 m are chosen to investigate the dynamic response of semi-spherical and semi-cylindrical bottom-sitting steel shell structures subjected to a 300 kg underwater explosion shock wave.
To systematically analyze the effect of geometric configuration, the dynamic responses of both shell types (semi-spherical and semi-cylindrical) under the same explosive conditions (300 kg equivalent, underwater medium) were compared. Figure 11 shows that the semi-spherical shell displays convex deformation concentrated above the bottom constraint, with deformation at 7 m and 9 m distances being significantly smaller. In contrast, preliminary analysis of the semi-cylindrical shell (relevant to its inherent geometric features) reveals a more complex deformation pattern. At closer distances, its deformation is more pronounced compared to the semi-spherical shell. At a 3 m distance, the semi-spherical shell’s center vertical displacement peaks at −0.08321 m. For the semi-cylindrical shell, initial analysis based on its linear profile and basic mechanical principles shows that its displacement would be much larger. This highlights that the semi-spherical shell’s curved geometry efficiently dissipates shock wave energy through membrane action, whereas the semi-cylindrical shell’s linear profile induces more stress concentrations at critical areas.
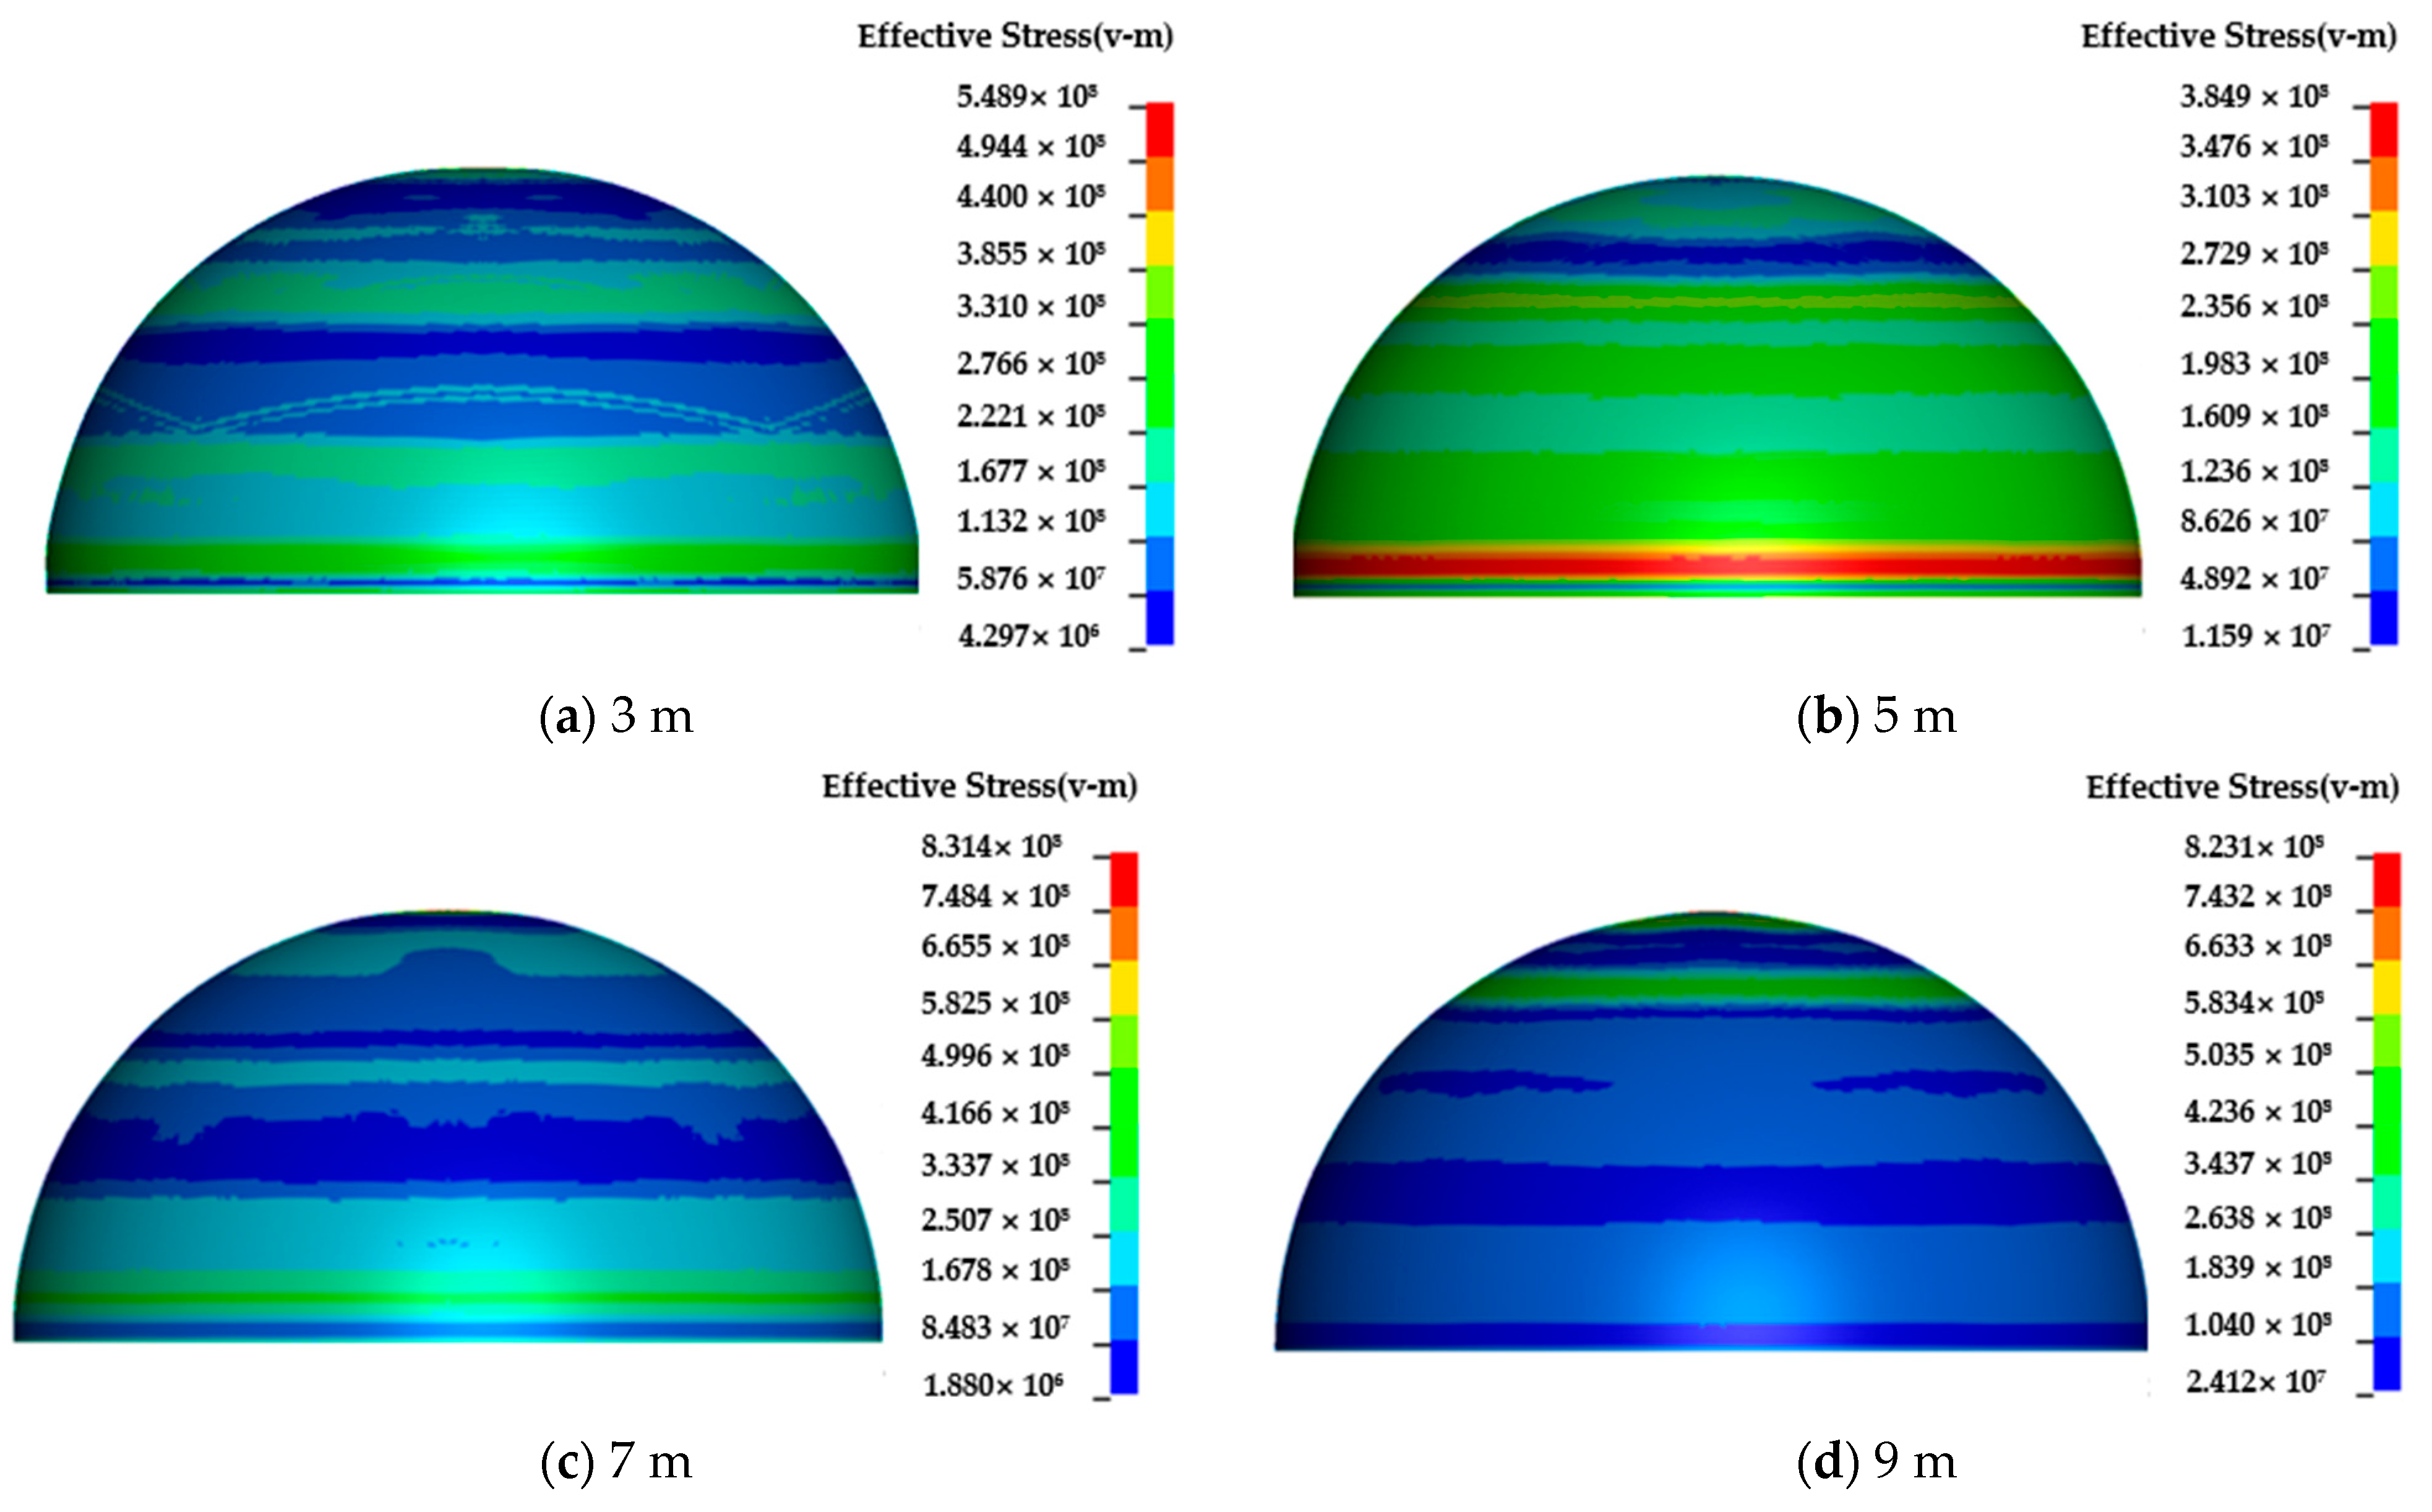
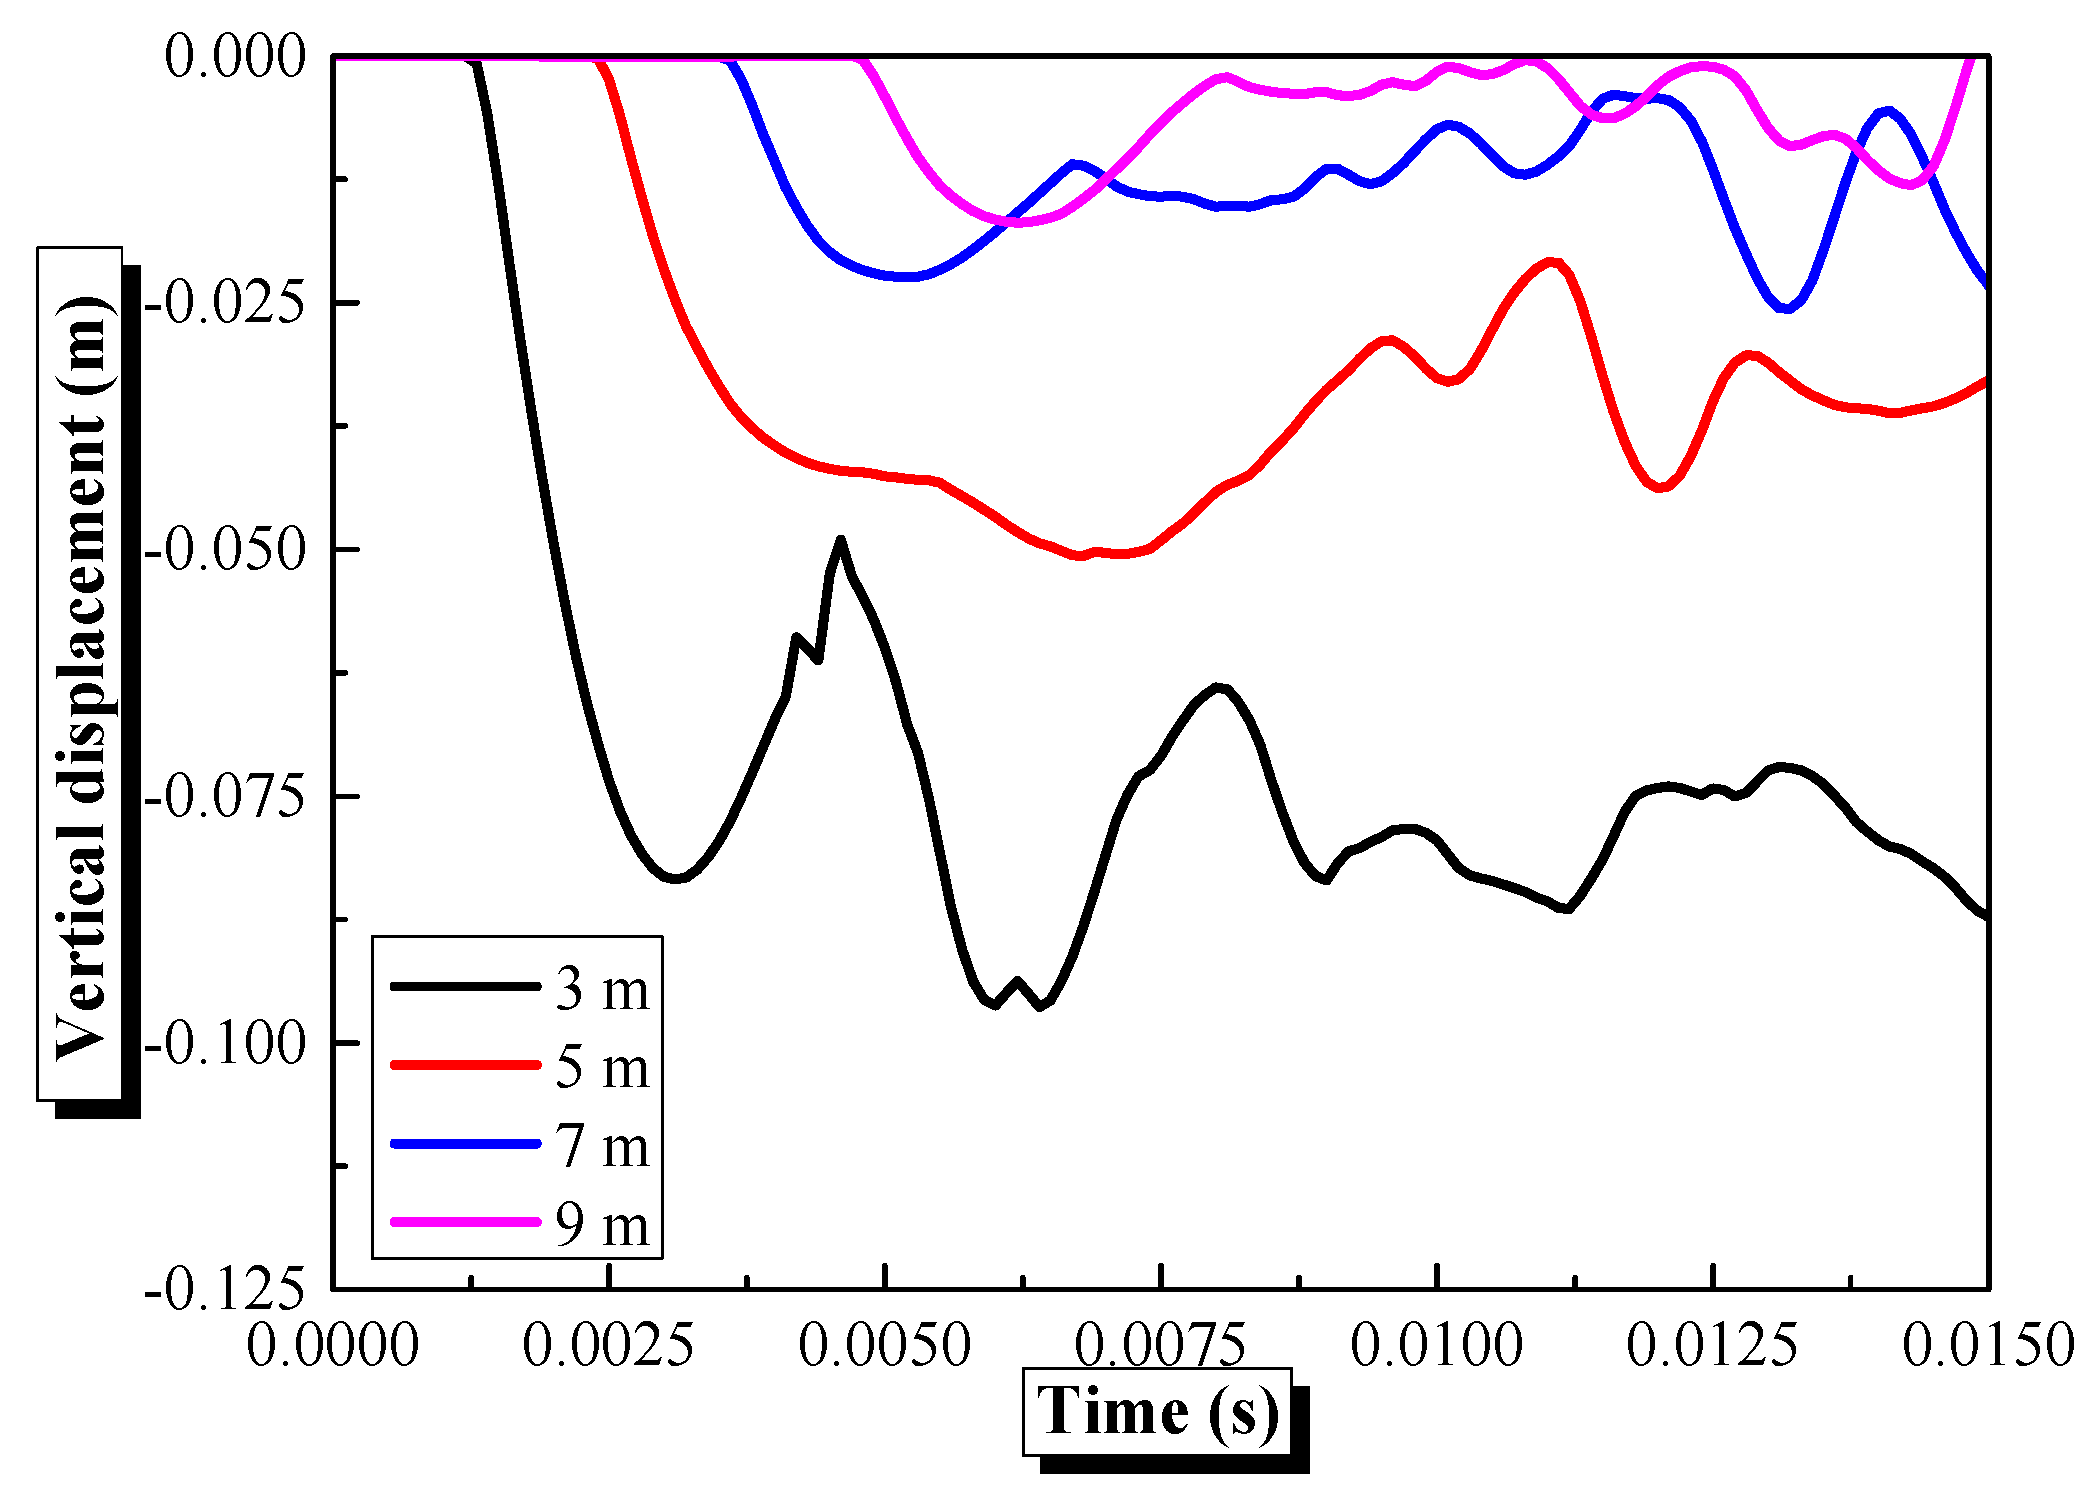
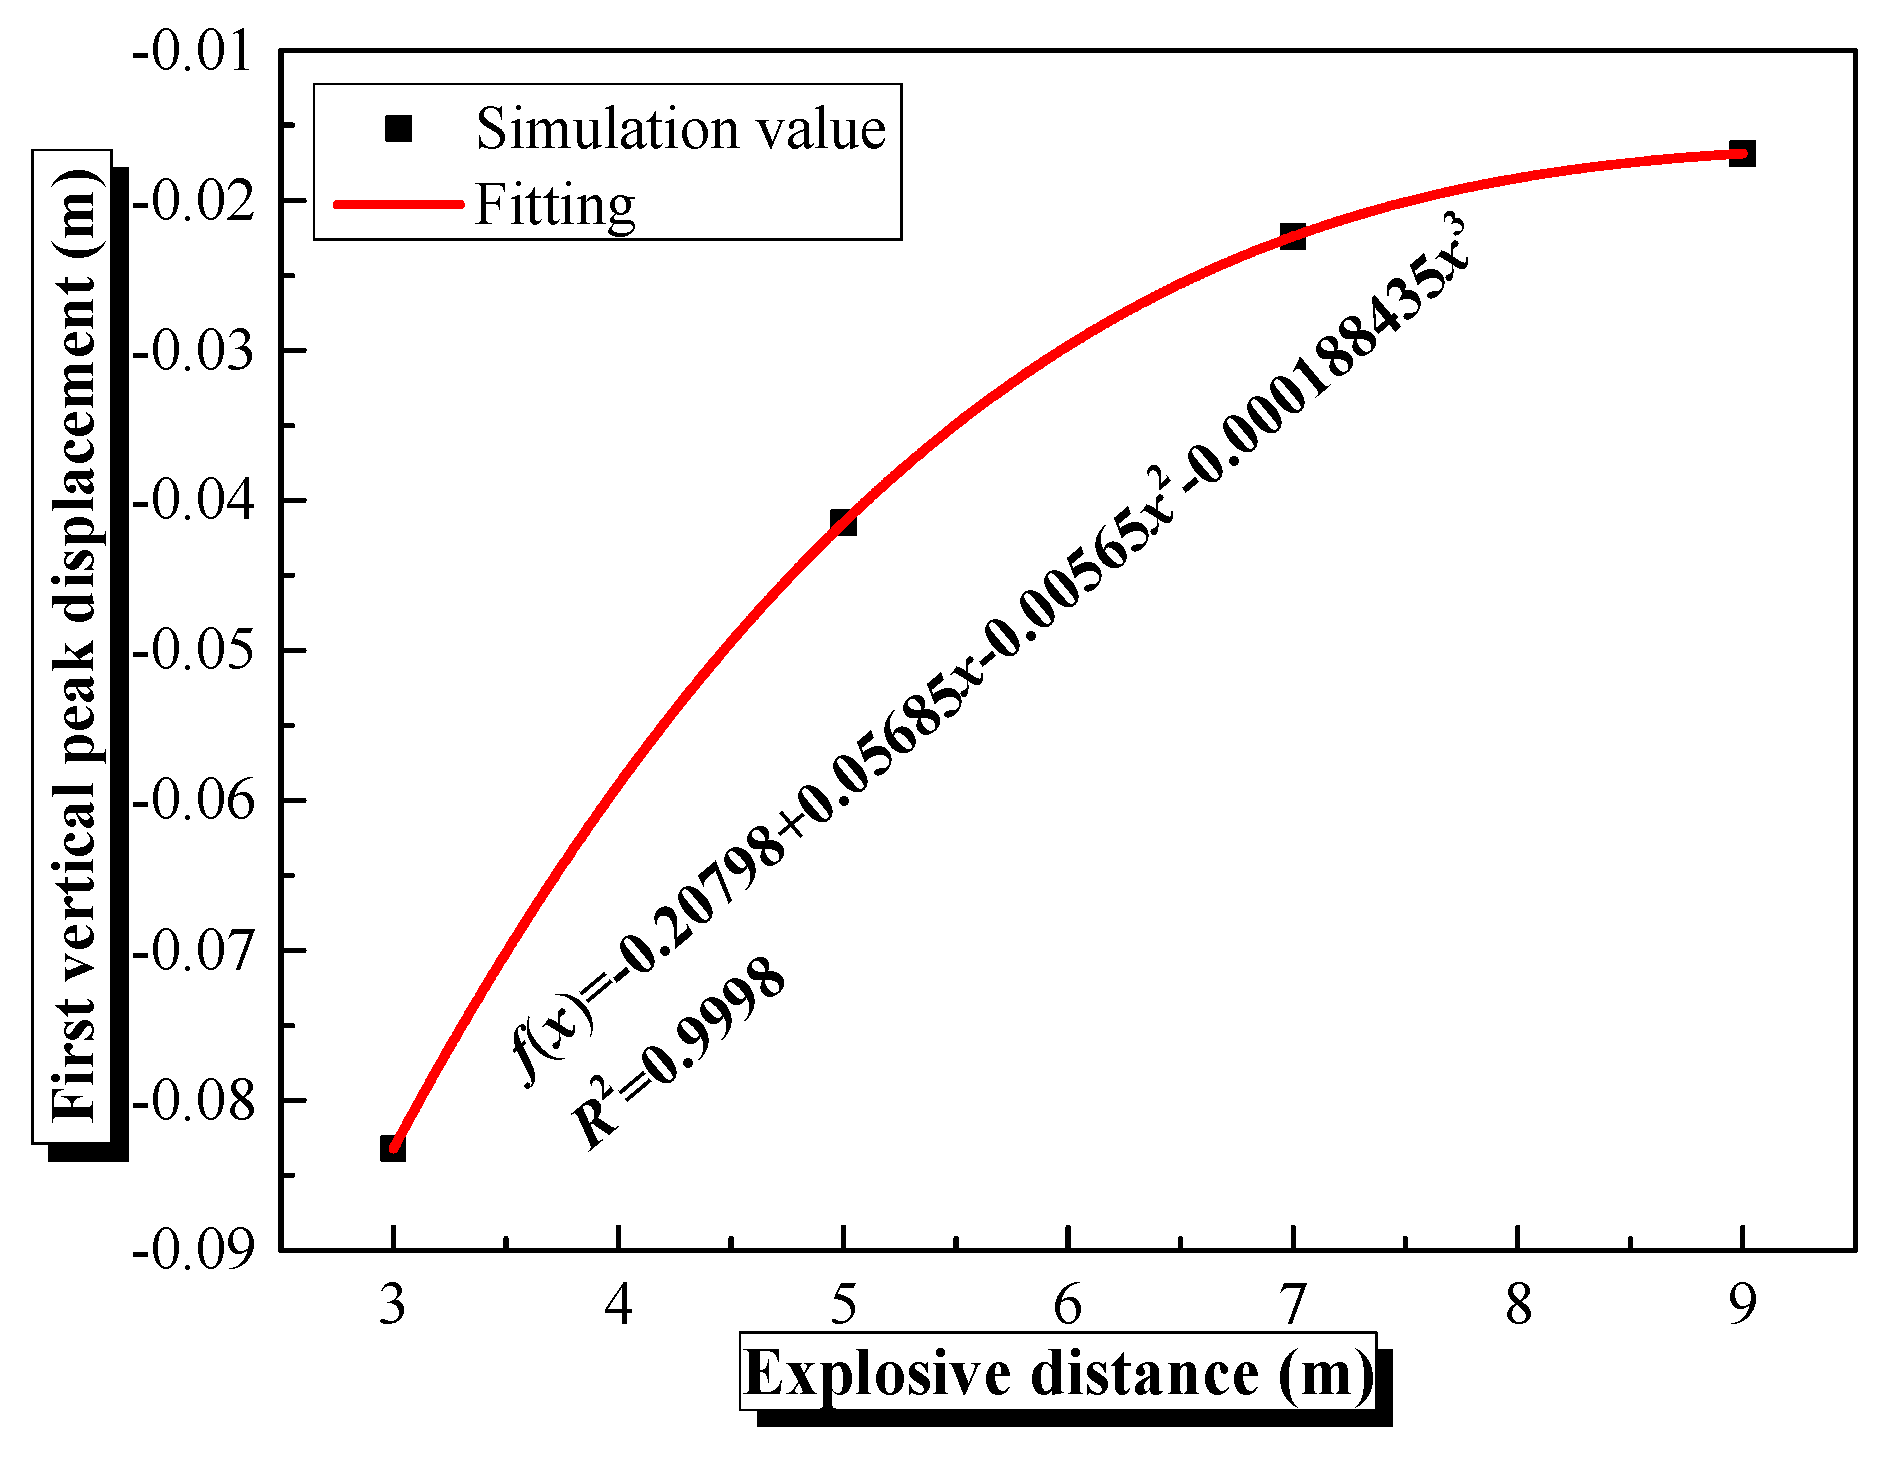
Figure 11 demonstrates that the deformation of the semi-spherical steel shell reduces as the explosion distance increases, primarily observed as convex deformation above the bottom constraint location of the semi-spherical shell. This trend is primarily attributed to the exponential decay of shock wave energy with distance, as described by Cole’s law, which results in a significant reduction in peak pressure. The curvature-induced ‘hoop effect’ of the shell further constrains local deformation, leading to minimal deformation at 7 m and 9 m. The curves of the center vertical displacement of the semi−spherical steel shell change with time, with 300 kg explosive equivalent and different explosive distances, as shown in Figure 12. The center displacement gradually decreases with the increase in explosion distance. The center of the semi-spherical steel shell has a vertical oscillation deformation after the first recovery deformation. Figure 13 shows that the center first vertical peak displacement of a semi-spherical steel shell mainly decreases in a third-order polynomial manner with the increase of explosion distance. The center first vertical peak displacement of a semi-spherical steel shell has a maximum value of about −0.08321 m with a 3 m explosion distance. Shock wave energy diffuses spherically with distance ( P m 1 / R 1.13 ) , leading to significant far-field pressure attenuation. At 3 m, the shock waves contain the effects of high-frequency pulses, causing local high-strain-rate responses in the structure; while at 9 m, pressure waveforms tend to be gentle, and the structure deforms mainly through overall bending. As shown in Figure 13, the center displacement decreases from −83.21 mm at 3 m to −16.83 m at 9 m, which is consistent with the positive correlation between pressure attenuation and deformation, verifying the dominant role of energy input in structural response.
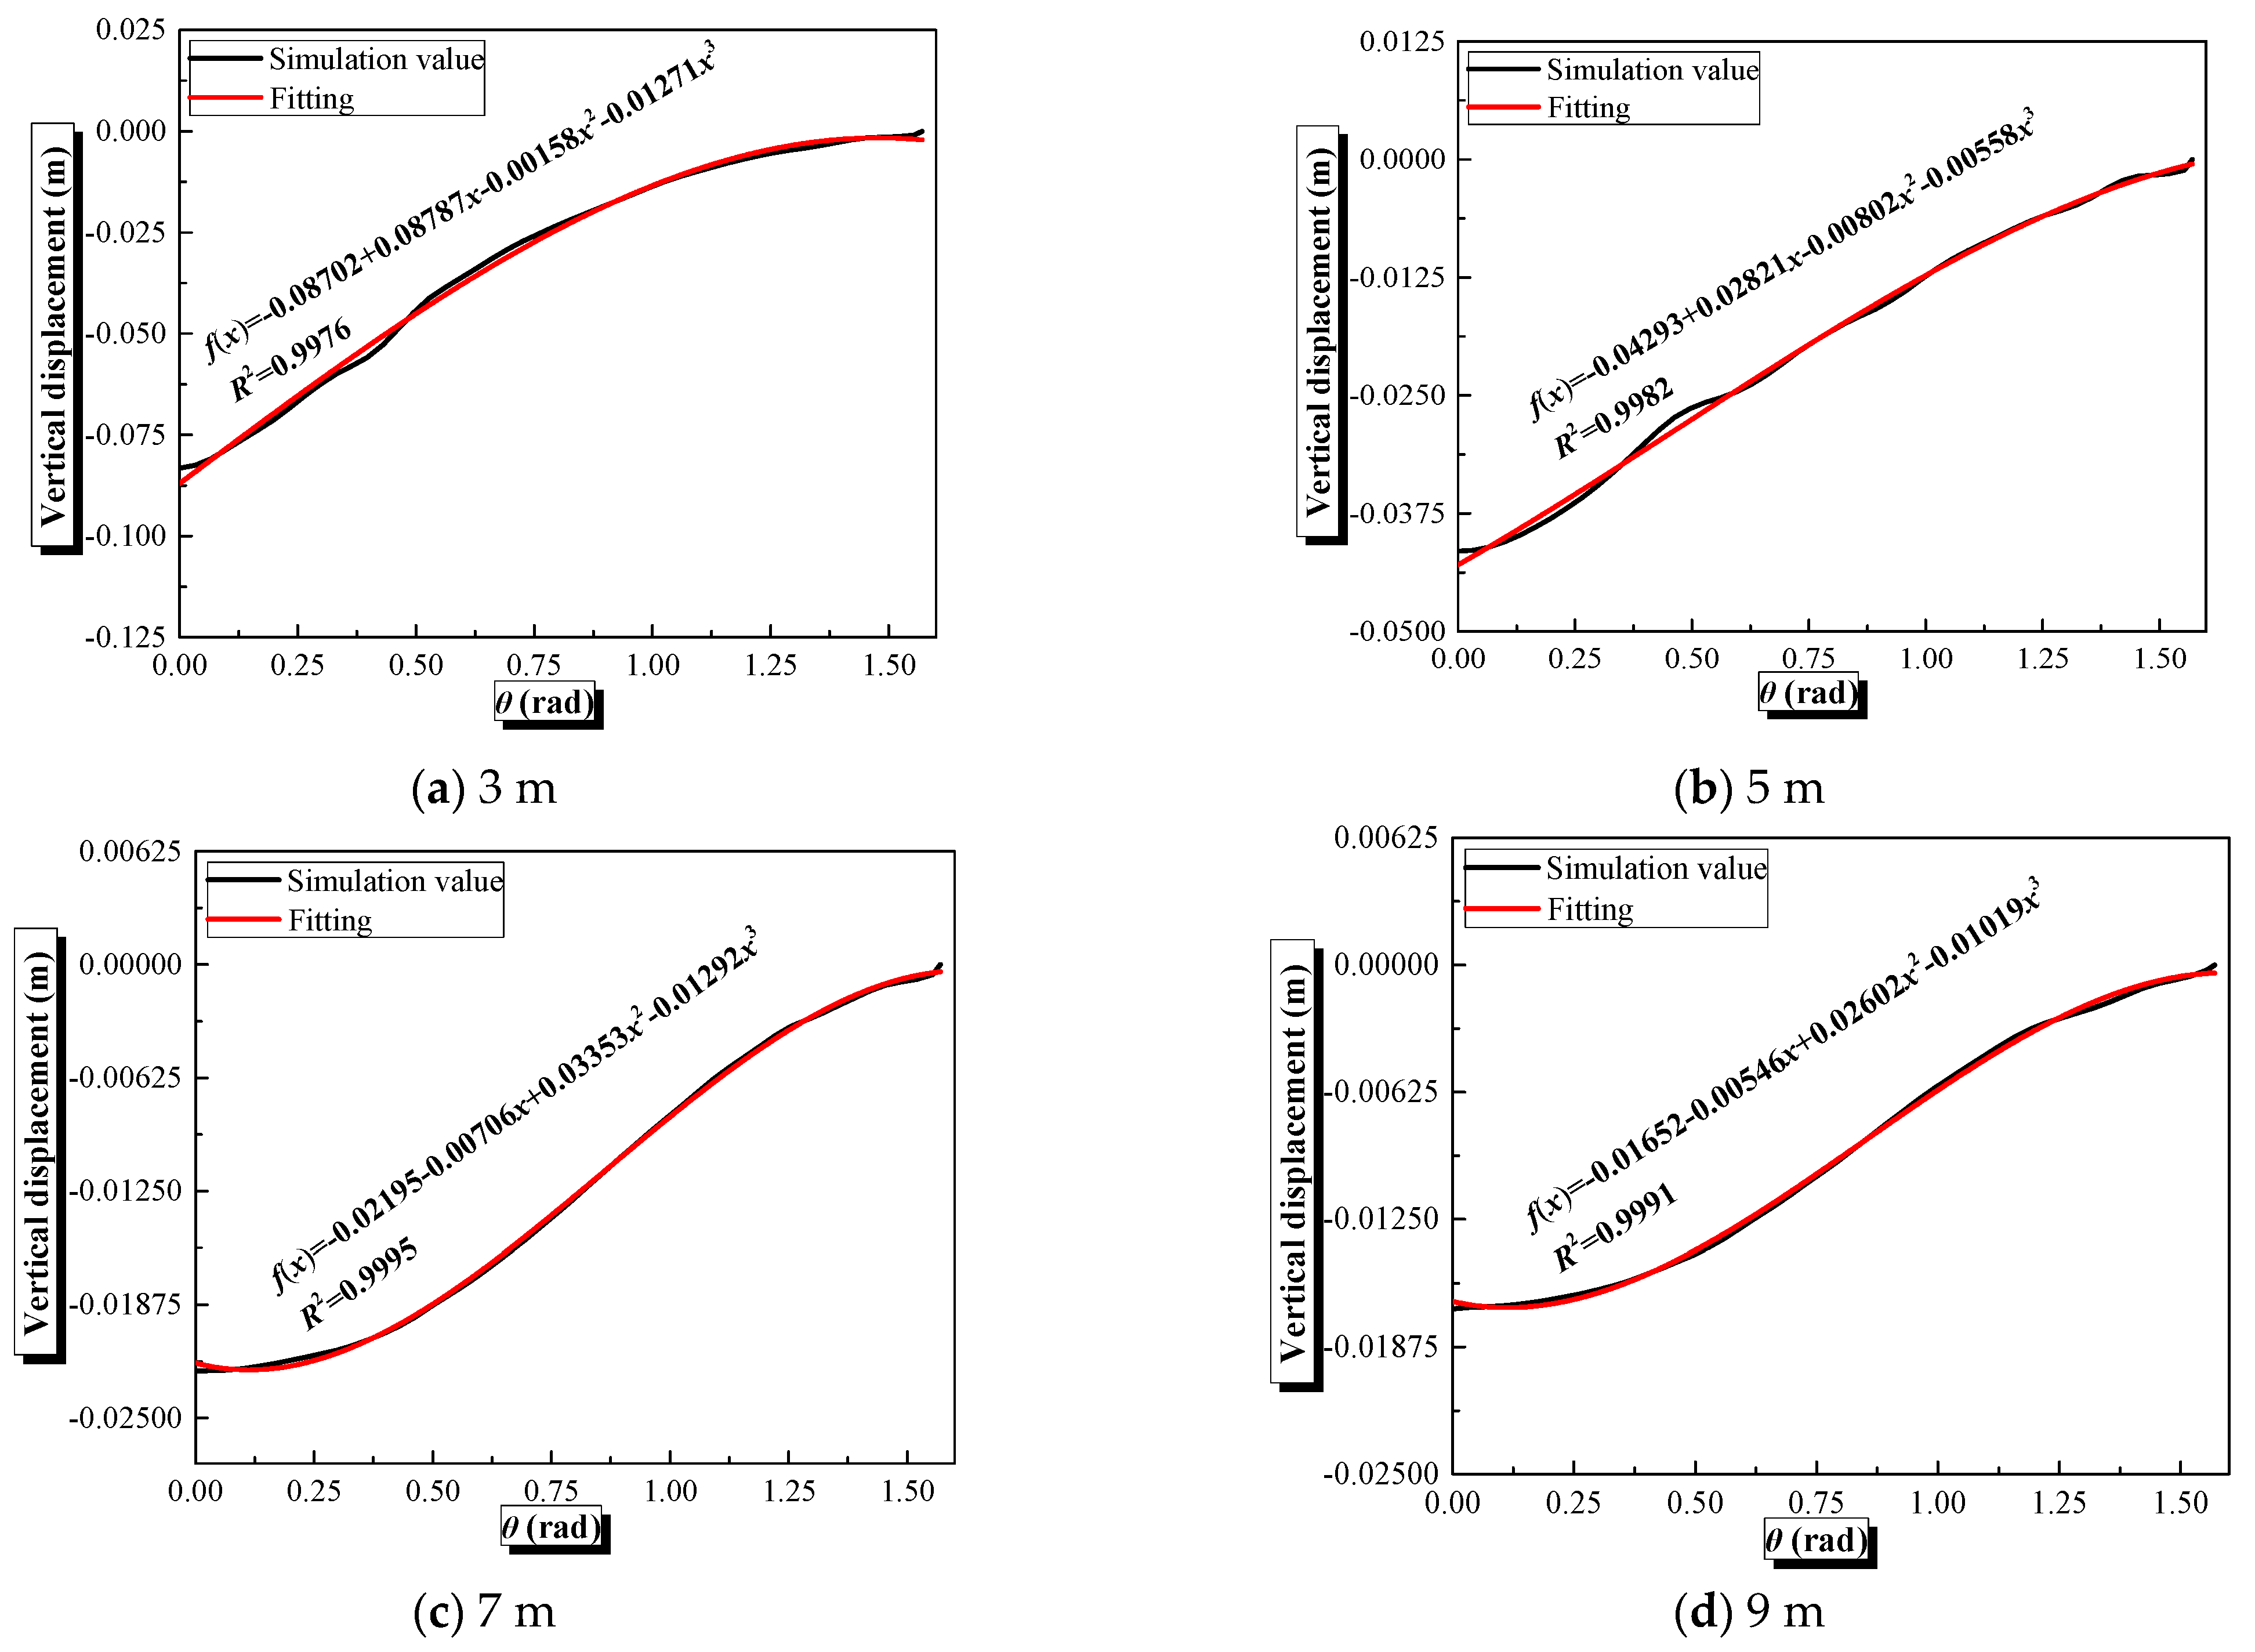
Figure 14 depicts the deformation schematic of a semi-spherical steel shell cross-section, contrasting the undeformed configuration with the shape in response to underwater shock waves. The convex deformation above the bottom constraint is evident, with the maximum displacement concentrated at the center (θ = 0 rad), gradually decreasing toward the shell edges. This asymmetric deformation pattern highlights the effect of curvature on stress distribution, where the spherical geometry induces membrane stresses that mitigate localized damage compared to linear structures. In addition, Figure 15 reveals that, when the center of the semi-spherical shell attains the first vertical peak displacement, the vertical displacement of its cross-section diminishes as a third-order polynomial with θ under varying explosion distances. The first vertical peak displacement at the center of the semi-spherical steel shell is the largest when compared to other positions of the semi-spherical cross-section. Figure 15 further illustrates the circumferential distribution of the first vertical peak displacement across the semi-spherical shell cross-section (θ ∈ [0, 1.57 rad]) at different explosive distances. The displacement decreases in a third-order polynomial manner with increasing θ. This trend confirms that the shell’s curved surface efficiently distributes shock wave energy, with the center bearing the maximum deformation due to direct loading. The fitting curves (R2 > 0.997) demonstrate consistent polynomial decay across all distances, validating the spherical shell’s stress dispersion capability.
Notably, the deformation at θ = 0 rad (center) is consistently the largest across all distances, reflecting the direct impact of shock waves along the symmetry axis. In contrast, regions with larger θ (near the shell’s edge) exhibit smaller displacements due to the ‘hoop effect’, where circumferential stresses restrain outward bulging. This behavior aligns with the theoretical analysis in Section 4.5, where hydrostatic pressure-induced hoop stresses were shown to reduce horizontal convex deformation. Comprehensive assessment of θ-dependent deformation provides a more complete picture of the shell’s dynamic response, beyond single-point vertical displacement.
The distinct responses can be attributed to the curvature-induced stress transmission mechanisms. (1) Hemispherical shells leverage their spherical curvature to convert normal shock wave pressures into tangential membrane stresses, distributing loads uniformly across the surface. This ‘hoop effect’ (based on fundamental structural mechanics theories) restrains outward deformation, as evident in the reduced displacement at larger distances. (2) Semi-cylindrical shells, lacking full circumferential curvature, rely more on bending resistance, which is less efficient in energy dissipation. The flat bottom and related structural parts act as areas prone to stress concentration. In response to shock waves, reflected waves amplify local stresses at these regions, leading to more significant deformation. This aligns with basic structural mechanics principles, where geometric discontinuities (such as the transition from flat to curved parts in semi-cylindrical shells) create stress-sensitive zones, unlike the more uniform stress distribution in hemispherical shells due to their continuous curvature. As noted by Wierzbicki and Fatt [22], cylindrical shells under blast loads exhibit higher bending stresses due to their limited curvature, aligning with our findings in Figure 16.
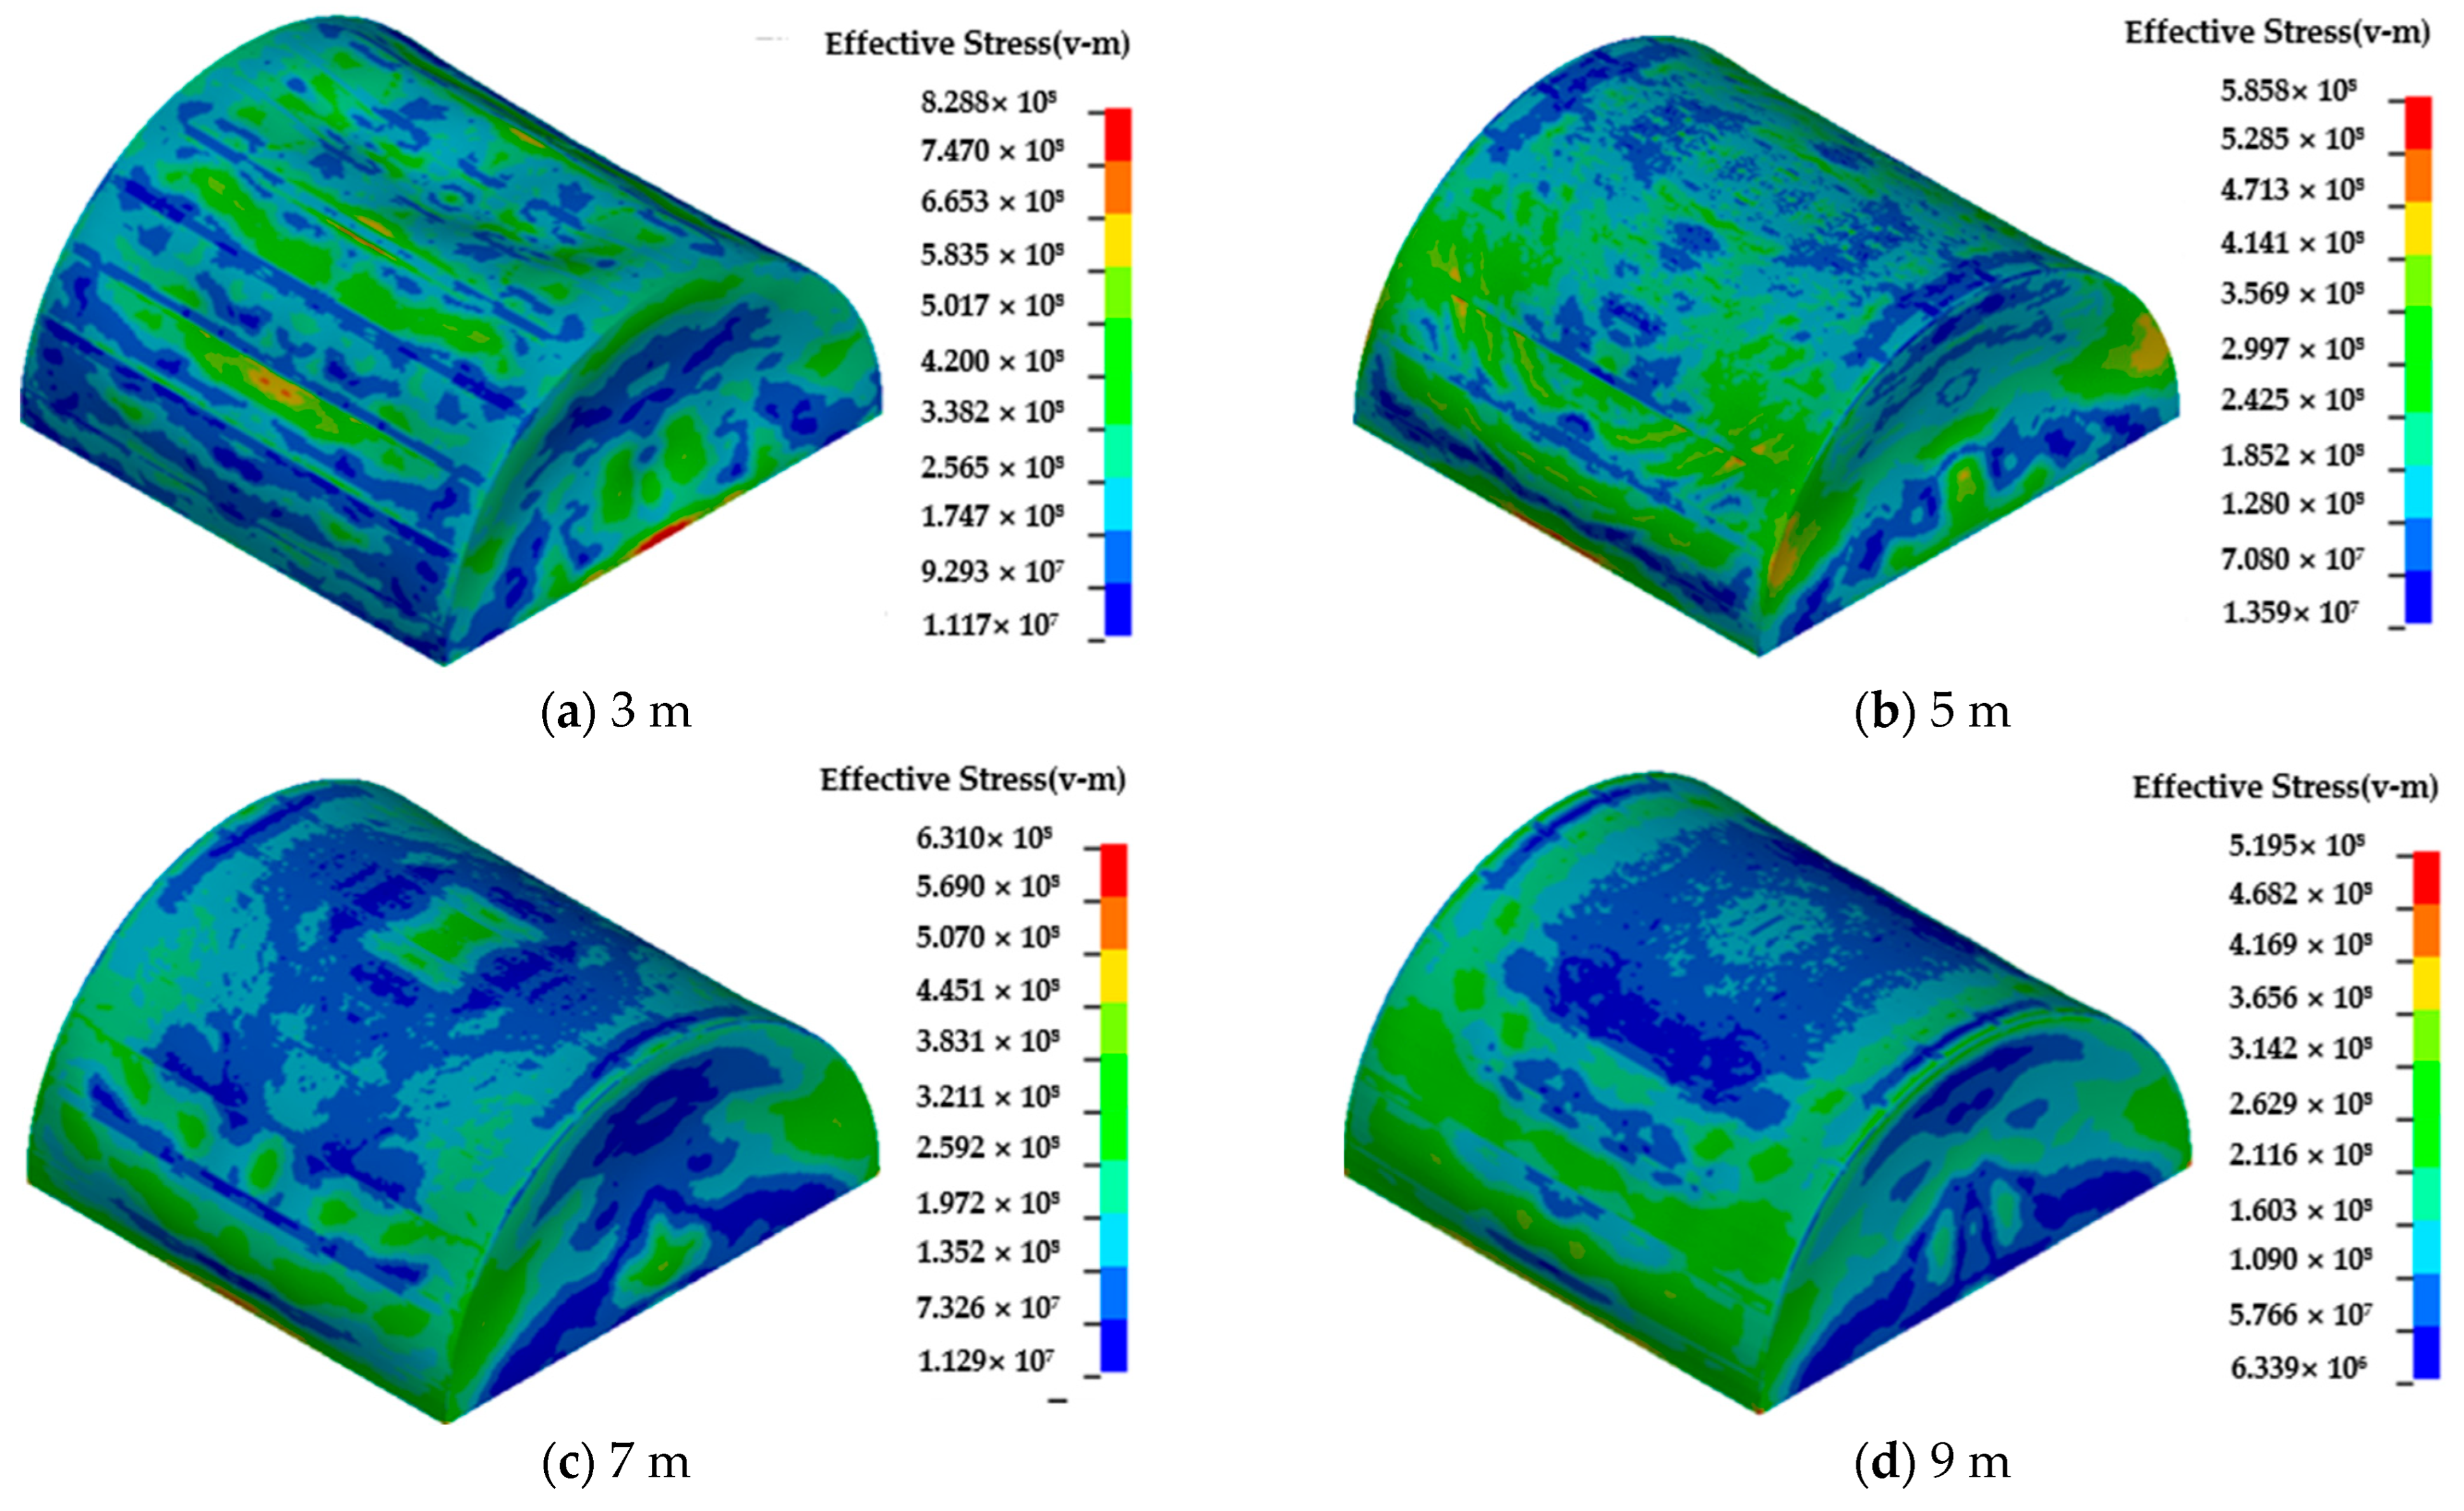
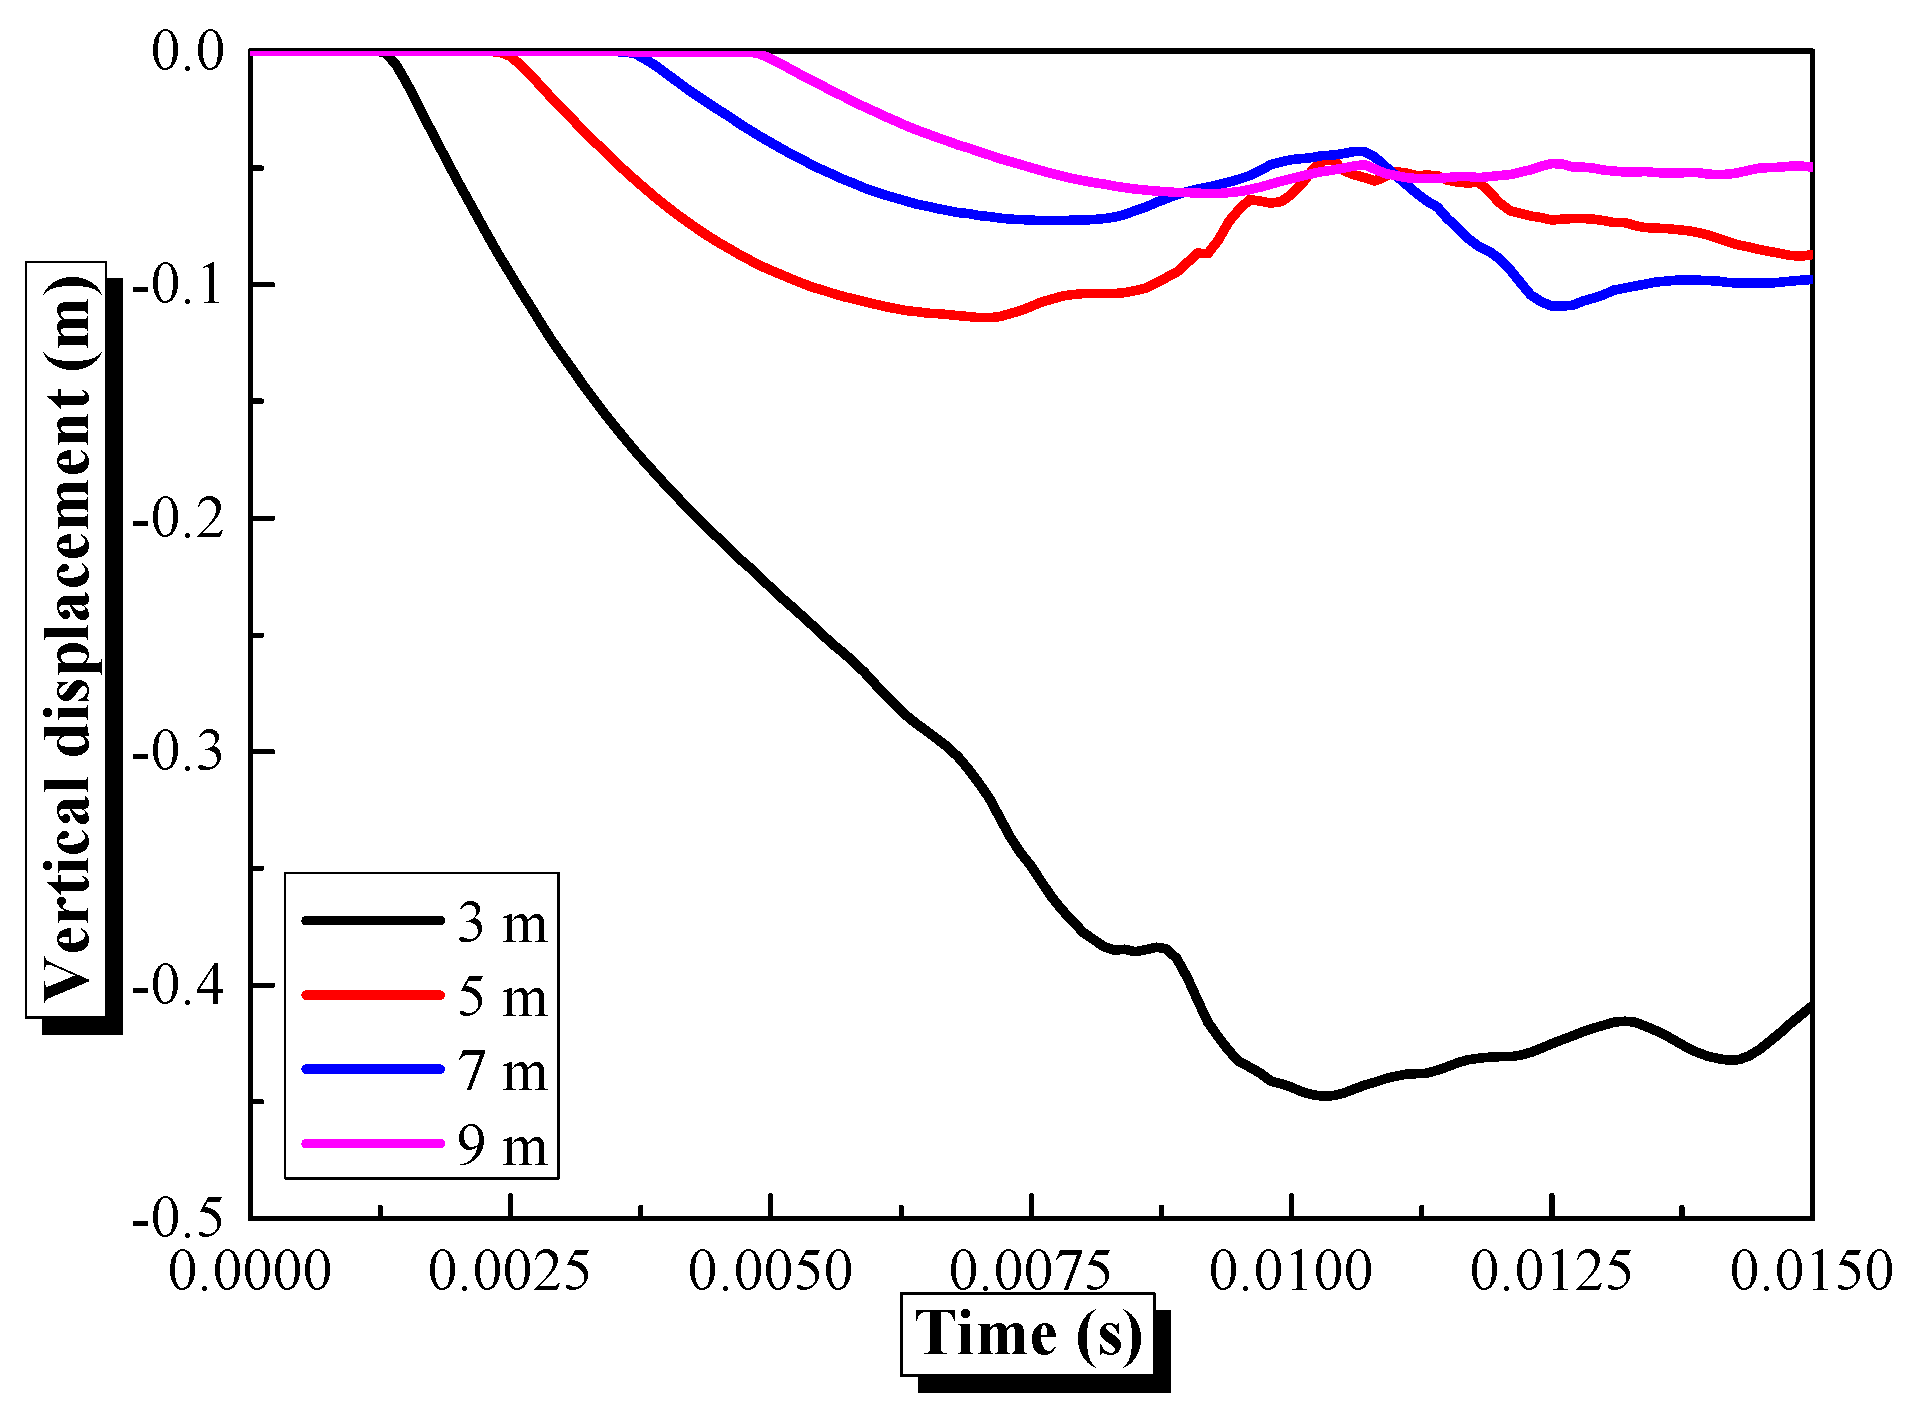
Figure 16 demonstrates that the deformation of the semi-cylindrical steel shell reduces as the explosive distance increases. The semi-cylindrical steel shell has the most considerable deformation at a 3 m explosion distance compared with 5 m, 7 m, and 9 m explosive distances. The semi-cylindrical deformation consists of convex deformation at the bottom, concave deformation of the sidewalls at both ends, and concave deformation at the center. Due to the explosion, the shock wave load shows a symmetric distribution along the half-cylindrical shell wall in the circumferential direction and the half-cylindrical shell in the axis direction. The deformation in the circumferential direction, axial direction, and both end side walls also shows symmetry. As depicted in Figure 17, the central displacement of the semi-cylindrical steel shell at an explosive distance of 3 m is notably larger than that at 5 m, 7 m, and 9 m. This discrepancy can be attributed to the nonlinear attenuation of shock wave pressure with distance, as described by Cole’s formula: the peak pressure at 3 m is 174.67 MPa—nearly twice that at 5 m (81.18 MPa, Table 5)—leading to a dramatic increase in impulsive loading. The semi-cylindrical shell’s linear geometry (flat bottom + curved sidewalls) exacerbates stress concentration at the center under close-range loading, where the lack of continuous curvature prevents effective membrane stress distribution, resulting in pronounced concave deformation. In contrast, at distances greater than or equal to 5 m, the attenuated pressure induces primarily elastic deformation, causing the displacement curves to converge. As shown in Figure 18, the first vertical peak displacement of the semi-cylindrical shell’s center decreases in a third-order polynomial manner with increasing distance, contrasting sharply with the semi-spherical shell’s response. For example, at 3 m, the semi-cylindrical shell’s displacement (−0.38566 m) is 4.6 times that of the semi-spherical shell (−0.08321 m), highlighting the critical role of geometric curvature. The semi-spherical shell’s continuous curvature induces a ‘hoop effect’, converting normal shock pressures into circumferential membrane stresses that mitigate radial deformation, whereas the semi-cylindrical shell’s flat bottom lacks this mechanism, leading to localized instability. This disparity underscores the superior blast resistance of spherical geometries in high-pressure environments, as their curvature efficiently dissipates energy through stress diffusion.
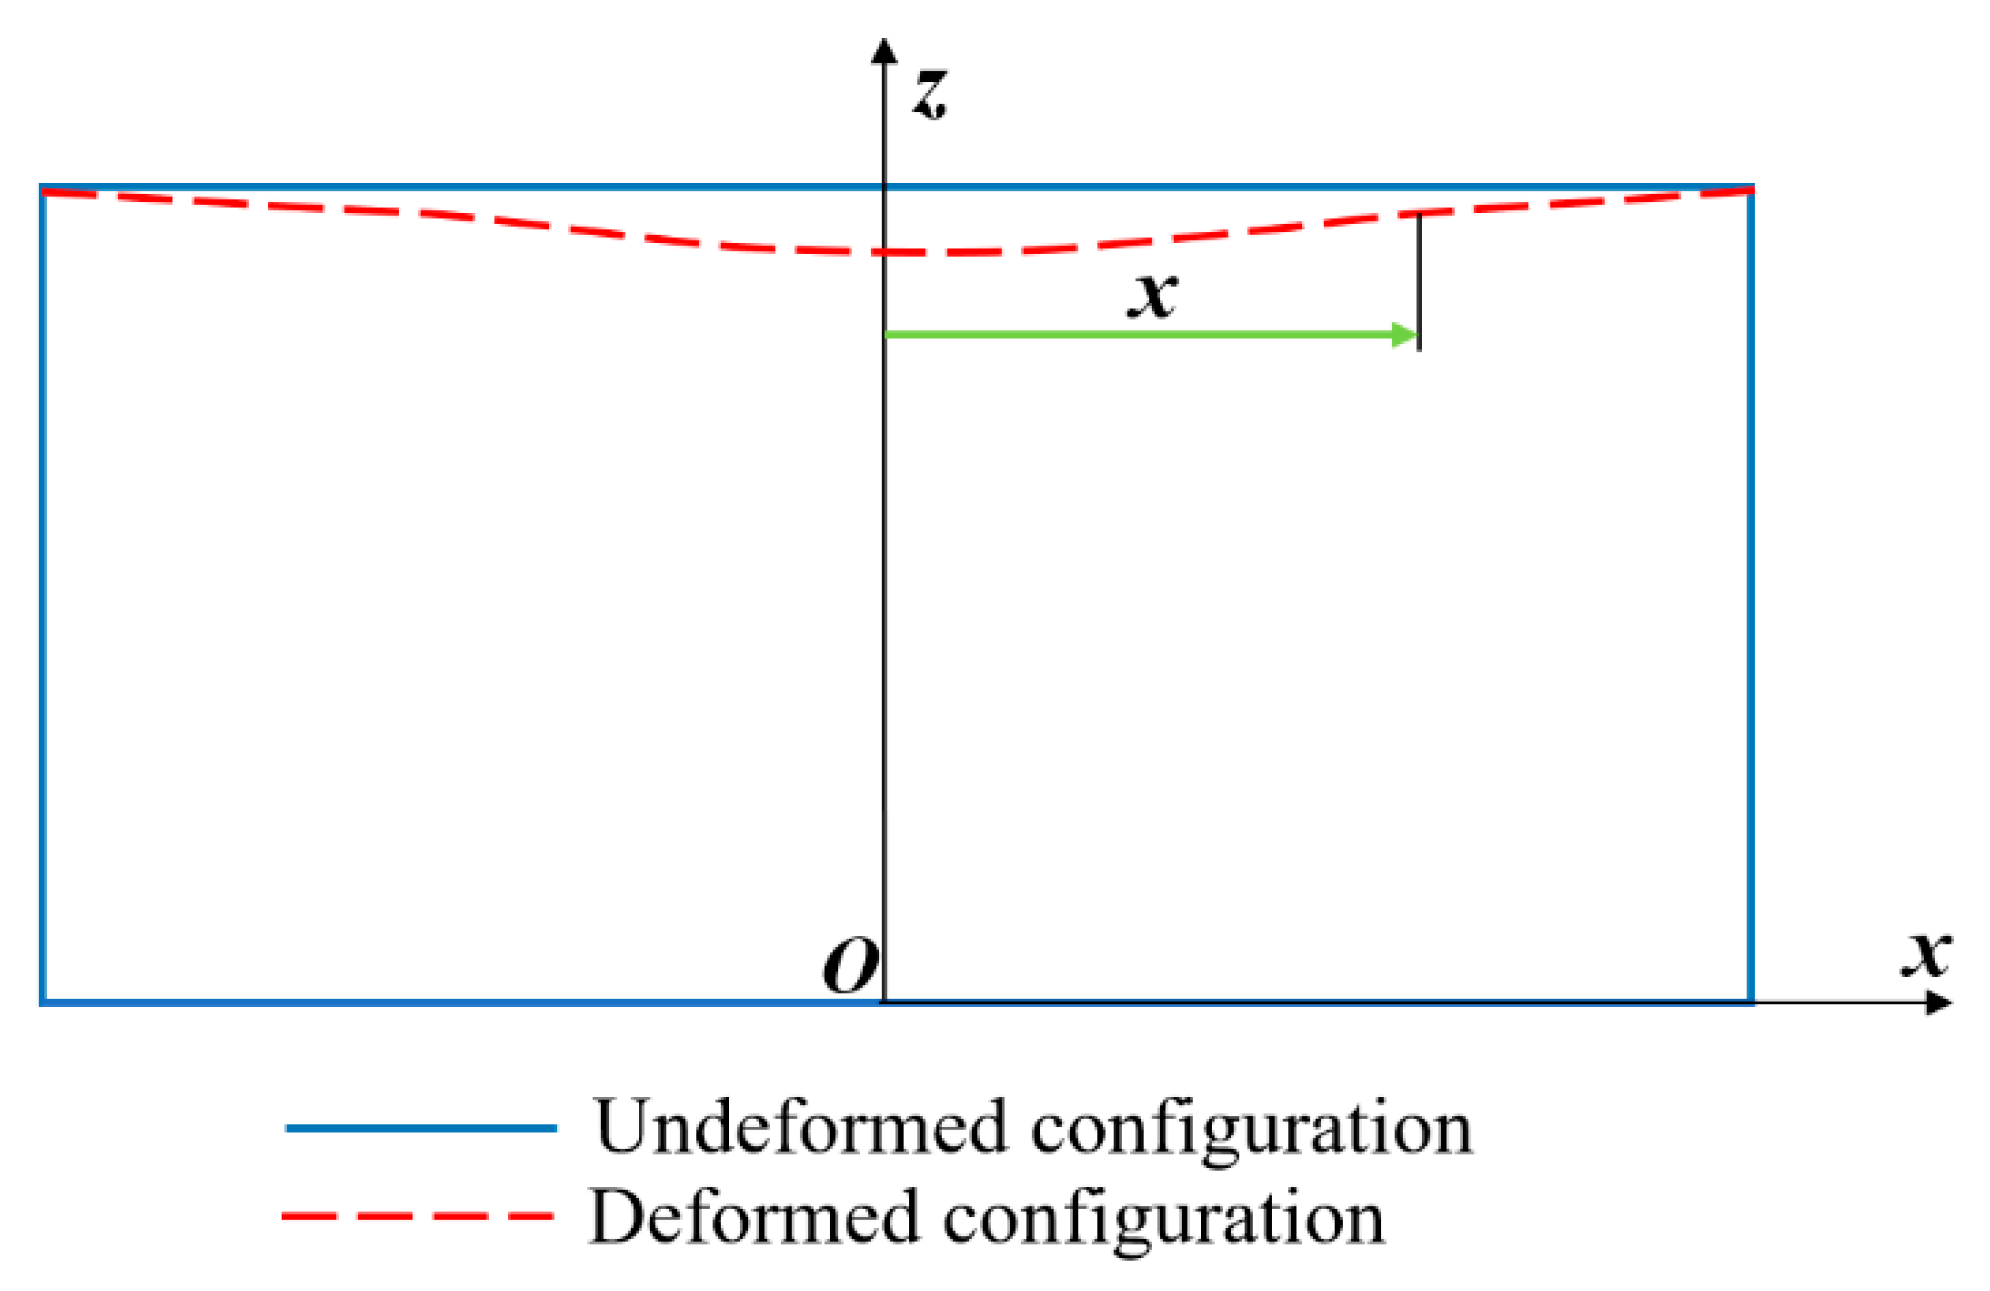
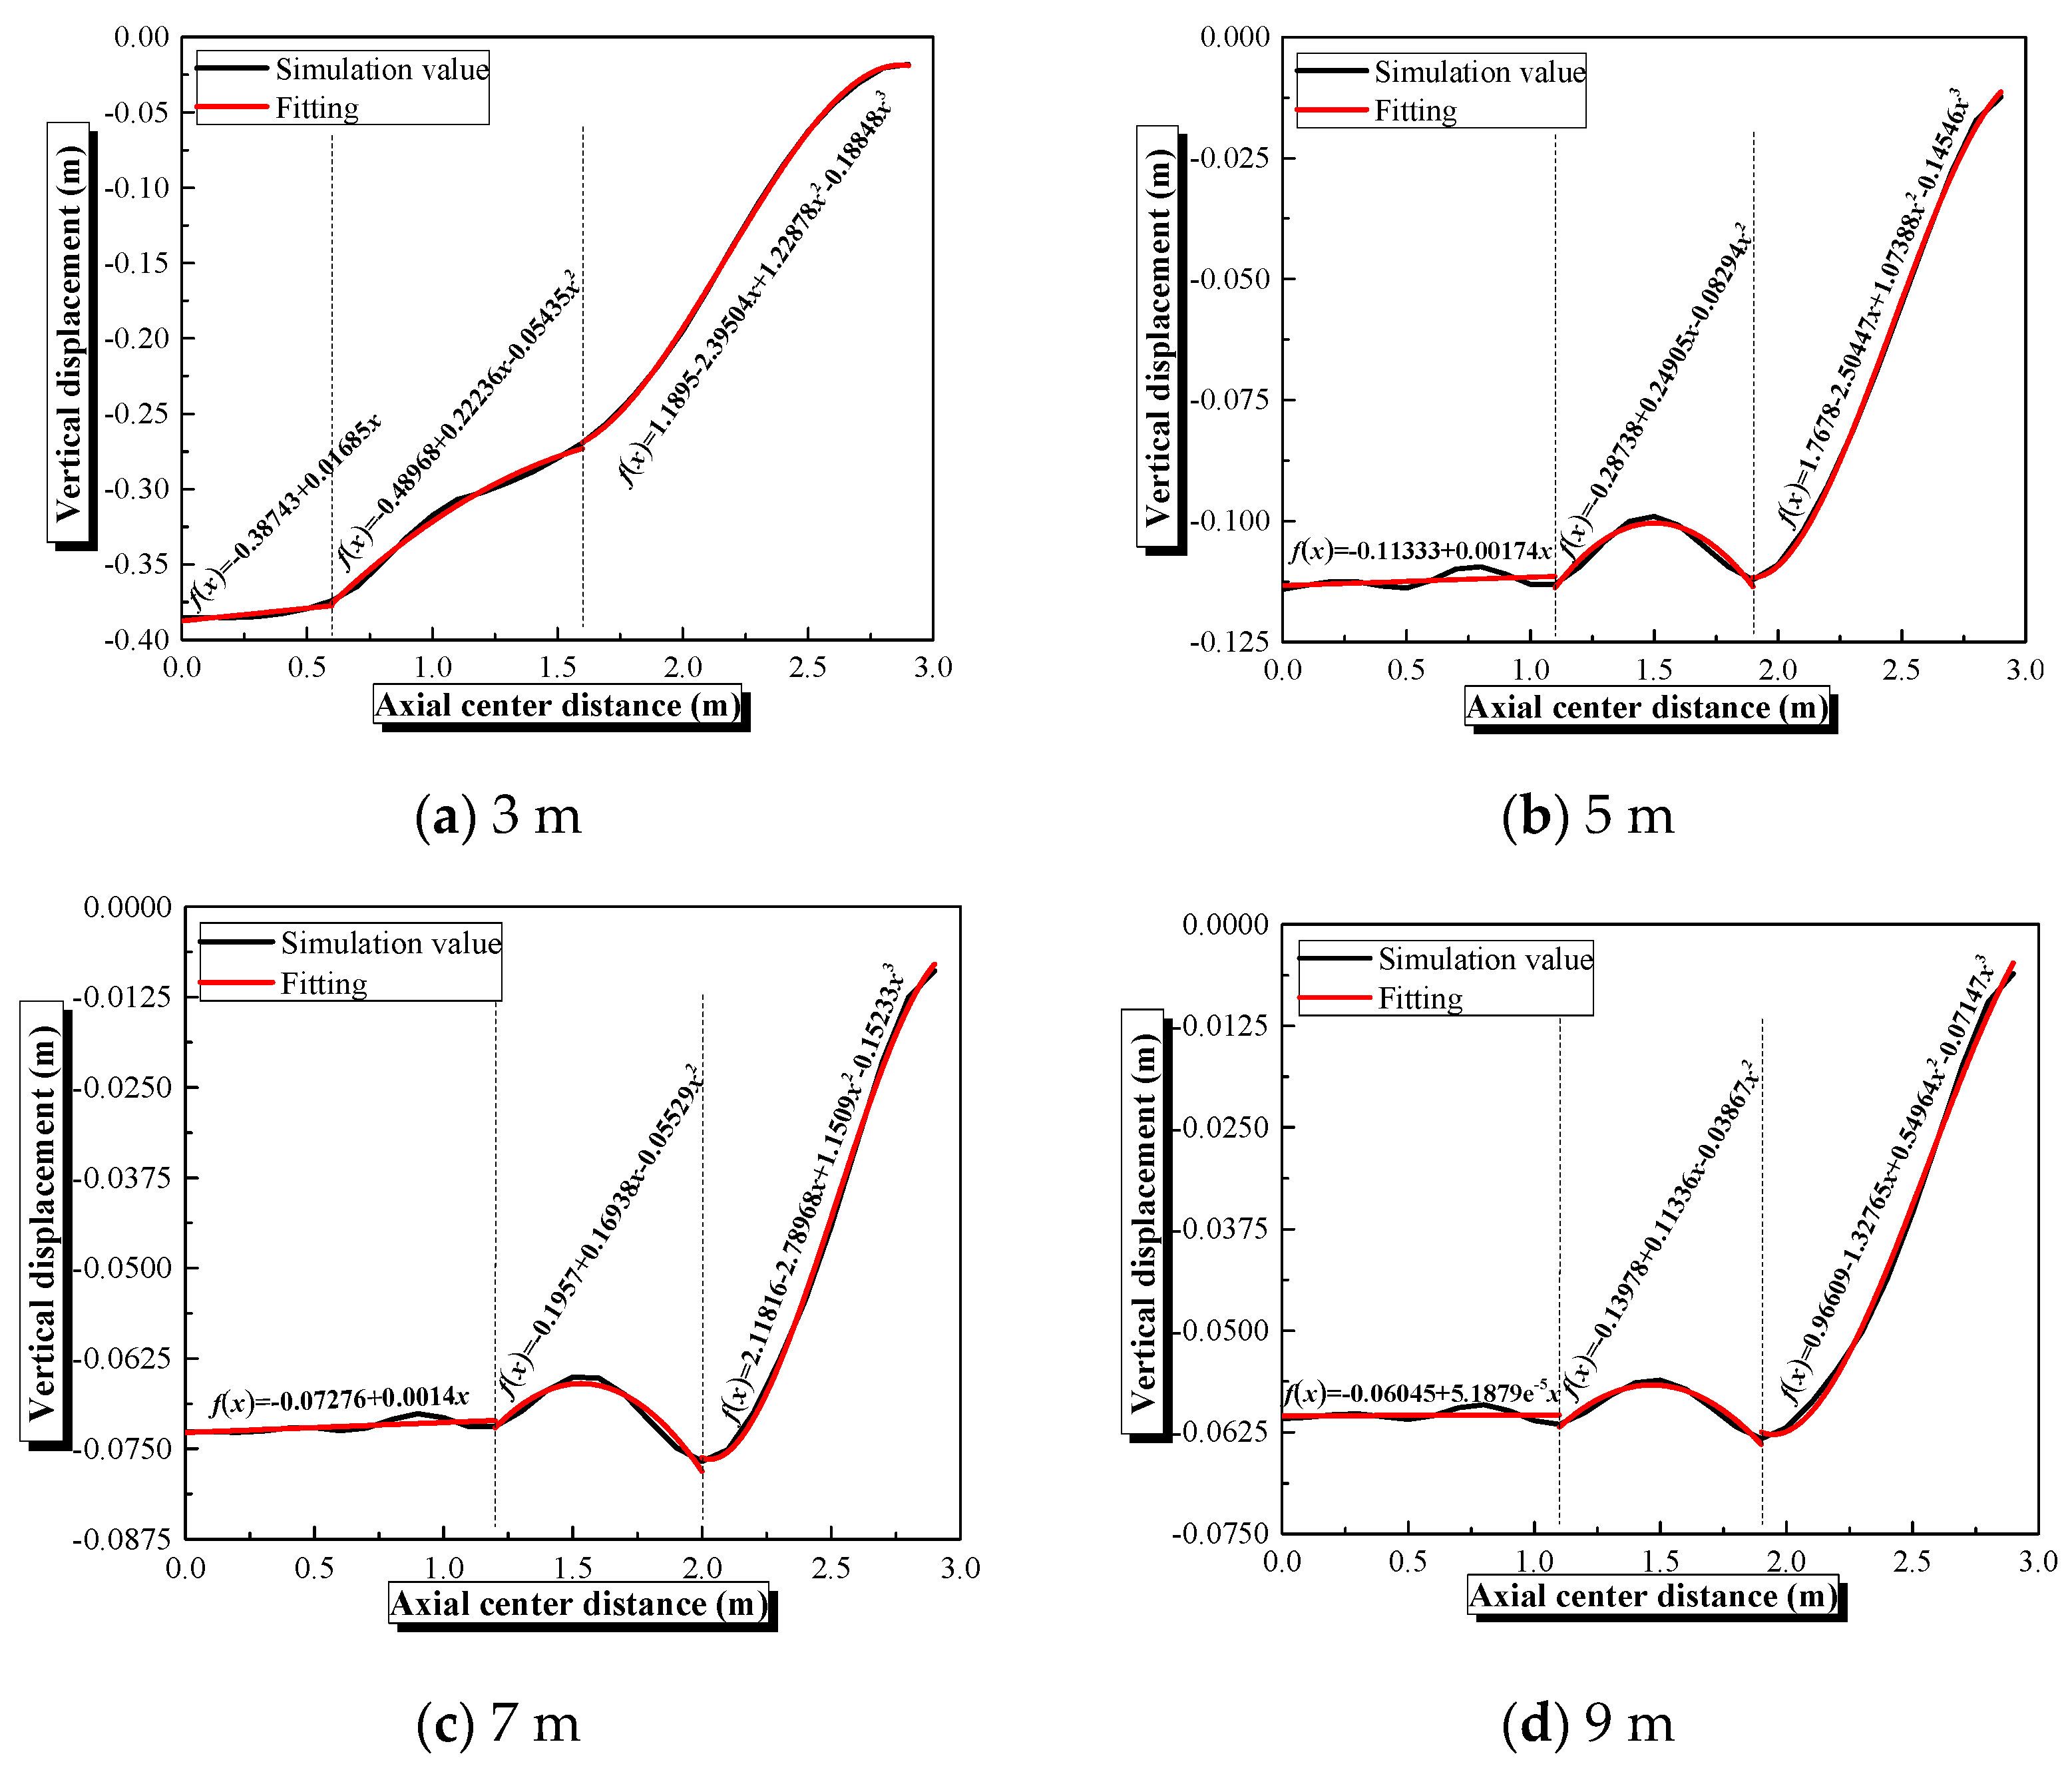
Figure 19 presents the deformation schematic for the axial cross-section of a semi-cylindrical steel shell. When the center of the semi-cylindrical shell reaches the first vertical peak displacement, the top vertical displacements of the semi-cylindrical shell structure mainly show three kinds of changing characteristics with an increase in axial center distance x that ranges from 0 to 3 m. Firstly, the top vertical displacement of the shell structure decreases linearly as the axial center distance increases. Secondly, it exhibits a quadratic polynomial trend, decreasing initially and then increasing as the axial center distance further increases. Thirdly, it demonstrates a third-order polynomial increase as the axial center distance keeps increasing. Notably, the Jones–Wilkens–Lee (JWL) equation, namely Equation (1), describes the relationship among pressure, specific energy, and the volume of explosive products during the explosive’s energy release process. Equation (2) represents the Gruneisen equation of state for water, while Equation (5) defines the linear polynomial equation of state for air. Figure 20 illustrates the curves of the semi-cylindrical steel shell’s center first vertical peak displacement varying with x at an explosive equivalent of 300 kg under different explosive distances. The fitting value obtained by Equations (8)–(10) and the simulation value have better consistency. The semi-cylindrical shell structure has a most significant deformation at the mid-span position when directly subjected to a shock wave above the center of the shell, which absorbs a greater amount of shock wave energy. Similar to the plastic hinge at the beam end of a reinforced beam, the semi-cylindrical bottom-sitting shell structure also has a relatively large deformation region at the junction of variation characteristics II and III. This region can withstand bending moments in a specific direction and has a large corner that absorbs more shock wave energy through deformation.
Variation characteristic I:
f(x) = a1 + b1x
Variation characteristic II:
f(x) = a2 + b2x + c2x2
Variation characteristic III:
f(x) = a3 + b3x + c3x2 + d3x3
where f(x) is the top vertical displacement and a1, a2, a3, b1, b2, b3, c2, c3, and d3 are constant.

4.4. Influence of Explosive Equivalent on the Dynamic Behavior of Semi-Spherical and Semi-Cylindrical Bottom-Sitting Steel Shells

The explosive equivalent is a key element influencing the structure’s dynamic behavior. Thus, explosive equivalents of 50 kg, 100 kg, 200 kg, 300 kg, 500 kg, and 800 kg are chosen to examine the dynamic response of semi-spherical and semi-cylindrical bottom-sitting steel shells under underwater explosion shock wave loading at an explosive distance of 5 m. This range is selected to cover typical underwater blast scenarios, from small-scale explosions to large-scale events, while including the validated 300 kg case to ensure model reliability. The span allows analysis of nonlinear deformation characteristics, from elastic to plastic regimes, and aligns with equivalent ranges in prior studies [4,17].
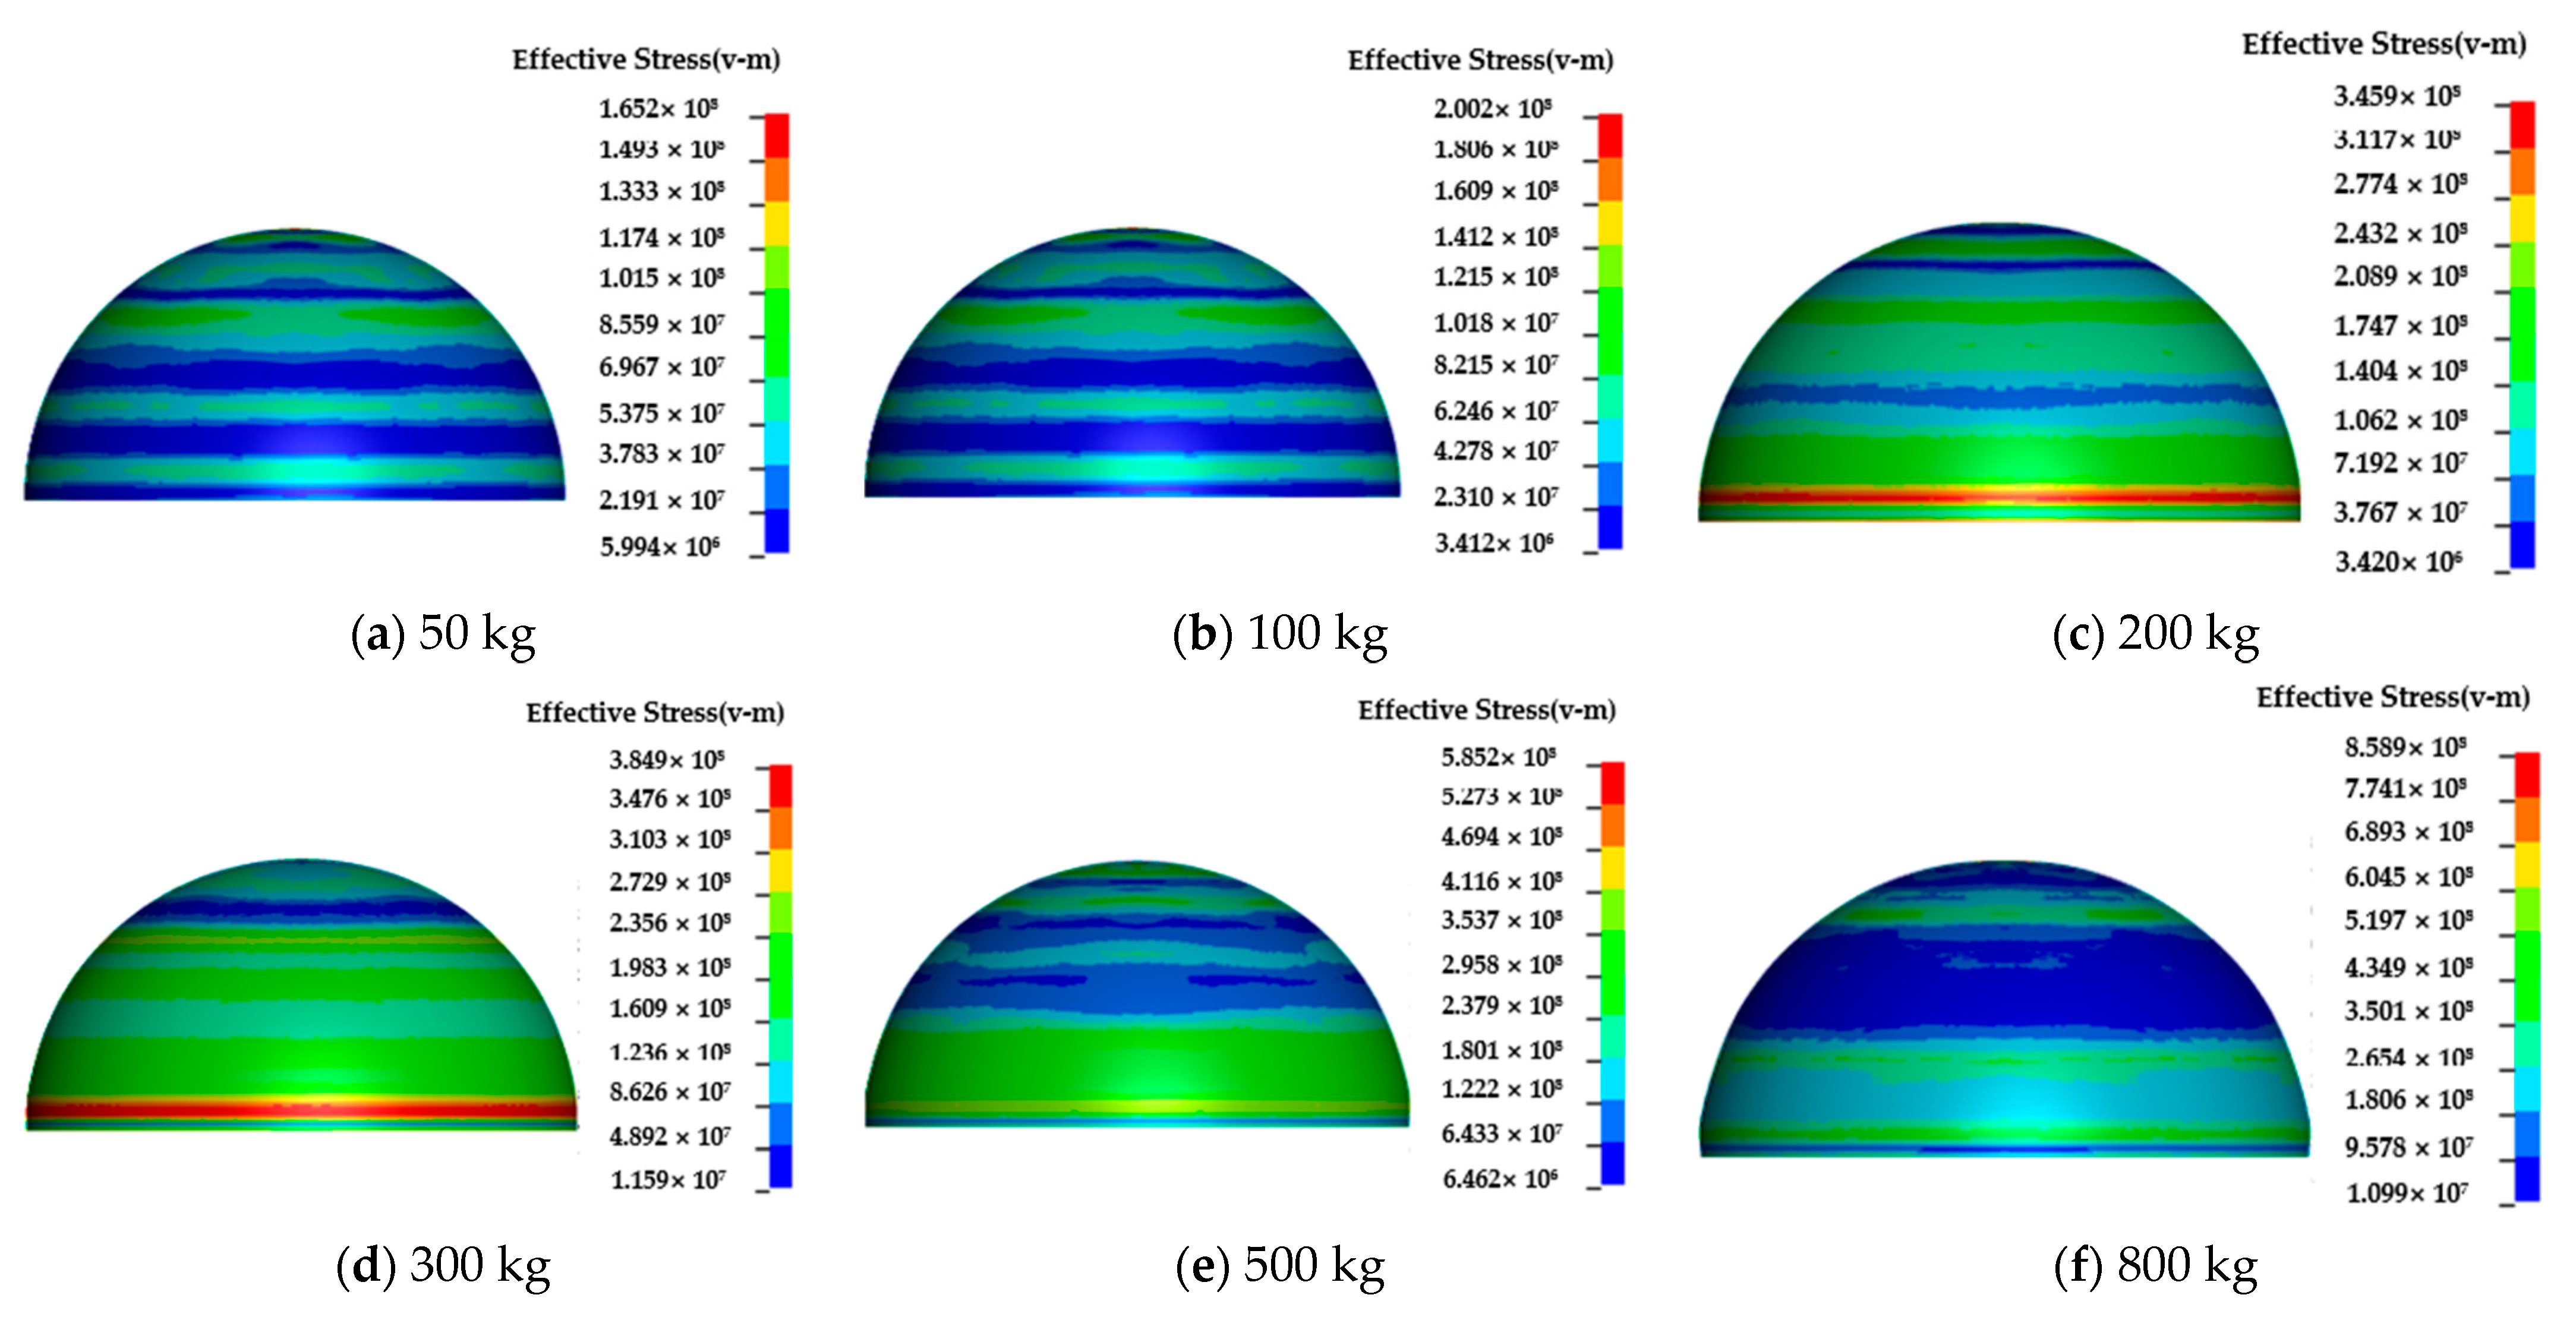
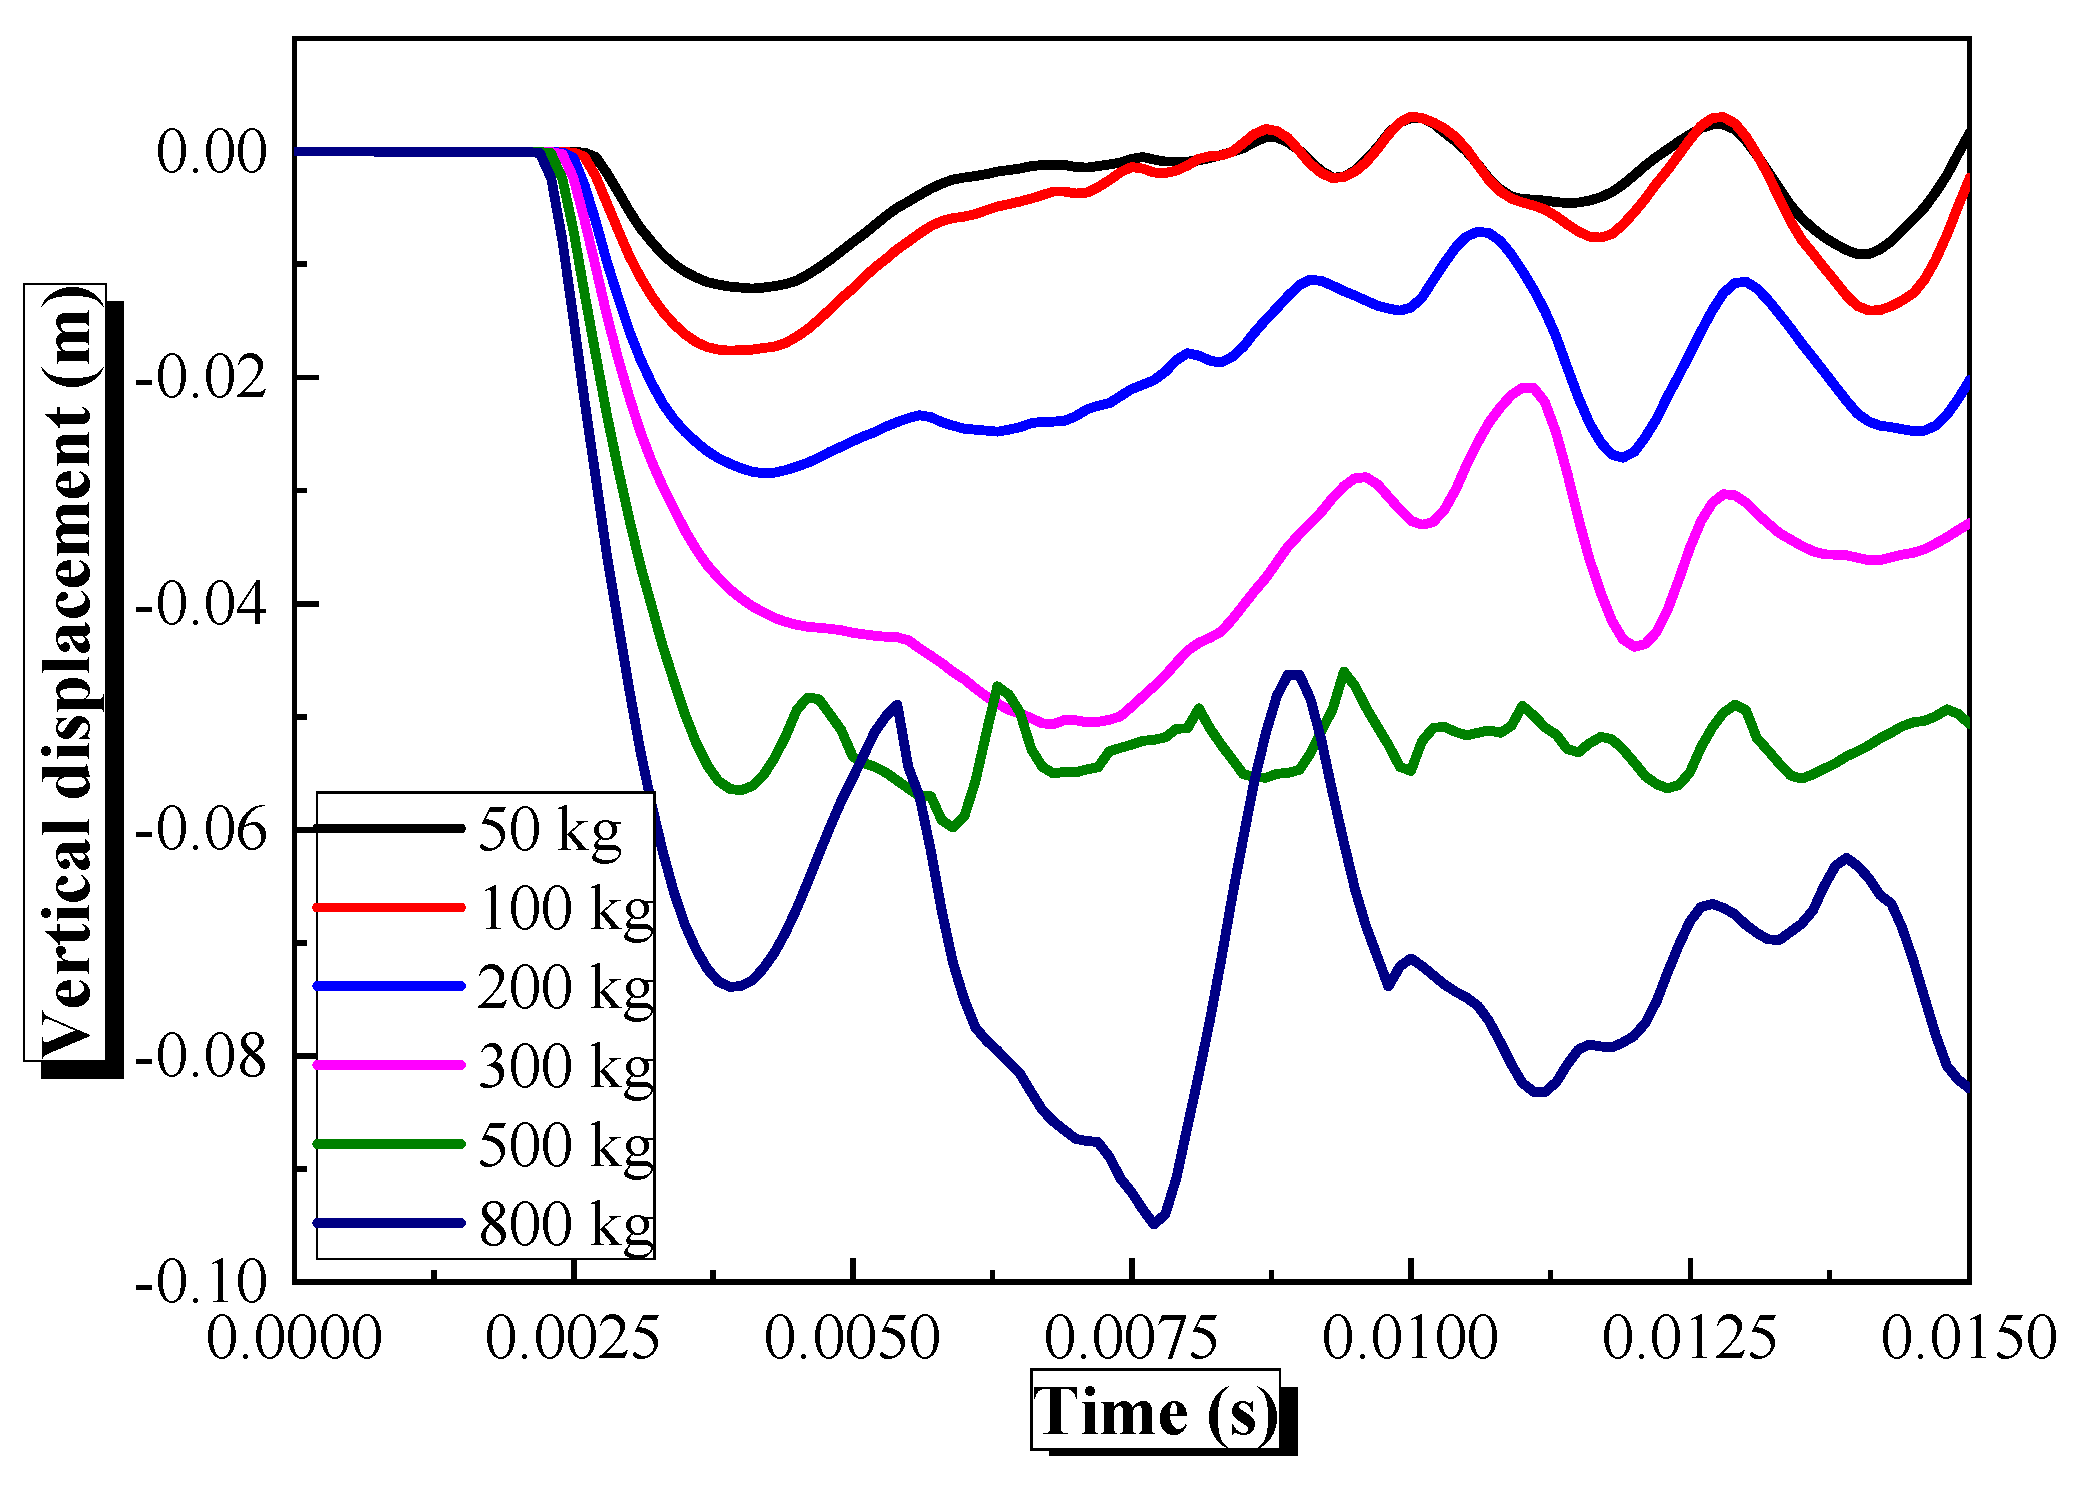
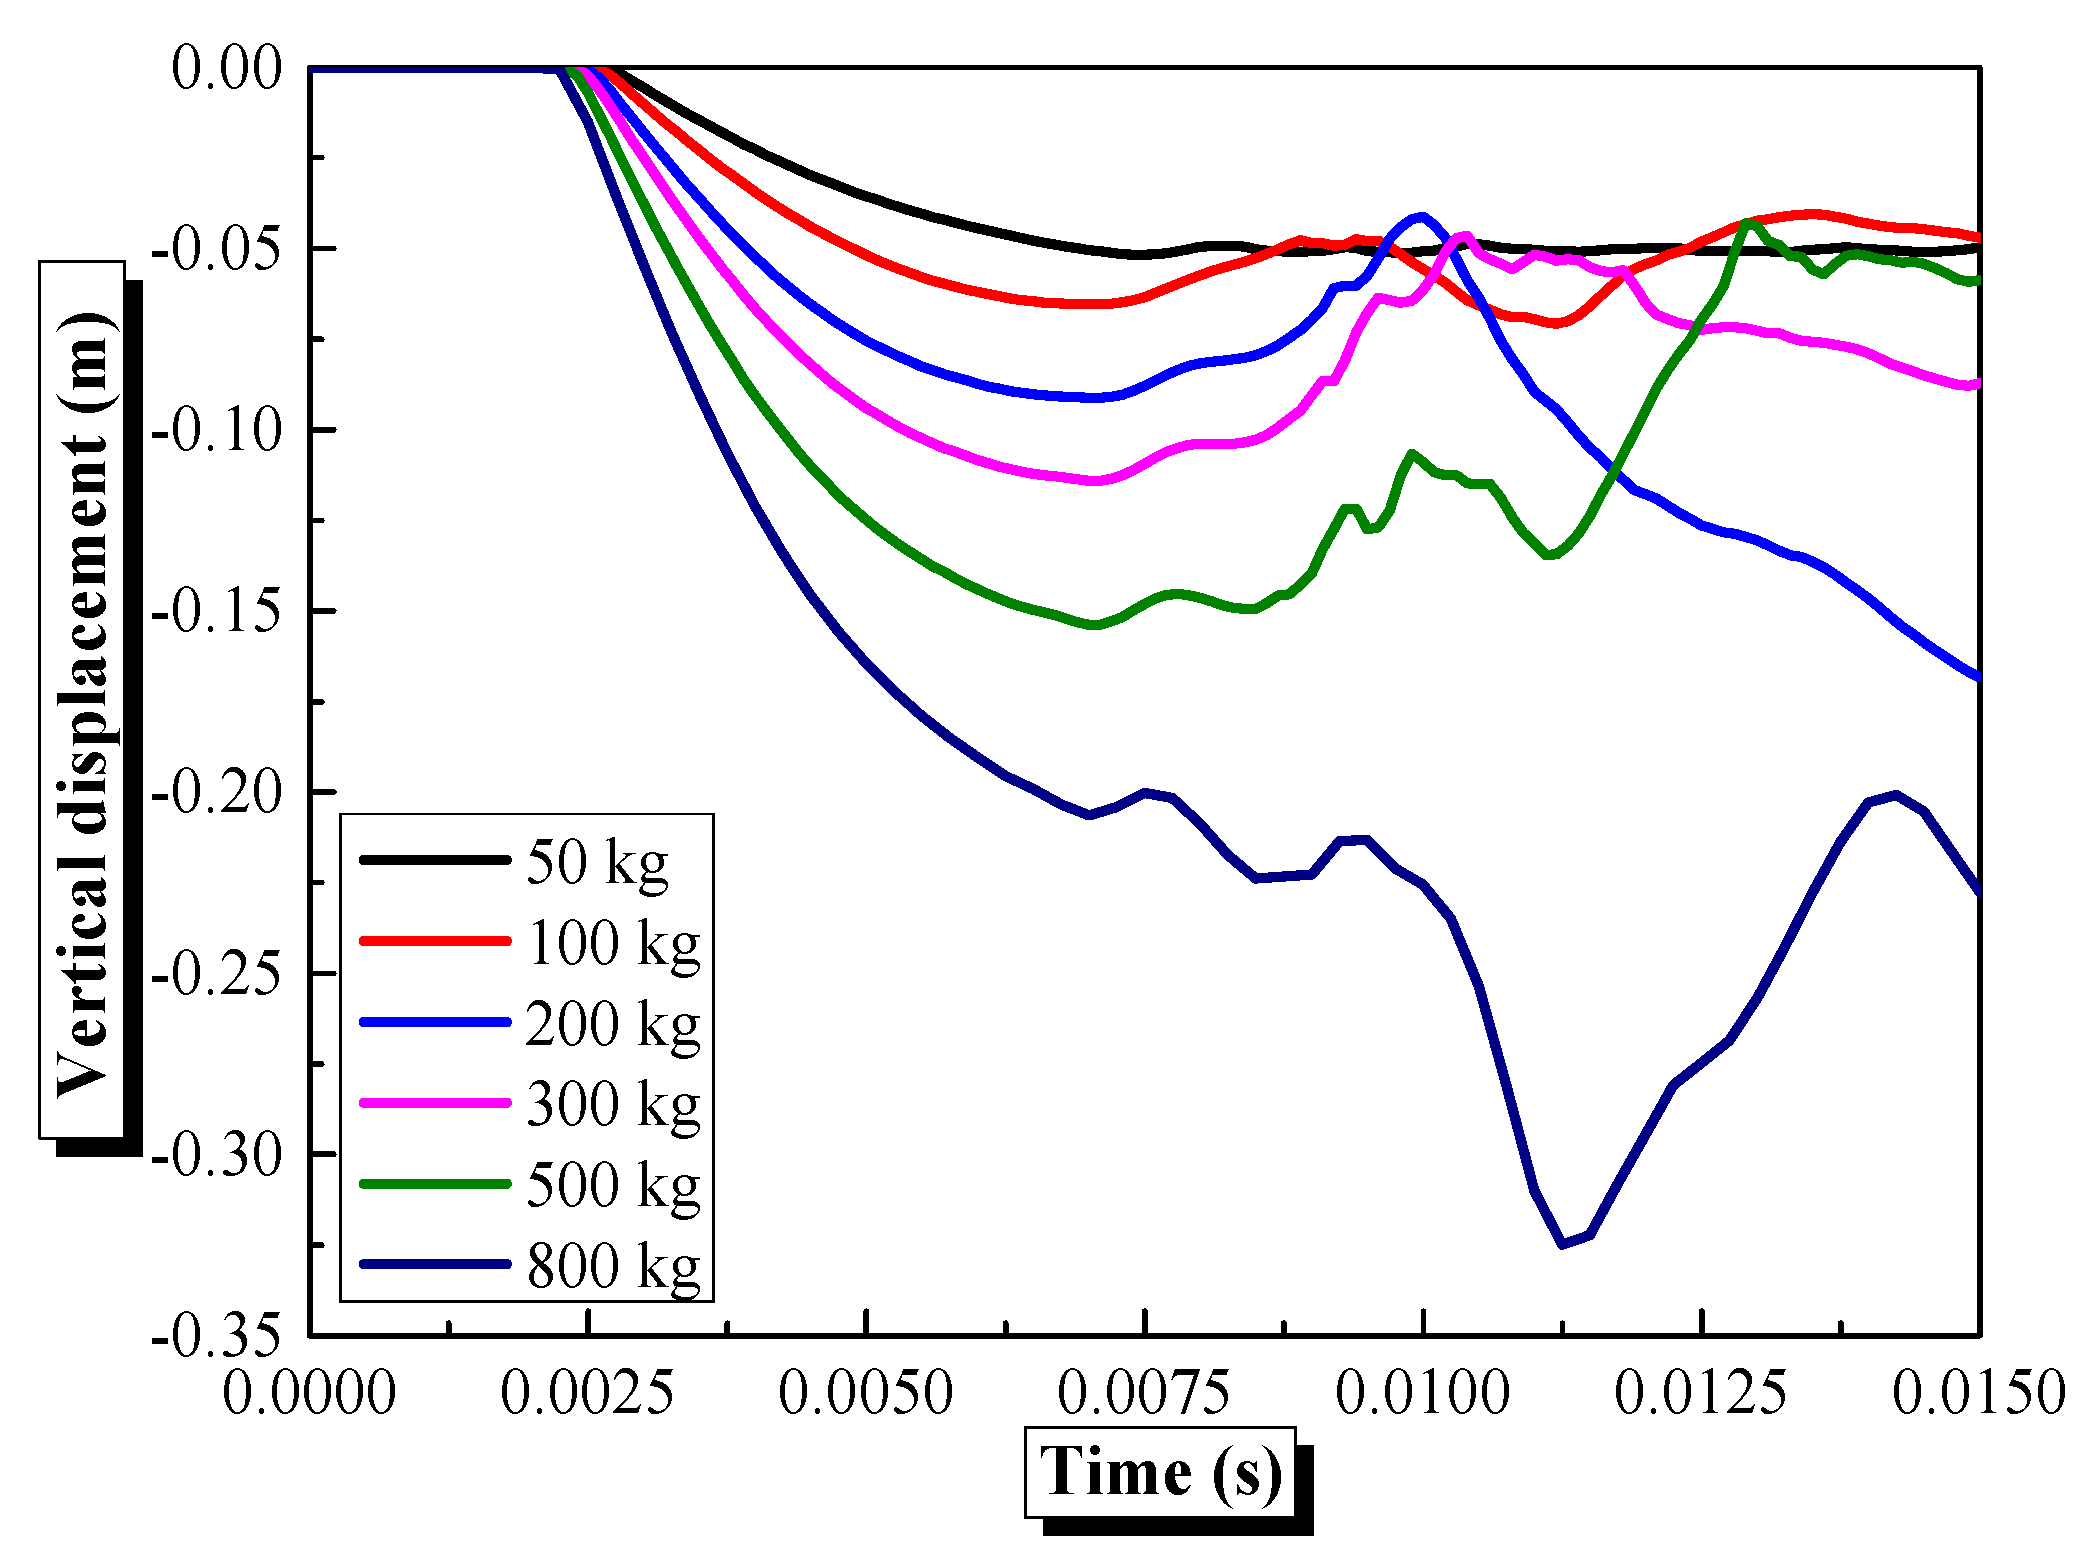
Figure 21 shows that the effective stress of the semi-spherical steel shell significantly increases with the increase of explosive equivalent, primarily concentrated in the convex region above the bottom constraints. For instance, in response to an underwater explosion, the maximum effective stress rises from 101.5 MPa (50 kg) to 519.7 MPa (800 kg), a 4.1-fold increase, demonstrating a nonlinear growth pattern consistent with the energy input from larger explosions. Figure 22 illustrates that the center vertical deformation of the semi-spherical steel shell increases significantly with the increase in explosive equivalent. This phenomenon can be primarily attributed to two factors: (1) the shock wave energy increases nonlinearly with the explosive equivalent; (2) the shock wave pressure is positively correlated with the explosive equivalent. Compared with lower explosive equivalents, the center vertical displacement increases from approximately 12.12 mm at 50 kg to 73.89 mm at 800 kg, a 5.1-fold increase, clearly demonstrating the nonlinear growth of deformation with energy input. The explosive equivalent directly determines the total shock wave energy, and a higher equivalent leads to greater peak pressure and impulse. As shown in Figure 23, the center first vertical peak displacement of the semi-spherical shell reaches—0.07389 m at an 800 kg equivalent, increasing by 5.1 times compared with 50 kg, which is consistent with nonlinear growth of shock wave energy (energy release is linear with equivalent, while structural deformation is nonlinearly positively correlated with energy). At the same time, the strain-rate sensitivity of the material (C = 0.021 in the John–Cook model) exacerbates plastic deformation at high equivalents. The maximum effective stress at the bottom of the semi-spherical steel shell above the constraint is about 519.7 MPa in response to an underwater explosion shock wave with an 800 kg explosive equivalent, which does not exceed the ultimate strength of 770 MPa of Q690 steel. This indicates that the semi-spherical steel shell structure has excellent blast resistance performance in response to underwater explosion shock waves. For engineering applications, especially in critical underwater facilities such as deep-sea exploration cabins or underwater protective structures, choosing a semi-spherical structure can significantly enhance safety and reliability, providing direct guidance for practical design.
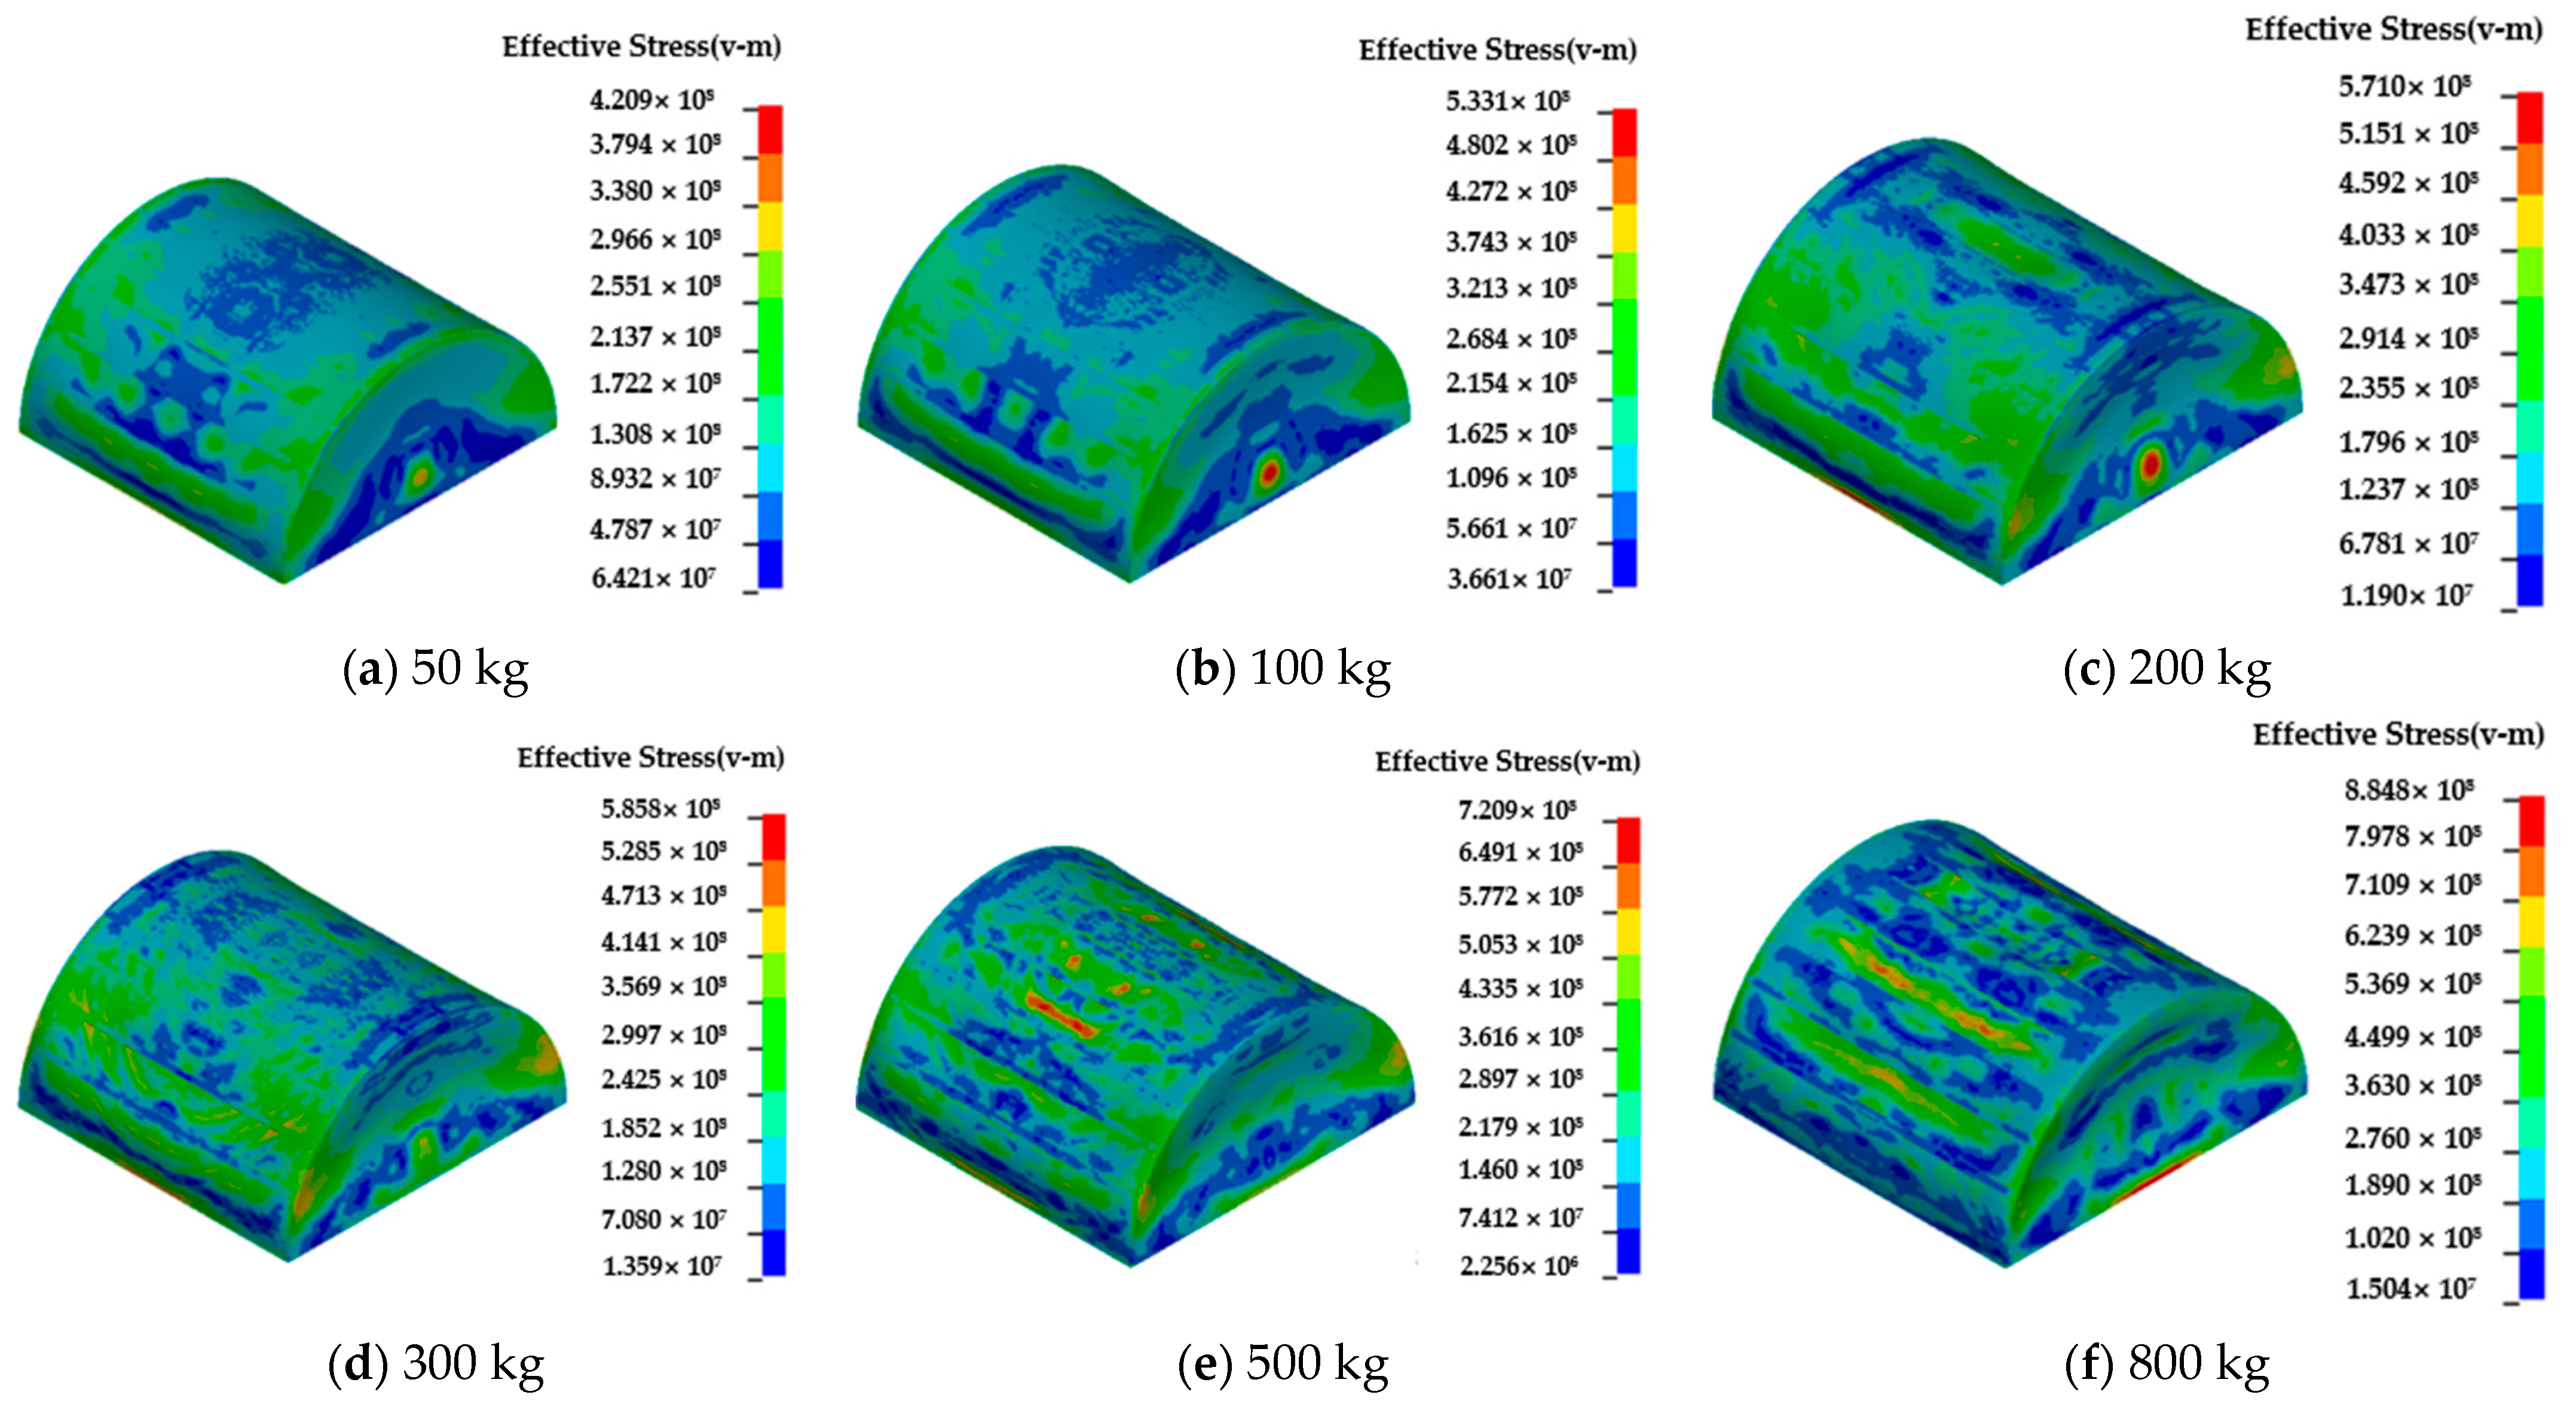
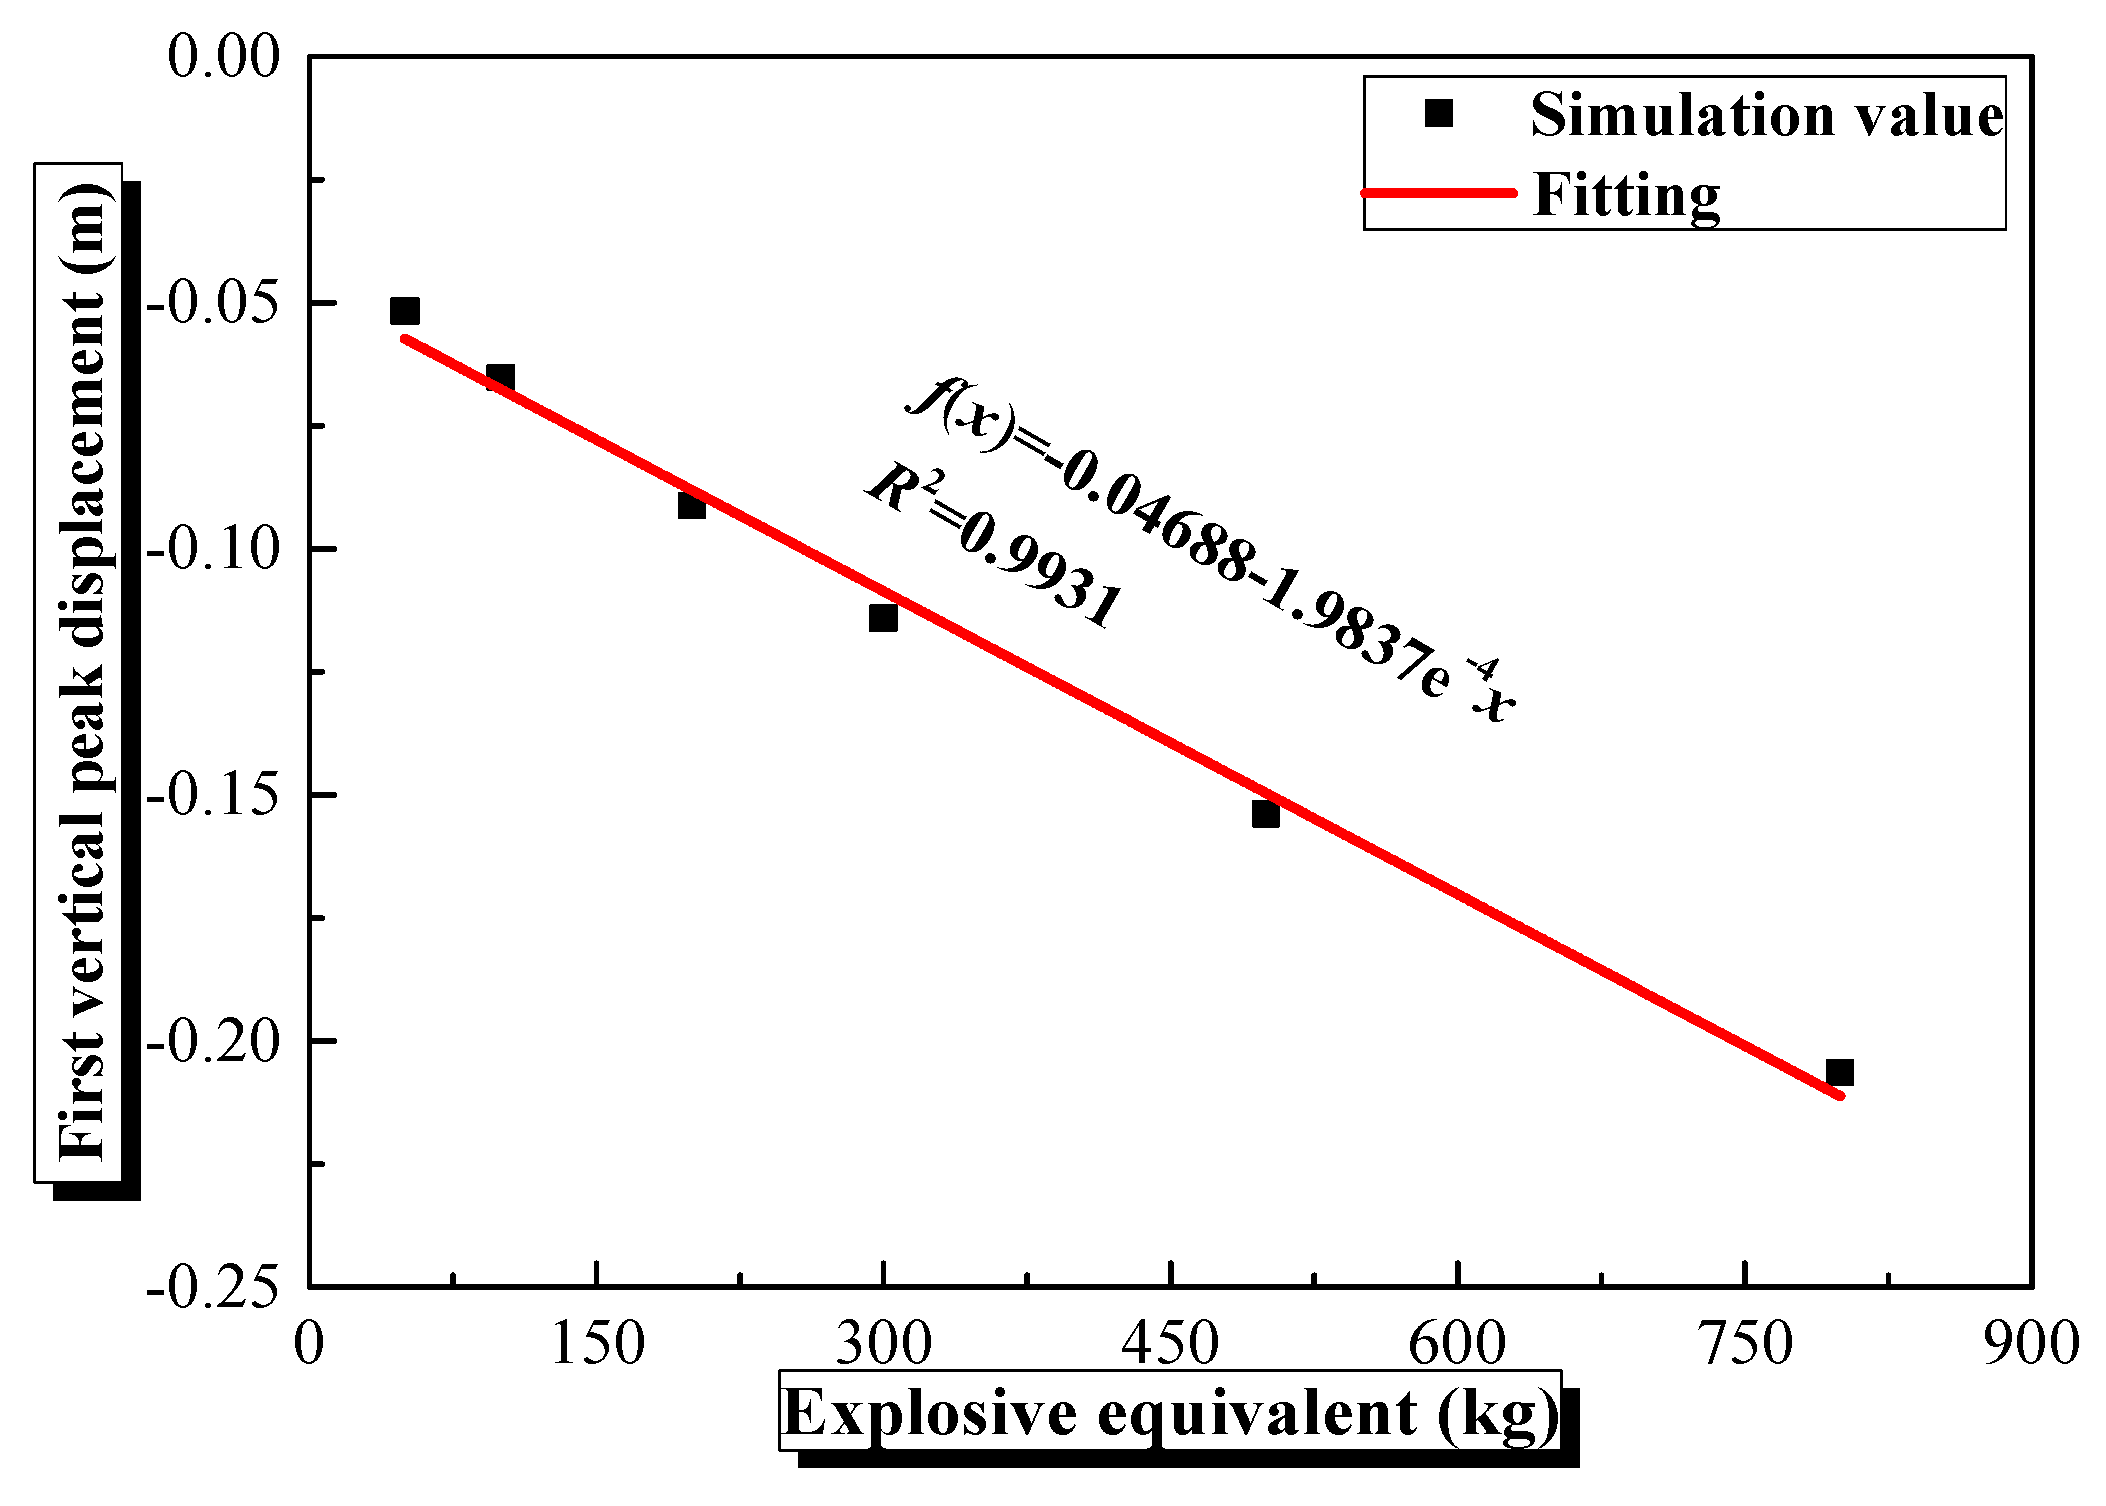
Figure 24 illustrates that deformation of the semi-cylindrical steel shell grows as the explosive equivalent increases. The semi-cylindrical deformation consists of convex deformation at the bottom, concave deformation of the sidewalls at both ends, and concave deformation at the center. Figure 25 demonstrates that, after the initial recovery deformation, the center of the semi-cylindrical steel shell undergoes vertical oscillatory deformation, yet its oscillatory frequency is notably lower than that of the semi-spherical steel shell. Quantitative analysis of displacement curves reveals an average oscillatory frequency of approximately 200 Hz for the semi-spherical shell versus 100 Hz for the semi-cylindrical shell—a nearly two-fold difference. This discrepancy is primarily attributed to geometric stiffness variation: the uniform curvature of the semi-spherical shell provides higher overall rigidity, resulting in a higher natural frequency, whereas the non-uniform curvature of the semi-cylindrical shell reduces axial rigidity, lowering its natural frequency. This frequency difference significantly influences structural resonance behavior: the lower frequency of the semi-cylindrical shell makes it more susceptible to resonance with low-frequency shock wave components, potentially leading to more pronounced cumulative deformation or structural failure. In contrast, the higher natural frequency of the semi-spherical shell allows it to avoid partial low-frequency energy, exhibiting more stable dynamic responses. Figure 26 shows that the first vertical peak displacement at the center of the semi-cylindrical steel shell increases linearly with explosive equivalent. Under an 800 kg explosive equivalent, this center reaches a maximum first vertical peak displacement of approximately 0.2064 m. Additionally, in response to an 800 kg explosive equivalent, the effective stress at the center of the semi-cylindrical shell and the bottom of both sidewall ends in the restrained position attains about 848.8 MPa, exceeding the ultimate strength of Q690 steel (770 MPa). This reveals the failure risk of the semi-cylindrical structure under high-equivalent explosions. It reminds engineers that, if this structure is used, additional reinforcement (such as adding circumferential ribs or optimizing sidewall thickness) is necessary, or it should be avoided in high-risk scenarios. Such findings deepen understanding of structural blast resistance, enriching research in the field of underwater explosion responses and providing a theoretical basis for engineering optimization.

4.5. Influence of Hydrostatic Pressure on the Dynamic Response of Semi-Spherical and Semi-Cylindrical Bottom-Sitting Steel Shells

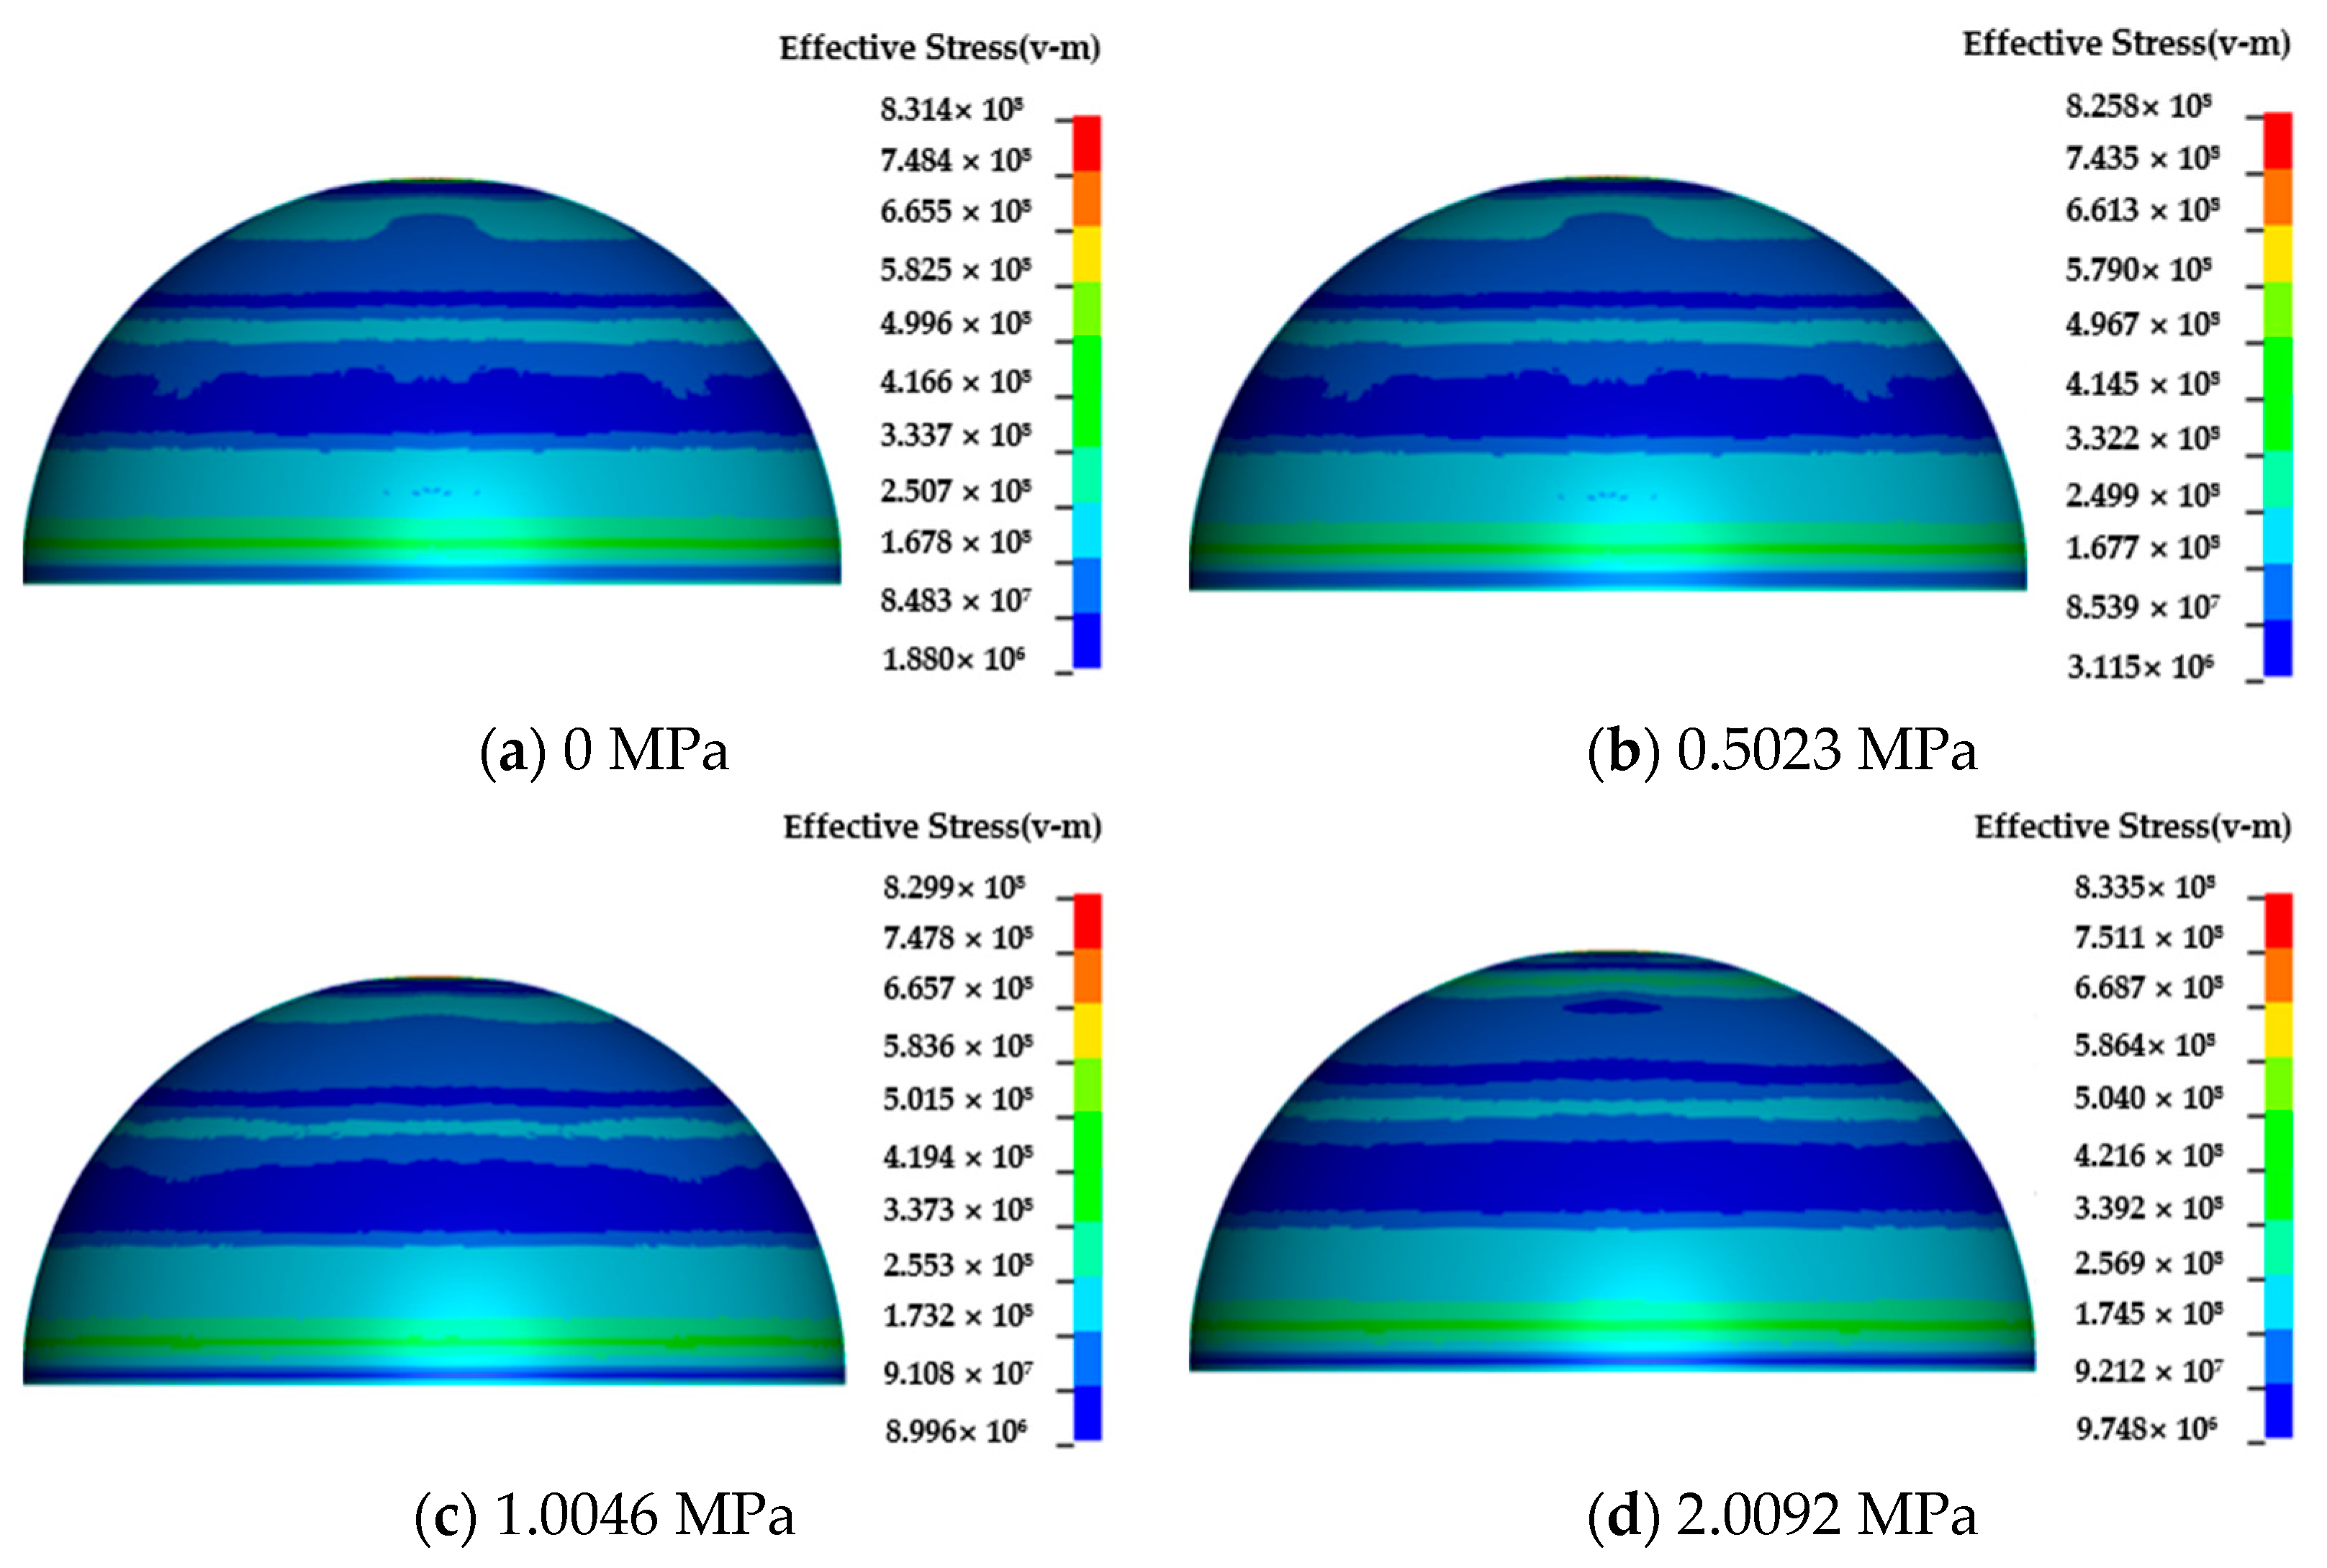
For underwater structures, coupling external shock wave load and hydrostatic pressure may cause more severe structural damage. To isolate the effect of hydrostatic pressure and avoid interference from multiple variables changing simultaneously (as demonstrated in previous sections that both explosive equivalent and distance significantly affect structural deformation), we fixed the explosive equivalent at 300 kg and the explosive distance at 7 m. This controlled approach allows for focused analysis of hydrostatic pressure. Therefore, the hydrostatic pressures were set as 0 MPa, 0.5023 MPa, 1.0046 MPa, and 2.0092 MPa to analyze the dynamic response of semi-spherical and semi-cylindrical bottom-sitting steel shell structures in response to a 300 kg explosive equivalent and a 7 m explosive distance.
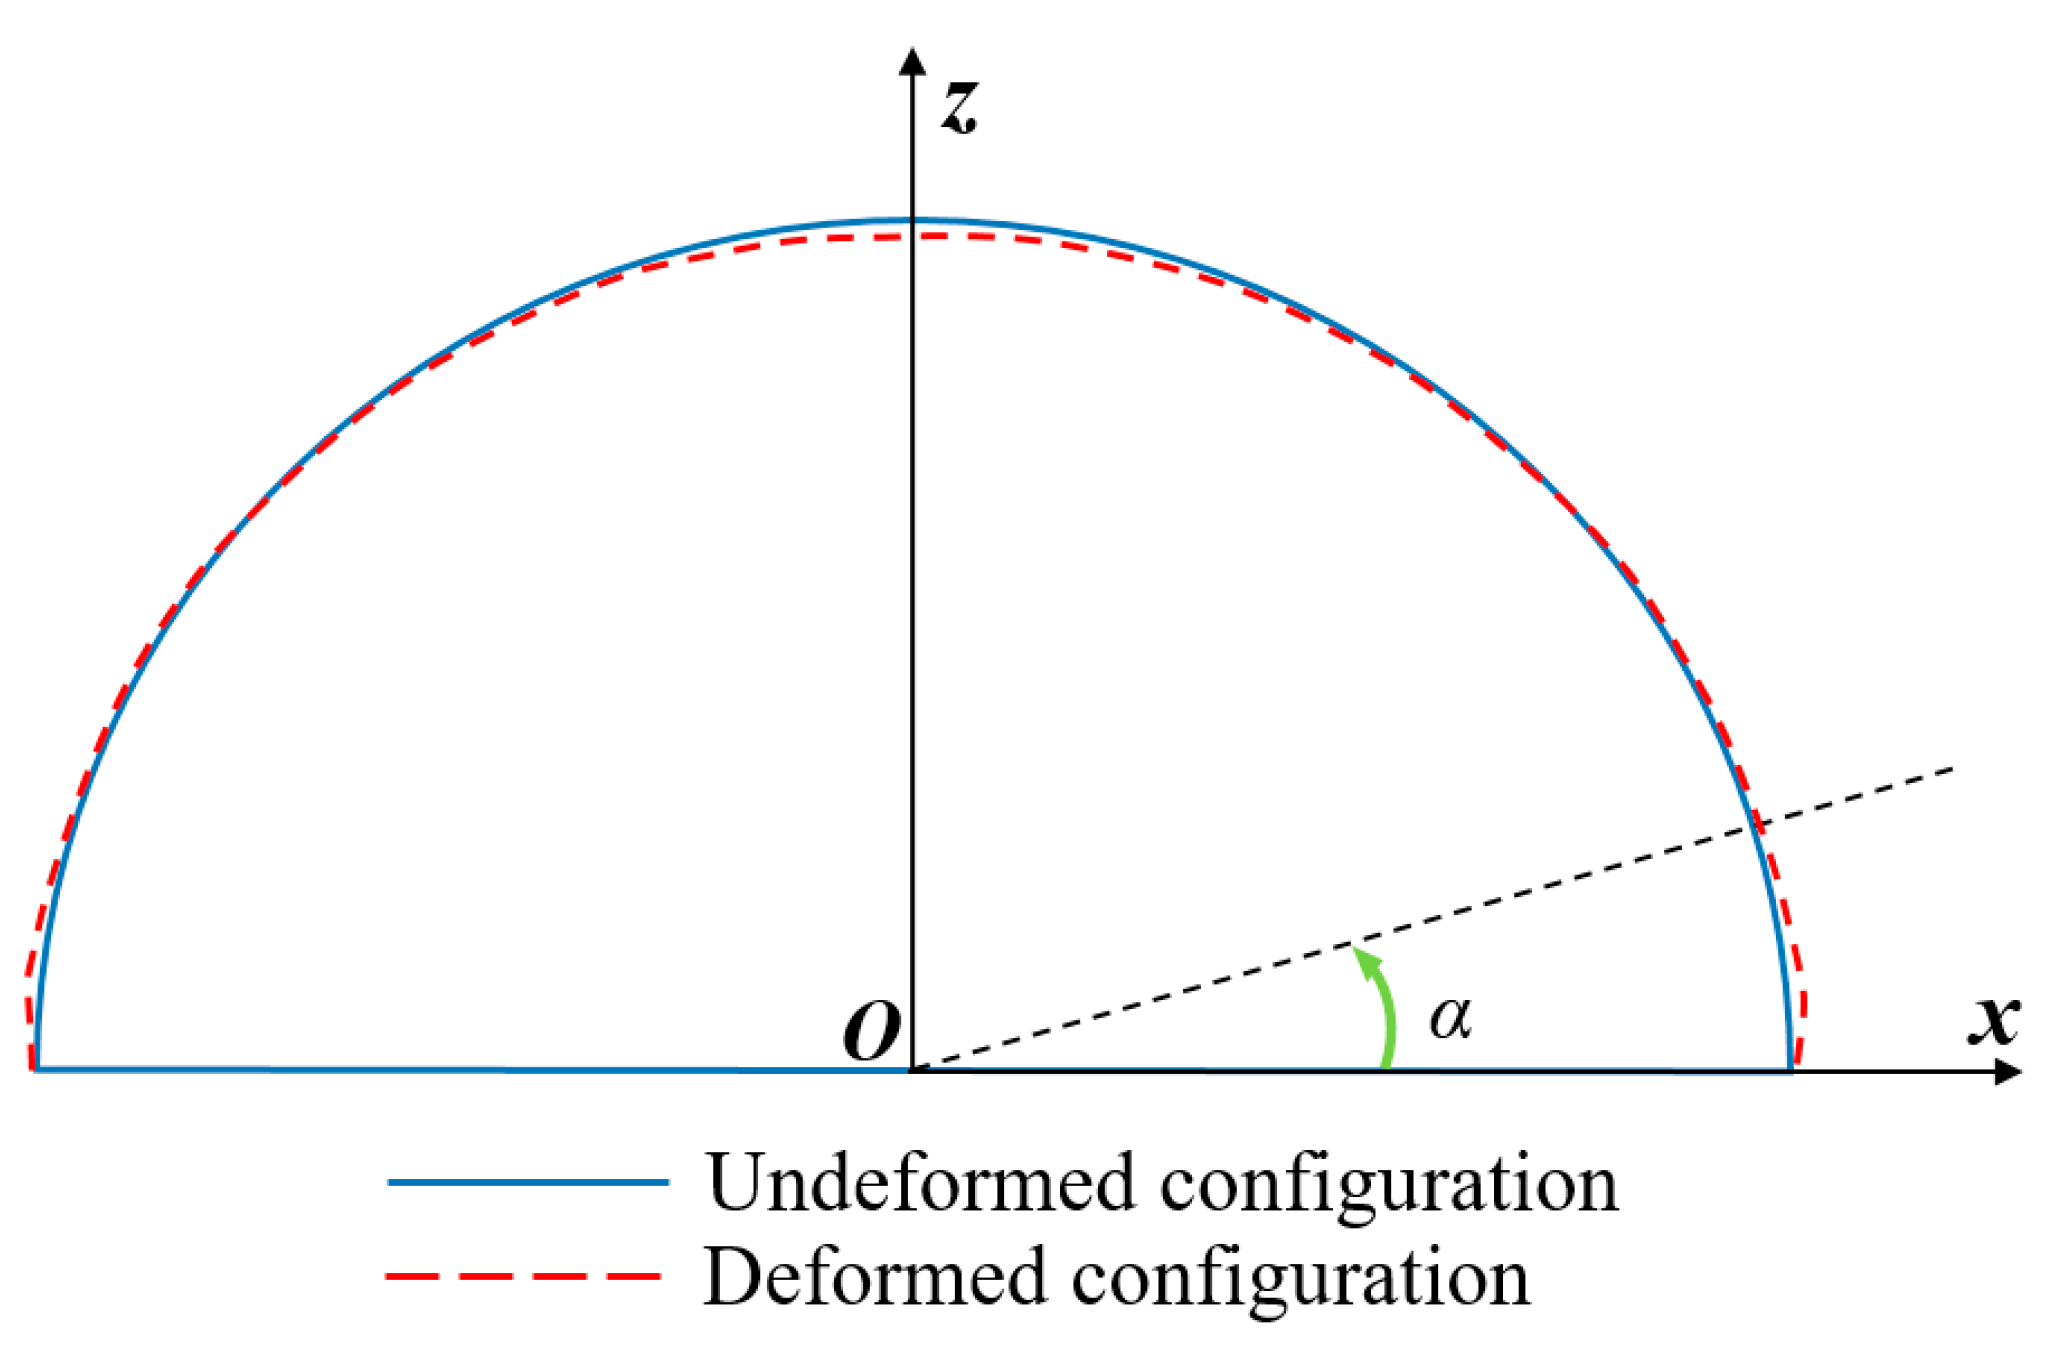
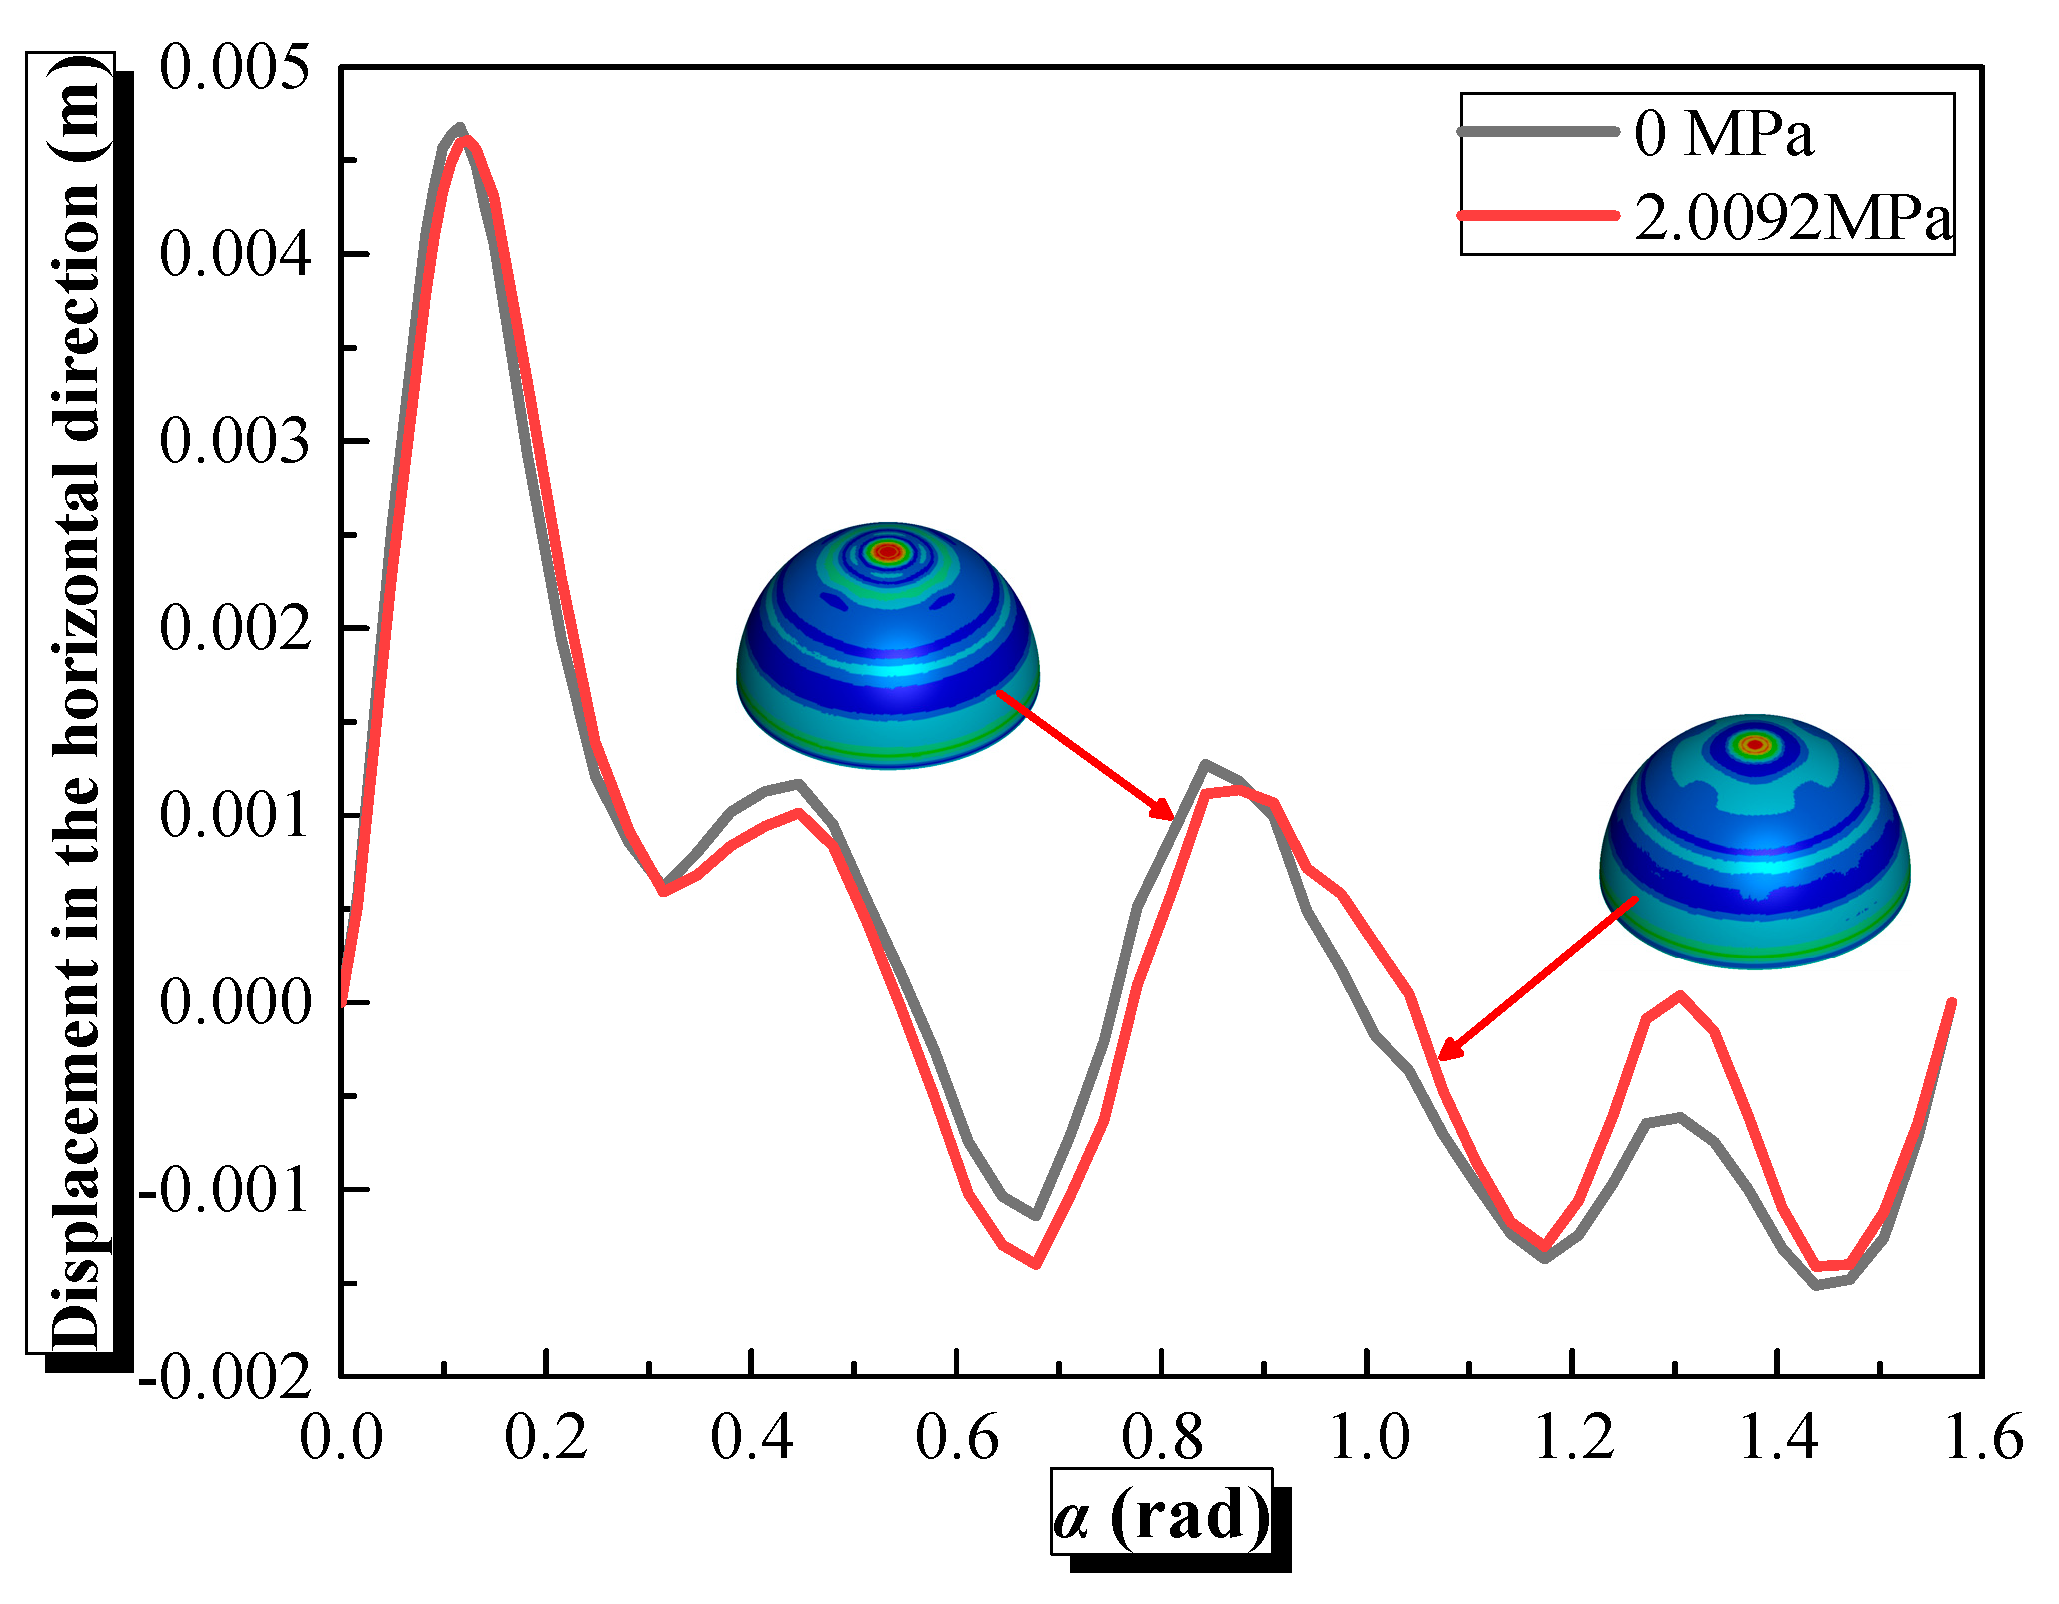
Figure 27 illustrates that, in response to an explosive equivalent of 300 kg and an explosive distance of 7 m, deformation of the semi-spherical steel shell remains minimal. Moreover, hydrostatic pressure ranging from 0 to 2.0092 MPa exerts a negligible influence on its deformation. Figure 28 demonstrates that the central vertical displacement of the semi-spherical steel shell diminishes slightly as hydrostatic pressure increases. Figure 29 shows the cross-section deformation schematic. Figure 30 shows the curves of the semi-spherical steel shell’s horizontal displacement varying with α in response to a 300 kg explosive equivalent, a 7 m explosive distance, and different hydrostatic pressures. Notably, the maximum horizontal displacement occurs in the region of the semi-spherical shell with the most pronounced deformation. The maximum horizontal displacement of the semi-spherical steel shell under 0 MPa hydrostatic pressure is slightly higher than that under 2.0092 MPa. The hydrostatic pressure on the surface of the semi-spherical steel shell generates a ‘hoop effect’, which restricts its horizontal convex deformation. Moreover, with the increase in hydrostatic pressure, the horizontal convex deformation of the semi-spherical steel shell decreases. Such a change improves the steel shell’s vertical bearing capacity and reduces its vertical central displacement.
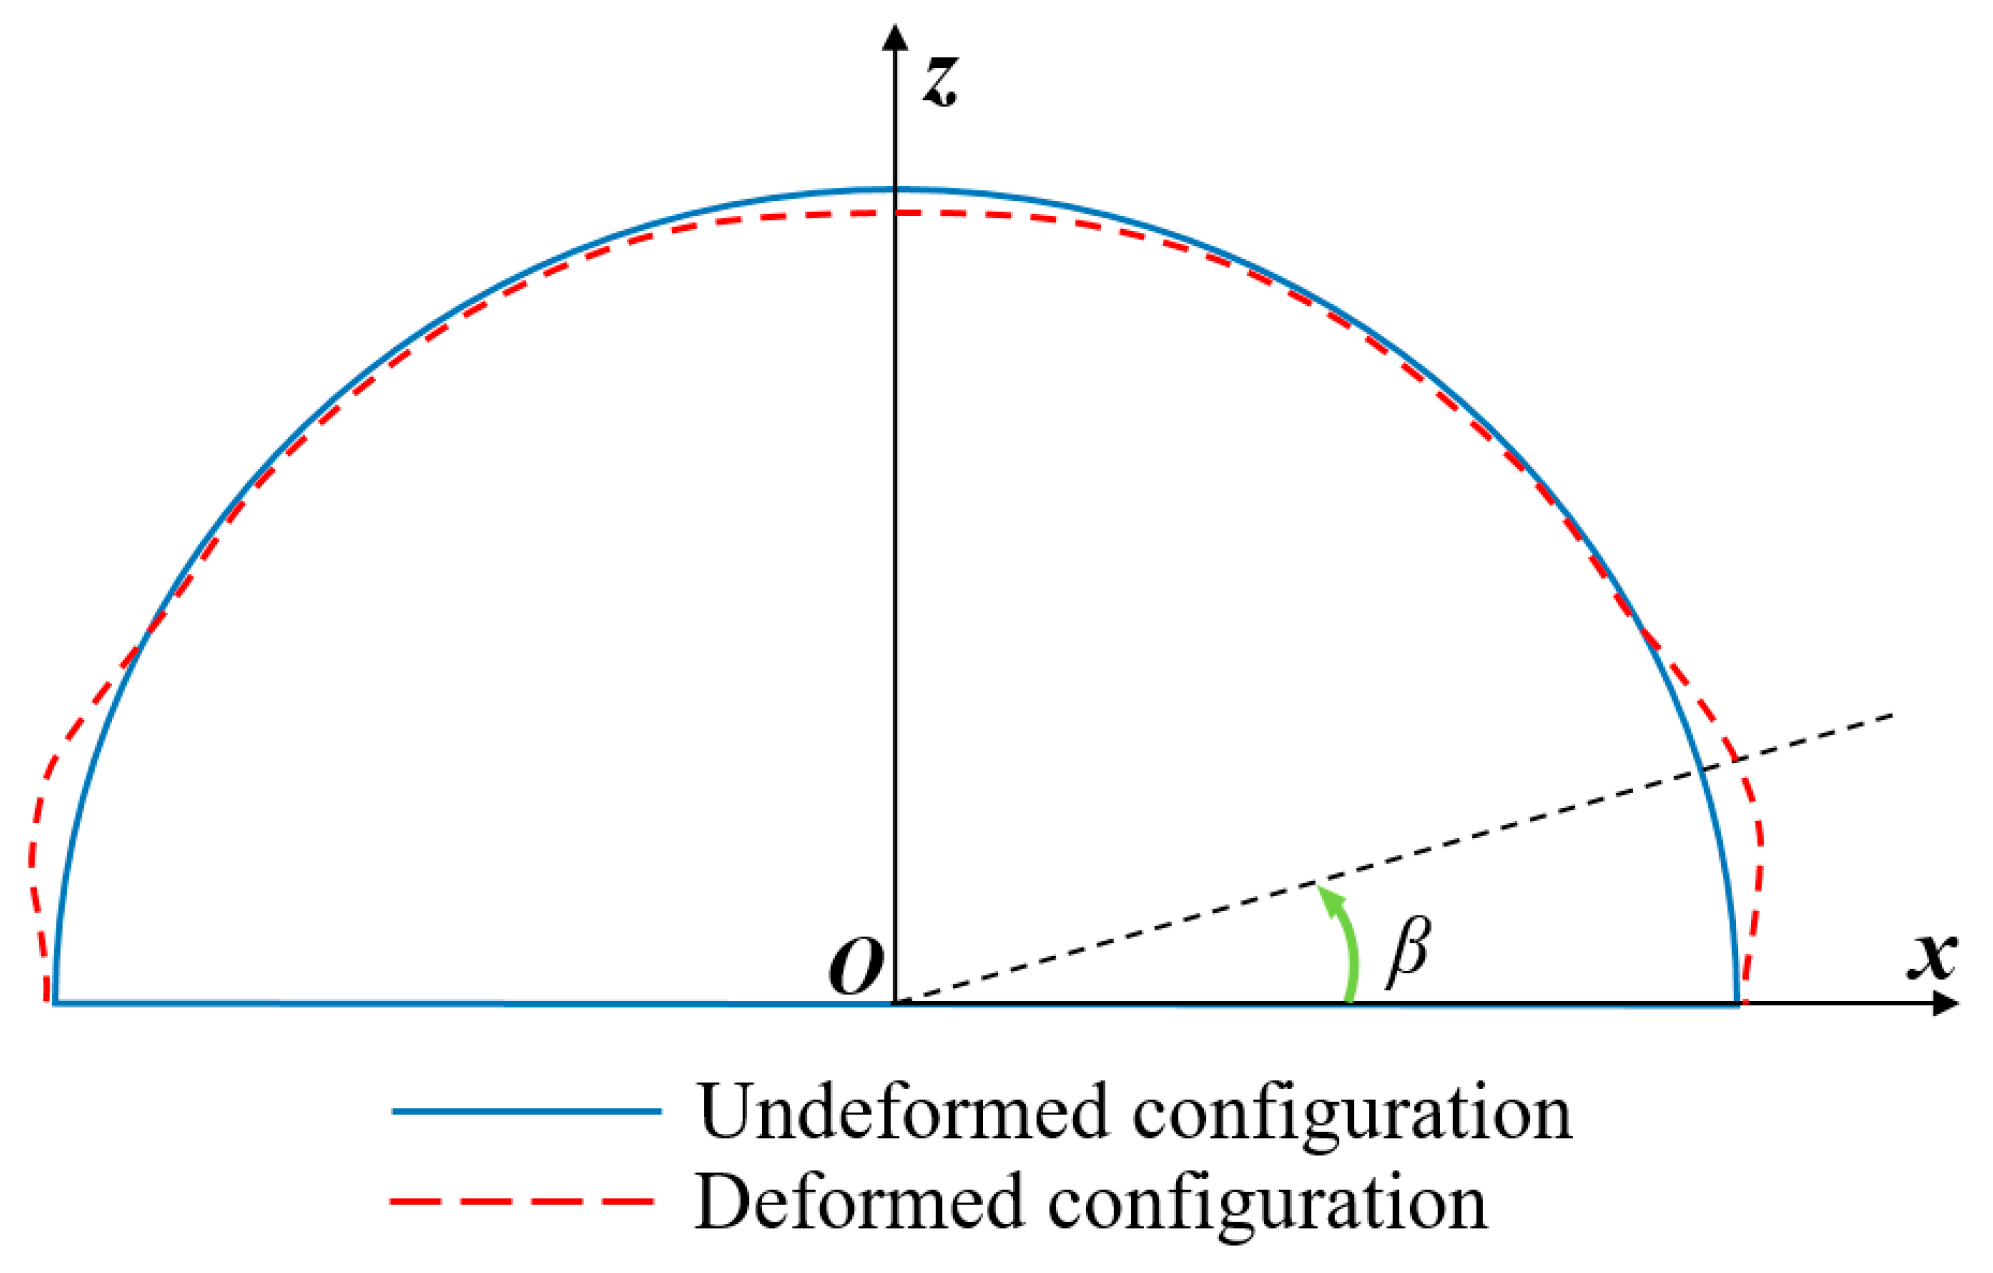
Figure 31 shows that relatively high effective-stress regions exist in the bottom convex deformation, both end sidewall concave deformations, and the central concave deformation. Figure 32 shows that the central vertical displacement of the semi-cylindrical steel shell grows as hydrostatic pressure increases. Figure 33 displays the deformation schematic of the semi-cylindrical steel shell cross-section. Figure 34 illustrates the curves of the semi-cylindrical steel shell’s horizontal displacement varying with β under a 300 kg explosive equivalent, a 7 m explosive distance, and different hydrostatic pressures. Peak horizontal displacement occurs in the area of the semi-cylindrical steel shell with the most significant deformation. When the hydrostatic pressure is 0 MPa, the maximum horizontal displacement of the semi-cylindrical steel shell is slightly greater than that under 2.0092 MPa. Hydrostatic pressure restricts the horizontal convex deformation of the semi-cylindrical steel shell. However, the central vertical bearing capacity of the semi-cylindrical steel shell is lower than that of the semi-spherical shell. Therefore, the combination of hydrostatic pressure and underwater shock wave amplifies inward concave deformation at the shell center, resulting in a rise in vertical displacement.
In addition, the coupling effect of hydrostatic pressure and shock wave load affects the structure through stress superposition and geometric constraint mechanisms. On one hand, hydrostatic pressure (0–2.0092 MPa) produces a ‘hoop constraint effect’, uniformly compressing the shell surface and suppressing part of the deformation (such as the horizontal displacement of the hemispherical shell decreasing from 0.047 m at 0 MPa to 0.046 m at 2.0092 MPa, Figure 30); on the other hand, due to the non-uniform curvature distribution of the semi-cylindrical shell, hydrostatic pressure cannot be evenly dispersed, leading to axial stress concentration and forming additional bending moments in the central area, intensifying the inward concave deformation (the center vertical displacement of the semi-cylindrical shell at 2.0092 MPa in Figure 32 increases by about 26.34% compared with 0 MPa). This contradictory mechanism originates from the influence of shell geometry on pressure distribution, reflecting the complex relationship between hydrostatic pressure and structural dynamic response.

4.6. Influence of Shell Thickness on the Dynamic Response of Semi-Spherical and Semi-Cylindrical Bottom-Sitting Steel Shells

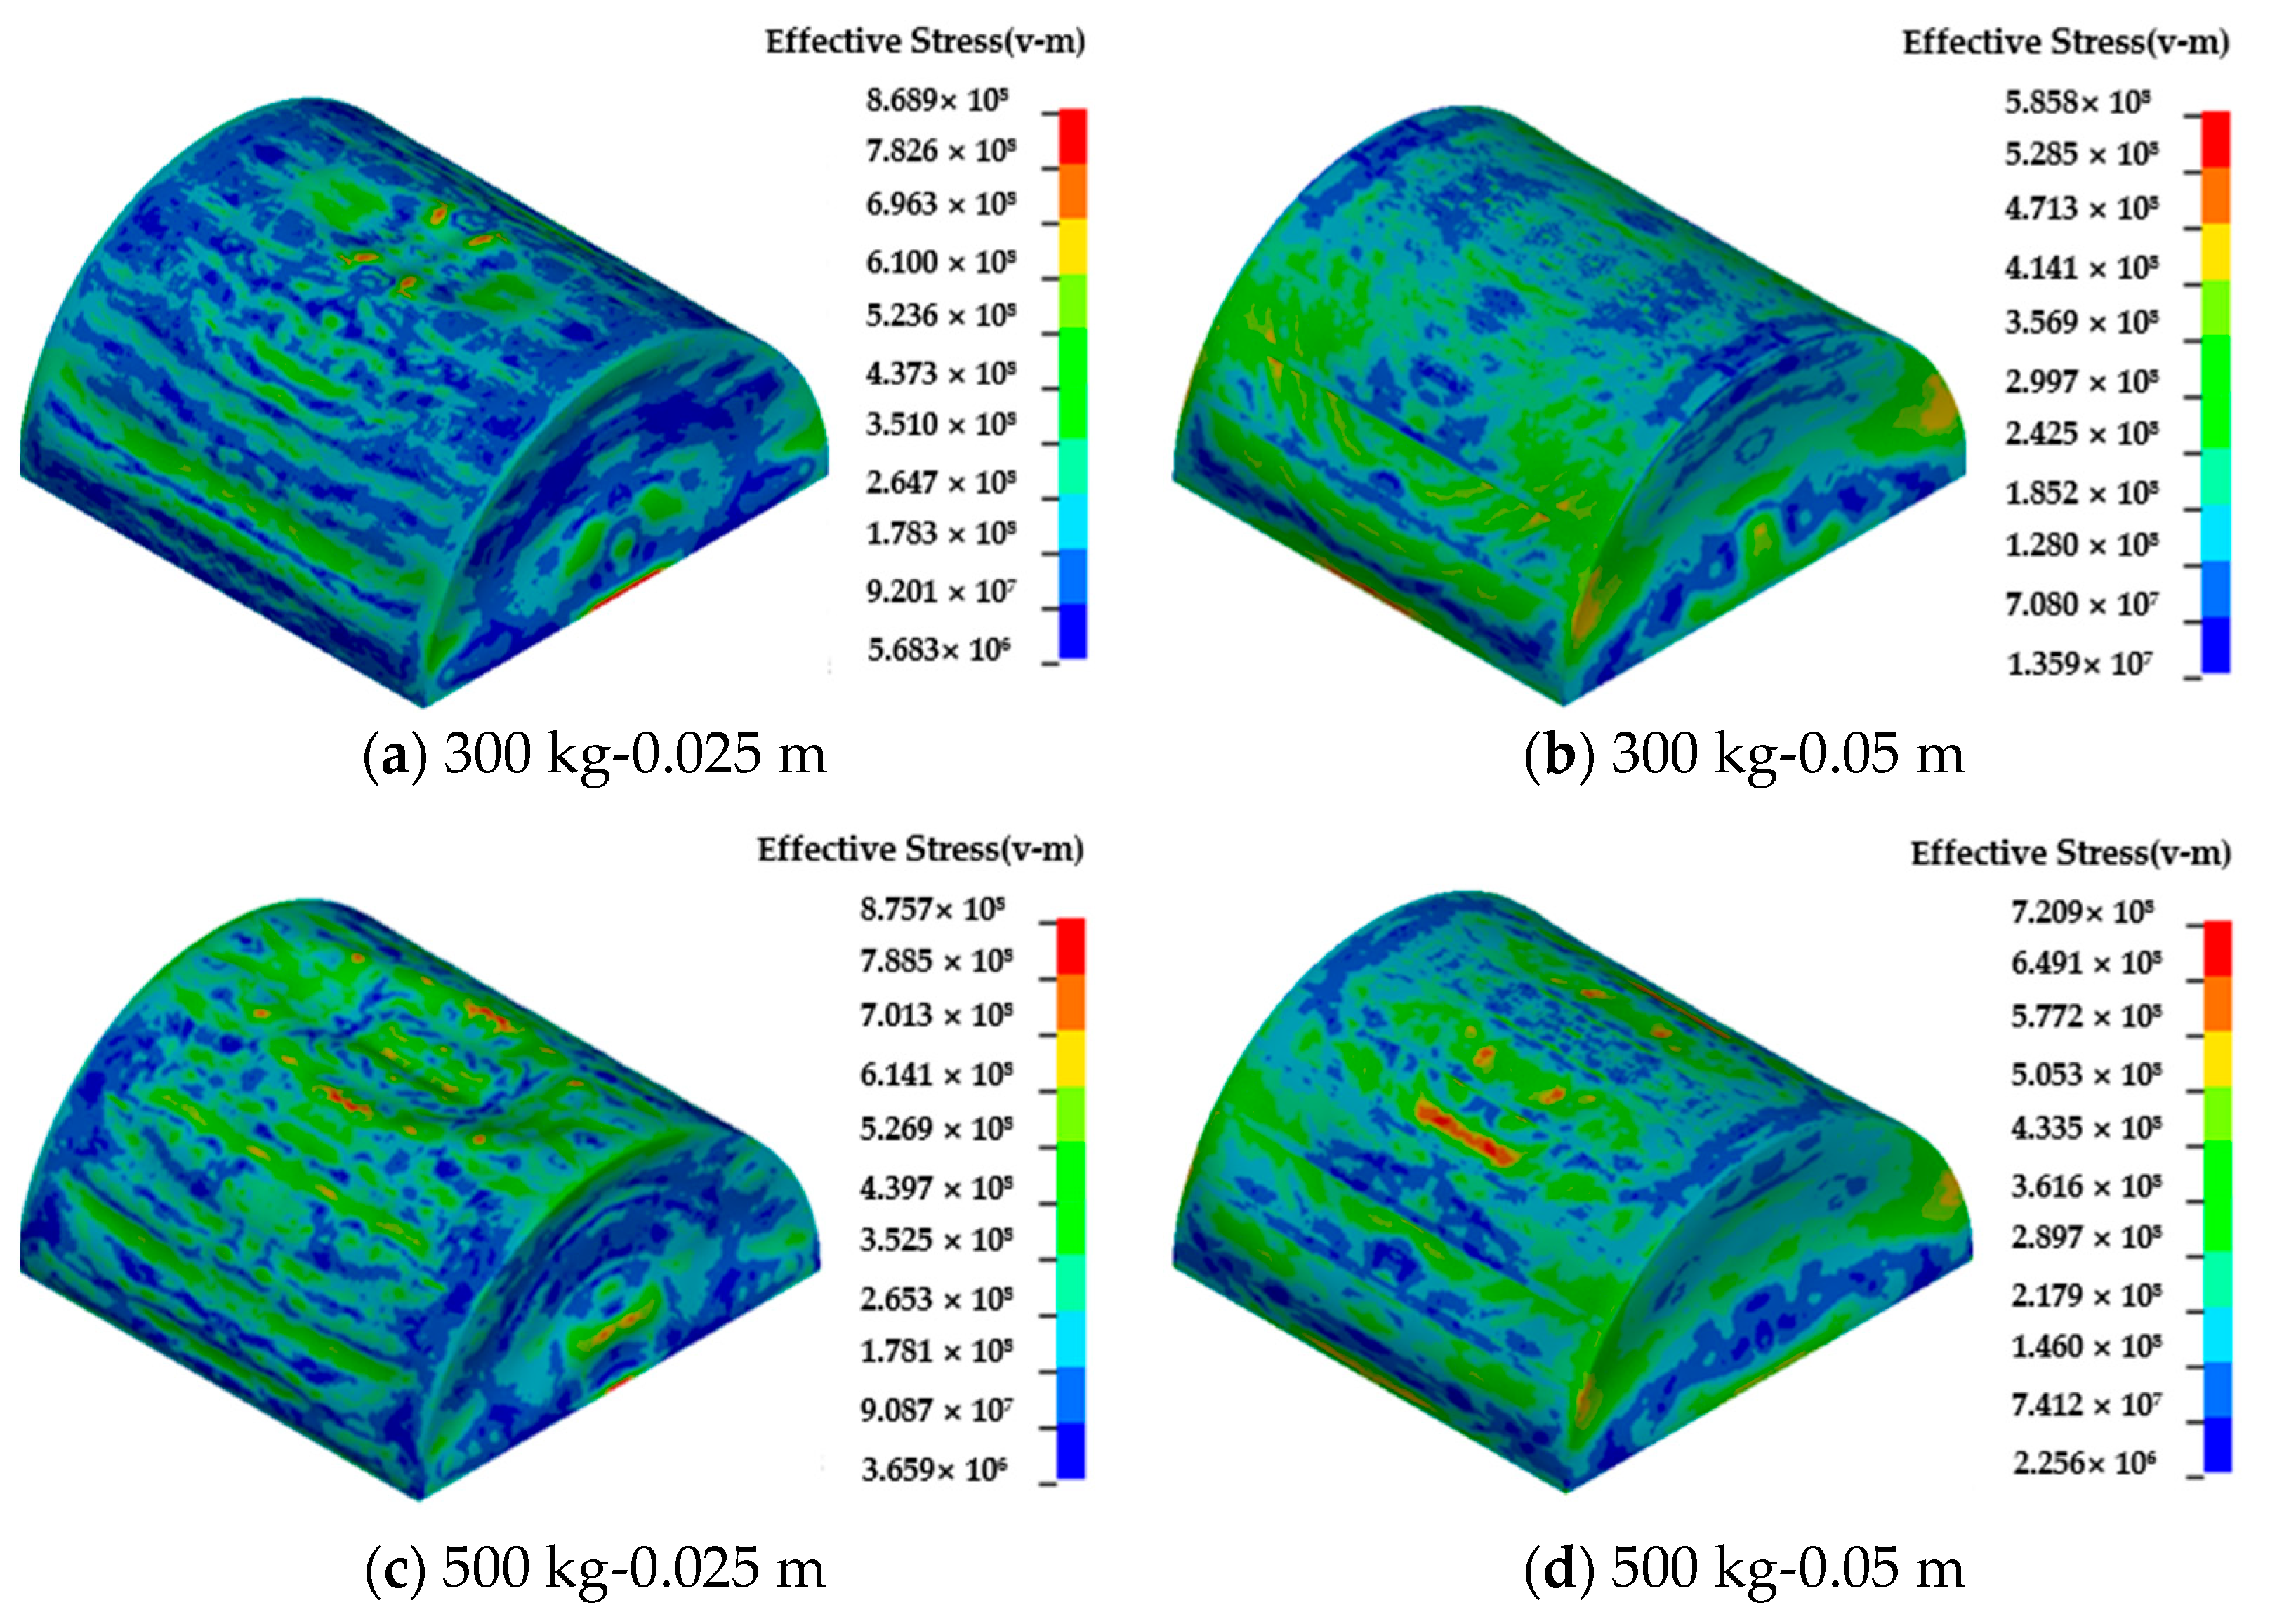
Shell thickness significantly impacts the dynamic response of such structures. Thus, the dynamic responses of semi-spherical and semi-cylindrical bottom-sitting steel shell structures with varying thicknesses in response to underwater shock wave loading were examined at an explosive distance of 5 m and explosive equivalents of 300 kg or 500 kg.
As depicted in Figure 35, the semi-spherical steel shell with a thickness of 0.025 m exhibits a distinct convex deformation above the bottom constraint under explosive equivalents of 300 kg and 500 kg. In contrast, when the explosive equivalent is 300 kg, the deformation of a semi-spherical steel shell with a thickness of 0.05 m is less pronounced. The deformation of a semi-spherical steel shell with a 0.05 m thickness has a convex deformation smaller than 0.025 m under a 500 kg explosive equivalent. Figure 36 demonstrates that the central vertical displacement of the 0.025 m thick steel shell exceeds that of the 0.05 m thick steel shell for explosive equivalents of 300 kg and 500 kg. Therefore, increasing the thickness of the semi-spherical steel shell can effectively reduce its deformation and increase its stiffness.
As shown in Figure 37, the semi-cylindrical steel shell with a 0.025 m thickness has significant deformation under 300 kg and 500 kg explosive equivalents, mainly manifested in convex deformation at the bottom, concave deformation of the sidewalls at both ends, and concave deformation at the center. The deformation of the 0.05 m thick semi-cylindrical steel shell is significantly smaller than that of the 0.025 m thick counterpart, primarily due to the increase in the sectional moment of inertia (I) and section modulus (W) with thickness. According to material mechanics, when the shell thickness t increases, the sectional moment of inertia I t 3 and section modulus W t 2 exponentially enhance the structure’s resistance to bending deformation. As shown in Figure 38, the center vertical displacement of the 0.025 m thick shell reaches 0.2064 m at 300 kg, while that of the 0.05 m thick shell is only 0.0826 m, a 60% reduction. Increasing thickness improves structural rigidity by enhancing geometric parameters, effectively reducing bending stress and deformation ( δ 1 / I ) , demonstrating the decisive role of material thickness in structural stiffness under dynamic loads. Therefore, increasing the thickness of the semi-cylindrical steel shell can effectively reduce its deformation and increase its stiffness.

5. Conclusions

This study systematically analyzed the dynamic response of semi-spherical and semi-cylindrical steel shells to underwater shock waves, focusing on the effects of transmission medium, explosive parameters, hydrostatic pressure, and shell thickness. The key findings are as follows:
(1)
Deformation of the semi-spherical steel shell is mainly manifested in convex deformation above the location of the bottom constraints of the semi-spherical shell. Deformation of the semi-cylindrical steel shell mainly manifested in convex deformation at the bottom, concave deformation of the sidewalls at both ends, and concave deformation at the center.
(2)
Underwater shock waves induce significantly more severe deformation than air shock waves, with peak effective stresses in semi-spherical shells reaching 831.4 MPa (underwater) vs. 191 MPa (air) and vertical displacements differing by an order of magnitude. The semi-spherical geometry mitigates deformation through a curvature-induced ‘hoop effect’, reducing center displacement compared to semi-cylindrical shells under the same conditions.
(3)
Within 0–2.0092 MPa, hydrostatic pressure constrains horizontal convex deformation in both shell types via circumferential stress (hoop effect), but with different contrasting vertical responses. Semi-spherical shells: center vertical displacement decreases by 8% as hydrostatic pressure increases, due to enhanced vertical bearing capacity. Semi-cylindrical shells: inward concave deformation at the center increases by 26.34%, driven by weakened vertical stiffness under combined pressure and shock loads.
(4)
Increasing thickness from 0.025 m to 0.05 m reduces deformation across all load cases. For example, semi-cylindrical shells subjected to 300 kg of explosives show a displacement reduction from 0.2064 m to 0.0826 m, demonstrating their effectiveness in enhancing structural robustness. This provides a clear design guideline for optimizing shell thickness in underwater structures.
In summary, this study not only clarifies the complex interplay of multiple factors regarding structural response, but also provides actionable insights for engineering practice, theoretical analysis, and practical underwater structure design.

Author Contributions

F.L.: conceptualization, methodology, and software, X.Z.: investigation and data curation; L.X.: investigation, writing—original draft; Z.L.: software, investigation, and data curation; C.L.: conceptualization, methodology, software, validation, writing—original draft, and writing—review and editing. All authors have read and agreed to the published version of the manuscript.

Funding

This research received no external funding.

Data Availability Statement

Data is contained within the article.

Acknowledgments

We sincerely thank the anonymous reviewers for their constructive and insightful comments and suggestions.

Conflicts of Interest

The authors declare no known competing financial interests or personal relationships that could influence this work.

References

  1. Avachat, S.; Zhou, M. Response of submerged metallic sandwich structures to underwater impulsive loads. J. Mech. Mater. Struct. 2015, 10, 17–41. [Google Scholar] [CrossRef]
  2. Yang, G.; Fan, Y.; Wang, G.; Gao, Q.; Deng, K.; Wang, F. Numerical study on dynamic response of submerged tunnel subjected to underwater explosion. Soil. Dyn. Earthq. Eng. 2022, 156, 107216. [Google Scholar] [CrossRef]
  3. Liu, Z.; Zhou, X.; Xiao, L.; Li, X.; Lin, F. Dynamic response and damage characteristics of special blast-resistant door structure subjected to underwater explosion. Structures 2023, 57, 105262. [Google Scholar] [CrossRef]
  4. Hung, C.F.; Lin, B.J.; Hwang-Fuu, J.J.; Hsu, P.Y. Dynamic response of cylindrical shell structures subjected to underwater explosion. Ocean Eng. 2009, 36, 564–577. [Google Scholar] [CrossRef]
  5. Li, G.; Shi, D.; Chen, Y.; Yao, X.; Wang, Z.; Helal, W.M.K. A study on damage characteristics of double-layer cylindrical shells subjected to underwater contact explosion. Int. J. Impact Eng. 2023, 172, 104428. [Google Scholar] [CrossRef]
  6. Kristoffersen, M.; Minoretti, A.; Børvik, T. On the internal blast loading of submerged floating tunnels in concrete with circular and rectangular cross-sections. Eng. Fail. Anal. 2019, 103, 462–480. [Google Scholar] [CrossRef]
  7. Brett, J.M.; Yiannakopoulos, G.; Van der Schaaf, P.J. Time-resolved measurement of the deformation of submerged cylinders subjected to loading from a nearby explosion. Int. J. Impact Eng. 2000, 24, 875–890. [Google Scholar] [CrossRef]
  8. Brett, J.M.; Yiannakopolous, G. A study of explosive effects in close proximity to a submerged cylinder. Int. J. Impact Eng. 2008, 35, 206–225. [Google Scholar] [CrossRef]
  9. Huang, S.; Jin, Z.; Chen, Y. Underwater blast resistance of double cylindrical shells with circular tube stiffeners. Ocean Eng. 2021, 238, 109691. [Google Scholar] [CrossRef]
  10. Zhang, J.; Huang, Z.; Chen, Z.; Li, Y. Dynamic response of spherical shells subjected to the underwater impulse. Ocean Eng. 2023, 286, 115568. [Google Scholar] [CrossRef]
  11. Li, X.; Kurata, M.; Nakashima, M. Evaluating damage extent of fractured beams in steel moment-resisting frames using dynamic strain responses. Earthq. Eng. Struct. Dyn. 2015, 44, 563–581. [Google Scholar] [CrossRef]
  12. Razavi, M.; Hadidi, A.; Ashrafzadeh, F. Feature extraction based on dynamic response measurements for structural damage identification: A comparative study. J. Struct. Integr. Maint. 2024, 9, 2364125. [Google Scholar] [CrossRef]
  13. Danai, K.; Civjan, S.A.; Styckiewicz, M.M. Direct method of damage localization for civil structures via shape comparison of dynamic response measurements. Comput. Struct. 2012, 92, 297–307. [Google Scholar] [CrossRef]
  14. Kwon, Y.W.; Fox, P.K. Underwater shock response of a cylinder subjected to a side-on explosion. Comput. Struct. 1993, 48, 637–646. [Google Scholar] [CrossRef]
  15. Wu, W.; Liu, M.; Zhang, A.-M.; Liu, Y.-L. Fully coupled model for simulating highly nonlinear dynamic behaviors of a bubble near an elastic-plastic thin-walled plate. Phys. Rev. Fluids 2021, 6, 13605. [Google Scholar] [CrossRef]
  16. Nayak, S.; Lyngdoh, G.A.; Shukla, A.; Das, S. Predicting the near field underwater explosion response of coated composite cylinders using multiscale simulations, experiments, and machine learning. Compos. Struct. 2022, 283, 115157. [Google Scholar] [CrossRef]
  17. Gannon, L. Submerged aluminum cylinder response to close-proximity underwater explosions–a comparison of experiment and simulation. Int. J. Impact Eng. 2019, 133, 103339. [Google Scholar] [CrossRef]
  18. Praba, R.P.S.; Ramajeyathilagam, K. Numerical investigations on the large deformation behaviour of ring stiffened cylindrical shell subjected to underwater explosion. Appl. Ocean Res. 2020, 101, 102262. [Google Scholar] [CrossRef]
  19. Wu, W.; Zhang, A.M.; Liu, Y.-L.; Liu, M. Interaction between shock wave and a movable sphere with cavitation effects in shallow water. Phys. Fluids 2020, 32, 16103. [Google Scholar] [CrossRef]
  20. Yin, C.; Jin, Z.; Chen, Y.; Hua, H. Effects of sacrificial coatings on stiffened double cylindrical shells subjected to underwater blasts. Int. J. Impact Eng. 2020, 136, 103412. [Google Scholar] [CrossRef]
  21. Peng, Y.-X.; Zhang, A.-M.; Ming, F.-R. Numerical simulation of structural damage subjected to the near-field underwater explosion based on SPH and RKPM. Ocean Eng. 2021, 222, 108576. [Google Scholar] [CrossRef]
  22. Yang, G.; Wang, G.; Fan, Y.; Deng, K.; Lu, W.; Zhao, J. Dynamic response and performance of submarine tunnel subjected to surface explosions. Mar. Struct. 2021, 80, 103091. [Google Scholar] [CrossRef]
  23. Yang, G.; Wang, G.; Lu, W.; Yan, P.; Chen, M. Damage assessment and mitigation measures of underwater tunnel subjected to blast loads. Tunn. Undergr. Sp. Technol. 2019, 94, 103131. [Google Scholar] [CrossRef]
  24. Brochard, K.; Le Sourne, H.; Barras, G. Estimation of the response of a deeply immersed cylinder to the shock wave generated by an underwater explosion. Mar. Struct. 2020, 72, 102786. [Google Scholar] [CrossRef]
  25. Wierzbicki, T.; Fatt, M.S.H. Damage assessment of cylinders due to impact and explosive loading. Int. J. Impact Eng. 1993, 13, 215–241. [Google Scholar] [CrossRef]
  26. Benson, D.J. Computational methods in Lagrangian and Eulerian hydrocodes. Comput. Methods Appl. Mech. Eng. 1992, 99, 235–394. [Google Scholar] [CrossRef]
  27. Wu, W.; Liu, Y.-L.; Zhang, A.-M.; Liu, M. An h-adaptive local discontinuous Galerkin method for second order wave equation: Applications for the underwater explosion shock hydrodynamics. Ocean Eng. 2022, 264, 112526. [Google Scholar] [CrossRef]
  28. Mussa, M.H.; Mutalib, A.A.; Hamid, R.; Naidu, S.R.; Radzi, N.A.M.; Abedini, M. Assessment of damage to an underground box tunnel by a surface explosion. Tunn. Undergr. Sp. Technol. 2017, 66, 64–76. [Google Scholar] [CrossRef]
  29. Wu, W.; Liu, Y.-L.; Zhang, A.-M.; Liu, N.; Liu, L. Numerical investigation on underwater explosion cavitation characteristics near water wave. Ocean. Eng. 2020, 205, 107321. [Google Scholar] [CrossRef]
  30. Zhang, J.; Lin, Z.; Wang, F.; Zhao, T.; Zhu, Y. Ultimate strength of externally pressurised steel spheres containing through-thickness defects. Int. J. Press. Vessel. Pip. 2022, 199, 104750. [Google Scholar] [CrossRef]
  31. Zhang, J.; Zhang, M.; Tang, W.; Wang, W.; Wang, M. Buckling of spherical shells subjected to external pressure: A comparison of experimental and theoretical data. Thin-Walled Struct. 2017, 111, 58–64. [Google Scholar] [CrossRef]
  32. Stachiw, J.D. Ocean Engineering Studies: Pressure Hulls, Cellular Sandwich Construction; Naval Ocean Systems Center: San Diego, CA, USA, 1990; Volume 8. [Google Scholar]
  33. Valdez, B.; Schorr, M.; Bastidas, J.M. The natural gas industry: Equipment, materials, and corrosion. Corros. Rev. 2015, 33, 175–185. [Google Scholar] [CrossRef]
  34. Karamanos, S.A.A. Structural Mechanics and Design of Metal Pipes: A Systematic Approach for Onshore and Offshore Pipelines; Elsevier: Amsterdam, The Netherlands, 2022. [Google Scholar]
  35. Geyer, R.A. Submersibles and Their Use in Oceanography and Ocean Engineering; Elsevier: Amsterdam, The Netherlands, 2011; Volume 17. [Google Scholar]
  36. Meng, Q.; Zhang, K.; He, R.; Qu, Z. A review of thermal shock behavior of ceramics: Fundamental theory, experimental methods, and outlooks. Int. J. Appl. Ceram. Technol. 2024, 21, 3789–3811. [Google Scholar] [CrossRef]
  37. Lü, C.F.; Chen, W.Q.; Shao, J. Semi-analytical three-dimensional elasticity solutions for generally laminated composite plates. Eur. J. Mech. 2008, 27, 899–917. [Google Scholar] [CrossRef]
  38. Wang, H.M. Dynamic electromechanical behavior of a triple-layer piezoelectric composite cylinder with imperfect interfaces. Appl. Math. Model. 2011, 35, 1765–1781. [Google Scholar] [CrossRef]
  39. Gupta, S.; Matos, H.; LeBlanc, J.M.; Shukla, A. Shock initiated instabilities in underwater cylindrical structures. J. Mech. Phys. Solids 2016, 95, 188–212. [Google Scholar] [CrossRef]
  40. Yang, G.; Fan, Y.; Wang, G.; Cui, X.; Leng, Z.; Lu, W. Blast resistance of air-backed RC slab against underwater contact explosion. Def. Technol. 2023, 28, 236–250. [Google Scholar] [CrossRef]
  41. Xie, L.X.; Lu, W.B.; Zhang, Q.B.; Jiang, Q.H.; Chen, M.; Zhao, J. Analysis of damage mechanisms and optimization of cut blasting design under high in-situ stresses. Tunn. Undergr. Sp. Technol. 2017, 66, 19–33. [Google Scholar] [CrossRef]
  42. Yang, X.; Yang, H.; Zhang, S. Rate-dependent constitutive models of S690 high-strength structural steel. Constr. Build. Mater. 2019, 198, 597–607. [Google Scholar] [CrossRef]
  43. Cole, R.H.; Weller, R. Underwater Explosions; American Institute of Physics: College Park, MD, USA, 1948; Volume 1. [Google Scholar]
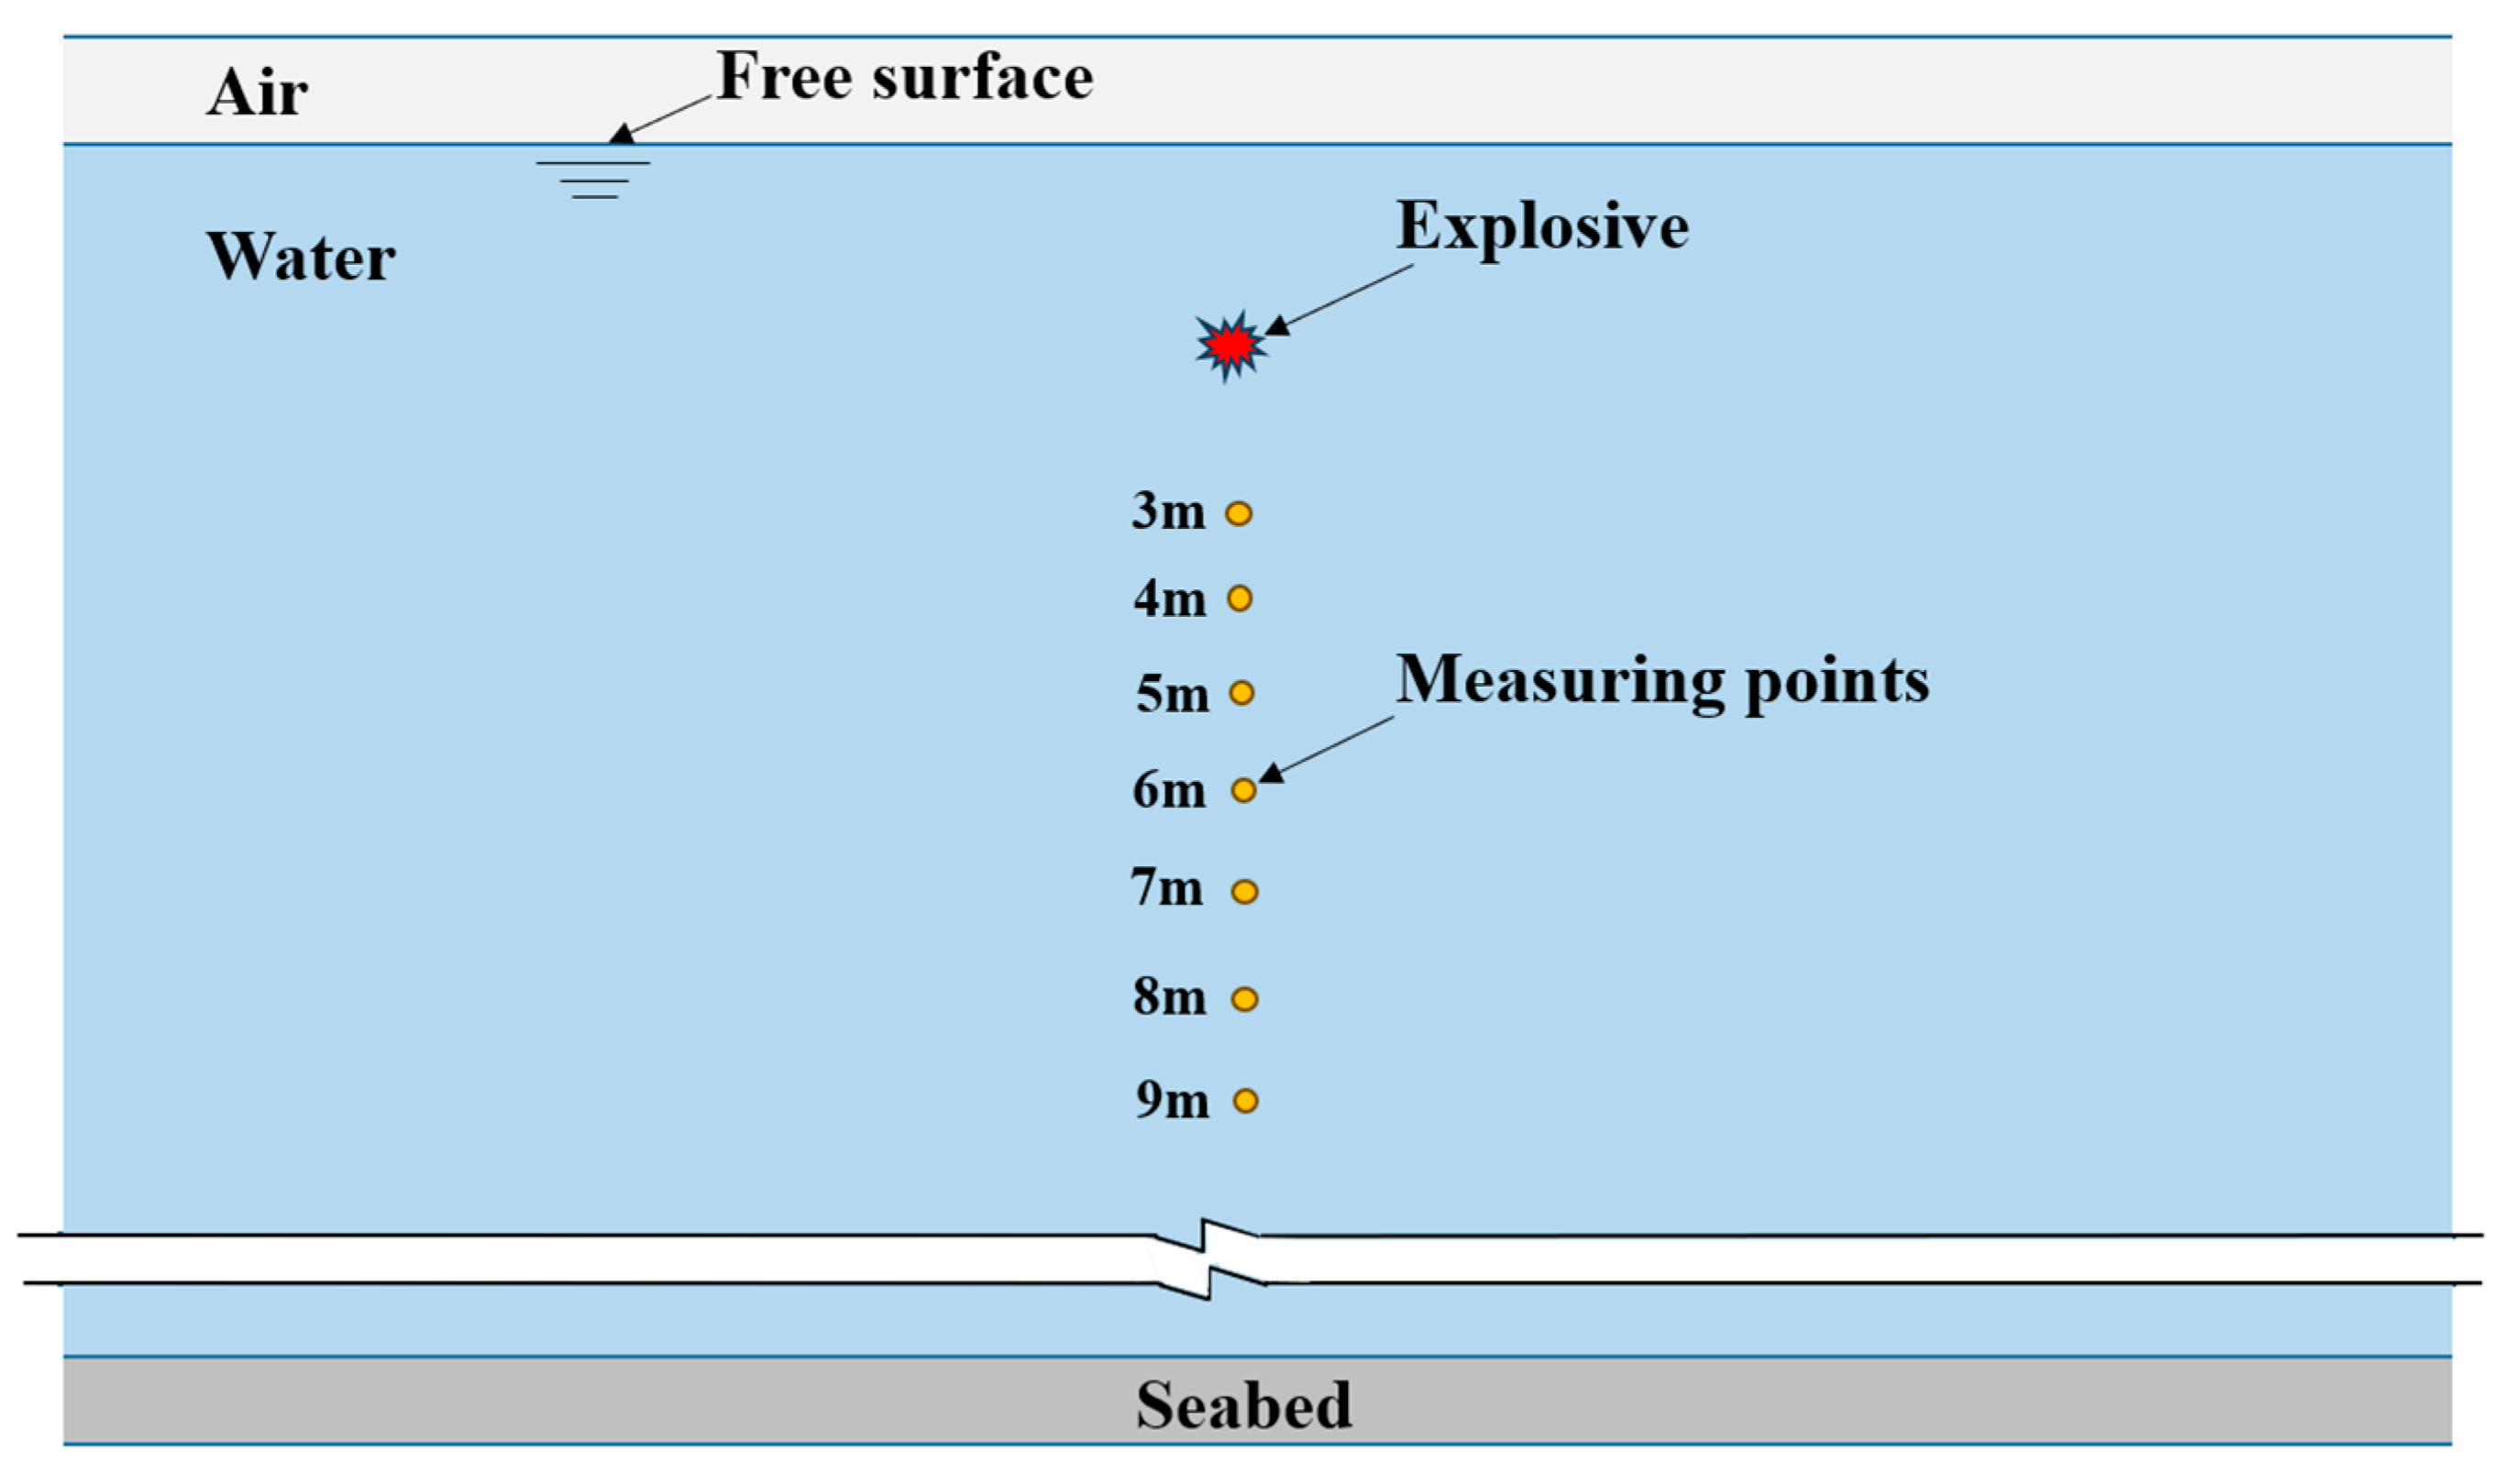
Figure 1. Schematic layout of underwater explosion measurement points in the free field of three-dimensional infinite water.
Infrastructures 10 00130 g001
Figure 2. 3D infinite water free-field ALE model of an underwater explosion.
Infrastructures 10 00130 g002
Figure 3. Schematic layout of the underwater bottom-sitting shell structures and explosive load configuration.
Infrastructures 10 00130 g003
Figure 4. Coupling numerical model of a one-fourth underwater bottom-sitting steel shell–water–explosion shock wave. (a) One-fourth semi-spherical steel shell structure–water–underwater explosion shock wave. (b) One-fourth semi-cylindrical steel shell structure–water–underwater explosion shock wave.
Infrastructures 10 00130 g004
Figure 5. Dimensions of a semi-spherical steel shell.
Infrastructures 10 00130 g005
Figure 6. Dimensions of the semi-cylindrical steel shell.
Infrastructures 10 00130 g006
Figure 7. Cloud diagrams of effective stress distribution of semi-spherical steel shells subjected to air and water explosions with a 7 m explosive distance and 300 kg explosive equivalent.
Infrastructures 10 00130 g007
Figure 8. Curves of the central vertical displacement of the semi-spherical steel shell varying with time under an explosive distance of 7 m and an explosive equivalent of 300 kg.
Infrastructures 10 00130 g008
Figure 9. Cloud diagrams of effective stress distribution of the semi-cylindrical steel shell subjected to air and water explosions with 7 m explosive distance and 300 kg explosive equivalent.
Infrastructures 10 00130 g009
Figure 10. Center vertical displacement curves of the semi-cylindrical steel shell over time, at an explosive distance of 7 m and an explosive equivalent of 300 kg.
Infrastructures 10 00130 g010
Figure 11. Contour visualization of effective stress fields in a semi-spherical steel structure subjected to a 300 kg TNT equivalent charge at multiple explosive distances.
Infrastructures 10 00130 g011
Figure 12. Curves of central vertical displacement for the semi-spherical steel shell over time for an explosive equivalent of 300 kg at various explosive distances.
Infrastructures 10 00130 g012
Figure 13. The curve of the center first vertical peak displacement of the semi-spherical steel shell changes with explosion distance in response to a 300 kg explosive equivalent.
Infrastructures 10 00130 g013
Figure 14. Schematic illustration of deformation within the cross-section of a semi-spherical steel shell.
Infrastructures 10 00130 g014
Figure 15. The curves of the center first vertical peak displacement of the semi-spherical steel shell change with θ at a 300 kg explosive equivalent and different explosive distances.
Infrastructures 10 00130 g015
Figure 16. Cloud diagrams of the effective stress distribution of the semi-cylindrical steel shell with a 300 kg explosive equivalent and different explosive distances.
Infrastructures 10 00130 g016
Figure 17. Center vertical displacement curves of the semi-cylindrical steel shell over time at an explosive equivalent of 300 kg and different explosive distances.
Infrastructures 10 00130 g017
Figure 18. Central vertical displacement curve of the semi-cylindrical steel shell over time at an explosive equivalent of 300 kg and different explosive distances.
Infrastructures 10 00130 g018
Figure 19. Deformation schematic in the axial cross-section of a semi-cylindrical steel shell.
Infrastructures 10 00130 g019
Figure 20. The curves of the center first vertical peak displacement of the semi-cylindrical steel shell change with x at a 300 kg explosive equivalent and different explosive distances.
Infrastructures 10 00130 g020
Figure 21. Cloud diagrams of the effective stress distribution of the semi-spherical steel shell with a 5 m explosive distance and different explosive equivalents.
Infrastructures 10 00130 g021
Figure 22. Center vertical displacement curves of a semi-spherical steel shell over time at a 5 m explosive distance and different explosive equivalents.
Infrastructures 10 00130 g022
Figure 23. The curve of the center first vertical peak displacement of the semi-spherical steel shell changes with explosive equivalence in response to a 5 m explosive distance.
Infrastructures 10 00130 g023
Figure 24. Cloud diagrams of the effective stress distribution of the semi-cylindrical steel shell with a 5 m explosive distance and different explosive equivalents.
Infrastructures 10 00130 g024
Figure 25. Center vertical displacement curves of the semi-cylindrical steel shell over time at a 5 m explosive distance and different explosive equivalents.
Infrastructures 10 00130 g025
Figure 26. The curve of the center first vertical peak displacement of the semi-cylindrical steel shell changes with explosive equivalence in response to a 5 m explosive distance.
Infrastructures 10 00130 g026
Figure 27. Cloud diagrams of the effective stress distribution of a semi-spherical steel shell subjected to different hydrostatic pressures.
Infrastructures 10 00130 g027
Figure 28. Center displacement of a semi-spherical steel shell under different hydrostatic pressures.
Infrastructures 10 00130 g028
Figure 29. Schematic diagram of deformation in a semi-spherical steel shell cross-section.
Infrastructures 10 00130 g029
Figure 30. The curves of horizontal displacement of the semi-spherical steel shell varying with α in response to an explosive equivalent of 300 kg, an explosive distance of 7 m, and different hydrostatic pressures.
Infrastructures 10 00130 g030
Figure 31. Cloud diagrams of the effective stress distribution of a semi-cylindrical steel shell in response to different hydrostatic pressures.
Infrastructures 10 00130 g031
Figure 32. Center displacement of a semi-cylindrical steel shell under different hydrostatic pressures.
Infrastructures 10 00130 g032
Figure 33. Deformation schematic of a cross-section of a semi-cylindrical steel shell.
Infrastructures 10 00130 g033
Figure 34. Curves of horizontal displacement for the semi-cylindrical steel shell as β varies, in response to an explosive equivalent of 300 kg, an explosive distance of 7 m, and different hydrostatic pressures.
Infrastructures 10 00130 g034
Figure 35. Cloud diagrams of the effective stress distribution of semi-spherical steel shells of different thicknesses.
Infrastructures 10 00130 g035
Figure 36. The center displacement of a semi-spherical steel shell under different thicknesses.
Infrastructures 10 00130 g036
Figure 37. Cloud diagrams of the effective stress distribution of semi-cylindrical steel shells with different thicknesses.
Infrastructures 10 00130 g037
Figure 38. The center displacement of a semi-cylindrical steel shell under different thicknesses.
Infrastructures 10 00130 g038
Table 1. Parameters of the JWL equation of state.
A/GPaB/GPaR1ρ/(kg∙m−3)D/(m∙s−1)Pcj/GPaR2ωE0/GPa
373.773.7474.1516306930210.90.356
Table 2. Parameters of the Gruneisen equation of state.
ρ/(kg∙m−3)S1γ0C/(m∙s−1)S2S3a
10001.9210.351647−0.09600
Table 3. Parameters of the linear polynomial equation of state.
ρ/(kg∙m−3)E0C0–C3C4, C5C6V0
1.252.53 × 10500.401.0
Table 4. John–Cook model material parameters for Q690 steel.
A/(MPa)B/(MPa)Cnm
7224000.0210.57-
Table 5. Comparison analysis of peak shock wave pressure at varying explosive distances (0.12 m, 0.13 m, and 0.14 m mesh).
Explosive Distances (m)Simulated Pm (MPa)Theoretical Pm (MPa)Deviation (%)
0.12 m0.13 m0.14 m0.12 m0.13 m0.14 m
3165.00161.00160.00174.67−5.53−7.82−8.40
4108.00107.00104.00113.45−4.80−5.68−8.33
580.3078.2076.5081.18−1.08−3.67−5.76
663.8062.6060.8061.753.311.37−1.54
750.9050.1049.6049.013.872.231.21%
843.1042.0041.8040.117.454.714.21
936.9036.4035.7033.619.778.296.20
Disclaimer/Publisher’s Note: The statements, opinions and data contained in all publications are solely those of the individual author(s) and contributor(s) and not of MDPI and/or the editor(s). MDPI and/or the editor(s) disclaim responsibility for any injury to people or property resulting from any ideas, methods, instructions or products referred to in the content.