Article

Advanced Seismic Analysis of a 44-Story Reinforced Concrete Building: A Comparison of Code-Based and Performance Based Design Approaches

by
Mistreselasie Abate
1,
Ana Catarina Jorge Evangelista
1,* and
Vivian W. Y. Tam
2
1
Engineering Institute of Technology, Perth 6000, Australia
2
Engineering, Design and Built Environment, Western Sydney University, Sydney 2007, Australia
*
Author to whom correspondence should be addressed.
Infrastructures 2025, 10(4), 93; https://doi.org/10.3390/infrastructures10040093
Submission received: 4 March 2025 / Revised: 31 March 2025 / Accepted: 5 April 2025 / Published: 9 April 2025

Abstract

Conventional seismic design regulations, even when rigorously adapted to local conditions, often fail to ensure the resilience of reinforced concrete buildings. Code-based prescriptive methods rely on simplified assumptions that do not fully capture the complex nonlinear behavior of structures during strong earthquakes, potentially underestimating seismic demands and structural vulnerabilities. This study evaluates the seismic performance of a 44-story reinforced concrete building designed per the EN-2015 code, currently adopted in Ethiopia. The building was analyzed using Response Spectrum Analysis (RSA), Linear Dynamic Time History Analysis (LDTHA), and Classical Modal Analysis in ETABS v19, with 11 ground motions from the PEER database. Ground motion scaling was performed using SeismoMatch and ETABS. Results indicate that LDTHA predicts 25.68% higher maximum story displacement, 26.49% greater inter-story drift ratios, 15.35% higher story shear, and 27.5% greater overturning moments compared to RSA. The fundamental time period for the first mode was found to be 3.956 s in Classical Modal Analysis, 3.806 s in RSA, and 3.883 s in LDTHA. These discrepancies highlight the limitations of code-based design and underscore the necessity of performance-based seismic design for achieving safer, more resilient structures in high-seismic regions.

1. Introduction

Ethiopia’s rapid appearance of high-rise structures raises worries about the country’s adopted reinforced concrete design code. Ethiopia lacks a seismic design code, relying instead on European standards.
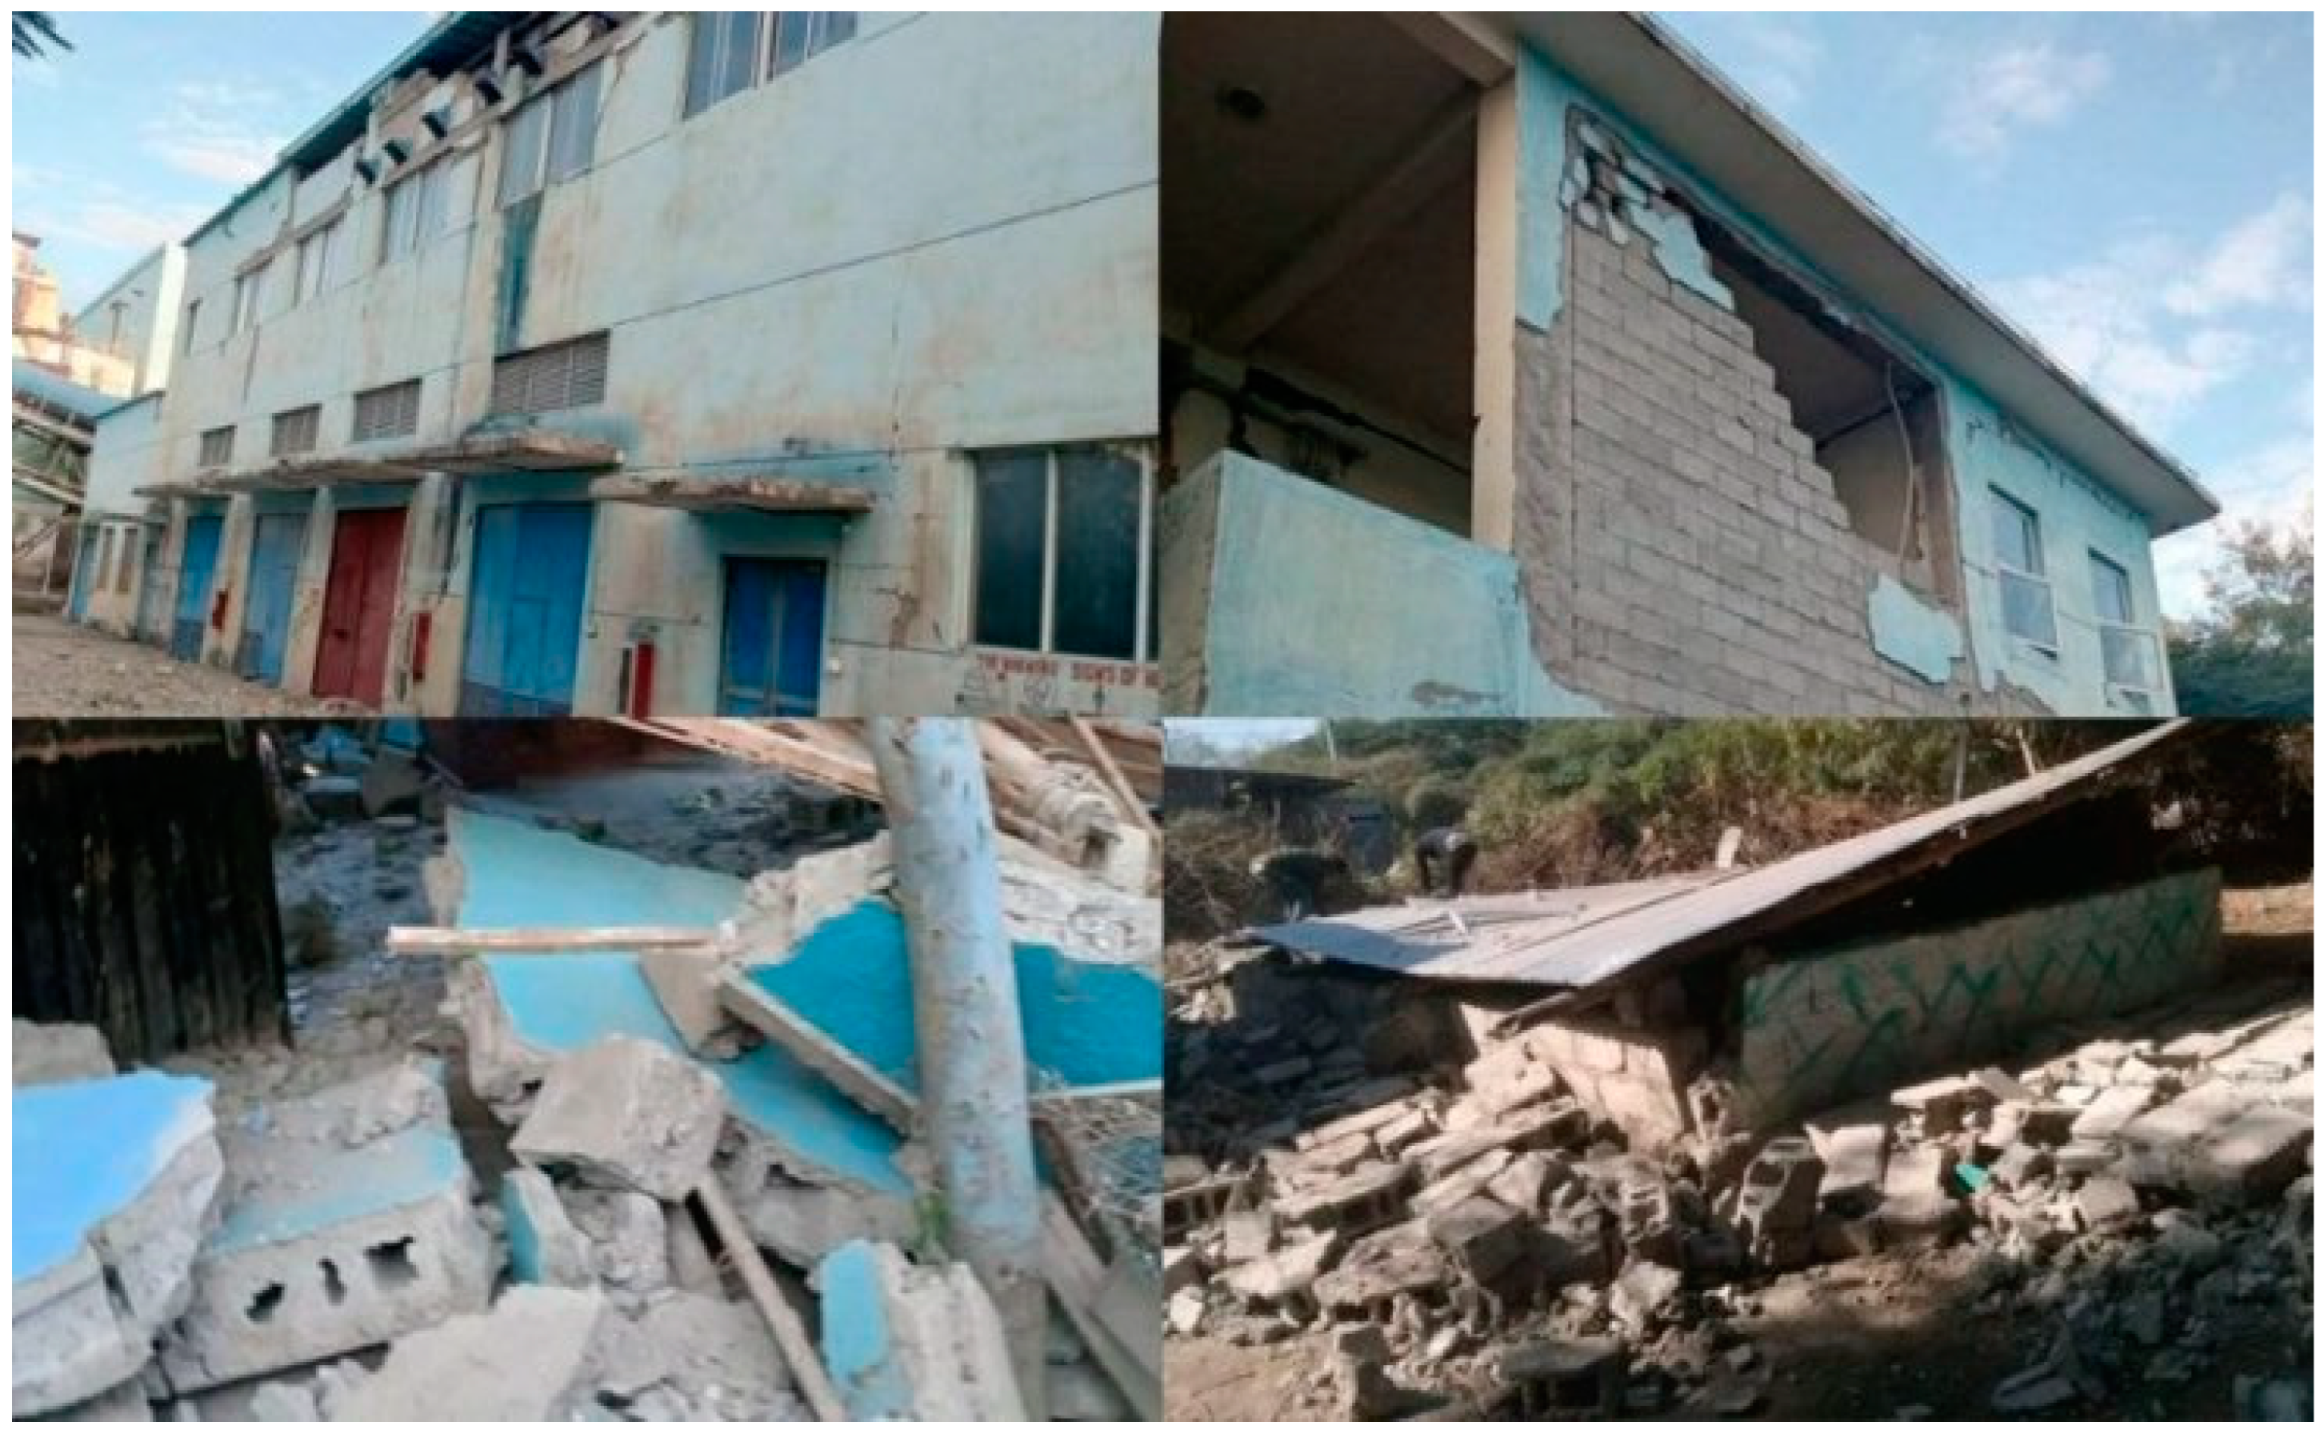
Ethiopia is susceptible to earthquakes and recently the United States Geological Survey recorded an earthquake measuring a magnitude of 5.8 and Ethiopia’s government has said it is evacuating approximately 80,000 people following a series of small-scale earthquakes in the Afar, Oromia and Amhara regions as shown in Figure 1. The eruption in the Rift Valley, which runs through the center of Ethiopia, is one of the testimonies of the country’s severe risk. Simultaneously, the region is generating increasingly significant real estate projects. This may be disastrous for developing nations like Ethiopia, which are not prepared for earthquakes like the one with a large magnitude that occurred in Haiti.
Hence, this research details the entire design of a 44-story reinforced concrete sample model based on Eurocode 8-2004 code. Classical modal analysis, RS (Response Spectrum Analysis), and LDTHA (Line Time History Analysis) were done on the 44-story sample RC building. SPO (Static Pushover Analysis) and NLTHA (Non-Linear Time History Analysis) were also done on a 44-story sample structure to determine global and local responses such as story shear, story moment, story stiffness, and story displacement. Comparable areas include the formation of plastic hinges and static and dynamic pushover curves [1].
Additionally, the most recent Ethiopian earthquake code, ES8-2015 (hereafter referred to as “ES8-15”), as well as additional significant codes, have been adopted based on European Standards EN1998-1, which are the same as Eurocode 8-2004 [1]. Gouin developed the first seismic hazard map in 1976 to study seismic risk assessments in limited regions of Ethiopia. This aided in creating the first Ethiopian building code, ESCP-1: 1983. Additionally, Kebede and Asfaw examined the map in 1996, and the conclusions were included in the second nation-building code, EBCS-8: 1999. Kebede and Van Eck reviewed the dangerous characteristics of Ethiopian and neighboring earthquakes in 1997 and concluded that there were no significant differences in the map and effects of the 1996 Kebede earthquake hazard map. However, it is believed that they analyzed the spectral response in other cities and industrial areas [2].
Additionally, Ref. [2] examined the hazard map of Ethiopia and adjacent countries in 1999, examining the influence of rock formation on a 10% exceedance over a 50-year case. Later, an examination of the potential for earthquakes in Ethiopia and neighboring countries incorporated the Poisson earthquake model and the related catalogue, which Ayele reported in 2017, and the 475-return period was used to develop Ethiopia’s third-generation building code. The current research has little regional impact or inadequate reaction regarding topography, groundwater response, or slope. As a result, the Ethiopian seismic hazard map must comprehensively examine groundwater changes or local soil conditions, climate and slope impacts, groundwater hydrology, slope, and other necessary parameters. Finally, it is concluded that further interdisciplinary study is required to enhance the Ethiopian seismic hazard map (e.g., logical tree considerations). Ethiopian high-rise building design and construction are still in their infancy, and the authorities are worried about the quality of the local consultants. Since 2005, various initiatives targeted at bolstering the domestic building sector have been implemented. However, owing to the absence of such measures, the status of the domestic building sector continues to worsen. Local contractors and managers lack the necessary skills, state-owned firms are inefficient, corruption exists, there are unsustainable employment possibilities, technology is antiquated, and supporting policies are lacking. Unfavorable economic circumstances, for any reason, are all impediments to adoption [3].
In conclusion, it is believed that further interdisciplinary study is required to enhance the Ethiopian seismic hazard map. Hence, instead of relying on the inaccurate hazard map of Ethiopia, in this paper, to improve the seismic performance of the new and old design buildings, the adoption of the state-of-the-art design methodology, and a performance-based design approach, is necessary. Hence, in this paper, we perform the full-scale 44-story sample reinforced concrete design to demonstrate the application of a performance-based approach to real-world structural design.

1.1. Research-Specific Aims and Objectives

  • To explore the primary hazards of adopting foreign building codes in Ethiopia without adequate adjustments to account for the country’s unique geological conditions when designing and constructing tall structures, and to compare the two design approaches, code-based linear analysis and PBD.
  • To explore strategic recommendations for effectively utilizing the design findings of this paper, which employs the cutting-edge Performance-Based Design (PBD) approach, specifically nonlinear dynamic analysis (such as NLRHA).
  • This analysis procedure aligns with the updated ‘Tall Buildings Initiative’ and the ‘Guidelines for Performance-Based Seismic Design of Tall Buildings, 2017’, developed by the Pacific Earthquake Engineering Research Centre (PEER).
  • Additionally, the objective is to propose integrating the PBD approach into Ethiopian e-government policies and as a guiding framework within local consultancy and construction firms.

1.2. Problem Statement

  • Ethiopia’s current seismic design, adopted from European norms, is generally sound. However, adopting a code presents a challenge; some requirements need to be considered, one of which is the seismic hazard map of Ethiopia.
  • Unfortunately, we have lost considerable historical earthquake data due to a lack of seismic recording stations, finances, and technical personnel. As a result, Ethiopia’s current seismic hazard map remains preliminary, casting doubts on the reliability of its seismic design code.
  • Can we rely on structures designed using it if we cannot trust our current seismic hazard map? The answer is no. This raises the following question: how can we create structures that perform well in future unexpected earthquakes without a reliable seismic hazard map?
  • One option could be to rely on global seismic hazard maps. However, these maps often do not consider local geological parameters crucial for seismic design. This brings us back to the question: can we truly rely on global seismic hazard maps for our local needs?

1.3. Gap in the Literature

Lack of intensive and comprehensive RC design on 44-story RC buildings included almost all design procedures, such as Classical Modal Analysis, RSA, LTHA in linear model and SPO and NLTHA on nonlinear modelling with plastic hinge modelling. The approach is in one paper and in the design location of Ethiopia. In addition, 11 earthquake datasets extracted from the PEER website are unique to this paper. This makes this paper novel and original, opening the door for further research.

1.4. Research Questions

  • Does the absence of earthquake recording stations and reliable seismic data pose a significant challenge for countries without the means to generate accurate seismic hazard maps?
  • If we cannot trust our current seismic hazard map, can we rely on structures designed using it? The answer is no. This raises the following question: How can we design structures that perform well in future unexpected earthquakes without a reliable seismic hazard map?
  • Considering the absence of reliable seismic maps in certain countries, could performance-based design be a viable solution?”
  • Is the seismic performance of reinforced concrete structures designed according to Ethiopian ES8-15 corresponding to Eurocode 8-2004 standards (based on EN1998-1) seismic code recommendations effective or not?
  • Is there a consistency between Non-Linear Time History Analysis (NLTHA) and Pushover Analysis (SPO) compared to traditional linear analysis methods such as Classical Modal Analysis, Response Spectrum Analysis (RSA), and Linear Dynamic Time History Analysis (LDTHA) by the current Ethiopian building codes?

2. Literature Review

Advanced priority on decoupling structure designs from conformance to prescriptive adopted reinforced concrete design codes needs assessment, especially in the perspective of story stiffness, materials, cost, strength, and configuration, has created momentum [1,2,3] toward the adoption of design paradigms that are premised on performance objectives. The efficacy of sustainable and resilient structure designs with specific performance expectations pegged on the spatial and temporal user needs and environmental dynamics has been affirmed extensively in the literature. Empirical analysis of the performance scale for the new design of structures indicates superior thermal performance [4,5,6,7,8], improved load-carrying capacity [9], higher durability [10], and impressive response to seismic disturbances [11,12,13,14,15]. Performance-based structure designs, the high structural and functional performance notwithstanding, exhibit defragmented implementation criteria due to variability in spatial and temporal performance needs across and along geographical contours [16,17,18].
The resultant incompatibility of the performance-based structure designs between geographical regions introduces complexities in computing loading factors, dead load, wind load, economic value, and design analyses of structures subjected to similar performance conditions [19,20,21]. Despite these challenges, the design paradigm offers a quantitative advantage in localizing reinforced concrete (RC) codes and standards, ultimately increasing their responsiveness to local conditions [22]. The transference of the structure design codes between countries and regions can be achieved by adapting to the destination environment to create seamless conformity [22]. Comparative analysis of ACI 318-08 and AASHTO LRFD design criteria for concrete structural designs by [23] indicates the codes exhibit fundamental variances in moment capacity and flexural strength.
Performance-based structure designs necessitate reverse engineering, in which the nature of the desired performance results advises the design criteria. In [24], it is noted that the shift to performance-based structure designs simplifies the mathematical modelling of the structure performance. The efficient integration of the design’s mathematical models potentially increases the accuracy of performance estimation [25] and harmonization of the local structural designs [26,27]. It confers greater regulation and control of the structural performance of RC members in different applications [28,29,30,31], accurate estimation of structural failure under different load conditions [32,33,34], and sustainable development [35].
Design structures supercharged to conform to prescriptive criteria, as demonstrated in [36], demonstrate a deficient capacity to respond to seismic disturbances. Similarly, variations in design codes affect the performance of the structures on key indicators, including the packing capacity of the materials, elastic stiffness, global lateral response, peak strength, and target displacement, among others [37,38]. Flexible design codes allow cost-effective temporary work designs [39] to retain uniformity, clarity, consistency, and repeatability in structure design and analysis [40,41] and simplifies designs [42]. Generally, the impressive performance parameters of the design paradigm facilitate the seismic fragility analysis of the structures [43,44], the temporal dynamic behavior of RC structures [45], and the seismic function of the interactivity between structural and non-structural members [46]. In addition to that, modular construction offers efficiency but poses unique seismic challenges due to discrete diaphragms and weak inter-module connections. A study on a 9-story RC modular building found that central RC walls induce torsional flexibility, and seismic collector rigidity impacts force response. It also highlights ASCE 7-16’s limitations, stressing the need for improved seismic design methods [47].
Generally, the intrinsic qualities of the codes are determined by the deliberate trade-off made to achieve the desired standards and market demands. In [48], a comparative analysis of European Structural Codes (Eurocodes) and British Standard Codes shows marked differences in effective area, cost, and structural performance. Such differences in design codes are reflective of a local need’s assessment of structural performance, such as RC ductility, longevity, sustainability, and durability in different load conditions [49]. The fundamental principles of performance-based structure design codes provide a platform for optimizing the performance indices of the RC members, steel, components, or their combinations.
Recently, Ref. [50] has demonstrated that the architecture of the system provides a stable platform for launching topology optimization frameworks to develop functional concrete structures, create variable friction systems with minimal hysteresis [51], optimal use of the structure, and elimination of torsional deformability [52], limit structural failure [53,54,55,56,57,58,59,60], alleviate the corrosion-related deformity of RC elements [61], and increase the overall reliability of the RC structure [62,63]. According to [64], transparency and continuous improvement of the design codes form the rampart of the system functionalities. In [65], the Eurocode 8 (EC8) is evaluated to make it highly efficient in controlling and predicting the earthquake behavior of steel moment-resisting frames (MRFs) by minimizing the volume and weight of the material and enhancing consistency in the true-to-performance between design predictions and ductility response spectra of the structure to seismic waves [66,67,68,69].
A comparative analysis of the performances of different systems codes is reported extensively in the literature. In [70,71,72,73,74,75], the American ACI code is noted to have higher story shear and drift indices compared to AC8 and the Indian Standard (IS) code [76,77,78,79,80,81,82,83,84]. However, the displacement index for the three systems is close to the source of the displacement force [85]. The displace increment, along with the stories from the base story upward, is 50% for the IS and 70% to 80% for both the ACI and EU8 codes. In essence, the IS emerges as an ideal model and a standard for (PBD) performance-based design of structures on account of its sustainable performance and high level of predictability and controllability [86,87,88,89,90,91,92,93,94,95]. The efficacy of the IS code is investigated in detail in [96,97,98,99,100] with significant findings point excellent seismic performance and spectral displacement. In [101,102,103] a comparative analysis of the Chinese Code (GB) and the ACI shows the latter code has a material density inefficiency ranging between 8 and 10% compared to the former code [104].
The anomaly in the performance indices of the modern codes is primarily a function of differences in their efficacy in assessing structural components [105] assessment methods and approaches [106,107,108] seismic design methods [109,110] and the seismic vulnerability of the structures [111,112,113]. Other influencing factors include the component-level seismic performance of the structure [114,115] seismic zoning [116,117] level of seismic code enforcement [118,119] projected or anticipated member capacity [120,121] risk-inconsistencies and code conservativeness [122,123] and the ductility factor of the structure [124,125] also influences the efficiency of the codes. The level codes’ flexibility influences their performances with variances ranging from ductility for highly flexible codes to rigidity for lesser flexible codes [126,127,128]. Optimal design considerations for structure components offer better control over the code shear and seismic failure performance [129,130,131] energy dissipation performance [132,133] torsional effect [134] and structure component performance [135,136,137].
The development and adoption of performance-based structure design are still in their infancy. Regular reviews of the codes are critical to improving their efficacy [138,139] changing environmental dynamics, design philosophy, and market demand [140,141,142,143,144]. Continuous improvement of the codes demonstrates a marked reduction in their performance discrepancies in the assessment of key parameters [145,146] strengthening of building safety [147] better performance against seismic loads [148] implementation and training [149] and cross-compatibility [150]. The evolution of the codes is energized by innovative designs [151] models [152] greater control and adaptation environmental dynamics [153] and pegging their design on targeted performance. The technology provides a better alternative to the classic linear elastic techniques [154].

3. Materials and Methods

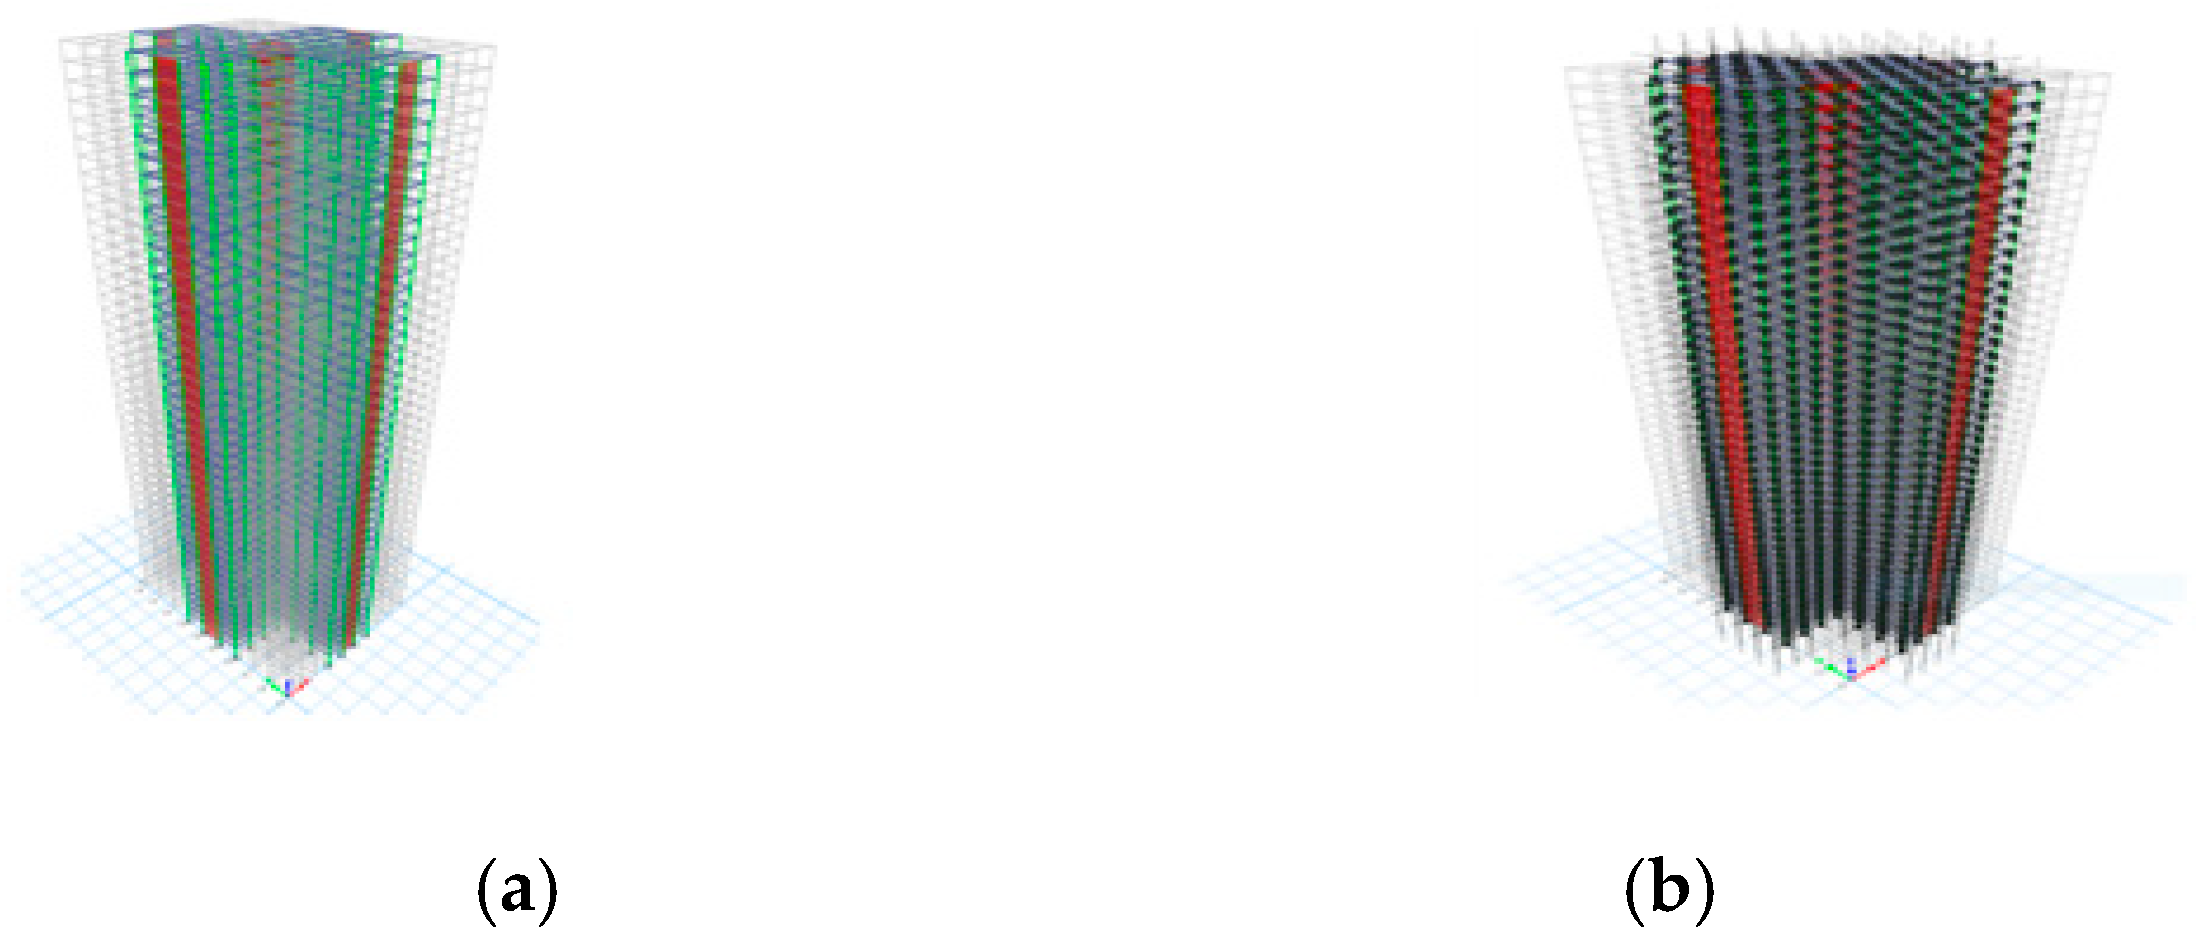
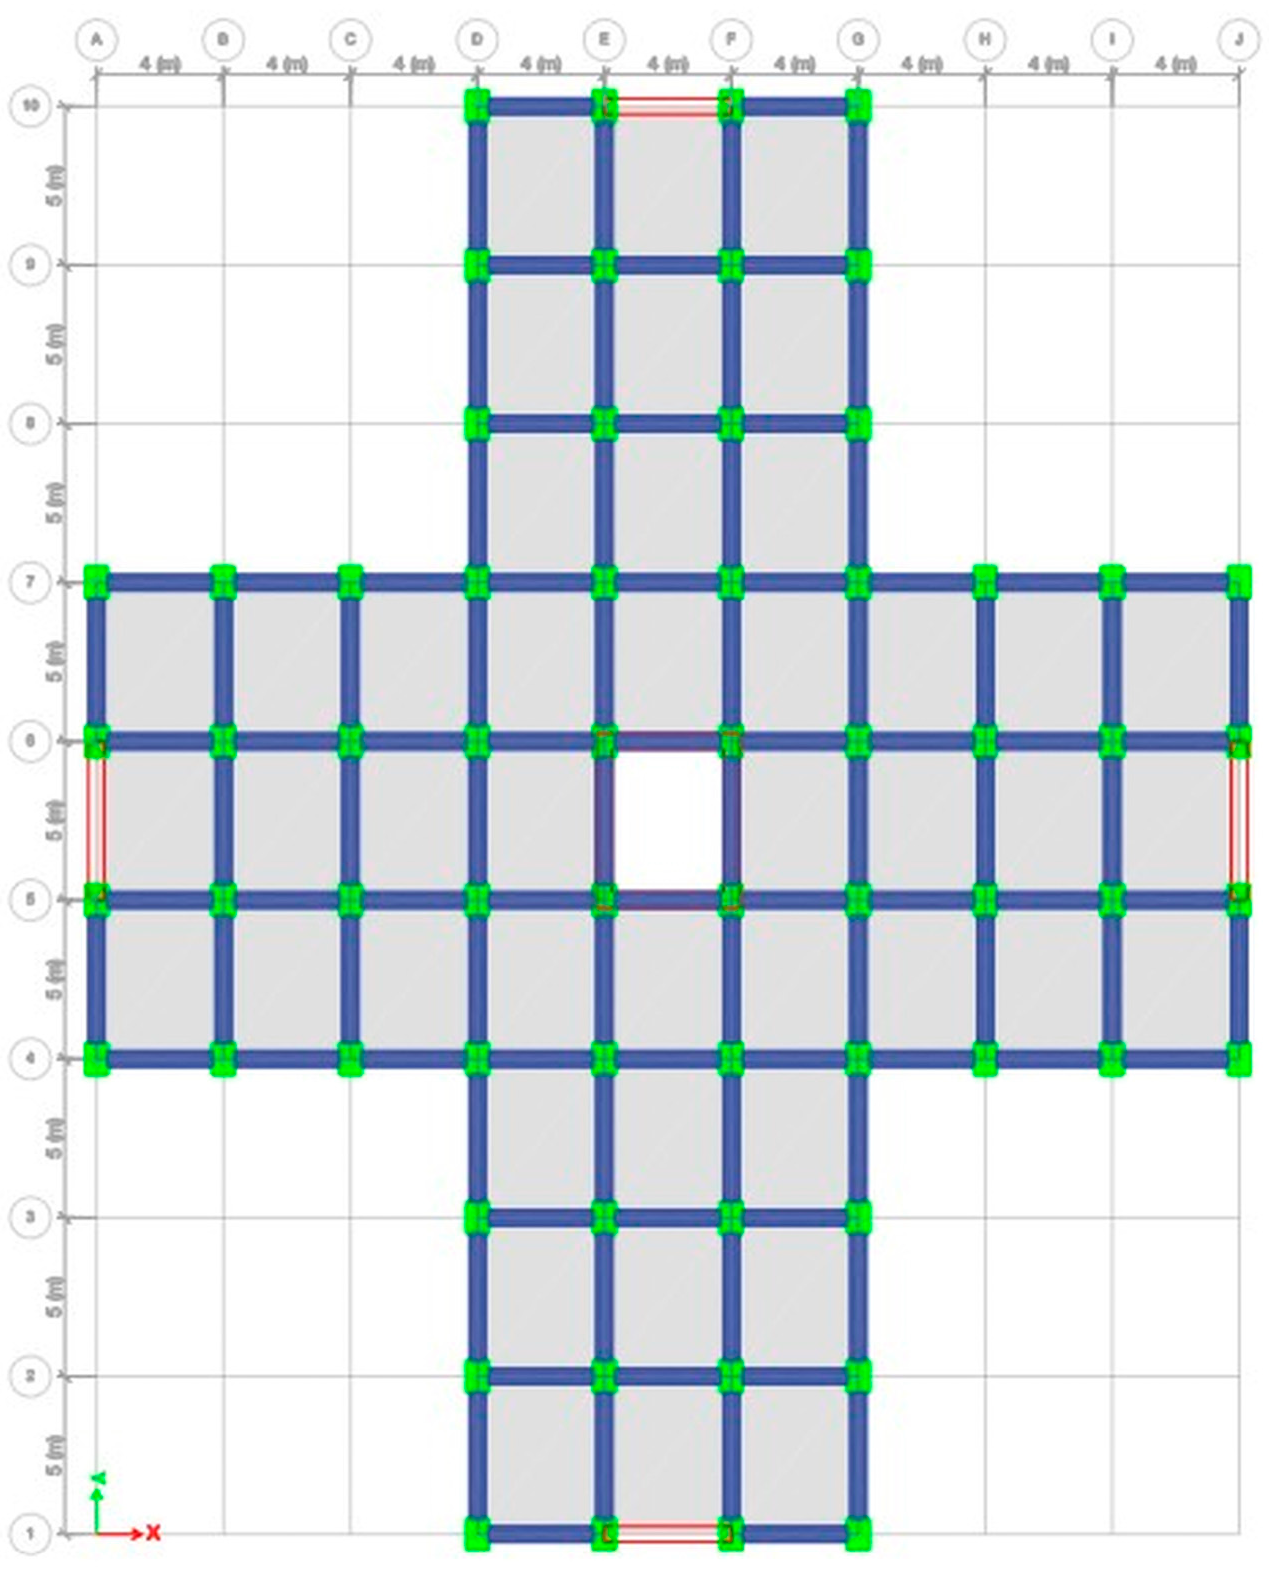
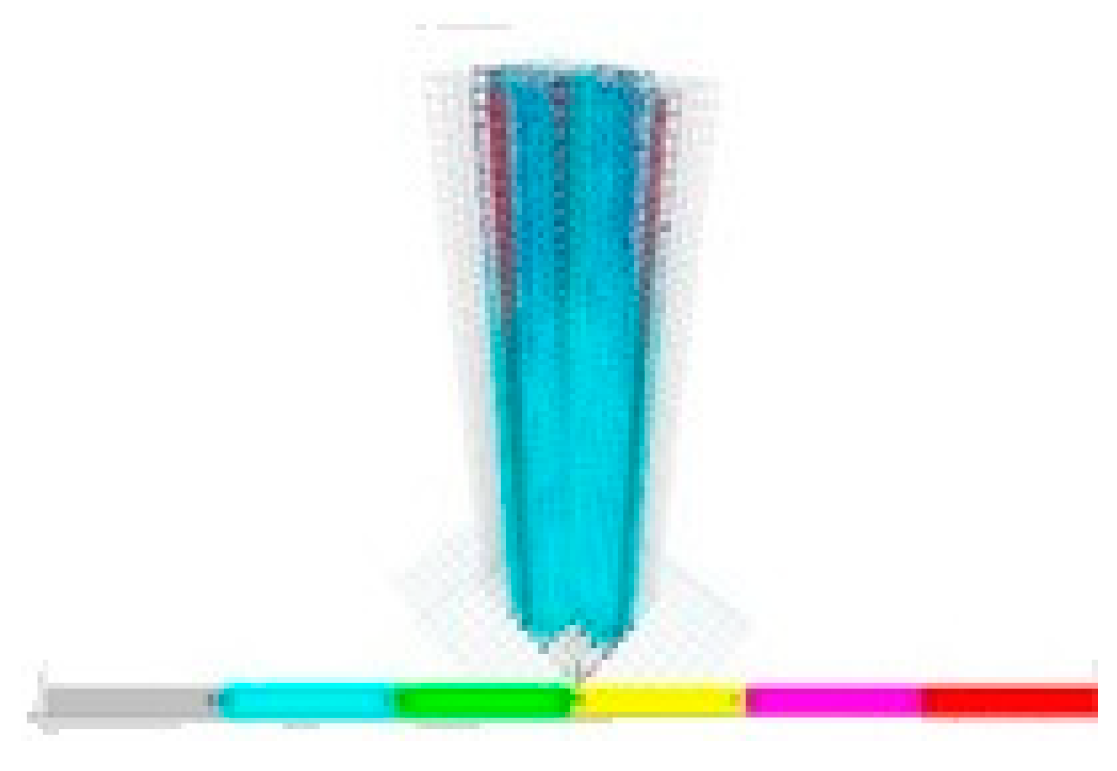
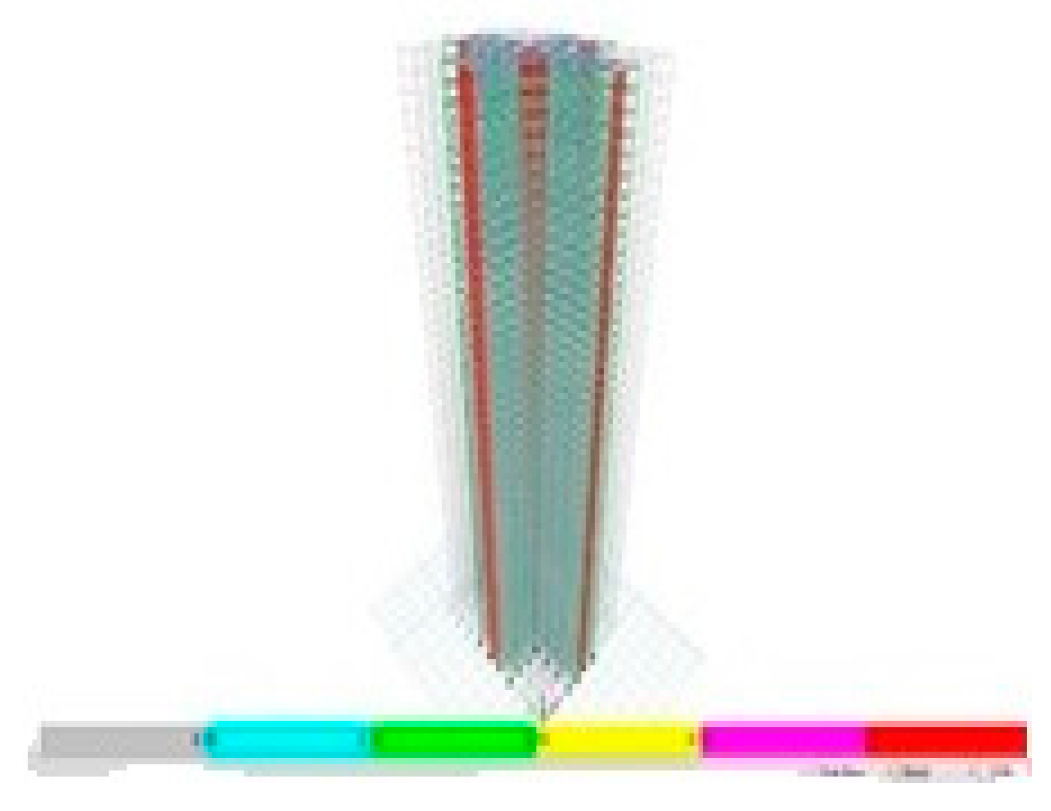
Reinforced concrete 44-story multi-storied buildings are analyzed and designed according to the specifications described in the Ethiopian earthquake design standard ES8-2015, based on the building code Eurocode 8-2004, and PBD with the same local condition as shown in Table 1, Figure 2 and Figure 3. Both linear and nonlinear models are analyzed and built under similar loads and design conditions. Thereafter, seismic assessments were performed using a pushover based on ASCE 41-17 requirements, FEMA 356, and ATC 40. Pushover analysis is a practical way to perform seismic analyses in buildings. Compared to conventional elastic analysis, it gives valuable information about future structural reactions and provides an understanding of the structural features that influence capacity during major future earthquakes. Additionally, it exposes design flaws that the elastic analysis process cannot capture; for example, it can detect the most critical portions of a structure regardless of its limits. It is suggested as the benchmark for typical models examined, particularly in the first dominant mode. Additionally, nonlinear dynamic analysis was used to validate the pushover static analysis findings. These are important components of performance-based design research conducted using the ETABS 2019 software. In this work, we used SeismoMatch 2016 and ETABS 2019 to select and modify different earth quicks, as shown in Table 2, which is extracted from the PEER Ground Motion Database. The extracted earthquake data was used to analyze linear and nonlinear time history as shown in Figure 2, Figure 3, Figure A1, Figure A2, Figure A3, Figure A4, Figure A5, Figure A6, Figure A7, Figure A8, Figure A9, Figure A10, Figure A11, Figure A12, Figure A13, Figure A14 and Figure A15, scaled and matched into our target response spectrum Type-I as shown in Table A1 and Table A2. As per the procedure, the first linear elastic design using the code-based design processes is performed with DBE level (10 per cent chance of being over 50 years, i.e., a return period of 475 years), and then the performance of the building is assessed under MCE level The chances of falling under an earthquake are very rare (2 per cent chance of being over 50 years, i.e., a return period of 2475 years). The study used models of a specific weight factor and development in various analyses, such as SPO, NLTHA, RS, and LTHA, and compared seismic performance results.
This section discusses designing a model building used in the study by building code ES8-15 (EN1998-1). Later, the project findings will be used to evaluate the seismic performance of nonlinear models. Functional structures, loads, and geometric models are very similar in comparing earthquakes’ design and distribution methods between linear and nonlinear types of analysis. With the design of the beam and column connecting parts, the concrete is almost identical, and the strength of the reinforcing steel is used as described in the Ethiopian ES2-2015 code. Twenty-eight-day compressive strength, as shown in Table 1, the stress–stress relationship of concrete in Ethiopian Code ES2-2015 is calculated using the same H-Rusch calculation as a member design. Gravity and lateral seismic loads are included in the design load. Gravity load consists of two parts: the dead load, which does not include the self-weight of the building, and was kept at 3.0 kN/m2. In addition to the dead load of the filling walls, the load distributed in standard beams is set as 15 kN/m. Additionally, 2.0 kN/m2 live load was used as specified in ES1-2015. Additionally, as defined in ES8-15 for dynamic analysis, 30% of the LL, in addition to the DL, was used when calculating the seismic weigh.
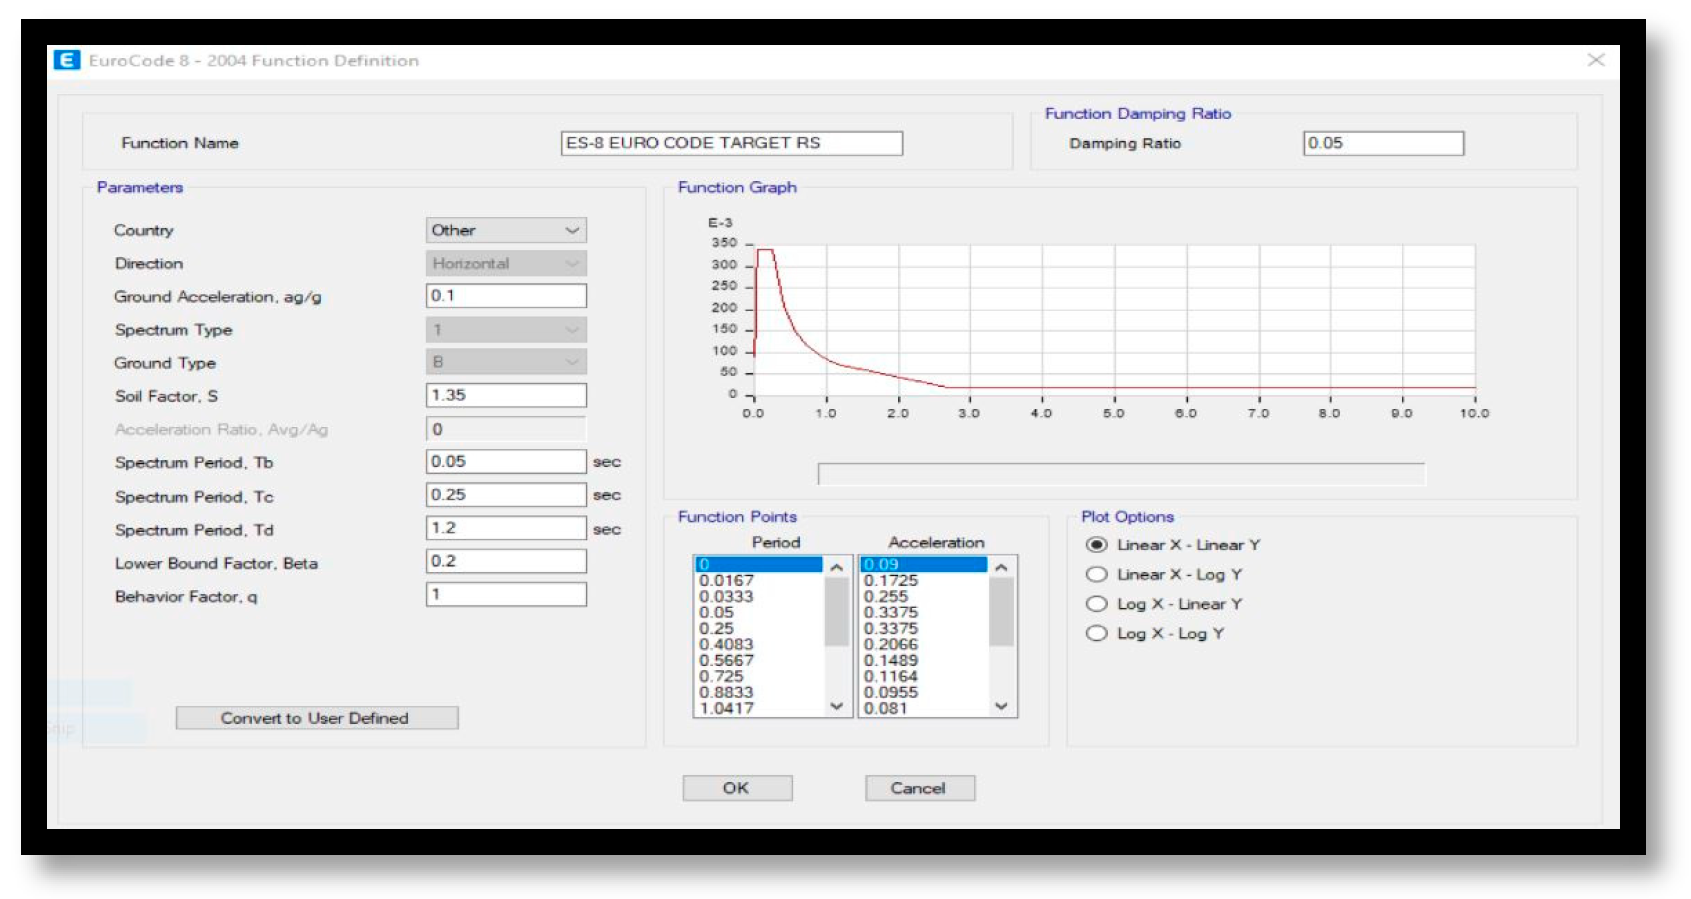
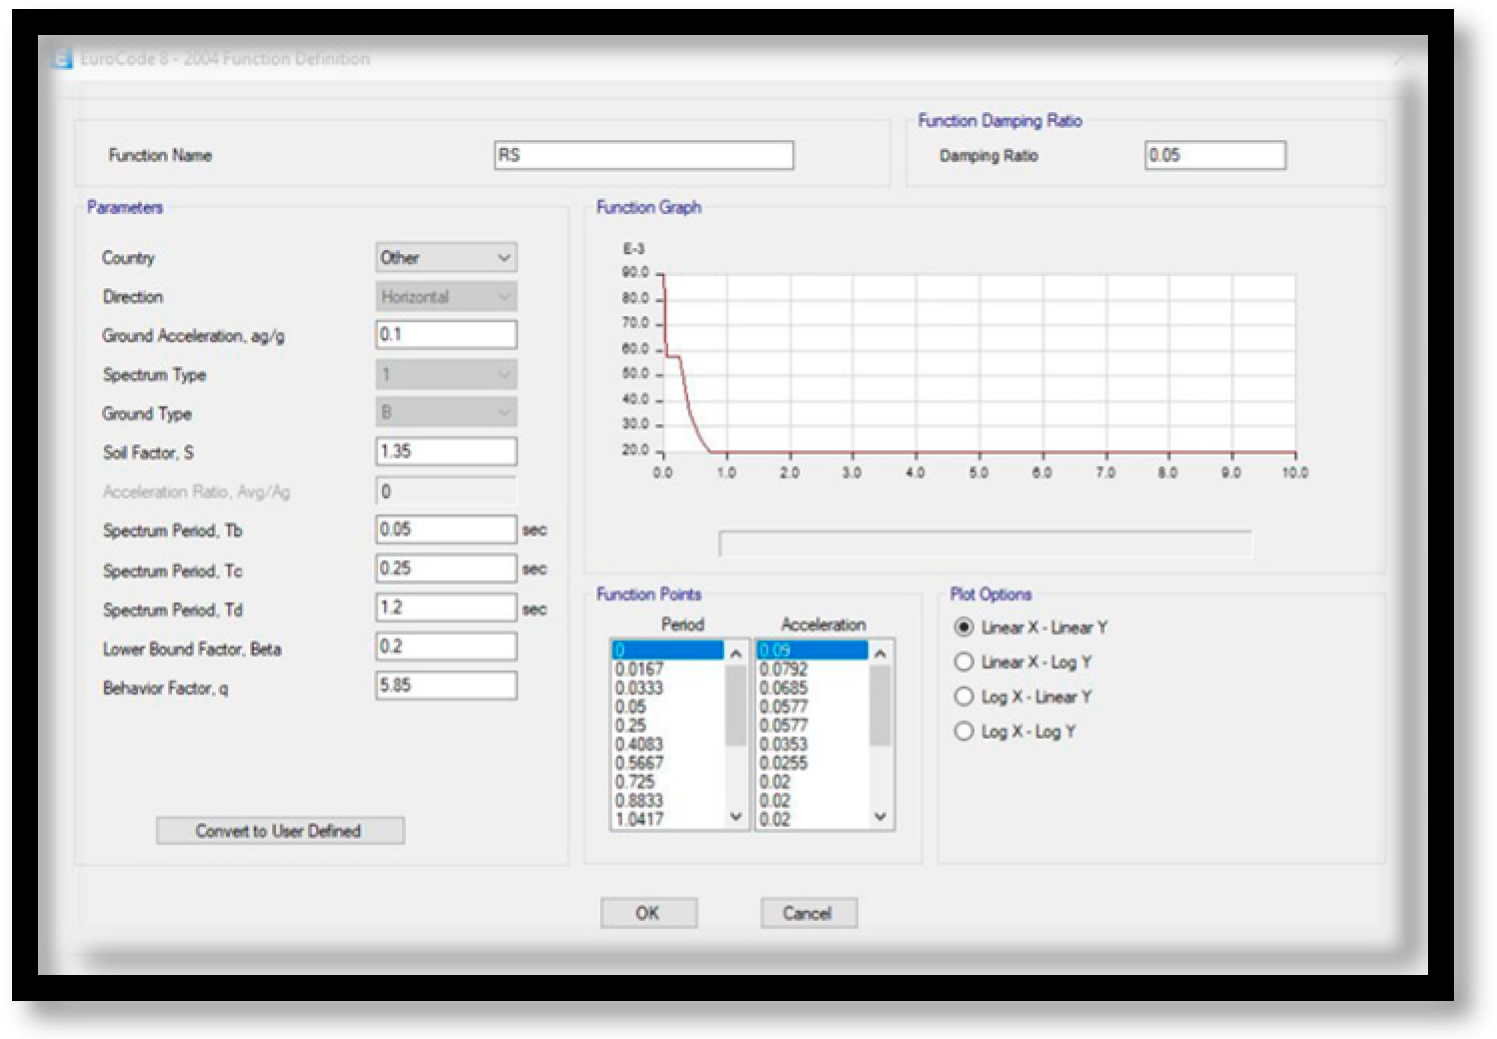
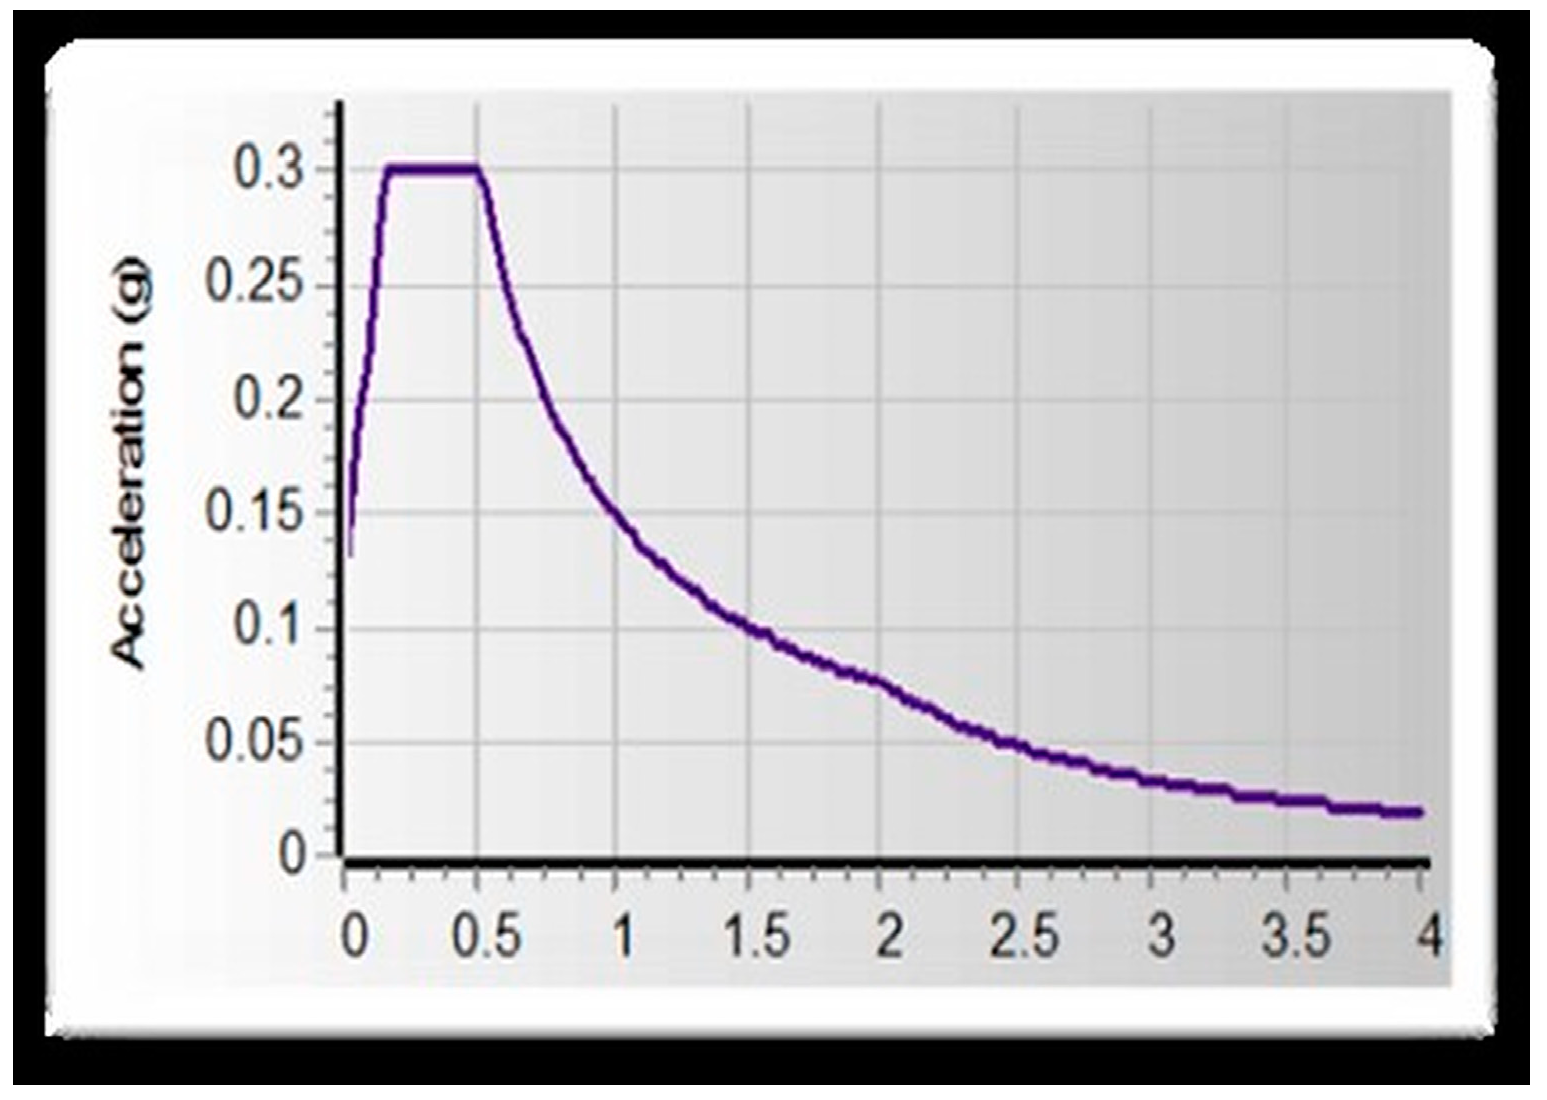
The ESEN 2015 code complies with the requirements of Eurocode 8-2004 by dividing the soil into five critical categories, A to E. Table A1 and Table A2 show each with its soil importance factor (S), soil type (B), and shear wave velocity (V30) used in this investigation. PGA is determined in Ethiopia using rock ground type A. In addition, 0.1 g Addis Ababa (Zone 2) in ES8-15 is used in this study to develop structural models. Therefore, ES8-15 uses a design RS (inelastic response spectrum) in addition to the linear response spectrum, as shown in Figure A16 and Figure A17. Additionally, the algorithm uses a response spectrum in various ways to measure the magnitude of seismic input into building models.
It is obtained by modifying the elastic spectrum of the structure by ductility, as well as the characteristic factor, q, and calculating the indirect influences present in the structure members. The behavioral factor q measures a building system’s ability to withstand nonlinear earthquake activity.
This is an approximate amount of seismic force that a building would face if its response were fully elastic and seismic forces decreased by 5% viscous damping. It can be used with an elastic analysis model to ensure the structural response is acceptable. The structural system determines the value of a behavioral factor, q. According to ESEN 2015, the q value of RC structures varies between 1.5 and 6.75. The value varies depending on the ductility and design standard, and finding the correct number requires nonlinear analysis and the response frameworks of the code ES8-15. The graph shown in Figure A16 and Figure A17 is constructed using the same design as for an earthquake risk level of 10% over 50 years and 5% damping. It is equivalent to soil B (PGA = 0.1 g, compared to soil type A), with a soil importance factor S = 1.35. ES8-15 design response spectrum serves as the basis for model frames and gravity loads and is used to test the design of structural components. Earthquake demand is reduced by about 1/5.85 in ES8-15.

4. Results and Discussion

4.1. Linear Dynamic Modelling and Analysis Results

4.1.1. Part-I Classical Modal Analysis for 44-Story RC Linear Sample Model

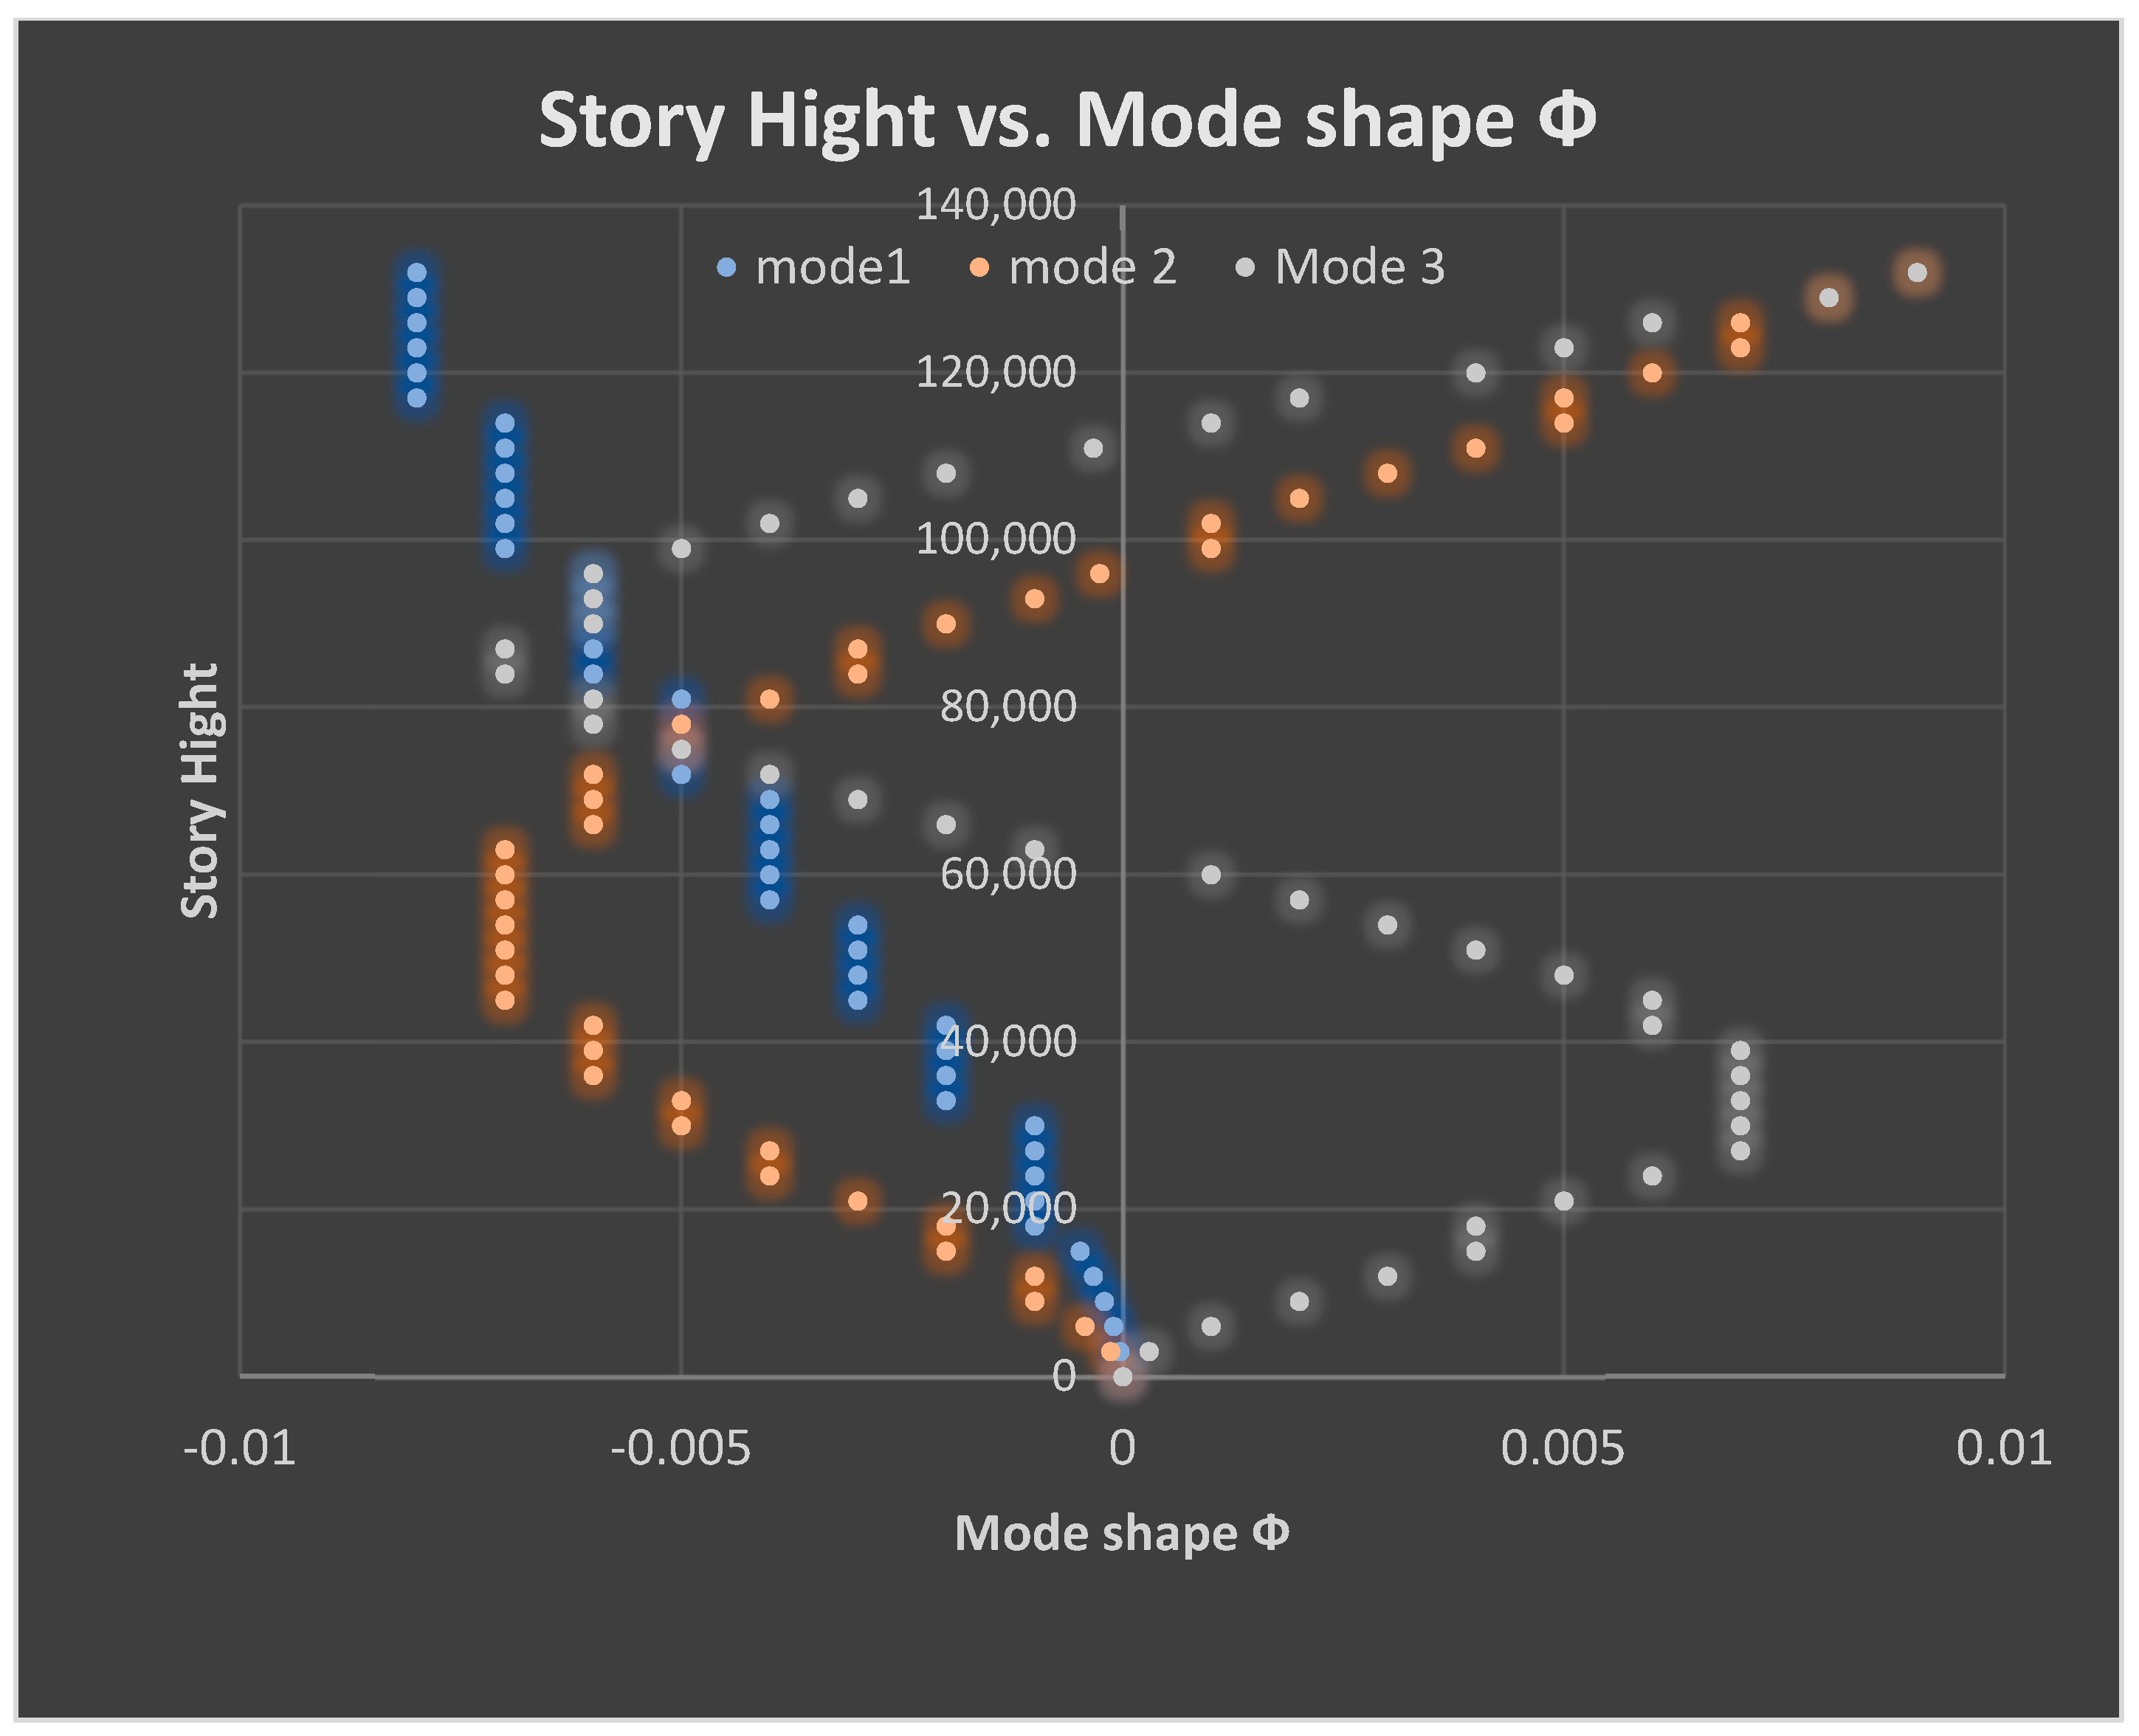
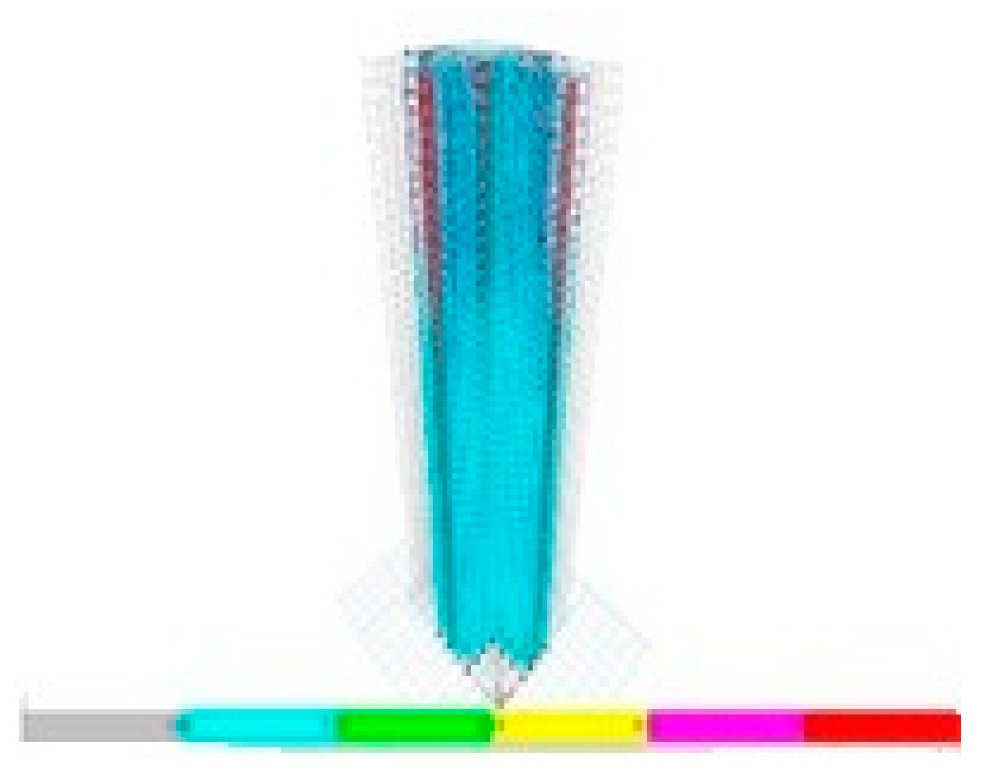
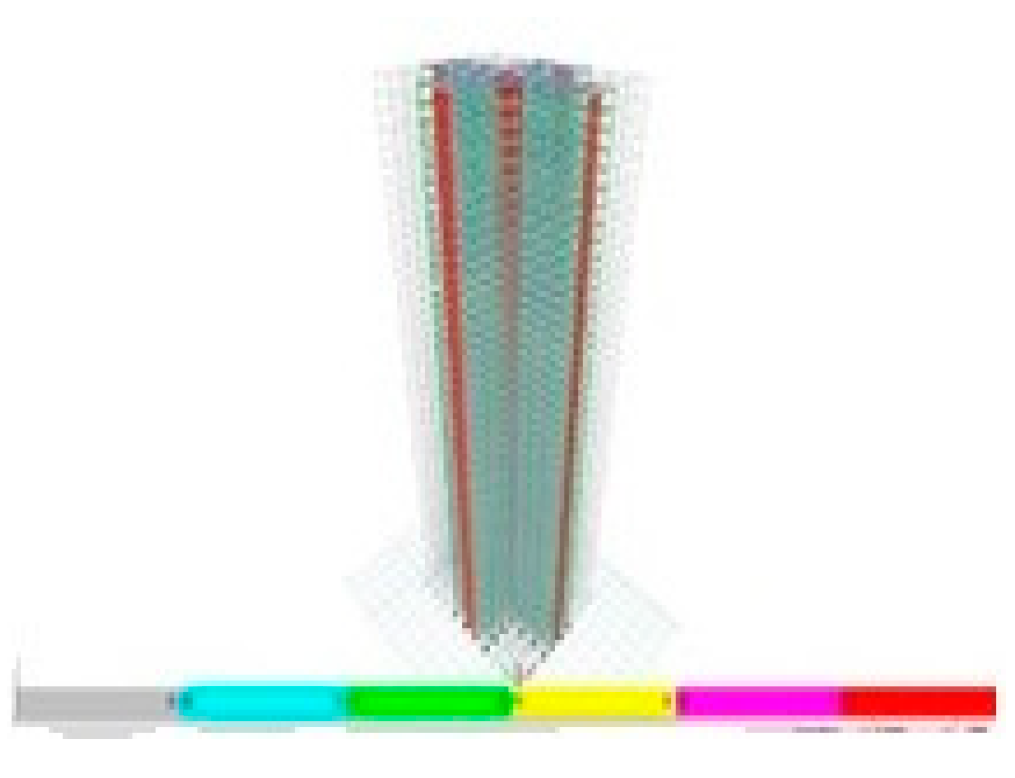
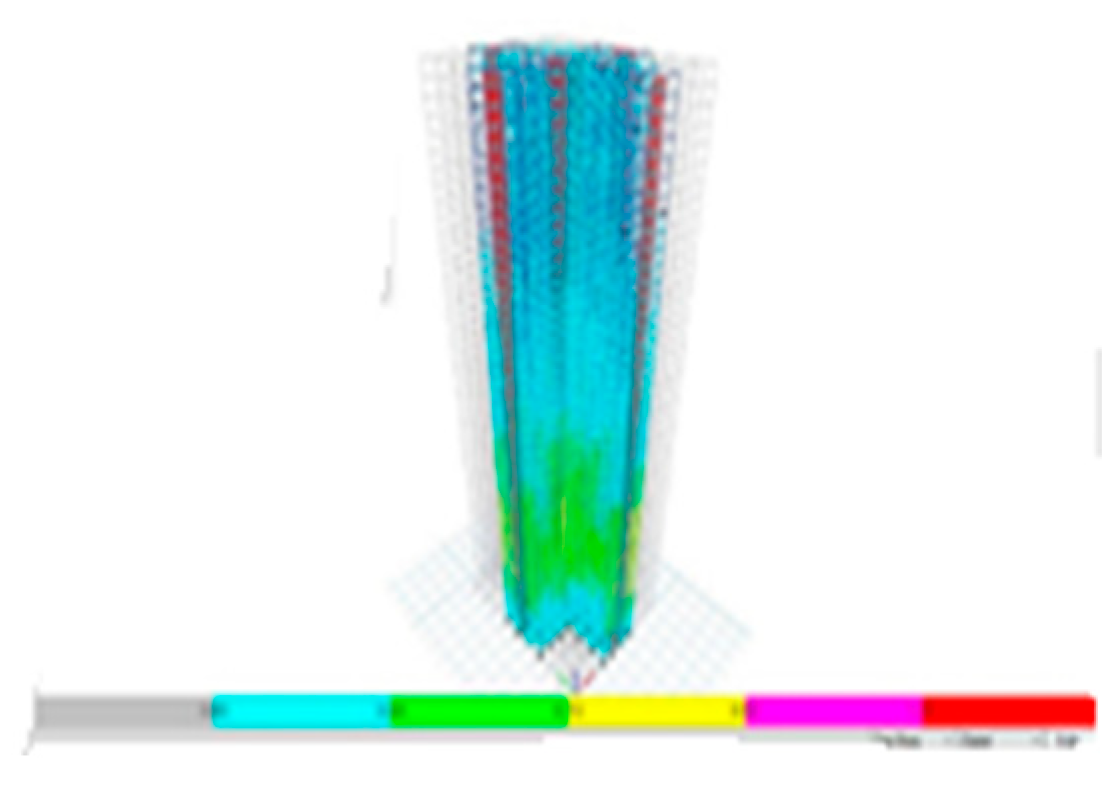
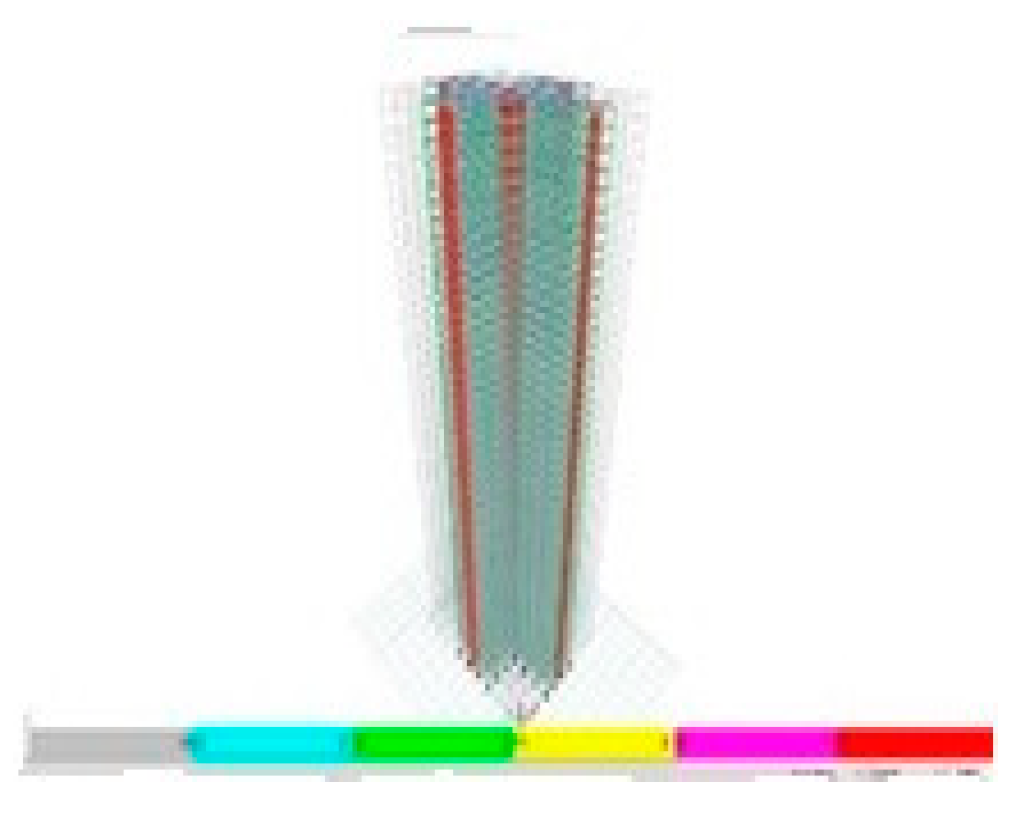
Before applying any given loading, the building was analyzed with the classical modal analysis procedure, which is sometimes called the heartbeat of the structure. The only parameters required for modal analysis are M-matrix and K-matrix to find the natural periods or frequency of the structures within the acceptable limit. In the future we will analyze a structure’s dynamic behavior, including the basis for damping, resonance, and amplification effects. The first mode fundamental period of tall buildings is approximated with the empirical formula 0.1 times the number of stories. Without applying any loading, we can calculate the structure’s natural period, and it should be in the reasonable range, then, most probably, our structure will perform well in future dynamic loading. The primary direction of the structure is determined by the first mode movement or its translation, and seismic analysis of the building should be conducted in those principal directions. In those primary directions, RSA and THA analyses were done by ES8-15 (Eurocode 8-2004). In addition, the SRSS method combines diverse modes of response by ES8-15. For conventional structures, the primary direction of the structure coincides with the global direction of the structure. Complete linear 3D modelling and classical modal analysis of samples of 44 stories were performed. The number of modes considered was 20 in ETABS vs. 19.0.0.; the natural period 1st mode for 44 stories was found to be 3.95 s. As per code requirement, the first three modes achieve more than 90% of the mass participation factor in the principal direction as shown in Figure 4.
The sample model’s modal analysis, RSA, and THA fundamental period observed were almost similar. The modal shape of the first three mode forms exhibited for the three analysis methods is identical. Table 3 summarizes the building’s first three modal features, including the (MPF) mass participation factor and natural periods. The 1st mode mass participation factor is about 80% or more in all models (ES8–15), indicating a first-mode dominating structure.

4.1.2. Part-II Response Spectrum & LDTHA Analysis Results for 44-Story RC Linear Sample Model

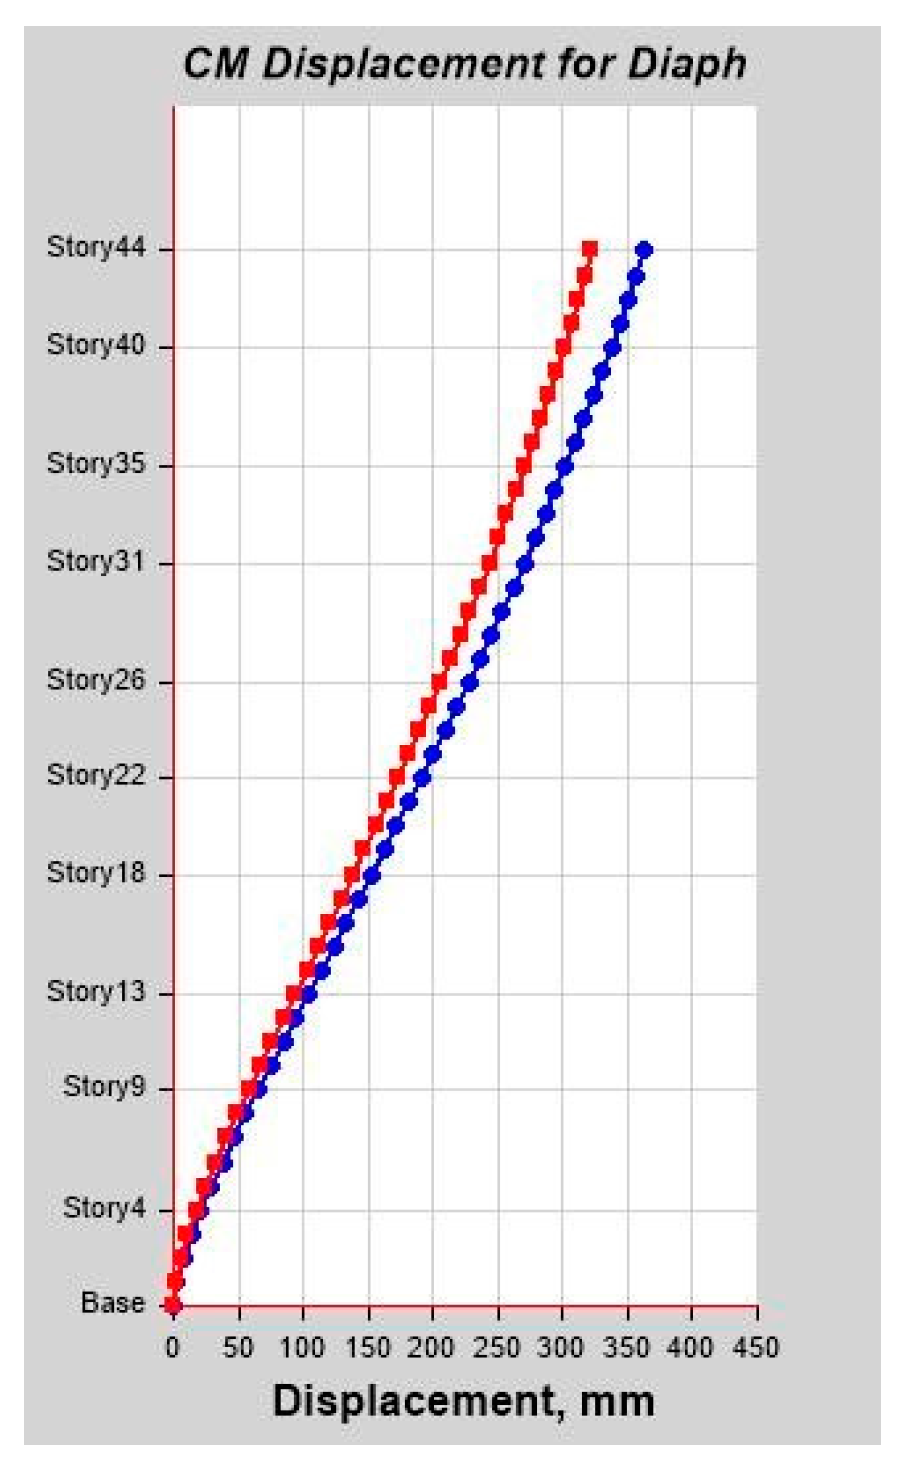
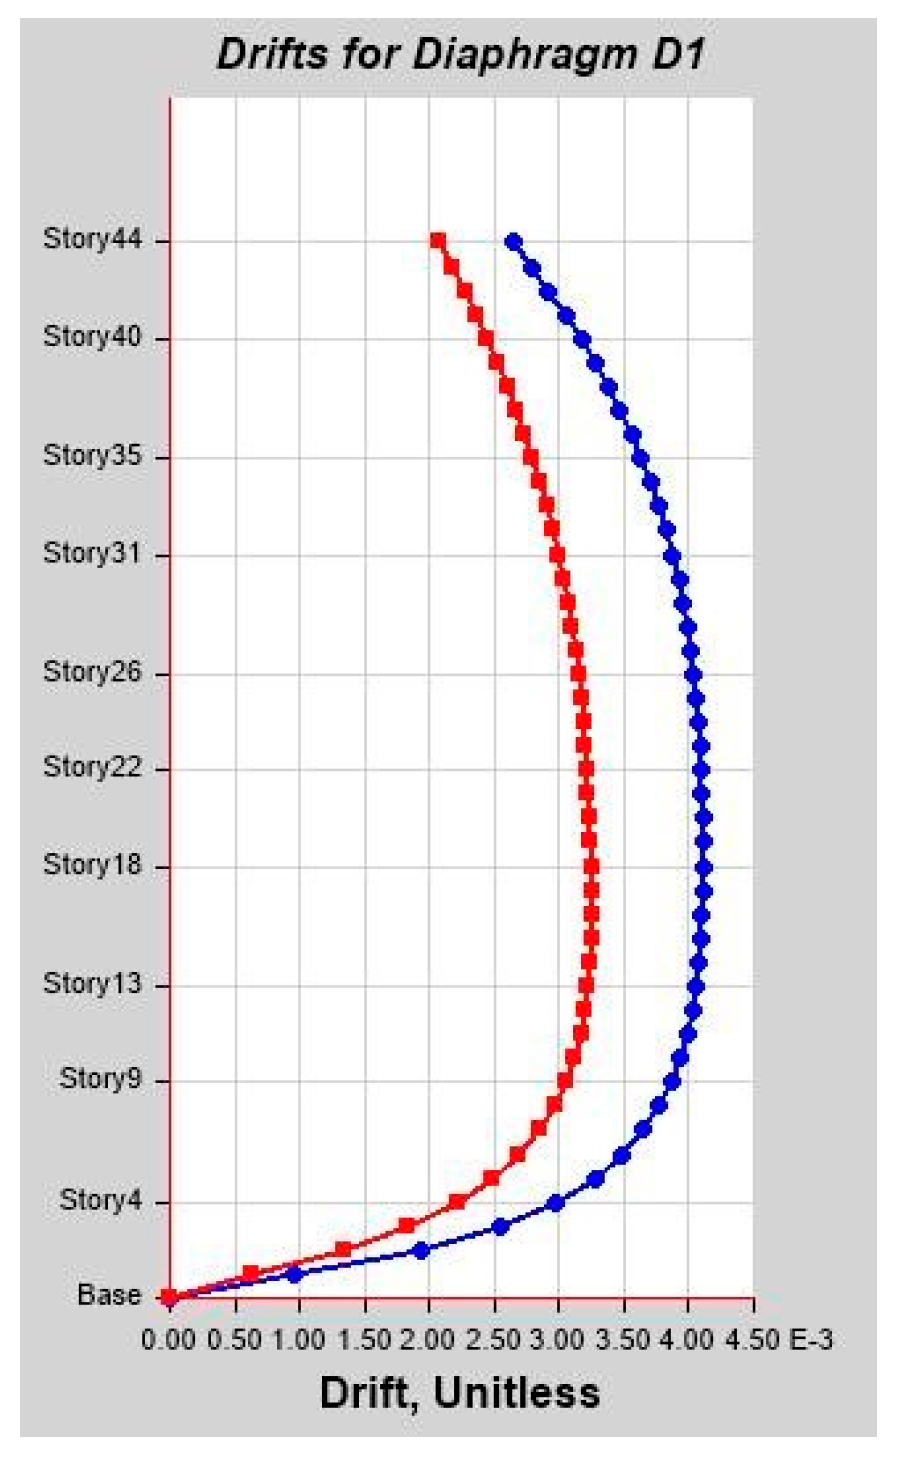
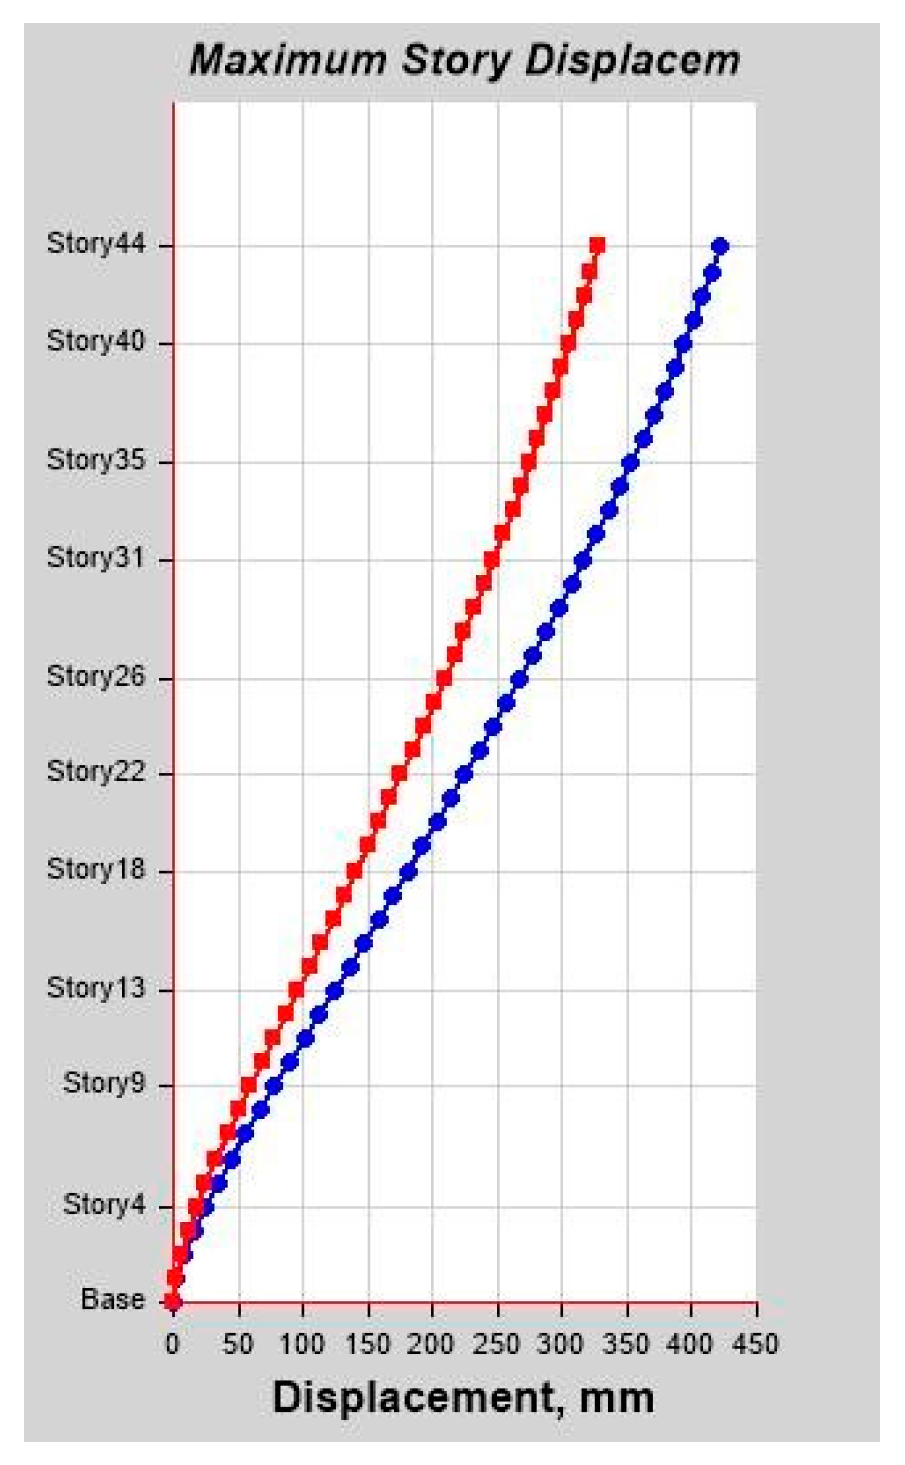
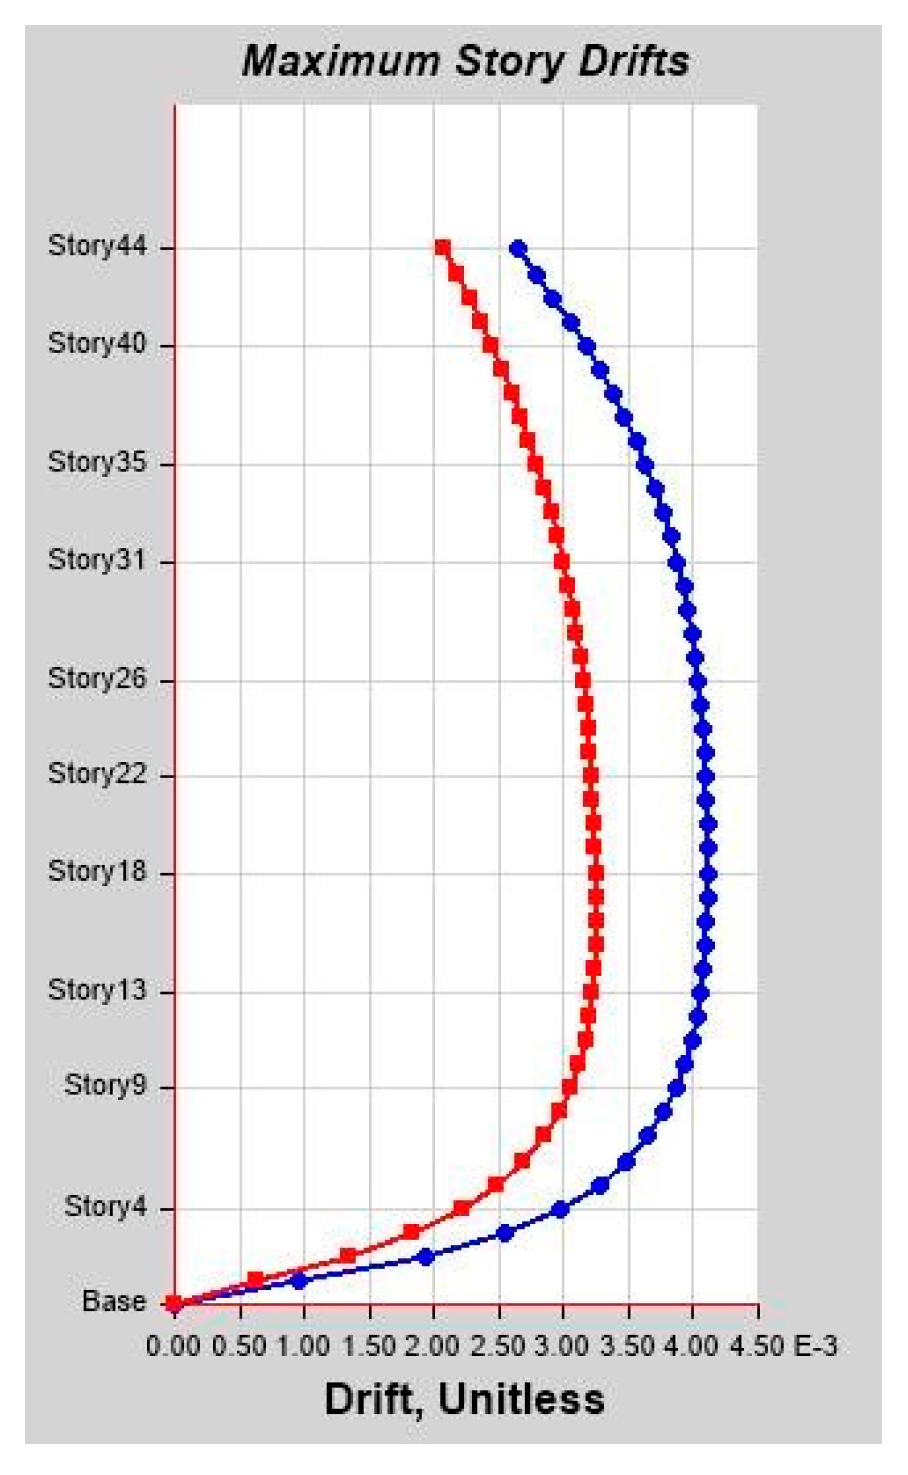
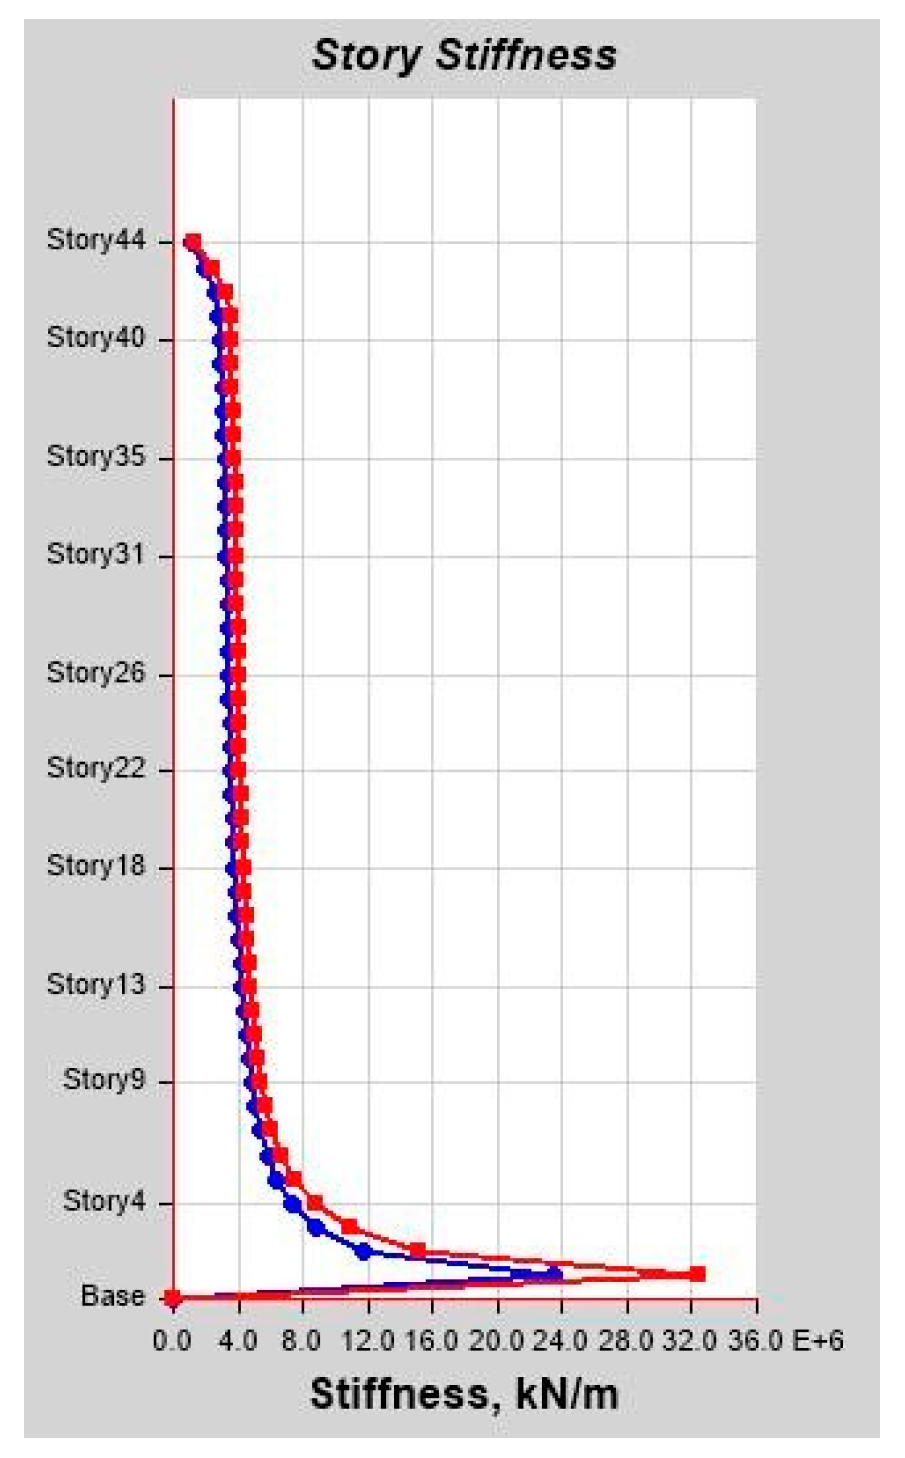
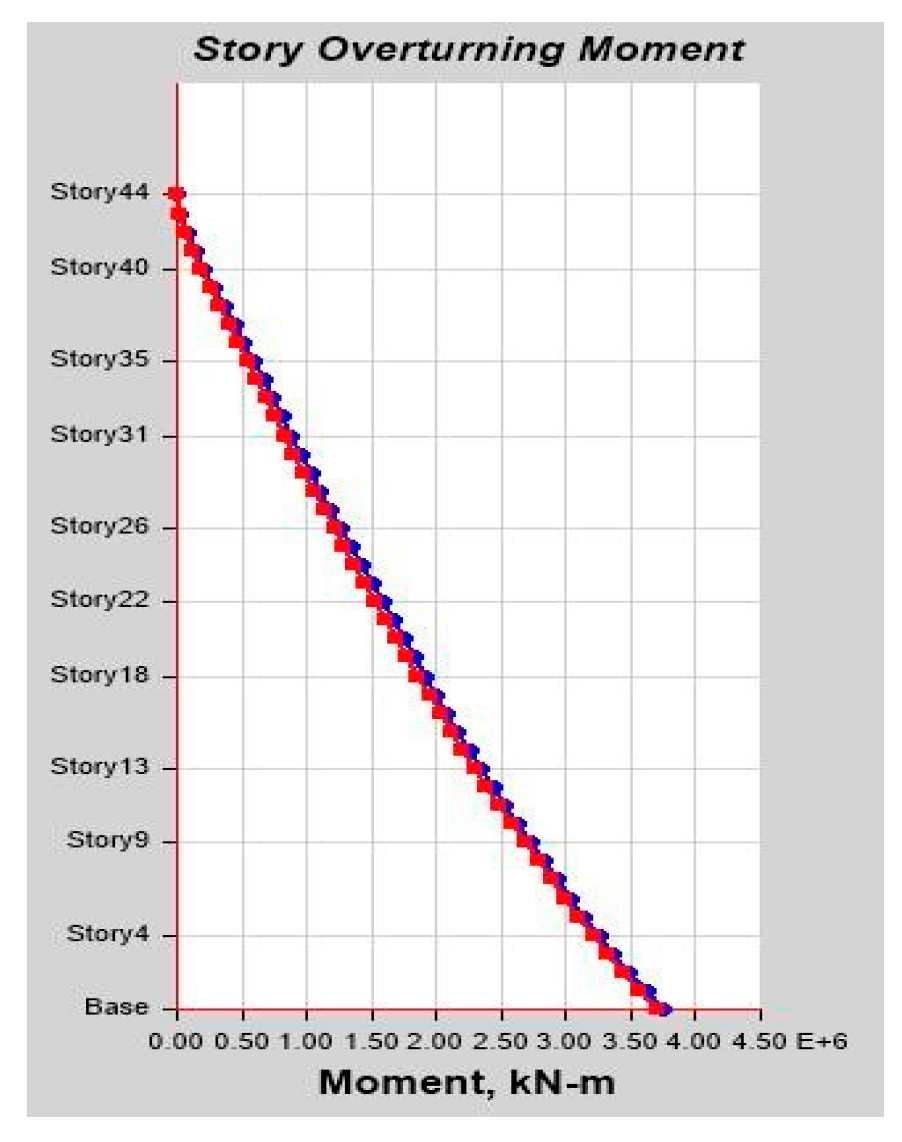
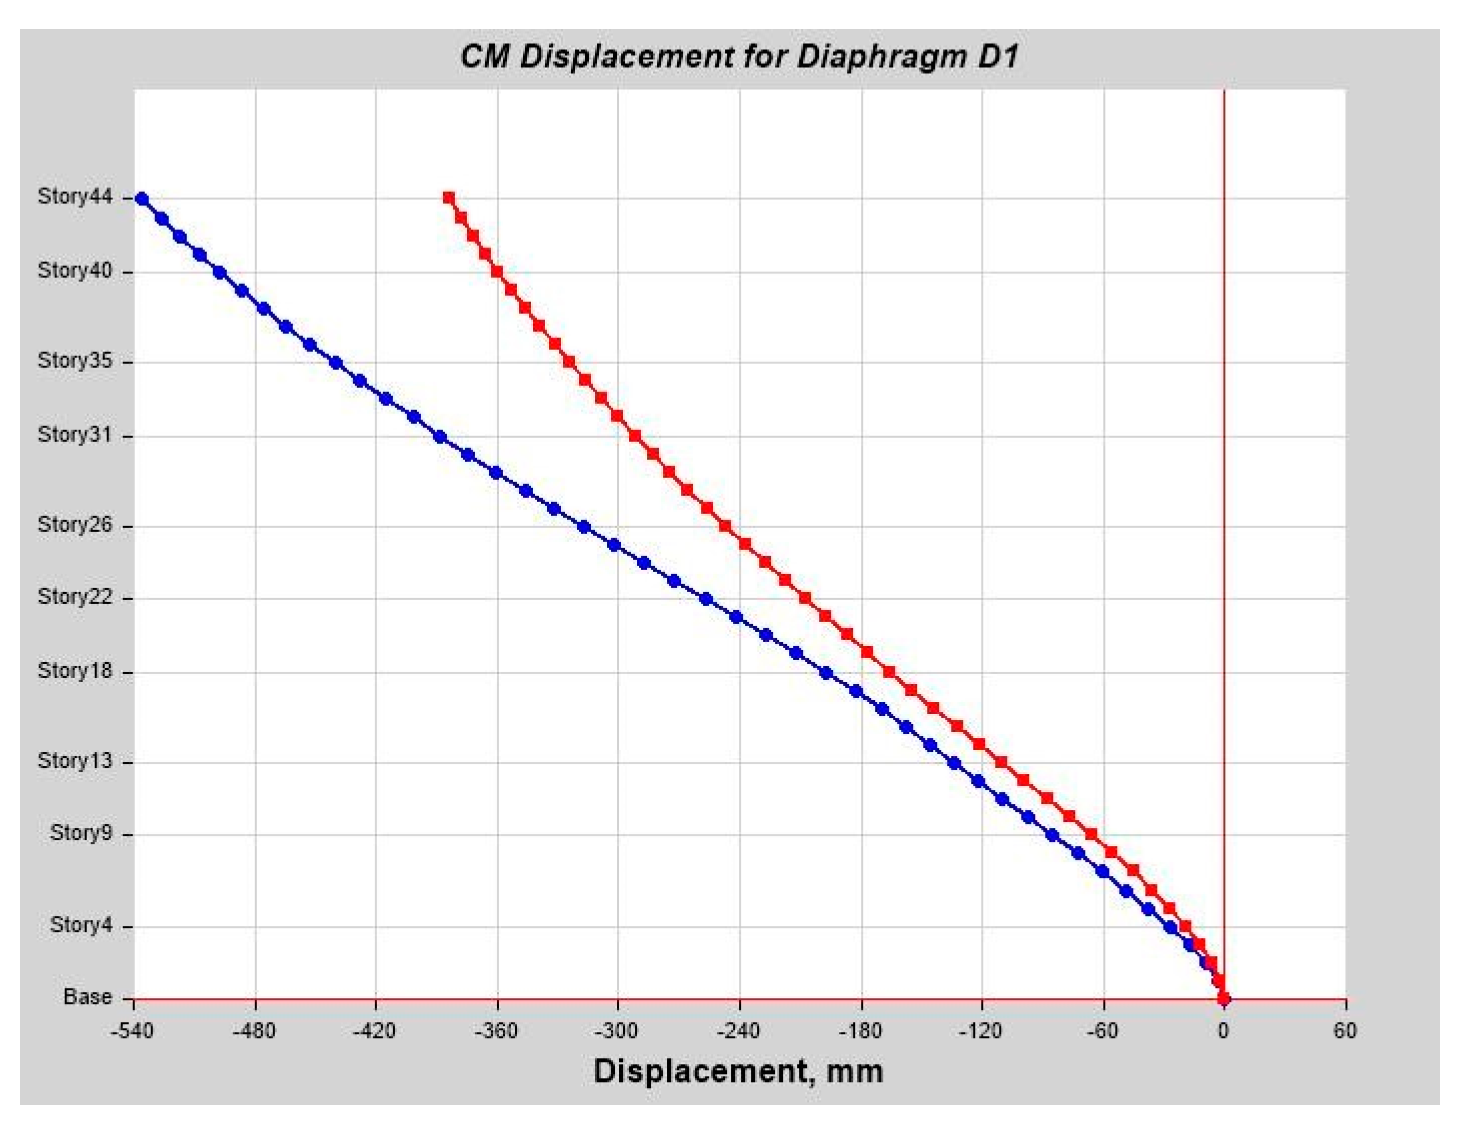
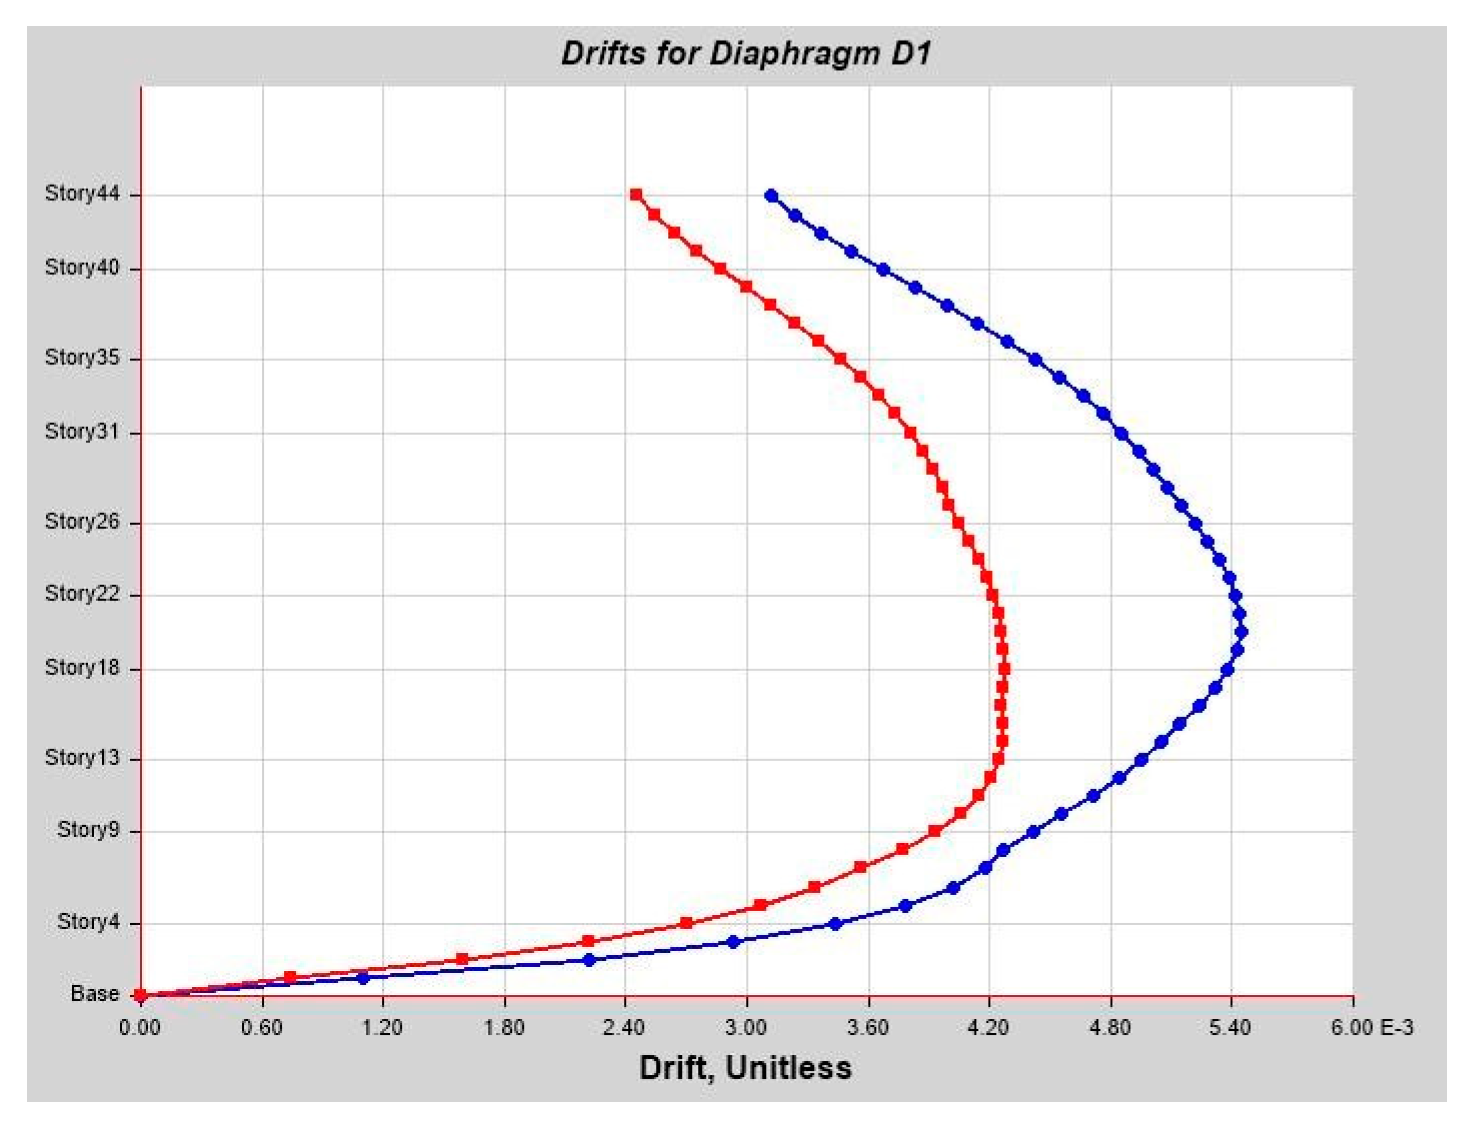
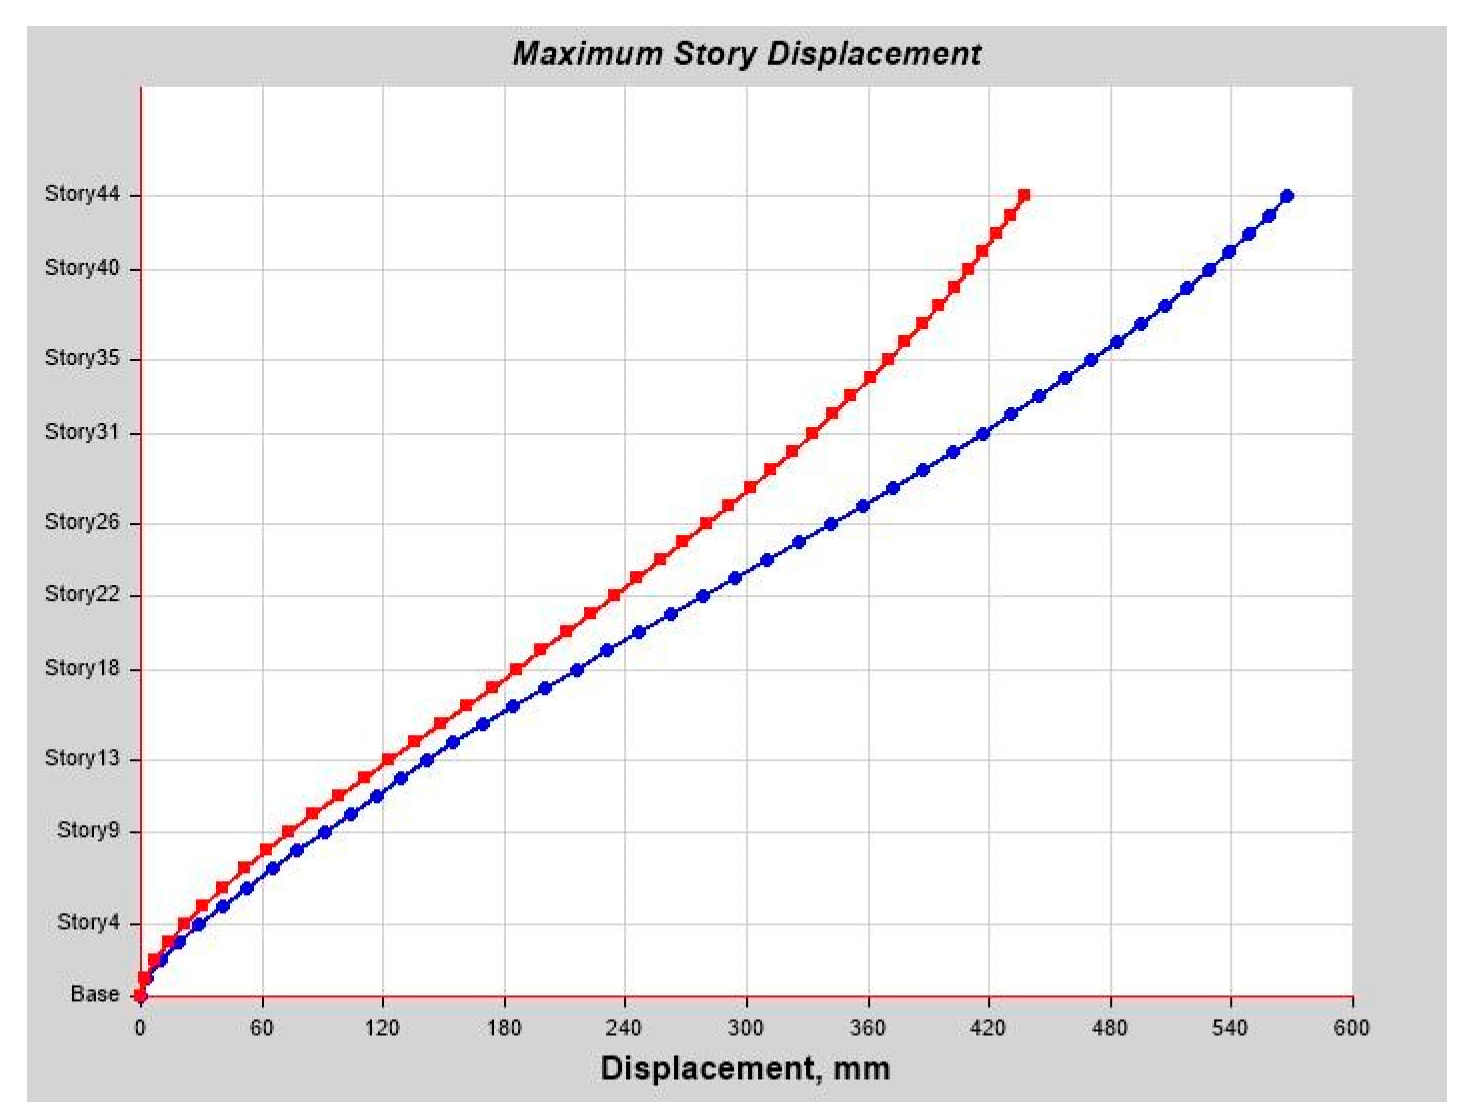
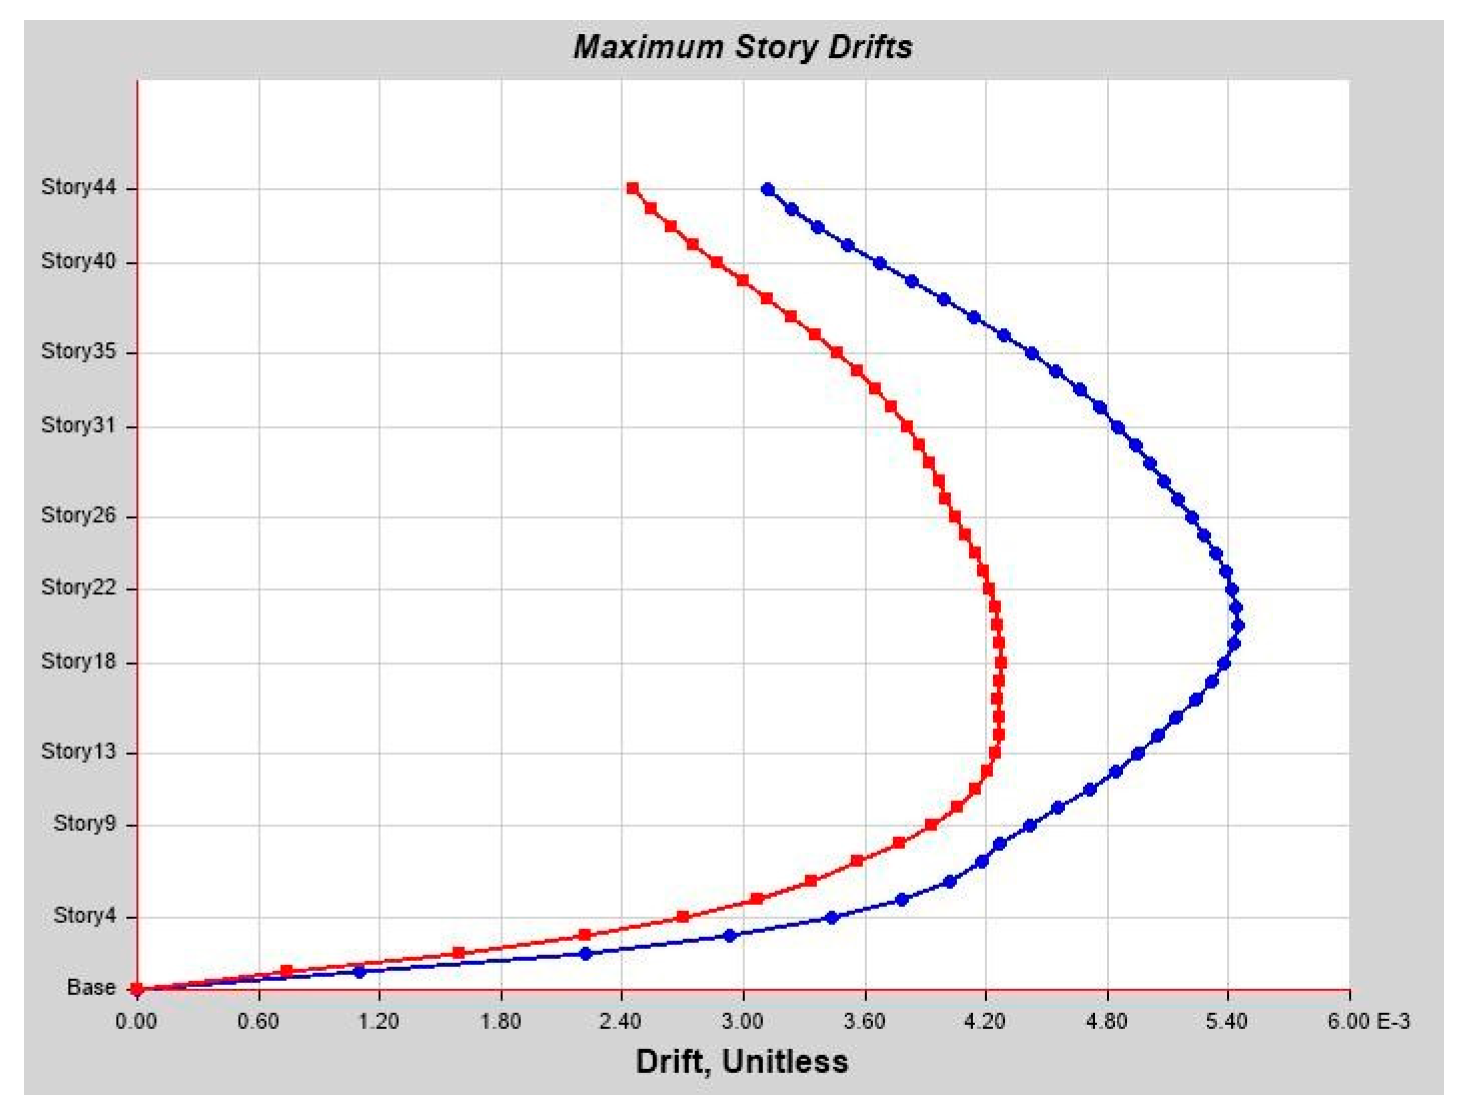
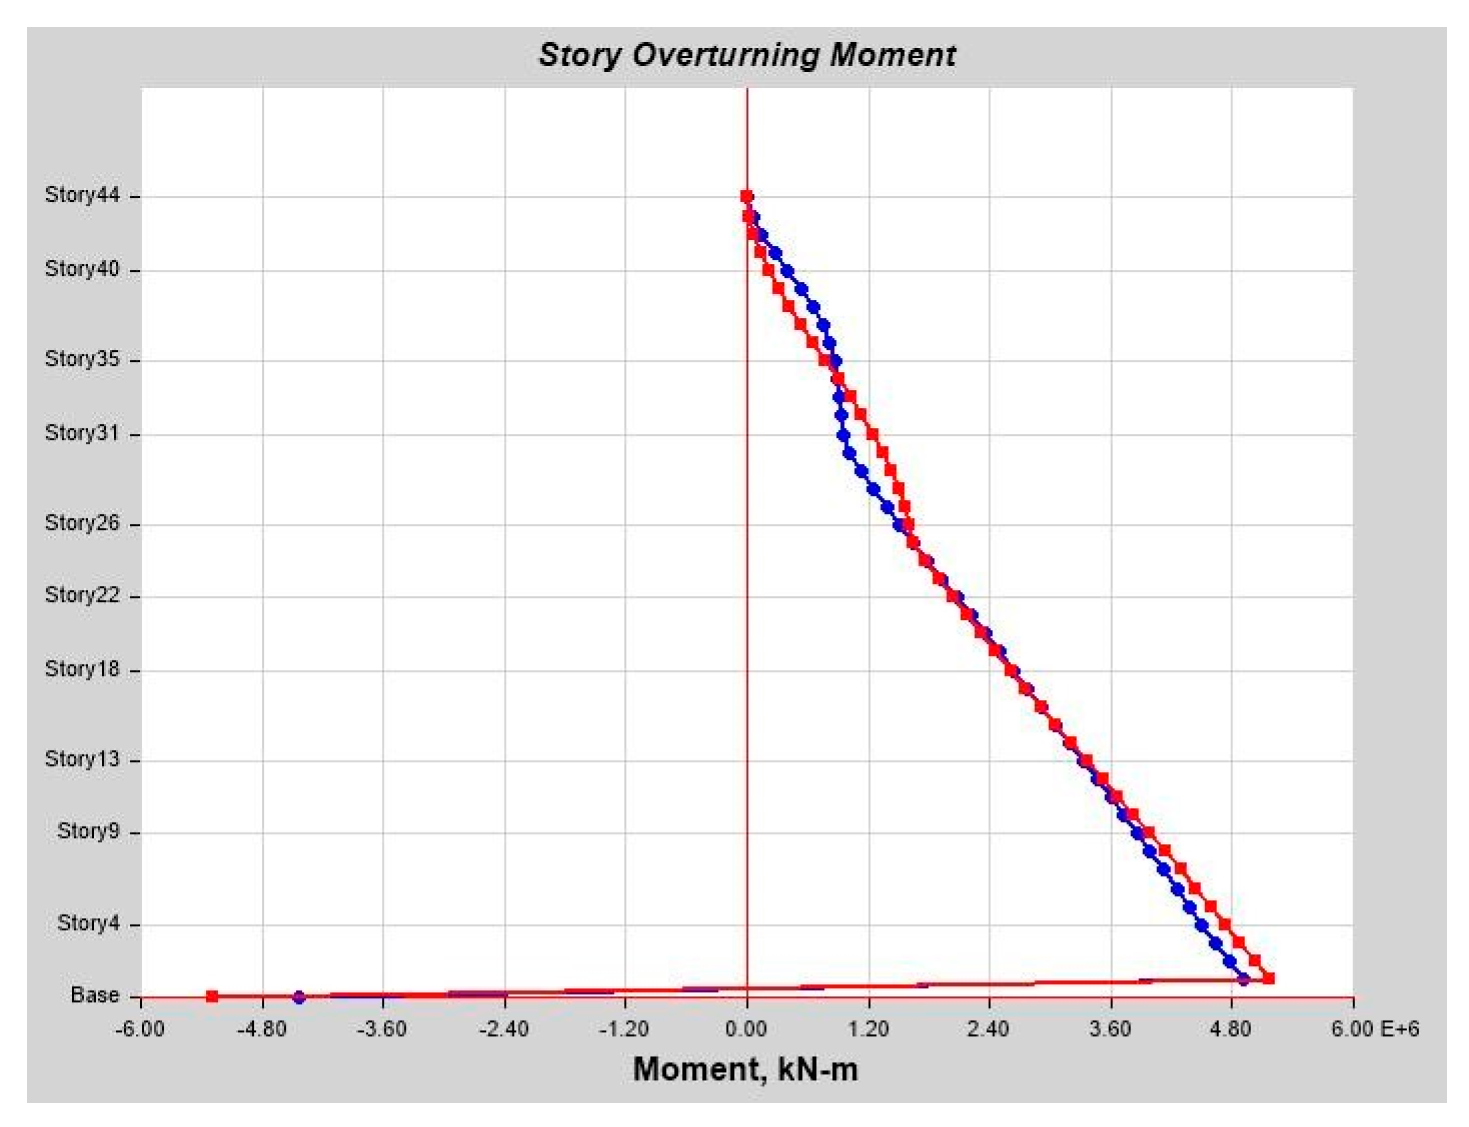
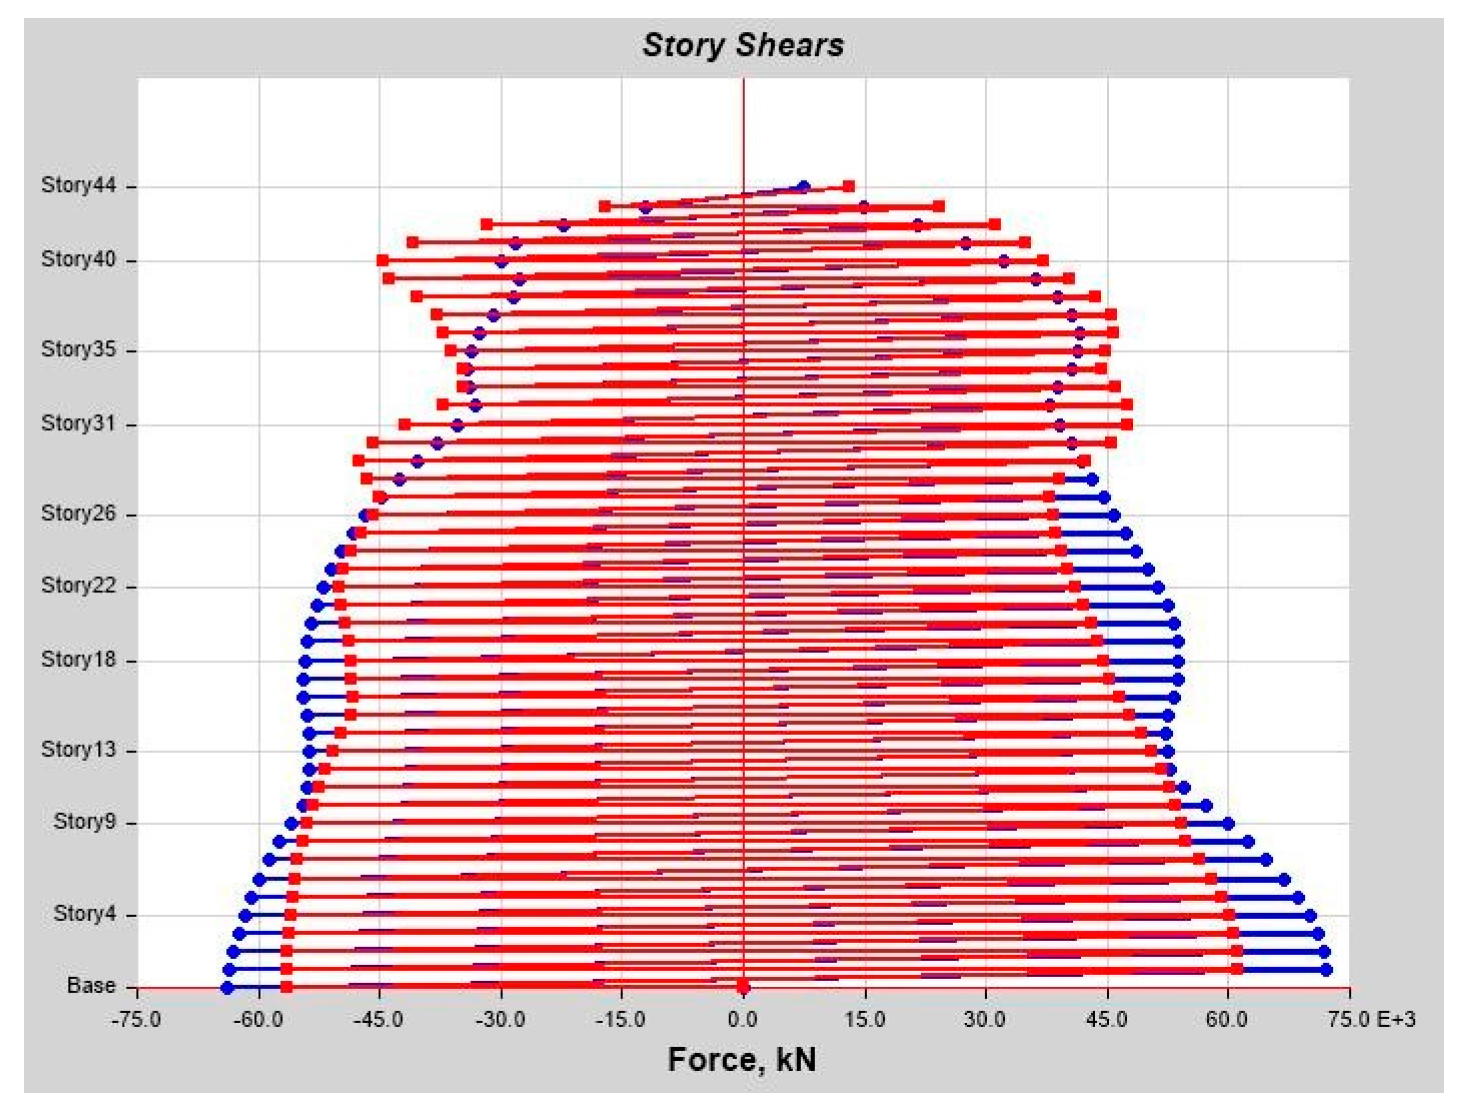
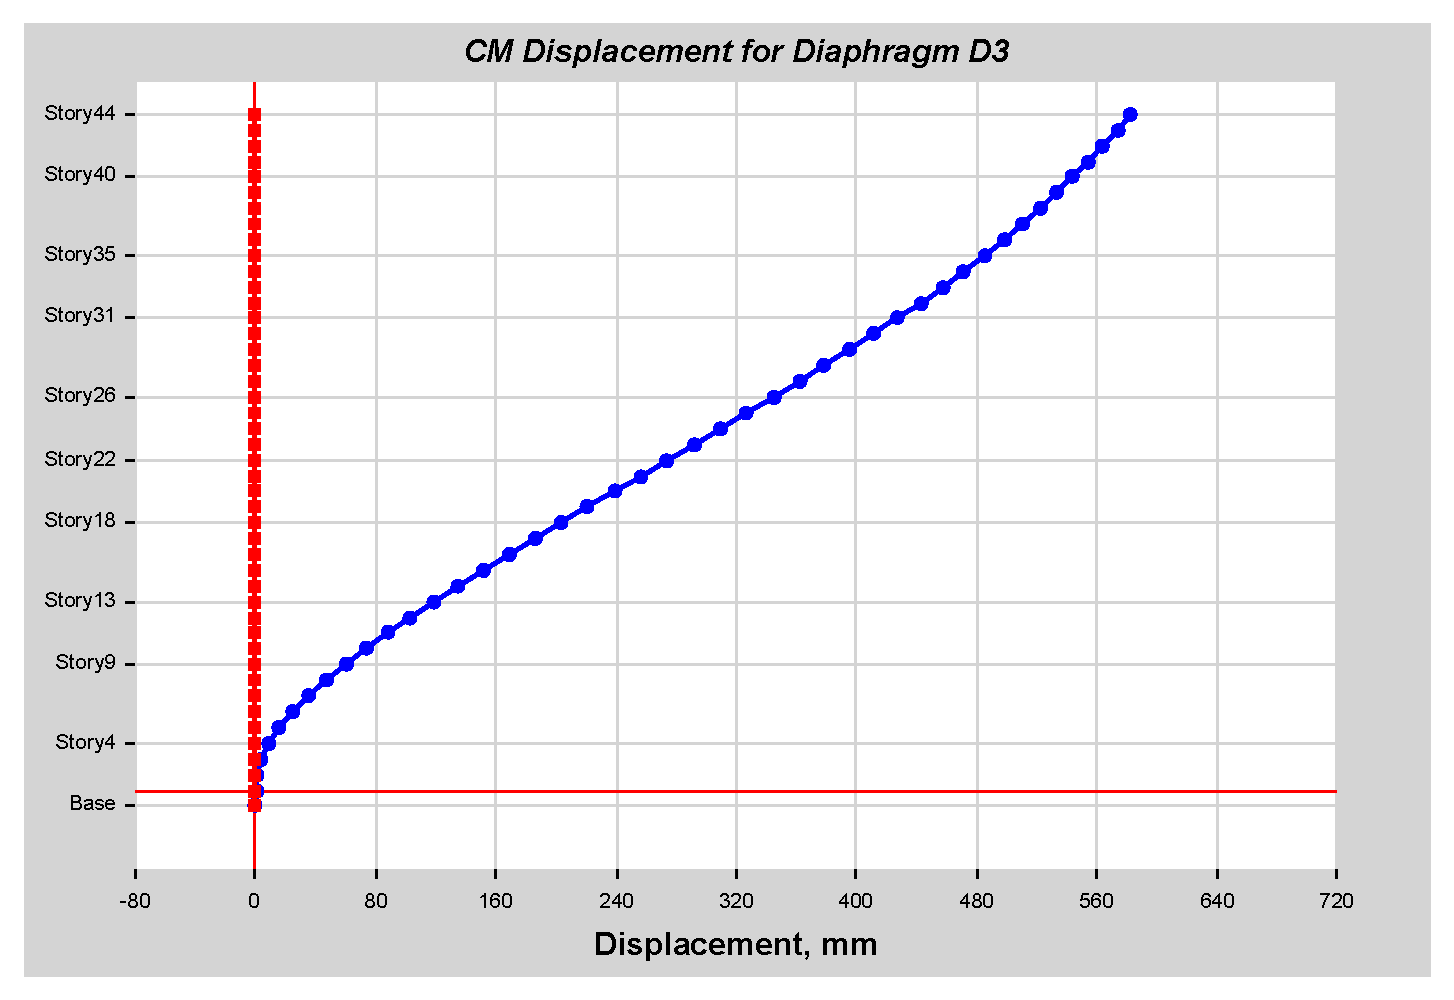
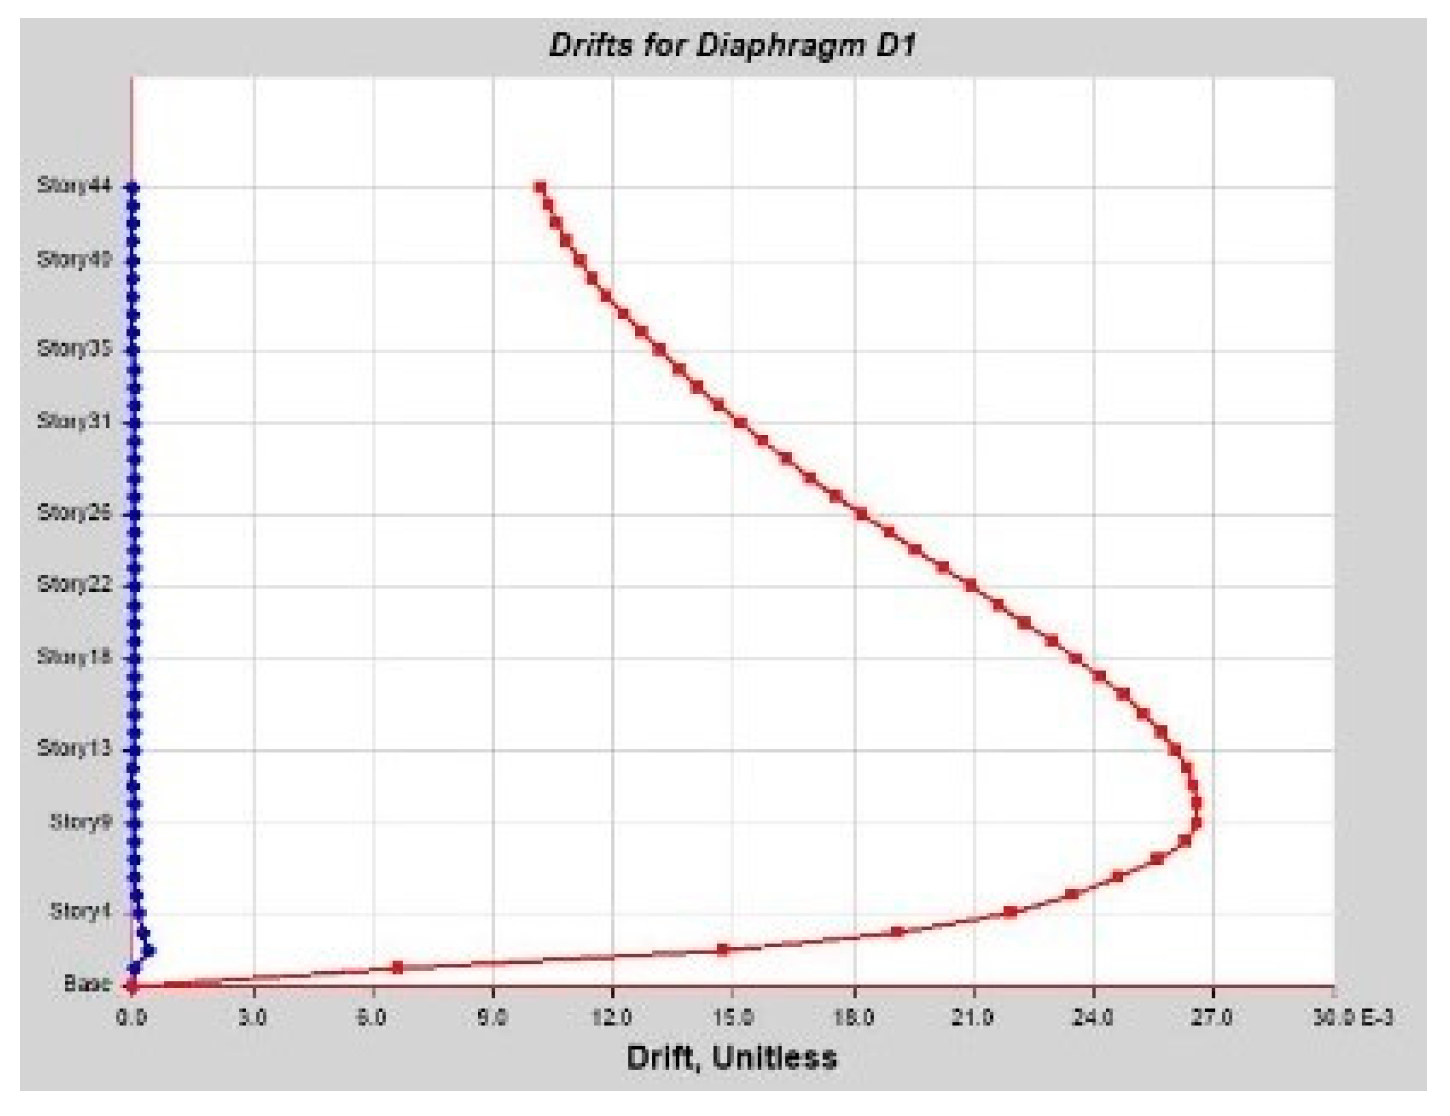
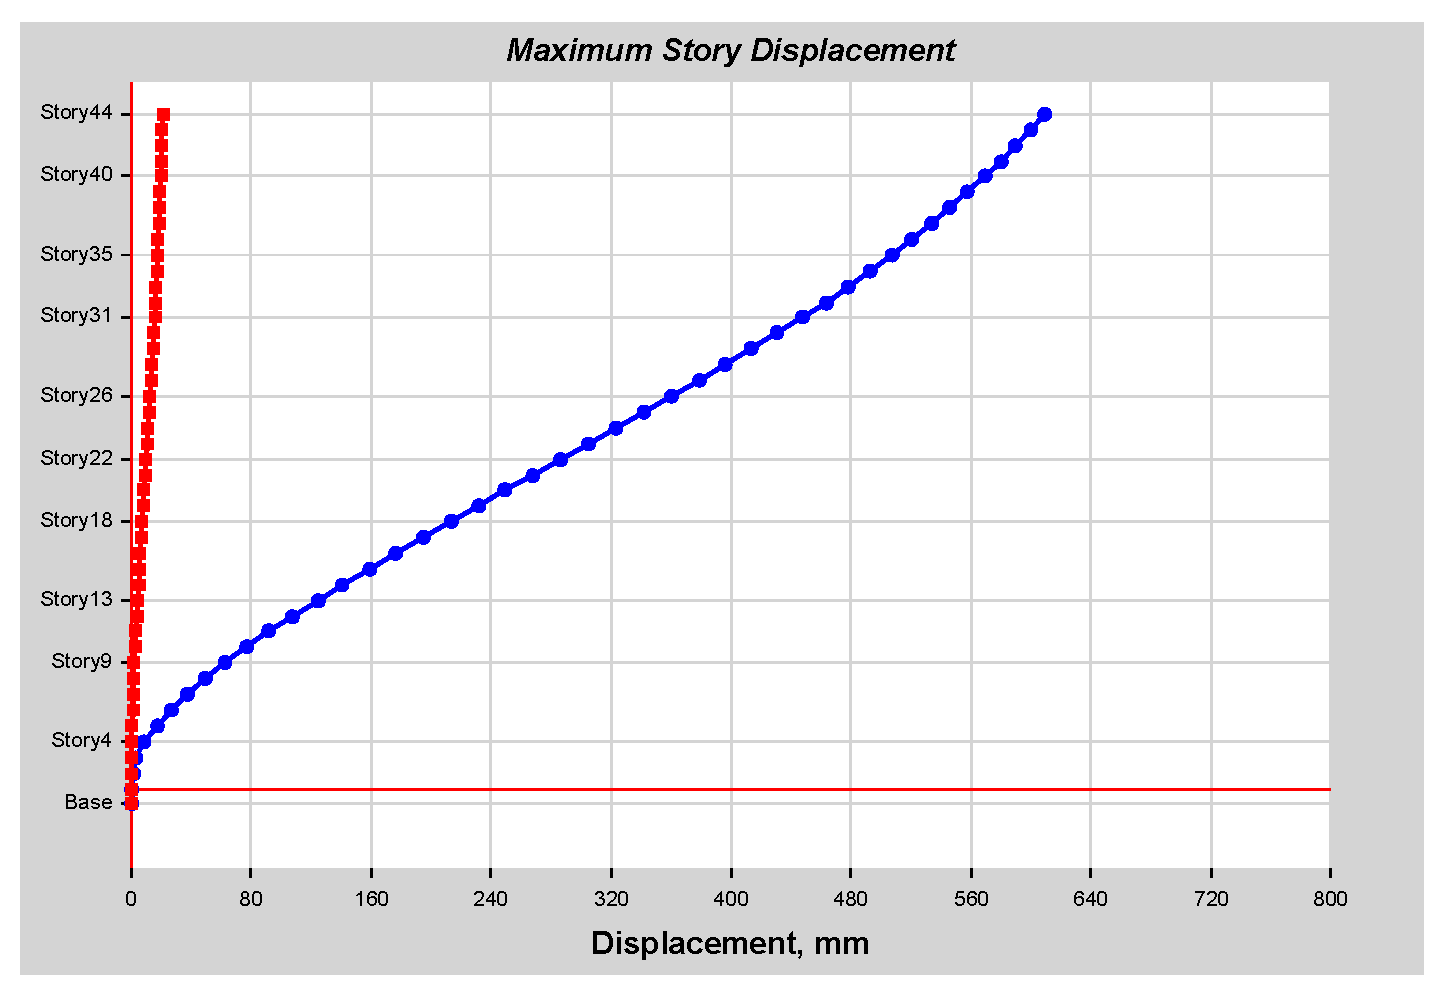
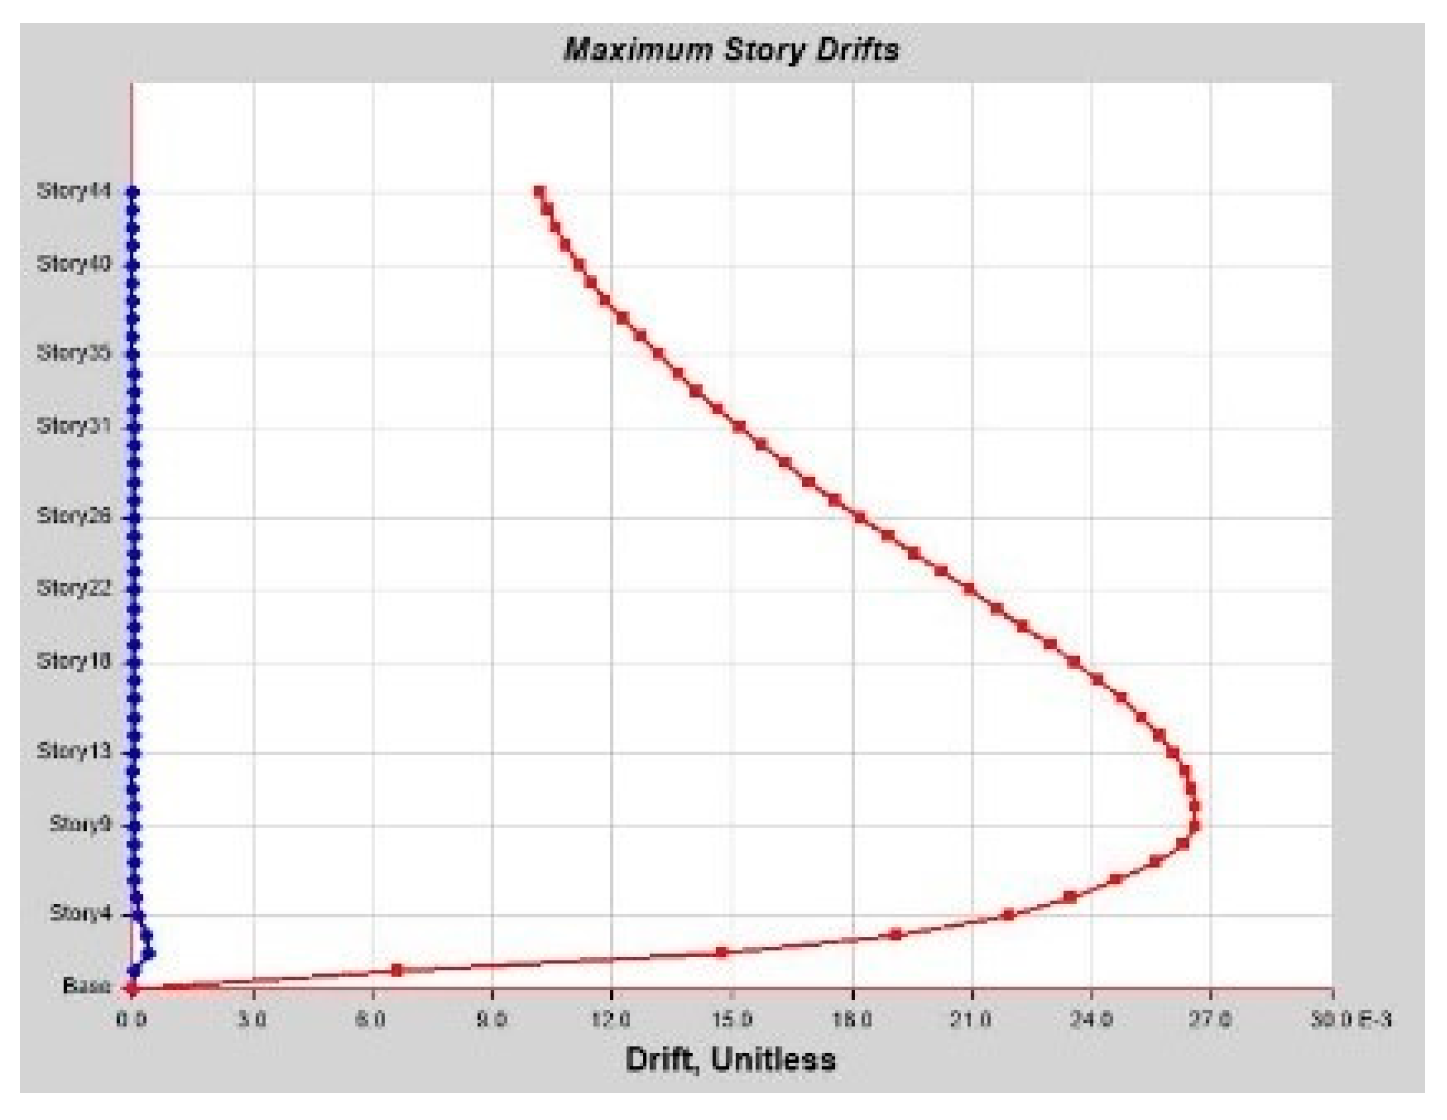
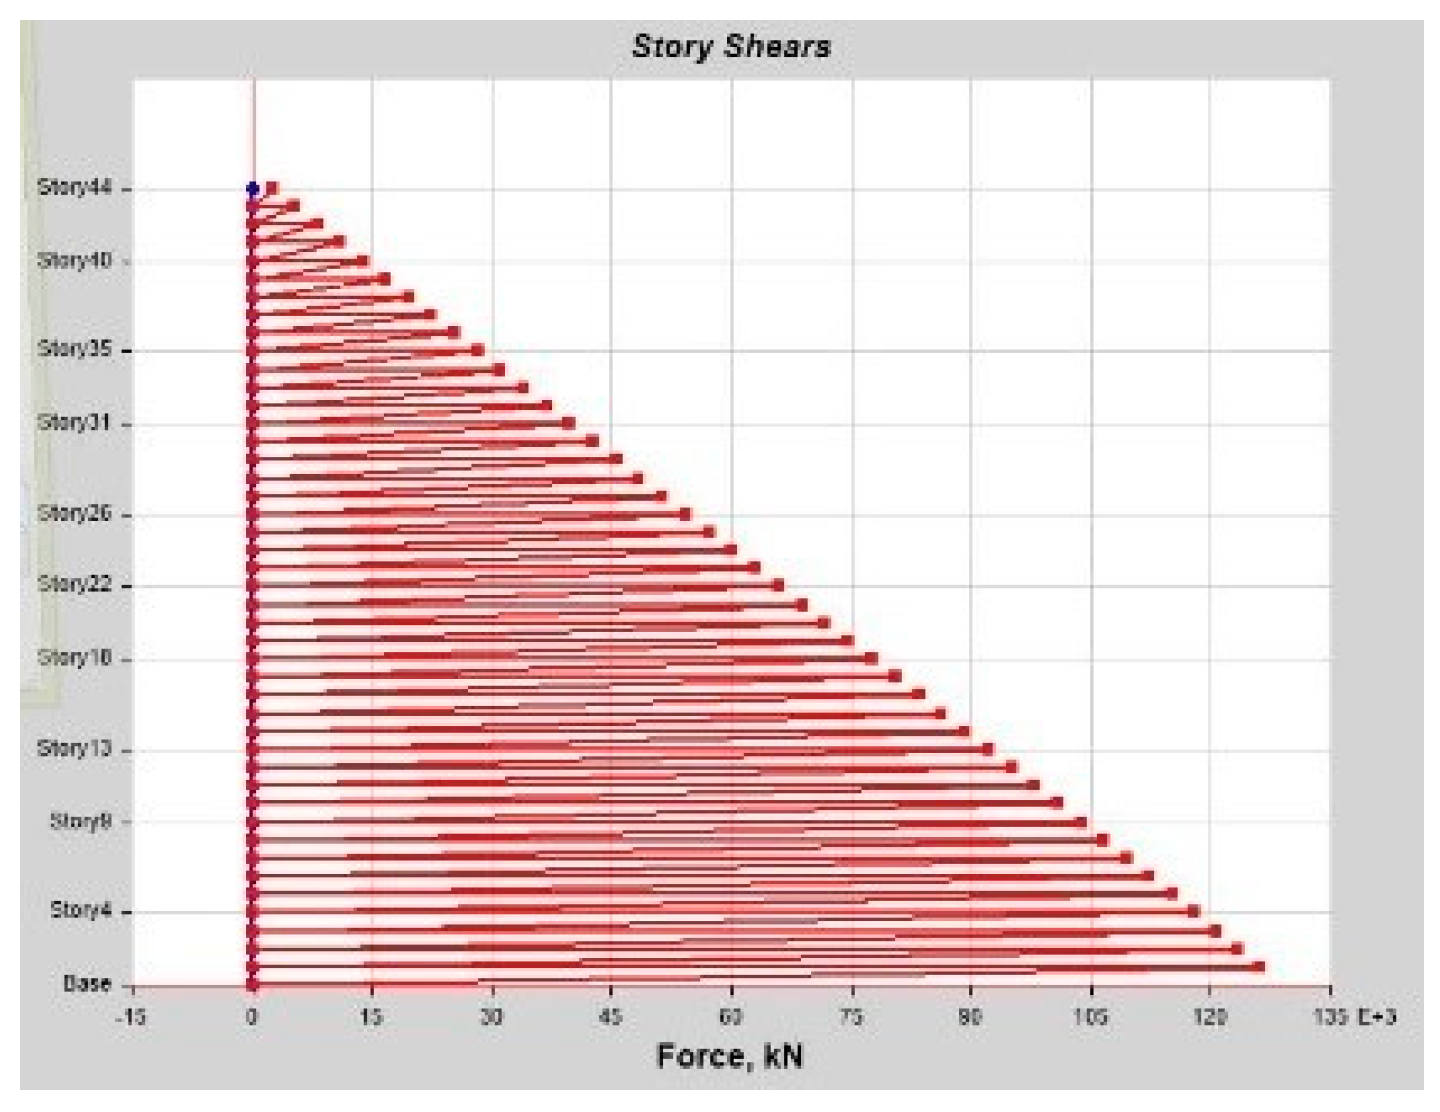
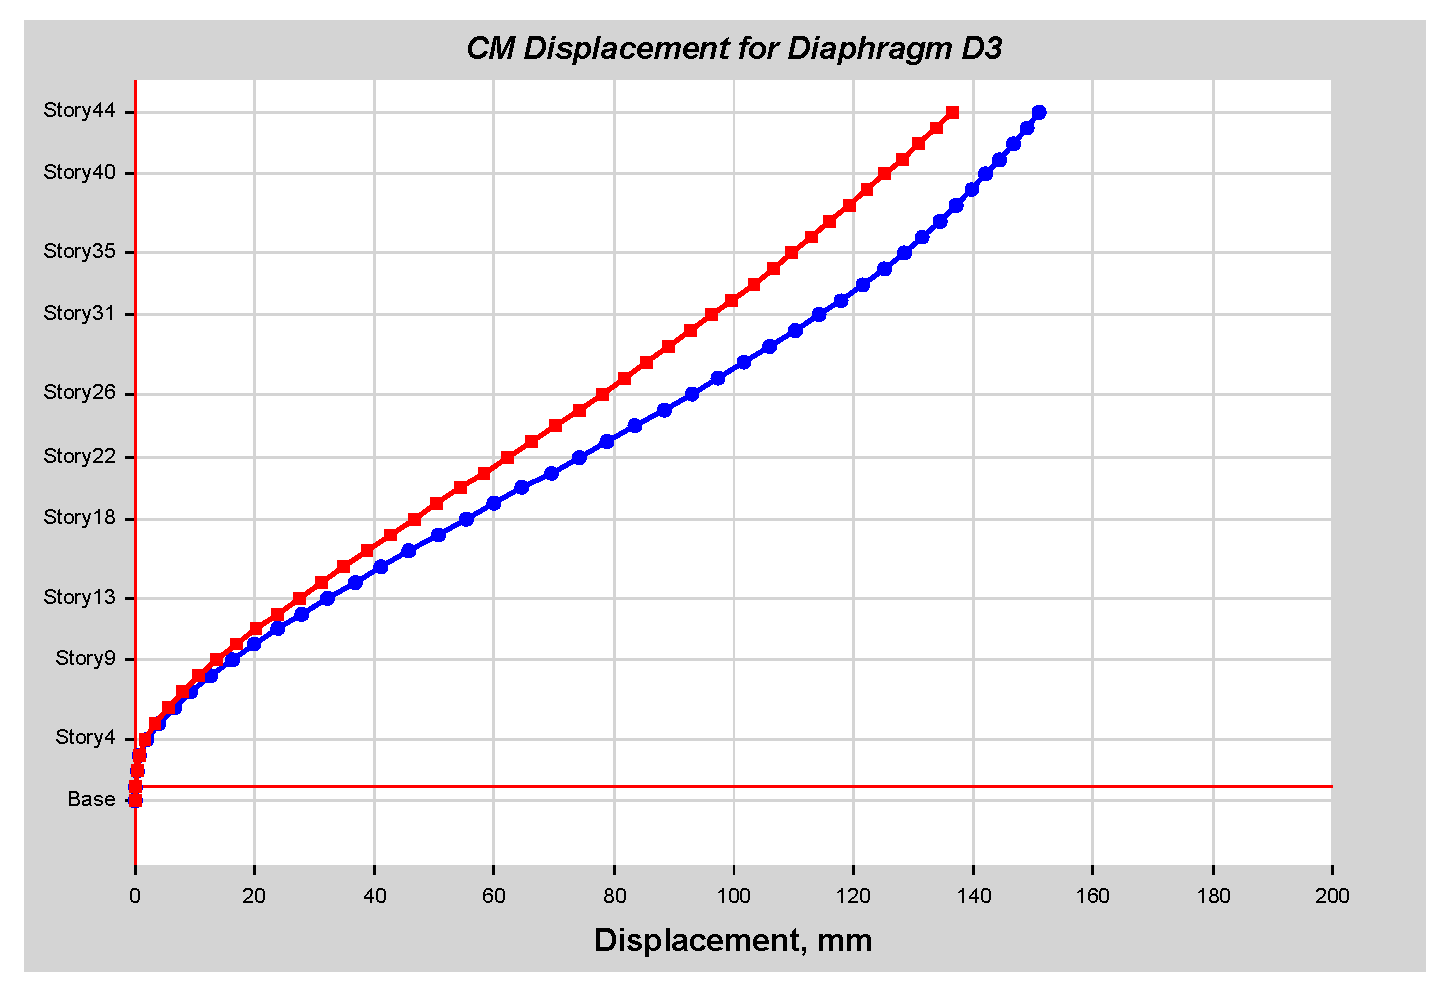
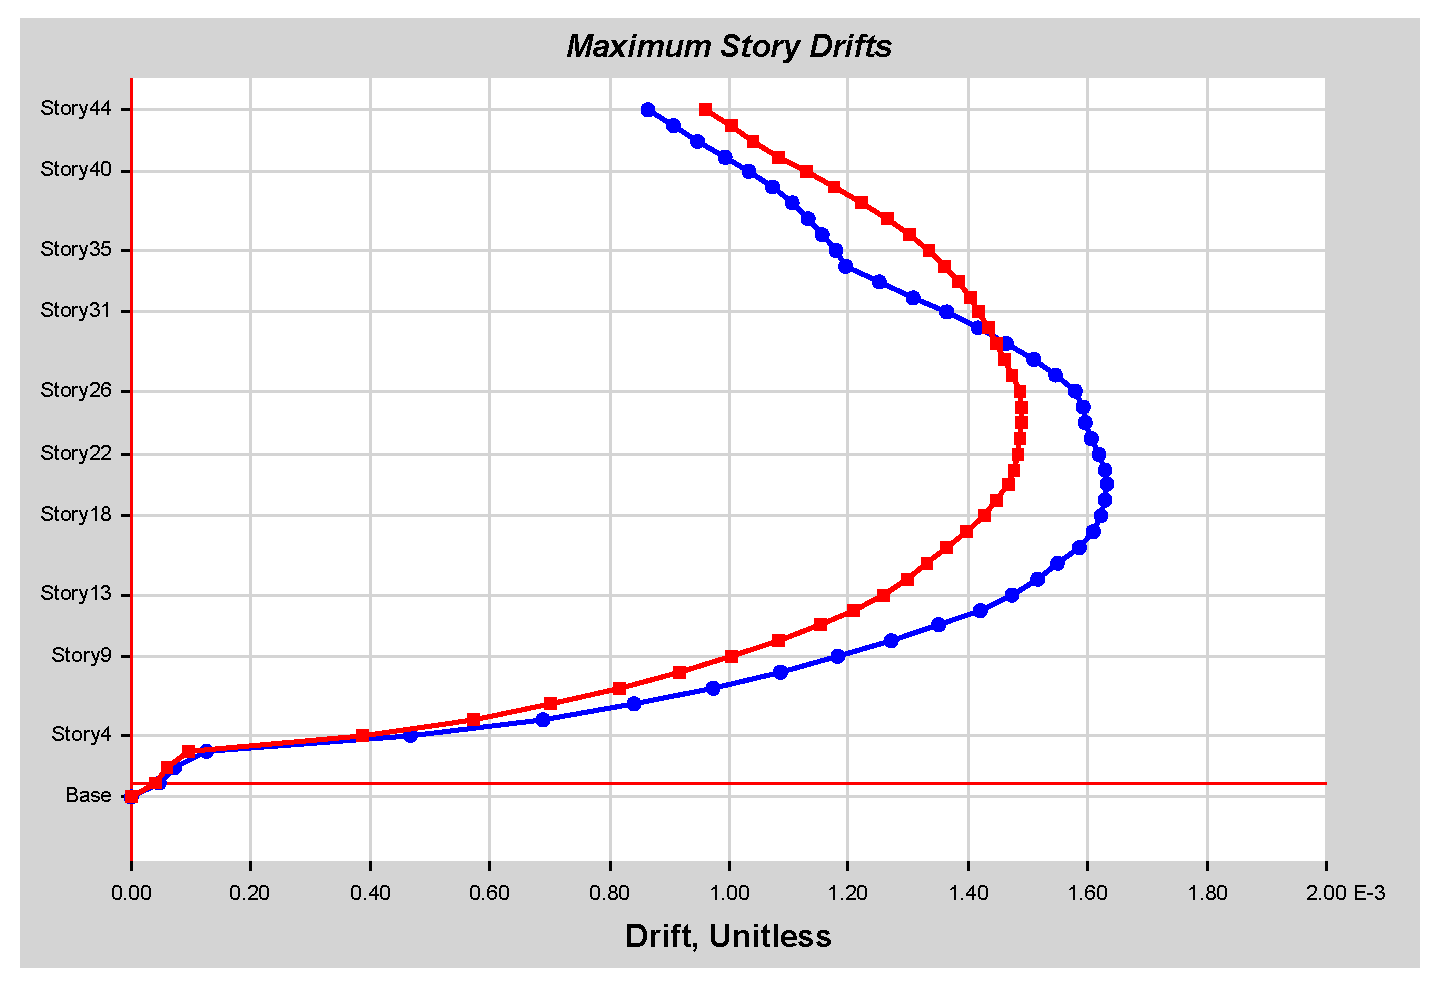
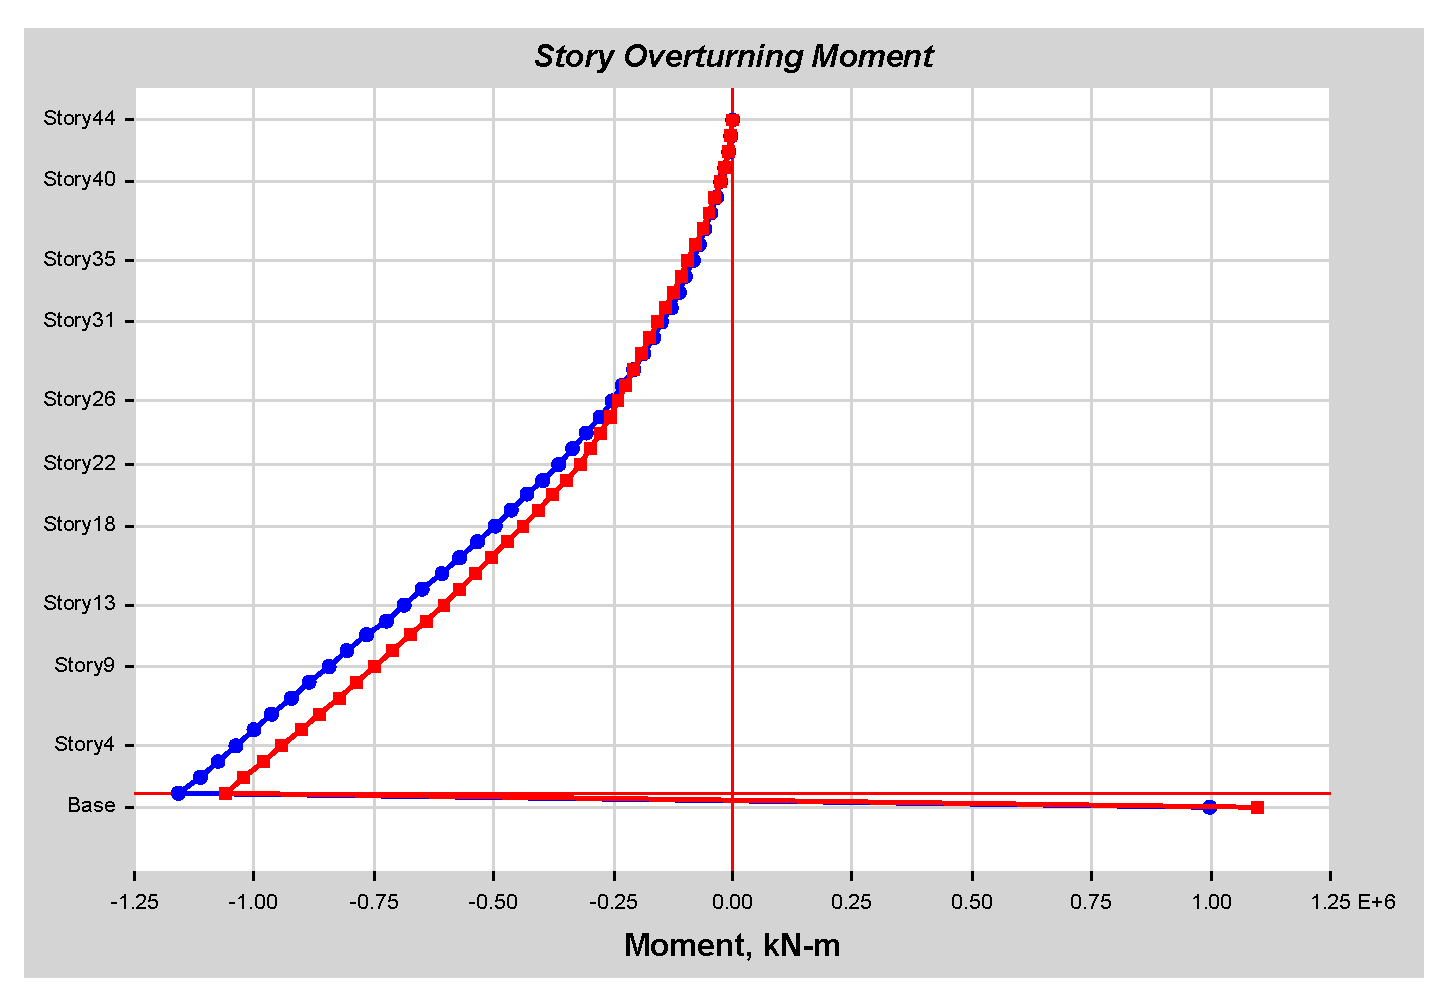
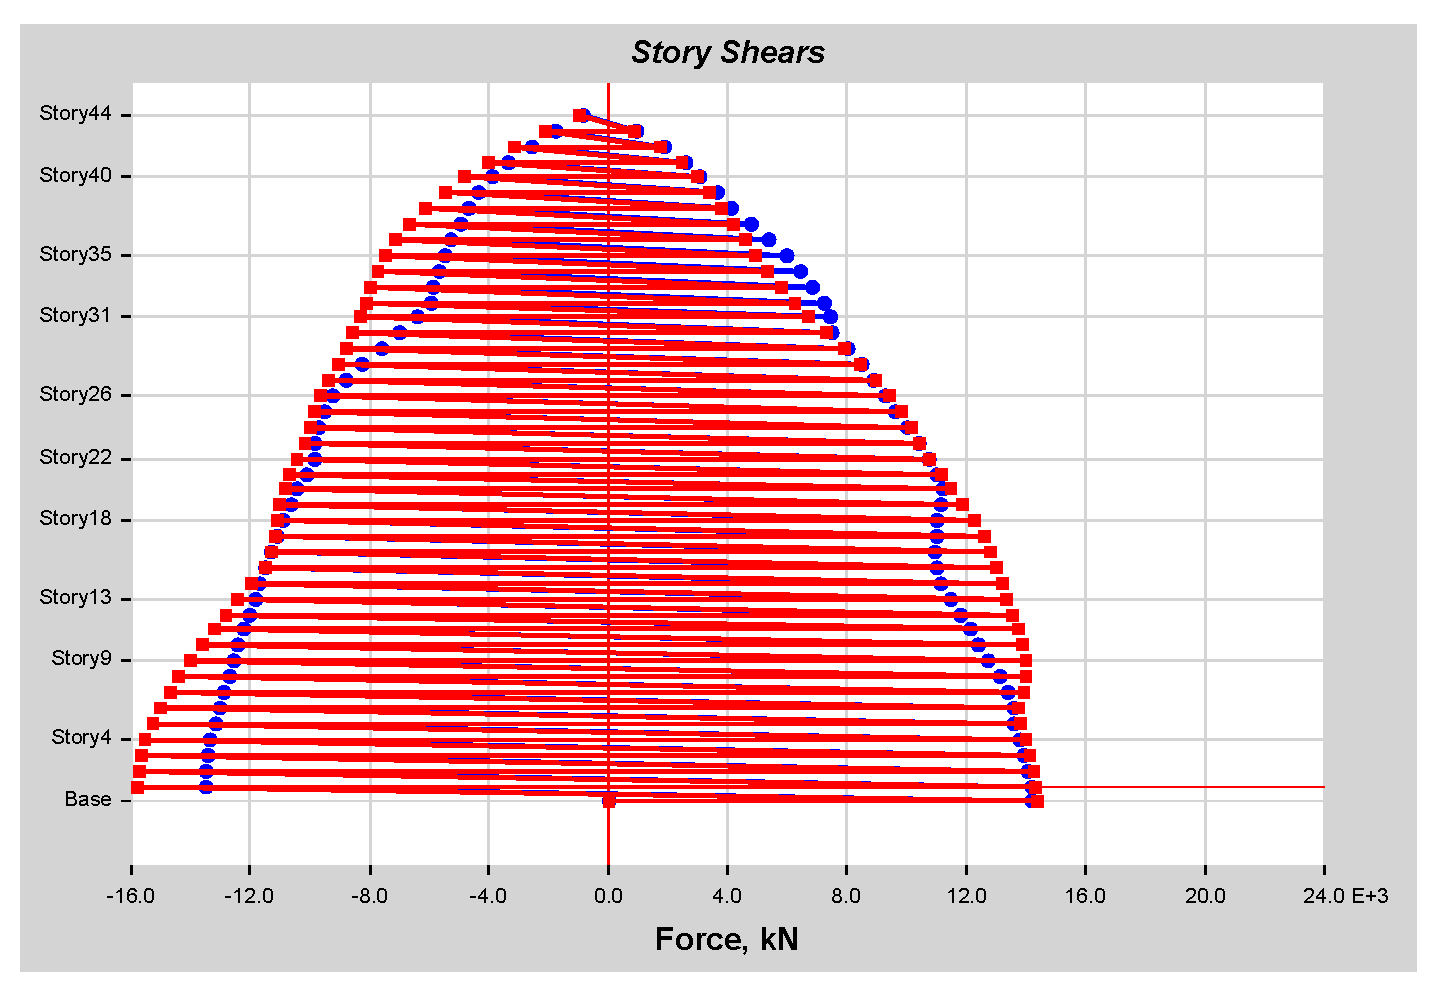
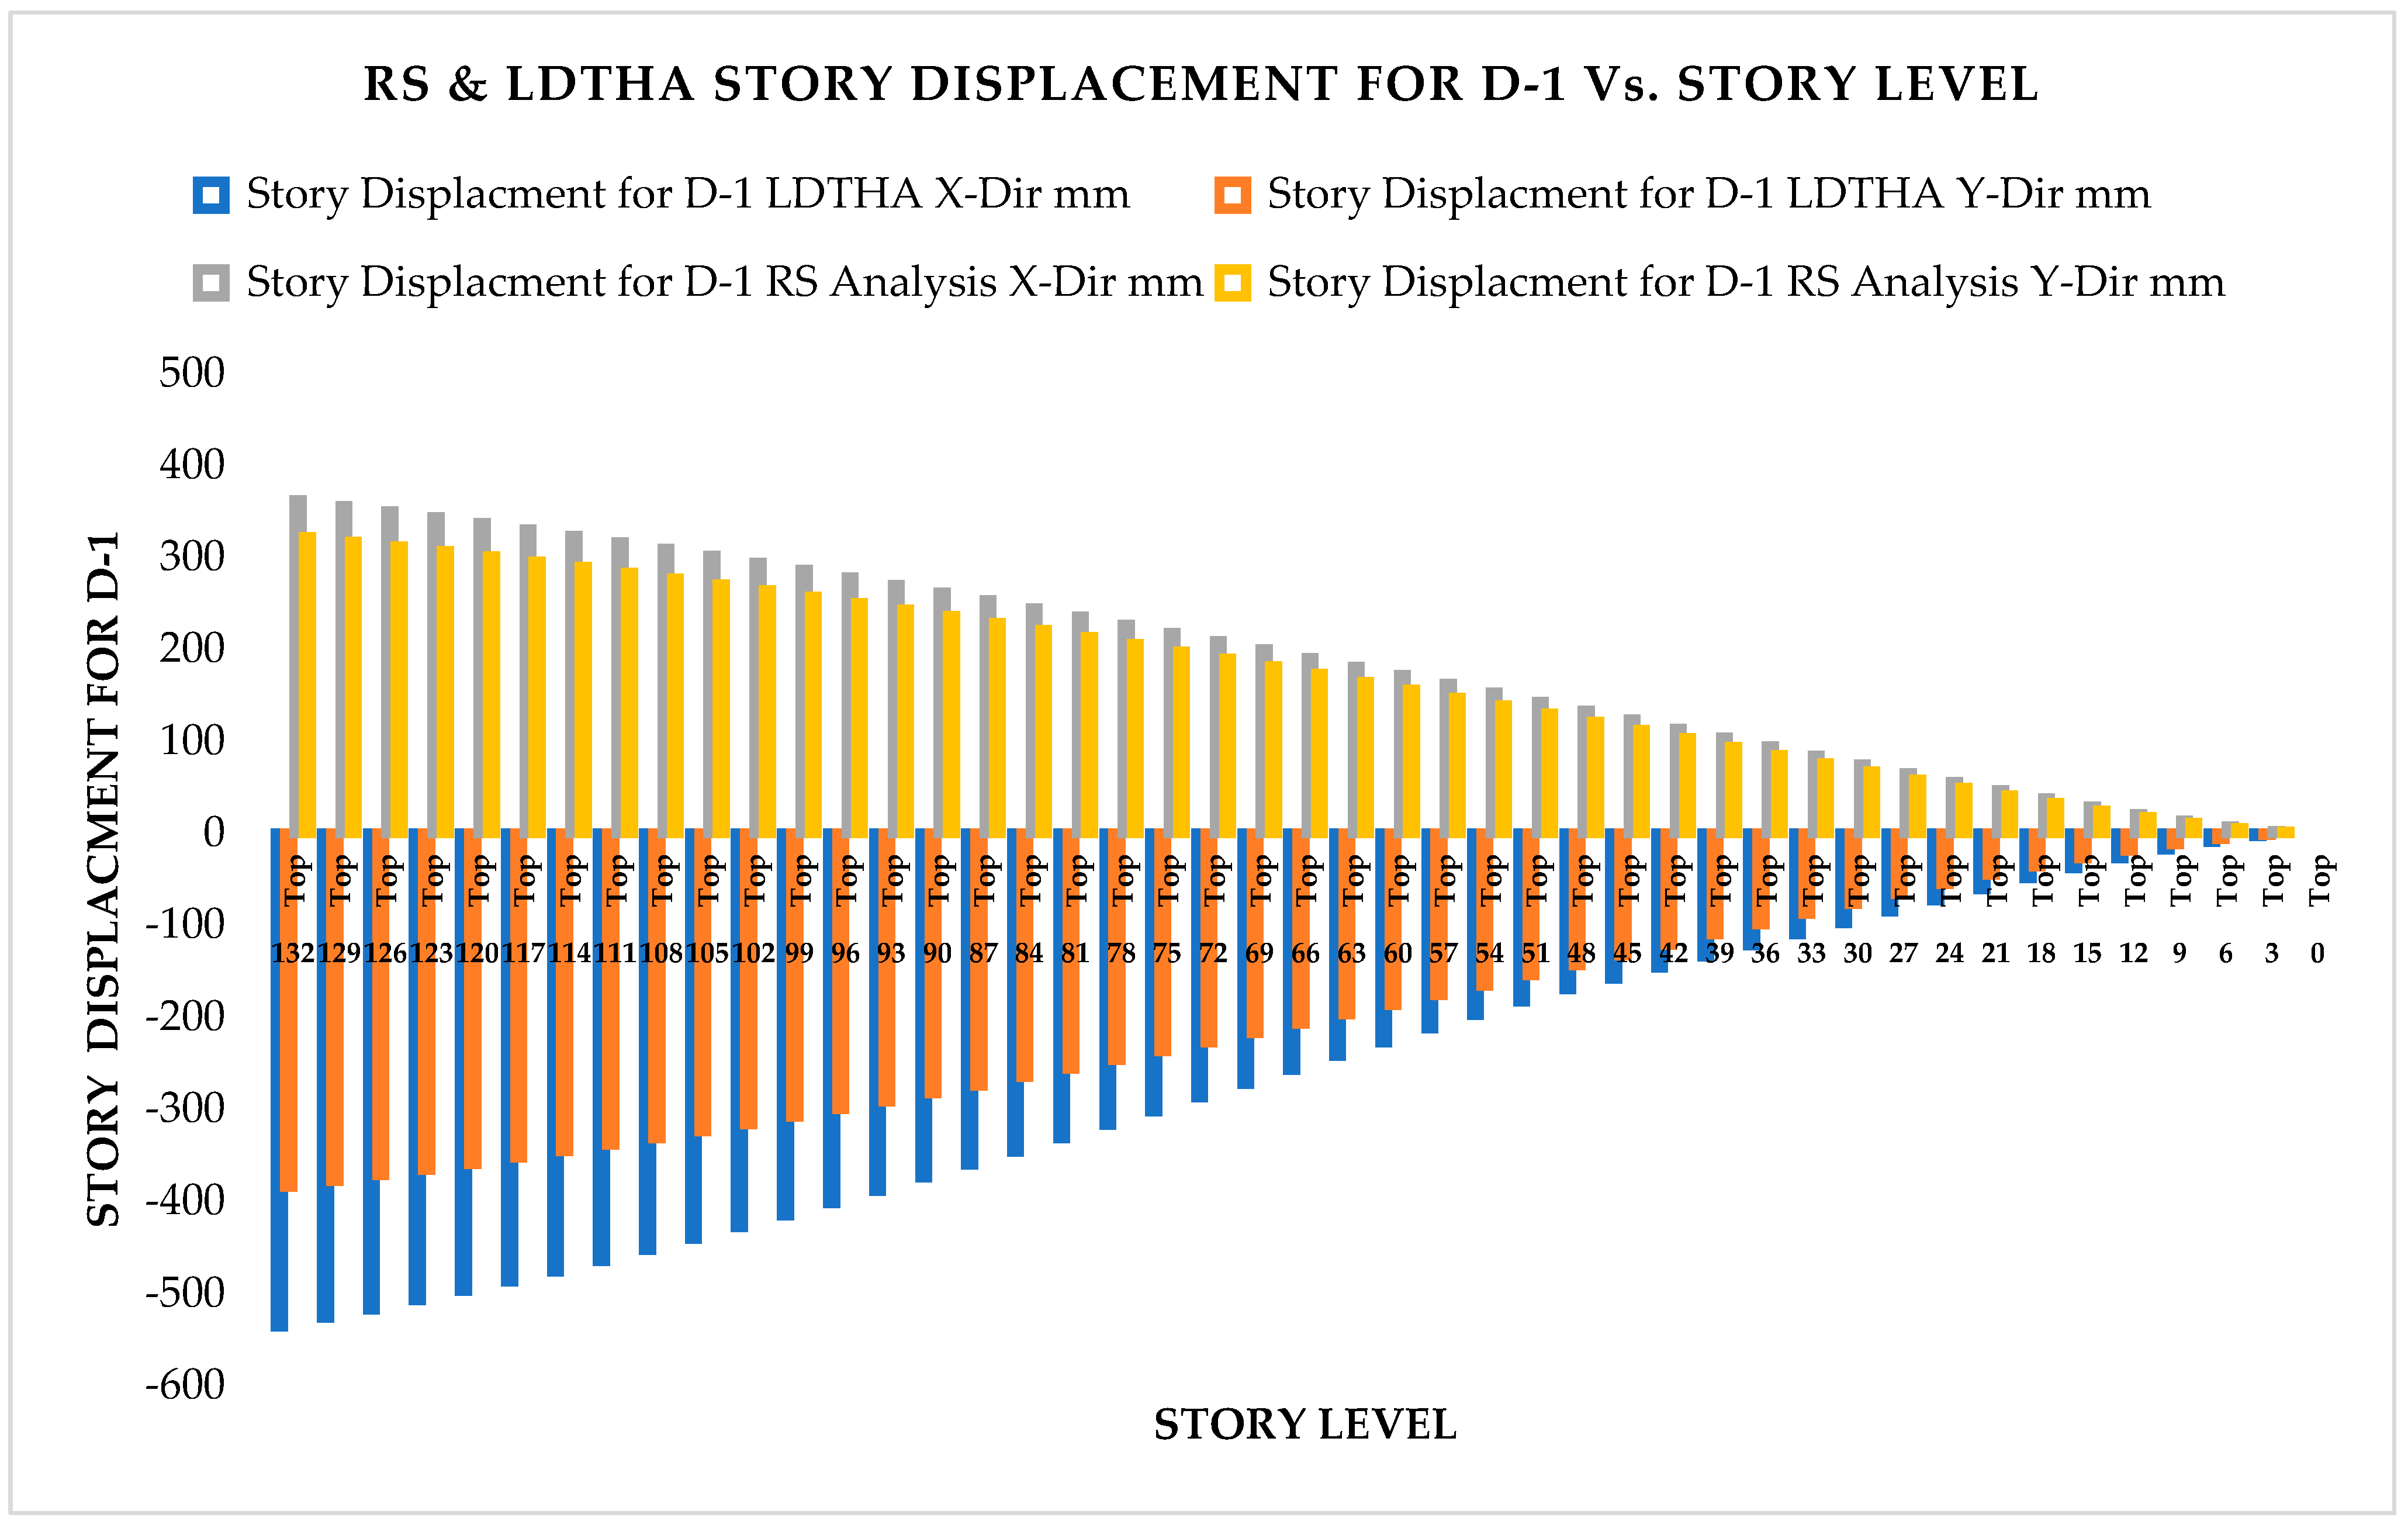
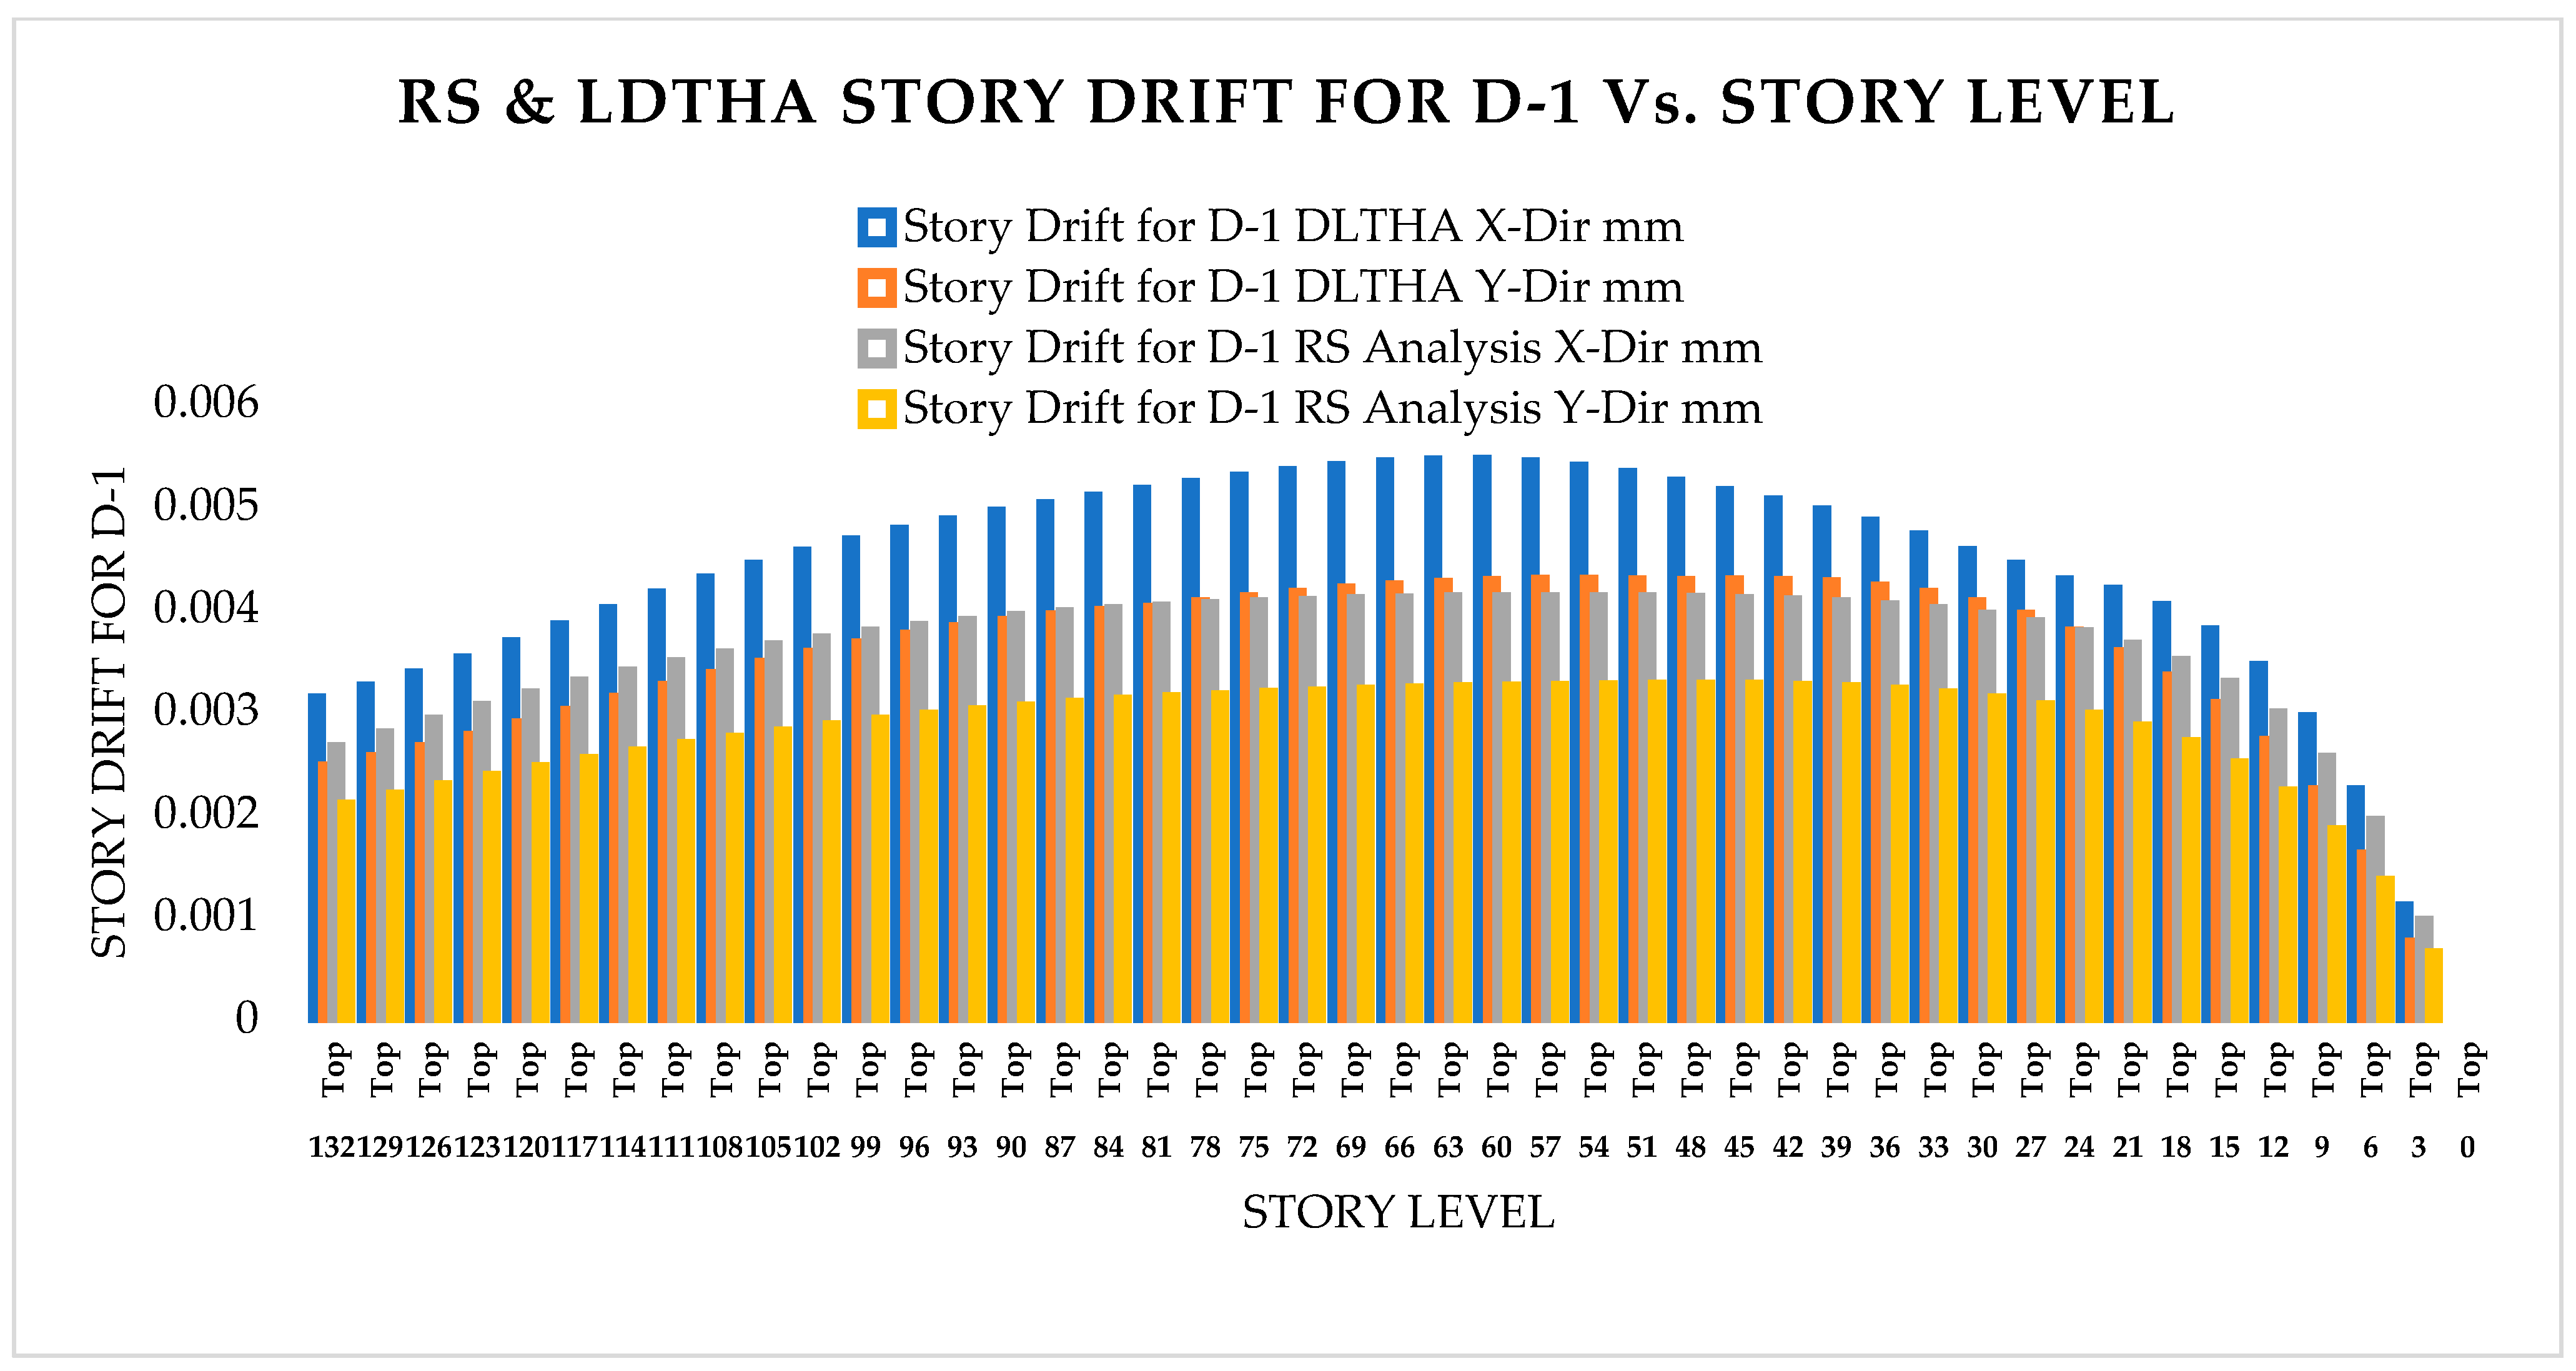
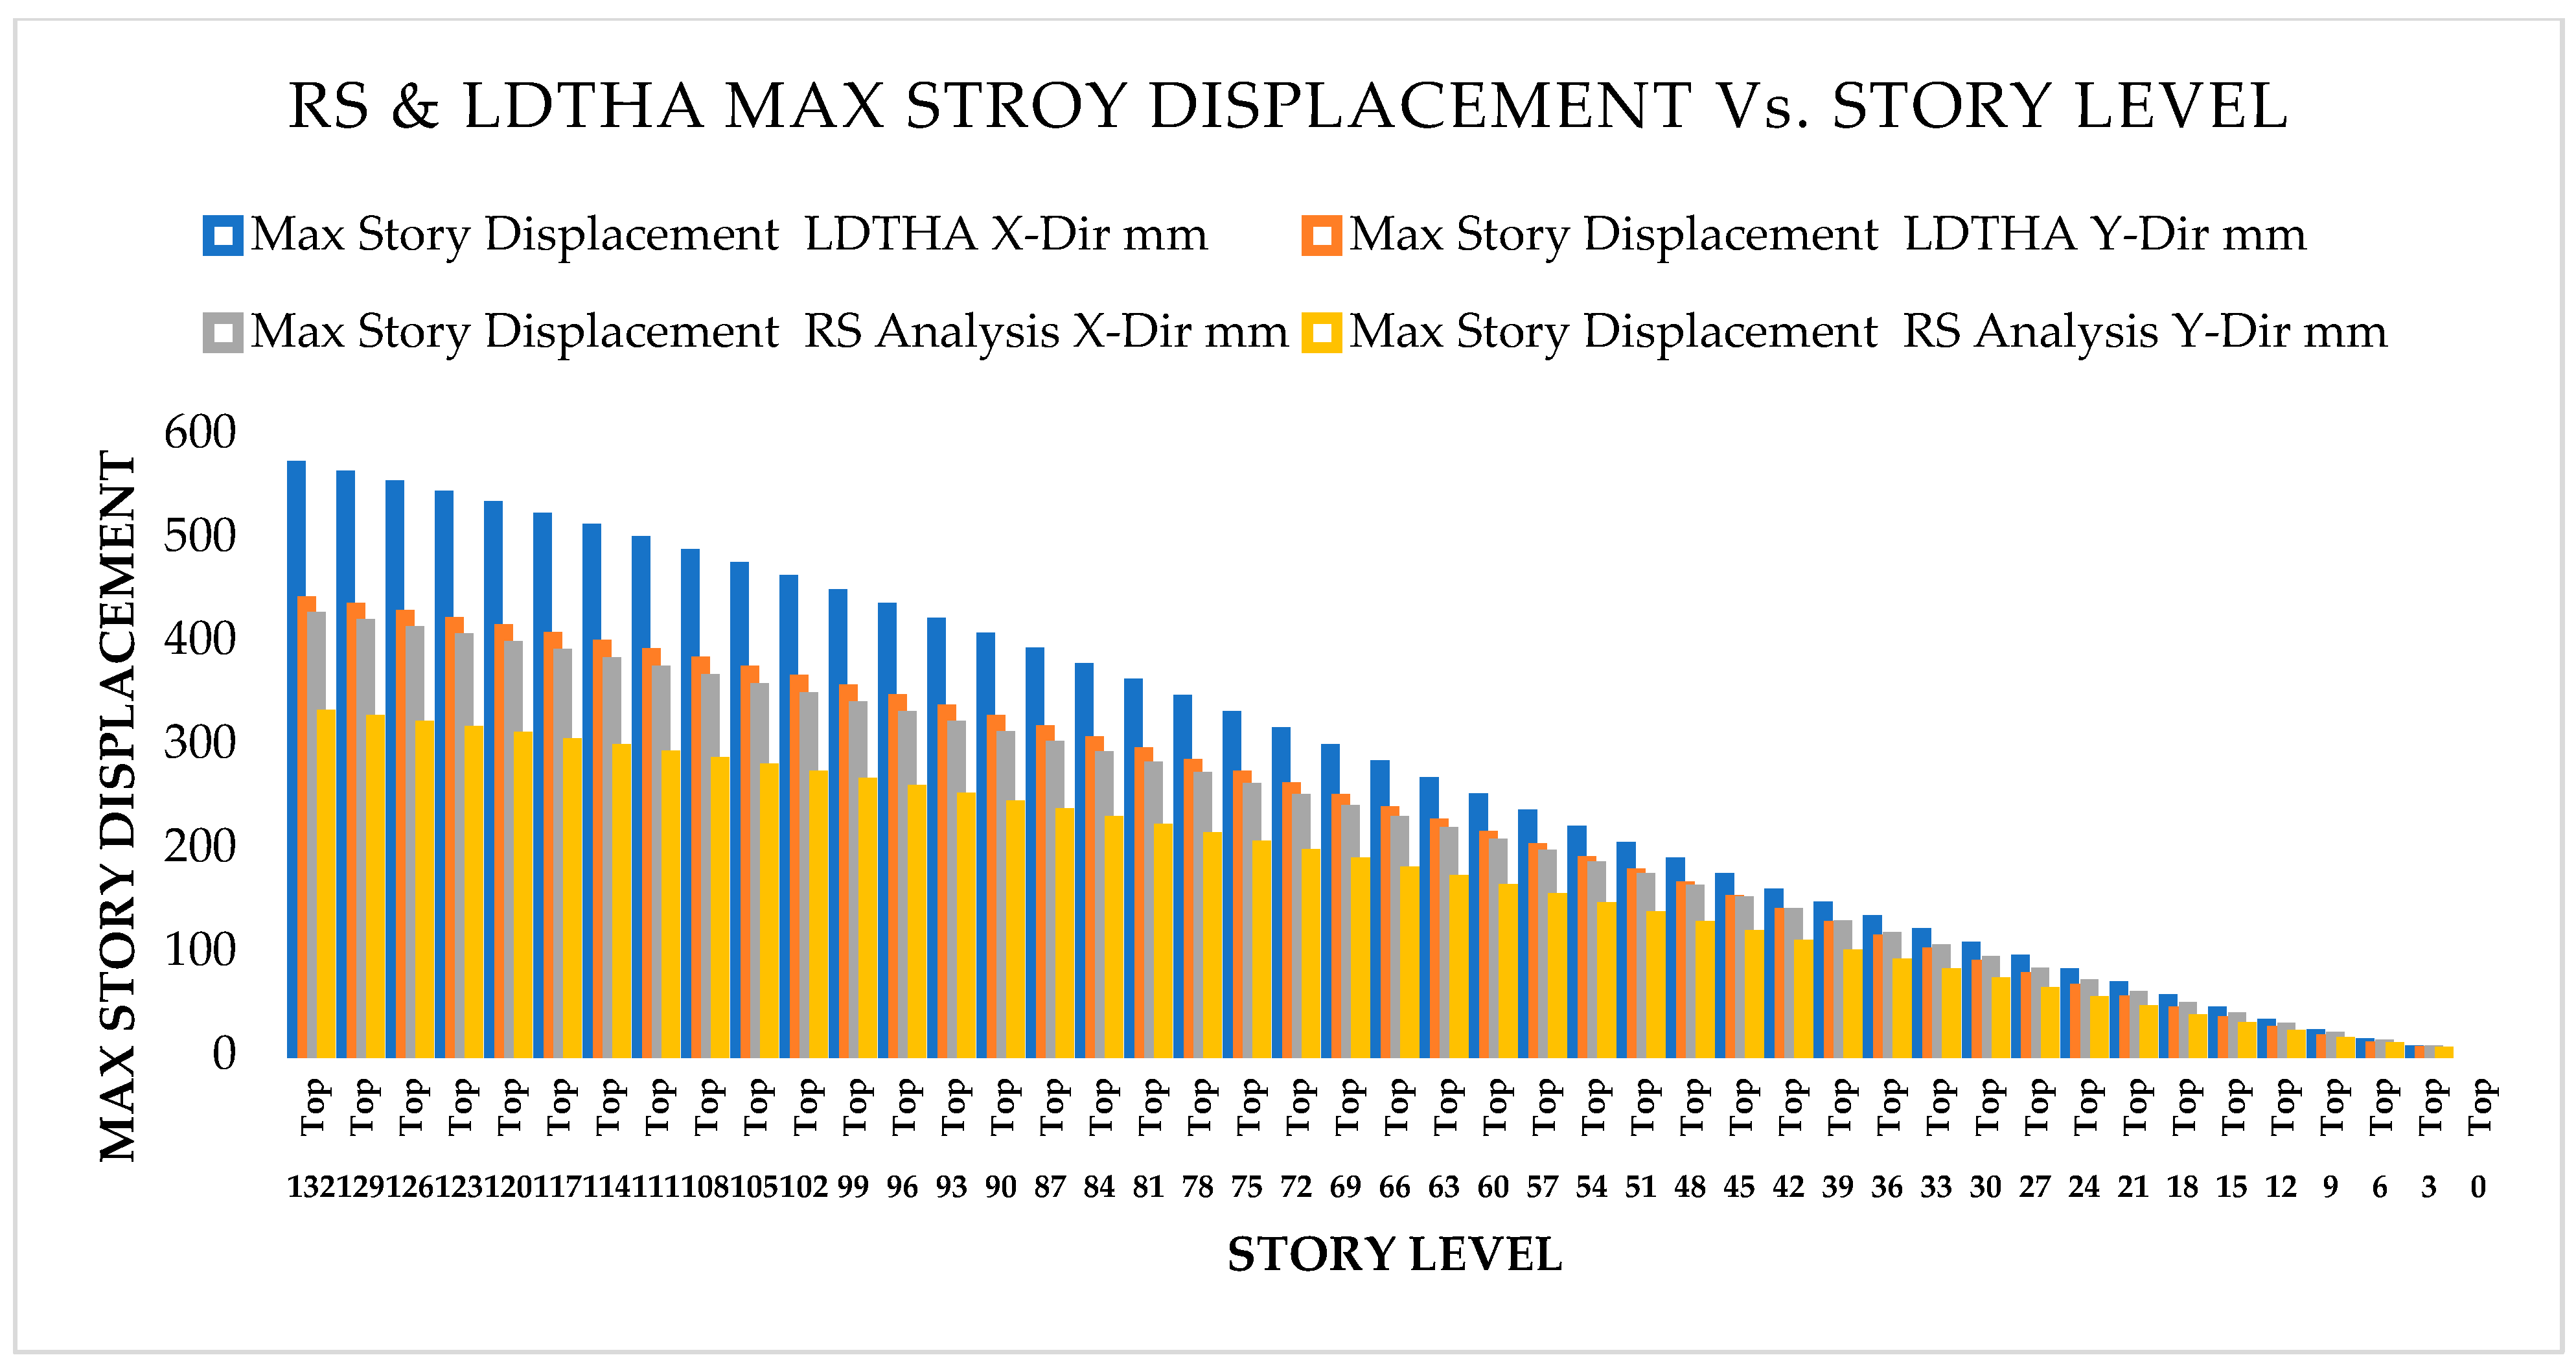
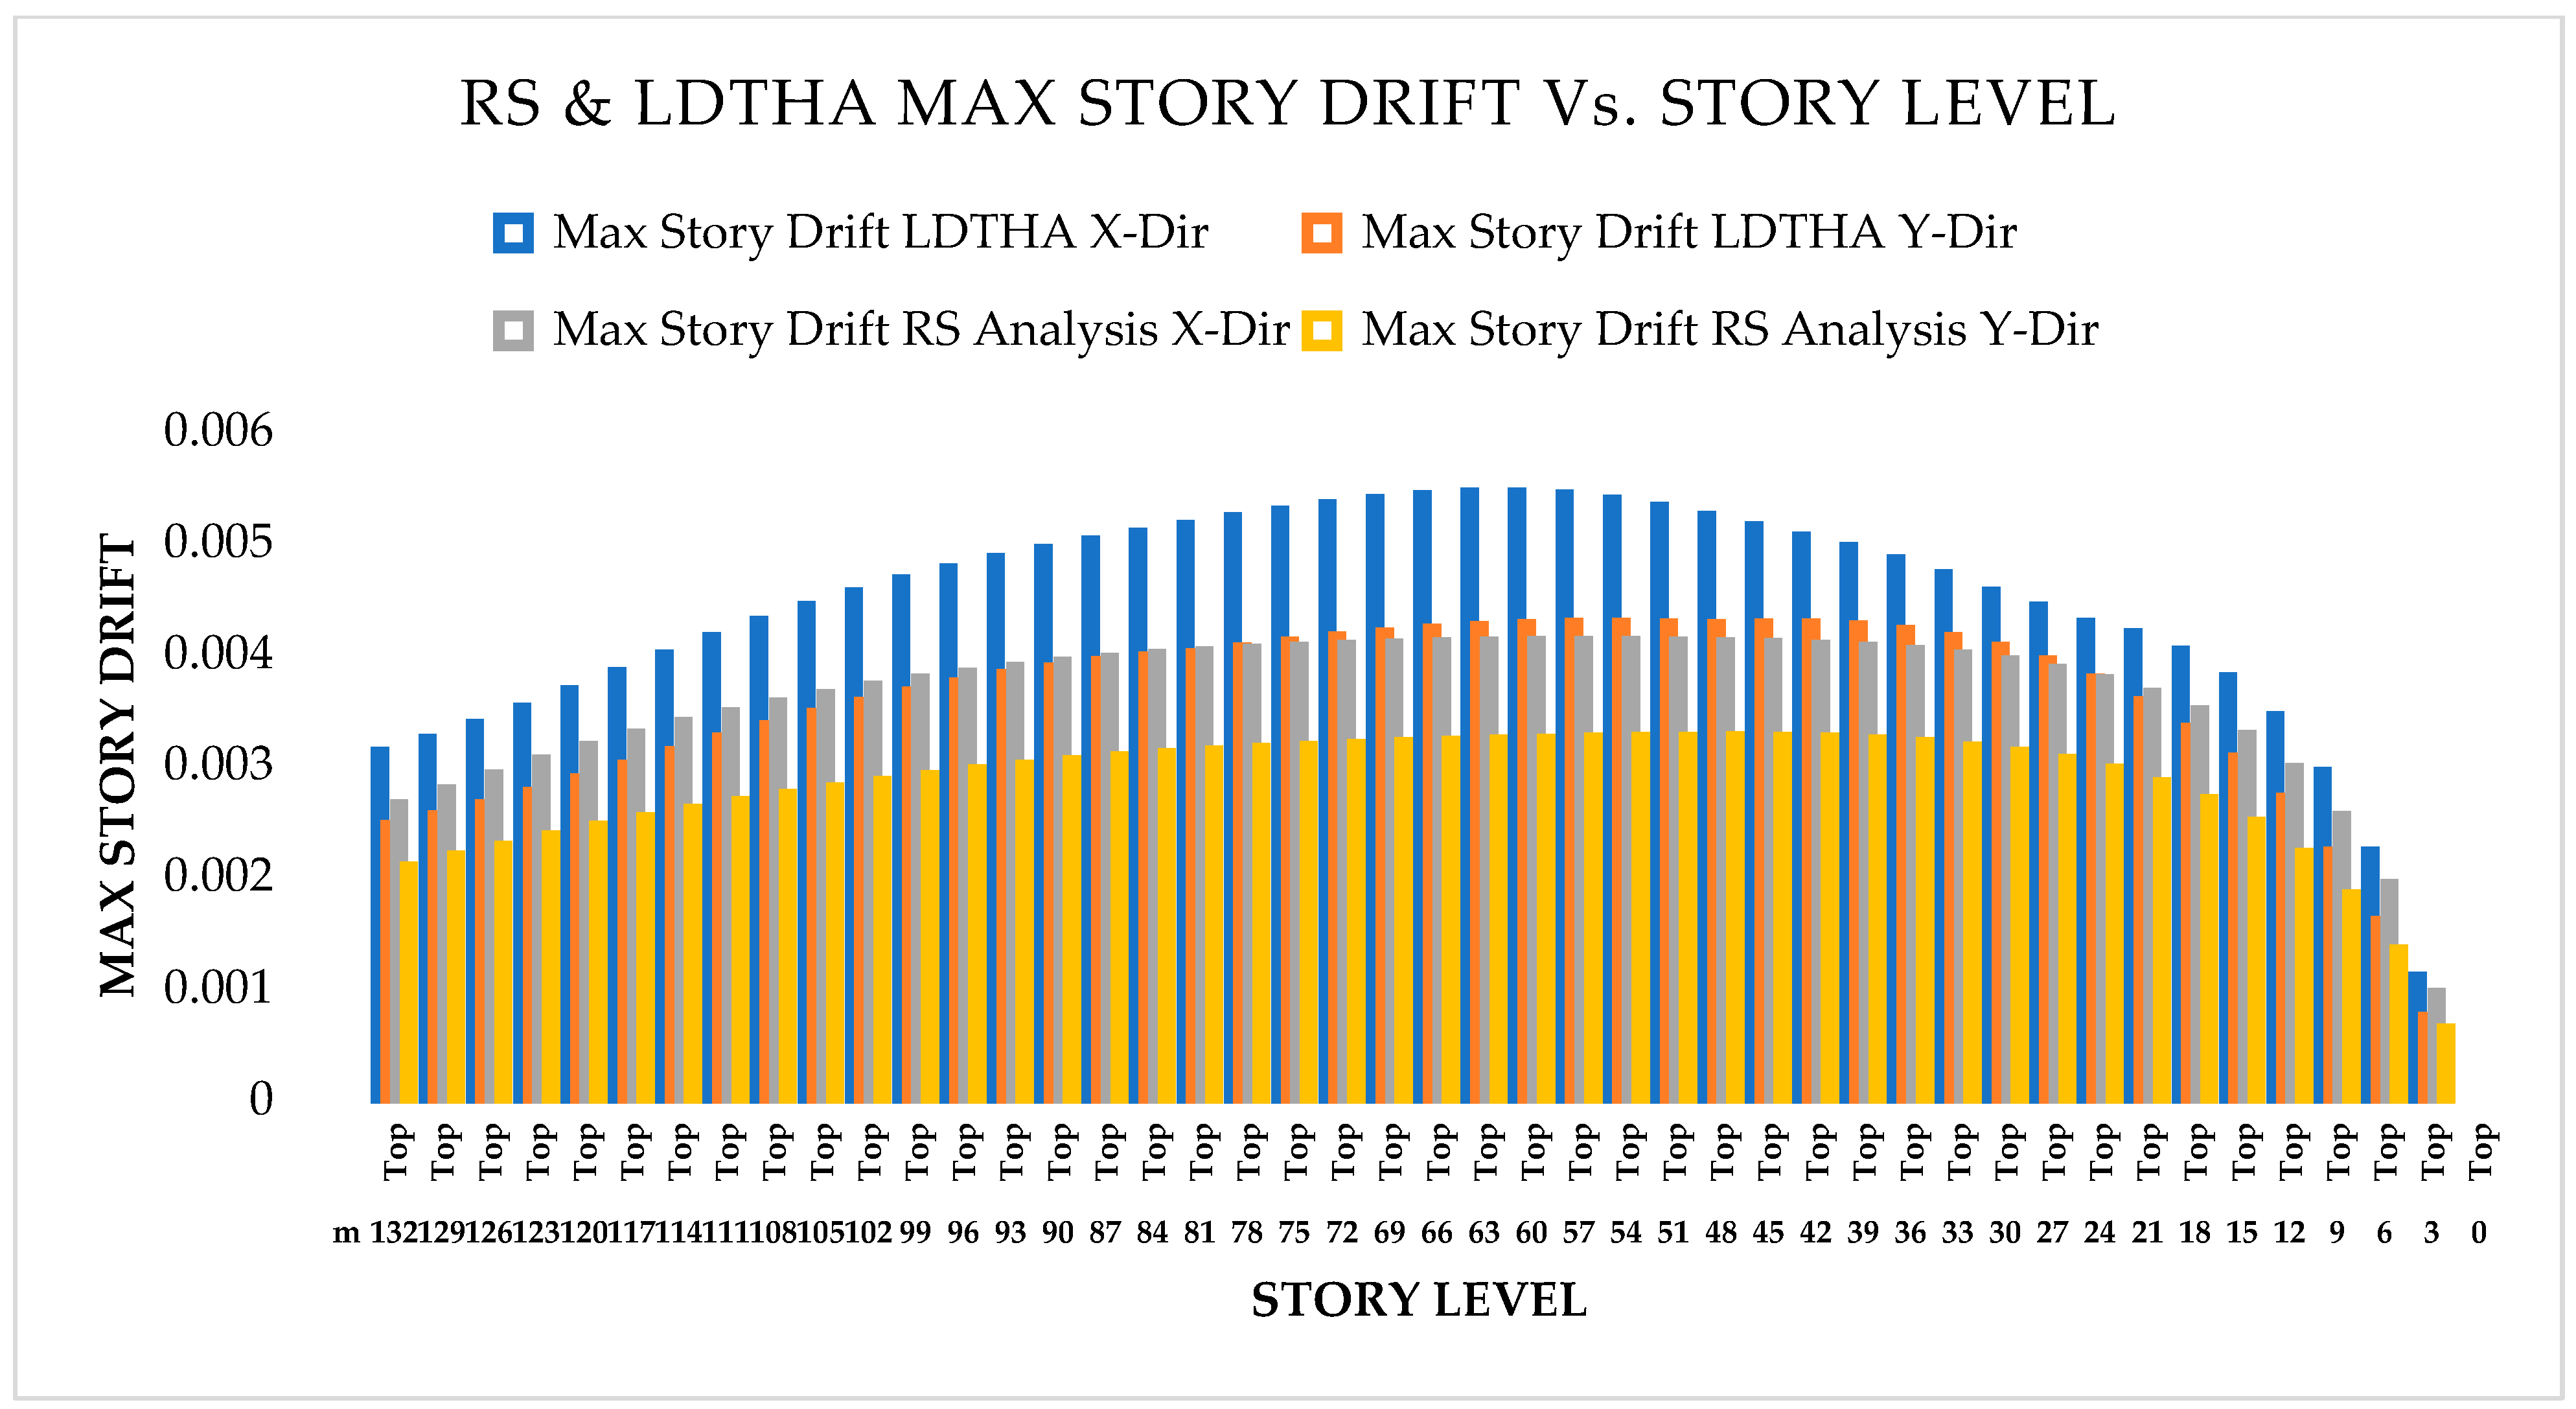
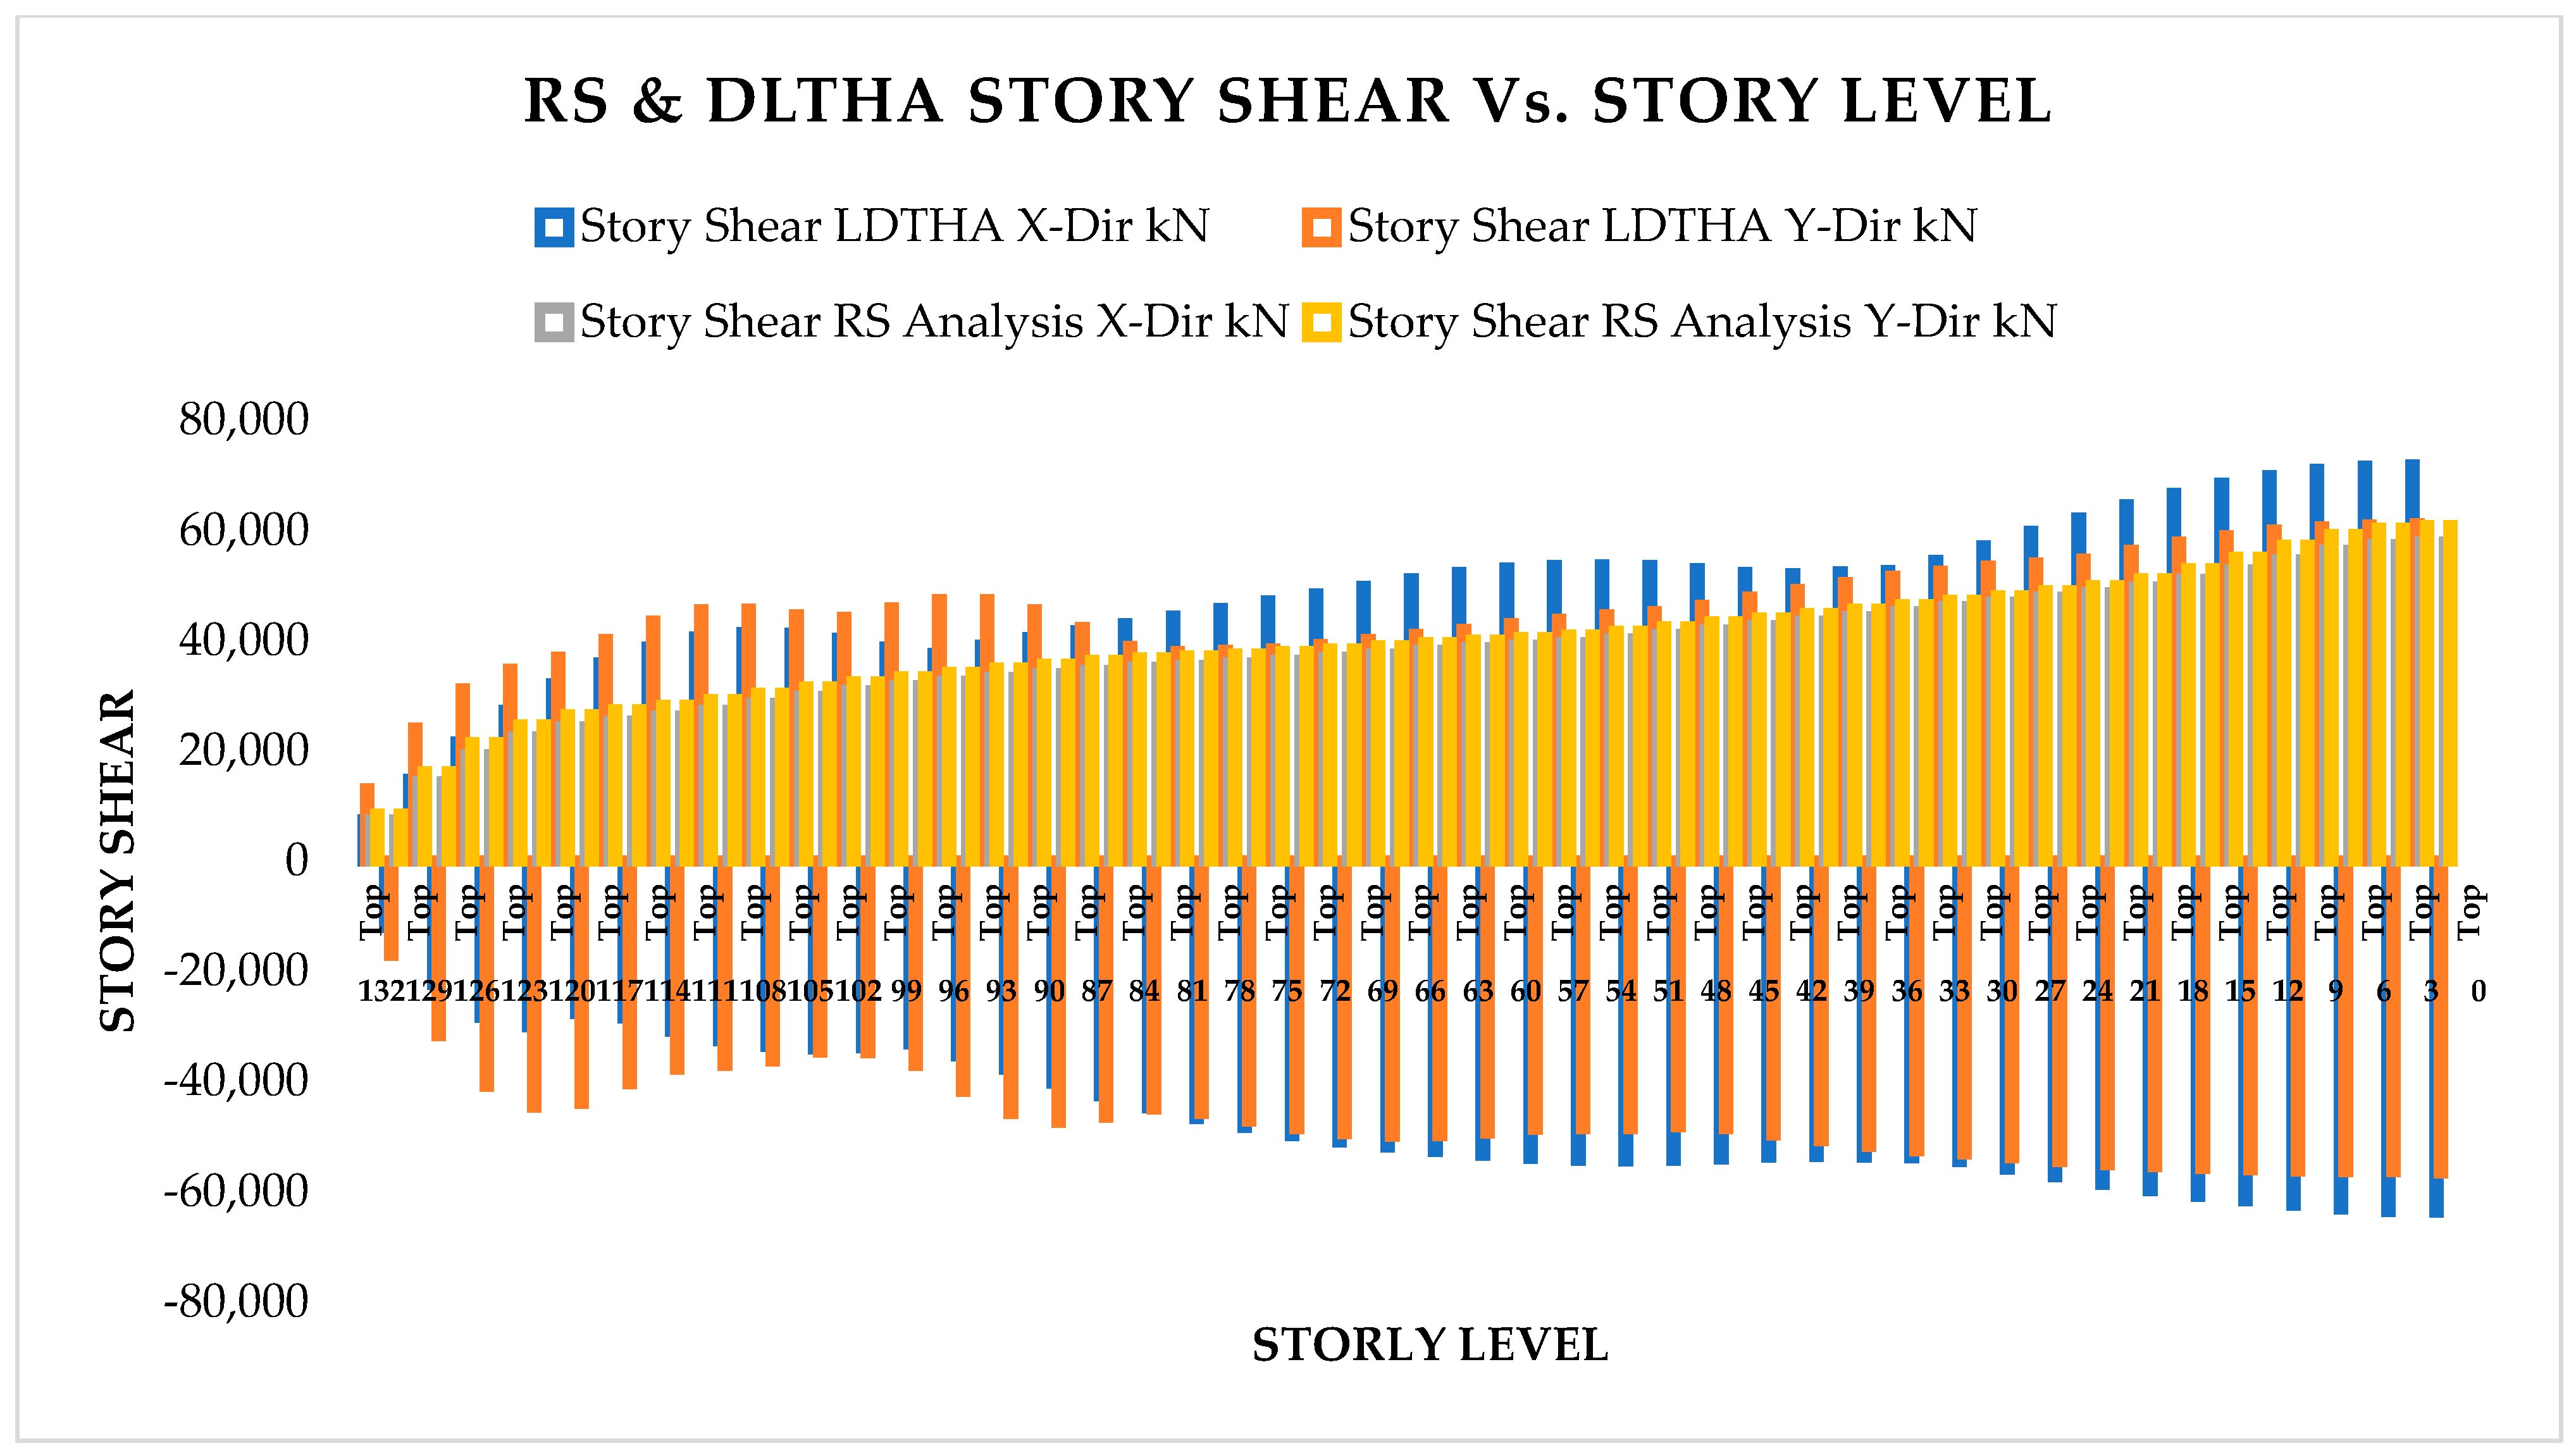
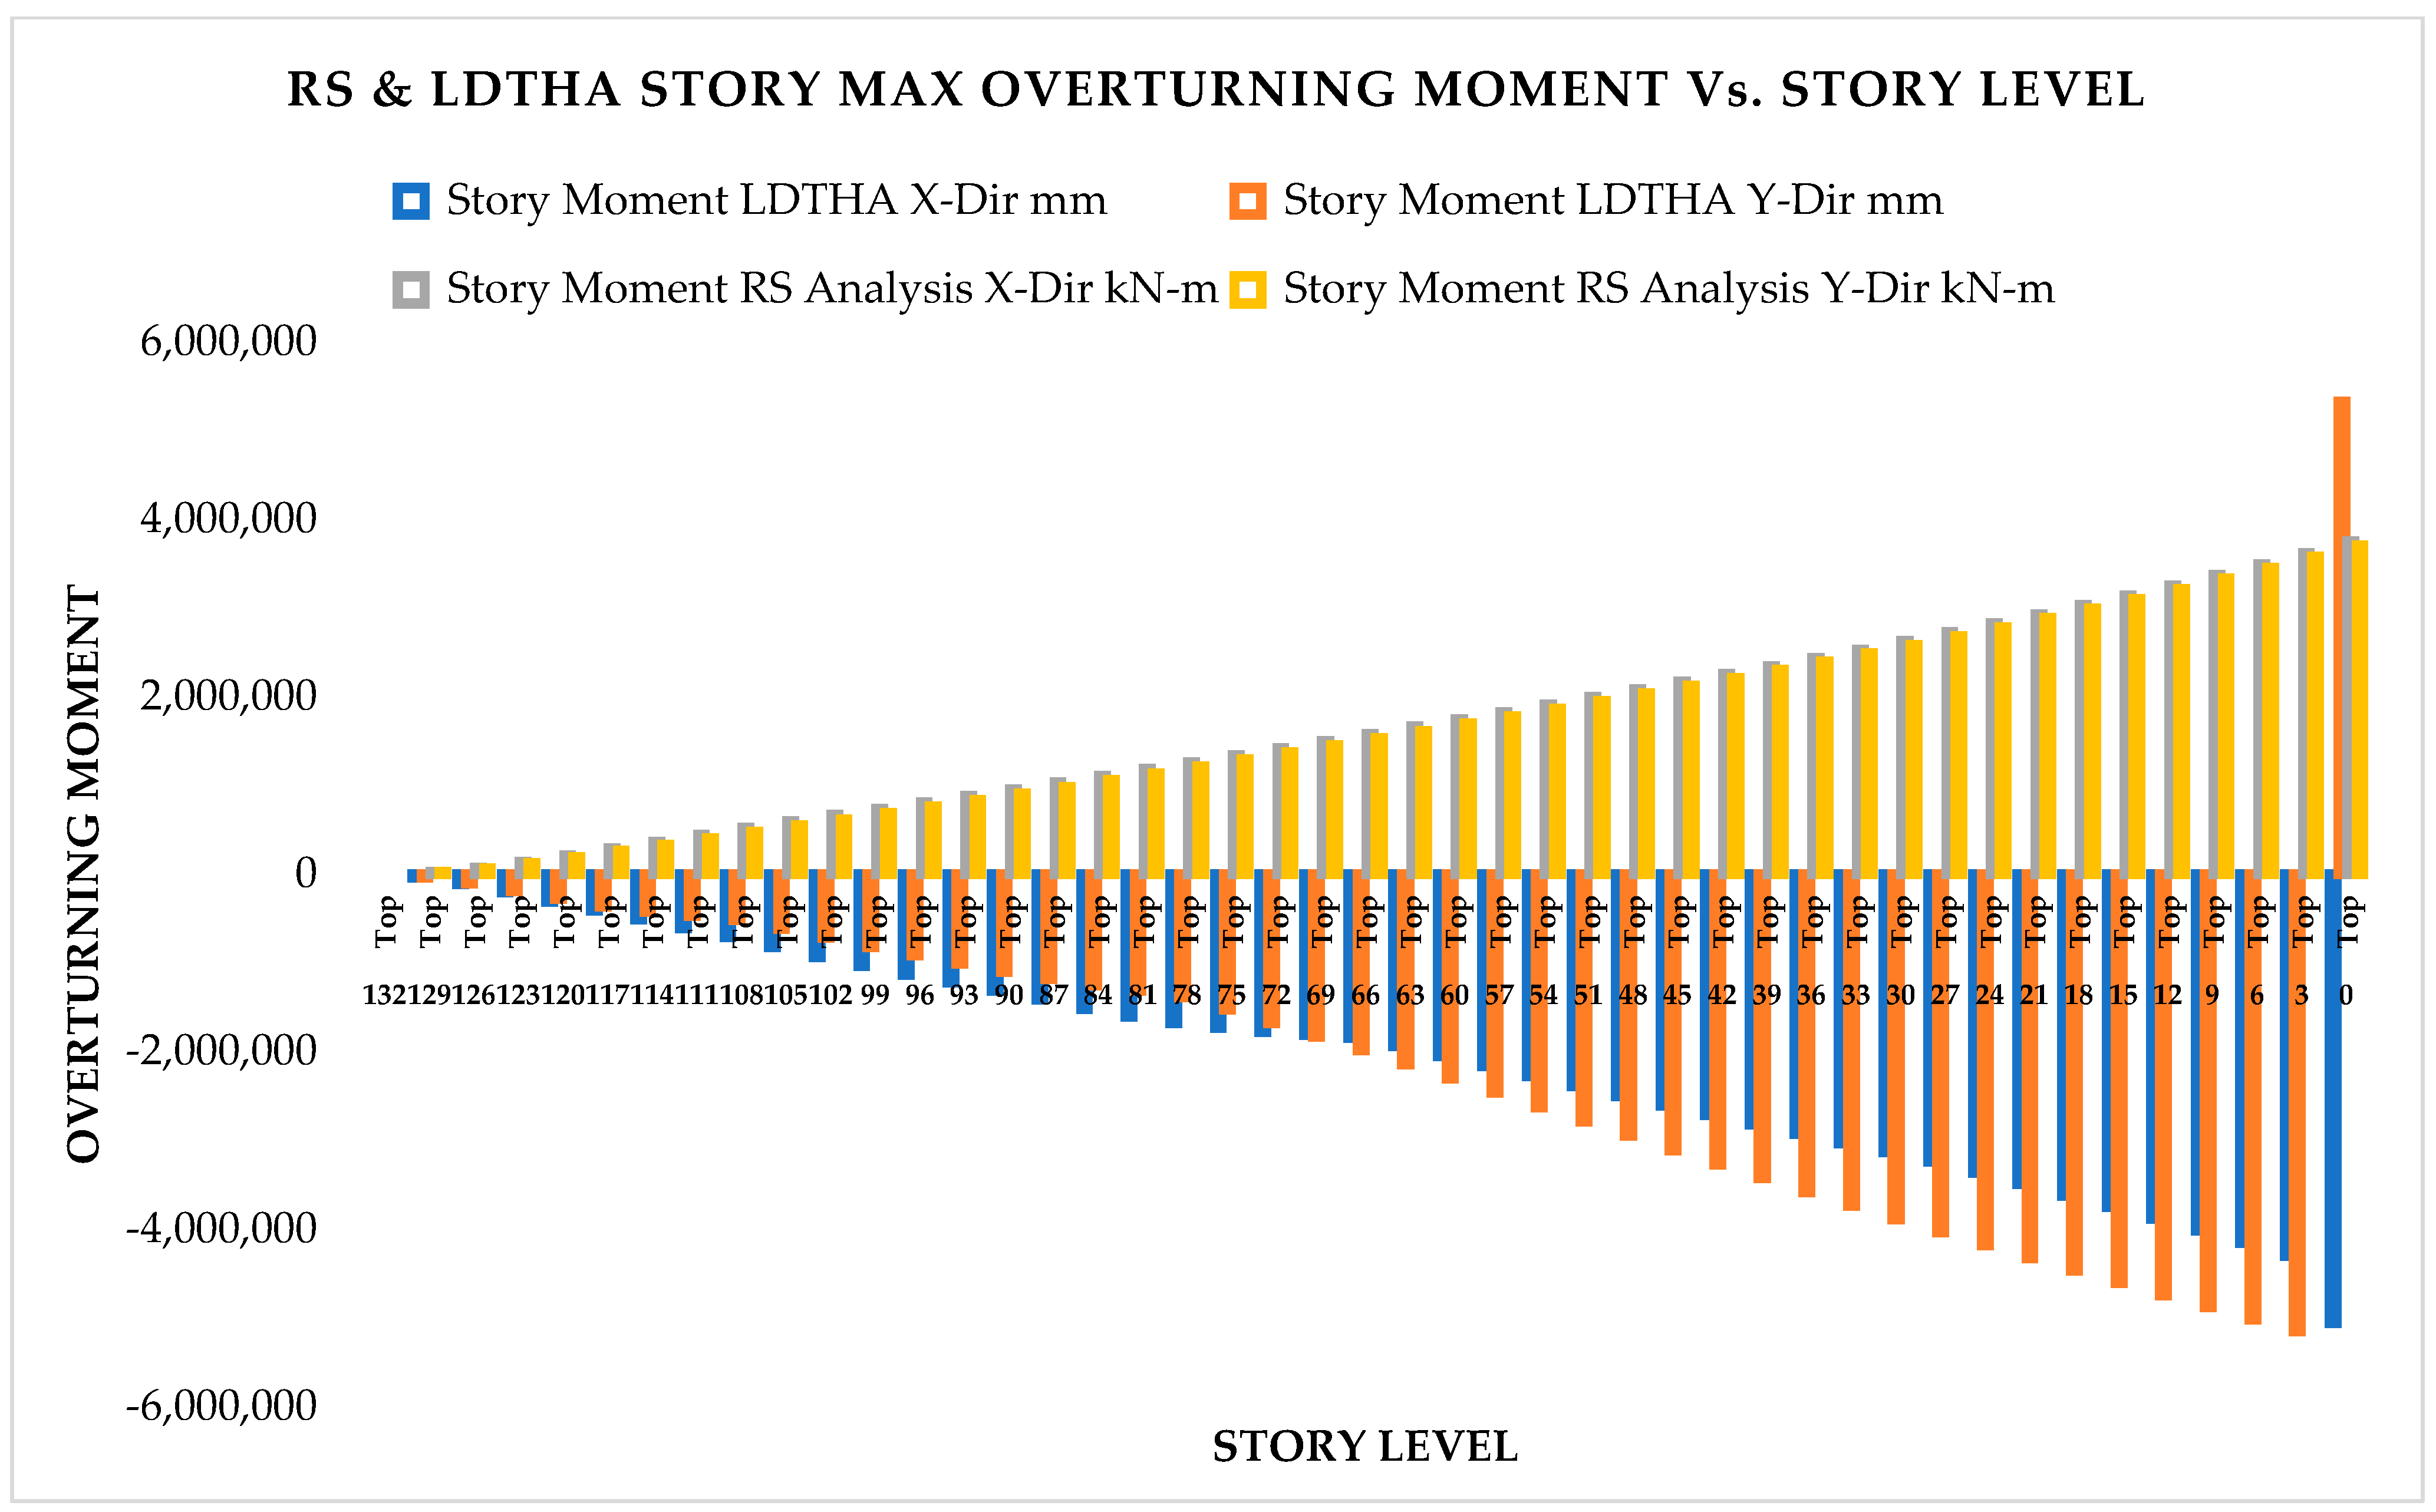
As per the RSA and LDTHA analysis result of the sample linear 44-story building, Figure 5, Figure 6, Figure 7, Figure 8, Figure 9 and Figure 10 show that the global responses of the structure are higher for LDTHA than that of the RSA analysis result. For 44-story buildings, LDTHA shows a maximum story displacement of 25.68%, maximum inter-story drift ratio of 26.49%, story shear at 15.35%, story overturning moment at 27.5%, and the fundamental time period at 2% higher than RSA results observed. The fundamental time period first mode found from classical modal analysis for 44 stories was 3.956. In addition to this, the fundamental time period found from RSA analysis of the 1st mode period was 3.806. Similarly, the fundamental period for DLTHA was found to be 3.883 s. In addition, for all three analyses, it has been observed that the first two modes are translational and the third mode is torsional, as required by different coda and guidelines.
Table 4 and Figure A18, Figure A19, Figure A20, Figure A21, Figure A22, Figure A23 and Figure A24 show RSX ETABS vs. 19.00 combined global story responses from RSX (RXL) load case; the maximum story displacement is 421.90 mm, maximum story drift (IDR) is 0.4%, story shears 60,898 kN, and the story overturning moment was found to be 3.749287 × 10⁶ kN-m., which is clearly a lower result than the DLTHA global response results as shown in Table 5.
As per ETABS vs. 19.0.0, the DLTHA global story responses for mean sample eleven selected ground acceleration load case shown in Table 5 and Figure A25, Figure A26, Figure A27, Figure A28, Figure A29 and Figure A30; the maximum story displacement was found to be 567.70 mm, (inter-story drift ratio) maximum story drift (IDR) was 0.5442%, the story shear was 71,942 kN and the story overturning moment was 5.17236 × 10⁶ kN-m (including Landers US 881_1992 EQ), which is clearly a higher result than the response spectrum global response results as shown in Table 5.

4.1.3. III-Results and Discussion of Nonlinear Static and Dynamic Analysis

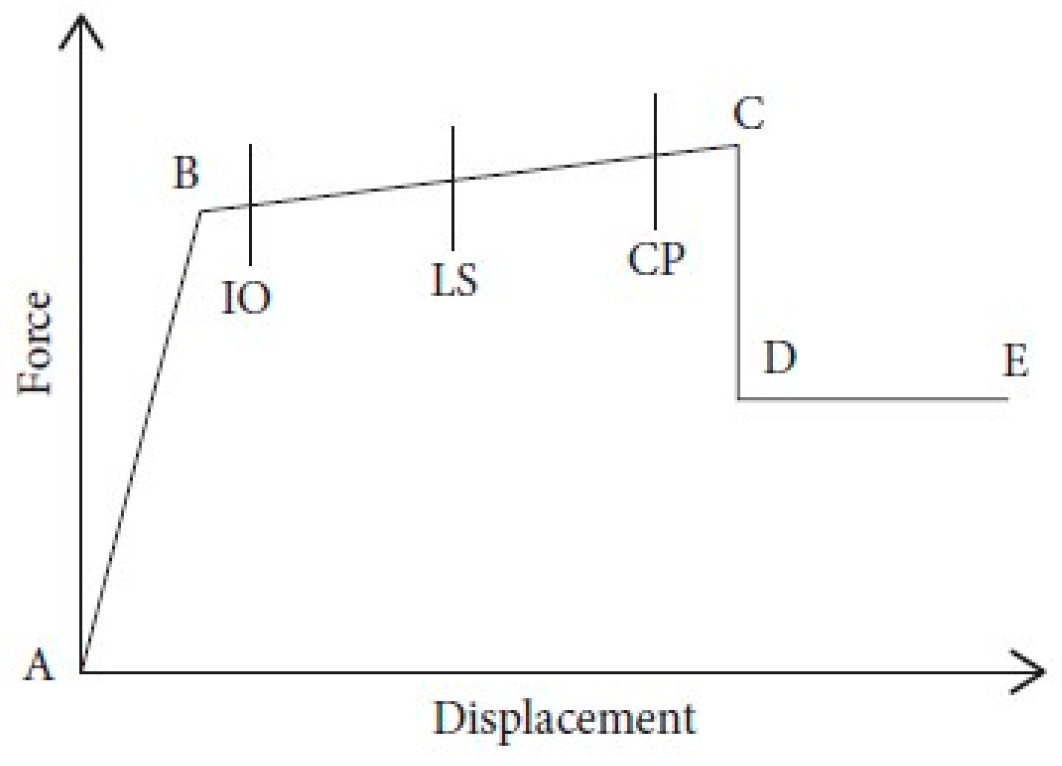
This section discusses the results of the performance analysis of static pushover analysis and nonlinear time history analysis. The previous section thoroughly discussed the 44-story linear RC building global response results. In this part, Pushover analysis was validated using nonlinear time history analysis (NLTHA). The result of the Static pushover analysis of model structures was evaluated based on the capacity pushover curve, the pattern of plastic hinges, and the distribution of plastic hinges on structural elements and the general performance test for the model was performed using methods provided in FEMA 356, ASCE 41-17, and ATC 40, and a detailed discussion of the sample structure presented. In addition to that, axial load on the beams is considered zero in the analysis of the temporal curvature. Axial loads in columns were considered static and equal to the load caused by DL and 30% of LL in columns, as described in ES8-15. Additionally, IO, LS, and CP three levels of performance are defined by plastic rotation: 20%, 50%, and 90% of the overall force deformation capacity of that particular assigned hinge.
Because all the gravitational force is distributed evenly across all beams, plastic hinges that can be present on both ends of members are considered. Similar to the FEMA 356, ATC-40, and ASCE 41-17 plastic hinges guidelines, ETABS competes with the Force-deformation column P-M2-M3 hinge type and for beams moment M3 hinge type assigned at the end of the members. FEMA 356 recommends that flexible hinges be kept as close to the ends of the section as possible without counting directly from modeling and analysis. Therefore, the plastic in the RC members is considered composite and developed at a distance equal to 1/2 the normal length of the Lp plastic hinge from the edge of the member, which was 10% of the total length of the member.
Another important aspect of pushover analysis is to find the pattern of the lateral load, other than the plastic hinge. FEMA 356 and ES8-15 both promote the adoption of several horizontal load patterns to limit the extent of design actions that might occur during a real earthquake reaction. In this study, we used the same loading patterns as Mode-1 almost triangular, called the modal pattern, is equal to the lateral force and corresponds to the distribution of the horizontal force along the length of the building.
The pushover capacity curve depicts the structure’s overall ability to increase controlled node displacement step by step from 0 to the target displacement. The displacement of the controlled node might be measured at the center of mass or the roof of the chosen frames. The roof displacement value represents the displacement that would be expected throughout an earthquake inside the nonelastic variety. ES8-15 (EN1998-1) and FEMA 356 each imply a maximum roof displacement of 150%. ATC 40 shows a drift of 2% of the roof; this target displacement for the existing safety performance looks like a fair point of departure for the pushover analysis. For this research, a 2% of H roof drift is used to calculate the controlled node displacement for all trials, in which H is the building height, and so the roof drift implemented to this model is 2640 mm (H = 132 m) for the 44-story example model. The displacement spectrum method of pushover evaluation is favored throughout the analysis. In addition to this, the P-delta effect is not integrated into this calculation.
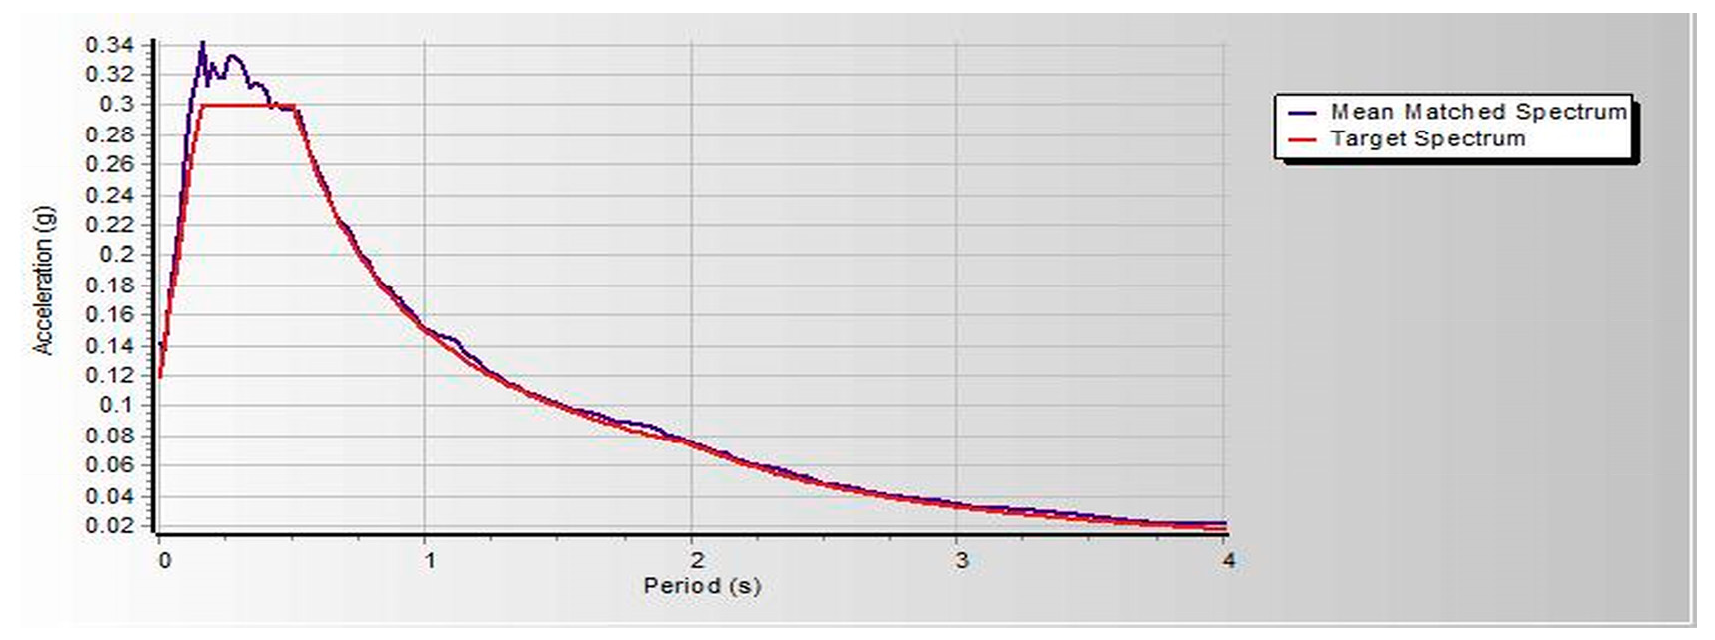
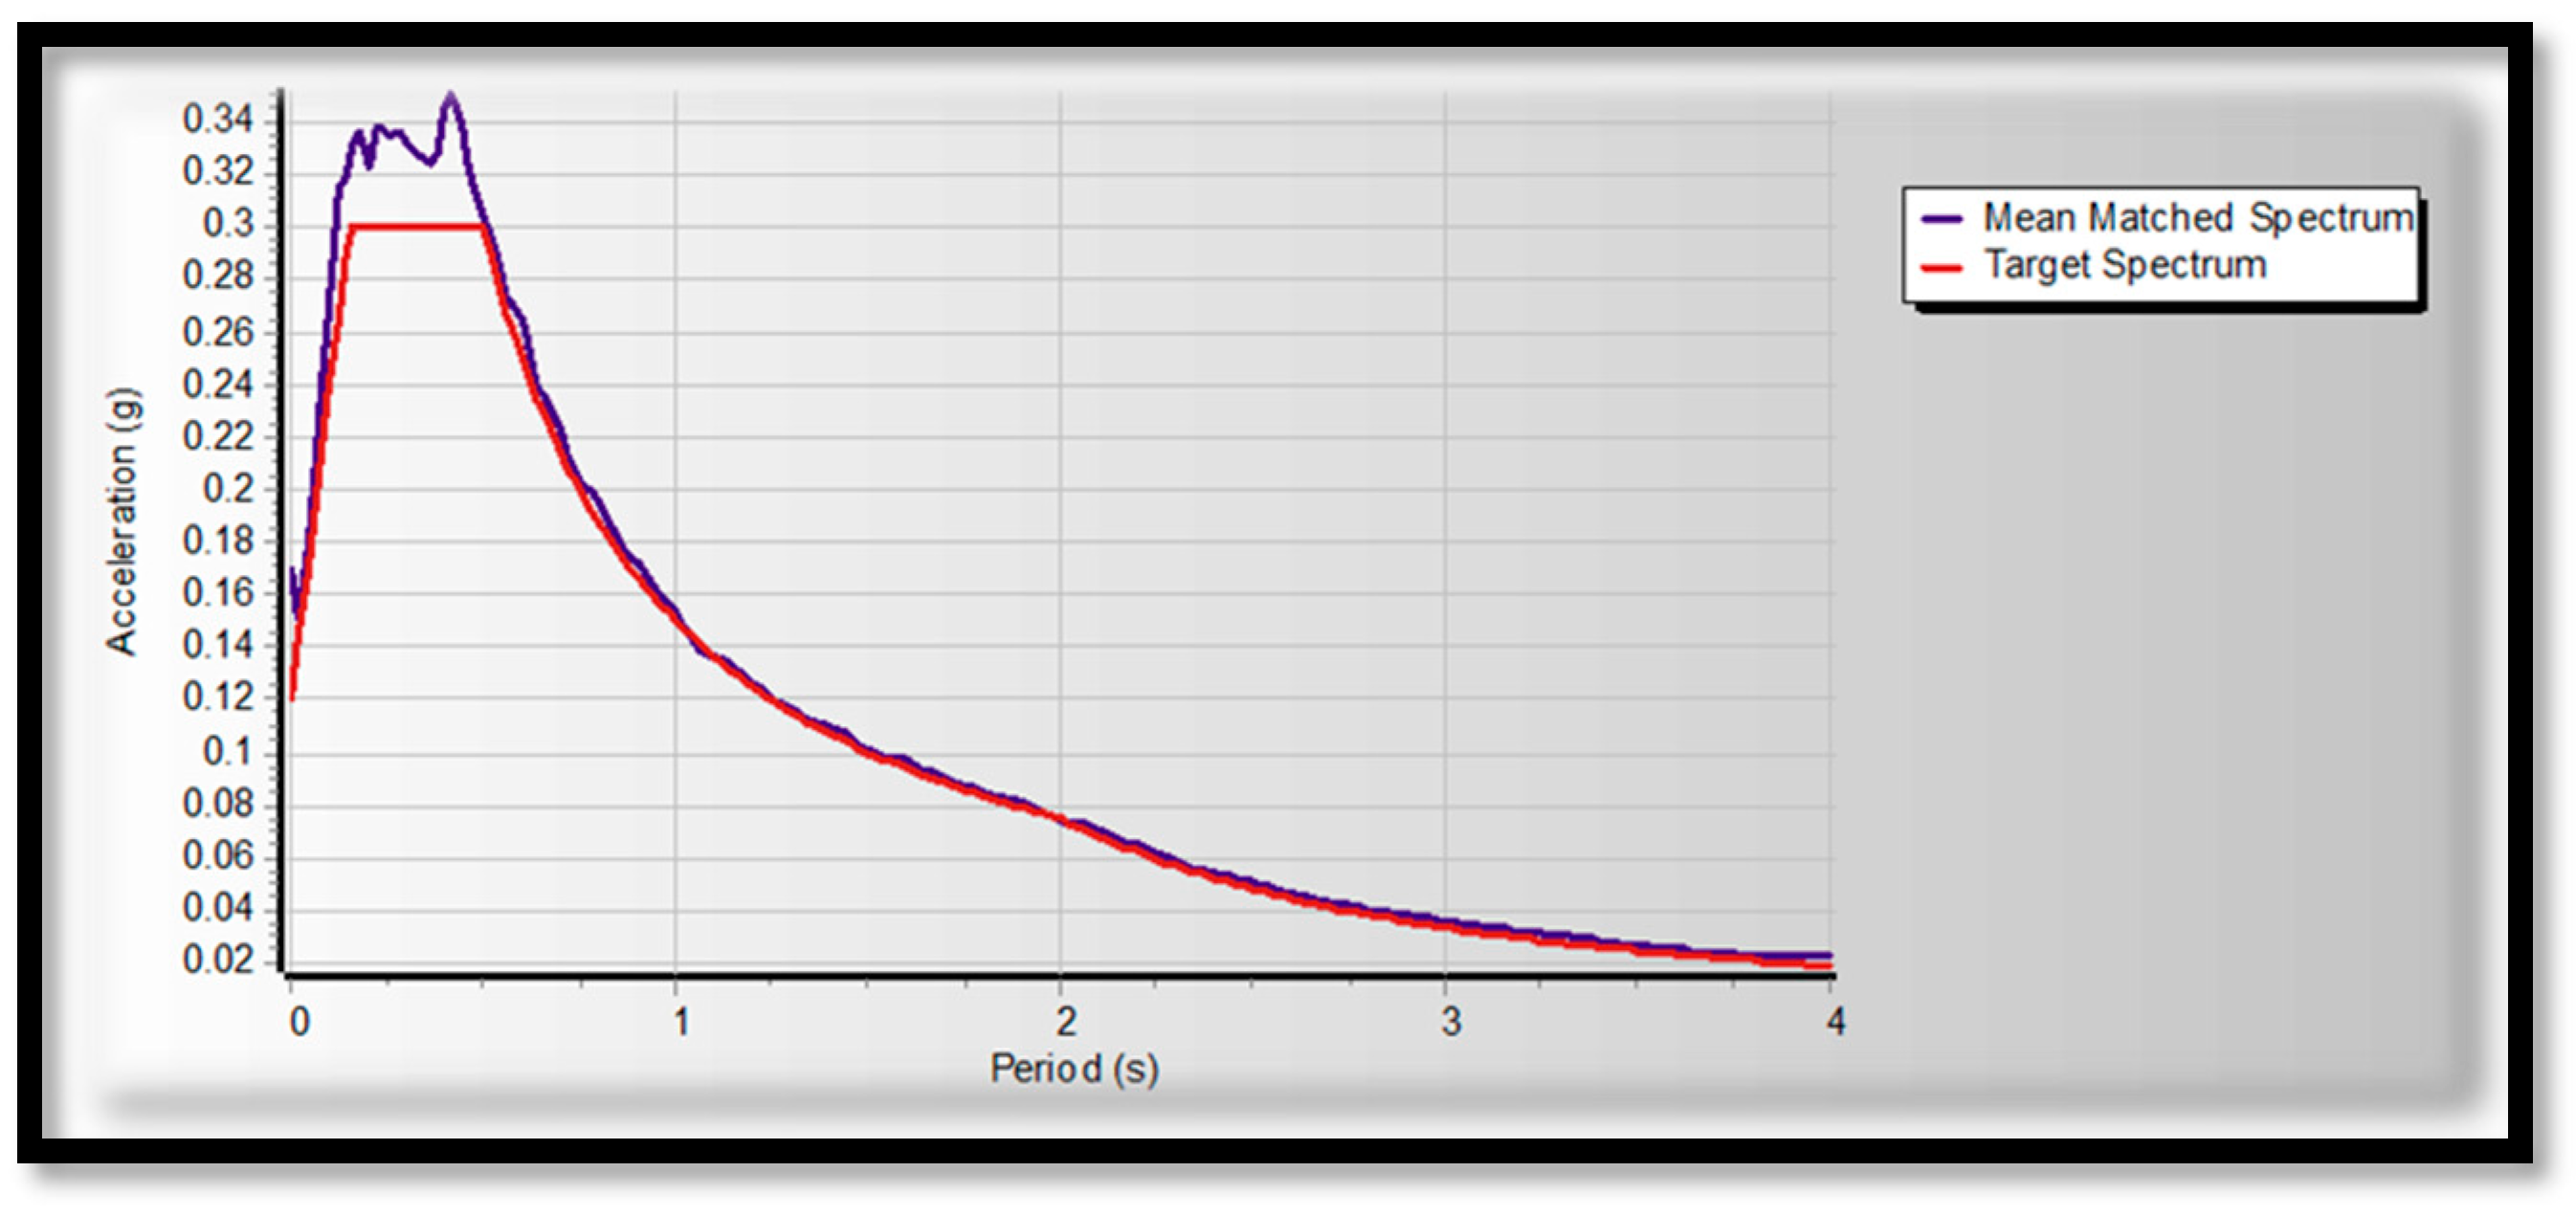
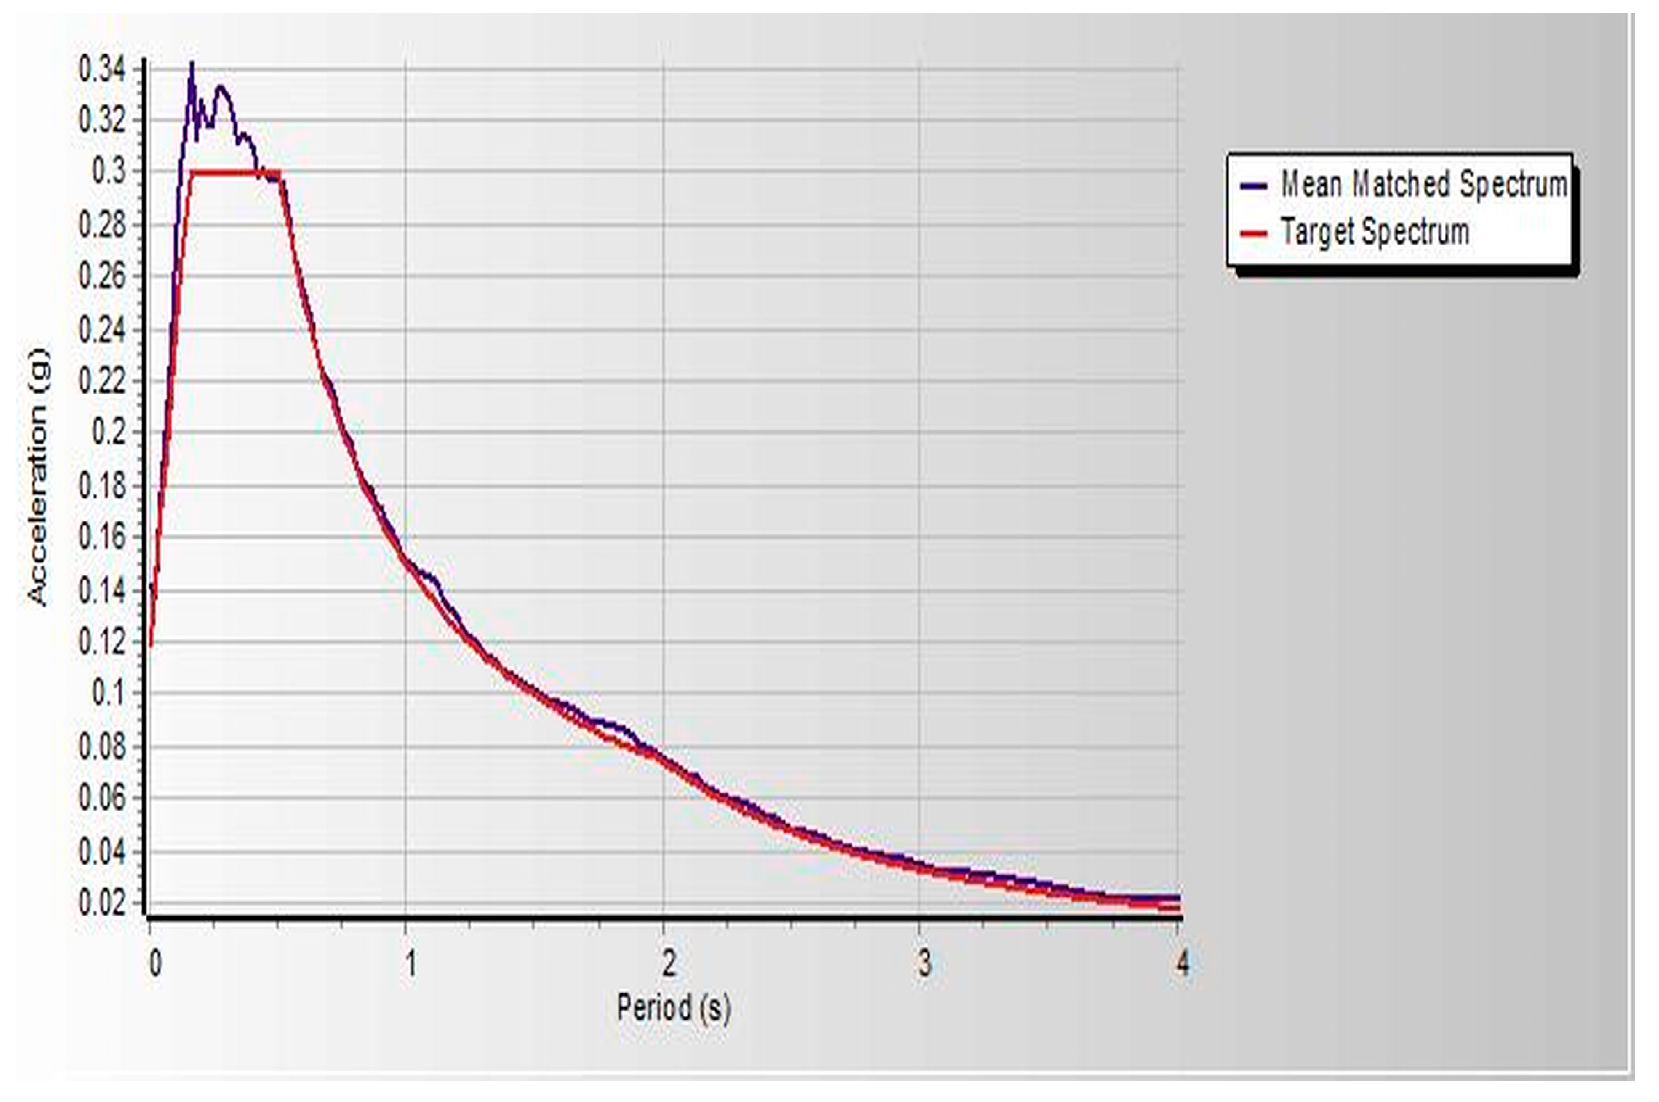
To validate the findings of the nonlinear static pushover analysis (SPO), a nonlinear time history analysis (NLTHA) was done. Even though NLTHA analysis is generally more reliable than SPO analysis, choosing the precise ground data is not easy. For this study, we extracted 11 real earthquake recordings from the PEER website and evaluated them according to FEMA 360 recommendations. The selected recording has a horizontal acceleration from 0.089 g to 0.75 g, soil type B, PGA = 0.1 g category A has been used and then processed using SeismoMatch and ETABS software. The scaling and matching process b/n 0.2T1 to 2T1 confirmed that none of the matched selected earthquake data were not less than 90% of the target response spectrum, respectively, and are considered according to the recommendation of ES8-15, such that T-1 is the fundamental period of vibration of the proposed model. The matched spectrum of the 44-story building version is shown in Figure 11 compared to ES8-15 of the type–target response spectrum.
The nonlinear sample model can be used for the nonlinear time history analysis (NLTHA)and is similar to those used in SPO. As a result, the same independent models used in the SPO analysis were used in the NLTHA analysis on ETABS computer software version 19.0.0. The sample model was assigned with the recording of the same matched ground motion and the findings were compared with those obtained by SPO for verification purpose.

4.2. SPO Result Verification

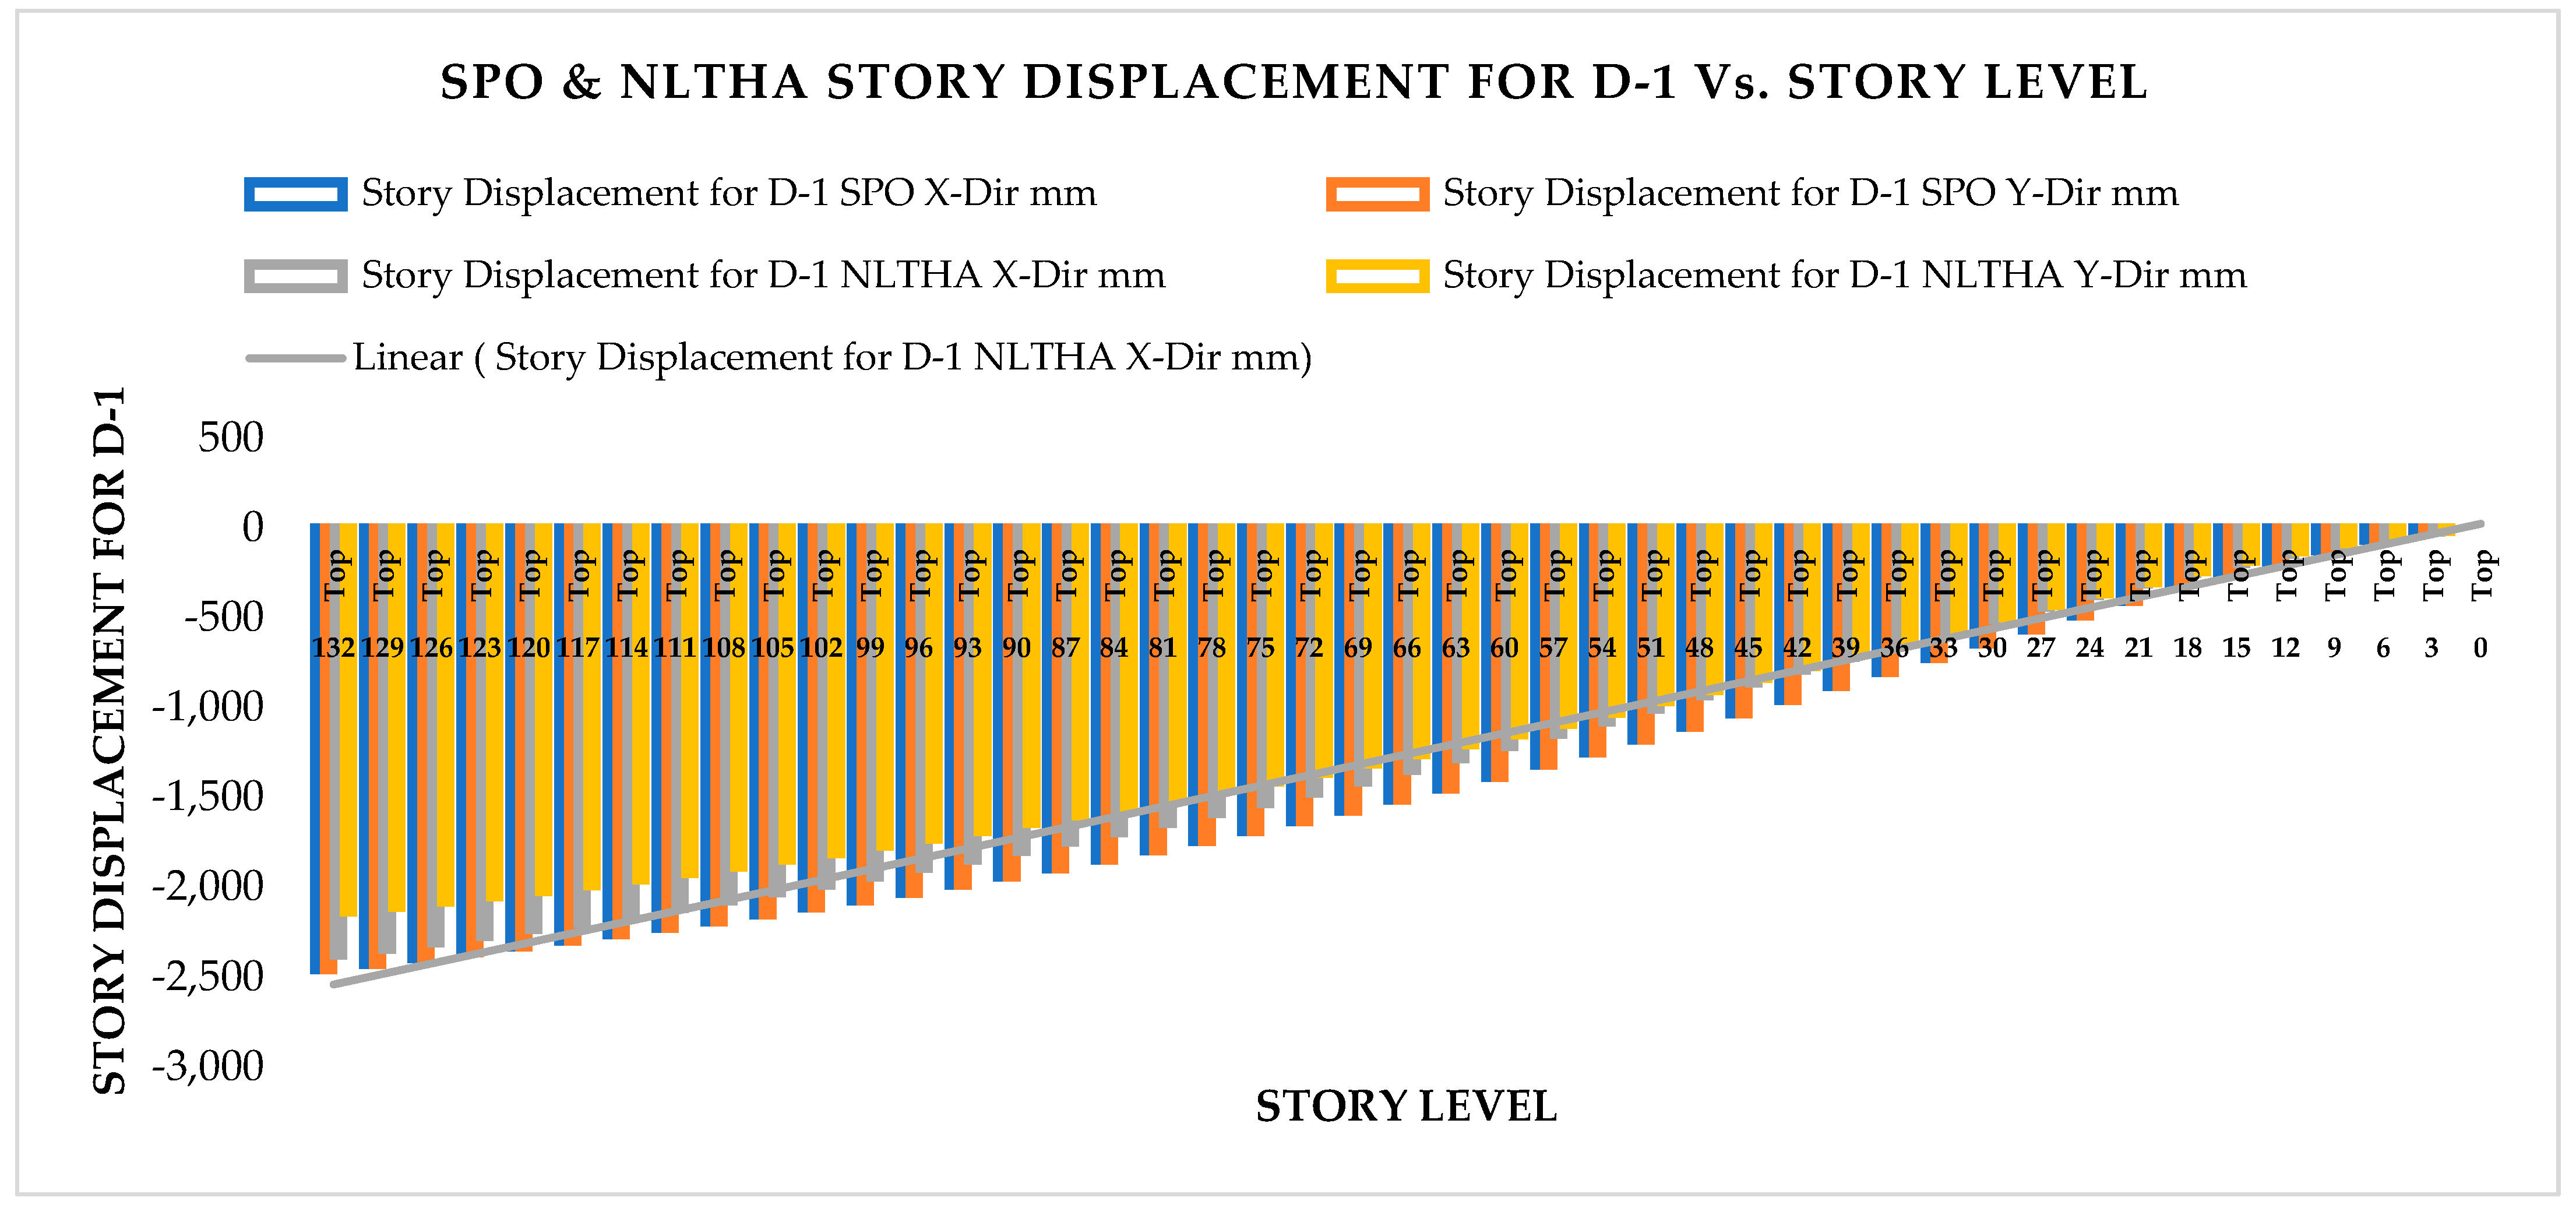
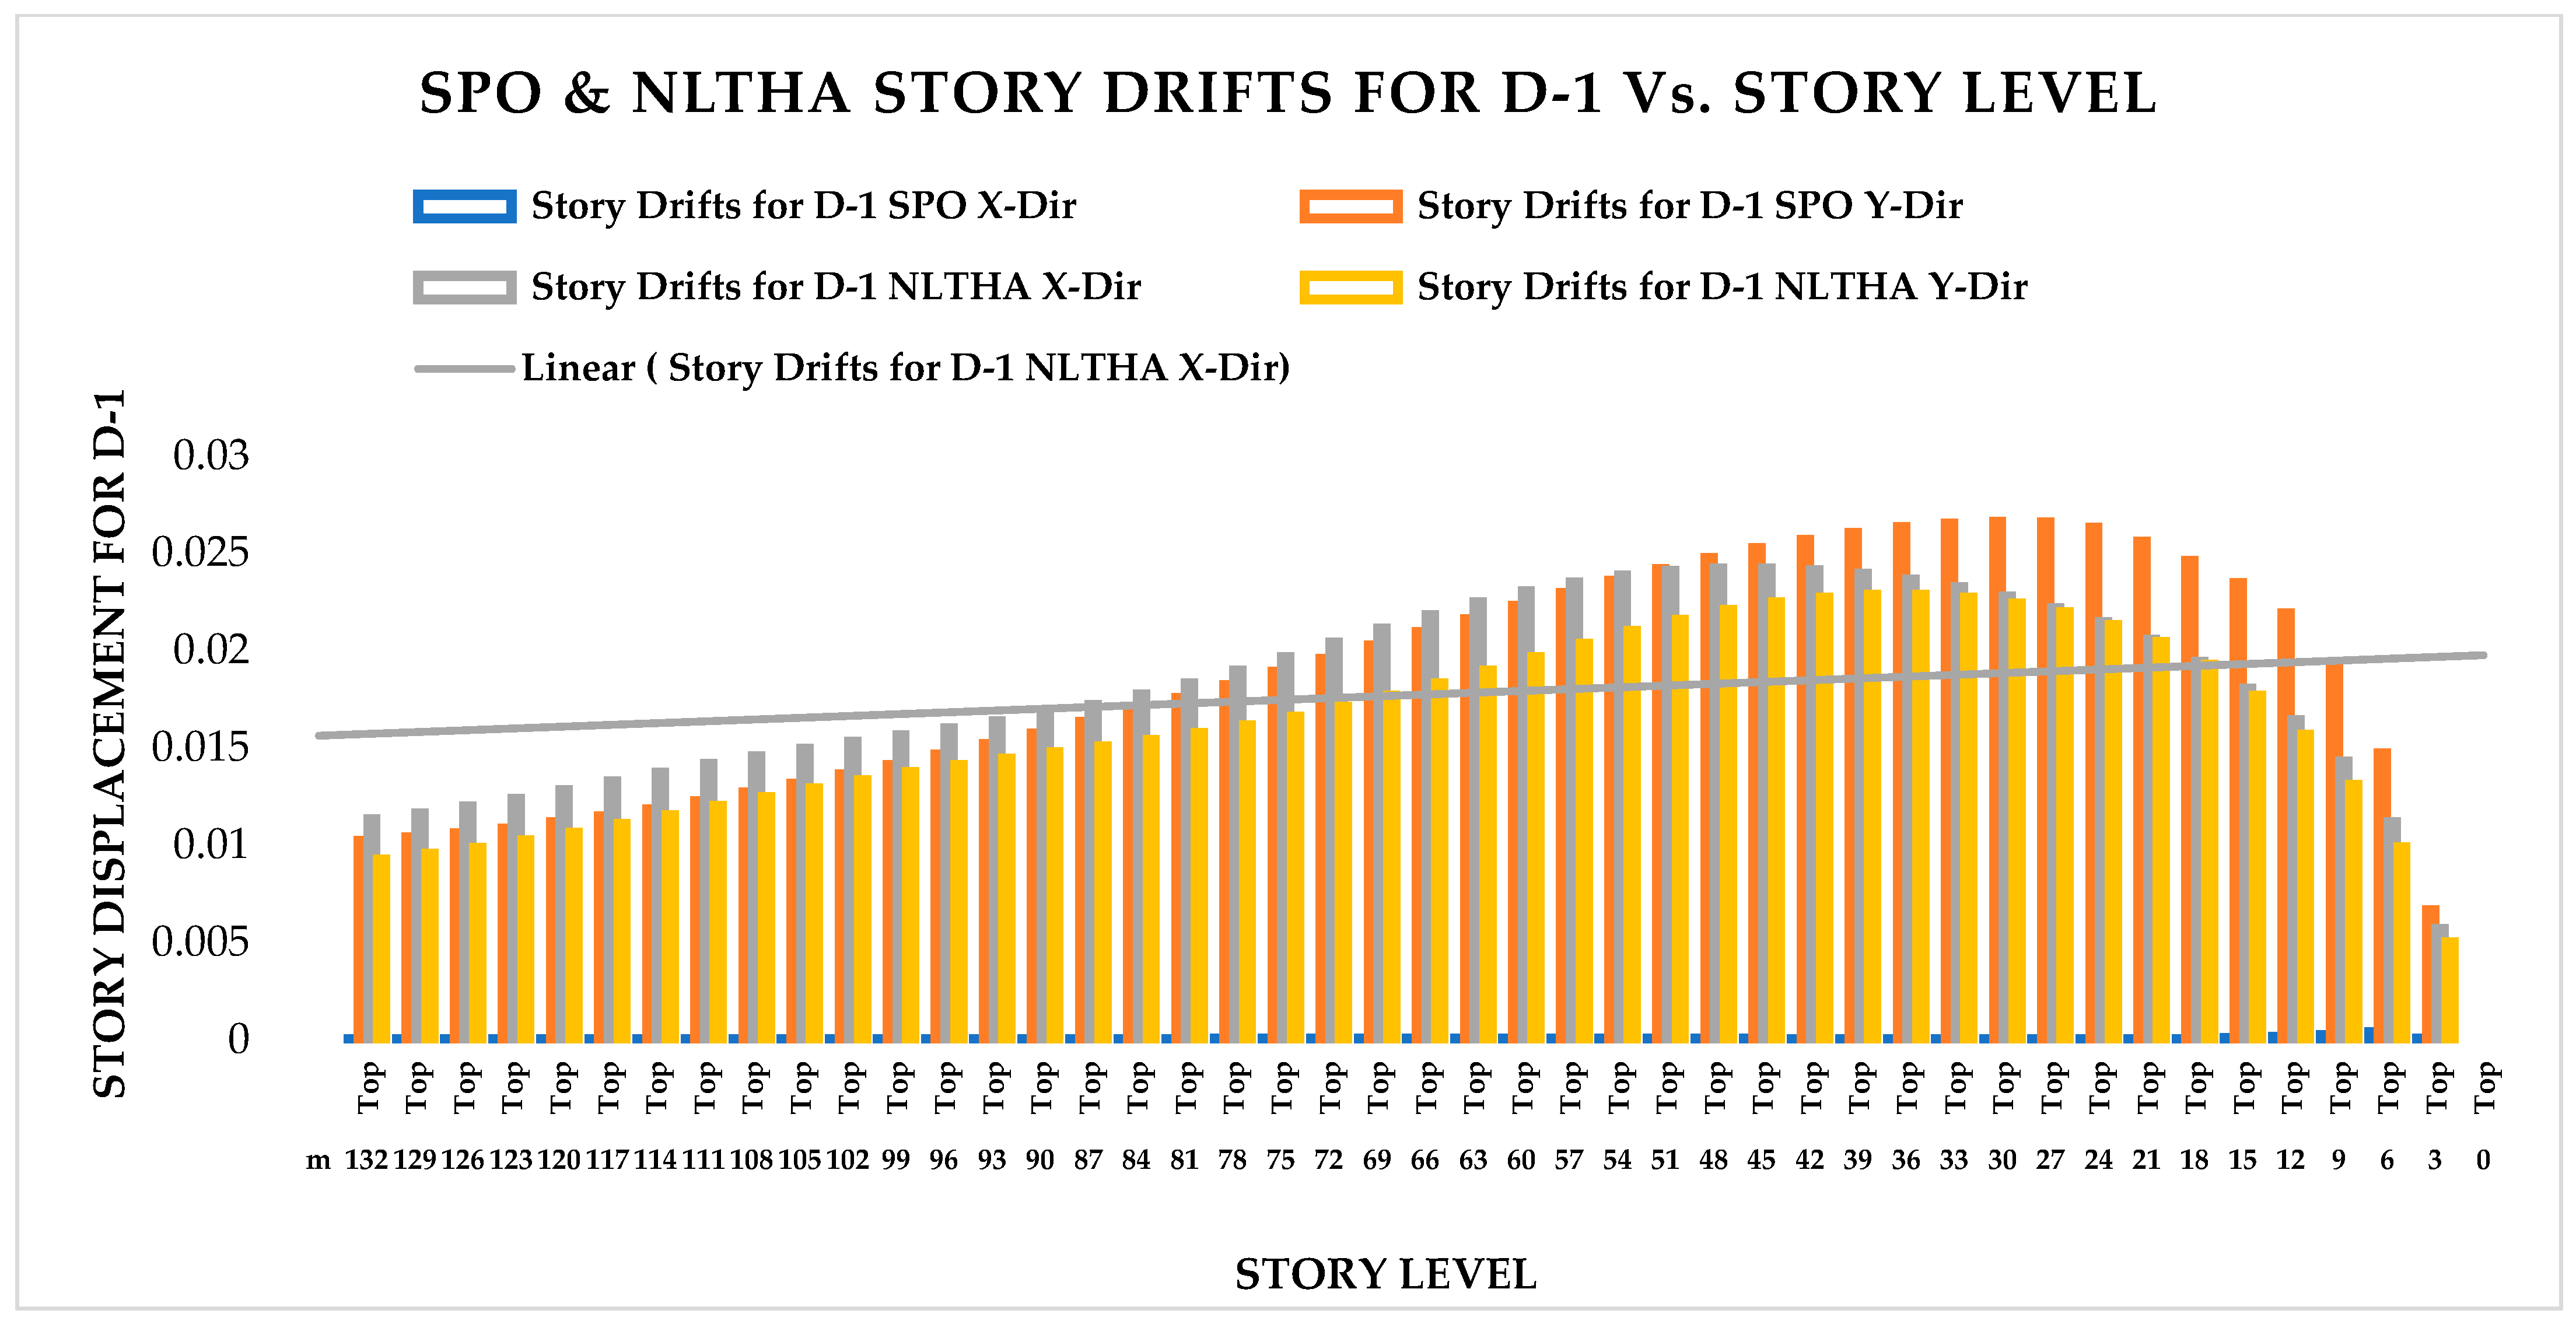
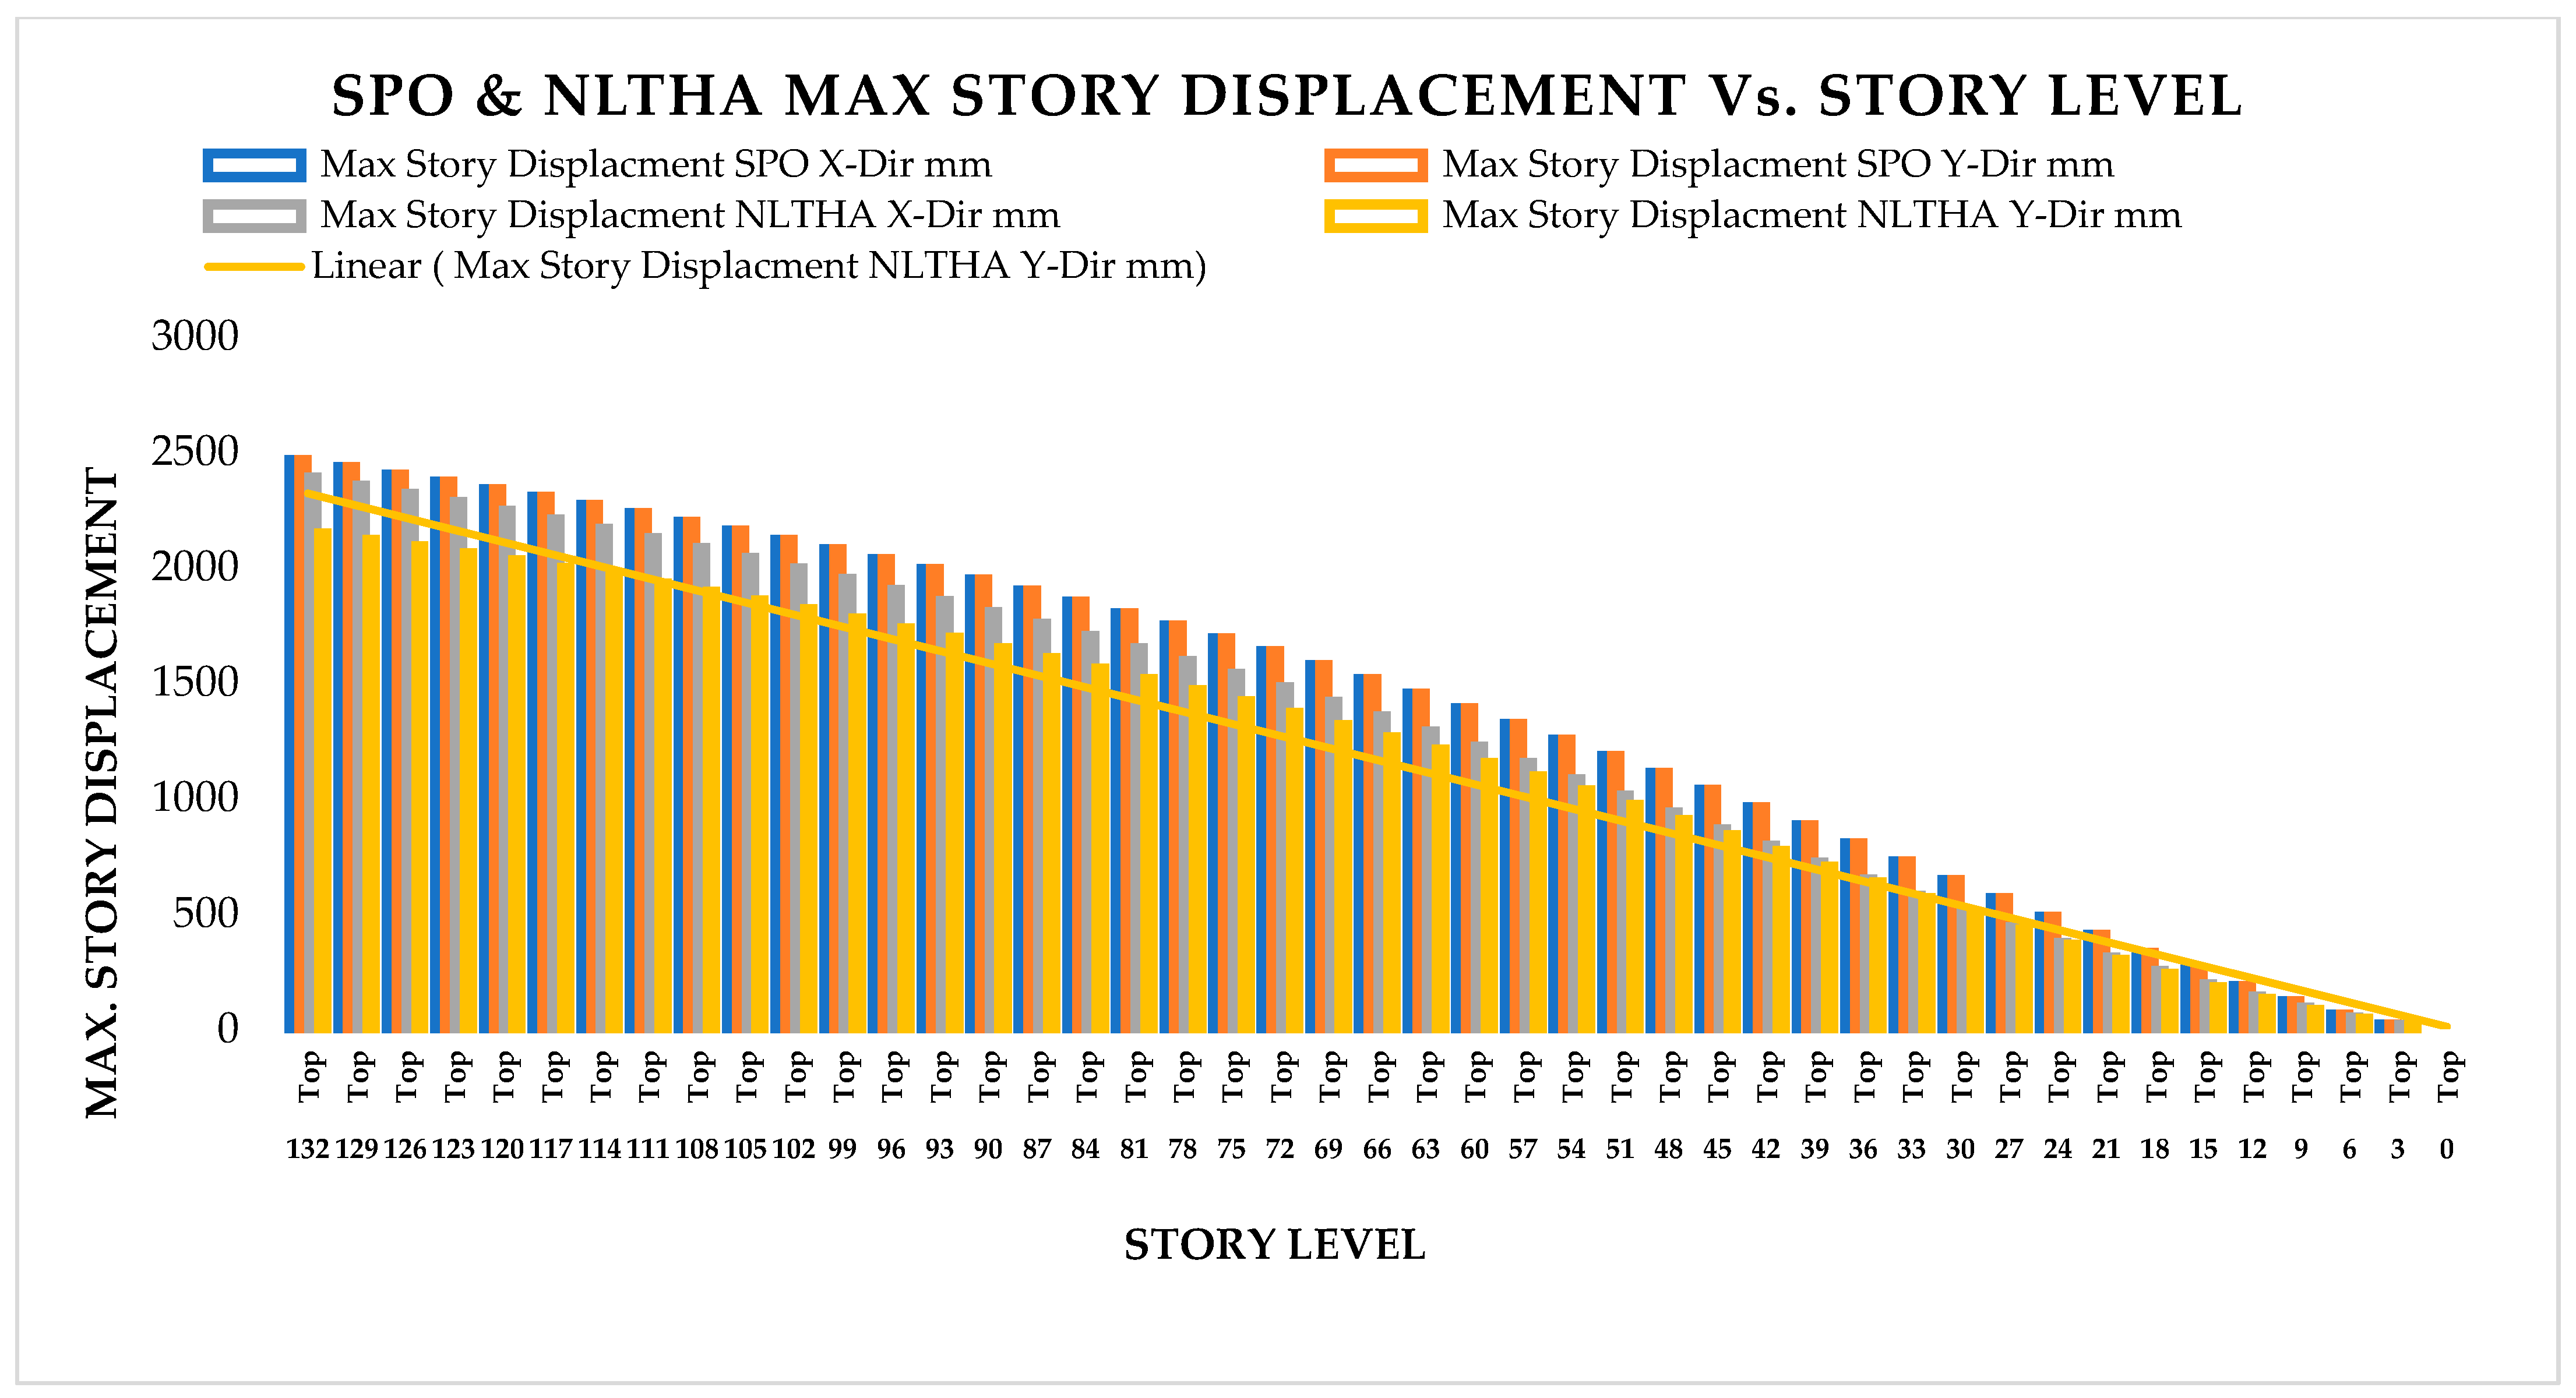
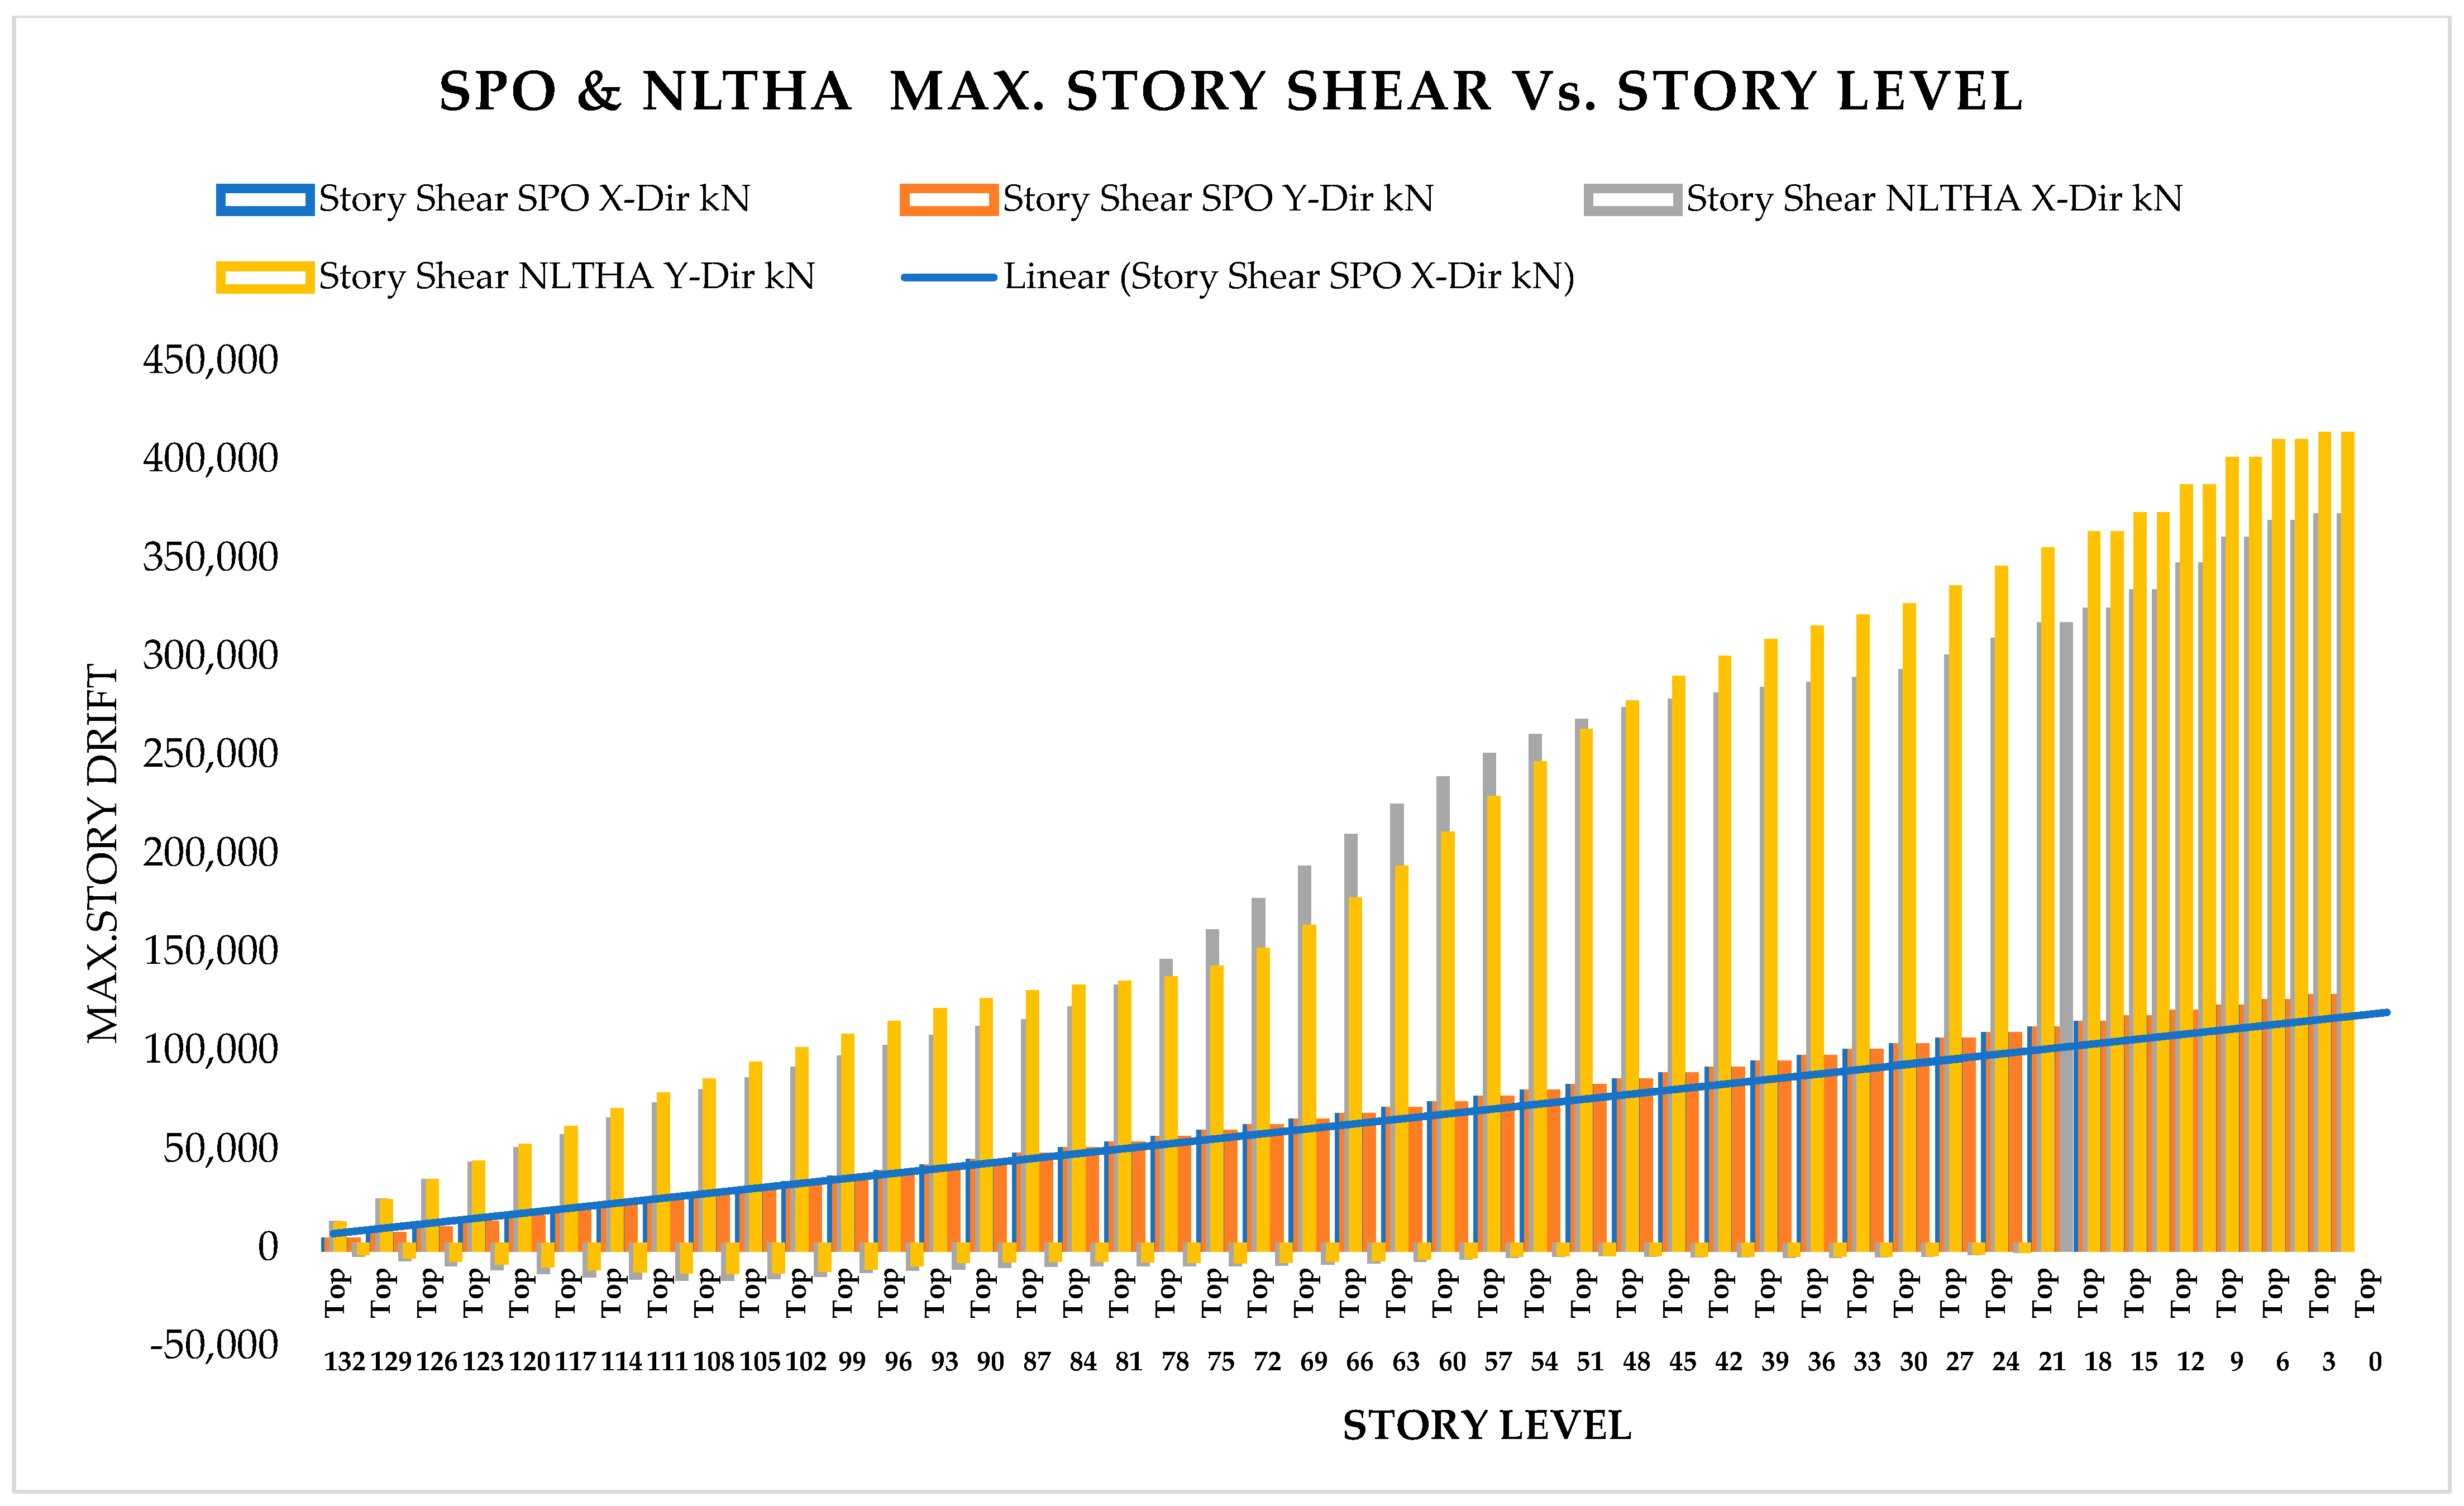
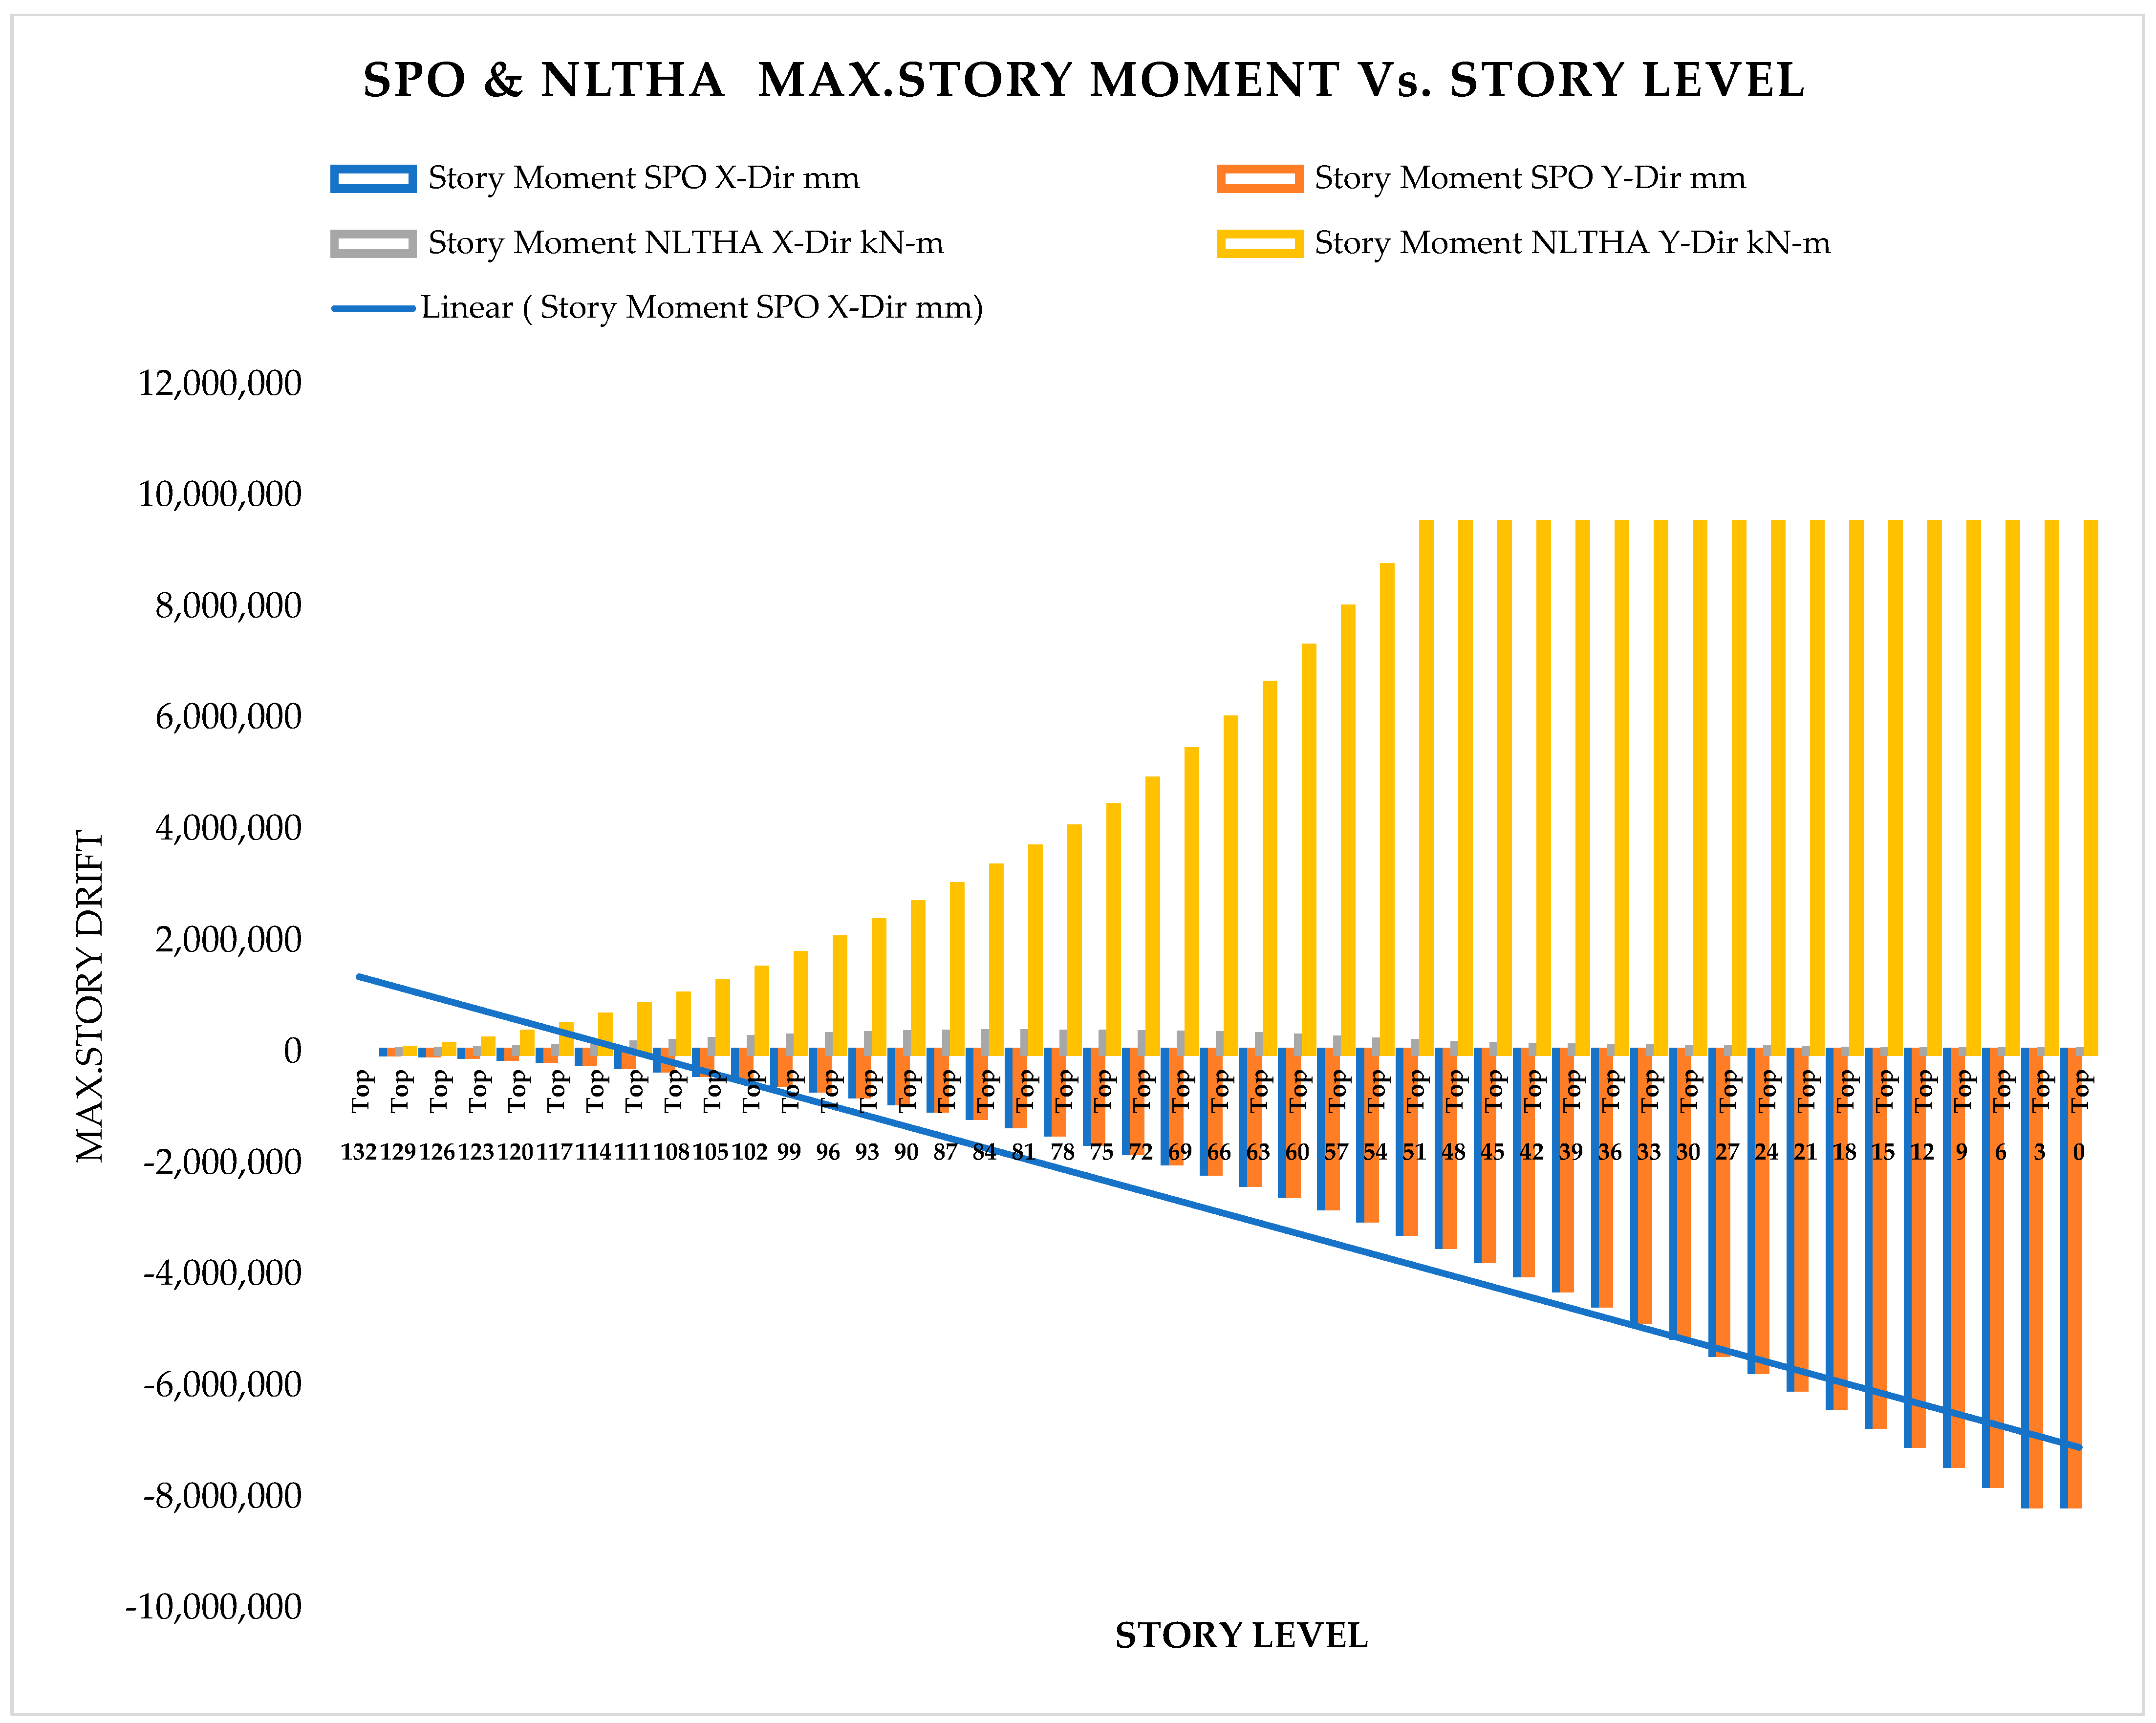
This section examines the result of 44-story model structures that use both SPO and NLTHA methods. The results of the dynamic and static studies are shown in Table 6 and Table 7, Figure A31, Figure A32, Figure A33, Figure A34, Figure A35, Figure A36, Figure A37, Figure A38, Figure A39, Figure A40, Figure A41 and Figure A42, along with the height of the RC structures. The result demonstrates that the global response diagrams generated by the 1st modal shape and dynamic analyses are extremely comparable. The maximum story displacements were 2464 mm and 2388.14 mm, respectively; the maximum inter-story drift ratio at 2.69 percent and 2.28 percent, respectively; story shear at 126,002.1933 K-N and 411,445.0987 k-N, respectively; and story overturning moment at 8,134,042 kN.m and 9,476,966.1221 kN.m, respectively.
In both NLTHA and SPO assessments, the inter-story drift of a 44-story RC building yields a greater SPO value, which is 15% higher than the NLTHA result. Similar to the inter-story drift result, the maximum story displacement is 3% higher. Story shear is 30.62% lower than NLTHA findings once more. Similar to the shear force finding, the story overturning moment is 7.6% lower than the NLTHA results, as shown in Figure 12, Figure 13, Figure 14, Figure 15, Figure 16 and Figure 17.

4.3. Performance Point Assessment

This section summarizes the results of performance point analysis using SPO and NLTHA and discusses in detail how the analysis of two SPO and NLTHA independent model results based on capacity curves (pushover), drift, formation and distribution plastic hinges, and performance level conditions adopted in FEMA 356, ASCE 41-17, and ATC-40 according with the applicable code provision.
In addition, the SPO and NLTHA studies were used to compare the quality of plastic hinge formation in both models. The NLTHA study showed that plastic hinges are evenly distributed over the frame length, but in the SPO analysis, additional hinges are available at lower levels. Qualitative analysis shows that the structure of the SPO’s result of the lower story column hinge is approximately the same as that of NLTHA. Still, there are differences in the level of hinges. In all NLTHA research cases, the upper part of the structure of the beam hinge is observed to be at the IO level (immediate occupancy). Still, the formation of the column hinges is slightly higher in the SPO columns than in the NLTHA column result. It shows the differences in power dissipation methods between the two model analysis types. Nonetheless, the above small sample example of SPO and NLTHA findings for RC buildings gives important information since the SPO results are compatible with the NLTHA results, suggesting that SPO analysis is practical for the investigated model.

4.4. Nonlinear Static and Dynamic Analysis Verification

4.4.1. Pushover Curves

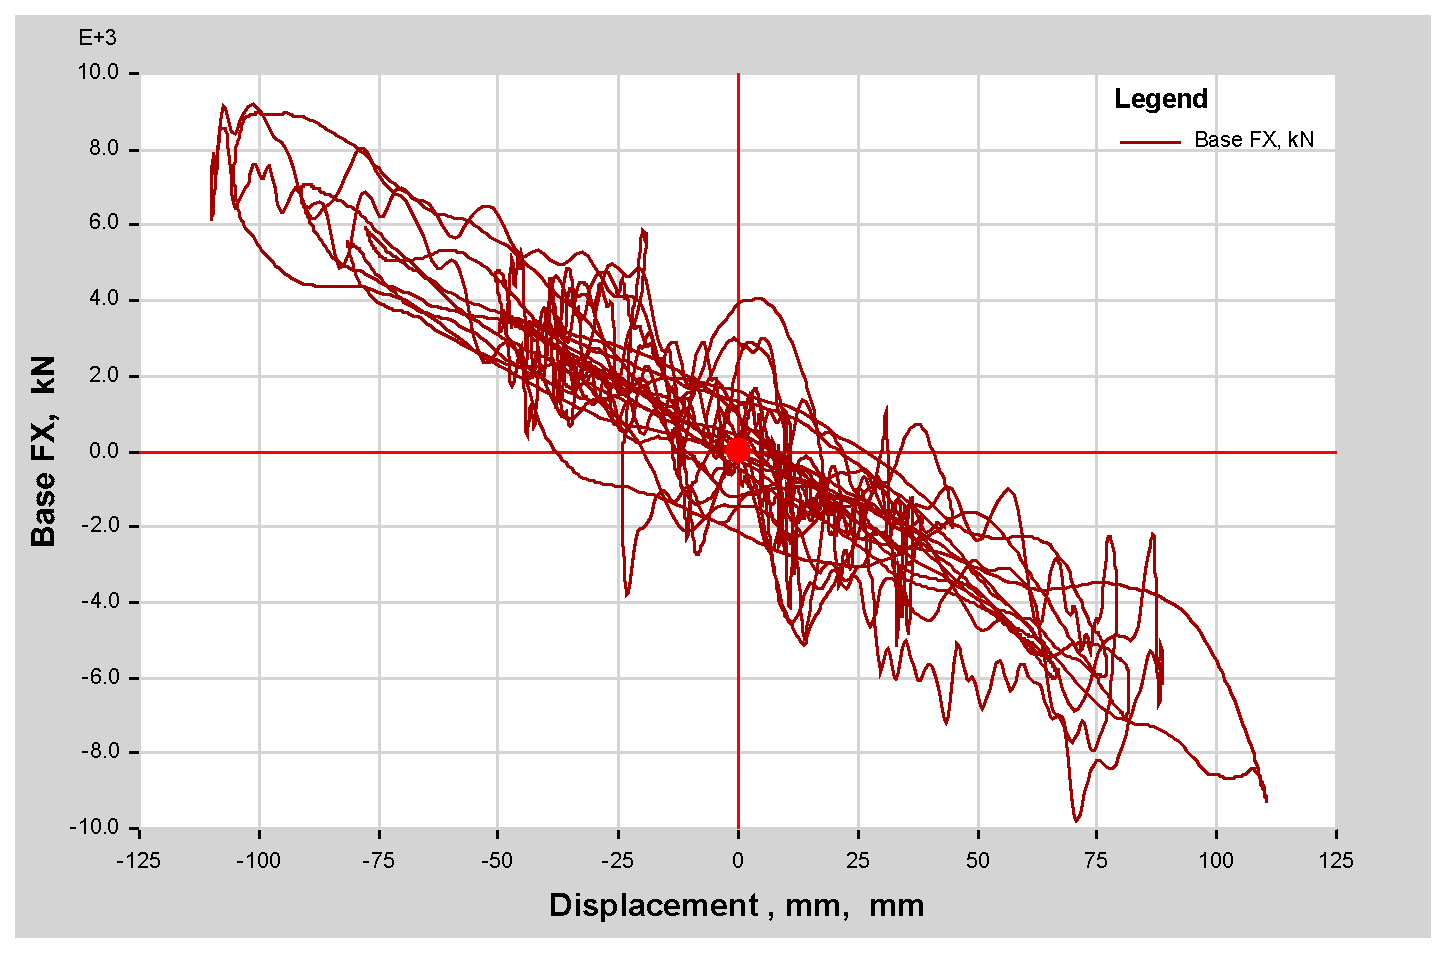
This section discusses the analysis results of the 44-story RC structure using SPO and NLTHA, emphasizing capacity curve, drift, and the formation of plastic hinges. The dynamic and static pushover curves are shown in Figure 18 and Figure 19. The dynamic pushover curve is obtained by scaling 11 real earth quicks. Initially, it was observed the dynamic curve was near the Mode-1 pattern. Again, it was observed that in both static and dynamic curves, NLTHA has a higher value than SPO results.

4.4.2. Performance Point Analysis as per ASCE 41-13 and FEMA 440 EL

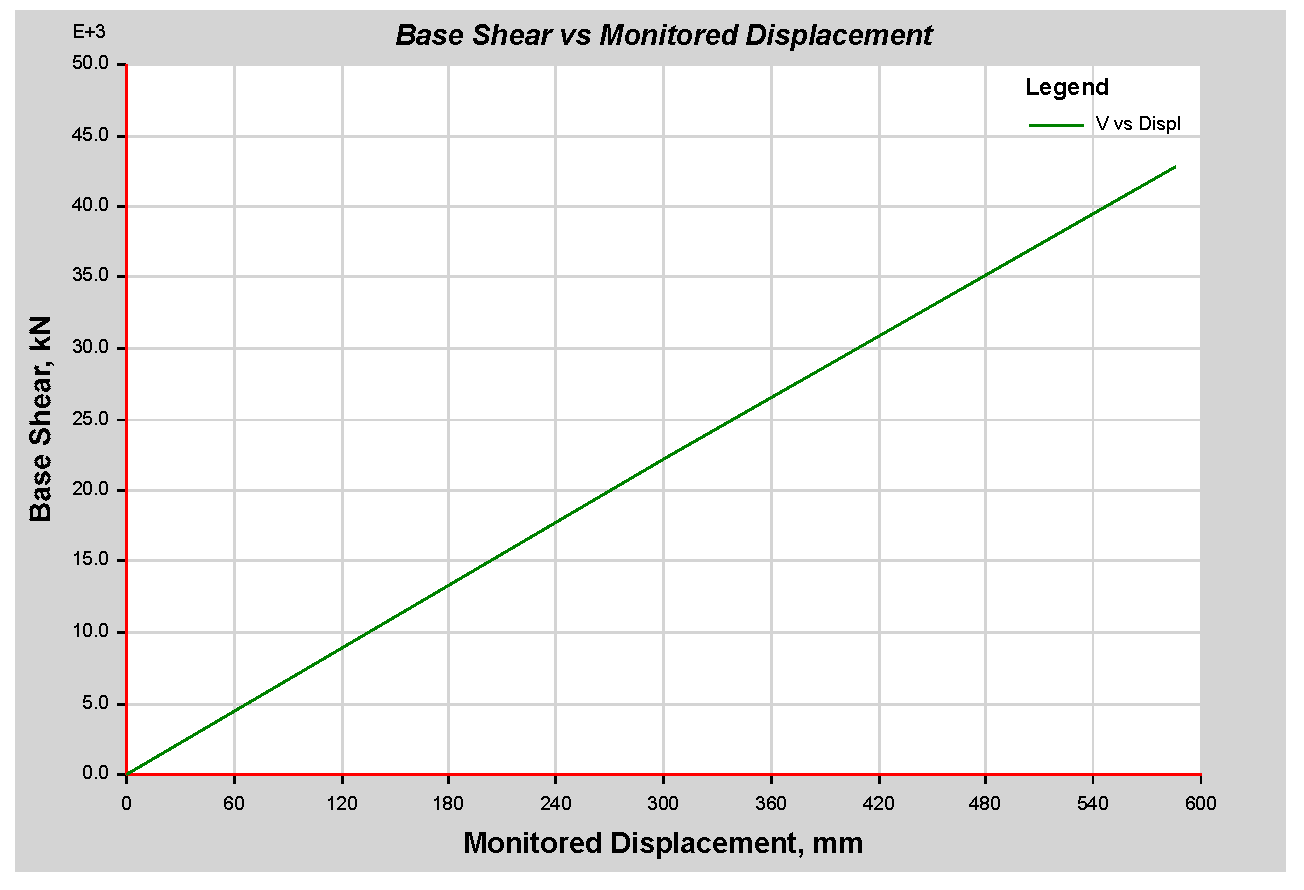
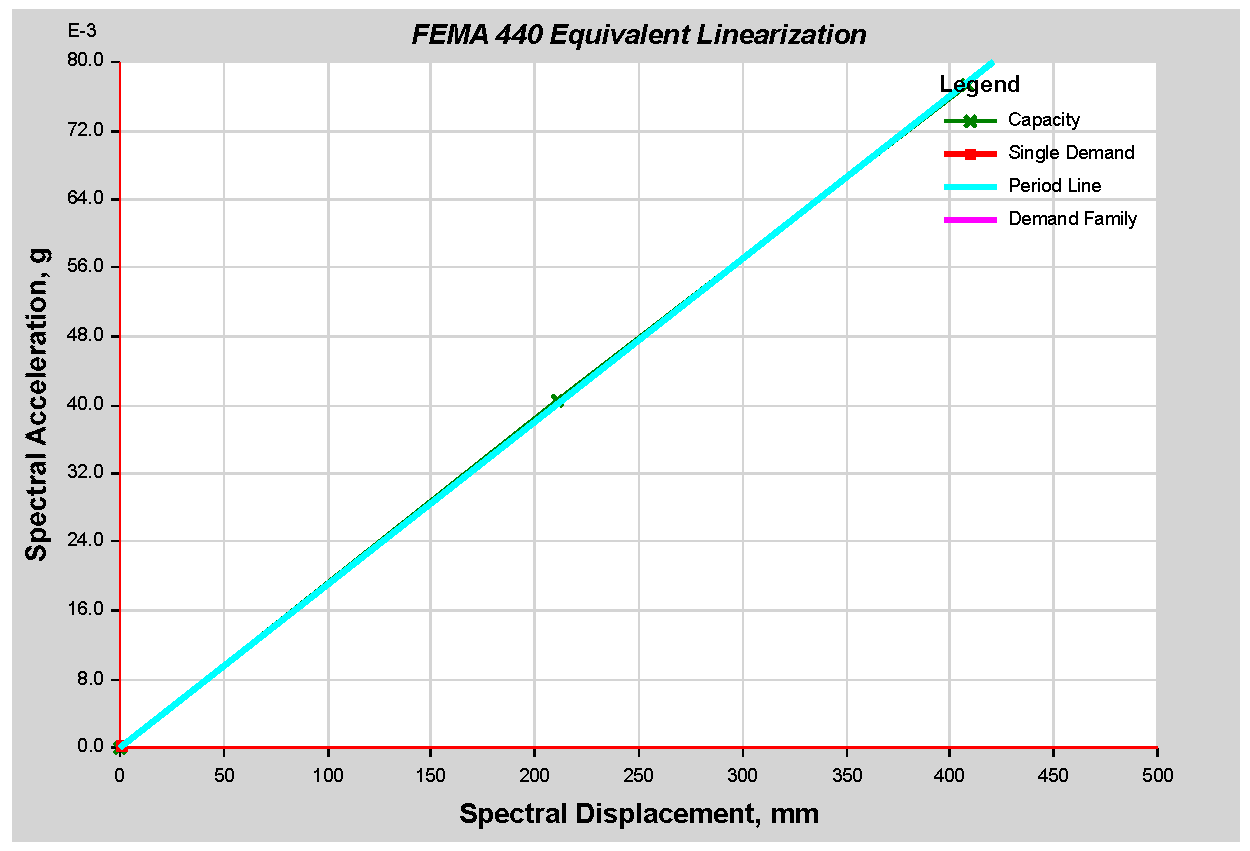
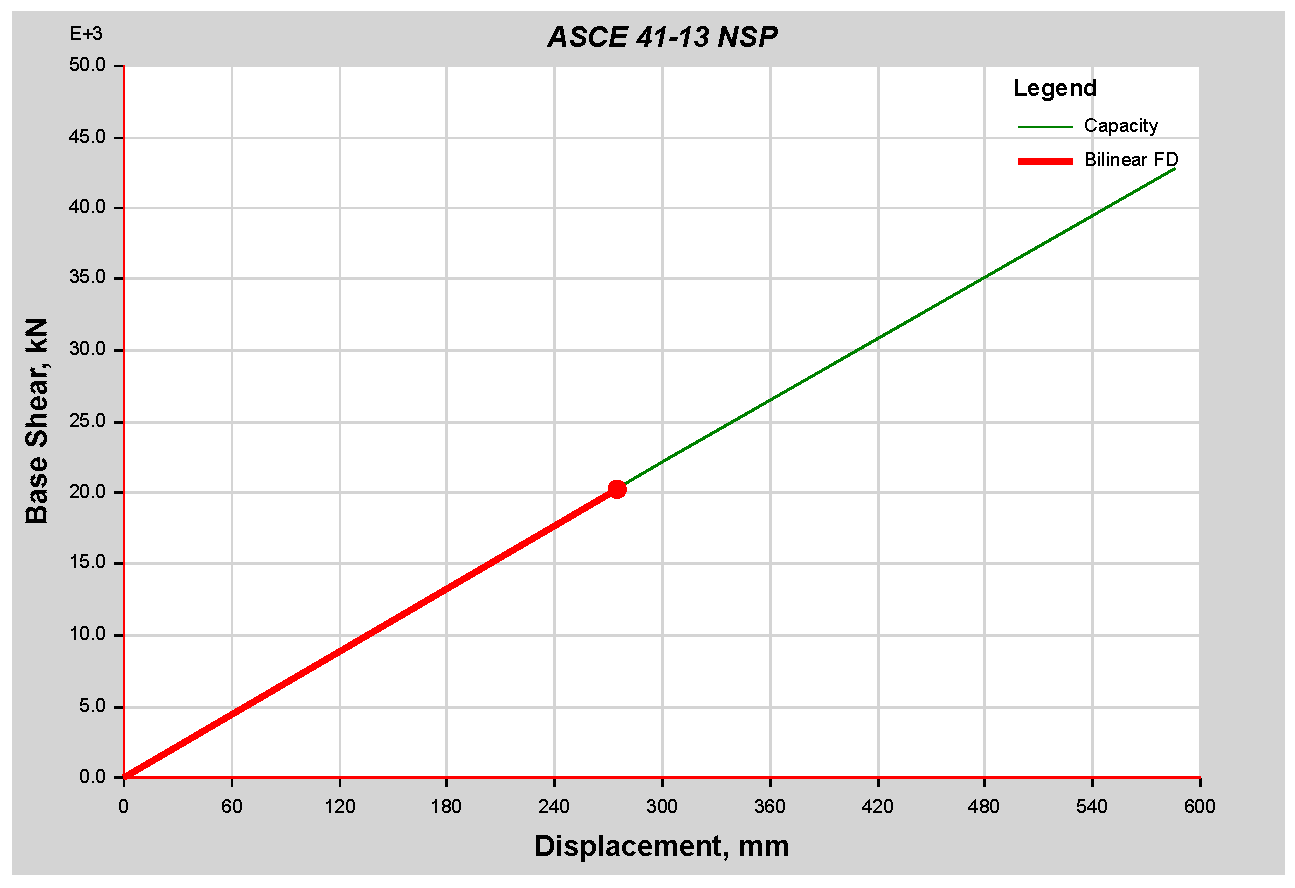
Figure 20 and Figure 21 show 44-story reinforced concrete sample buildings ASCE 41-13 SPO performance assessment graphs for the assigned target response spectrum type-I. The target displacement and base shear results are 114.751 mm and 16,694.9227 (kN). In addition, the performance point result found as per FEMA 440 EL is target displacement 120.294 mm and Shear 17,455.2248 kN with a slighter difference from the ASCE41-13 result. The SPO result was 2464.3 mm for a maximum shear force of 0.126002 × 10⁶ KN verified with NLTHA, and the dynamic pushover curve gives the exact target displacement, which is 2% of the height of the building, which was around 2358 mm for a higher maximum shear force of 0.411 × 10⁶ KN. The target displacement was maintained with different shear and moment capacities in both cases.

4.4.3. Inter-Story Drift

It was observed that the inter-story drift exceeds the ATC 40 life safety (LS) level to the mid-length of the model system in both analyses. In this case, there are no structures that exceed the level of collapse prevention (CP). Moreover, the observation of a dramatic decline in inter-story drift amid all models raises the relevant question. It is attached directly to the tracing and distribution of plastic hinges in columns and beams, which vary depending on the model of plastic hinges on the beam–column connection. All of the beam–column joints confirm the minimal strong column–weak beam capacity ratio, as stated earlier in the design. Thus, until the performance point evaluation study is completed, it may be impossible to determine whether ES8-15 adheres to the Eurocode 8-2004 intended structure to satisfy or not the longer future seismic force in the nonlinear variety range. The roof drift of 2% may exceed the design limit. It is also worth noting that one of the primary goals of seismic performance analysis is to identify any design flaws. Nonetheless, the ductility of ES8-15 has been exaggerated.

4.4.4. Plastic Hinge Formation for Different Performic Point Levels

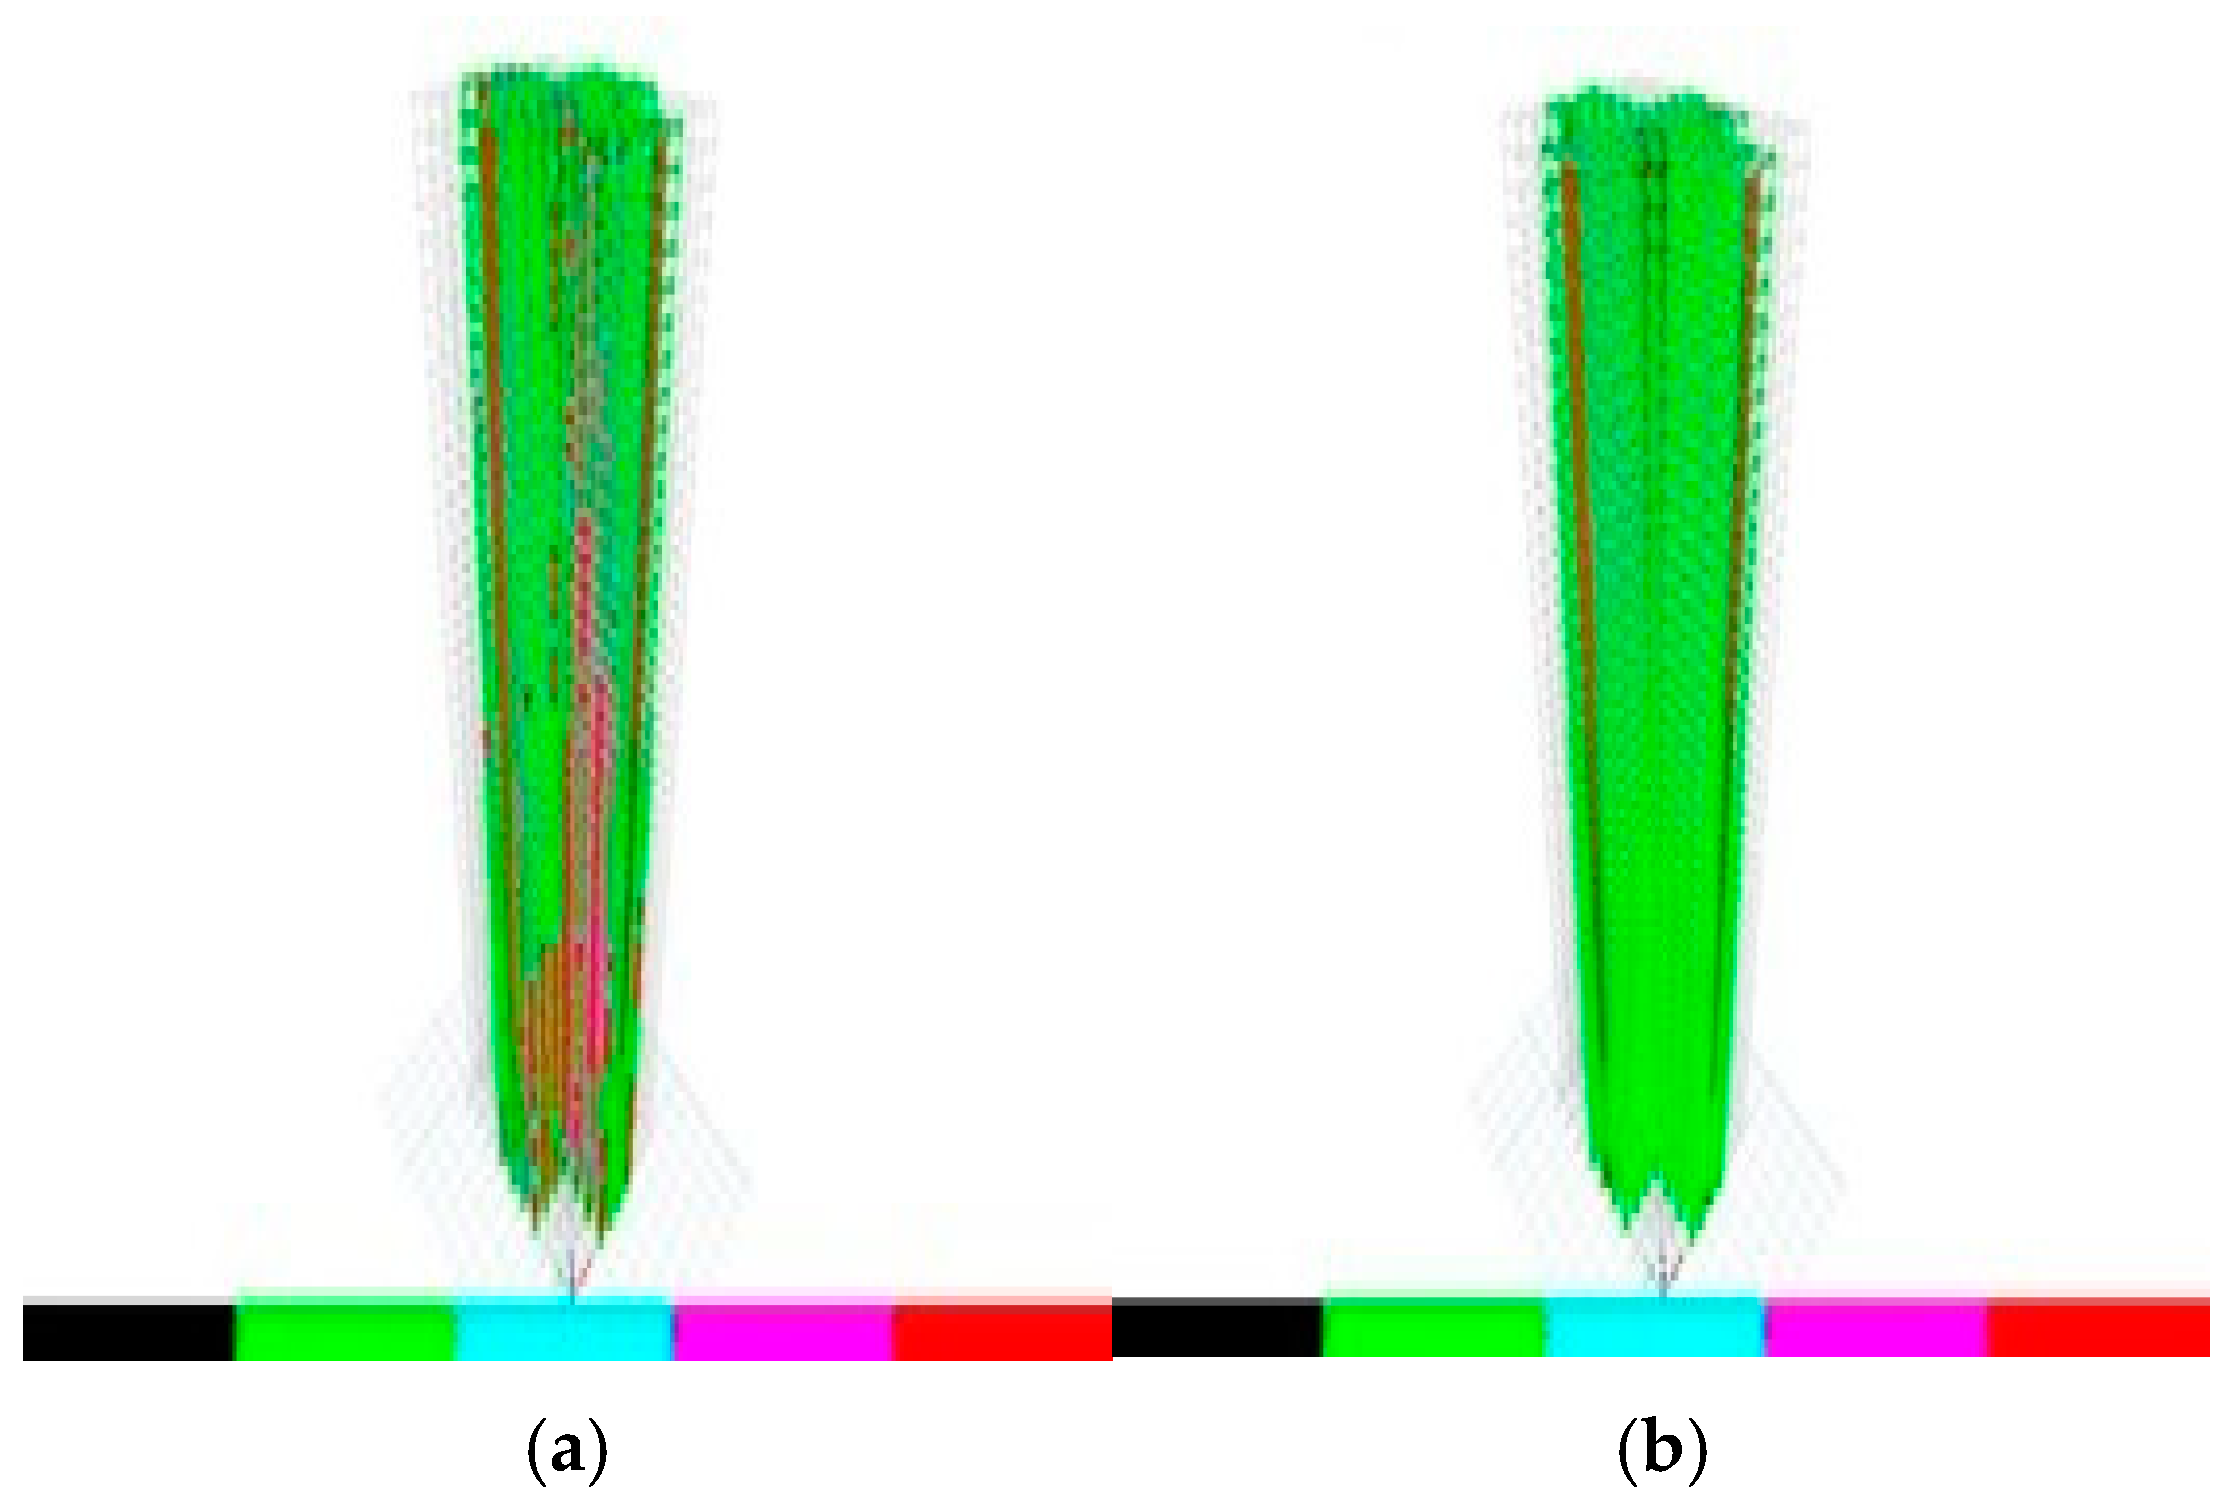
Plastic rotation limits in beams and columns for immediate occupancy (IO), life safety (LS), and collapse prevention (CP) are shown in Figure 22a,b, Figure 23, Figure 24, Figure 25, Figure 26, Figure 27 and Figure 28 which show the plastic hinge definition frame with plastic hinges at the end of the push steps. The structure is shown with a 2% shift in the roof due to the uniform load pattern.
Plastic hinges were commonly found in the lower part of building structures using both analysis types and conforming to all load patterns. Additionally, when the structure was under the same ground load pattern, plastic hinges were usually introduced on the first-story column. Regardless of several issues, all models showed the same trend of plastic hinge formation. Except for a few systems, the beam-sway method was notable, indicating that the design meets the predicted requirement of a strong/weak column.
As per the qualitative analysis result, The SPO hinge pattern of the 44-story model frame is shown in Figure 22a, and the NLTHA hinge pattern of the 44-story model structure is shown in Figure 22b. Although most of the designed column hinges as per ES8-15 are within the LS and IO Levels, several hinges have passed the CP level from the 1st to the 24th floor, as opposed to the upper floor in the case of SPO analysis rather than NLTHA. This demonstrates more hinges are formed at the lower part of the model.
Similarly, Figure 23 and Figure 24 show 44-story sample RC building D/C ratios for the performance objective of immediate occupancy (IO) for SPO and NLTHA, respectively. Some frame elements were found between the 0 and 0.5 zone for this particular sample building. For the 4th to 13th floors, some frames fall in between the 0.5 and 0.75 zone. Again, in the same region, some frames fall in between the 0.7 and 0.9 zone. In addition to that, none of the frames passed the CP level in the case of SPO. However, for NLTHA, all the column and beam frame elements fall in between the 0 and 0.5 safe zone concerning IO and CP levels.
Figure 25 and Figure 26 show 44-story RC building D/C ratios for the performance objective of Life Safety (LS) for SPO and NLTHA, respectively. For this particular situation, all frames fall in the 0 to 0.5 zone. None of the frame elements passed this threshold for both analysis methods.
In addition, Figure 27 and Figure 28 show 44-story RC building D/C ratios for the performance objective of collapse prevention (CP) for SPO and NLTHA, respectively. For this particular sample building, all the frames fall within the 0 to 0.5 safe zone with respect to IO and CP levels.
In short, plastic hinge formations of columns in 44-story buildings under SPO analysis are much larger, closer to the life safety threshold, and collapse faster than NLTHA for all structures exposed to equal target roof displacement. Additionally, when SPO-designed structures are compared to NLTHA-designed structures, plastic hinges are created earlier in beams than in columns. As a result, it is determined that the ES8-15 structure maintains a strong column–weak beam configuration. Additionally, this demonstrates that the stiffness distribution in ES8-15 is reasonably comparable.

5. Conclusions

The seismic performance of the 44-story linear and nonlinear RC sample building was designed according to the ES8-15, FEMA 356, ASCE 41-17, and ATC 40 recommendations. This study investigated the SPO and NLTHA techniques. In both of these design processes using nonlinear and linear sample models, the study used the same 44-story RC model frame developed using a capacity design approach.
Following SPO design processes mentioned in FEMA 356, ASCE 41-17, ATC 40, and the provisions in the relevant ES8-15 codes for verification purposes, NLTHA was used to evaluate the result obtained from SPO analysis. A comprehensive analysis of the nonlinear timeline history with 11 selected EQ was performed on a 44-story RC structure, which ensures good agreement with SPO analysis results. Overall, from linear and nonlinear analysis results, significant conclusions were identified and presented as new scientific knowledge about the issues of designing earthquake-resistant reinforced concrete structures, engineering application of the obtained results, and the development of scientific research on this topic in the future as follows:
  • PART-1 New scientific knowledge about the issues of designing earthquake-resistant reinforced concrete structures.
  • As per Classical Modal Analysis, the RSA and LDTHA analyses of the sample linear 44-story buildings show that the structure’s four global responses are higher for LDTHA than for the RSA analysis result.
  • As per linear analysis results for 44-story buildings, LDTHA shows maximum story displacement of 25.68%, maximum inter-story drift ratio of 25.68%, story shear of 15.35%, story overturning moment of 27.5%, fundamental period 2% higher than RSA results of observed.
  • As per the linear elastic analysis result the fundamental period first mode found from classical modal analysis for 44 stories was 3.956 s. From RSA analysis, the 1st mode period was 3.806 s. Similarly, the fundamental period for DLTHA was found to be 3.883 s, which indicates that the 44-story model used in the study was correctly implemented. In addition, for all three analyses, it has been observed that the first two modes are translational, and the third mode is torsional as required by different coda and guidelines.
  • As per the Pushover Analysis result of roof displacement of up to 2% by the ATC 40 recommendation, the output generated was a smaller capacity curve than NLTHA. This demonstrated that NLTHA analysis is superior to SPO analysis and it also justifies the claim that SPO analysis is an approximate analysis type.
  • PART-2 Engineering application of the obtained results.
As per the analysis result following ES8-15, FEMA 356, ASCE 41-17, and ATC 40 recommendations, more plastic hinges and energy dissipation first appear on the beams rather than on the columns. This shows the excellent scenario of a weak beam and strong column case, and they are evenly distributed along the length of the structure. The result also shows that for the 44-story RC sample building as per ASCE 41-13 SPO performance assessment graph, the target Displacement and Base Shear results are 114.751 mm and 16,694.9227 (kN). In addition,, the performance point result found as per FEMA 440 EL is target displacement 120.294 mm and Shear 17,455.2248 kN, with a slighter difference from the ASCE41-13 result. The result was verified with NLTHA and the dynamic pushover curve gives the exact target displacement at 2% of the height of the building, which was around 2358 mm for a maximum shear force of 0.411445 × 10⁶ KN. The nonlinear static result gives 2464.3 mm for a maximum shear force of 0.126002 × 10⁶ KN. This demonstrates that the performance of the sample building result was verified with NLTHA and it gives a satisfactory result. Hence, this result shows the use of SPO is adequate in a situation where finding real ground acceleration is difficult. Thus, until the performance point evaluation study is completed, it may be impossible to determine whether ES8-15 adheres to the Eurocode 8-2004 intended structure or is no longer favorable for future seismic force in the nonlinear range. The roof drift of 2% may exceed the design limit. It is also worth noting that one of the primary goals of seismic performance analysis is to identify any design flaws. Nonetheless, the ductility factor used in ES8-15 appears to be overestimated.
In general, we concluded the performance evaluation of all components created using the two analytical techniques. According to the code requirements, several fully flexible plastic hinge levels are available depending on the amount of earthquake force exerted on the structure. In addition, it demonstrates how the total number of hinges in the structure increased as the model was gradually pushed to achieve the 2% roof drift. For example, part of the hinge development is greater in IO than in LS and CP limits. Although all frames designed by ES8-15 using SPO and NLTHA techniques are below CP limits, more than 3% of frames exceed these limits in both tests. In general, hinges formed with a uniform load pattern are more important than Mode-1 hinges.
From the nonlinear analysis result it has been also concluded that in both NLTHA and SPO assessments, the inter-story drift of a 44-story RC building yields a greater SPO value, which is 15% higher than the NLTHA result. Similar to the inter-story drift result, the maximum story displacement is 3% higher. The story shear is 30.62% lower than NLTHA findings once more. Similar to the shear force finding, the story overturning moment is 7.6% lower than NLTHA results. In addition to the nonlinear analysis result, it has also been concluded that the SPO and NLTHA studies were used to compare the quality of plastic hinge formation in both models. As per the result in the NLTHA study, plastic hinges are evenly distributed over the frame length, but in the SPO analysis, additional hinges are available at lower levels. Qualitative analysis shows that the structure of the SPO result of the lower story column hinge is approximately the same as that of the NLTHA, but there are differences in the number of hinges observed. In all NLTHA research cases, the upper part of the structure of the beam hinge is observed to be at the IO level (immediate occupancy). Still, the formation of column hinges is slightly higher in SPO columns than in the NLTHA column result. This shows the differences in power dissipation methods between the two model analysis types. Nonetheless, the small sample example of SPO and NLTHA findings above for RC buildings gives important information, since the SPO results are compatible with the NLTHA results, suggesting that SPO analysis is practical for the investigated model.
  • PART-3 The development of scientific research on this topic in the future.
  • Future research could explore how the study highlights that until the performance point evaluation study is completed, it may be impossible to determine whether ES8-15 adheres to Eurocode 8-2004 intended structure or is no longer favorable for future seismic force in the nonlinear range. The roof drift of 2% may exceed the design limit.
  • For future research it is also worth noting that one of the primary goals of seismic performance analysis is to identify any design flaws. Nonetheless, the ductility factor used in ES8-15 appears to be overestimated.
  • Future research could explore improved modeling techniques to refine SPO and NLTHA comparisons, particularly in identifying cases where SPO could be a practical alternative when real ground acceleration data is difficult to obtain.
  • Further studies could analyze different load patterns and their effects on hinge formation and energy dissipation across varying high-rise building configurations.
  • Additional research should focus on optimizing weak beam–strong column design strategies to enhance structural performance under extreme seismic loads.
Author Contributions

Conceptualization, V.W.Y.T., A.C.J.E. and M.A.; methodology, V.W.Y.T., A.C.J.E. and M.A.; software, M.A.; validation, formal analysis, V.W.Y.T., A.C.J.E. and M.A.; investigation, V.W.Y.T., A.C.J.E. and M.A.; resources, V.W.Y.T., A.C.J.E. and M.A.; data curation, V.W.Y.T., A.C.J.E. and M.A.; writing—original draft preparation, M.A.; writing—review and editing, V.W.Y.T., A.C.J.E. and M.A.; visualization, V.W.Y.T., A.C.J.E. and M.A.; supervision, V.W.Y.T., A.C.J.E. and M.A.; project administration, V.W.Y.T., A.C.J.E. and M.A. All authors have read and agreed to the published version of the manuscript.

Funding

This research received no external funding.

Data Availability Statement

The data presented in this study are available on request from the corresponding author. The data are not publicly available due to EIT privacy policy.

Acknowledgments

The authors extend their deepest gratitude to the Engineering Institute of Technology for their great support.

Conflicts of Interest

The authors declare no conflicts of interest.

Appendix A

Table A1. ES8-15 adheres to Eurocode 8-2004 regulations values of Type 2 Response Spectrum with (M < 5.5).
Ground TypeSTB(S)TC(s)TD(s)
A1.00.050.251.2
B1.350.050.251.2
C1.50.100.251.2
D1.80.100.301.2
E1.60.050.251.2
Table A2. Parameters for Type I (M ≥ 5.5) elastic response spectra ES8-15 adheres to Eurocode 8-2004 regulations.
Ground TypeSTB(S)TC(s)TD(s)
A1.00.150.402.0
B1.200.150.502.0
C1.350.200.602.0
D1.40.200.802.0
E1.40.150.502.0
Figure A1. Mean Matched Spectrum for 11 Selected Ground Accelerations and Target Spectrum as per ES EN 1998-15.
Infrastructures 10 00093 g0a1
Figure A2. Target Response Spectrum as Per ES8 EN 1998-15 and Eurocode 8-2004.
Infrastructures 10 00093 g0a2
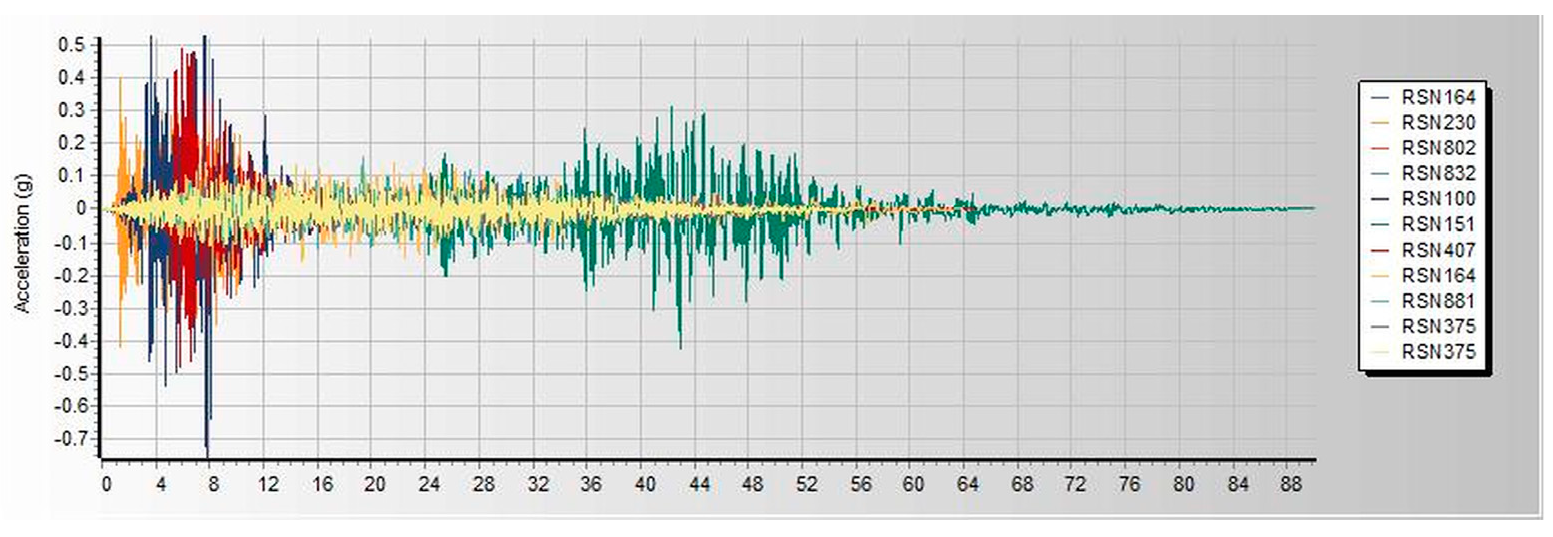
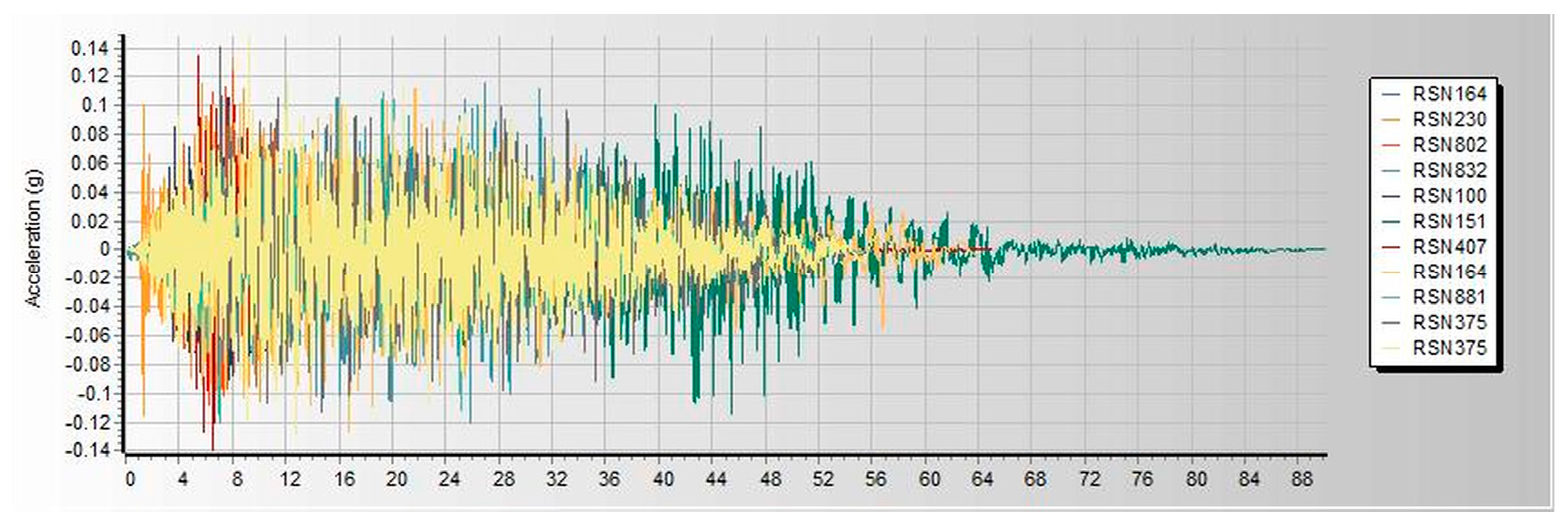
Figure A3. SeismoMatch Representation of Acceleration (g)-Time (s) Eleven Ground Motions.
Infrastructures 10 00093 g0a3
Figure A4. Force–Displacement Representation of IO, LS, and CP Levels.
Infrastructures 10 00093 g0a4
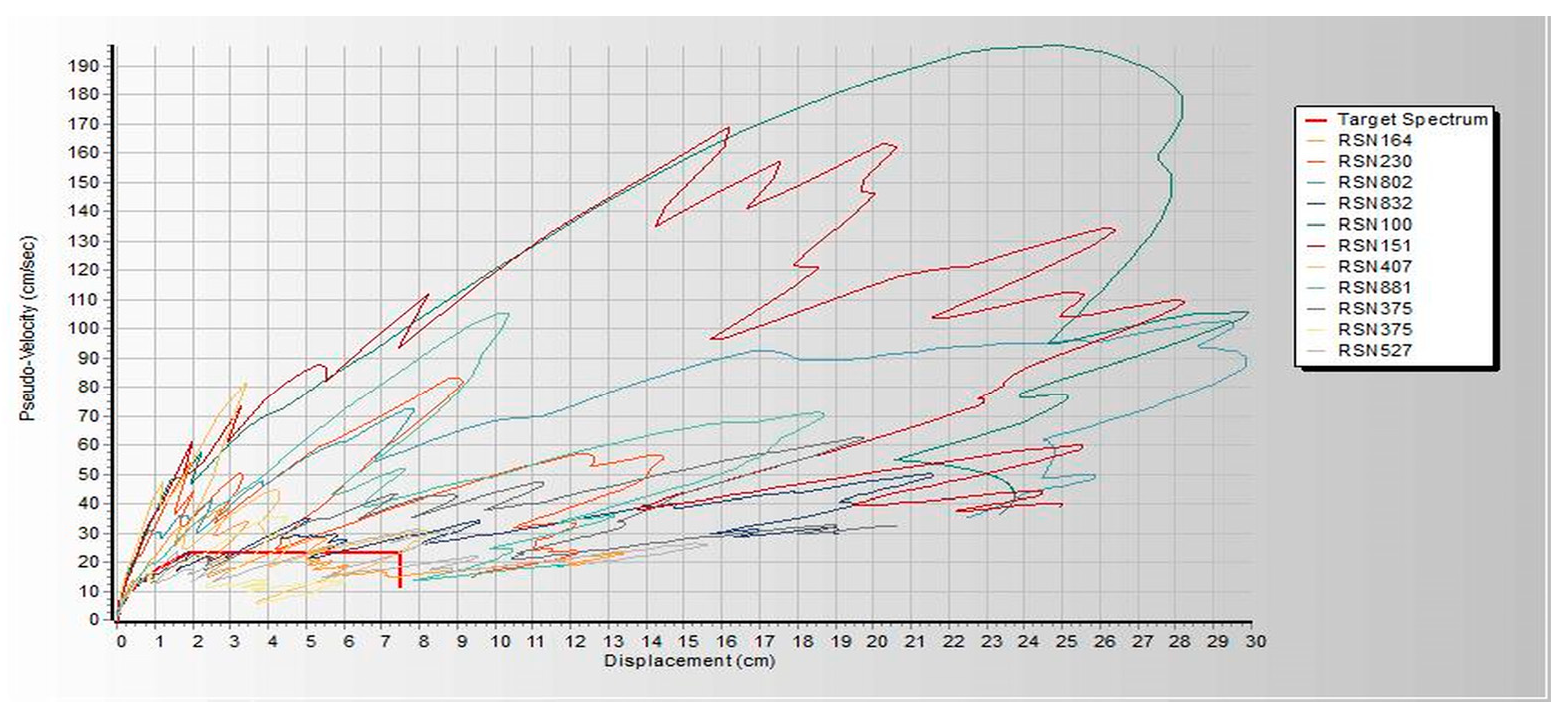
Figure A5. SeismoMatch Representation of Pseudo-Velocity (cm/s)-Displacement (cm) Eleven Ground Motions.
Infrastructures 10 00093 g0a5
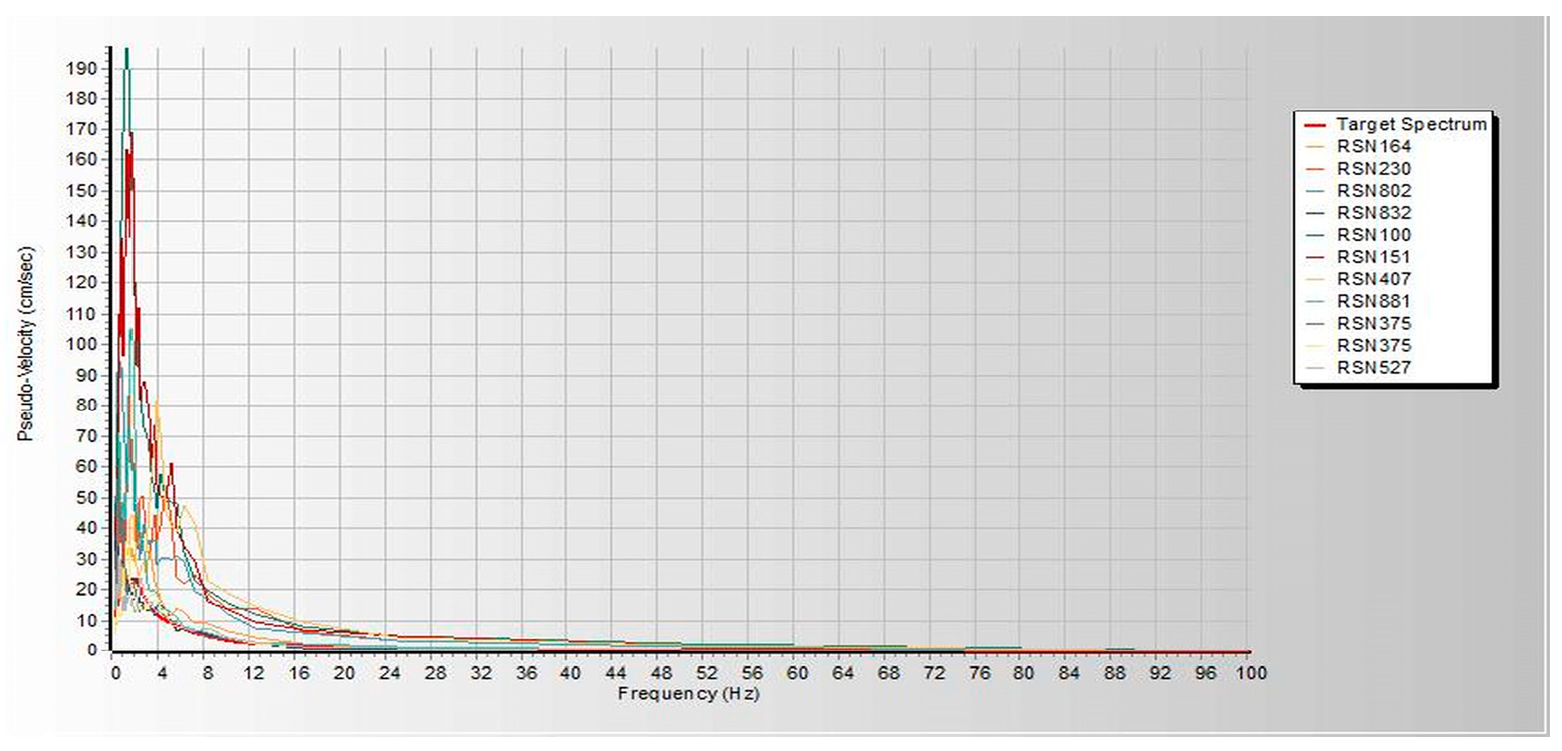
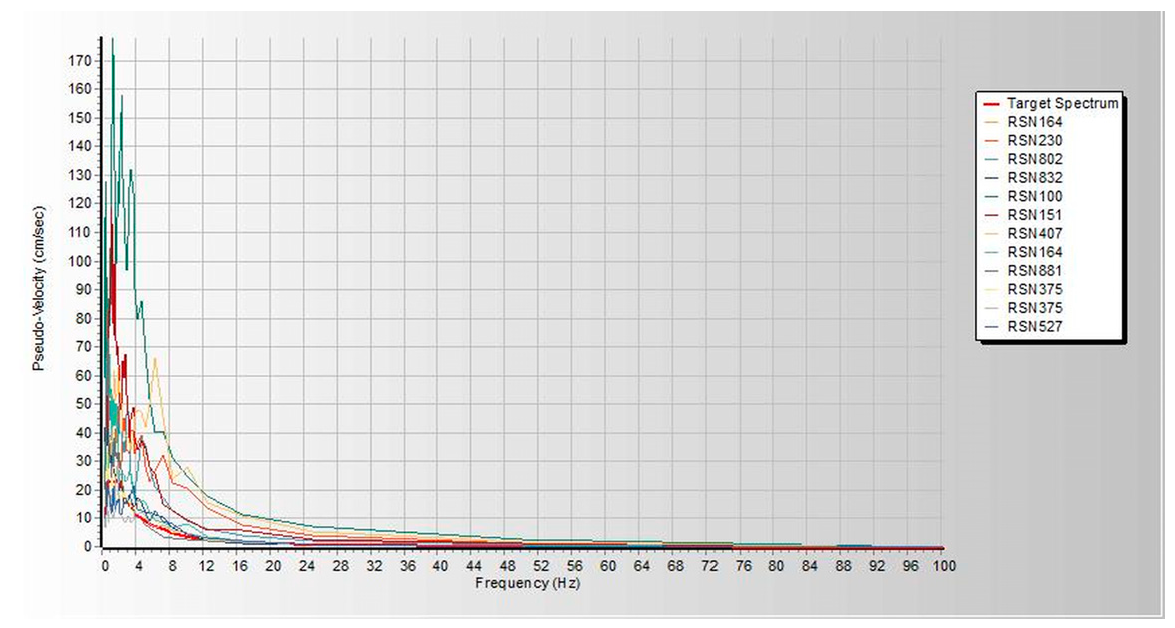
Figure A6. SeismoMatch Representation of Pseudo-Velocity-Frequency (Hz) Eleven Ground Motions.
Infrastructures 10 00093 g0a6
Figure A7. Sample 1-SeismoMatch Representation of Acceleration (g)-time t (s) Eleven Ground Motions.
Infrastructures 10 00093 g0a7
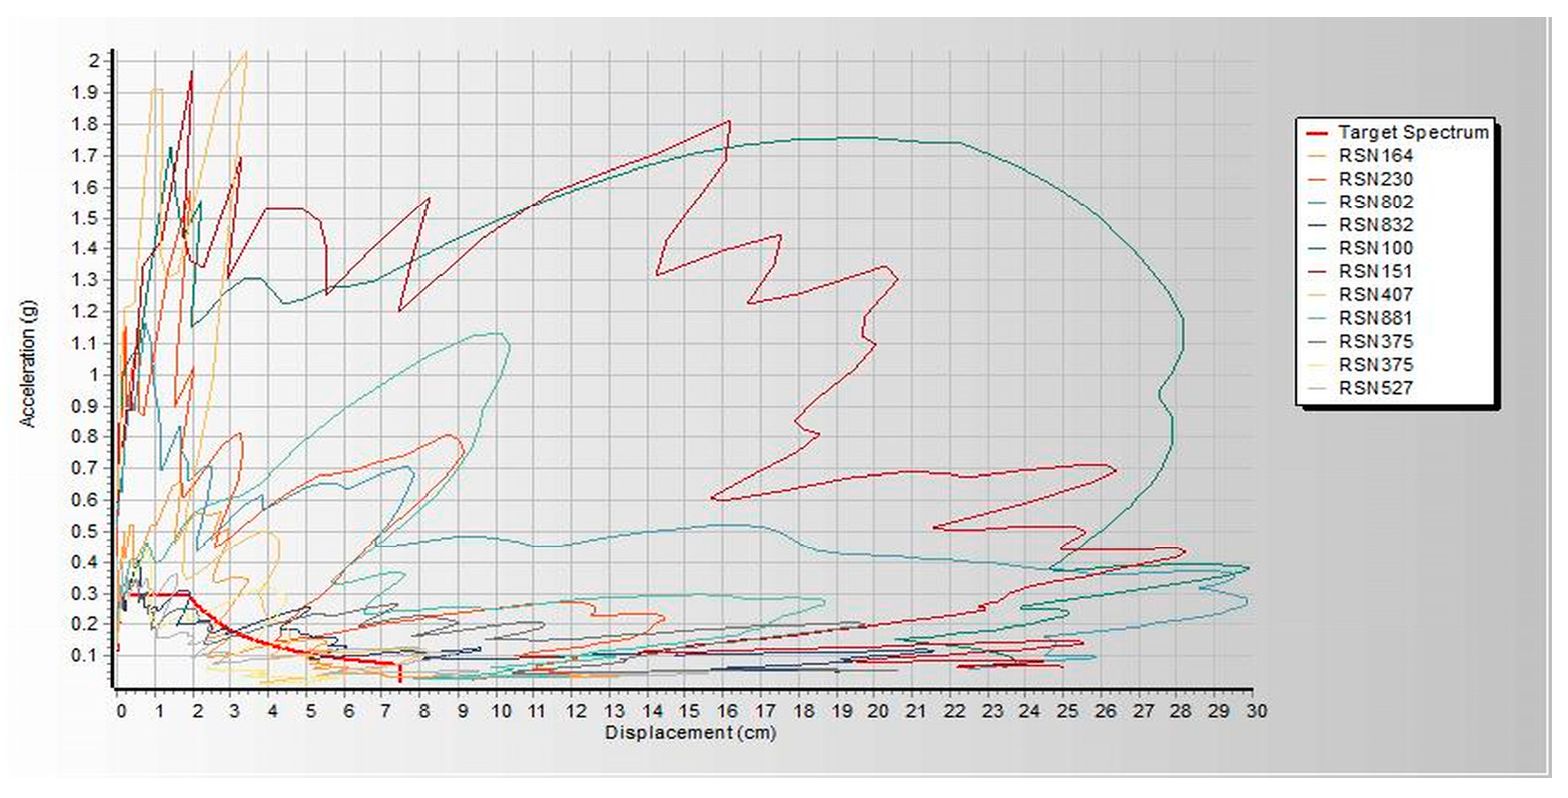
Figure A8. SeismoMatch Representation of Acceleration–Displacement (cm) Eleven Ground Motions.
Infrastructures 10 00093 g0a8
Figure A9. SeismoMatch Representation of Acceleration (g)-time t (s) Nine Ground Motions.
Infrastructures 10 00093 g0a9
Figure A10. Sample 2- SeismoMatch Representation of Acceleration (g)-time t (s) Eleven Ground Motions.
Infrastructures 10 00093 g0a10
Figure A11. SeismoMatch Representation of Displacement (cm)-time t (s) Nine Ground Motions.
Infrastructures 10 00093 g0a11
Figure A12. SeismoMatch Representation of Velocity (cm/s)-time t (s) Nine Ground Motions.
Infrastructures 10 00093 g0a12
Figure A13. SeismoMatch Representation of Mean Matched Spectrum with Target Spectrum.
Infrastructures 10 00093 g0a13
Figure A14. Sample 3- SeismoMatch Representation of Acceleration (g)-time t (s) Eleven Ground Motions.
Infrastructures 10 00093 g0a14
Figure A15. SeismoMatch Representation of Pseudo-Velocity (cm/s)-Frequency (Hz) Eleven Ground Motions and Target Spectrum.
Infrastructures 10 00093 g0a15
Figure A16. ES8-15- Elastic Target Response Spectrum.
Infrastructures 10 00093 g0a16
Figure A17. EN-2015 adheres to Eurocode 8-2004 Regulations Inelastic Target Response Spectrum.
Infrastructures 10 00093 g0a17

Appendix B

44-story RSX & LDTHA ETABS vs. 19.0.0 combined global story responses result as per ES8-15 adhering to Eurocode 8-2004 regulations and design response spectrum of ES8-15.
Figure A18. RS CM Disp. vs. Story Level.
Infrastructures 10 00093 g0a18
Figure A19. RS Drifts vs. Story Level.
Infrastructures 10 00093 g0a19
Figure A20. RS Max. Disp. vs. Story Level.
Infrastructures 10 00093 g0a20
Figure A21. RS Max. Drift. vs. Story Level.
Infrastructures 10 00093 g0a21
Figure A22. RS Shear vs. Story Level.
Infrastructures 10 00093 g0a22
Figure A23. RS Stiffness vs. Story Level.
Infrastructures 10 00093 g0a23
Figure A24. RS Moment vs. Story Level.
Infrastructures 10 00093 g0a24
Figure A25. LDTHA CM Disp. vs. Story Level.
Infrastructures 10 00093 g0a25
Figure A26. LDTHA Drift for D-1 vs. Story Level.
Infrastructures 10 00093 g0a26
Figure A27. LDTHA Max. Disp. vs. Story Level.
Infrastructures 10 00093 g0a27
Figure A28. LDTHA Max. Drift vs. Story Level.
Infrastructures 10 00093 g0a28
Figure A29. LDTHA Moment vs. Story Level.
Infrastructures 10 00093 g0a29
Figure A30. LDTHA Shear vs. Story Level.
Infrastructures 10 00093 g0a30
Figure A31. SPO CM Disp. vs. Story Level.
Infrastructures 10 00093 g0a31
Figure A32. SPO Drift D-1 vs. Story Level.
Infrastructures 10 00093 g0a32
Figure A33. SPO Max. Disp. vs. Story Level.
Infrastructures 10 00093 g0a33
Figure A34. SPO Max. Drift vs. Story Level.
Infrastructures 10 00093 g0a34
Figure A35. SPO Moment vs. Story Level.
Infrastructures 10 00093 g0a35
Figure A36. SPO Shear vs. Story Level.
Infrastructures 10 00093 g0a36
Figure A37. NLTHA CM Disp. vs. Story Level.
Infrastructures 10 00093 g0a37
Figure A38. NLTHA Drift D-1 vs. Story Level.
Infrastructures 10 00093 g0a38
Figure A39. NLTHA Max. Disp. vs. Story Level.
Infrastructures 10 00093 g0a39
Figure A40. NLTHA Max. Story Drift vs. Story Level.
Infrastructures 10 00093 g0a40
Figure A41. NLTHA Moment vs. Story Level.
Infrastructures 10 00093 g0a41
Figure A42. NLTHA Shear vs. Story Level.
Infrastructures 10 00093 g0a42

References

  1. Getachew, K.; Chen, D.H.; Peng, G. Seismic Performance Evaluation of RC Frame Designed Using Ethiopian and Chinese Seismic Codes. Adv. Civ. Eng. 2020, 2020, 8493495. [Google Scholar] [CrossRef]
  2. Kibret, B.A.; Ayele, A.; Keir, D. Modelling S-Wave Velocity Structure Beneath the Central Main Ethiopian Rift Using Receiver Functions. Front. Earth Sci. 2022, 10, 773783. [Google Scholar] [CrossRef]
  3. Asefa, J.; Ayele, A. Complex tectonic deformation in Circum-Tanzania Craton: East African Rift System. J. Afr. Earth Sci. 2020, 170, 103893. [Google Scholar] [CrossRef]
  4. Sullivan, T.J. Highlighting differences between force-based and displacement-based design solutions for reinforced concrete frame structures. Struct. Eng. Int. J. Int. Assoc. Bridg. Struct. Eng. 2013, 23, 122–131. [Google Scholar] [CrossRef]
  5. Syamsi, M.I.; Maulana, T.I.; Widyantama, H.; Ian, M.R.; Lesmana, R.I. Comparative Study of Indonesian Seismic Codes Applied on Vertically Irregular RC Building in High Seismicity Region. Int. J. Integr. Eng. 2021, 13, 158–167. [Google Scholar] [CrossRef]
  6. Haselton, C.B.; Goulet, C.A.; Mitrani-Reiser, J.; Beck, J.L.; Deierlein, G.G.; Porter, K.A.; Stewart, J.P.; Taciroglu, E. An Assessment to Benchmark the Seismic Performance of a Code-Conforming Reinforced Concrete Moment-Frame Building; PEER Report 2007/12; Pacific Earthquake Engineering Research Center, College of Engineering, University of California: Berkeley, CA, USA, 2008; Available online: https://peer.berkeley.edu/publications/2007-12 (accessed on 1 March 2025).
  7. Sambasivam, R.; Gogul, R.K.J.; Jayapal, M.; Leela, K.N.; Subesh, M.S. International Journal of Trend in Scientific Research and Development (IJTSRD) Automated Greenhouse. Int. J. Trend Sci. Res. Dev. 2018, 1, 2–4. Available online: https://www.researchgate.net/profile/Mike-Micah/publication/333258612_Redefining_Education_’’The_Need_through_Innovative_in_Africa_for_Sustainable_Development_hrough_and_Creative_Learning’’/links/638e26aa11e9f00cda1f316a/Redefining-Education-The-Need-thro (accessed on 1 March 2025).
  8. Liu, Q.; Paavola, J. Performance-based seismic optimization design. Raken. Mek. 2015, 48, 1–17. Available online: http://rmseura.tkk.fi/rmlehti/2015/nro1/RakMek_48_1_2015_1.pdf (accessed on 19 March 2025).
  9. Pratap, Y.; Neelima, P.V.S. Performance Based Design: Case Study. Int. J. Eng. Manag. Res. 2015, 5, 525–530. Available online: https://www.irjet.net/archives/V9/i7/IRJET-V9I7523.pdf (accessed on 18 March 2025).
  10. Gkimprixis, A.; Tubaldi, E.; Douglas, J. Evaluating alternative approaches for the seismic design of structures. Bull. Earthq. Eng. 2020, 18, 4331–4361. [Google Scholar] [CrossRef]
  11. Kani, N.; Feng, D.; Sera, S. Performance Based Design of Seismically Isolated Buildings in Japan. In Proceedings of the Workshop: Bridges Seismic Isolation and Large Scale Modeling, St. Petersburg, Russia, 29 June–3 July 2010; pp. 1–17. Available online: http://akira-wada.com/00_img/article/2006/0602s05_8NCEE-002181.pdf (accessed on 15 March 2025).
  12. Thorvaldsdottir, S.; Bessason, B.; Rupakhety, R. Non-structural earthquake risk management for residential buildings. Ann. Geophys. 2020, 63, SE323. [Google Scholar] [CrossRef]
  13. Raju, K.R.; Cinitha, A.; Iyer, N.R. Seismic performance evaluation of existing RC buildings designed as per past codes of practice. Sadhana Acad. Proc. Eng. Sci. 2012, 37, 281–297. [Google Scholar] [CrossRef]
  14. Heidebrecht, A.C. Overview of seismic provisions of the proposed 2005 edition of the National Building Code of Canada. Can. J. Civ. Eng. 2003, 30, 241–254. [Google Scholar] [CrossRef]
  15. Unnikrishnan, V.U.; Barbato, M.; Petrini, F.; Ciampoli, M. Probabilistic performance based risk assessment considering the interaction of wind and windborne debris hazard. In Proceedings of the 2012 ATC SEI Conference on Advances in Hurricane Engineering, Miami, FL, USA, 24–26 October 2013; pp. 1183–1193. [Google Scholar] [CrossRef]
  16. Fahnestock, L.A.; Sause, R.; Ricles, J.M.; Lu, L.W. Ductility demands on buckling-restrained braced frames under earthquake loading. Earthq. Eng. Eng. Vib. 2003, 2, 255–268. [Google Scholar] [CrossRef]
  17. Biondi, G.; Cascone, E.; Maugeri, M. Displacement versus pseudo-static evaluation of the seismic performance of sliding retaining walls. Bull. Earthq. Eng. 2014, 12, 1239–1267. [Google Scholar] [CrossRef]
  18. Hamburger, R.O. The ATC-58 project: Development of next-generation performance-based earthquake engineering design criteria for buildings. Proc. Struct. Congr. Expo. 2006, 2006, 31. [Google Scholar] [CrossRef]
  19. Shamsabadi, A.; Rollins, K.M.; Kapuskar, M. Nonlinear Soil–Abutment–Bridge Structure Interaction for Seismic Performance-Based Design. J. Geotech. Geoenviron. Eng. 2007, 133, 707–720. [Google Scholar] [CrossRef]
  20. Astrella, M.J.; Whittaker, A.S. The Performance-Based Design Paradigm The Performance-Based Design Paradigm by. 2016. Available online: https://www.eng.buffalo.edu/mceer-reports/05/05-0011.pdf (accessed on 1 March 2025).
  21. Oxman, R. Performance-Based Design: Current Practices and Research Issues. Int. J. Archit. Comput. 2008, 6, 1–17. [Google Scholar] [CrossRef]
  22. Quiel, S.E.; Garlock, M.E.M. A closed-form analysis of perimeter member behavior in a steel building frame subject to fire. Eng. Struct. 2008, 30, 3276–3284. [Google Scholar] [CrossRef]
  23. Liang, Q.Q.; Steven, G.P. A performance-based optimization method for topology design of continuum structures with mean compliance constraints. Comput. Methods Appl. Mech. Eng. 2002, 191, 1471–1489. [Google Scholar] [CrossRef]
  24. Mital, D.; Roshni, J. Seismic Performance of Base Isolated MultiStorey Building. Int. J. Sci. Eng. Res. 2015, 6, 2–6. Available online: https://www.academia.edu/34182061/Seismic_Performance_of_Base_Isolated_Multi_Storey_Building (accessed on 1 March 2025).
  25. Krawinkler, H.; Zareian, F.; Medina, R.A.; Ibarra, L.F. Decision support for conceptual performance-based design. Earthq. Eng. Struct. Dyn. 2006, 35, 115–133. [Google Scholar]
  26. Abo-el-ezz, A.; Nollet, M. Seismic Risk Assessment of Existing Buildings in Old Quebec City, Canada. In Proceedings of the 15th World Conference on Earthquake Engineering (15WCEE), Lisbon, Portugal, 24–28 September 2012; Available online: https://www.researchgate.net/publication/278675647_Seismic_Risk_Assessment_of_Existing_Buildings_in_Old_Quebec_City_Canada (accessed on 1 March 2025).
  27. Chaulagain, H.; Rodrigues, H.; Jara, J.; Spacone, E.; Varum, H. Seismic response of current RC buildings in Nepal: A comparative analysis of different design/construction. Eng. Struct. 2013, 49, 284–294. [Google Scholar] [CrossRef]
  28. Hernandez Morales, H.; Scaletti Farina, H.; Proaño Tataje, R. Seismic Performance of Base Isolated Buildings At Different Stages of Construction. 2017. Available online: https://www.wcee.nicee.org/wcee/article/16WCEE/WCEE2017-2467.pdf (accessed on 1 March 2025).
  29. Chaudhary, M.T.A. Seismic Vulnerability Mitigation of Non-Engineered Buildings. Int. J. Civ. Struct. Constr. Archit. Eng. 2014, 8, 367–371. Available online: https://www.academia.edu/90013677/Seismic_Vulnerability_Mitigation_Of_Non_Engineered_Buildings (accessed on 1 March 2025).
  30. Willford, M.; Whittaker, A.; Klemencic, R. Recommendations for the seismic design of high-rise buildings—A consensus document. Ctbuh 2008. Available online: https://global.ctbuh.org/resources/papers/download/429-ctbuh-recommendations-for-the-seismic-design-of-high-rise-buildings.pdf (accessed on 1 March 2025).
  31. Amey, M.; Jarag, A.; Patil, S.P. Review of Various Provisions in Various Building Seismic Design Codes. Int. Res. J. Eng. Technol. 2022, 9, 687–690. [Google Scholar]
  32. Ganzerli, S.; Pantelides, C.P.; Reaveley, L.D. Performance-based design using structural optimization. Earthq. Eng. Struct. Dyn. 2000, 29, 1677–1690. [Google Scholar] [CrossRef]
  33. Aktan, A.E.; Ellingwood, B.R.; Kehoe, B. Performance-Based Engineering of Constructed Systems. J. Struct. Eng. 2007, 133, 311–323. [Google Scholar] [CrossRef]
  34. Anwar, N.; Aung, T.H.; Najam, F.; Strategy, P.R. Seismic Performance Based Evaluation of Nonstructural Components in Tall Buildings. 2018; pp. 1–12. Available online: https://www.researchgate.net/publication/329907087_Seismic_Performance_Based_Evaluation_of_Non_structural_Components_in_Tall_Buildings (accessed on 1 March 2025).
  35. Lee, D.H.; Kim, T.; Kim, J.H.; Kang, D.E. State of Practice of Performance-Based Seismic Design in Korea State of Practice of Performance-Based Seismic Design in Korea. Int. J. High-Rise Build. 2012, 1, 195–201. Available online: https://global.ctbuh.org/resources/papers/download/1992-state-of-practice-of-performance-based-seismic-design-in-korea.pdf (accessed on 20 January 2025).
  36. Paper, C. Performance-Based Evaluation of Historical Structures Performance-Based Evaluation of Historical Structures. In Proceedings of the Workshop on Seismicity of Historical Structures, Istanbul, Turkey, 12–14 November 2014; pp. 2–8. Available online: https://www.researchgate.net/publication/271975173_Performance-Based_Seismic_Evaluation_of_Historical_Buildings (accessed on 1 March 2025).
  37. Miranda, E. Perfomance-Based Assessment of Existing Structures Accounting for Residual Displacements. 2024. Available online: https://scholar.google.com/citations?view_op=view_citation&hl=en&user=_lYdXdgAAAAJ&cstart=20&pagesize=80&citation_for_view=_lYdXdgAAAAJ:8k81kl-MbHgC (accessed on 18 December 2024).
  38. Tande, S.N.; Karad, R.M. Performance Based Inelastic Seismic Analysis of Buildings. Int. J. Latest Trends Eng. Technol. 2013, 2, 380. Available online: https://www.ijltet.org/wp-content/uploads/2013/07/56.pdf (accessed on 1 March 2025).
  39. Bursi, O.S.; Paolacci, F.; Reza, M.S.; Alessandri, S.; Tondini, N. Seismic Assessment of Petrochemical Piping Systems Using a Performance-Based Approach. J. Press. Vessel Technol. Trans. ASME 2016, 138, 031801. [Google Scholar] [CrossRef]
  40. El Ganainy, H.; El Naggar, M.H. Seismic performance of three-dimensional frame structures with underground stories. Soil Dyn. Earthq. Eng. 2009, 29, 1249–1261. [Google Scholar] [CrossRef]
  41. Ciampoli, M.; Petrini, F. Performance-based Aeolian risk assessment and reduction for tall buildings. Probabilistic Eng. Mech. 2012, 28, 75–84. [Google Scholar] [CrossRef]
  42. Qarahasanlou, A.N.; Zamani, A.; Barabadi, A.; Mokhberdoran, M. Resilience assessment: A performance-based importance measure. Energies 2021, 14, 7575. [Google Scholar] [CrossRef]
  43. Petrini, F.; Ciampoli, M.; Barbato, M. Performance-based design of tall buildings under wind action. Struct. Congr. 2010, 2010, 1852–1863. [Google Scholar] [CrossRef]
  44. Frangopol, D.M.; Liu, M. Structure and Infrastructure Engineering: Maintenance, Management, Life-Cycle Design and Performance. Struct. Infrastruct. Eng. 2007, 3, 29–41. Available online: http://www.informaworld.com/10.1080/15732479.2010.491119 (accessed on 1 March 2025). [CrossRef]
  45. Reddy, C.R.; Mothilal, M.; Reddy, C.R. Comparative Study on G + 15 RCC Building with Plan Irregularity Using Response Spectrum Comparative Study on G + 15 RCC Building with Plan Irregularity Using Response Spectrum Analysis and Time History Analysis. 2023. Available online: https://easychair.org/publications/preprint/JbT6 (accessed on 12 March 2024).
  46. Ghobarah, A. Performance-based design in earthquake engineering: State of development. Eng. Struct. 2001, 23, 878–884. [Google Scholar] [CrossRef]
  47. Wang, C.; Tian, P.; Chan, T.M. Seismic behavior of modular buildings with reinforced concrete (RC) structural walls as seismic force resisting system. Eng. Struct. 2024, 315, 118378. [Google Scholar] [CrossRef]
  48. Filiatrault, A.; Perrone, D.; Merino, R.J.; Calvi, G.M. Performance-Based Seismic Design of Nonstructural Building Elements. J. Earthq. Eng. 2018, 25, 237–269. [Google Scholar] [CrossRef]
  49. Golewski, G.L. The Phenomenon of Cracking in Cement Concretes and Reinforced Concrete Structures: The Mechanism of Cracks Formation, Causes of Their Initiation, Types and Places of Occurrence, and Methods of Detection—A Review. Buildings 2023, 13, 765. [Google Scholar] [CrossRef]
  50. Rojas, H.A.; Pezeshk, S.; Foley, C.M. Performance-based optimization considering both structural and nonstructural components. Earthq. Spectra 2007, 23, 685–709. [Google Scholar] [CrossRef]
  51. Sica, S.; Santucci de Magistris, F.; Vinale, F. Seismic behaviour of geotechnical structures. Ann. Geophys. 2002, 45, 799–815. Available online: https://core.ac.uk/download/pdf/41145220.pdf (accessed on 1 March 2025). [CrossRef]
  52. Chandrasekaran, S.; Roy, A. Seismic evaluation of multi-storey RC frame using modal pushover analysis. Nonlinear Dyn. 2006, 43, 329–342. [Google Scholar] [CrossRef]
  53. Pandit, V.K.; Pandit, M.; Khare, A.K. Optimum Performance-Based Design of Concrete Structure. Int. J. Comput. Sci. Mob. Comput. 2014, 3, 671–675. Available online: https://www.academia.edu/6576198/Optimum_Performance_Based_Design_of_Concrete_Structure_ (accessed on 10 January 2025).
  54. Whittaker, A.; Constantinou, M.; Tsopelas, P. Displacement Estimates for Performance-Based Seismic Design. J. Struct. Eng. 1998, 124, 905–912. [Google Scholar] [CrossRef]
  55. Becker, R. Fundamentals of performance-based building design. Build. Simul. 2008, 1, 356–371. [Google Scholar] [CrossRef]
  56. Whittaker, A.; Huang, Y.N.; Hamburger, R.O. Next-generation performance based earthquake engineering. Electron. J. Struct. Eng. 2007, 7, 49–57. [Google Scholar] [CrossRef]
  57. Kasimzade, A.A.; Tuhta, S.; Abrar, G.A.; Atmaca, G.; Alameri, I.; Abrar, O. Novel Approach on Performance-Based Aseismic Design Based on FEMA Requirements. Int. J. Trend Sci. Res. Dev. 2018, 3, 812–816. [Google Scholar] [CrossRef]
  58. Petrini, F.; Ciampoli, M. Performance-based wind design of tall buildings. Struct. Infrastruct. Eng. 2012, 8, 954–966. [Google Scholar] [CrossRef]
  59. Strobbe, T.; De Meyer, R.; Van Campenhout, J. A Generative Approach towards Performance-Based Design Using a shape grammar implementation. In Proceedings of the 31st eCAADe Conference: Computation and Performance, Delft, The Netherlands, 18–20 September 2013; Volume 2, pp. 627–633. Available online: https://www.academia.edu/68961590/A_generative_approach_towards_performance_based_design_using_a_shape_grammar_implementation (accessed on 1 March 2025).
  60. Baker, D.C.; Sipe, N.G.; Gleeson, B.J. Performance-Based Planning: Perspectives from the United States, Australia, and New Zealand. J. Plan. Educ. Res. 2006, 25, 396–409. [Google Scholar] [CrossRef]
  61. Takewaki, I. Incremental inverse eigenmode problem for performance-based structural redesign. Finite Elem. Anal. Des. 1997, 27, 175–191. [Google Scholar] [CrossRef]
  62. Roohi, M.; Hernandez, E.M.; Rosowsky, D. Seismic Damage Assessment of Instrumented Wood-frame Buildings: A Case-study of NEESWood Full-scale Shake Table Tests. arXiv 2019, arXiv:1902.09955. [Google Scholar]
  63. Petrini, F. A probabilistic approach to Performance-Based Wind Engineering (PBWE). Ph.D. Thesis, Università degli Studi di Roma “La Sapienza”, Rome, Italy, 2009; pp. 1–12. Available online: https://www.researchgate.net/publication/265626558_A_probabilistic_framework_for_Performance-Based_Wind_Engineering (accessed on 1 March 2025).
  64. Moehle, J.; Deierlein, G.G. A framework methodology for performance-based earthquake engineering. In Proceedings of the 13th World Conference on Earthquake Engineering, Vancouver, BC, USA, 1–6 August 2004; Available online: https://www.researchgate.net/publication/228706335 (accessed on 1 March 2025).
  65. Fajfar, P. A Nonlinear Analysis Method for Performance-Based Seismic Design. Earthq. Spectra 2000, 16, 573–592. [Google Scholar] [CrossRef]
  66. John, E.; Prince, G.; George, J. A review on performance—Based specification of durable concrete. Sustain. Agri. Food Environ. Res. 2021, 10, 1–8. [Google Scholar] [CrossRef]
  67. Porter, K.A. An Overview of PEER’s Performance-Based Earthquake Engineering Methodology. In Proceedings of the ICASP9—The 9th International Conference on Applications of Statistics and Probability in Civil Engineering, San Francisco, CA, USA, 6–9 July 2003; Volume 273, pp. 973–980. Available online: https://www.researchgate.net/publication/237390996_An_Overview_of_PEER’s_Performance-Based_Earthquake_Engineering_Methodology (accessed on 1 March 2025).
  68. Shankar, S.; Husain, M.T. Performance Based Design and Optimization of Multi-storeyed Structure: A Simulative Performance Analysis. J. Xi’an Univ. Archit. Technol. 2020, 12, 2042–2055. Available online: https://www.academia.edu/108975736/Performance_Based_Design_and_Optimization_of_Multi_storeyed_Structure_A_Simulative_Performance_Analysis (accessed on 1 March 2025).
  69. Sunaryati, J.; Nidiasari, N.; Yuliandri, R. Performance-based-plastic design method of reinforced concrete structure for operational performance level. E3S Web Conf. 2021, 331, 05010. [Google Scholar] [CrossRef]
  70. Ram, S.; Az, S.K.; Mohit, M. Effects of Openings on Different Shapes of Shear Wall in RC Buildings; Crimson Publishing: New York, NY, USA, 2021; Volume 3, pp. 1–10. Available online: https://crimsonpublishers.com/cojts/fulltext/COJTS.000563.php#:~:text=The%20strength%20and%20rigidity%20of%20shear%20wall%20decreases%20due%20to,the%20sizes%20of%20openings%20increase (accessed on 5 April 2023).
  71. Zhang, W.; Liu, X.; Huang, Y.; Tong, M.N. Reliability-Based Analysis of the Flexural Strength of Concrete Beams Reinforced with Hybrid BFRP and Steel Rebars. Arch. Civ. Mech. Eng. 2022, 22, 171. [Google Scholar] [CrossRef]
  72. Zacharenaki, A.; Fragiadakis, M.; Papadrakakis, M. Optimal seismic design of steel structures using approximate methods. In Proceedings of the 11th International Conference on Applications of Statistics and Probability in Civil Engineering (ICASP11), Zurich, Switzerland, 1–4 August 2011; pp. 868–873. [Google Scholar] [CrossRef]
  73. Papadrakakis, M.; Fragiadakis, M.; Lagaros, N.D. Optimum Performance-Based Reliability Design of Structures. In NATO Security through Science Series C: Environmental Security; Springer: Berlin/Heidelberg, Germany, 2007; pp. 137–159. [Google Scholar] [CrossRef]
  74. Salimi, S.; Mawlana, M.; Hammad, A. Performance analysis of simulation-based optimization of construction projects using High Performance Computing. Autom. Constr. 2018, 87, 158–172. [Google Scholar] [CrossRef]
  75. da Porto, F.; Donà, M.; Rosti, A.; Rota, M.; Lagomarsino, S.; Cattari, S.; Borzi, B.; Onida, M.; De Gregorio, D.; Perelli, F.L.; et al. Comparative Analysis of the Fragility Curves for Italian Residential Masonry and RC Buildings. Bull. Earthq. Eng. 2021, 19, 3209–3252. [Google Scholar] [CrossRef]
  76. Dhanashri, K.I.; Desai, D.B.; Malu, G.M. International Journal of Engineering Sciences & Research Technology IJESRT Chief Editor. Int. J. Eng. Sci. Res. Technol. 2020, 9, 140–144. [Google Scholar] [CrossRef]
  77. Radu, A.; Lazar, I.F.; Neild, S.A. Performance-based seismic design of tuned inerter dampers. Struct. Control Health Monit. 2019, 26, 1–19. [Google Scholar] [CrossRef]
  78. Ferraioli, M.; Concilio, A.; Molitierno, C. Seismic Performance of a Reinforced Concrete Building Retrofitted with Self-Centering Shape Memory Alloy Braces. Earthq. Eng. Eng. Vib. 2022, 21, 785–809. [Google Scholar] [CrossRef]
  79. Fragiadakis, M.; Lagaros, N.D.; Papadrakakis, M. Performance-based earthquake engineering using structural optimisation tools. Int. J. Reliab. Saf. 2006, 1, 59–76. [Google Scholar] [CrossRef]
  80. Journal, I.; Sciences, E.; Chief, I. Performance Based Evaluation of Rcc Building With Dual System. Int. J. Eng. Sci. Res. Technol. 2020, 9, 61–71. [Google Scholar] [CrossRef]
  81. Baker, J.W. Measuring bias in structural response caused by ground motion scaling. In Proceedings of the 8th Pacific Conference on Earthquake Engineering, Singapore, 5–7 December 2007; Paper no. 056. pp. 1–6. [Google Scholar]
  82. Naser, M.Z.; Hawileh, R.A.; Abdalla, J. Modeling Strategies of Finite Element Simulation of Reinforced Concrete Beams Strengthened with FRP: A Review. J. Compos. Sci. 2021, 5, 19. [Google Scholar] [CrossRef]
  83. Karatzetzou, A.; Pitilakis, D. Performance-Based Concepts of Compliant Soil- Foundation-Structure Systems. In Proceedings of the 2nd International Conference on Performance-Based Design in Earthquake Geotechnical Engineering, Taormina, Italy, 28–30 May 2012; pp. 1407–1415. Available online: https://www.academia.edu/32976994/Performance_based_seismic_design_of_soil_foundation_structure_systems (accessed on 1 March 2025).
  84. Mahini, S.S.; Niroomandi, A.; Ronagh, H.R. Performance based assessment of FRP-retrofitted existing RC frames. In Proceedings of the 4th International Conference on FRP Composites in Civil Engineering (CICE 2008), Zurich, Switzerland, 22–24 July 2008; pp. 22–24. Available online: https://www.researchgate.net/profile/Arsalan-Niroomandi-2/publication/43507404_Performance_based_assessment_for_FRP-retrofitted_existing_RC_frames/links/54ab9ab60cf2ce2df668e18c/Performance-based-assessment-for-FRP-retrofitted-existing-RC-frames.pdf (accessed on 1 March 2025).
  85. Teplý, B.; Vořechovská, D.; Keršner, Z. Performance-based design of concrete structures: Durability aspects. Struct. Eng. Mech. 2010, 35, 535–538. [Google Scholar] [CrossRef]
  86. Pina, F. Performance-Based Design of Tall Buildings in Southern California. In Proceedings of the 9th Canadian Conference on Earthquake Engineering, Ottawa, ON, Canada, 26–29 June 2007; pp. 1–10. Available online: https://www.caee.ca/pdf/Paper_94046.pdf (accessed on 1 March 2025).
  87. Tachibana, S.; Masuya, H.; Nakamura, S. Performance based design of reinforced concrete beams under impact. Nat. Hazards Earth Syst. Sci. 2010, 10, 1069–1078. [Google Scholar] [CrossRef]
  88. Wallace, B.J.W.; Iv, J.H.T.; Member, S. Sesimic Design of RC Structural Walls. Part II: Applications. J. Struct. Eng. 1995, 121, 88–101. Available online: https://www.researchgate.net/publication/245303205_Seismic_Design_of_RC_Structural_Walls_Part_II_Applications (accessed on 5 April 2023). [CrossRef]
  89. Kasimzade, A.A.; Nematli, E.; Mammadzada, V.; Atmaca, G. New Design Criteria in Performance Based Earthquake Engineering. Int. J. Trend Sci. Res. Dev. 2020, 4, 1065–1074. Available online: www.ijtsrd.com/papers/ijtsrd33041.pdf%0Ahttps://www.ijtsrd.com/engineering/civil-engineering/33041/new-design-criteria-in-performance-based-earthquake-engineering/azer-arastunoglu-kasimzade (accessed on 1 March 2025).
  90. Hanson, R.D.; Taylor, G.; Ventura, C.; Pina, F. Nonlinear performance based seismic assessment for low-rise buildings. In Proceedings of the 2009 ATC-SEI Conference on Improving the Seismic Performance of Existing Buildings and Other Structures, San Francisco, CA, USA, 9–11 December 2009; pp. 813–822. [Google Scholar] [CrossRef]
  91. Bansal, H. Seismic Analysis and Design of Vertically Irregular RC Building Frames. Int. J. Sci. Res. 2014, 3, 207–215. Available online: https://www.ijsr.net/archive/v3i8/MDIwMTUyMjE=.pdf (accessed on 12 March 2024).
  92. Moghaddam, H. On the Optimum Performance-Based Design of Structures. In Proceedings of the U.S.-Iran Seismic Workshop, Irvine, CA, USA, 29 June–1 July 2009; p. 30. Available online: https://www.academia.edu/25376363/ON_THE_OPTIMUM_PERFORMANCE_BASED_DESIGN_OF_STRUCTURES (accessed on 1 March 2025).
  93. Talon, A.; Curt, C.; Boissier, D. Performance Assessment Based on Evidence Theory and Fuzzy Logic: Application to Building and Dam Performance. J. Comput. Civ. Eng. 2014, 28, 124–133. [Google Scholar] [CrossRef]
  94. Rajan, L. Wankhade Performance Based Design and Estimation of Forces for Building Frames with Earthquake Loading. Gov. Coll. Eng. 2014, 6890, 106–110. Available online: https://www.researchgate.net/publication/269698945 (accessed on 1 March 2025).
  95. Easa, S.M.; Yan, W.Y. Performance-based analysis in civil engineering: Overview of applications. Infrastructures 2019, 4, 1–41. [Google Scholar] [CrossRef]
  96. Zhang, C.; Gholipour, G.; Mousavi, A.A. State-of-The-Art Review on Responses of RC Structures Subjected to Lateral Impact Loads. Arch. Comput. Methods Eng. 2020, 28, 2477–2507. [Google Scholar] [CrossRef]
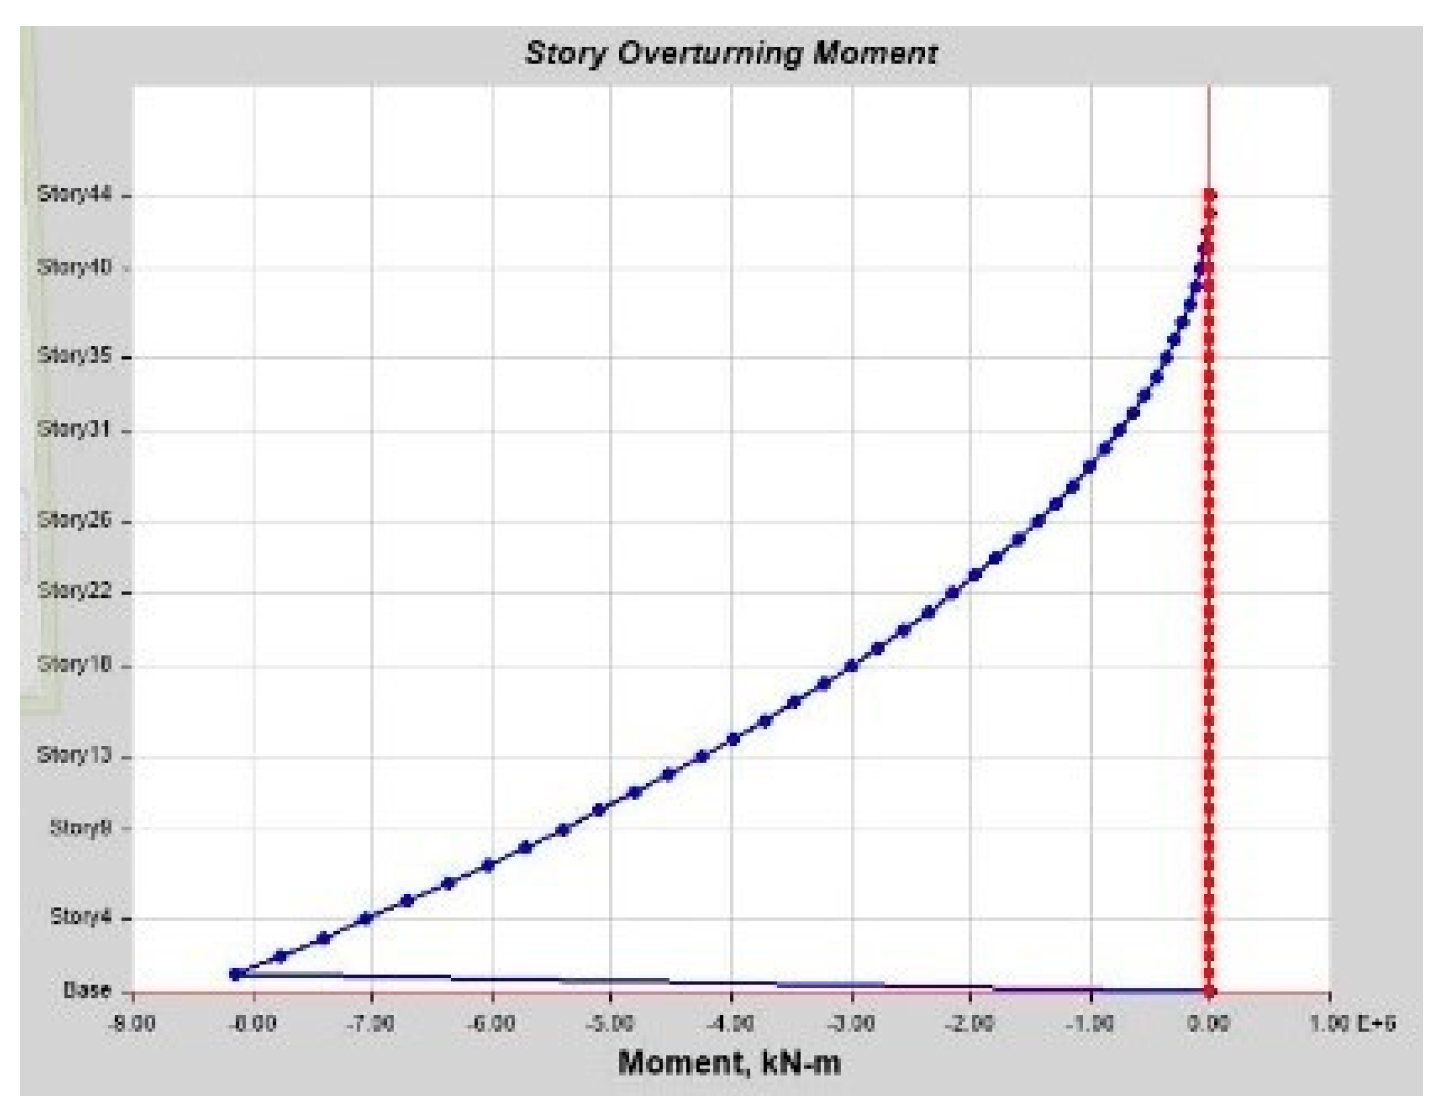
  97. Selviaridis, K.; Wynstra, F. Performance-based contracting: A literature review and future research directions. Int. J. Prod. Res. 2015, 53, 3505–3540. [Google Scholar] [CrossRef]
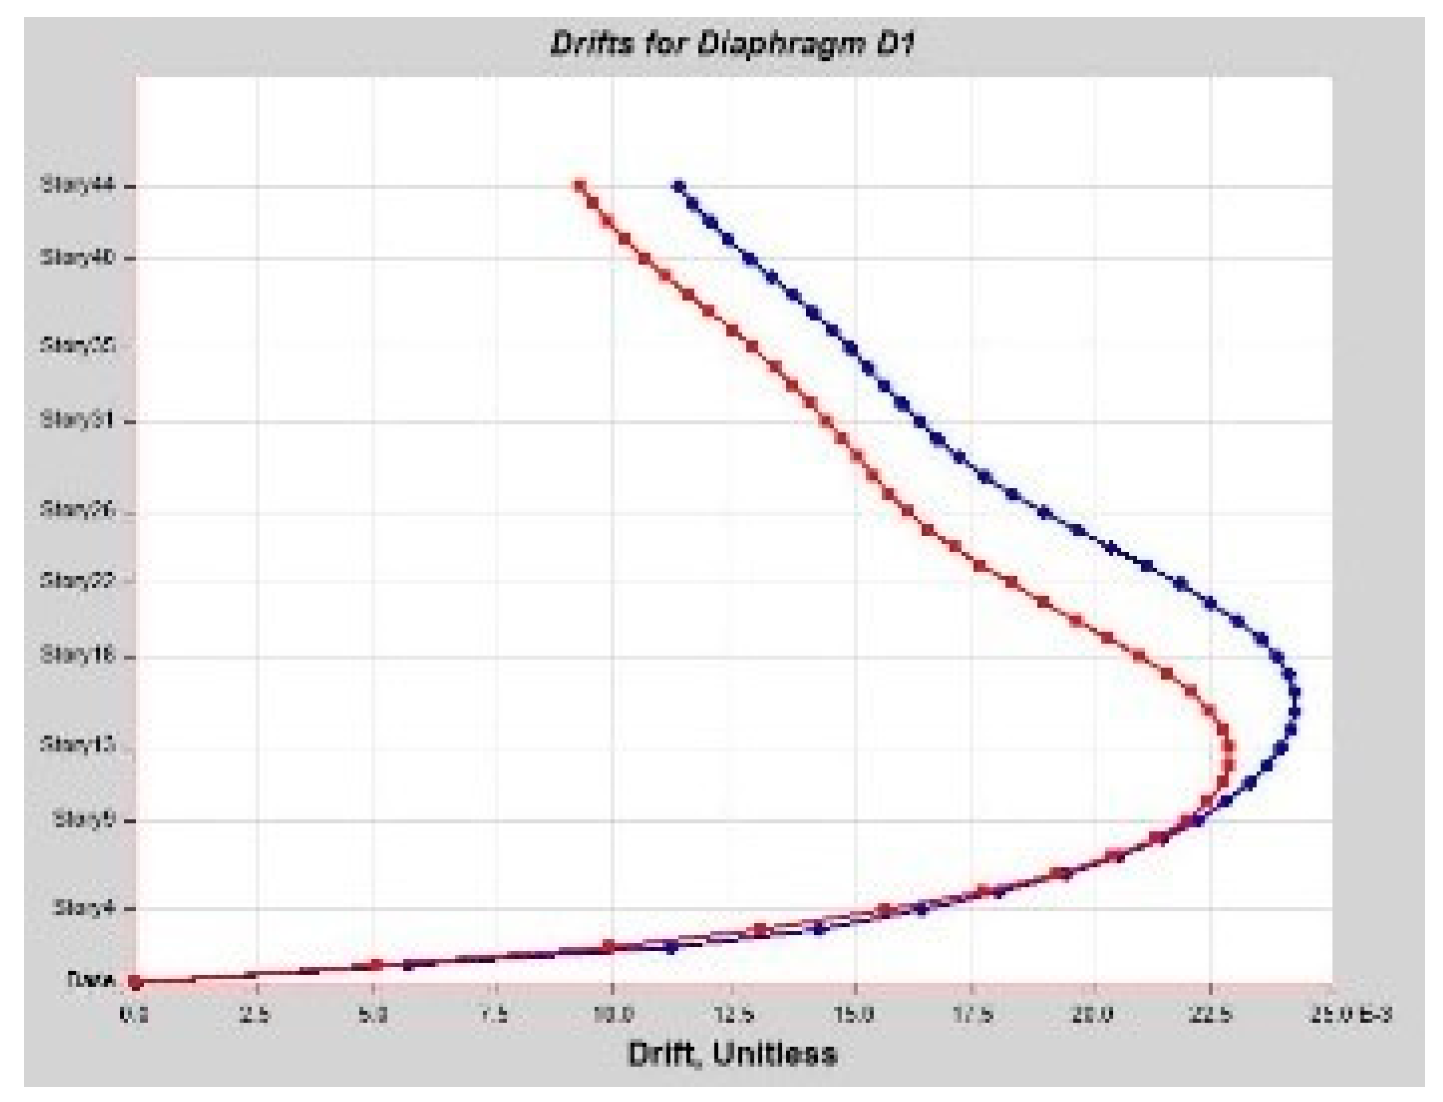
  98. Altouhami, R.; Mansur, M.; Ali, H.; Suliman, M.; Altlomate, A.; Alashlam, F.A.A. Wind Effect On Difference Shear Wall Position with Different Shape Configuration. In Proceedings of the Third International Conference on Technical Sciences, Tripoli, Liyba, 28–30 November 2020; Available online: https://www.researchgate.net/publication/348755181_Wind_Effect_On_Difference_Shear_Wall_Position_With_Different_Shape_Configuration (accessed on 5 April 2023).
  99. McMullin, P.W. Performance-Based Seismic Design. Spec. Struct. Top. 2017, 1, 71–87. [Google Scholar] [CrossRef]
  100. Lignos, D.G.; Karamanci, E.; Al-Shawwa, N. Structural component databases for performance-based earthquake engineering. In Proceedings of the 11th International Conference on Structural Safety and Reliability (ICOSSAR 2013), New York, NY, USA, 16–20 June 2013; pp. 725–732. [Google Scholar] [CrossRef]
  101. Neupane, P. Seismic Strengthening of RC Structures; pp. 2011–2023. Available online: https://publications.jrc.ec.europa.eu/repository/bitstream/JRC91949/lbna26945enn.pdf (accessed on 1 March 2025).
  102. Ambekar, A.A.; Mohite, P.M. Review on Performance Based Wind Analysis and Design. Int. Res. J. Eng. Technol. 2022, 644–647. Available online: www.irjet.net (accessed on 1 March 2025).
  103. Misini, M.; Guri, Z.; Pocesta, Y.; Mujaj, A. Pushover Analysis Method for Performance Based Seismic Design. 2014; pp. 151–160. Available online: https://knowledgecenter.ubt-uni.net/conference/2014/all-events/15/ (accessed on 29 January 2025).
  104. Hung, C.C.; El-Tawil, S.; Chao, S.H. A Review of Developments and Challenges for UHPC in Structural Engineering: Behavior, Analysis, and Design. J. Struct. Eng. 2021, 147, 03121001. [Google Scholar] [CrossRef]
  105. Mitchell, D.; Paultre, P.; Tinawi, R.; Saatcioglu, M.; Tremblay, R.; Elwood, K.; Adams, J.; DeVall, R. Evolution of seismic design provisions in the National building code of Canada. Can. J. Civ. Eng. 2010, 37, 1157–1170. [Google Scholar] [CrossRef]
  106. Shapiro, D.; Rojahn, C.; Reaveley, L.D.; Smith, J.R.; Morelli, U. NEHRP Guidelines and Commentary for the Seismic Rehabilitation of Buildings. Earthq. Spectra 2000, 16, 227–239. [Google Scholar] [CrossRef]
  107. Kleidouhakis, A. Earthquake Resistant Design in Italy, Greece and Turkey—An investigation of Performance-Based Seismic Design. Master’s Thesis, University of Greenwich, London, UK, 2010. Available online: https://www.academia.edu/13450788/Earthquake_Resistant_Design_in_Italy_Greece_and_Turkey_an_investigation_of_Performance-Based_Seismic_Design (accessed on 1 March 2025).
  108. Bento, R.; Simões, A. Seismic performance assessment of buildings. Buildings 2021, 11, 440. [Google Scholar] [CrossRef]
  109. Temtime, T.; Biggs, J.; Lewi, E.; Hamling, I.; Wright, T.; Ayele, A. Spatial and temporal patterns of deformation at the Tendaho geothermal prospect, Ethiopia. J. Volcanol. Geotherm. Res. 2018, 357, 56–67. [Google Scholar] [CrossRef]
  110. Ayele, A.; Stuart, G.; Kendall, J.M. Insights into rifting from shear wave splitting and receiver functions: An example from Ethiopia. Geophys. J. Int. 2004, 157, 354–362. [Google Scholar] [CrossRef]
  111. Nowacki, A.; Wilks, M.; Kendall, J.-M.; Biggs, J.; Beshahe, T.; Ayele, A.; Wookey, J. Identifying deformation styles and causes at two deforming volcanoes of the Central Main Ethiopian Rift with seismic anisotropy. EGU Gen. Assem. Conf. Abstr. 2016, 18, 11592. Available online: https://meetingorganizer.copernicus.org/EGU2016/EGU2016-11592.pdf (accessed on 1 March 2025).
  112. Delvaux, D.; Macheyeki, A.S.; Fernandes, R.; Ayele, A. Neotectonic faults and stress field in the East African Rift System around the Tanzanian Craton—A contribution to the seismotectonic map of Africa. 2015, Volume 17, p. 6338. Available online: https://meetingorganizer.copernicus.org/EGU2015/EGU2015-6338.pdf (accessed on 1 March 2025).
  113. La Rosa, A.; Doubre, C.; Pagli, C.; Sani, F.; Corti, G.; Leroy, S.; Ahmed, A.; Ayele, A.; Keir, D. Anomalously deep earthquakes in the March 2018 swarm along the Western Margin of Afar. In Proceedings of the EGU General Assembly 2020, Vienna, Austria, 3–8 May 2020. [Google Scholar] [CrossRef]
  114. Ebinger, C.J.; Harding, W.; Kakonkwe, C.; Ellen, K.; Bastow, I.; Bendick, R.; Muthoni, M.; Kianji, G.; Mariita, N.; Ayele, A. Constraining magmatism and migration patterns between the Ethiopia-Yemen & E. African plateaux from new seismic and geodetic data. In Proceedings of the EGU General Assembly 2020, Online, 4–8 May 2020. [Google Scholar] [CrossRef]
  115. Greenfield, T.; Keir, D.; Kendall, J.M.; Ayele, A. Low-frequency earthquakes beneath Tullu Moye volcano, Ethiopia, reveal fluid pulses from shallow magma chamber. Earth Planet. Sci. Lett. 2019, 526, 115782. [Google Scholar] [CrossRef]
  116. Wilks, M.; Rawlinson, N.; Kendall, J.M.; Nowacki, A.; Biggs, J.; Ayele, A.; Wookey, J. The Coupled Magmatic and Hydrothermal Systems of the Restless Aluto Caldera, Ethiopia. Front. Earth Sci. 2020, 8, 579699. [Google Scholar] [CrossRef]
  117. Bezabeh, M.; Bitsuamlak, G.; Tesfamariam, S. Performance-based wind design of tall buildings: Concepts, frameworks, and opportunities. Wind Struct. 2020, 31, 103–142. Available online: https://www.researchgate.net/publication/344059645_Performance-based_wind_design_of_tall_buildings_concepts_frameworks_and_opportunities (accessed on 1 March 2025).
  118. Hall, T.R.; Nixon, C.W.; Keir, D.; Burton, P.W.; Ayele, A. Earthquake clustering and energy release of the African–Arabian rift system. Bull. Seismol. Soc. Am. 2018, 108, 155–162. [Google Scholar] [CrossRef]
  119. Wright, T.; Ayele, A.; Barnie, T.; Belachew, M.; Calais, E.; Field, L.; Hamling, I. Witnessing the Birth of a New Ocean ? The First 6 Years of the Dabbahu Rifting Episode, and Other Activity in Afar. 2012, Volume 14, p. 14089. Available online: https://meetingorganizer.copernicus.org/EGU2012/EGU2012-14089.pdf (accessed on 1 March 2025).
  120. Illsley-Kemp, F.; Keir, D.; Bull, J.M.; Ayele, A.; Hammond, J.O.S.; Kendall, J.M.; Gallacher, R.J.; Gernon, T.; Goitom, B. Local earthquake magnitude scale and b-value for the Danakil region of northern afar. Bull. Seismol. Soc. Am. 2017, 107, 521–531. [Google Scholar] [CrossRef]
  121. Civiero, C.; Hammond, J.; Goes, S.; Ahmed, A.; Ayele, A. Understanding the Nature of Mantle Upwelling Beneath East-Africa. 2014; Volume 16, p. 12819. Available online: https://ui.adsabs.harvard.edu/abs/2014EGUGA..1612819C/abstract (accessed on 1 March 2025).
  122. Nassani, D.E.; Hussein, A.K. Comparative Analysis of High-Rise Reinforced Concrete Structures According to International Seismic Design Codes. J. Civ. Eng. Archit. 2016, 10, 211–218. [Google Scholar] [CrossRef]
  123. Dashore, A. 10 Construction Challenges in High Rise Buildings. Construction World. 2021; pp. 1–6. Available online: https://theconstructor.org/building/construction-challenges-high-rise-buildings/45779/ (accessed on 29 January 2025).
  124. Pejovic, J.; Serdar, N.; Pejovic, R. Performance-based seismic methodology and its application in seismic design of reinforced concrete structures «Performance - based » seismic methodology and its application in seismic design of reinforced concrete structures. Constr. Unique Build. Struct. 2015, 5, 75–83. Available online: https://www.researchgate.net/publication/300718082_Performance-based_seismic_methodology_and_its_application_in_seismic_design_of_reinforced_concrete_structures (accessed on 29 January 2025).
  125. Abate, M.; Evangelista, A.C.J.; Tam, V.W. Comparative Response Spectrum Analysis on 15- and 50-Story Reinforced Concrete Buildings Having Shear Walls with and without Openings as per EN1998-1 Seismic Code. Buildings 2023, 13, 1303. [Google Scholar] [CrossRef]
  126. Conte, J.P.; Astroza, R.; Benzoni, G.; Feltrin, G.; Loh, K.J.; Moaveni, B. Experimental Vibration Analysis for Civil Structures: Testing, Sensing, Monitoring, and Control. Lect. Notes Civ. Eng. Springer Ser. J. 2018, 5, 21. [Google Scholar] [CrossRef]
  127. Nikolic-Brzev, S.; Milićević, I.; Marinković, M.; Blagojević, N. Performance of RC Frames in 26.11.2019. Albania Earthquake: Effects of Irregularities and Detailing. Gradjevinski Materijali I Konstrukcije 2021, 64, 207–213. [Google Scholar] [CrossRef]
  128. Yeo, D.; Simiu, E. High-Rise Reinforced Concrete Structures: Database-Assisted Design for Wind. J. Struct. Eng. 2011, 137, 1340–1349. [Google Scholar] [CrossRef]
  129. Ricci, P.; Di Domenico, M.; Verderame, G.M. Behaviour factor and seismic safety of reinforced concrete structures designed according to Eurocodes. Structures 2023, 55, 677–689. [Google Scholar] [CrossRef]
  130. Arabzadeh, H.; Galal, K. Seismic-Response Analysis of RC C-Shaped Core Walls Subjected to Combined Flexure, Shear, and Torsion. J. Struct. Eng. 2018, 144, 04018165. [Google Scholar] [CrossRef]
  131. Timmers, M.; Tsay Jacobs, A. Concrete apartment tower in Los Angeles reimagined in mass timber. Eng. Struct. 2018, 167, 716–724. [Google Scholar] [CrossRef]
  132. Isik, E.; Harirchian, E.; Bilgin, H.; Jadhav, K. The effect of material strength and discontinuity in RC structures according to different site-specific design spectra. Res. Eng. Struct. Mater. 2021, 7, 413–430. [Google Scholar] [CrossRef]
  133. Aggarwal, Y.; Saha, S.K. Seismic performance assessment of reinforced concrete hilly buildings with open story. Structures 2021, 34, 224–238. [Google Scholar] [CrossRef]
  134. Mostafijur Rahman, M.; Jadhav, S.M.; Shahrooz, B.M. Seismic performance of reinforce concrete buildings designed according to codes in Bangladesh, India and U.S. Eng. Struct. 2018, 160, 111–120. [Google Scholar] [CrossRef]
  135. Martins, A.M.B.; Simões, L.M.C.; Negrão, J.H.J.O.; Lopes, A.V. Sensitivity analysis and optimum design of reinforced concrete frames according to Eurocode 2. Eng. Optim. 2020, 52, 2011–2032. [Google Scholar] [CrossRef]
  136. Vishal, N.; Kannan, M.R.; Keerthika, L. Seismic Analysis of Multi-Storey Irregular Building with Different Structural Systems. Int. J. Recent Technol. Eng. 2020, 8, 3146–3155. [Google Scholar] [CrossRef]
  137. Singhal, S.; Chourasia, A.; Kajale, Y.; Singh, D. Behaviour of precast reinforced concrete structural wall systems subjected to in-plane lateral loading. Eng. Struct. 2021, 241, 112474. [Google Scholar] [CrossRef]
  138. Eddin Nassani, D.; WASSEF Almufti, M.; Wassef Abdulmajeed, M. Seismic Base Isolation in Reinforced Concrete Structures. Int. J. Res. Stud. Sci. Eng. Technol. 2015, 2, 1–13. Available online: http://ijrsset.org/pdfs/v2-i2/1.pdf (accessed on 1 March 2025).
  139. Qiao, W.; Chen, G. Generation of strut-and-tie models in concrete structures by topology optimization based on moving morphable components. Eng. Optim. 2020, 53, 1251–1272. [Google Scholar] [CrossRef]
  140. Simwanda, L.; De Koker, N.; Viljoen, C. Structural reliability of ultra high-performance fibre reinforced concrete beams in flexure. Eng. Struct. 2021, 244, 112767. [Google Scholar] [CrossRef]
  141. Sayın, E.; Yön, B.; Onat, O.; Gör, M.; Öncü, M.E.; Tuğrul Tunç, E.; Bakır, D.; Karaton, M.; Calayır, Y. 24 January 2020 Sivrice-Elazığ, Turkey Earthquake: Geotechnical Evaluation and Performance of Structures. Bull. Earthq. Eng. 2021, 19, 657–684. [Google Scholar] [CrossRef]
  142. Kaeseberg, S.; Messerer, D.; Holschemacher, K. Assessment of standards and codes dedicated to CFRP confinement of RC columns. Materials 2019, 12, 2390. [Google Scholar] [CrossRef]
  143. Yenidogan, C. Earthquake-Resilient Design of Seismically Isolated Buildings: A Review of Technology. Vibration 2021, 4, 602–647. [Google Scholar] [CrossRef]
  144. Feng, H.; Zhou, F.; Ge, H.; Zhu, H.; Zhou, L. Energy dissipation enhancement through multi-toggle brace damper systems for mitigating dynamic responses of structures. Structures 2021, 33, 2487–2499. [Google Scholar] [CrossRef]
  145. Al-Rousan, R.Z.; Sharma, A. Integration of FRP sheet as internal reinforcement in reinforced concrete beam-column joints exposed to sulfate damaged. Structures 2020, 31, 891–908. [Google Scholar] [CrossRef]
  146. Lubkowski, Z.; Villani, M.; Coates, K.; Jirouskova, N.; Willis, M. Seismic Design Considerations for East Africa. In Proceedings of the 2nd European Conference of Earthquake Engineering and Seismology, Istanbul, Turkey, 24–29 August 2014; p. 12. Available online: https://www.researchgate.net/publication/279527737_SEISMIC_DESIGN_CONSIDERATIONS_FOR_EAST_AFRICA (accessed on 12 March 2024).
  147. Afsar Dizaj, E.; Kashani, M.M. Nonlinear structural performance and seismic fragility of corroded reinforced concrete structures: Modelling guidelines. Eur. J. Environ. Civ. Eng. 2021, 26, 5374–5403. [Google Scholar] [CrossRef]
  148. Zerbin, M.; Aprile, A.; Spacone, E. New formulation of ductility reduction factor of RC frame-wall dual systems for design under earthquake loadings. Soil Dyn. Earthq. Eng. 2020, 138, 106279. [Google Scholar] [CrossRef]
  149. Macedo, L.; Silva, A.; Castro, J.M. A more rational selection of the behaviour factor for seismic design according to Eurocode 8. Eng. Struct. 2019, 188, 69–86. [Google Scholar] [CrossRef]
  150. Bovo, M.; Savoia, M.; Praticò, L. Seismic Performance Assessment of a Multistorey Building Designed with an Alternative Capacity Design Approach. Adv. Civ. Eng. 2021, 2021, 5178065. [Google Scholar] [CrossRef]
  151. Zhang, L.; Hu, H.; Fang, Y.; Qiang, Z. Code Compliance in Reinforce Concrete Design: A Comparative Study of USA Code (ACI) and Chinese Code (GB). Adv. Civ. Eng. 2021, 2021, 5517332. [Google Scholar] [CrossRef]
  152. Castaldo, P.; Tubaldi, E.; Selvi, F.; Gioiella, L. Seismic performance of an existing RC structure retrofitted with buckling restrained braces. J. Build. Eng. 2021, 33, 101688. [Google Scholar] [CrossRef]
  153. Mazza, F. Dissipative steel exoskeletons for the seismic control of reinforced concrete framed buildings. Struct. Control Health Monit. 2021, 28, e2683. [Google Scholar] [CrossRef]
  154. Ghosh, S.; Ghosh, S.; Chakraborty, S. Seismic fragility analysis in the probabilistic performance-based earthquake engineering framework: An overview. Int. J. Adv. Eng. Sci. Appl. Math. 2021, 13, 122–135. [Google Scholar] [CrossRef]
Figure 1. Thousands of people were evacuated Saturday (January 4) in Ethiopia after a series of earthquakes, including a 5.8-magnitude tremor.
Infrastructures 10 00093 g001
Figure 2. (a) 44-story nonlinear sample building 3D models. (b) 44-story nonlinear sample building 3D model.
Infrastructures 10 00093 g002
Figure 3. Ground floor plan 45 m × 36 m.
Infrastructures 10 00093 g003
Figure 4. The mode shape of the first three modes.
Infrastructures 10 00093 g004
Figure 5. RS & LDTHA Story Displacement for D-1 vs. Story Level.
Infrastructures 10 00093 g005
Figure 6. RS & LDTHA Story Drift for D-1 vs. Story Level.
Infrastructures 10 00093 g006
Figure 7. RS & LDTHA Story Displacement vs. Story Level.
Infrastructures 10 00093 g007
Figure 8. RS & LDTHA Story Drift vs. Story Level.
Infrastructures 10 00093 g008
Figure 9. RS & LDTHA Story Shear vs. Story Level.
Infrastructures 10 00093 g009
Figure 10. RS & LDTHA Max. Overturning Moment Vs. Story Level.
Infrastructures 10 00093 g010
Figure 11. Mean Matched Response Spectrum for The Selected Ground Accelerations and Target Spectrum as per ES EN 1998-15.
Infrastructures 10 00093 g011
Figure 12. SPO & NLTHA Displacement for D-1 vs. Story Level.
Infrastructures 10 00093 g012
Figure 13. SPO & NLTHA Drift for D-1 vs. Story Level.
Infrastructures 10 00093 g013
Figure 14. SPO & NLTHA Max. Displacement vs. Story Level.
Infrastructures 10 00093 g014
Figure 15. SPO & NLTHA Max. Drift vs. Story Level.
Infrastructures 10 00093 g015
Figure 16. SPO & NLTHA Shear vs. Story Level.
Infrastructures 10 00093 g016
Figure 17. SPO & NLTHA Moment vs. Story Level.
Infrastructures 10 00093 g017
Figure 18. Static Base Shear vs. Monitored Displacement.
Infrastructures 10 00093 g018
Figure 19. Dynamic Base Shear vs. Displacement.
Infrastructures 10 00093 g019
Figure 20. FEMA 440 EL Spectral Acceleration vs. Spectral Displacement.
Infrastructures 10 00093 g020
Figure 21. ASCE 41-13 NSP Base Shear vs. Displacement.
Infrastructures 10 00093 g021
Figure 22. (a) Plastic hinge formation mechanism in SPO, and (b) plastic hinge formation mechanism in NLTHA.
Infrastructures 10 00093 g022
Figure 23. SPO D/C ratio for IO Level.
Infrastructures 10 00093 g023
Figure 24. NLTHA D/C ratio for IO Level.
Infrastructures 10 00093 g024
Figure 25. SPO D/C ratio for LS Level.
Infrastructures 10 00093 g025
Figure 26. NLTHA D/C ratio for LS Level.
Infrastructures 10 00093 g026
Figure 27. SPO D/C ratio for CP Level.
Infrastructures 10 00093 g027
Figure 28. NLTHA D/C ratio for CP Level.
Infrastructures 10 00093 g028
Table 1. General sample 44-story RC building detail.
Building Detail 44 Stories, 132 m
BM section 700 × 500 mm
Column Section 1000 × 1200 mm
Slab Section 200 mm
Shear Wall section 350 mm
28 days Compressive Strength C-30
Elastic Modulus, EC31 × 106 kN/m2
Concert unit weight 25 kN/m3
Re-bar Steel Strength S-460/HRB460
Es200 × 106 kN/m2
Steel unit weight78.5 kN/m3
Stress-Strain for concrete H-Rusch formula
Line load on the beam 15 kN/m2
LL for Dynamic Analysis mass calculation 30%
DL2.0 kN/m2
LL3.0 kN/m2
Wall load on Beam 15.0 kN/m2
CLMOA, LTH, RS, SPO & NLTHA procedure ES8-15, FEMA 356, ASCE 41-17 and ATC 40.
Table 2. Unscaled ground accelerations from PEER NGA West-2.
NoEQ YearRecording Station No. (RSN)MagVs30 (m/s)PGA (g)MechanismSpectral Ordinate
1“Imperial Valley-06”-US19791646.53471.530.21strike-slipSRSS
2“Landers”-US19928817.28396.410.21strike-slipSRSS
3“Mammoth Lakes-01”-US19802306.06382.120.42Normal ObliqueSRSS
4“Landers”-US199237577.28367.840.13strike-slipSRSS
5“Loma Prieta”-US19898026.93380.890.51Reverse ObliqueSRSS
6“Landers”-US199237597.28425.020.12strike-slipSRSS
7“Landers”-US19928327.28382.930.089strike-slipSRSS
8“Chuetsu-oki_ Japan”200752746.8430.710.13ReverseSRSS
9“Northridge-01”-US199410046.69380.060.75ReverseSRSS
10“Chi-Chi_ Taiwan”199915137.62363.990.59Reverse ObliqueSRSS
11“Parkfield-02_ CA”200440706378.990.62strike slipSRSS
Table 3. Mode shape and mass participation coefficient (MPM (%)).
CaseModePeriod
s
UXUYUZSumUXSumUYSumUZRZSumRZ
Modal13.8060.7187000.7187000.00810.0081
Modal23.58500.727400.71870.7274000.0081
Modal33.270.0077000.72640.727400.71870.7268
Modal41.130.1335000.85990.727400.00220.7291
Modal51.06600.128500.85990.8559000.7291
Modal60.9650.0027000.86250.855900.1230.8521
Modal70.5810.0433000.90580.855900.00110.8532
Modal80.54300.044400.90580.9003000.8532
Modal90.4880.0013000.90710.900300.04540.8986
Modal100.3760.0236000.93070.900300.00060.8992
Modal110.34300.025200.93070.9256000.8992
Modal120.3050.0008000.93150.925600.0250.9242
Modal130.2680.0147000.94620.925600.00040.9246
Modal140.23800.016300.94620.9419000.9246
Modal150.210.0008000.94690.941900.01570.9403
Modal160.2030.0099000.95690.941900.00060.9409
Modal170.17600.011600.95690.9535000.9409
Modal180.1610.0077000.96450.953501.614 × 10−50.9409
Modal190.1540.0001000.96460.953500.01150.9525
Modal200.13600.008600.96460.9622000.9525
Table 4. Summary of 44-story RSX ETABS vs. 19.0.0 combined global story responses result as per ES8-15 adheres to Eurocode 8-2004 regulations and design response spectrum of ES8-15.
No Combined Story Response (Load Case RSX)RSX ETABS vs. 19.00 Combined Global Story Responses Output
1Maximum Story Displacement421.90 mm
2Maximum inter story Drift ration 0.4%
3Story Shear 60,898 kN
4Story Overturning Moment 3.749287 × 10⁶ kN-m
Table 5. Summary of 44-story LDTHA ETABS vs. 19.0.0 combined global story responses result as per ES8-15 adhering to Eurocode 8-2004 regulations and matched design response spectrum of ES8-15.
No Combined Story Response (Load Case RSX)DLTHA ETABS vs. 19.0.0 Combined Global Story Responses Output
1Maximum Story Displacement567.70 mm
2Maximum inter story Drift ratio 0.5442%
3Story Shear 71,942 KN
4Story Overturning Moment 5.17236 × 10⁶ kN-m
Table 6. Summary of SPO 44-story ETABS combined global story responses result as per ES8-15 and matched design response spectrum.
No Combined Story Response (Load Case Pushover Mode-1 Load Pattern and UxPushover Analysis ETABS vs. 19.0.0 Combined Global Story Responses Output
1Maximum Story Displacement2464 mm
2Maximum inter story Drift ratio 2.69%
3Story Shear 126,002.1933-kN
4Story Overturning Moment 8,134,042 kN-m
Table 7. Summary of NLTHA 44-story ETABS combined global story responses result as per ES8-15 and matched design response spectrum.
No Mean 11 Ground Motion Time History Load CasesNLDTHA ETABS vs. 19.0.0 Combined Global Story Responses Output
1Maximum Story Displacement2388.14 mm
2Maximum inter story Drift ratio 2.28%
3Story Shear 136,445.0987-kN
4Story Overturning Moment 9,476,966.1221 kN-m
Disclaimer/Publisher’s Note: The statements, opinions and data contained in all publications are solely those of the individual author(s) and contributor(s) and not of MDPI and/or the editor(s). MDPI and/or the editor(s) disclaim responsibility for any injury to people or property resulting from any ideas, methods, instructions or products referred to in the content.