1. Introduction
In recent decades, the construction sector faced significant environmental challenges due to the excessive use of concrete, which is the second most consumed material after water, driven by the rapid growth in global housing demand [
1]. Despite its numerous benefits in construction, the production of Portland cement generates massive carbon dioxide emissions, reaching 798 kg per ton of cement (global average) and 712 kg (European average) [
2]. This environmental impact is expected to grow substantially, with production projected to increase from 4.2 billion tons in 2020 to 9.8 billion tons by 2050 [
3,
4]. In light of these environmental challenges, there has been a growing global interest in using geopolymer concrete as an eco-friendly alternative to conventional concrete [
5,
6]. This is due to its ability to utilize industrial waste, reduce carbon dioxide emissions, and achieve sufficient strength and its high durability [
7], resistance to elevated temperatures, and resistance to acids attacks [
8].
Geopolymer precursors typically consist of industrial byproducts and mineral resources, such as fly ash (FA), ground granulated blast furnace slag (GGBFS), ferronickel slag, ultrafine slag, metakaolin, and calcined kaolin. FA is considered to be one of the most suitable precursors in geopolymer concrete due to its high availability, low water demand, high workability, and its high content of SiO
2 and Al
2O
3. However, for optimal strength development, FA-based geopolymer concrete needs high curing temperatures of 60–120 °C for 24 h [
9]. According to earlier research, FA-based geopolymer mortar showed high durability and resistance to chemical attacks that make it suitable for use in corrosion-induced and repair applications [
10]. GGBFS can improve the mechanical and structural performance of concrete due to its high calcium content. When cured at room temperature, GGBFS exhibits pozzolanic and binding properties as a result of its reaction with alkaline activators [
11]. Compared to FA-based geopolymer concrete, slag-based geopolymer concrete has less workability.
Enhancing environmental sustainability in the construction sector is a critical issue that requires a comprehensive approach, including the management of construction and demolition waste (CDW). CDW can be utilized in geopolymer concrete due to its high alumina and silica content and can yield positive results in various standard construction applications [
12,
13]. In this context, Sata and Chindaprasirt [
14] noted that CDW can be used as aggregate in geopolymer concrete to improve its properties, such as density reduction and thermal insulation; although, it may result in a slight reduction in compressive strength and durability.
Among construction waste materials, brick waste (BW) is considered to be a major source of environmental pollution and significant disposal expenses [
15]. Despite recycling efforts, a substantial amount of BW remains unutilized. Integrating BW into geopolymer production would mark a significant milestone in its recycling process. The literature underscores that BW contains the essential silicon and aluminum required for geopolymer synthesis [
16]. Additionally, earlier research has demonstrated potentials for using BW as a pozzolanic binder material for geopolymer synthesis [
17]. Studies conducted by [
16,
18,
19,
20] have investigated geopolymer binders incorporating BW and showed that it can achieved high compressive strengths. They examined the pore structure of a ternary blended geopolymer, which included BW, GGBFS, and FA. The mix containing 20% BW demonstrated the highest compressive strength, reaching 73 MPa at 28 days. They also indicated that a binder containing 60% BW can achieve high compressive strength.
Ceramic waste (CW), rich in silica and alumina, is used as a base material in geopolymers to address waste disposal issues [
21]. The strength and durability characteristics of geopolymer mortar made with 50% CW and various amounts of FA in place of slag were investigated by Huseien et al. [
22] using different sodium hydroxide (SH) solution molarities ranging from 2 M to 16 M. Compressive strength increased as the SH molarity increased; although, the flowability and setting time reduced. According to previous research [
23], enhanced strengths of up to 58 MPa were achieved at a curing temperature of 80 °C when SH molarities ranging from 8 to 12 M were used.
Roof tile waste (RTW) is considered to be a promising component derived from CDW, with significant potential for use in the production of geopolymer materials. In terms of mechanical properties, RTW-based geopolymer mortars have shown higher compressive strength. Under heat curing conditions, RTW-based geopolymer mortars have demonstrated a compressive strength of up to 40 MPa. RTW has been compared to other materials, such as glass waste (GW) in various studies, and the results indicated that RTW significantly improved mechanical properties, particularly in terms of compressive strength. One key factor contributing to this improvement is the higher content of Al
2O
3 (alumina) in RTW compared to GW, controlling their ability to form geopolymer structures effectively. RTW has proven to be a more effective precursor in geopolymer production, leading to superior mechanical strength in geopolymer mortars. Kul et al. [
24] achieved compressive strength using RTW of up to 66 MPa at a curing temperature of 105 °C, with a SH molarity of 15 M, and a water/binder ratio of 0.35. Usha et al. [
25] recommended that the ideal mix of RTW-based geopolymer can be achieved using a SH molarity of 12 M, a sodium silicate (SS)/SH ratio of 2.5, an activator/binder ratio of 0.8, and 24 h of curing at 65 °C.
The geopolymer materials made of GW generally have low compressive strengths, despite glass’s high amorphous nature. Ulugöl et al. [
26] mentioned that glass’s chemical composition and particle size distribution are probably the main causes of its low compressive strength. About 40% of glass’s particles are larger than 100 micrometers, making it coarse in comparison to other raw materials. Other research [
1,
27,
28] indicated that modifying the mix parameters, including the temperature and curing time, as well as the concentration of SH, resulted in a compressive strength of up to 36 MPa. In the meantime, Tahwia et al. [
29] demonstrated that GW may be used as fine aggregate to produce ultra-high-performance geopolymer concrete. When 22.5% of sand was substituted with GW, the concrete’s compressive strength reached 121 MPa.
To improve the performance of geopolymers made of CDW, various processing conditions have been investigated to identify the best circumstances. The literature has documented a variety of curing conditions, including room temperature, autoclave curing, steam curing, and saltwater curing. In addition to accelerating up the degree and rate of condensation, thermal curing encourages the faster breakdown of silica and alumina types, resulting in denser and more robust mixes. The best results were achieved under temperature curing of above 60 °C, as this can enhance the reaction of the raw materials and facilitate the geopolymerization process [
30].
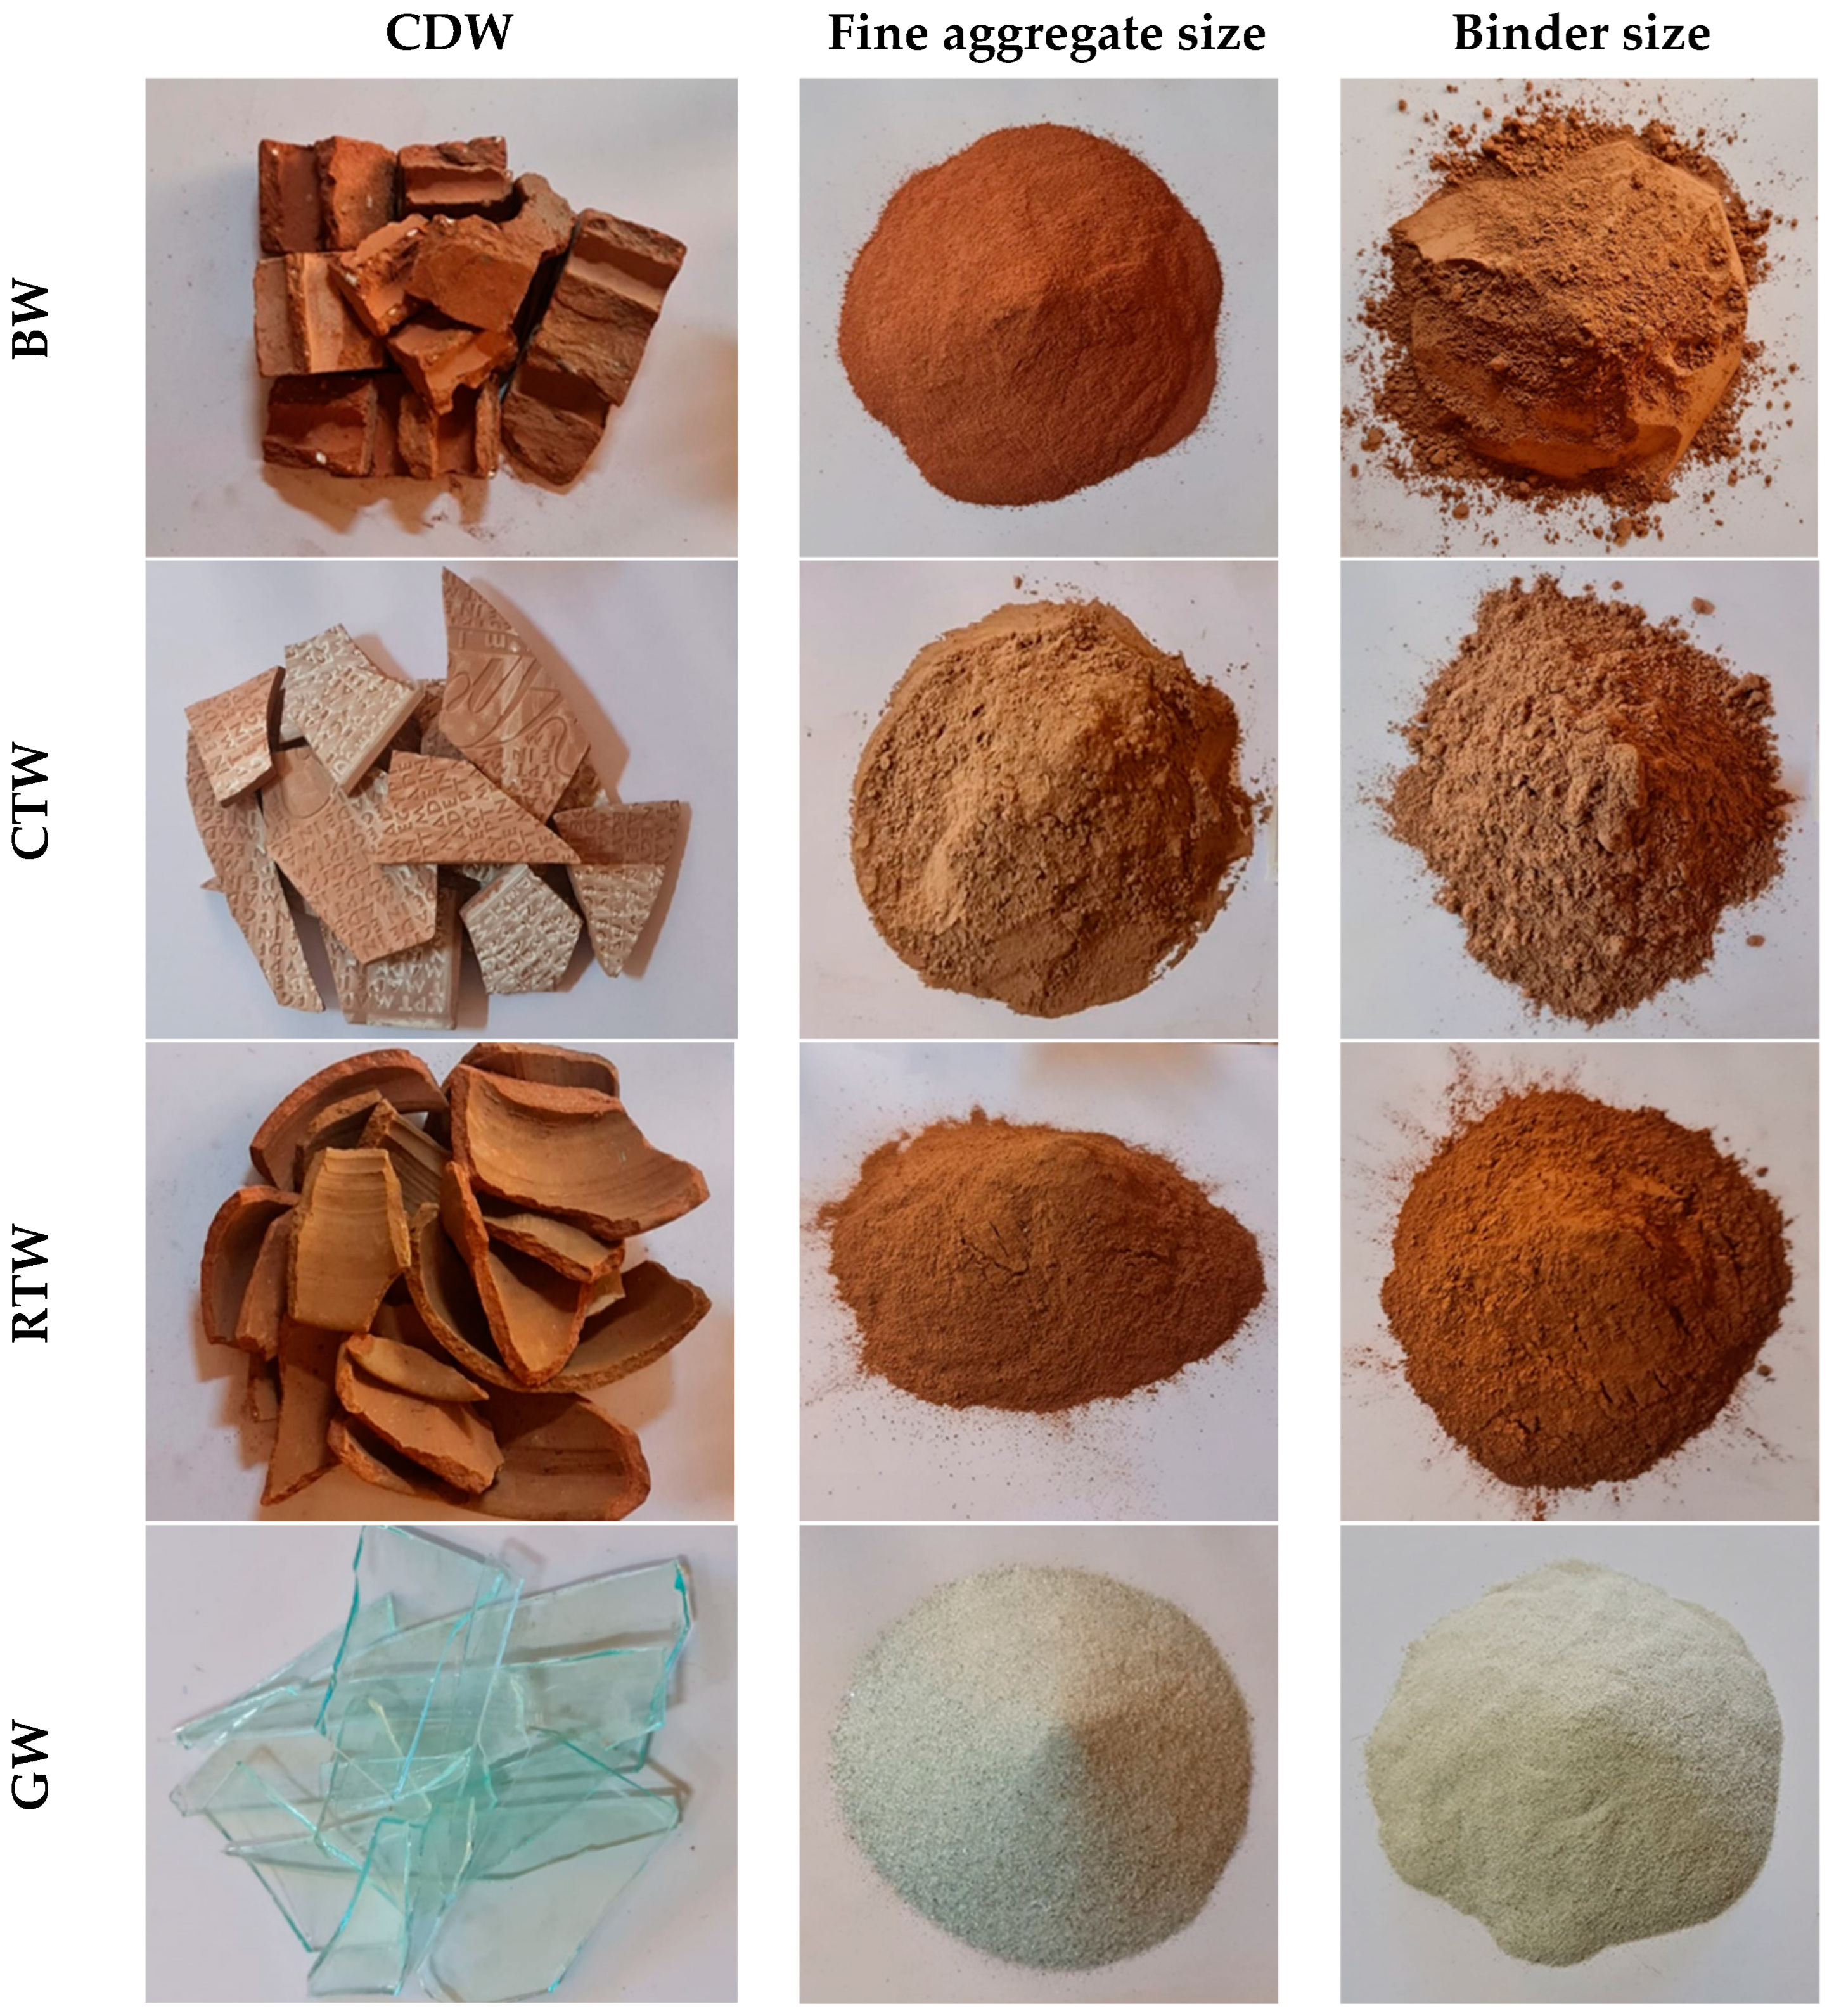
As per the literature review and to the best of the author’s knowledge, it has been observed that the impact of each type of CDW on geopolymer mortar has been studied individually, either as an aggregate or binder. In this study, four different types of CDW (BW, CTW, RTW, and GW) were used as a fine aggregate or binder to partially replace FA/slag or sand, respectively, at 25% and 50% by volume to produce eco-friendly high-strength geopolymer mortar (HSGM). A variety of mechanical and durability properties were measured for the proposed eco-friendly HSGM, including workability, compressive strength, freezing/thawing resistance, sulfate attack, water absorption, and water sorptivity. Three curing conditions were applied in this study, namely, water (W), heat followed by water (HW), and heat followed by air (HA). The goal of this study is to reduce the challenges associated with the production of HSGM. These challenges include improving the reaction of alternative materials derived from CDW, as well as controlling workability, while maintaining compressive strength and durability. Additionally, the study aims to develop suitable treatment methods that enhance mechanical performance, while ensuring environmental sustainability, making it suitable for a wide range of applications. The results of this study will help to improve the understanding of CDW performance in HSGM for more sustainable construction.
3. Results and Discussion
In this research, 33 HSGM mixes were prepared, tested, and compared over two experimental stages. Several fresh, mechanical, and durability properties were determined for the HSGMs, including workability, compressive strength, water absorption, water sorptivity, chemical attack effect, and freeze/thaw effect.
Table 4 and
Table 5 display the measured compressive strength and durability properties for the HSGMs.
3.1. Workability
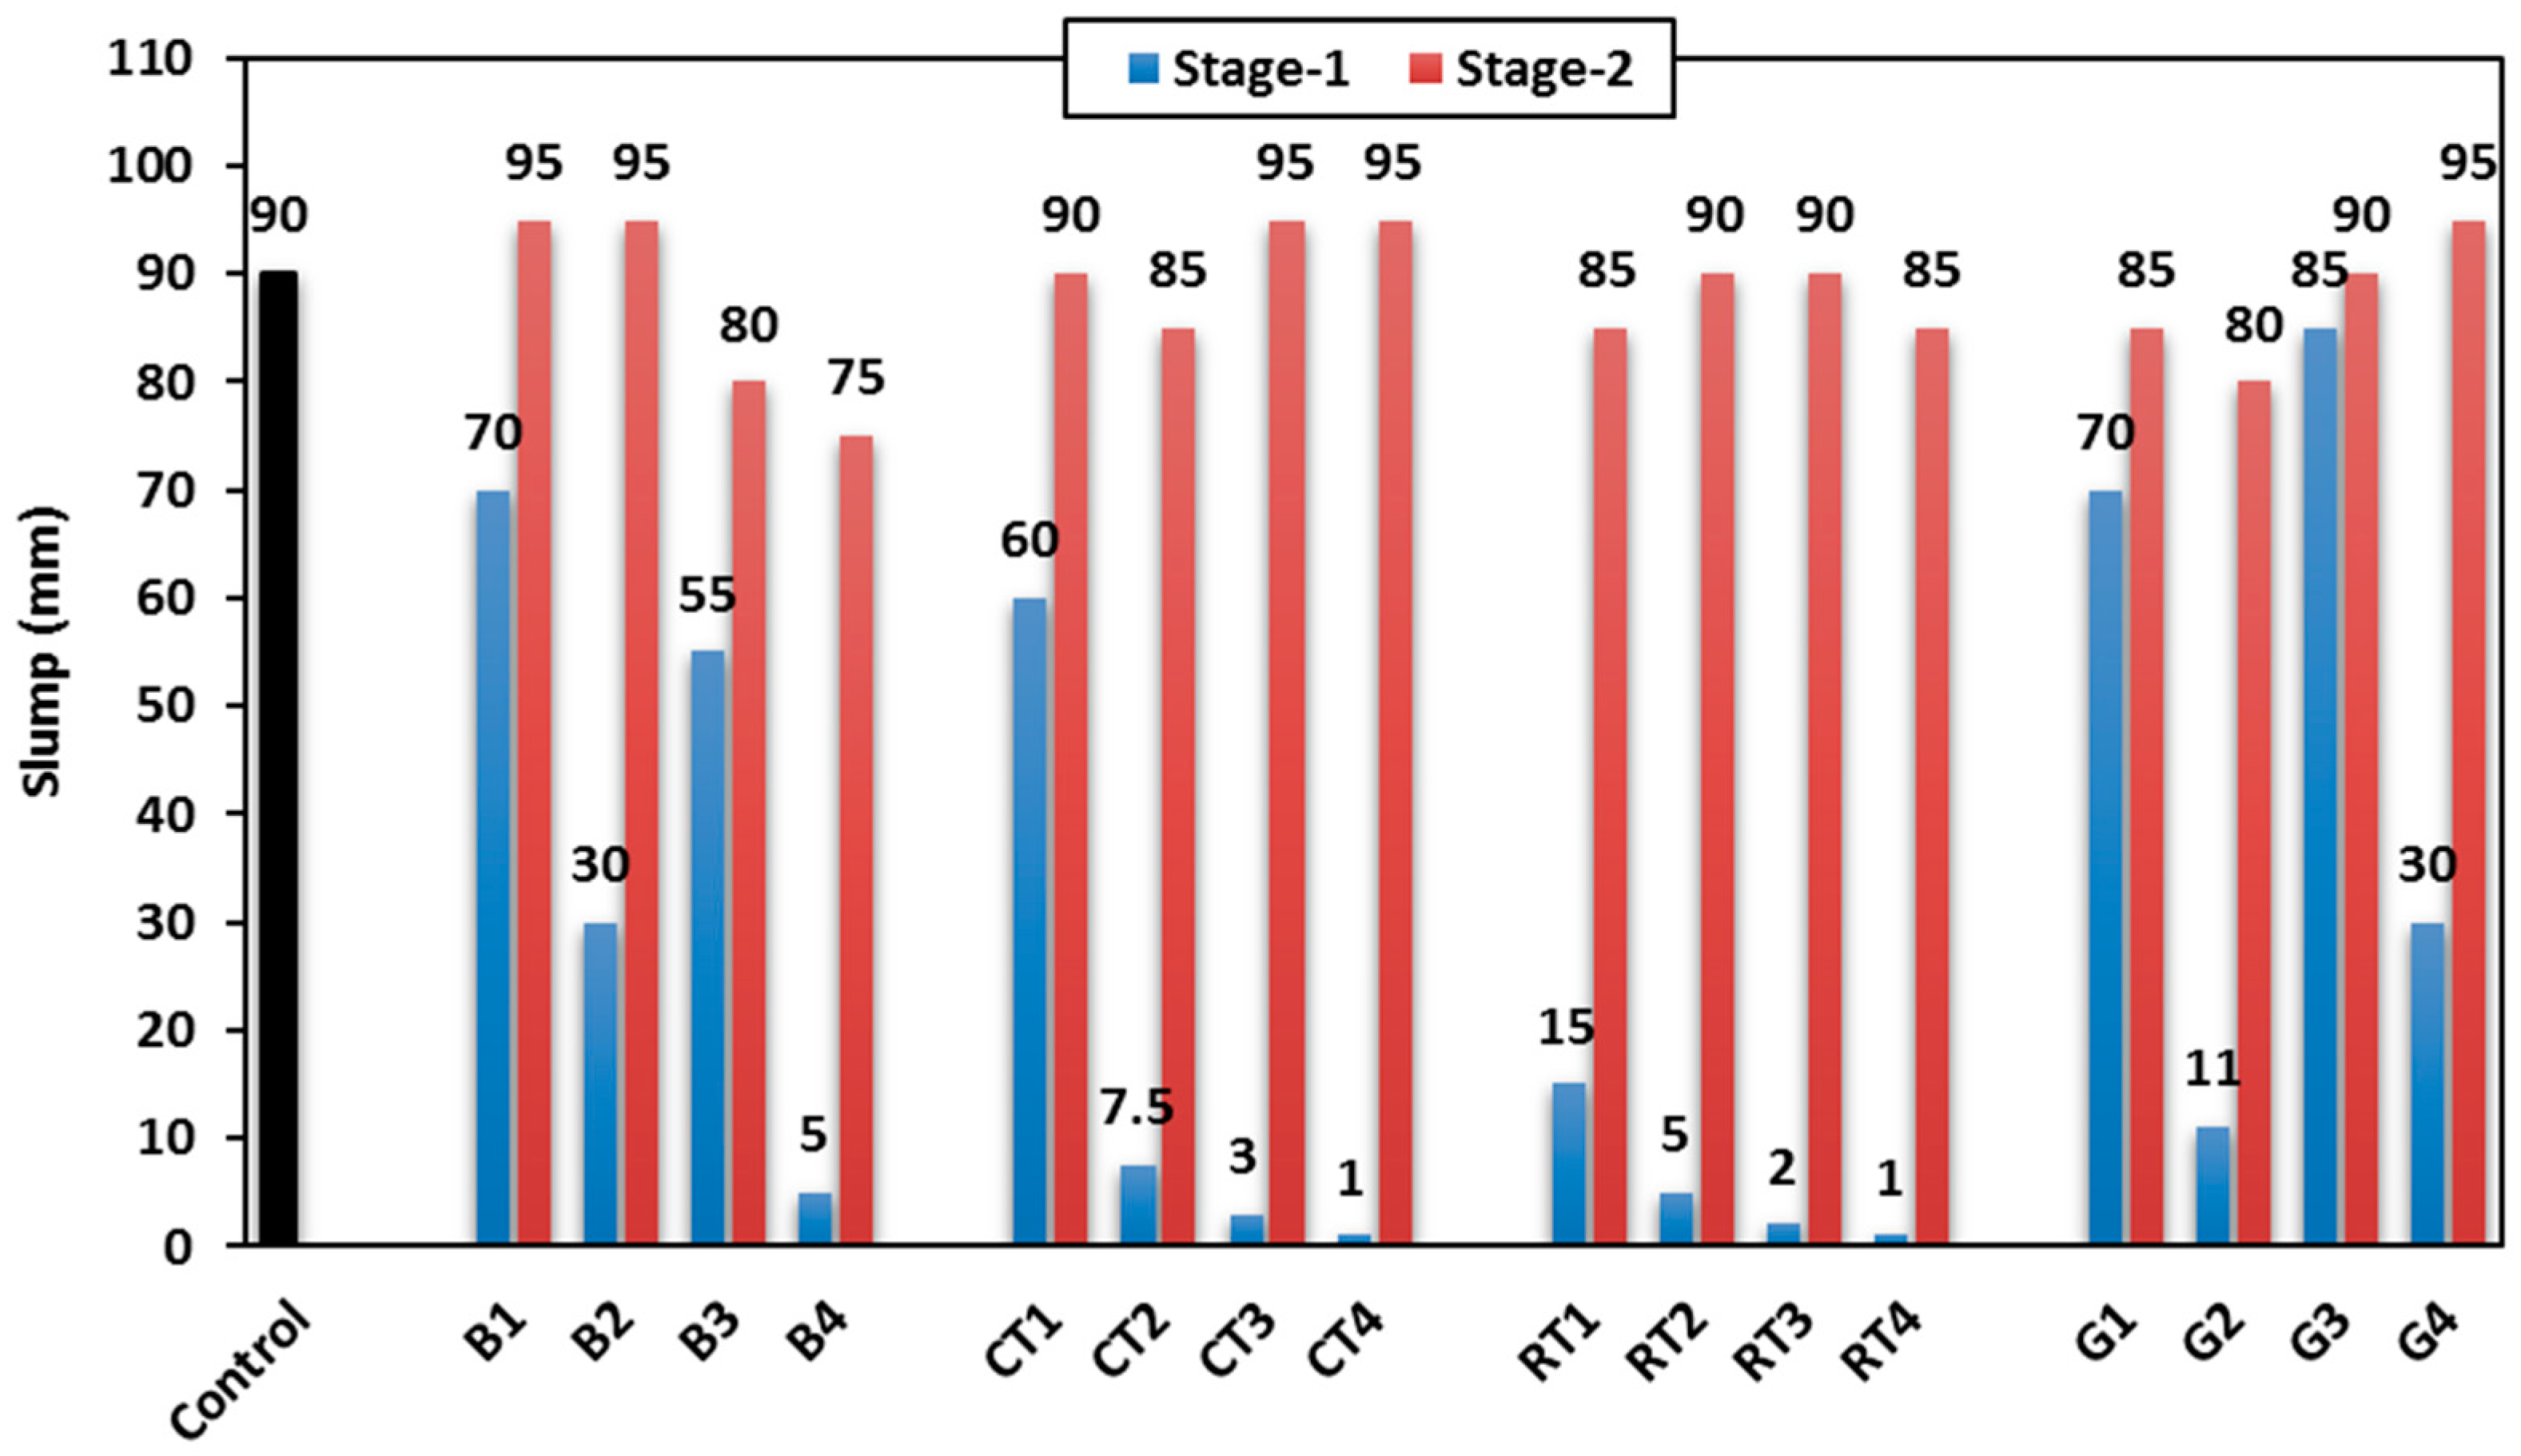
3.1.1. Slump
Figure 6 shows the slump values of the HSGM mixes. The control mix showed a 90 mm slump value, and it was used as the control for both stages. In Stage-1 (no extra water used), by increasing the content of CDW materials, the slump significantly decreased, regardless of the material size (binder or fine). This is attributed to the high water absorption of the CDW materials compared to the replaced traditional geopolymer materials. Among mixes incorporating CDW materials, those made with BW and GW (mixes B1, G1, and G3) could show a 70–85 mm slump with only a 5–22% decrease compared to the control mix. This is attributed to the relatively low water absorption of BW and GW compared to other utilized CDW materials. The GW also has a smooth surface, which helps to minimize friction and preserves the mortar mix’s moisture content. The lowest slump was observed when using RTW, as it could not show slump more than 15 mm with an 83% decrease, compared to the control mix. This is attributed to the relatively high water absorption of RTW, in addition to its rough surface, which increases the friction within the mortar matrix, and hence, workability decreases. When using 25% of CTWB, the slump decreased by 33.3% (60 mm); however, when the CTWB increased to 50%, the slump significantly decreased by 91.7%, as shown in
Figure 6.
Based on the workability findings of Stage-1, Stage-2 was carried out to control the workability of the HSGM mixes by adding extra water equal to the CDW water absorption % (see
Table 3). In this stage, the workability ranged from 95 mm to 75 mm for all mixes (+5% to −20%), whether using CDW as a replacement of binder or fine aggregate, as stated in
Figure 6.
The use of CDW in the production of geopolymer mortar reduces the need for the disposal of these wastes in landfills, thus reducing their harmful environmental impact. Among these wastes, GW and BW are considered the best materials used in this study in terms of workability, as they contribute to lower water consumption, with water being an important element in environmental sustainability.
3.1.2. Flow Diameter
Figure 7 shows the measured average flow diameter of the HSGM mixes. The control mix exhibited a flow diameter of 180 mm. In Stage-1, using CDW materials in HSGM mixes decreased the flow diameter by 16–44%, as the flow diameters ranged from 100 to 150 mm, compared to the control mix. Among mixes incorporated CDW, no significant differences were observed in their flow diameter, regardless the CDW material or dosage, unlike that observed in the corresponding measured slump. This reflects the capability of the proposed eco-friendly geopolymer mortar to compact well under traditional vibration, as also observed by previous research [
38]. When using 25% CDW as a binder in mixes B1, CT1, and G1, they showed approximately similar flow diameters of 130, 140, and 145 mm, respectively. This reflects flowability decreases of 19.4%, 22.2%, and 27.8%, respectively. However, when using 50% CDW as a binder, it was observed that the flow diameter for both mixes CT2 and G2 decreased by 38.3%, and mix B2 decreased by 33.3%. Using RTWB at 25% and 50% contents exhibited the lowest flow diameters with reductions ranging from 38.3% to 43.9%. Using CDW as a fine aggregate in mixes B3 and G3 yielded the highest flow diameters of 130 mm and 150 mm, respectively, meaning that the flowability decreased by 16.7% and 27.8%, respectively. The flowability decreased to 104 mm and 135 mm in mixes B4 and G4 with decrease percentages of 25% and 42.2%, respectively, compared to the control mix.
In Stage-2, the flow diameter increased compared to Stage-1 and ranged from 140 to 170 mm. It was not observed that the flow diameter significantly changed with the change in CDW material or content. Mixes B2, CT3, CT4, and G4 exhibited the highest flowability among all CDW mixes.
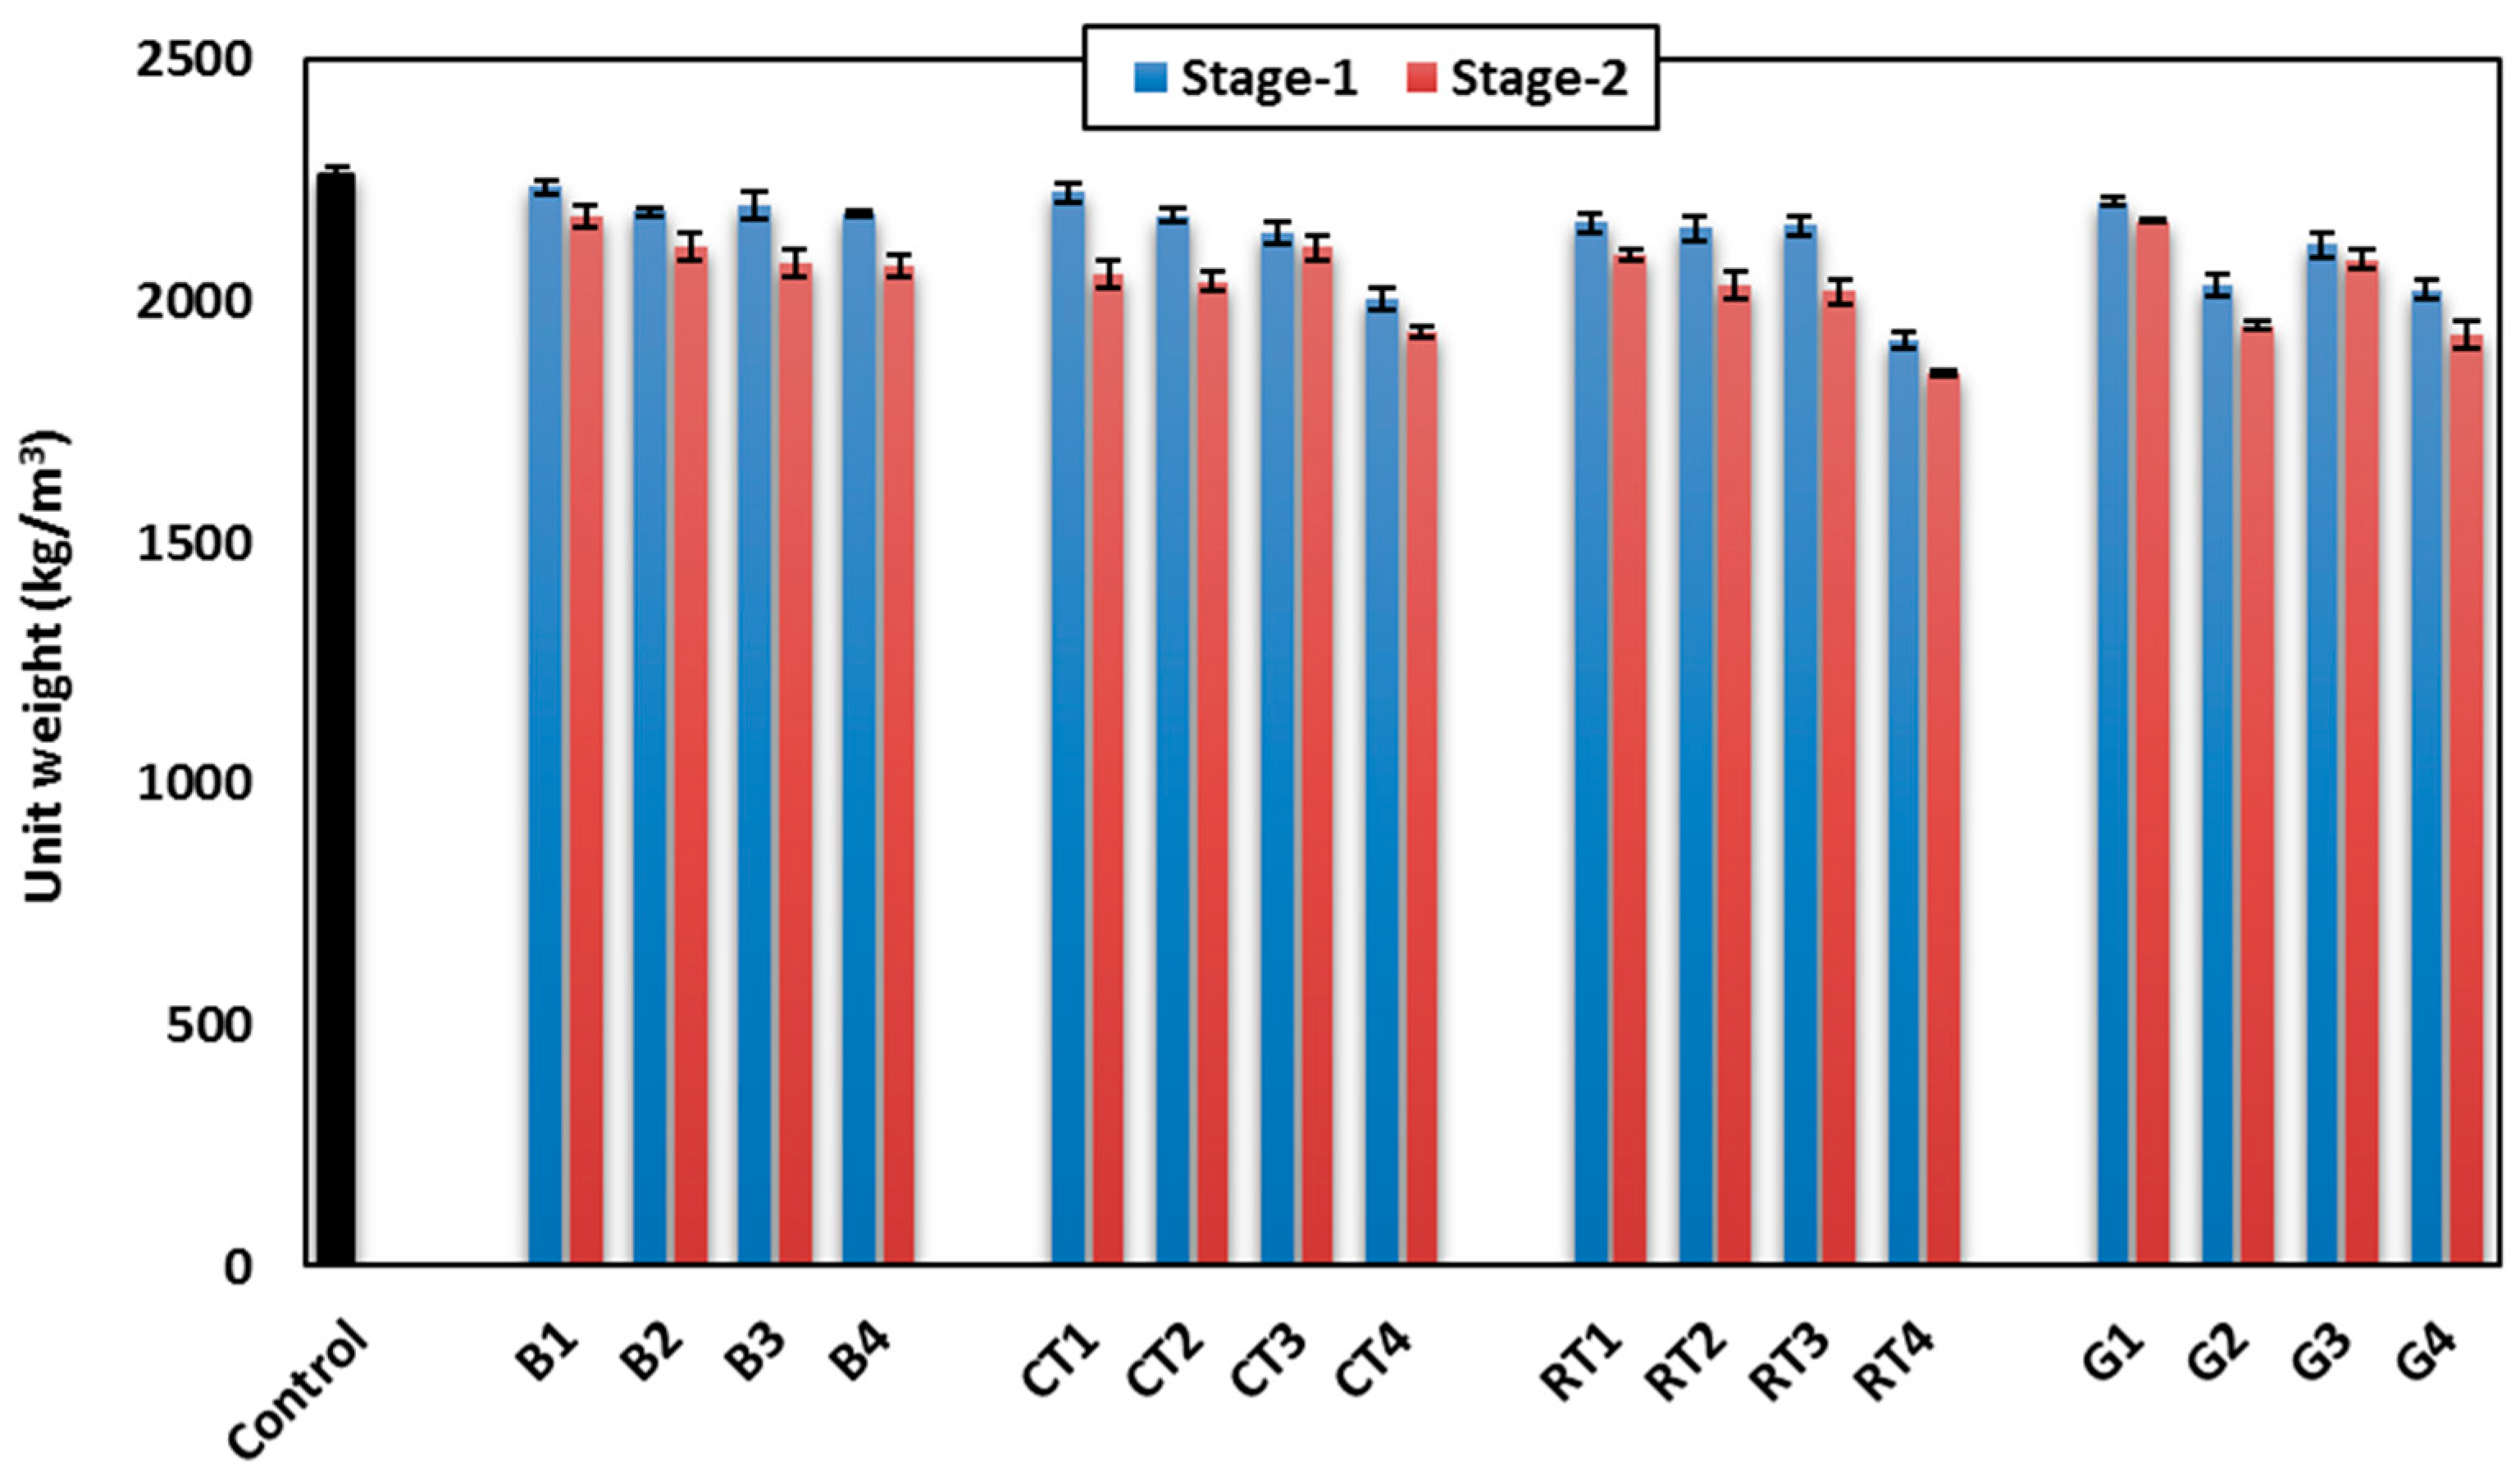
3.1.3. Unit Weight
The measured average unit weight for each HSGM mix is shown in
Figure 8 for both stages in this study. The results showed that, when the substitution rate increased from 25% to 50%, the unit weight decreased in all CDW mixes. This indicates that the CDW are lighter than the traditional precursor (slag, FA, and quartz sand) used in the control mix, especially the fine aggregate waste in Stage-1. The unit weight of the control mix was 2258 kg/m
3. This value decreased to 1920 kg/m
3 when 50% of quartz sand was replaced by RTW (15% decrease). The unit weight of mixes made in Stage-2 showed a similar trend to that shown in Stage-1, as can be observed in
Figure 8.
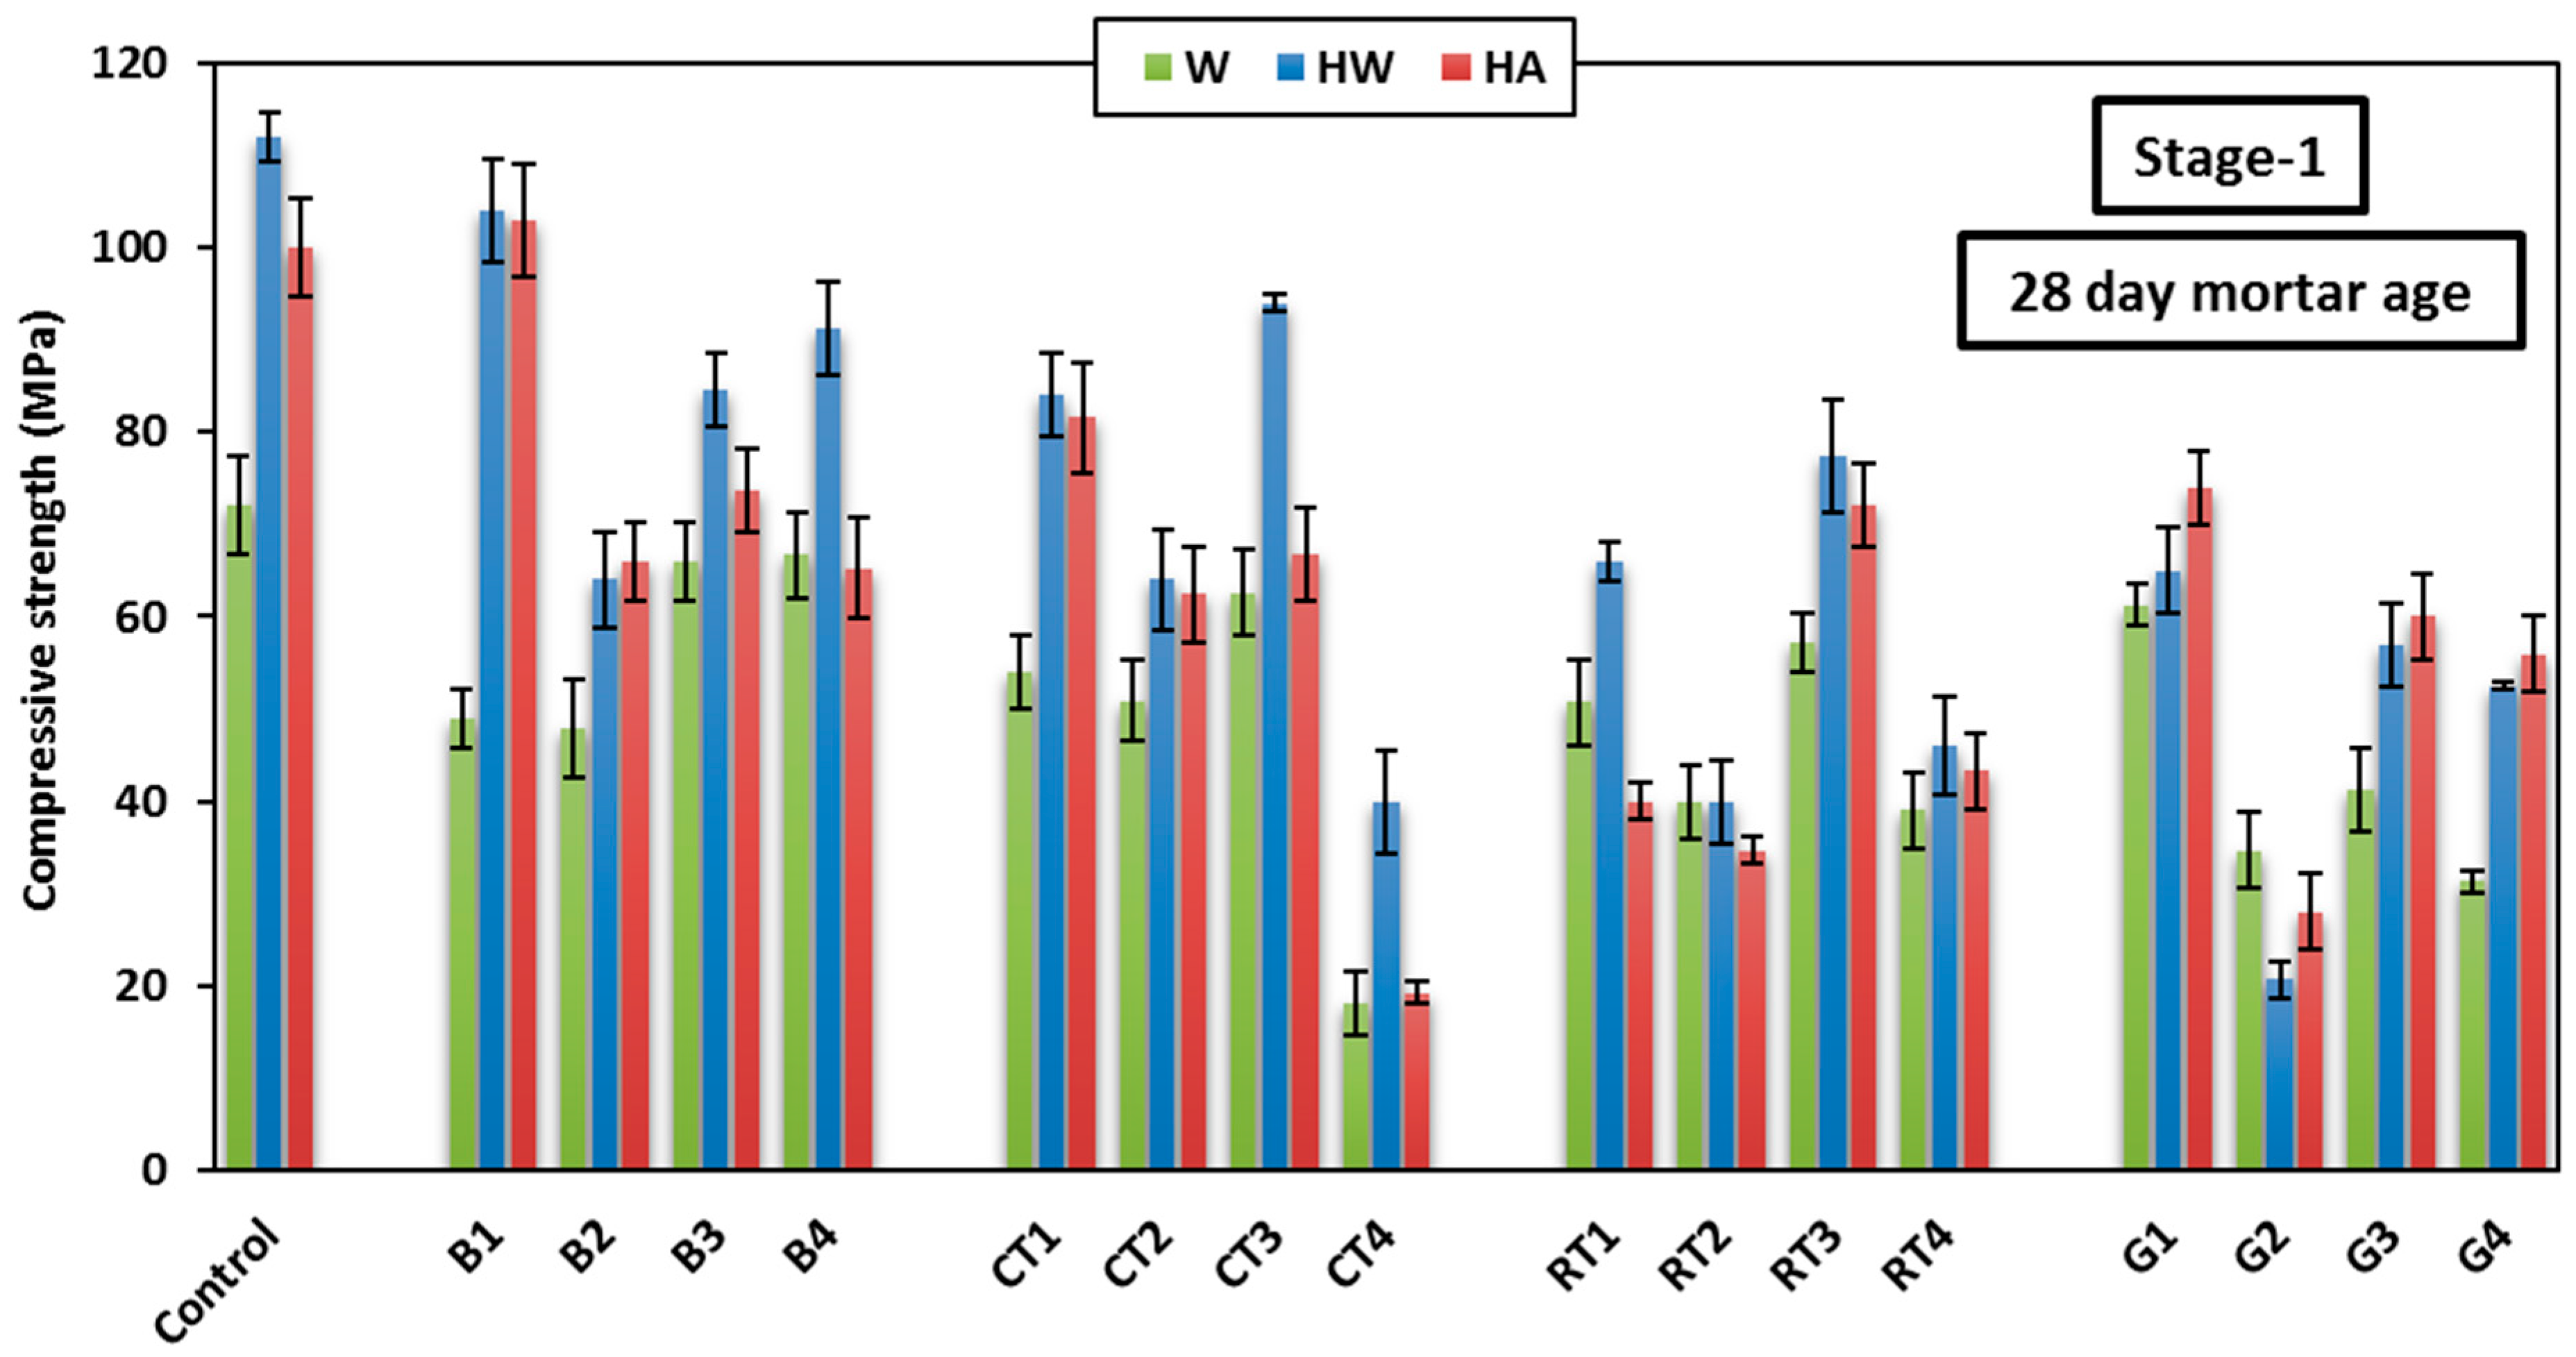
3.2. Compressive Strength
Figure 9 shows the 28-day compressive strength varation of the HSGM mixes at different curing conditions applied in Stage-1. As shown in the figure, the HW curing condition showed the highest 28-day compressive strength in the control mix (112 MPa), as well as the CDW mixes (up to 104 MPa), except the GW mixes that showed higher compressive strength when cured in HA. The advantage observed in compressive strength when using heat curing may be due to the slag containing calcium oxide (CaO), which reacts more quickly to produce calcium silicate hydrate (C-S-H) and calcium aluminosilicate hydrate (C-A-S-H). These are the main compounds that enhance compressive strength in mortar. These compounds create very solid gels that reinforce the structure and increase the material’s density. These gels form a matrix of strong chemical bonds that contribute to material strengthening, making it more capable of withstanding pressure. Consequently, the increase in mortar strength primarily arises from the formation of these gels during the early days after curing, improving the material’s compressive resistance. In addition, the high temperature also speeds up the chemical reactions in geopolymers, which promotes the material’s ability to create internal interactions. This makes the geopolymer’s structure stronger and denser by hastening the solidification process.
The benfits of using heat curing was also observed in the HA curing condition, as it was the second best curing condition after HW in most mixes. It also showed superiority in the GW mixes, due to the high SiO2 content and low Al2O3 content in GW, which often results in glass-based geopolymers, producing weakly bonded aluminosilicate materials. Therefore, in the case of HA curing, the low humidity reduces the likelihood of forming sodium silicate gel (which exhibits shrinkage and cracking), thereby enhancing the stability of the resulting material. In contrast, HW curing enriches the formation of sodium silicate gel due to the reaction of glass components with water, which can lead to greater shrinkage and cracking, thereby weakening compressive strength. HW curing also increases the likelihood of producing weakly bonded products (such as sodium silicate gel) and leads to the excessive consumption of alkalis due to the high CaO content in glass, ultimately reducing the final compressive strength. The W curing generally showed the lowest compressive strength in most mixes, which is not recommended for geopolymer products, especially those incroporating FA. In FA-based geopolymer mortar, the reaction occurs slowly, which can slow down the strength gain in the early stages. In the case of W curing only, the reaction does not occur fast enough or completely enough to improve strength beyond the early stages, resulting in relatively lower compressive strength. Additionally, FA has a high silica (SiO2) content and low calcium oxide (CaO) content. This means that the primary hydration products formed are weaker, as calcium oxide produces strong C-S-H and N-C-A-S-H hydrates that enhance strength. Therefore, if the mix contains FA, the chemical composition is less favorable for achieving a high strength under W curing only.
Overall, due to the low reactivity of FA with water and the insufficient amount of calcium oxide to support strong reactions, weak bonding and increased cracking were formed, leading to low compressive strength compared to mixes cured by heat. Heat curing generally enhances the strength of geopolymer concrete, especially in mixes containing slag or materials with high calcium oxide content.
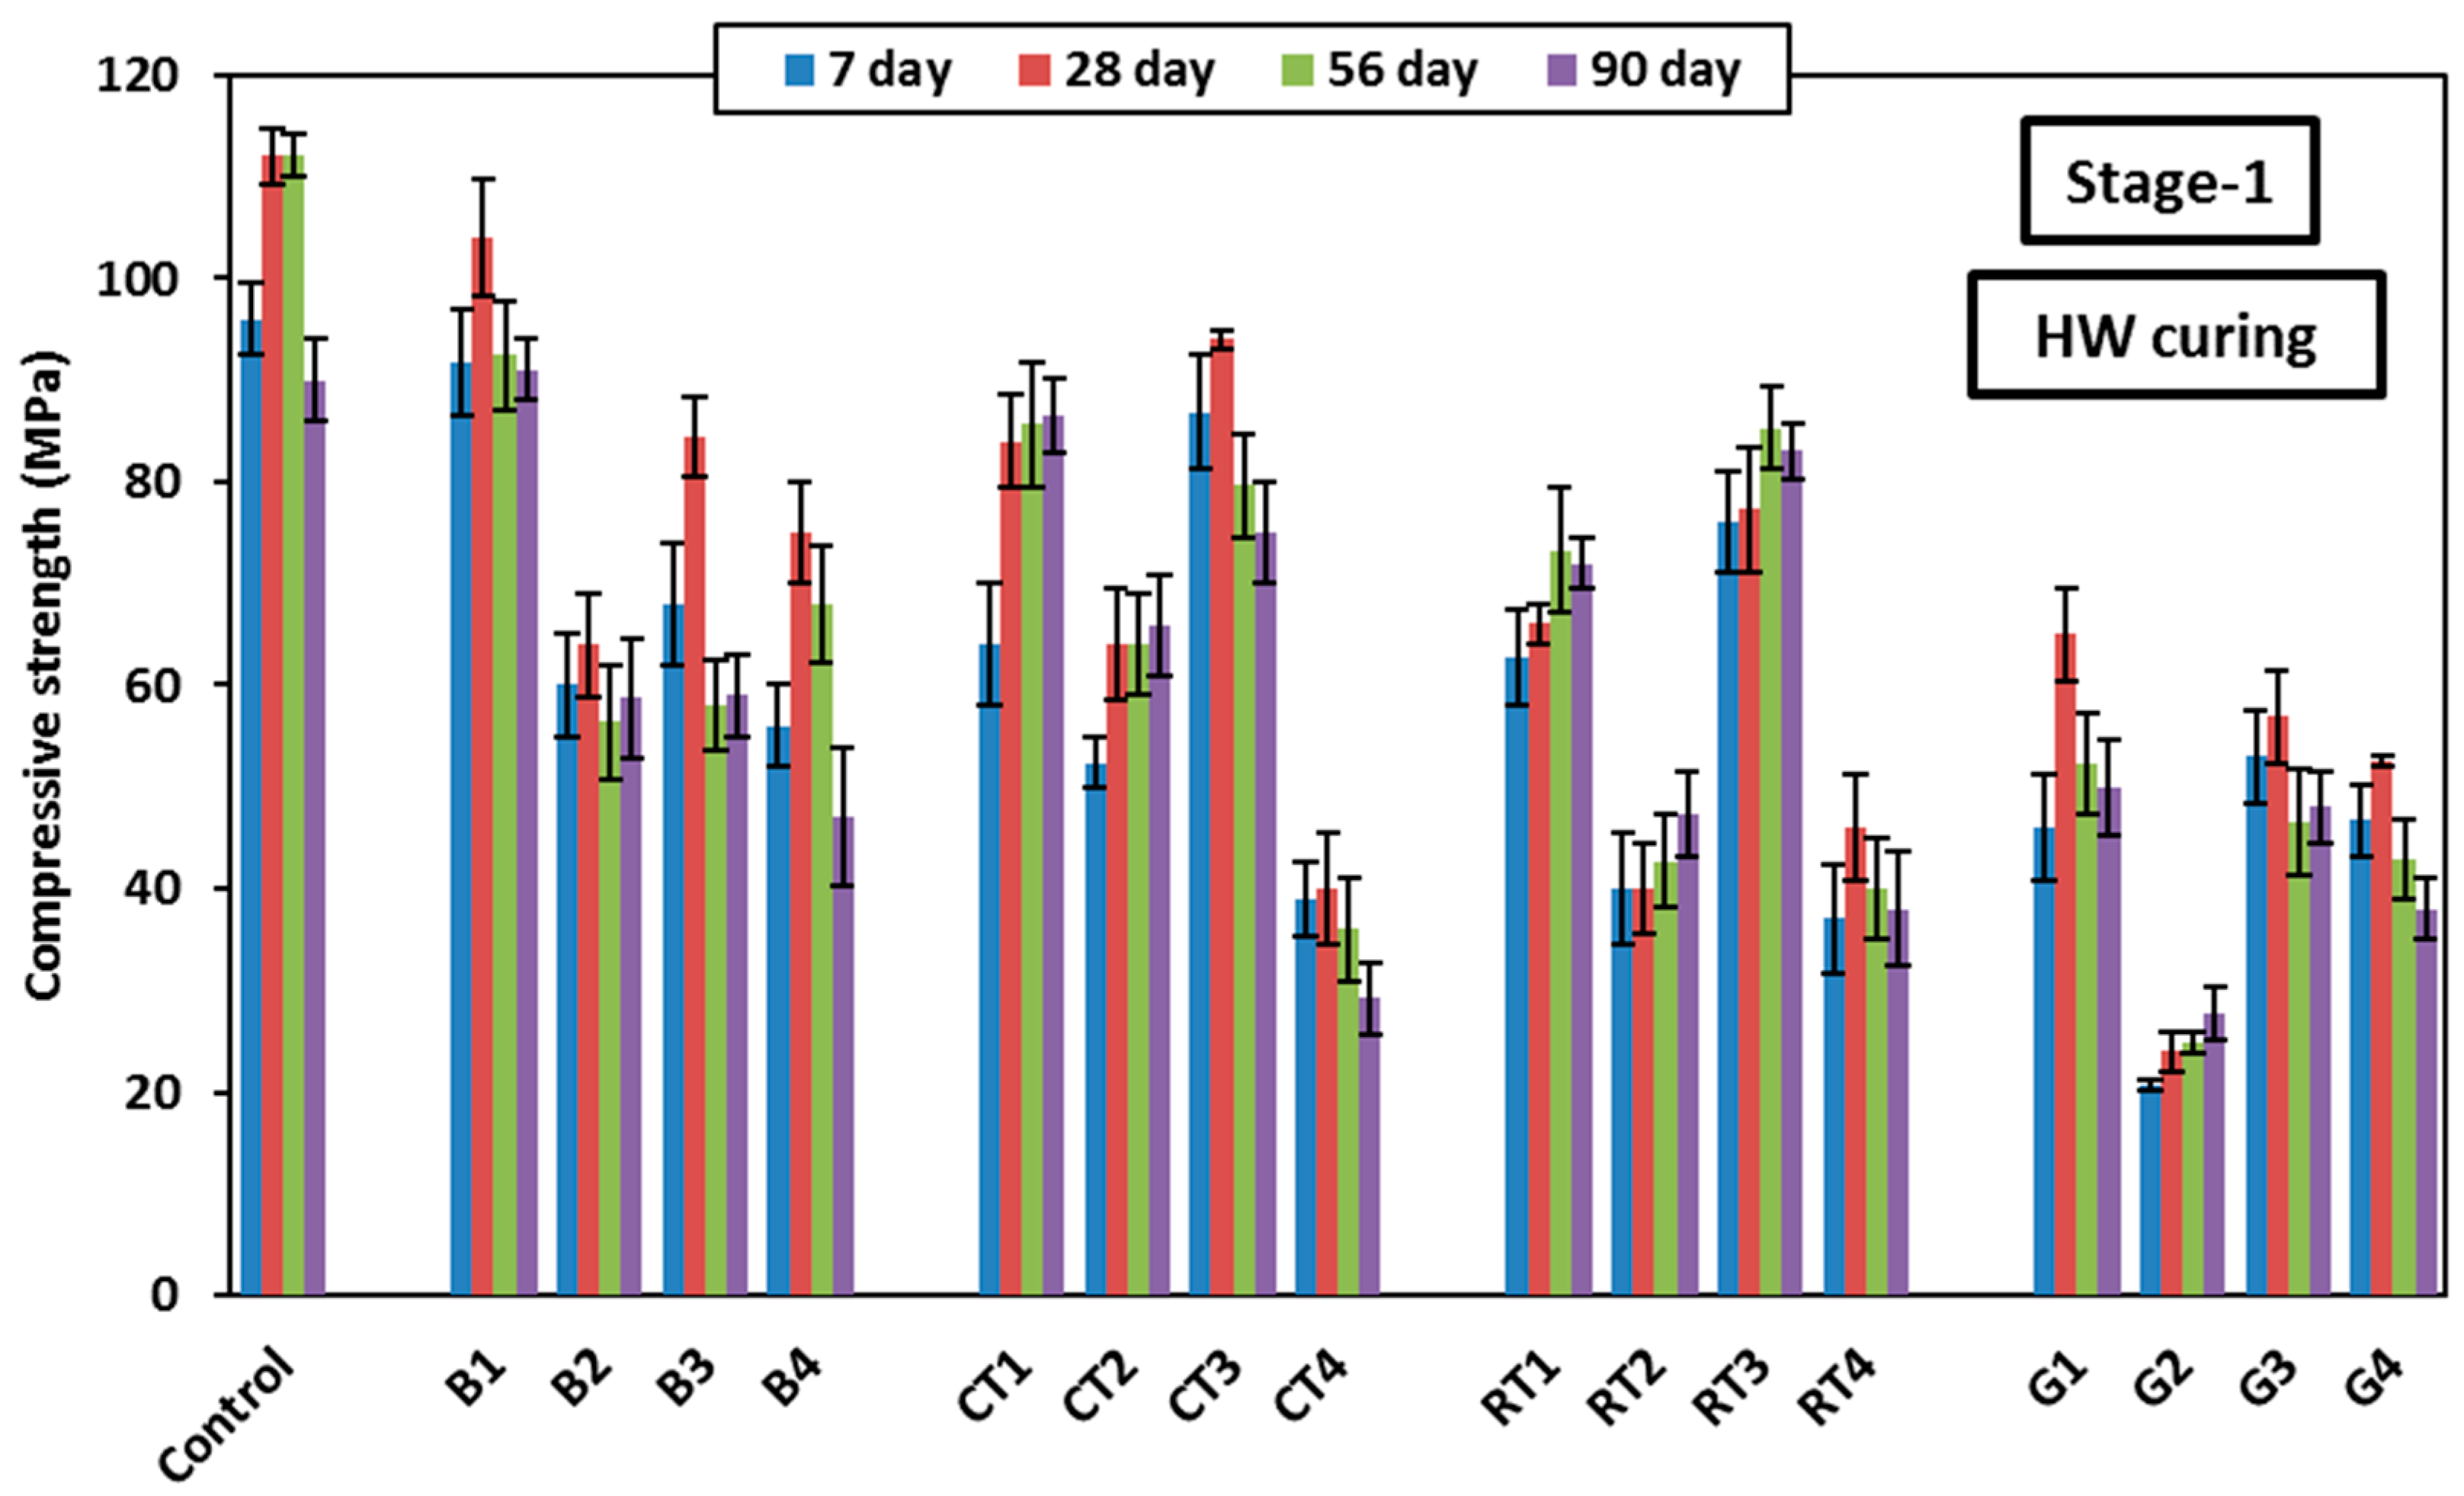
The development of HSGM compressive strength up to 90 days using HW curing is shown in
Figure 10. It was found that, for all mixes, compressive strength increased up to 28 days, but after that, it decreased and, in some cases, remained constant. This is because SH reacts with slag to create C-S-H and C-A-S-H gels very quickly [
39]. For long-term compressive strength (90 days), when 50% of the binder was replaced in mixes B2, CT2, RT2, and G2, the compressive strength slightly increased by approximately 5% compared to the 56-day strength. However, when 50% of fine aggregates were replaced in mixes B4, CT4, RT4, and G4, the compressive strength decreased compared to the 56-day strength. This is in line with what was reported by Vasconcelos et al. [
40] when employing a high sand/binder ratio (0.9) and a 12 M concentration of SH solution, the compressive strength of geopolymer concrete dropped after 28 days.
Among all CDW mixes, mixes B1, B2, B3, B4, CT1, CT2, CT3, RT1, RT3, and G1 achived a compressive strength of more than 60 MPa at 28 days; therefore, they can be categorised as HSGM. The enhanced formation of C-S-H and C-A-S-H gels may have been facilitated by the material’s granular structure and higher hydraulic response capabilities [
41]. This confirms that the use of CDW in geopolymer mortar is effective and can be utilized in manufacturing mortar with high compressive strength. Compressive strength exceeding 80 MPa was achieved at HW curing after 28 days when using BW and CTW at a substitution rate of 25%, whether they were used as the binder or fine aggregate. However, when the substitution rate was increased to 50%, the compressive strength decreased due to a decrease in the hydration products and a weakness of the integrity of the cementitious materials. Mix B4, which included 50% BWF, showed higher strength than B3 (included 25% BWF), with an increase of approximately 8% after 28 days. This is because it contains the essential silicon and aluminum needed to increase the reaction, which led to an increase in compressive strength. Using 50% CTWF in mix CT4 led to a 64% decrease in strength, while using 50% of RTWB or RTWF in mixes RT2 and RT4 caused a reduction of approximately 60%. When 50% GWB was used in G2, the compressive strength decreased drastically, recording the lowest strength with a 75% reduction. However, when GWF was used in mix G4, the strength decreased by 53.6%.
It is believed that the chemical composition of GW and the particle size distribution are the main reasons for the reduced compressive strength. The high roughness of the glass particles is considered a key factor in decreasing the compressive strength of geopolymer mortar made of GW. The higher Si/Al ratio in glass-based geopolymers is thought to contribute to lower compressive strength, as it leads to the formation of weakly bonded aluminosilicate materials. When GWB is used as a raw material, sodium silicate gel is formed, a substance prone to shrinkage and cracking when activated with SH, leading to a decrease in compressive strength. Additionally, the high CaO content in glass consumes SH, further reducing compressive strength.
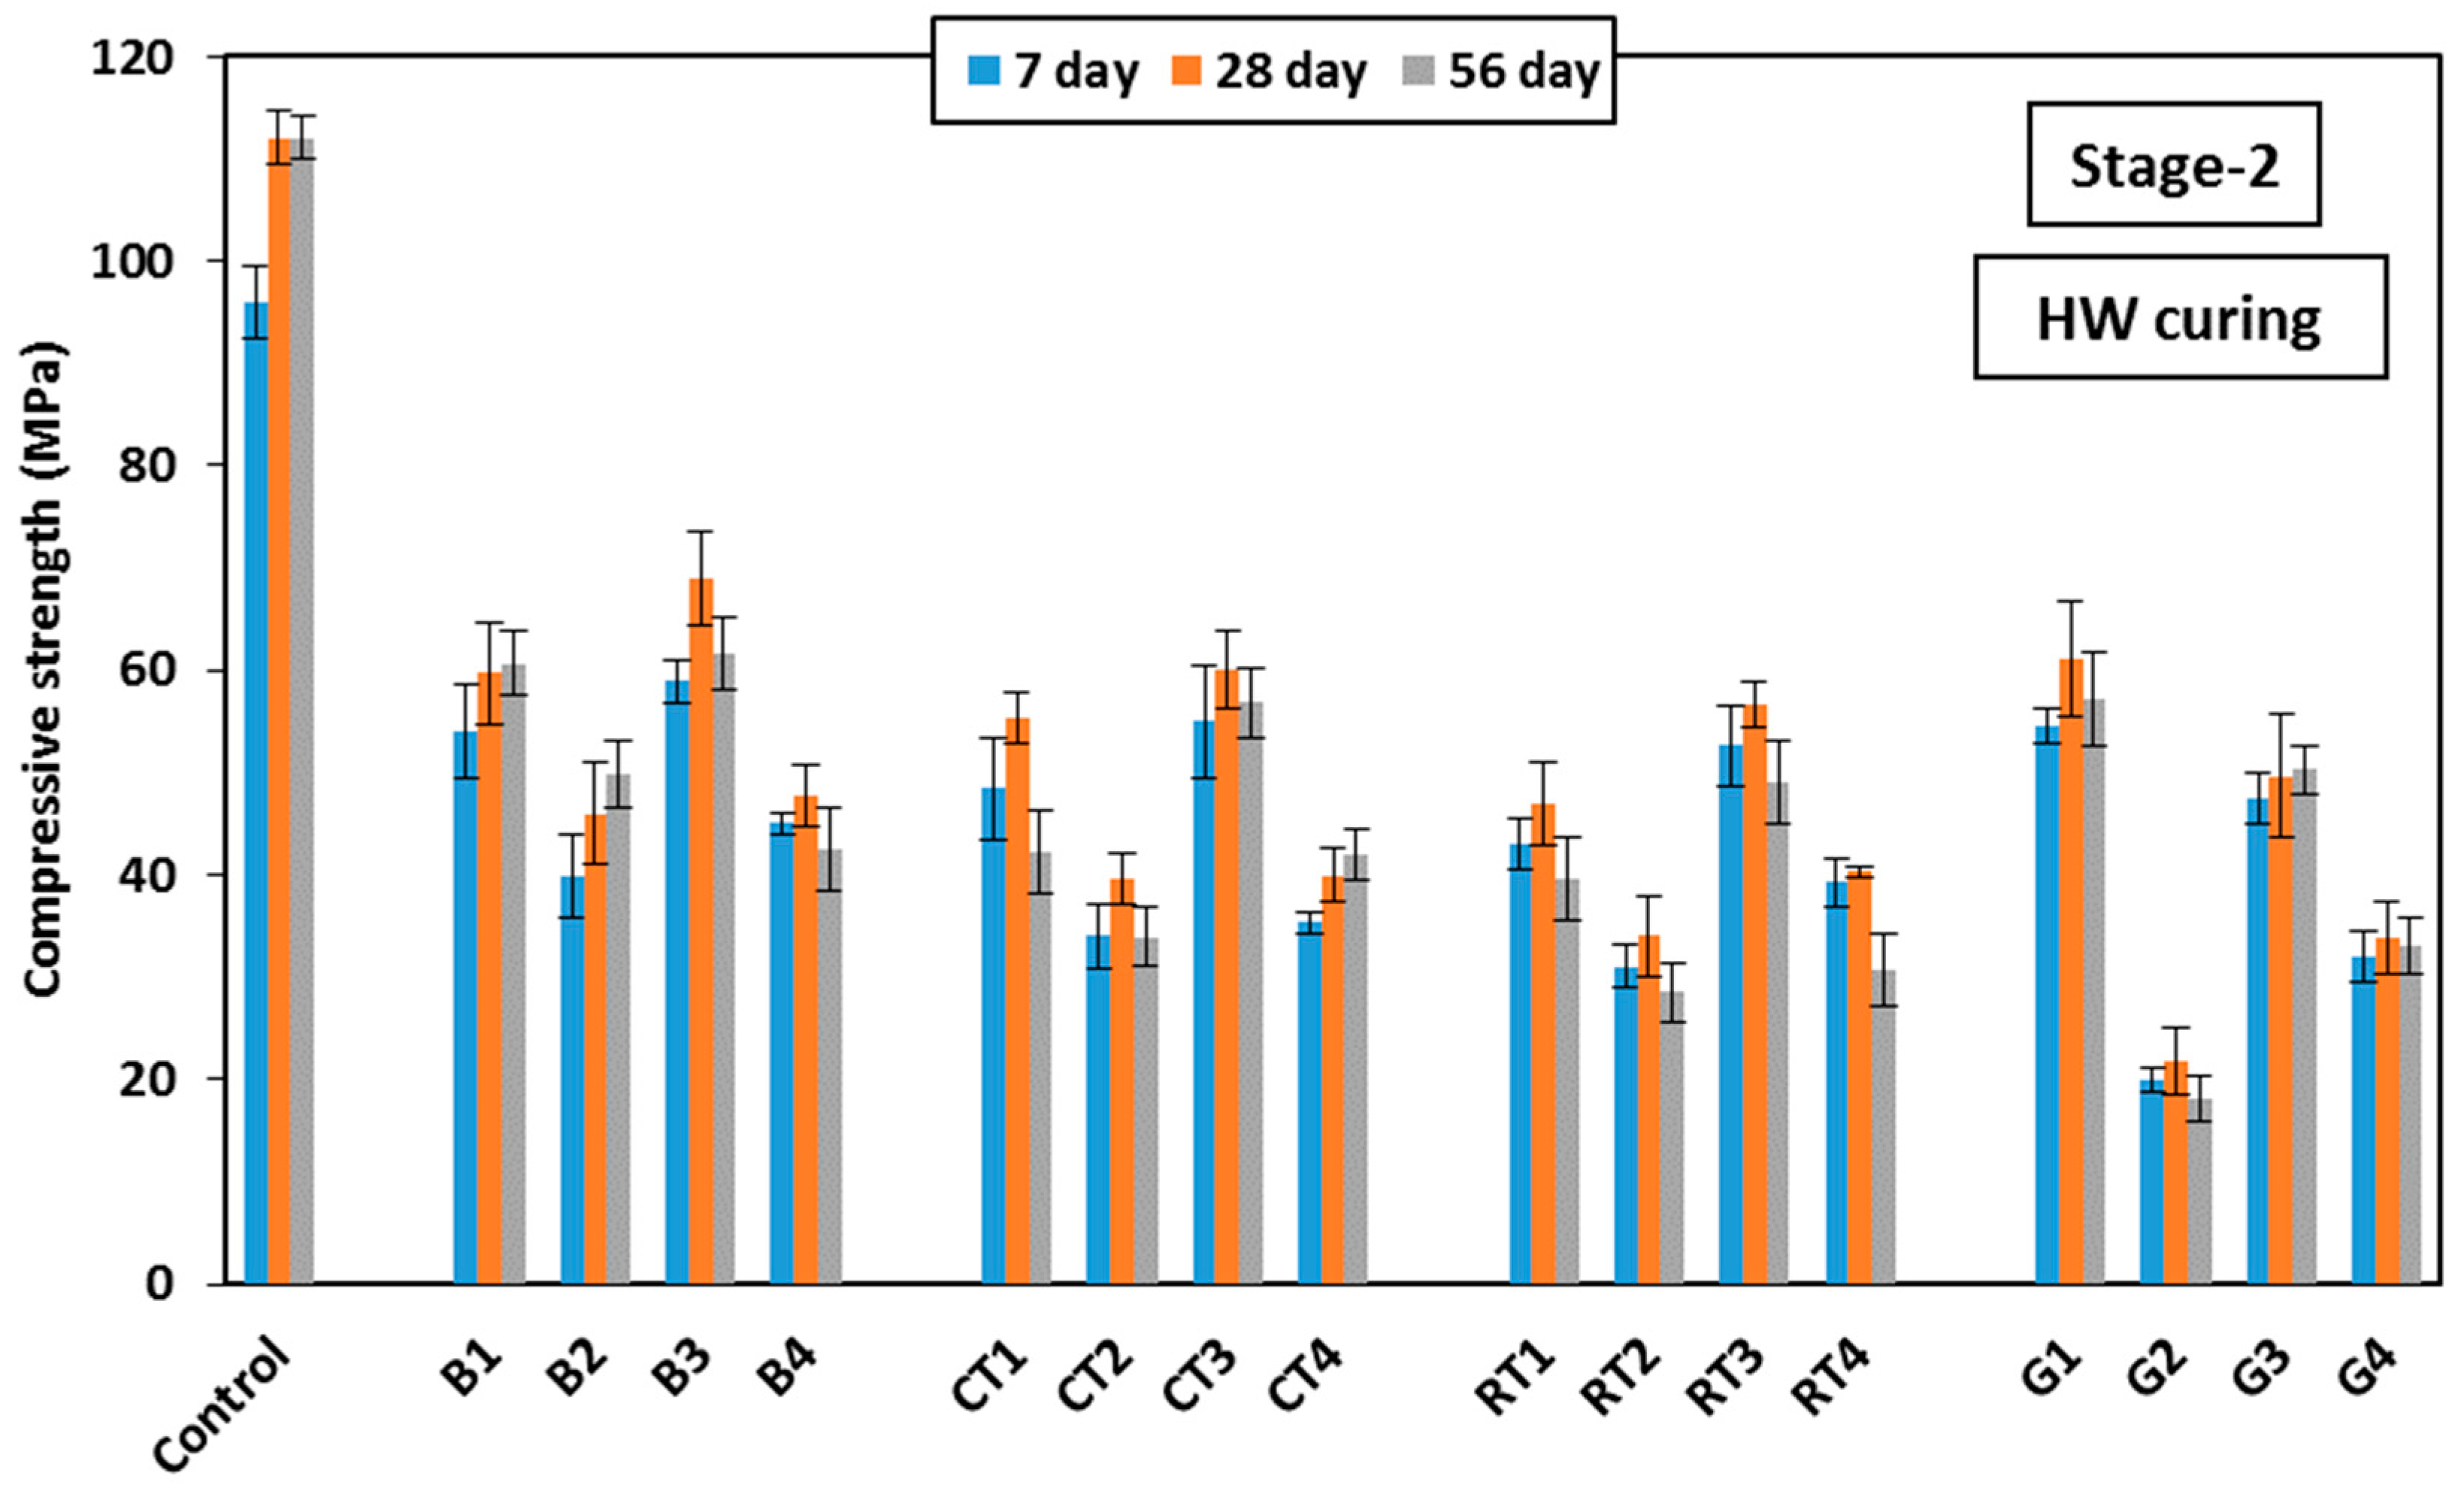
Figure 11 shows the development of HSGM compressive strength up to 56 days using the HW curing measured in Stage-2. As shown in the figure, the use of BW showed satisfactory results with a compressive strength of about 60 MPa when used at a ratio of 25% as the binder or fine aggregate in mixes B1 or B3, respectively. This reflected strength decreases of 46% and 38%, respectively, compared to the control mix. This is consistent with what was reported by Elemam et al. [
41], who pointed out the development of unreacted slag and FA particles. When 50% replacement was made with binder or fine aggregate in mixes B2 and B4, the strength decreased by 60%. The use of CTW showed results similar to BW. When 25% of CTWB was used in mix CT1, and CTWF was used in mix CT3, the strength decreased by 50% and 46%, respectively. At 50% replacement (in mixes CT2 and CT4), the strength decreased by 64%. It was also observed that the RTW gave results nearly similar to those of BW and CTW, which is contrary to what was recorded in Stage-1. However, in Stage-2, when 25% of RTW was used as the binder in mix RT1 and as the fine aggregate in mix RT3, the strength decreased by 58% and 49%, respectively. At a 50% replacement level using RTWB and RTWF, the strength decreased by 70% and 64%, respectively. Similarly, when 25% of GW was used in mixes G1 and G3, the strength decreased by 45.5% and 50%, respectively. At a 50% replacement level using GWB and GWF, the strength decreased by 80% and 70%, respectively. It is also noticeable that there was no discernible loss in strength for the mixes that contained 50% fine aggregate in mixes CT4 and RT4 compared to Stage-1. This can be explained by the fact that, in Stage-2, the addition of water during mixing helped to fully integrate the mix, resulting in high cohesion during mixing without any voids. Unlike what happened in Stage-1, utilizing 50% fine aggregate in mixes CT4 and RT4 resulted in dry mixes that were challenging to blend properly. This led to the presence of voids, which resulted in a noticeable decrease in compressive strength.
In conclusion, the use of BW in geopolymer mortar improved its mechanical qualities and maximized the mortar’s overall performance. BW is a more sustainable option than conventional raw materials, since its use helps in minimizing the environmental damage brought on by the consumption of natural resources, like sand. High compressive strength was achieved by using GW, CTW, and RTW at a 25% replacement ratio, making CDW a practical and sustainable alternative to traditional building materials. This contributes to waste reduction and minimizes environmental impact. The compressive strength results obtained in this study confirm that geopolymer mortar using CDW is a sustainable alternative to traditional Portland cement, reducing carbon dioxide emissions associated with cement production and minimizing environmental harm.
3.3. Freezing and Thawing Effect
3.3.1. Compressive Strength
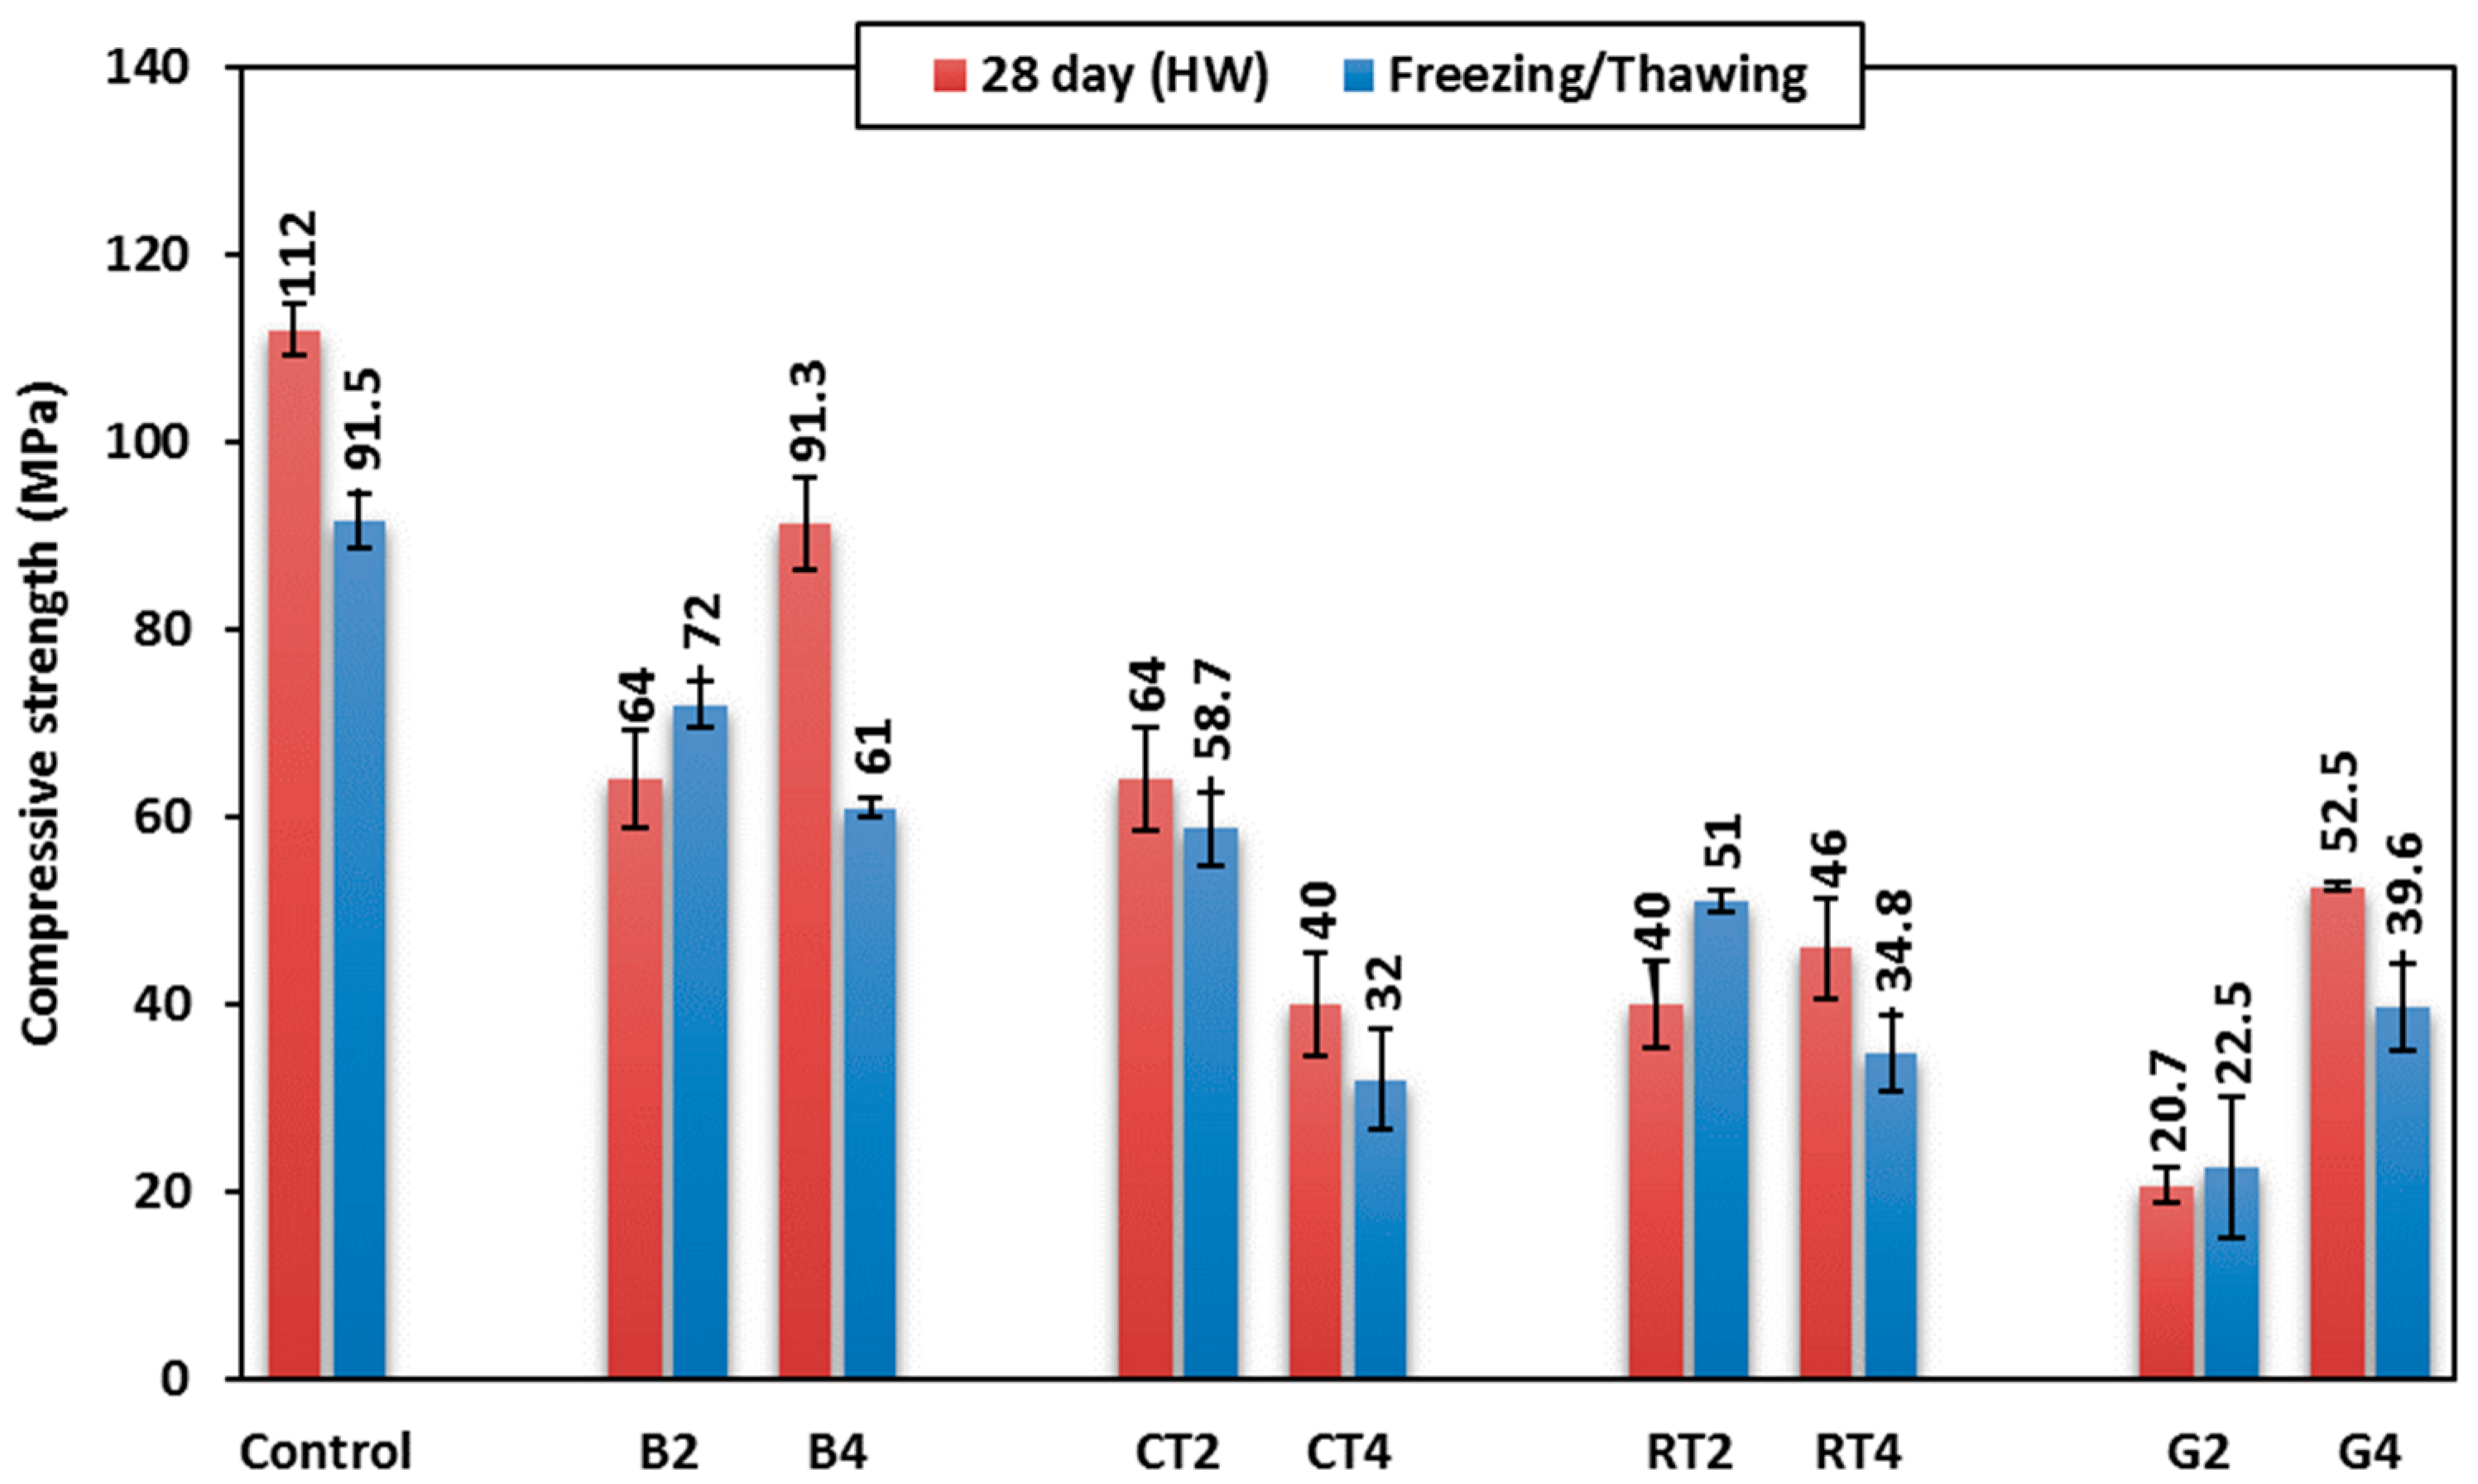
Selected mixes, including the control mix and CDW mixes of B2, B4, CT2, CT4, RT2, RT4, G2, and G4, were exposed to 100 cycles of freezing/thawing cycles using cube specimens of 50 mm size at 28 days mortar age. The effect of freezing/thawing cycles on the mortar’s compressive strength after 28 days is shown in
Figure 12. The control mix showed a compressive strength decrease of 18% after being subjected to the freezing/thawing cycles. This is attributed to the expansion and contraction occurred during the cycles, leading to the forming and developing of fine cracks, and hence, strength decreases. When using CDW as a binder in mixes B2, RT2, and G2, the compressive strength increased by 12.5%, 27.5%, and 8%, respectively. On the contrary, when 50% CDW was used as a fine aggregate, the compressive strength decreased in mixes B4, CT4, RT4, and G4 by 33%, 20%, 24%, and 24.6%, respectively. This can be explained by the high porosity of these materials, which enable them to absorb large volumes of water that freeze and thaw; this creates internal pressure, which weakens the structure of the geopolymer mortar and, hence, lowers its compressive strength.
The use of BW with a 50% replacement contributed to enhancing compressive strength after 100 freezing/thawing cycles, indicating improved resistance to strength degradation over the long term. This can be attributed to the reason in which the BW contains a high percentage of silica, which reacted with the alkaline solution in activating the geopolymer, leading to the cohesion and strength of the geopolymer mortar. The use of BW improved the internal structure, thereby reducing porosity and resulting in a structure that is less prone to cracking caused by freezing/thawing cycles. This, in turn, minimized the destructive effects of freezing/thawing cycles and enhanced the long-term durability of the mortar. This shows that BW is a sustainable material that increases the durability of geopolymer mortar.
3.3.2. Mass Loss
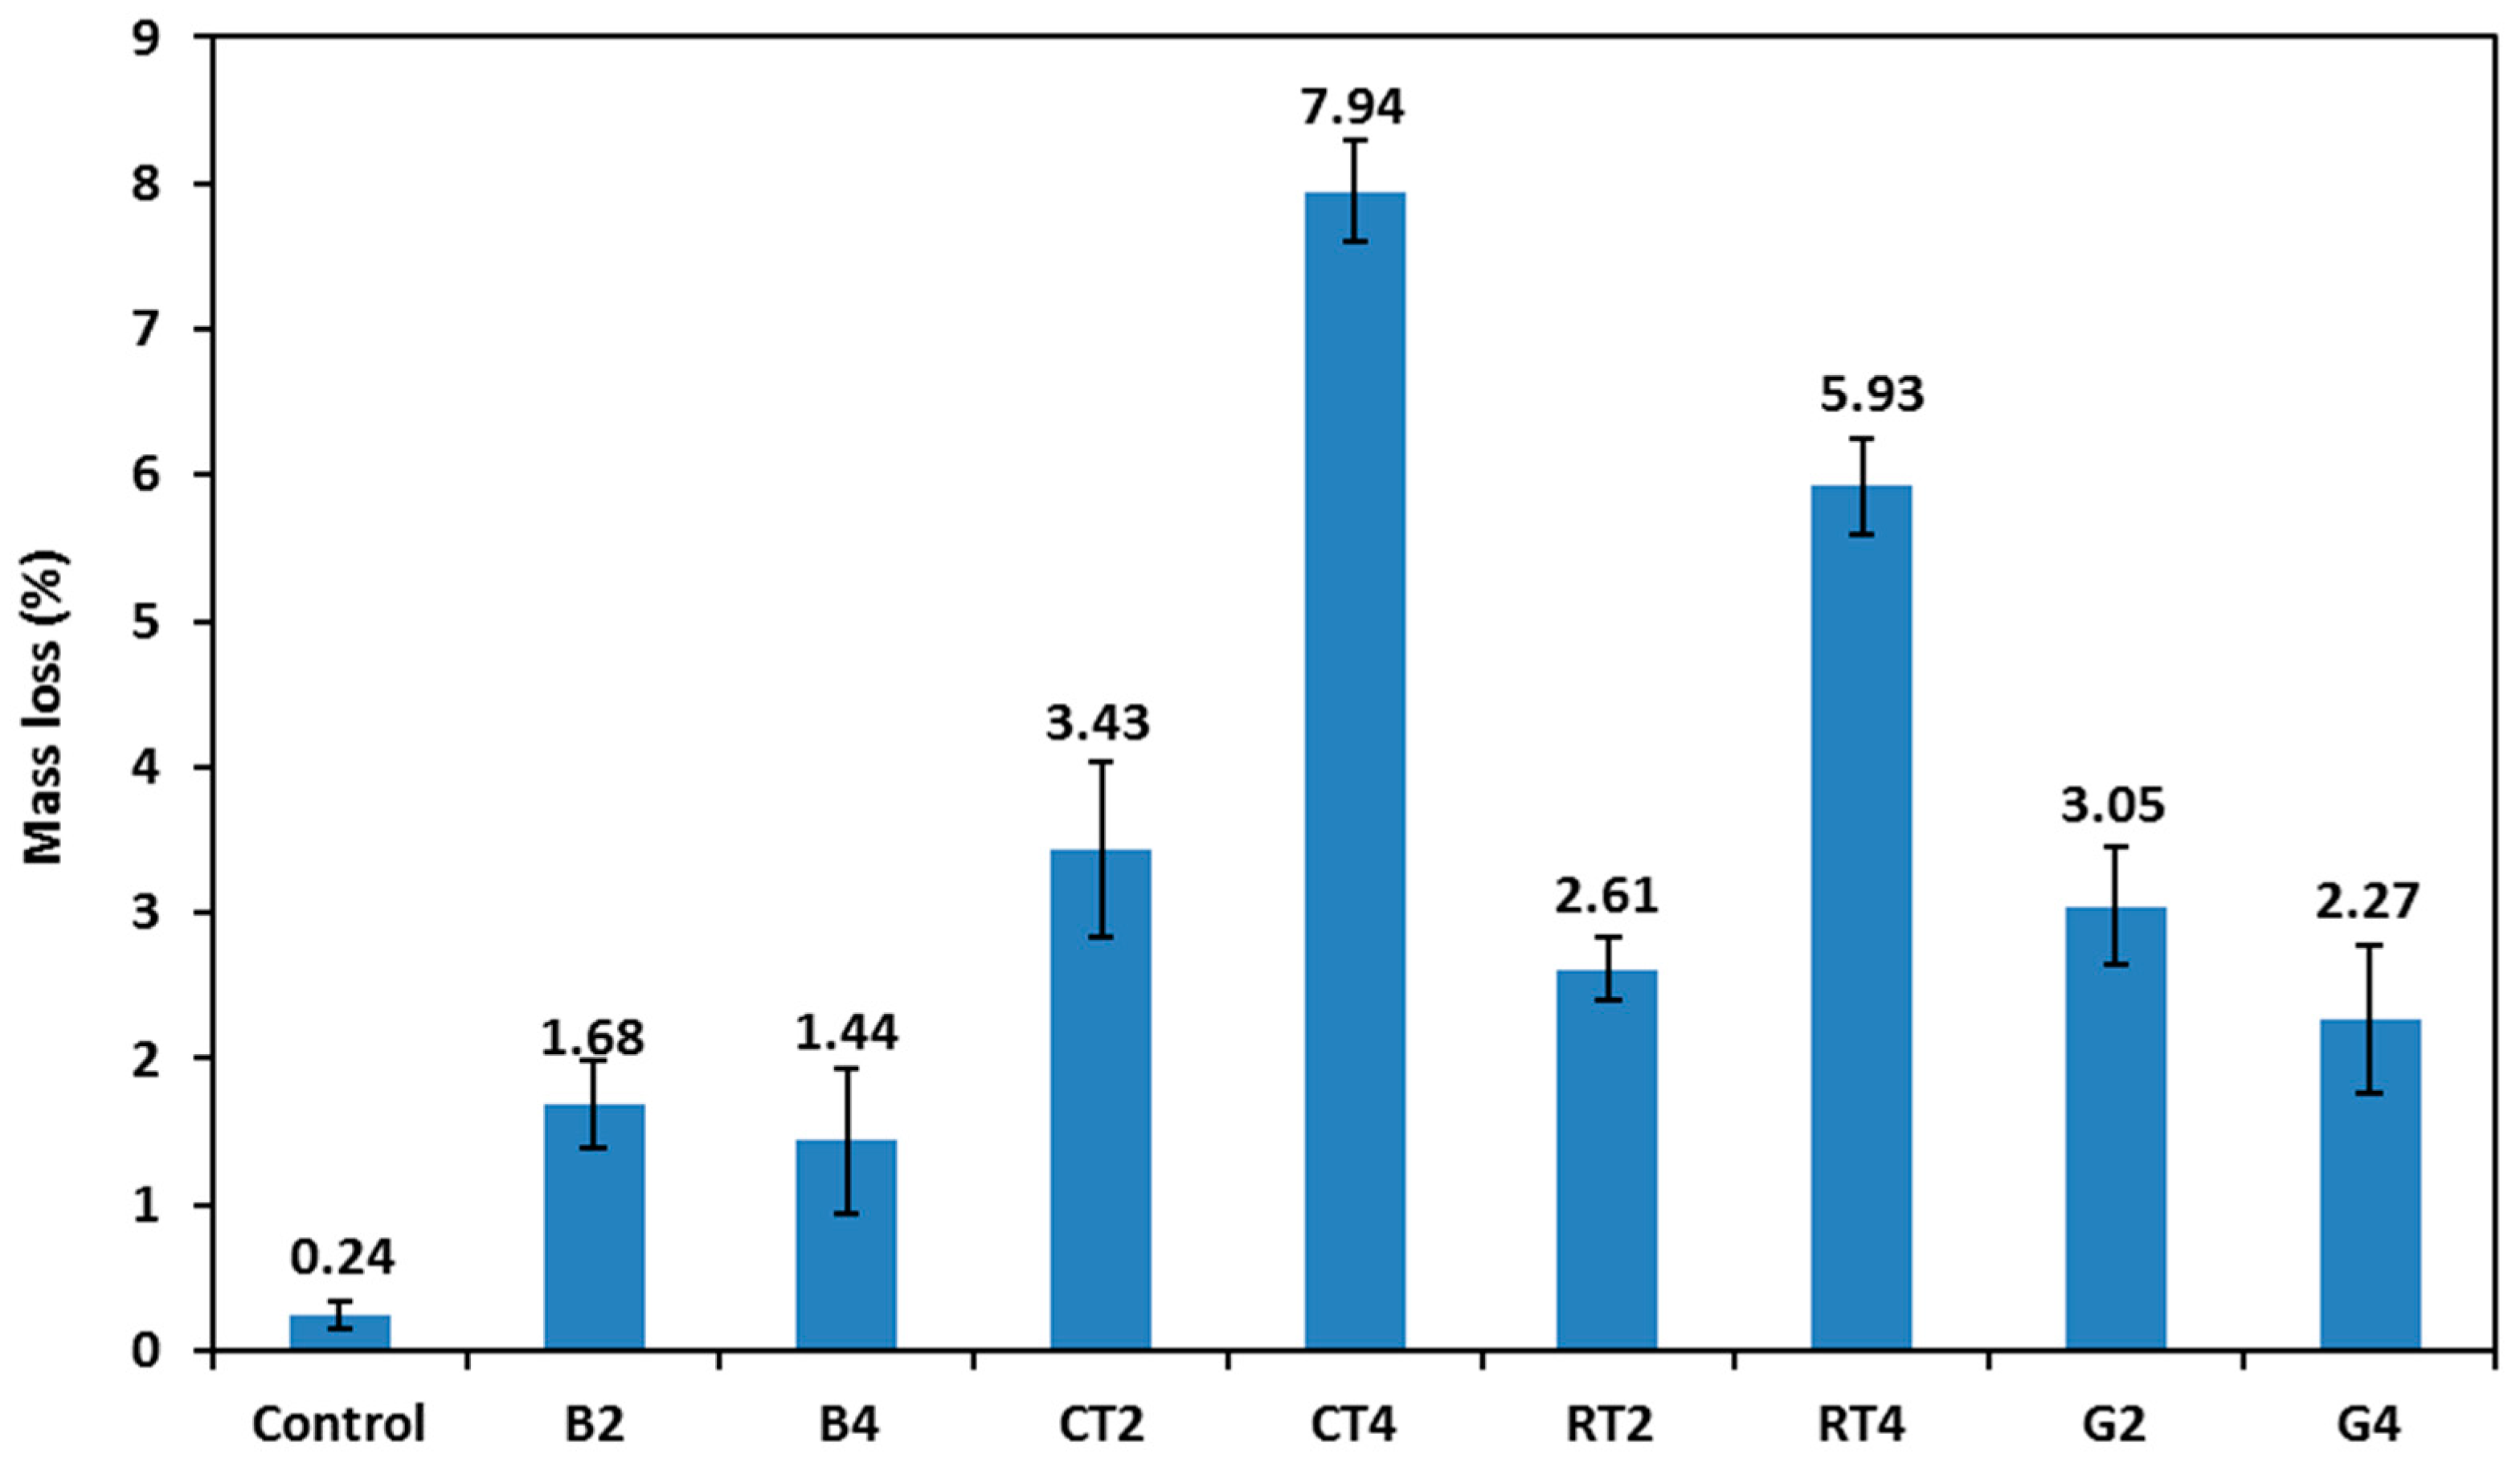
Figure 13 shows the mass loss results of the selected HSGMs after 100 cycles of freezing/thawing. The tested specimens showed no visible flaking or cracks on the surface of the specimens; only slight spalling was noted. When using CDW in mortar, the mass loss after freezing/thawing cycles significantly increased. The control mix showed a mass loss of 0.24%, while the mass loss for the rest of the mixes ranged from 1.44% to 7.94%. The CT4 mix (contained 50% CTWF) exhibited the highest mass loss and was followed by the RT4 mix (contained 50% RTWF). This is attributed to the materials’ increased vulnerability to mechanical degradation as a result of frequent expansion and contraction.
3.4. Sulfate Attack
3.4.1. Physical Appearance
In this investigation, HSGM specimens were subjected to continuous or cyclic MS attack with 5% concentration. All specimens showed salt deposits (white precipitates) on their surfaces, as shown in
Figure 14. This observation has also been reported by previous studies [
42,
43]. However, none of the HSGM specimens showed indications of cracking or expansion on their surfaces. This is attributed to the cross-linked alumino silicate gel and the low calcium content of the precursors that are able to provide stability to the geopolymer mortar when exposed to MS. Moreover, the lack of expansive gypsum or ettringite is thought to be caused by the predecessors’ low calcium levels [
44].
3.4.2. Compressive Strength
The compressive strength of HSGMs was measured after 3 and 6 months of continuous or cyclic MS attack, and the results are ploted in
Figure 15. BW and GW mixes exposed to MS showed a decrease in strength after 3 months of up to 38.8% and 36.8%, respectively, for the mix containing 25% BWB (B1) and the mix containing 50% GWF (G4), followed by an increase in strength after 6 months of up to 53% and 8.4%, respectively. This is attributed to the improving stability of magnesium cation transport and aluminosilicate polymer crosslinking by filling the pores with sulfate crystals, in addition to the diffusion of magnesium into the mortar matrix and the transfer of alkaline ions into the solution [
45]. This is consistent with previous studies that have shown that resistance increases with increasing immersion time in the magnesium solution [
42,
46]. Jiao et al. [
47] found that, as the soaking period increased, the compressive strength of alkali-active mortars initially declined and subsequently increased. Mixes containing CTW and RTW showed a decrease in compressive strength after 3 months of up to 26.8% and 10.7%, respectively, for mixes CT3 and RT4. This decrease persisted slightly at 6 months by up to 5.1% and 16.1%, respectively. This is attributed to the settling MgSO
4 crystals in the mortar structure’s voids. These crystals cause the alkaline ions to migrate from the mortar matrix into the solution, and therefore, the porosity increased, which resulted in a compressive strength decrease. At 6 months, the continuous expousure to MS attack showed an adverse effect on compressive strength compared to the cyclic expousure, where the compressive strength of the mixes containing BW, CTW, RTW, and GW decreased by up to 15.4%, 19.3%, 28.9%, and 18%, respectively.
The use of BW in geopolymer mortar is considered to be a sustainable alternative to traditional materials, as it promotes waste recycling and enhances mechanical performance under sulfate attack, such as increasing strength after 6 months. Enhanced sulfate resistance using GW increases the life spane of geopolymer mortar and improves material efficiency. Although mixes RTW and CTW showed relatively low sulfate resistance, their use helps in reducing waste from construction and demolition, which is a step in the right direction for material sustainability. Moreover, BW can be a great choice for sulfate resistance and attaining environmental sustainability. It is followed by GW, as both lessen their negative effects on the environment by consuming fewer natural resources and recycling waste.
3.4.3. Mass Change
Figure 16 shows the mass change results of HSGMs after exposure to 3 and 6 months of cyclic sulfate attack. After 3 months, the mass of the control mix increased by 6.1% compared to its original mass at 28 days. After 6 months, it remained almost constant, with a slight increase of 0.42% compared to 3 months. It is believed that the initial increase in mass is due to the absorption of the solution into the microstructure of the geopolymer mixes, leading to an increase in the specimen’s mass [
42]. In the mixes containing BW, it was found that it gained less weight compared to the control mix, indicating that less solution was absorbed due to the fine pore structure, especially in mixes containing 25% (B3) and 50% (B4) BWF, which gained 4.4% and 4.51%, respectively, in weight after 3 months compared to their original weight before immersion in the solution. After 6 months, the weight gain decreased by approximately 1.5% compared to 3 months. Mixes containing CTW showed different results in weight gain, but notably, the CT4 mix, which contained 50% CTWF, showed the highest weight gain after 3 months at 7.45%. After 6 months, the weight gain decreased by 6.46% compared to 3 months. The weight loss is attributed to the periodic change in the MS solution, which caused the leaching of alkalis from the specimens and could also be due to the dissolution and decomposition of some geopolymer reaction products. This is consistent with what was reported in previous studies [
43,
48]. RTW mixes showed the highest weight gain, especially in the RT4 mix, which contained 50% RTWF after 3 months at 8.41%. The weight gain continued to increase after 6 months, with a 1.9% increase compared to at 3 months. This indicates that the larger voids and pores of RTW allowed the solution to easily penetrate the geopolymer matrix and increase the weight. For both groups of mixes containing CTWF and RTWF, a common factor was observed between them. The CT4 and RT4 mixes showed the highest weight increase, as well as the lowest compressive strength against sulfate attack, as shown in
Figure 15. The CT3 and RT3 mixes recorded the lowest values in weight gain, which can be explained by the reduced porosity of the mixtures, leading to less solution absorption in the pore structure. This aligns with the compressive strength values against sulfate attack for these mixes (CT3 and RT3), which recorded the highest resistance among the CTW and RTW mixes, as shown in
Figure 15. The results for the mixes containing GW showed the lowest weight increase after 3 months, and the weight significantly decreased after 6 months. This suggests that the microstructure of the mixes containing GW, whether binder or fine aggregate, did not absorb the solution due to their lower porosity.
3.5. Water Absorption
The water absorption test was conducted on the mixes containing 50% of CDW after 28 days of HW curing, as shown in
Figure 17. As expected, the results showed that the highest water absorption percentage occurred when using CTW and RTW, especially when used as a fine aggregate. This is because of their very high porosity, leading to significant water absorption. Compared to the control mix, the water absorption of RT4 and CT4 mixes increased by 17.3% and 57.8%, respectively. This could be attributed to the CTW that is a mix of floor and wall tile wastes, which may not be homogeneous in particle distribution, resulting in poor adhesion and high voids, leading to higher water absorption. Also, it can be due to the possibility that a higher SH concentration would dissolve more alumino-silica, creating an excess of space that would ultimately create pores leading to an increase in the absorption rate [
49]. The absorption rate increased in mixes CT2 and RT2 by 3% and 5.8%, respectively, when utilizing CTW and RTW with 50% as a binder. This is due to the presence of fine capillary pores as the internal pores in the matrix have a significant impact on water absorption, which is consistent with what was reported by Cai et al. [
50]. The results also showed that the BW and GW mixes gave a lower water absorption percentage than the control mix, whether they were used as a binder or fine aggregate. This is due to the reduced porosity and, consequently, the lower water absorption, especially mixes G2 and G4, which gave the lowest percentages of 21.5% and 26.5%, respectively. This could be due to the lower porosity of glass than slag/fly ash and quartz sand and the smooth surface of the particles.
From the above results, it can be concluded that the most environmentally friendly CDWs are BW and GW because of their low water absorption, which increases the geopolymer mortar’s durability and life cycle, while limiting its negative effects on the environment. On the other hand, recycling RTW and CTW enhances sustainability; yet, their high absorption rates need future improvements to lessen their negative impacts.
3.6. Water Sorptivity
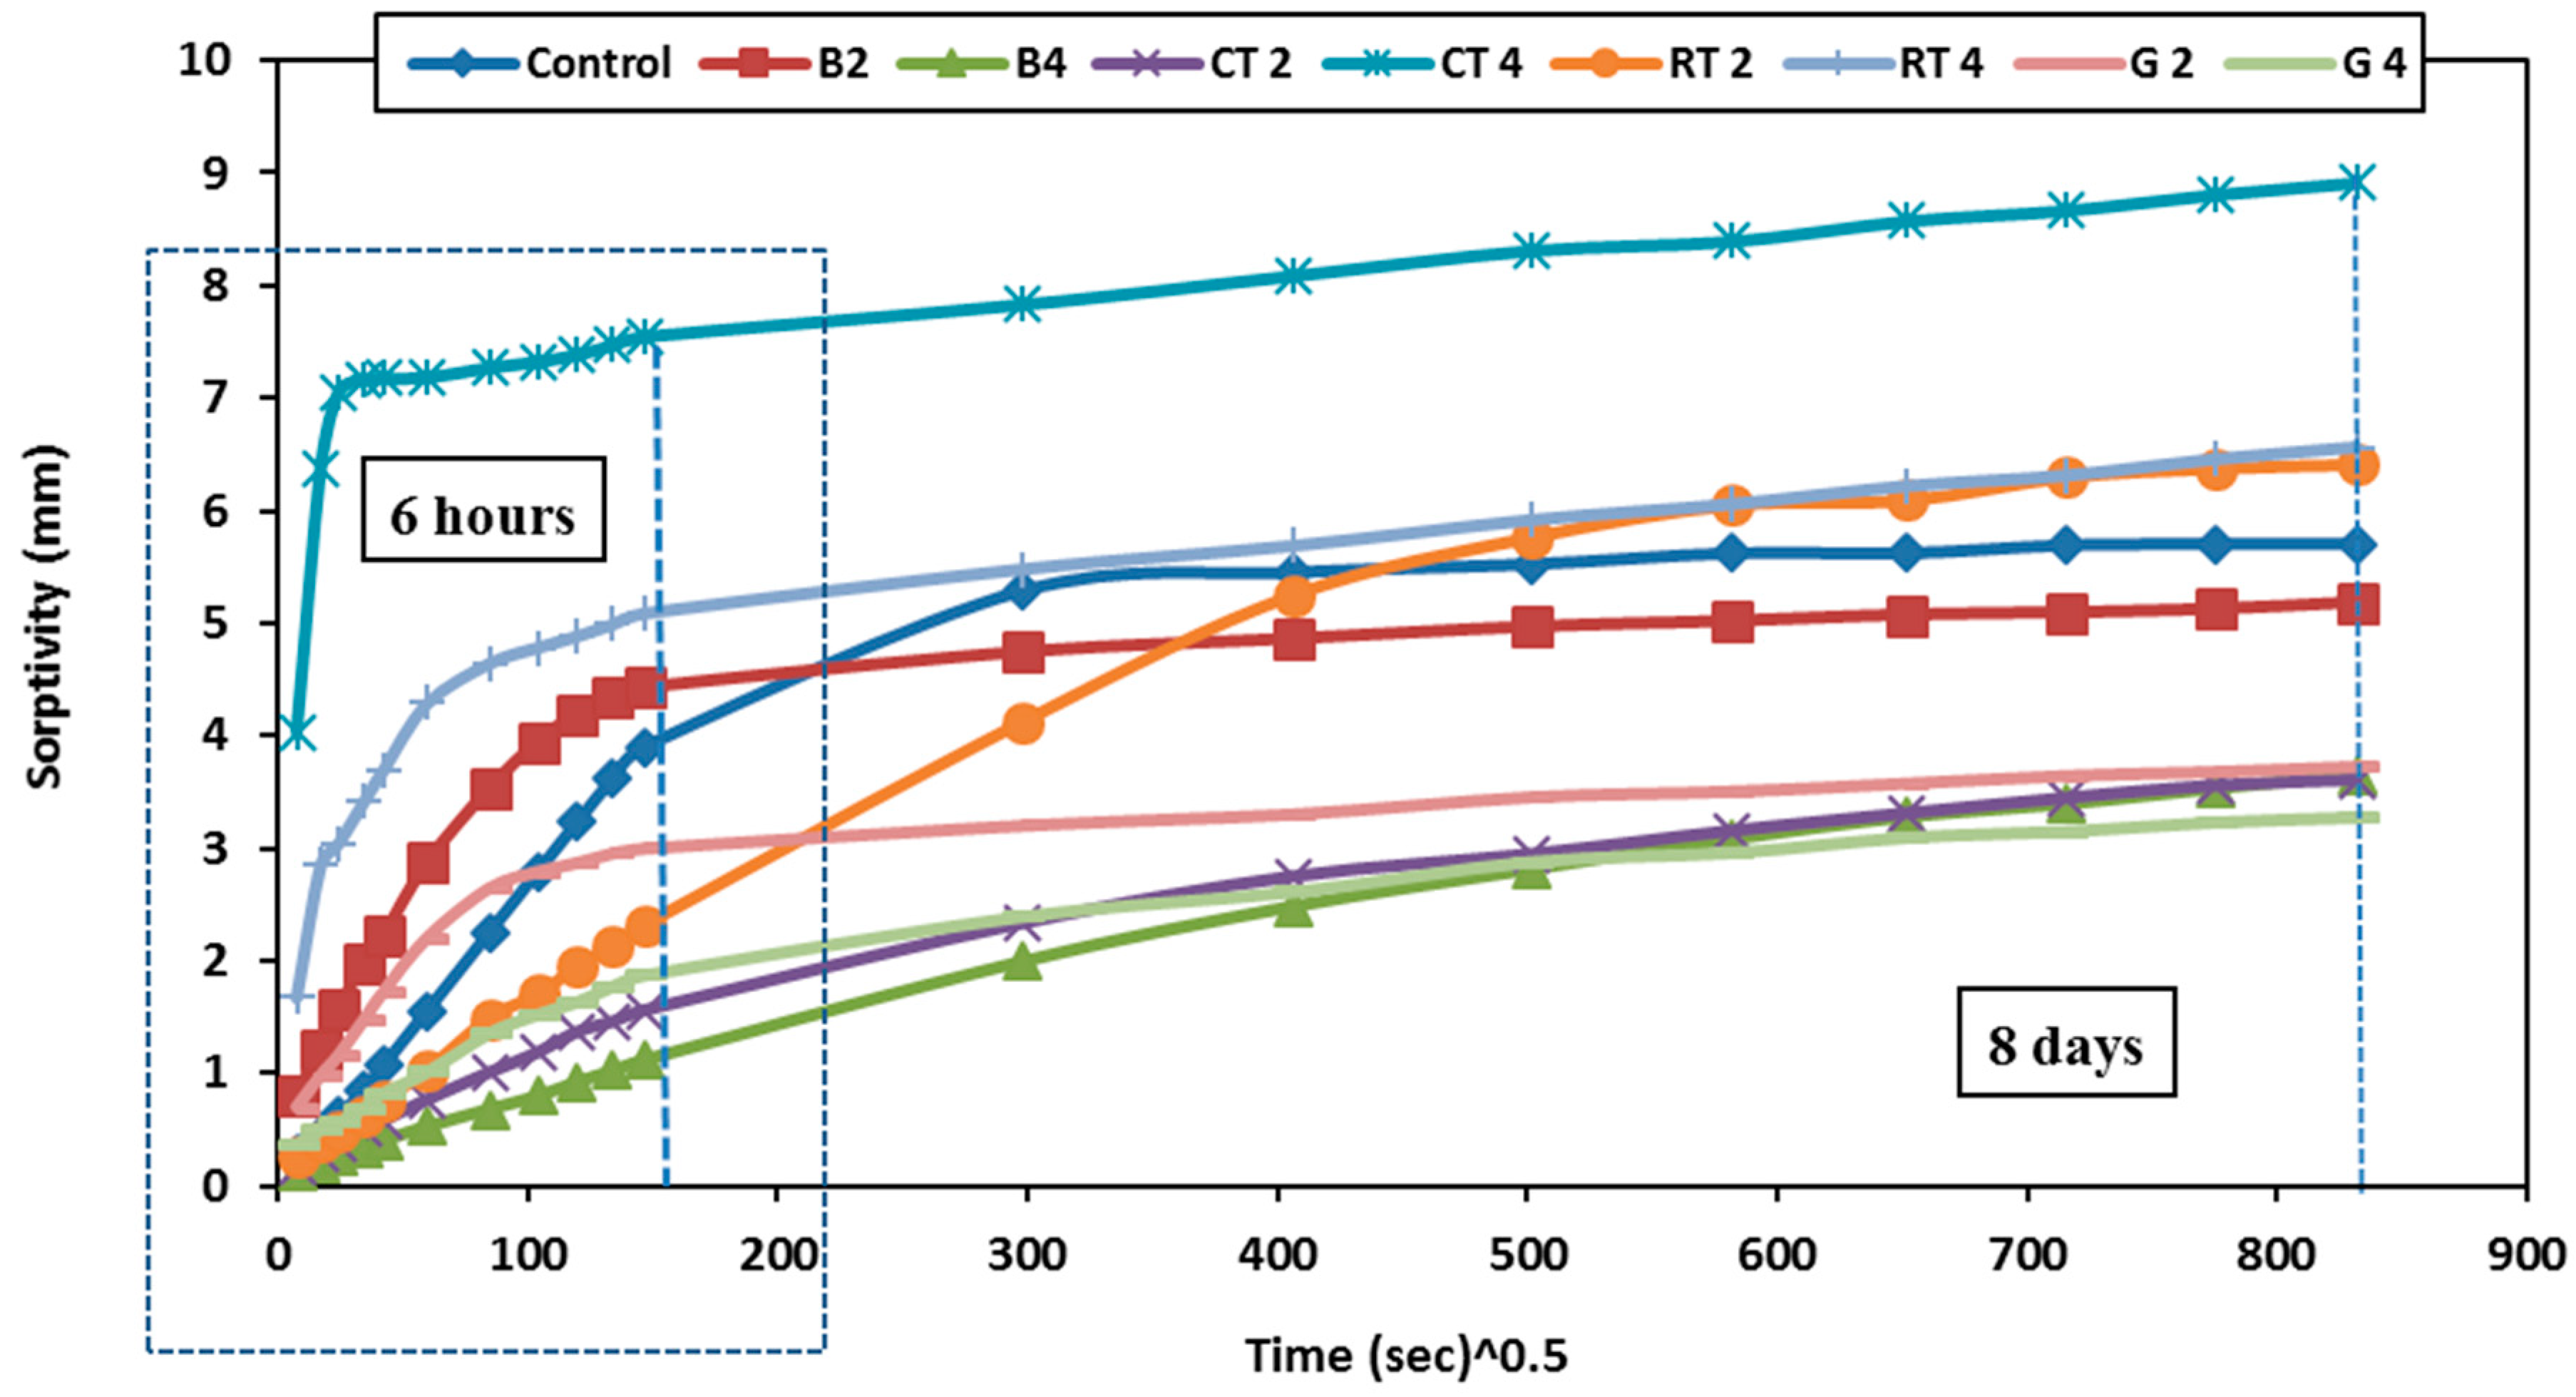
Figure 18 shows the water sorptivity index values for all HSGM mixes in this study throughout 8 days.
Figure 19 examines the initial sorptivity from 1 min to 6 h to assess the rise in the sorptivity coefficient during both early and late phases. The intial sorptivity rates are high but eventually decline, as seen in
Figure 18. Numerous capillary pores close to the submerged sample’s surface quickly become saturated, which is followed by the filling of finer pores further away from the surface. According to the results, the CT4 and RT4 mixes showed the highest sorptivity rates over the first six hours compared to the control mix (sorptivity increased by 92% and 30%, respectively). This resulted from the increased porosity and lower density of these mixes, which was consistent with a prior study [
51], which found that the main factors influencing concrete’s sorptivity are its density and microstructure. As density decreases, sorptivity rises due to an increase in pore volume. Furthermore, RTW and CTW particles’ porous surfaces help to create sizable air holes at their interfaces, which increases their capacity to absorb water.
At longer times (after 8 days), the sorptivity rate in CT4 and RT4 mixes increased by only 56% and 16%, respectively, compared to the control mix. This aligns with previous research [
52]. In CT2 and RT2 mixes containing 50% CTWB and RTWB, respectively, the water sorptivity rate decreased, which is attributed to the ability of CTW and RTW to fill the fine pores in the mortar matrix, reducing overall porosity and increasing the density of the mortar. Additionally, using CTW and RTW as a binder may enhance pozzolanic reactions, producing compounds such as C-S-H in geopolymer mortar, which seal the pores and improve the mortar’s cohesion. This reduces the permeability of the mortar, consequently lowering the water absorption rate. In contrast, when CTW and RTW were used as fine aggregate, the interstitial voids between the aggregate particles increased the mortar’s porosity, thereby enhancing its water absorption capacity. When 50% of BWB (mix B2) was used, the sorptivity increased by 12.8%, making it marginally greater than the control mix in the early stages. The sorptivity was not higher than that of the control mix in the subsequent phases, though sorptivity rate decreased by 8.8% in the later stages, and when 50% of the fine aggregate was replaced by BWF (mix B4), the absorption rate decreased by 71.8% and 36.8% in the early and later stages, respectively. This is attributed to the reduced porosity of the brick and its increased density, leading to a lower water sorptivity rate.
In both the early and late stages, the GW that was utilised as a binder (mix G2) or fine aggregate (mix G4) exhibited lower sorptivity rates than the control mix. The sorptivity decreased by 23% and 35.1%, respectively, in the early and late stages for mix G2, and similarly, in mix G4, the sorptivity decreased by 51.3% and 42.1%, respectively. This is because GW particles are smooth, which promotes secondary hydration reactions and creates C-S-H gel, which densifies the microstructure and prevents capillary pores from forming. This is explained by the fact that silica also produced C-A-S-H gels, which are denser and more capable of filling pores than other geopolymer gels [
53].
4. Conclusions
In this study, four different types of CDW (BW, CTW, RTW, and GW) were used both as fine aggregates or binders, to partially replace FA/slag and sand at 25% and 50% (volume %) in the production of eco-friendly HSGM. A variety of mechanical and durability properties were measured for the proposed eco-friendly HSGM. The following three curing conditions were applied in this study: W, HW, and HA. The key conclusions of this study are as follows:
The workability of the HSGM was negatively affected by using CDW, especially at a ratio of 50% as a binder or fine aggregate, and it decreased by up to 98.9%. To maintain workability, water was added based on the absorption rates of each waste material.
The compressive strength of all HSGM mixes containing CDW ranged from 24 to 104 MPa, indicating a significant impact of the characteristics of CDW on the mechanical performance of HSGM. However, when using 25% of each material as a substitute for the binder or fine aggregate, high strength was achieved at 28 days.
When comparing different curing conditions, the HW curing method showed an increase in compressive strength in all mixes that reached to 103 MPa, except for the GW mixes where HA curing showed a higher compressive strength of up to 74 MPa. However, water curing resulted in the lowest compressive strength.
When applying 100 freezing/thawing cycles to the HSGMs, different effects on compressive strength were observed, with compressive strength increasing by up to 12.5% when using CDW as a substitute for the binder, while it decreased by up to 33% when used as a substitute for fine aggregate.
The geopolymer mortar mixes demonstrated resistance to MS attack in terms of compressive strength up to 180 days, with no noticeable deterioration or significant weight loss observed. When using BW and GW as substitutes for the binder and fine aggregate, the mixes showed lower water absorption and sorptivity compared to the control mix. However, using 50% CTW and RTW as the fine aggregate resulted in the highest water absorption and sorptivity.
Overall, the HSGMs made of CDW yielded satisfactory and commendable results, since it is environmentally friendly and cost-effective in terms of recycling waste. It also achieves lower waste disposal costs and landfill fees, enhancing the financial sustainability of projects. Additionally, geopolymer mortar production consumes less energy compared to traditional cement manufacturing, reducing long-term production costs and making this approach more economically attractive for the construction industry. Moreover, since CDW can be sourced locally, transportation costs are lower than those of importing conventional raw materials, making it a more economical choice.
The use of BW was impressive, as it demonstrated high performance in terms of workability, compressive strength, sulfate resistance, and water absorption. The partial replacement of raw materials with CDW in HSGM enhances sustainability by reducing natural resource consumption and landfill waste. BW and GW performed effectively in increasing durability and reduced water absorption. Recycling CDW lowers emissions, promotes resource efficiency, and supports a circular economy in construction. The results of this study will help in reducing the challenges of producing sustainable HSGM, making it suitable for a wide range of applications.
Future research should consider carrying out life cycle evaluations and life cycle cost analyses, as well as prolonging test durations to examine durability and mechanical effects over an extended period of time in order to maximize advantages. A future extension of this research can also be carried out by comparing the finding of the current study with the results of the equivalent cement-based mortar to measure and assess the extent of variability and gains. In addition, the statistical significance of the results can also be considered for more evaluation of the research hypothesis.


