Article

Dynamic Behaviour and Seismic Response of Scoured Bridge Piers

1
Department of Civil and Environmental Engineering, University of Strathclyde, Glasgow G1 1XJ, UK
2
Department of Construction, Civil Engineering and Architecture (DICEA), Università Politecnica delle Marche, 60131 Ancona, Italy
3
School of Science and Technology—Geology Section, University of Camerino, 62032 Camerino, Italy
*
Author to whom correspondence should be addressed.
Infrastructures 2025, 10(4), 75; https://doi.org/10.3390/infrastructures10040075
Submission received: 7 February 2025 / Revised: 10 March 2025 / Accepted: 21 March 2025 / Published: 25 March 2025
(This article belongs to the Special Issue Bridge Modeling, Monitoring, Management and Beyond)

Abstract

This study explores the transverse response of bridge piers in riverbeds under a multi-hazard scenario, involving seismic actions and scoured foundations. The combined impact of scour on foundations’ stability and on the dynamic stiffness of soil–foundation systems makes bridges more susceptible to earthquake damage. While previous research has extensively investigated this issue for bridges founded on piles, this work addresses the less explored but critical scenario of bridges on shallow foundations, typical of existing bridges. A comprehensive soil–foundation structure model is developed to be representative of the transverse response of multi-span and continuous girder bridges, and the effects of different scour scenarios and foundation embedment on the dynamic stiffness of the soil–foundation sub-systems are investigated through refined finite element models. Then, a parametric investigation is conducted to assess the effects of scour on the dynamic properties of the systems and, for some representative bridge prototypes, the seismic response at scoured and non-scoured conditions are compared considering real earthquakes. The research results demonstrate the significance of scour effects on the dynamic properties of the soil–foundation structure system and on the displacement demand of the bridge decks.

1. Introduction

Bridges are critical transport infrastructure assets whose failure has severe consequences in terms of losses and casualties. Scour and earthquakes pose significant threats to bridge safety [1,2,3,4]. Many bridges with underwater foundations are located in earthquake-prone countries, and scour not only directly affects the stability of these bridges but also makes them more susceptible to damage from earthquakes [5,6,7]. Bridge scour refers to the erosion of soil surrounding the supports of a bridge, such as its abutments and piers, caused by the movement of water [8,9]. This phenomenon has a detrimental impact on the bridge’s structural integrity by diminishing its foundation bearing capacity and by decreasing the overall stiffness of the soil–foundation–structure (SFS) system. The stiffness reduction results in a different response of the structure to other dynamic loads, such as earthquakes. Current codes lack comprehensive guidance for assessing and designing bridges to withstand the combined effects of earthquake and scour hazards. However, many researchers have investigated the issue. For example, Wang et al. [10] investigated the dynamic behaviour and seismic performance of different types of reinforced concrete girder bridges, such as multi-span, simply supported, multi-span continuous, and single-frame bridges, under various scour conditions. They observed that scour can have a significantly different impact on the period elongation, and on the seismic response for different types of bridges, while enlarged shaft foundations can be effective in protecting bridges in earthquake and flood-prone areas. Prasad and Banerjee [11] evaluated the seismic performance of reinforced concrete bridges pre-exposed to various flood intensities and scour scenarios by means of nonlinear time history analyses. They concluded that the damageability of the bridge piers increases nonlinearly for increasing scour depth, and that even a low-intensity flood causes a significant degradation of the seismic performance. Yilmaz et al. [12] numerically assessed the performance of two real California bridges under the multi-hazard condition of flood-induced scour and earthquake by means of fragility analysis. The results showed that flood events can increase the seismic vulnerability and risk of bridges, yet larger-diameter foundations tend to reduce the impact of scour hazard on bridge seismic performance. Guo et al. [13] performed time-dependent fragility analyses to box girder concrete bridge systems to investigate their seismic performance under combined seismic and scour hazards over their whole service life. Song et al. [14] developed an analytical approach to assess the potential of earthquake damage for bridges with scoured foundations, showing that relatively low scour depths may cause foundation damage during an earthquake, even for bridges designed to provide satisfactory seismic performance. Fialko and Alipour [15] investigated the significance of non-uniform scour on the seismic performance of bridges. They concluded that for increasing scour depth scenarios, the amount of seismic energy experienced by the structure decreases, while the increasing flexibility of the foundation support results in an increasing displacement demand to other components of the structure. Han et al. [16] investigated the seismic response of a single-pylon cable-stayed bridge founded on a pile group under various scour scenarios, and they concluded that for increasing scour depths, the bending moment on the piles increases, whereas the bending moment demand on the pier decreases, and that the failure mode of the bridge moves from the pier to the piles and the abutments. Zaky et al. [17] assessed the influence of scour on the seismic performance of the piled-foundation Boğaçay Bridge in Turkey. They concluded that increasing scour width leads to a significant increase in pier displacement demands, especially in the transverse direction of the bridge. Moreover, they observed that the internal forces of the pier decrease significantly because of the migration and spreading of plastic hinging from piers to piles due to scouring. Foti et al. [18] provided an overview of conventional approaches to assess the performance of scoured bridges against seismic actions, including an application to an SFS system with caisson foundations. They concluded that advanced modelling of the impact of scour is essential, because of the drawback of the simplified conventional approaches’ applicability to capture the decreasing foundation capacity for increasing scour geometries. A significant number of experimental studies have also investigated the problem by performing tests on real systems or scaled models (see, e.g., [19,20,21]).
Most of the aforementioned numerical and experimental studies focused on the case of bridges with pile or caisson foundations. However, many existing bridges are characterised by piers on a shallow foundation, which has received less research attention, despite these bridges’ higher vulnerability to flood-induced scour. Guo [22] investigated the seismic performance of bridges with scoured shallow foundations by evaluating the changes in the impedance functions and used these in the seismic analysis of a simplified SFS system.
Other studies considering shallow foundations have only investigated the dynamic behaviour of bridges affected by scour and not the seismic response. Malekjafarian et al. [23] provided an experimental demonstration of a mode-shape-based scour-monitoring method by analysing the scaled model of a multi-span bridge prototype with shallow foundations. Antonopoulos et al. [
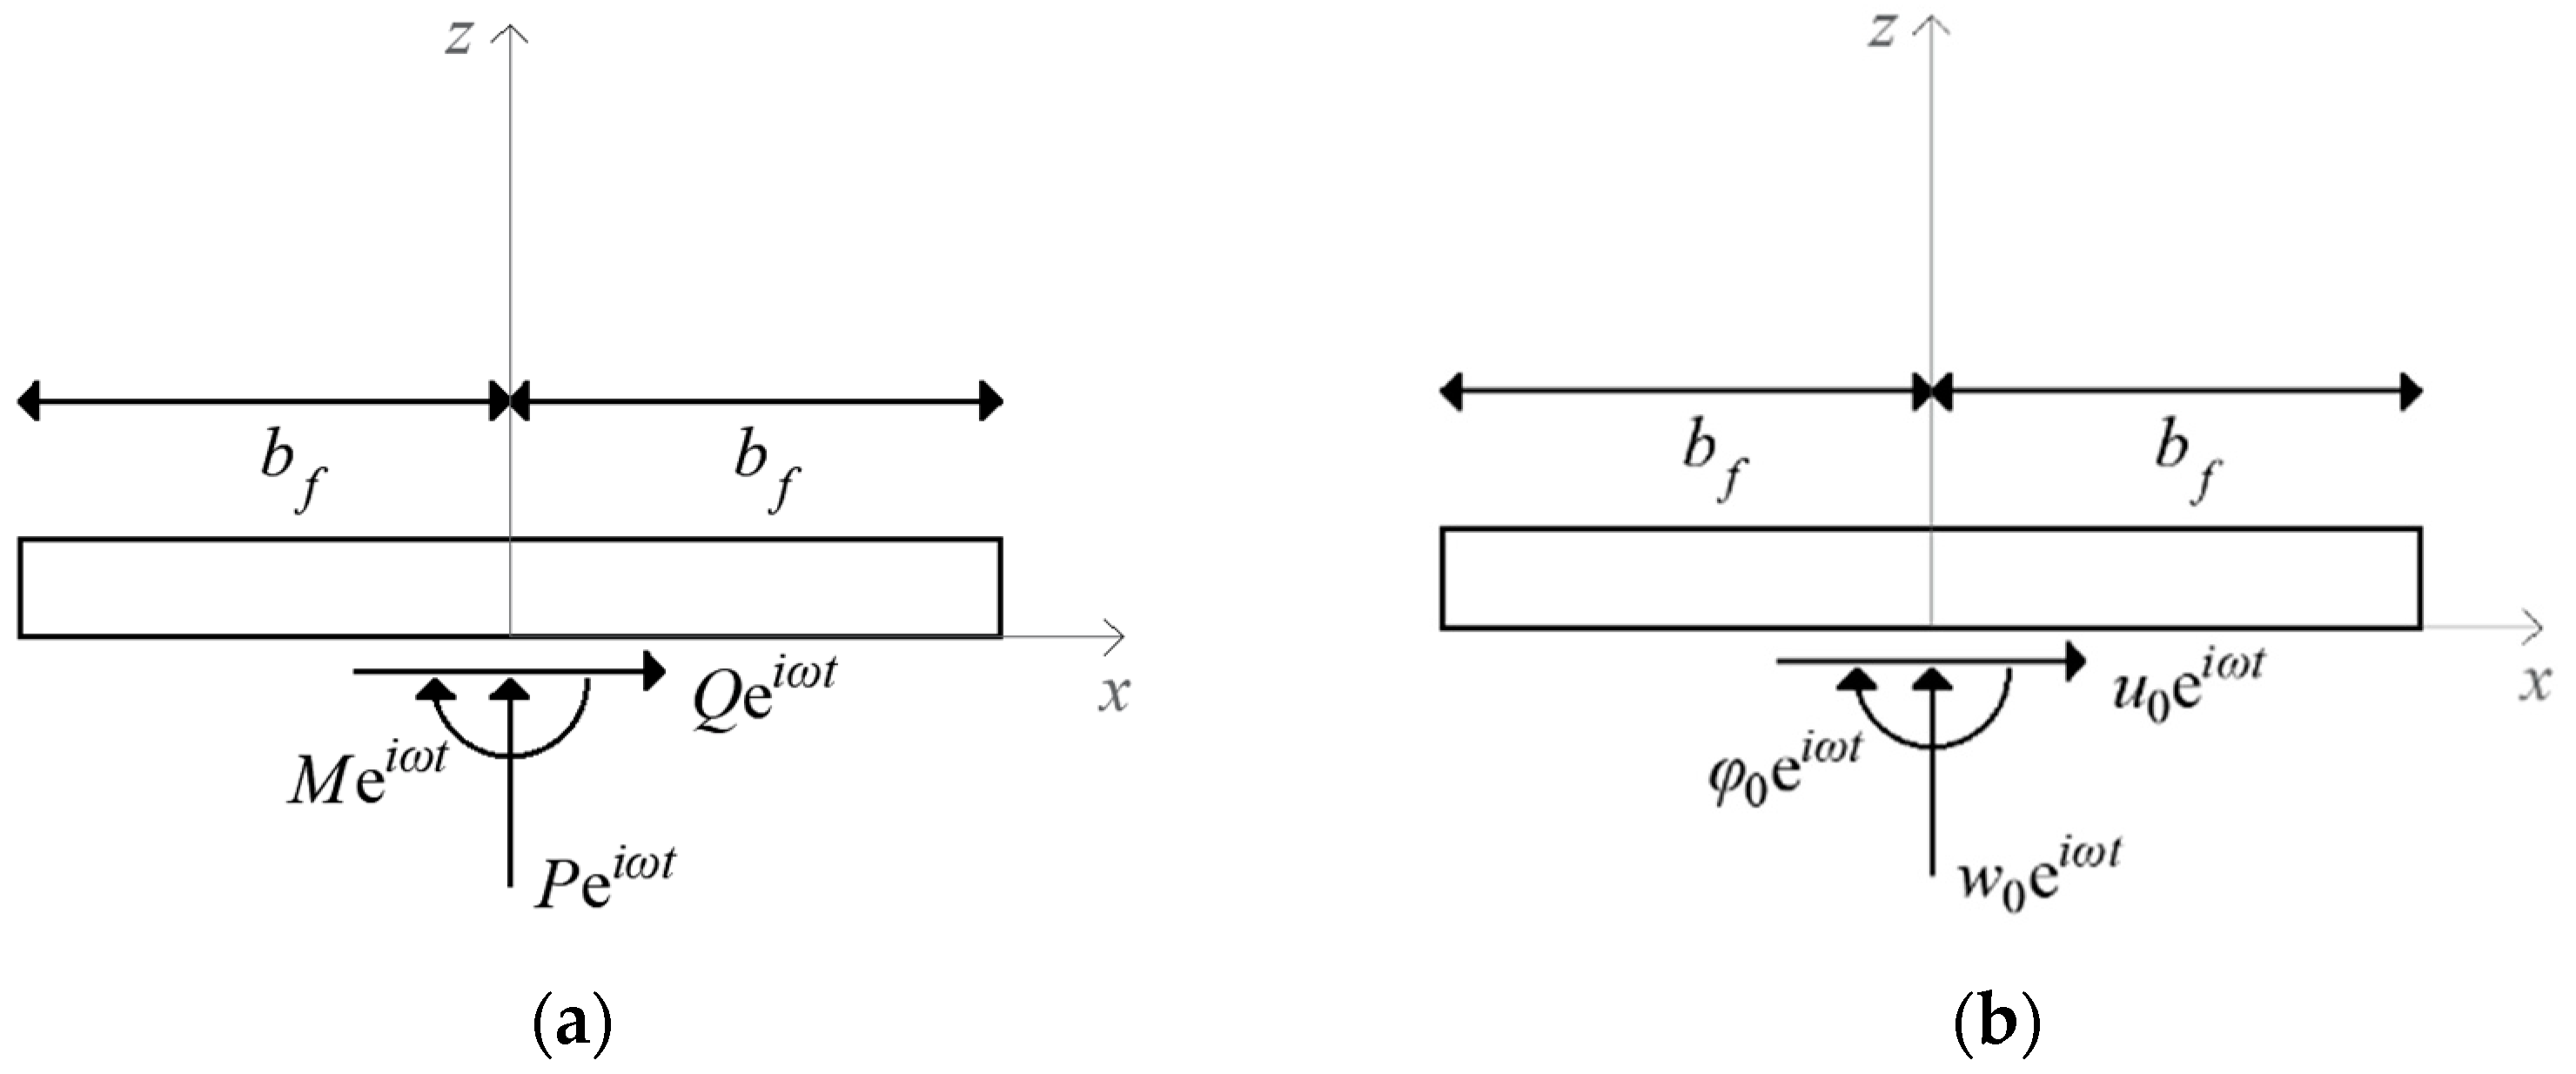
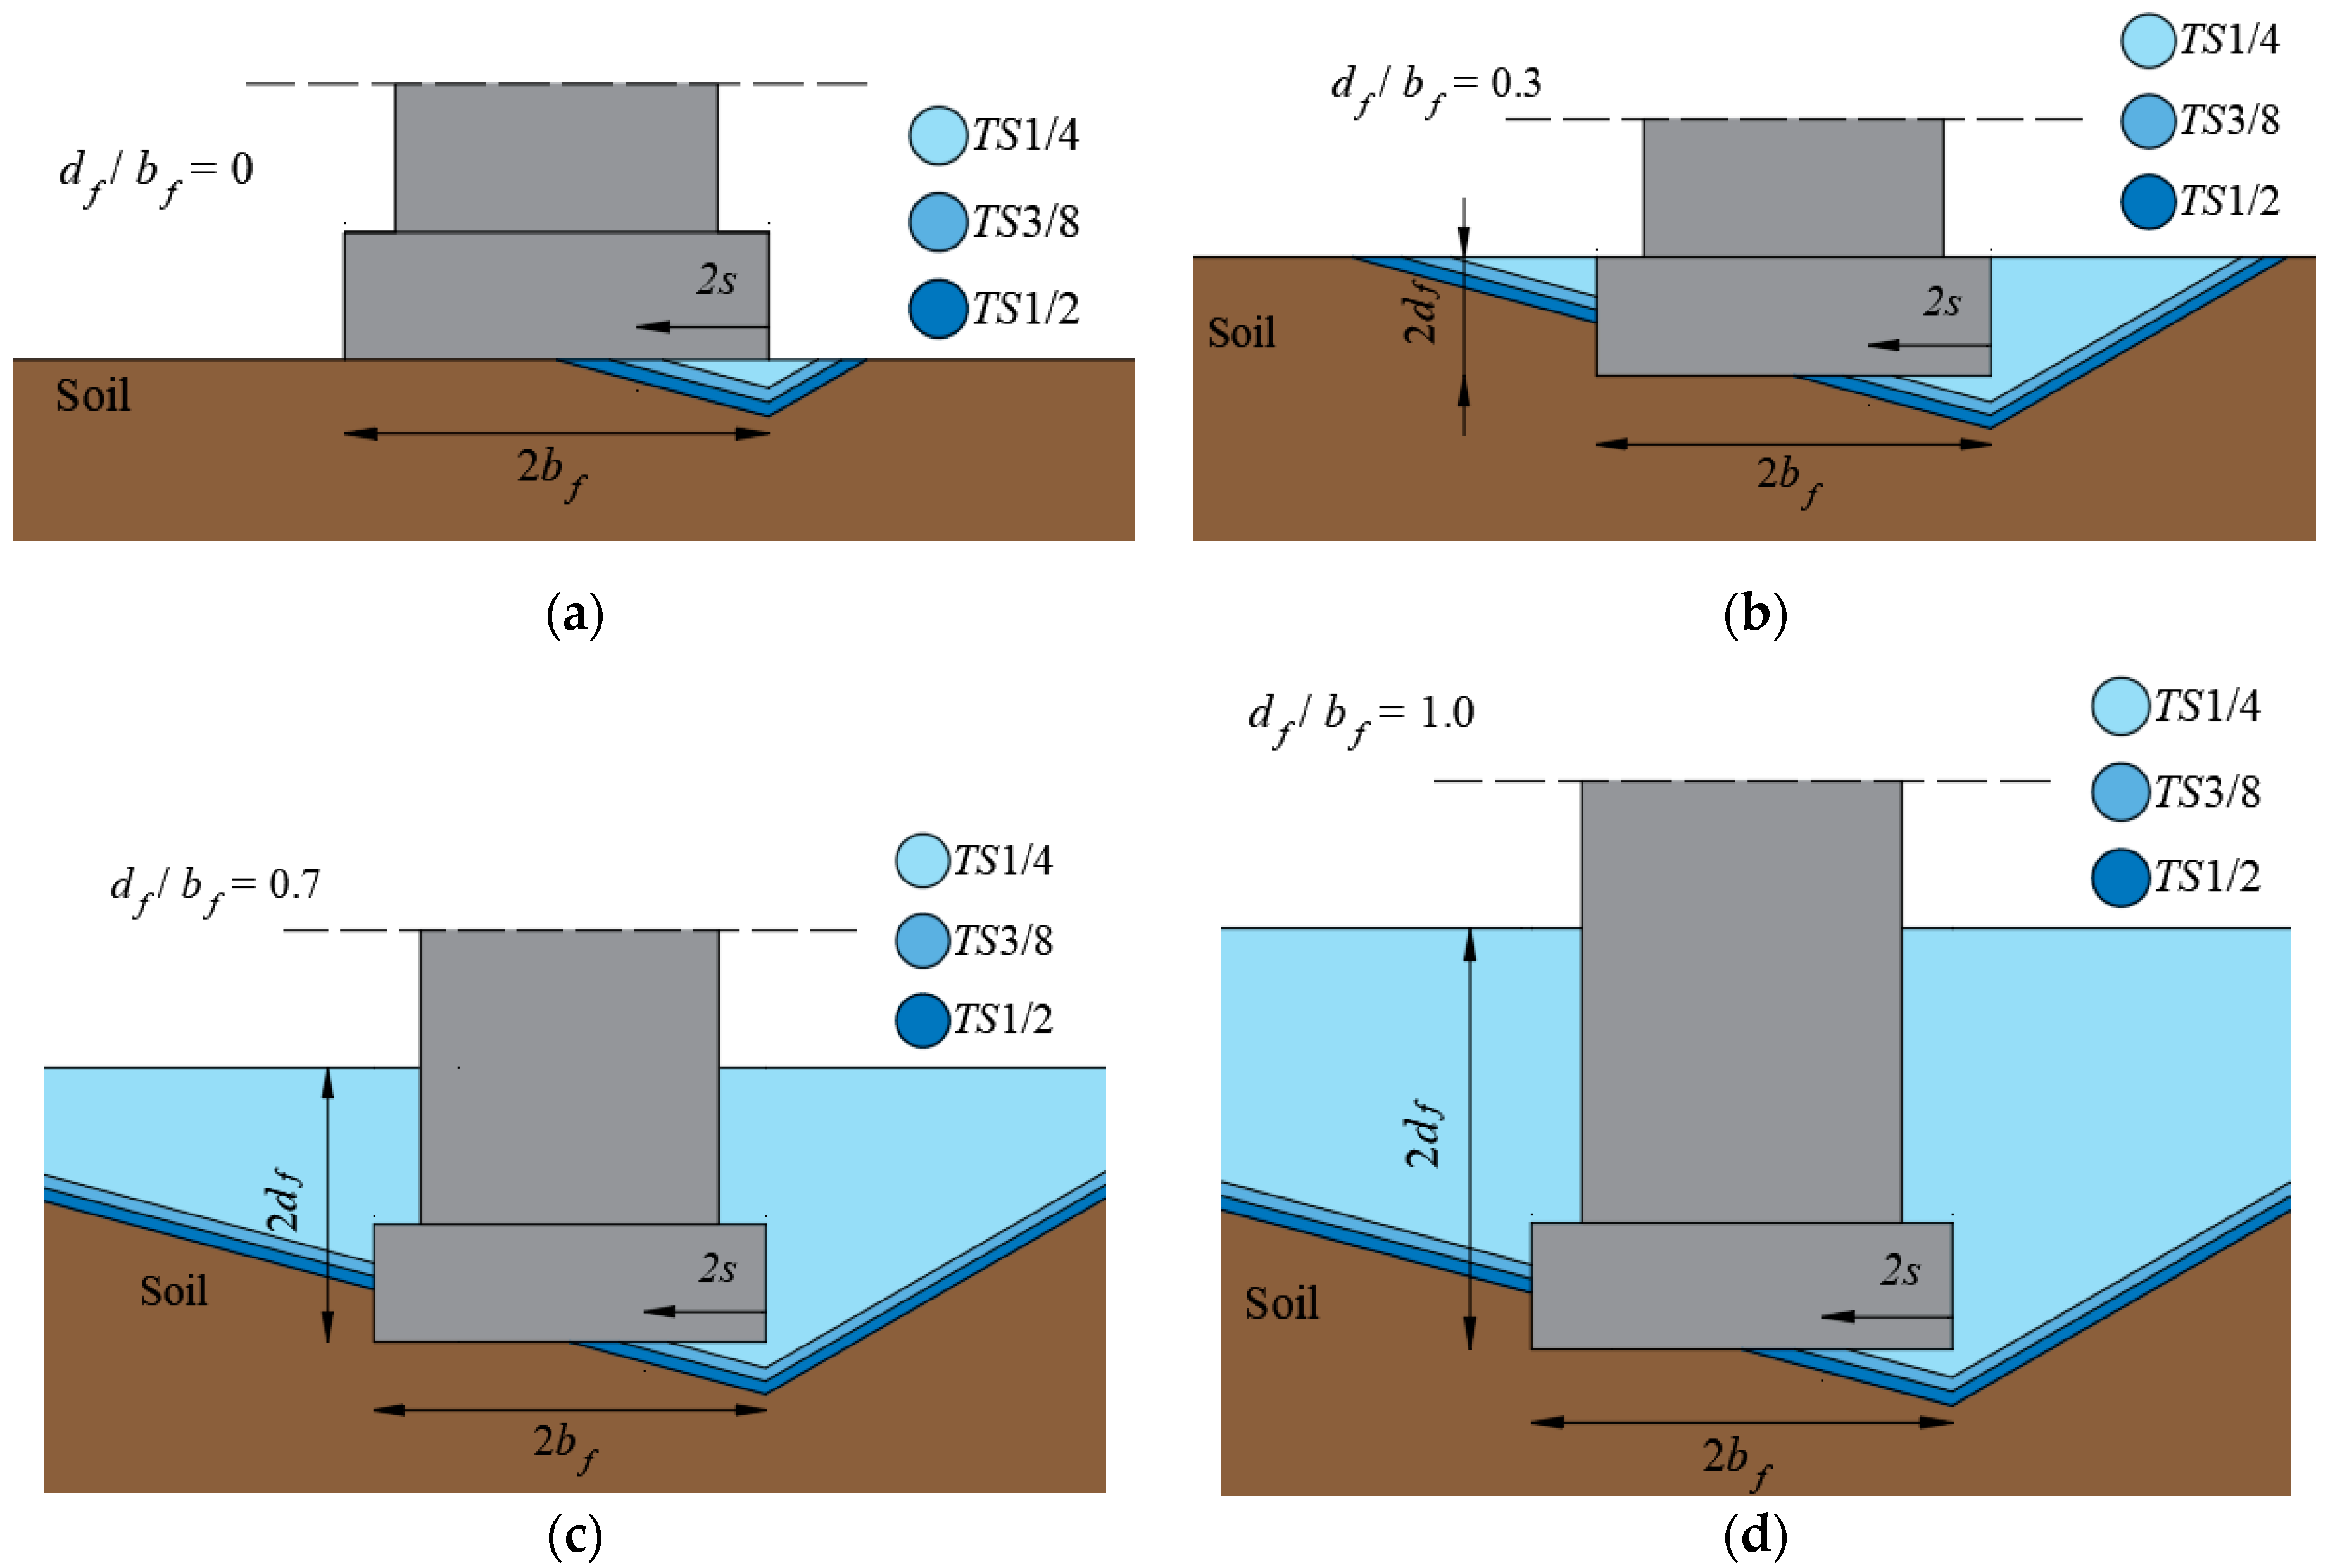
24] proposed a numerical strategy for evaluating the non-dimensional impedance functions for shallow foundations simply resting on the ground surface under various levels of local scour. These impedance functions were employed in an extensive parametric study to evaluate the impact of scour on the fundamental vibration frequency of SFS systems. Tubaldi et al. [25] illustrated the outcomes of a free-field full-scale experimental campaign, where operational modal analysis was performed to evaluate the effects of scour in terms of changes in the dynamic properties of EuroProteas, a prototype structure with a shallow foundation simply resting on the ground surface. Various modelling approaches were also presented to estimate the effect of scour on the dynamic behaviour of EuroProteas, by also considering the influence of the embedded depth of the foundation.
From the analysis of the literature, it is evident that further research is needed to investigate the influence of scour on the dynamic behaviour and seismic response of bridges with shallow foundations. Building on the previous work carried out by the same authors of this study [
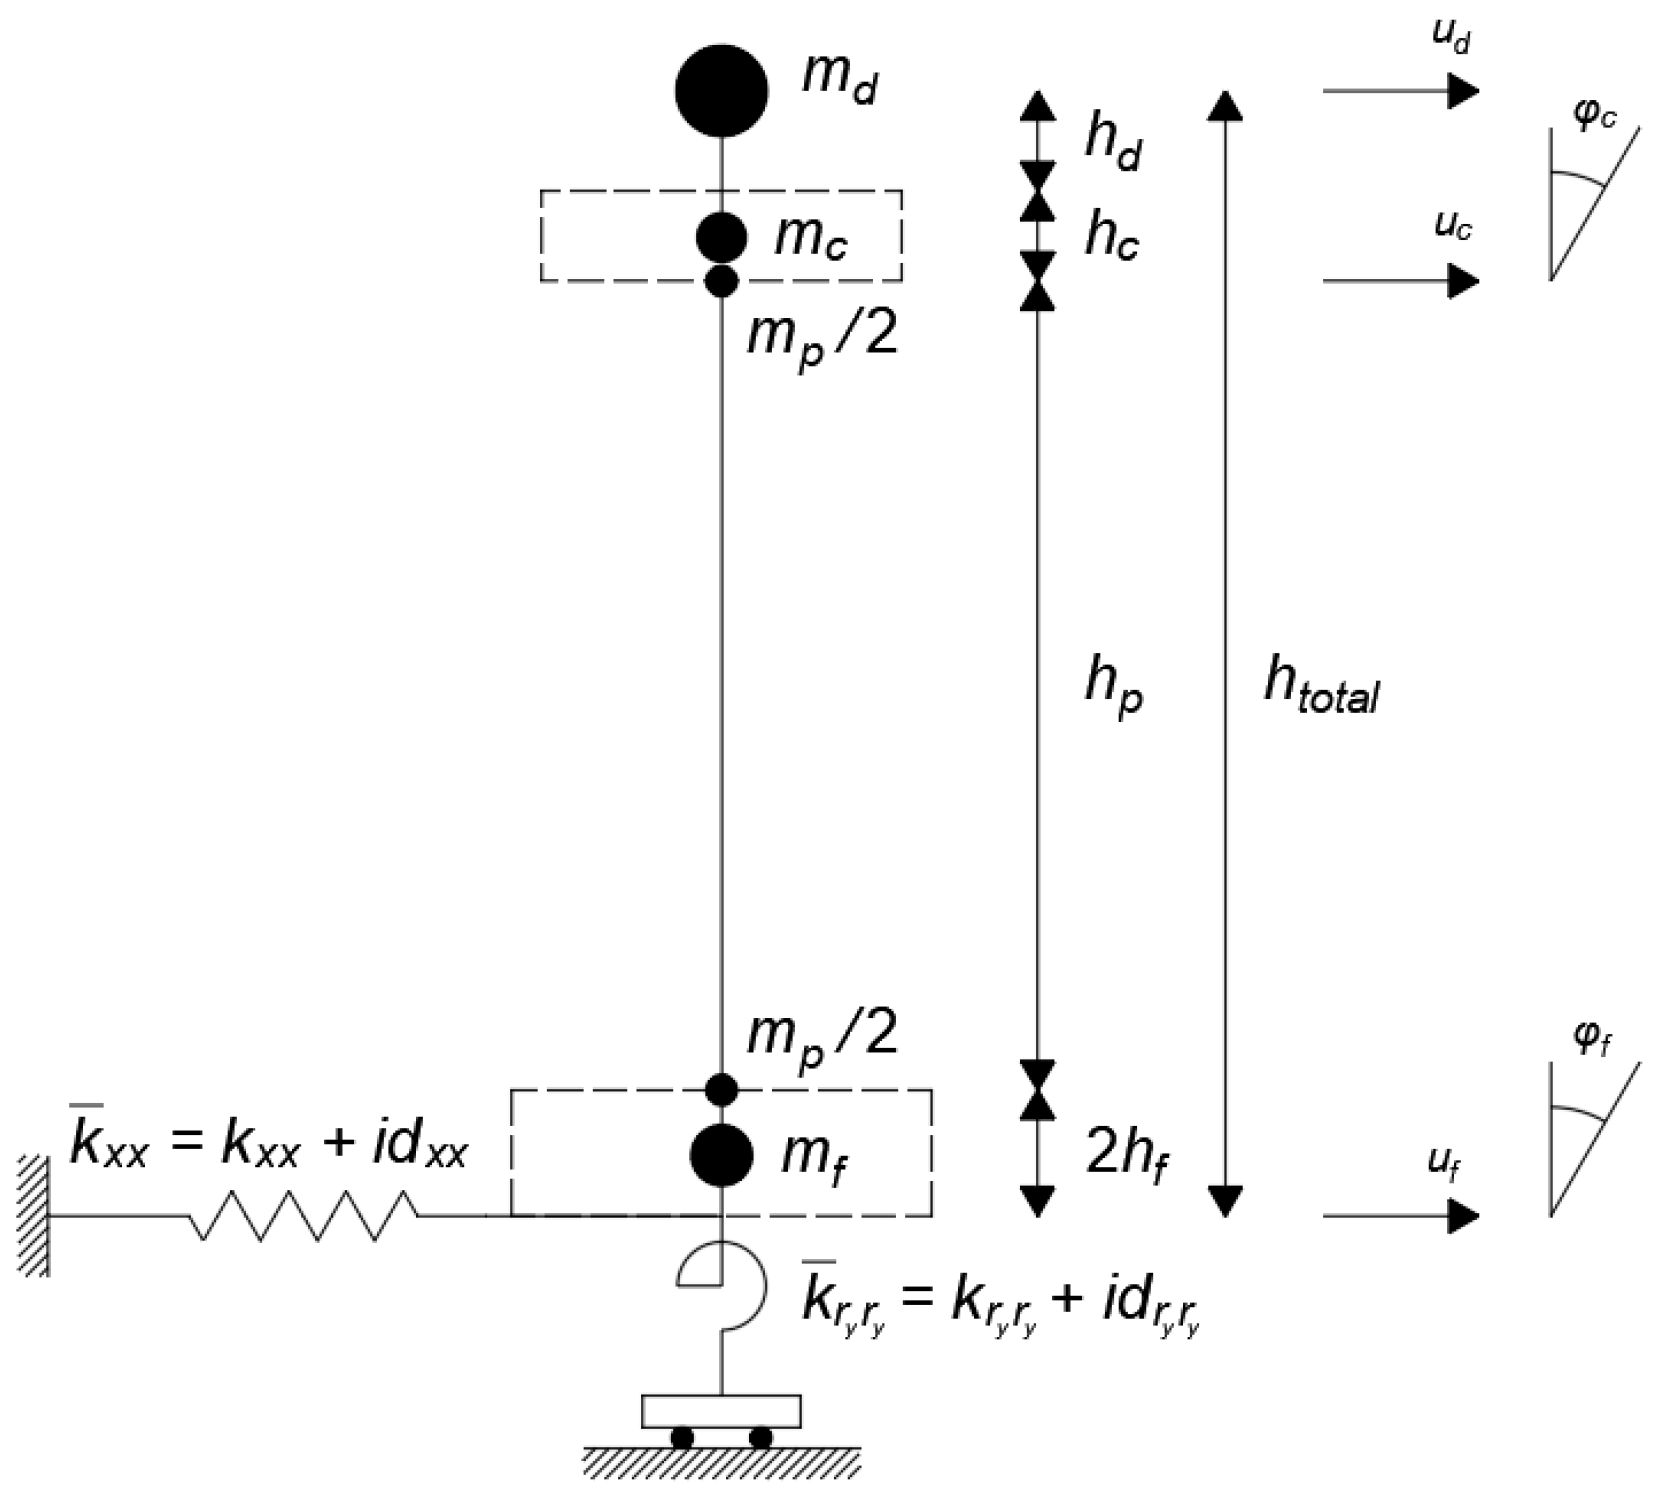
24], this paper aims to fill this knowledge gap. In particular, the main novel aspects of this study are as follows: (1) a more complex and realistic superstructure model was considered, by including more degrees of freedom for the superstructure compared to the model of [
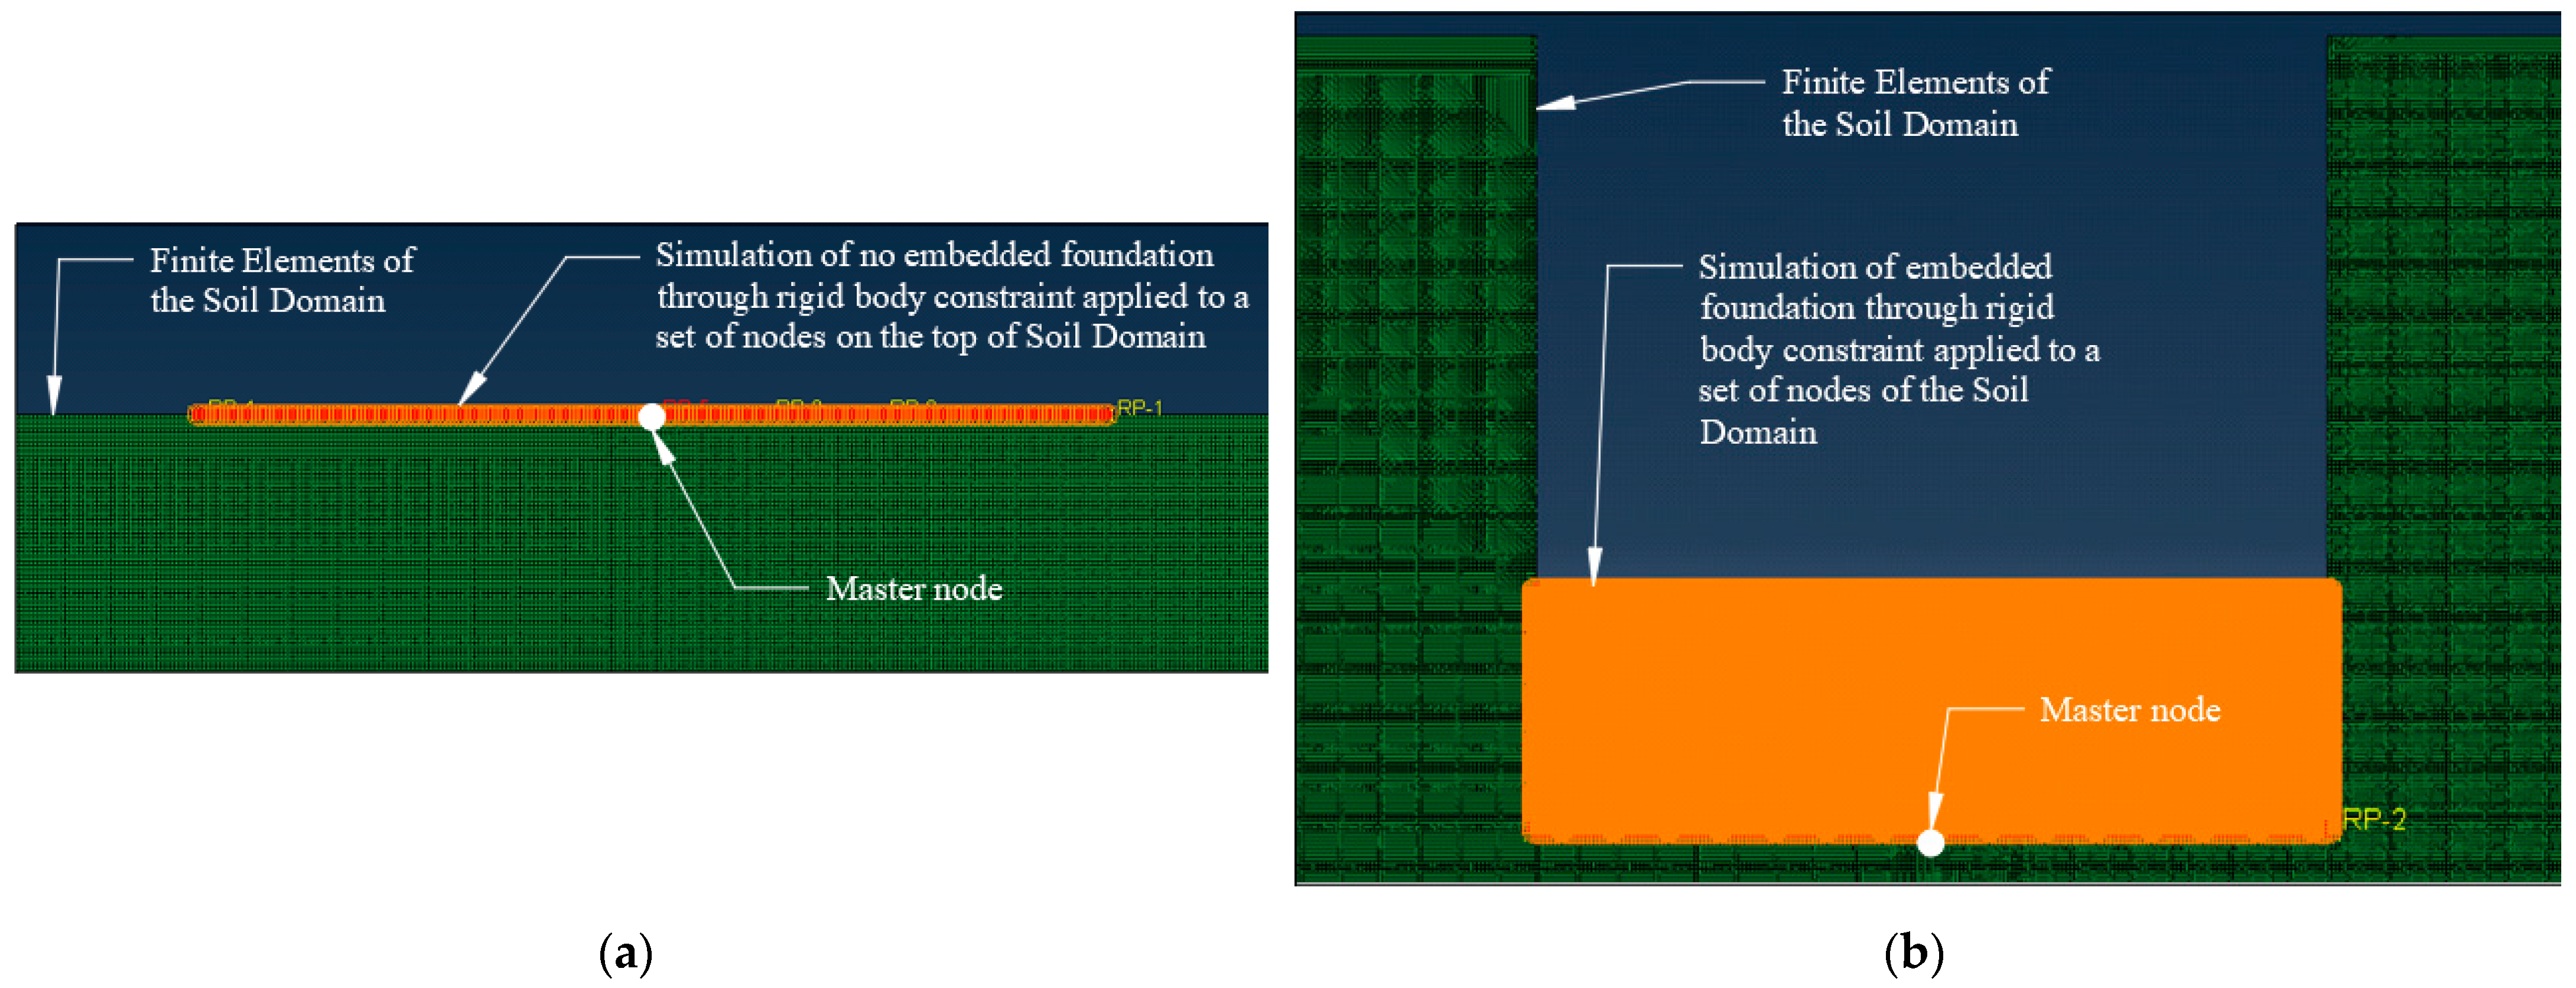
24], where the superstructure is treated as an sdof system; (2) impedance functions were derived by considering different values of the embedded depth of the foundation, as opposed to zero embedment in [24]; and (3) analysis of the seismic response of bridge prototypes was carried out, whereas [24] only investigated the variation in fundamental frequency.
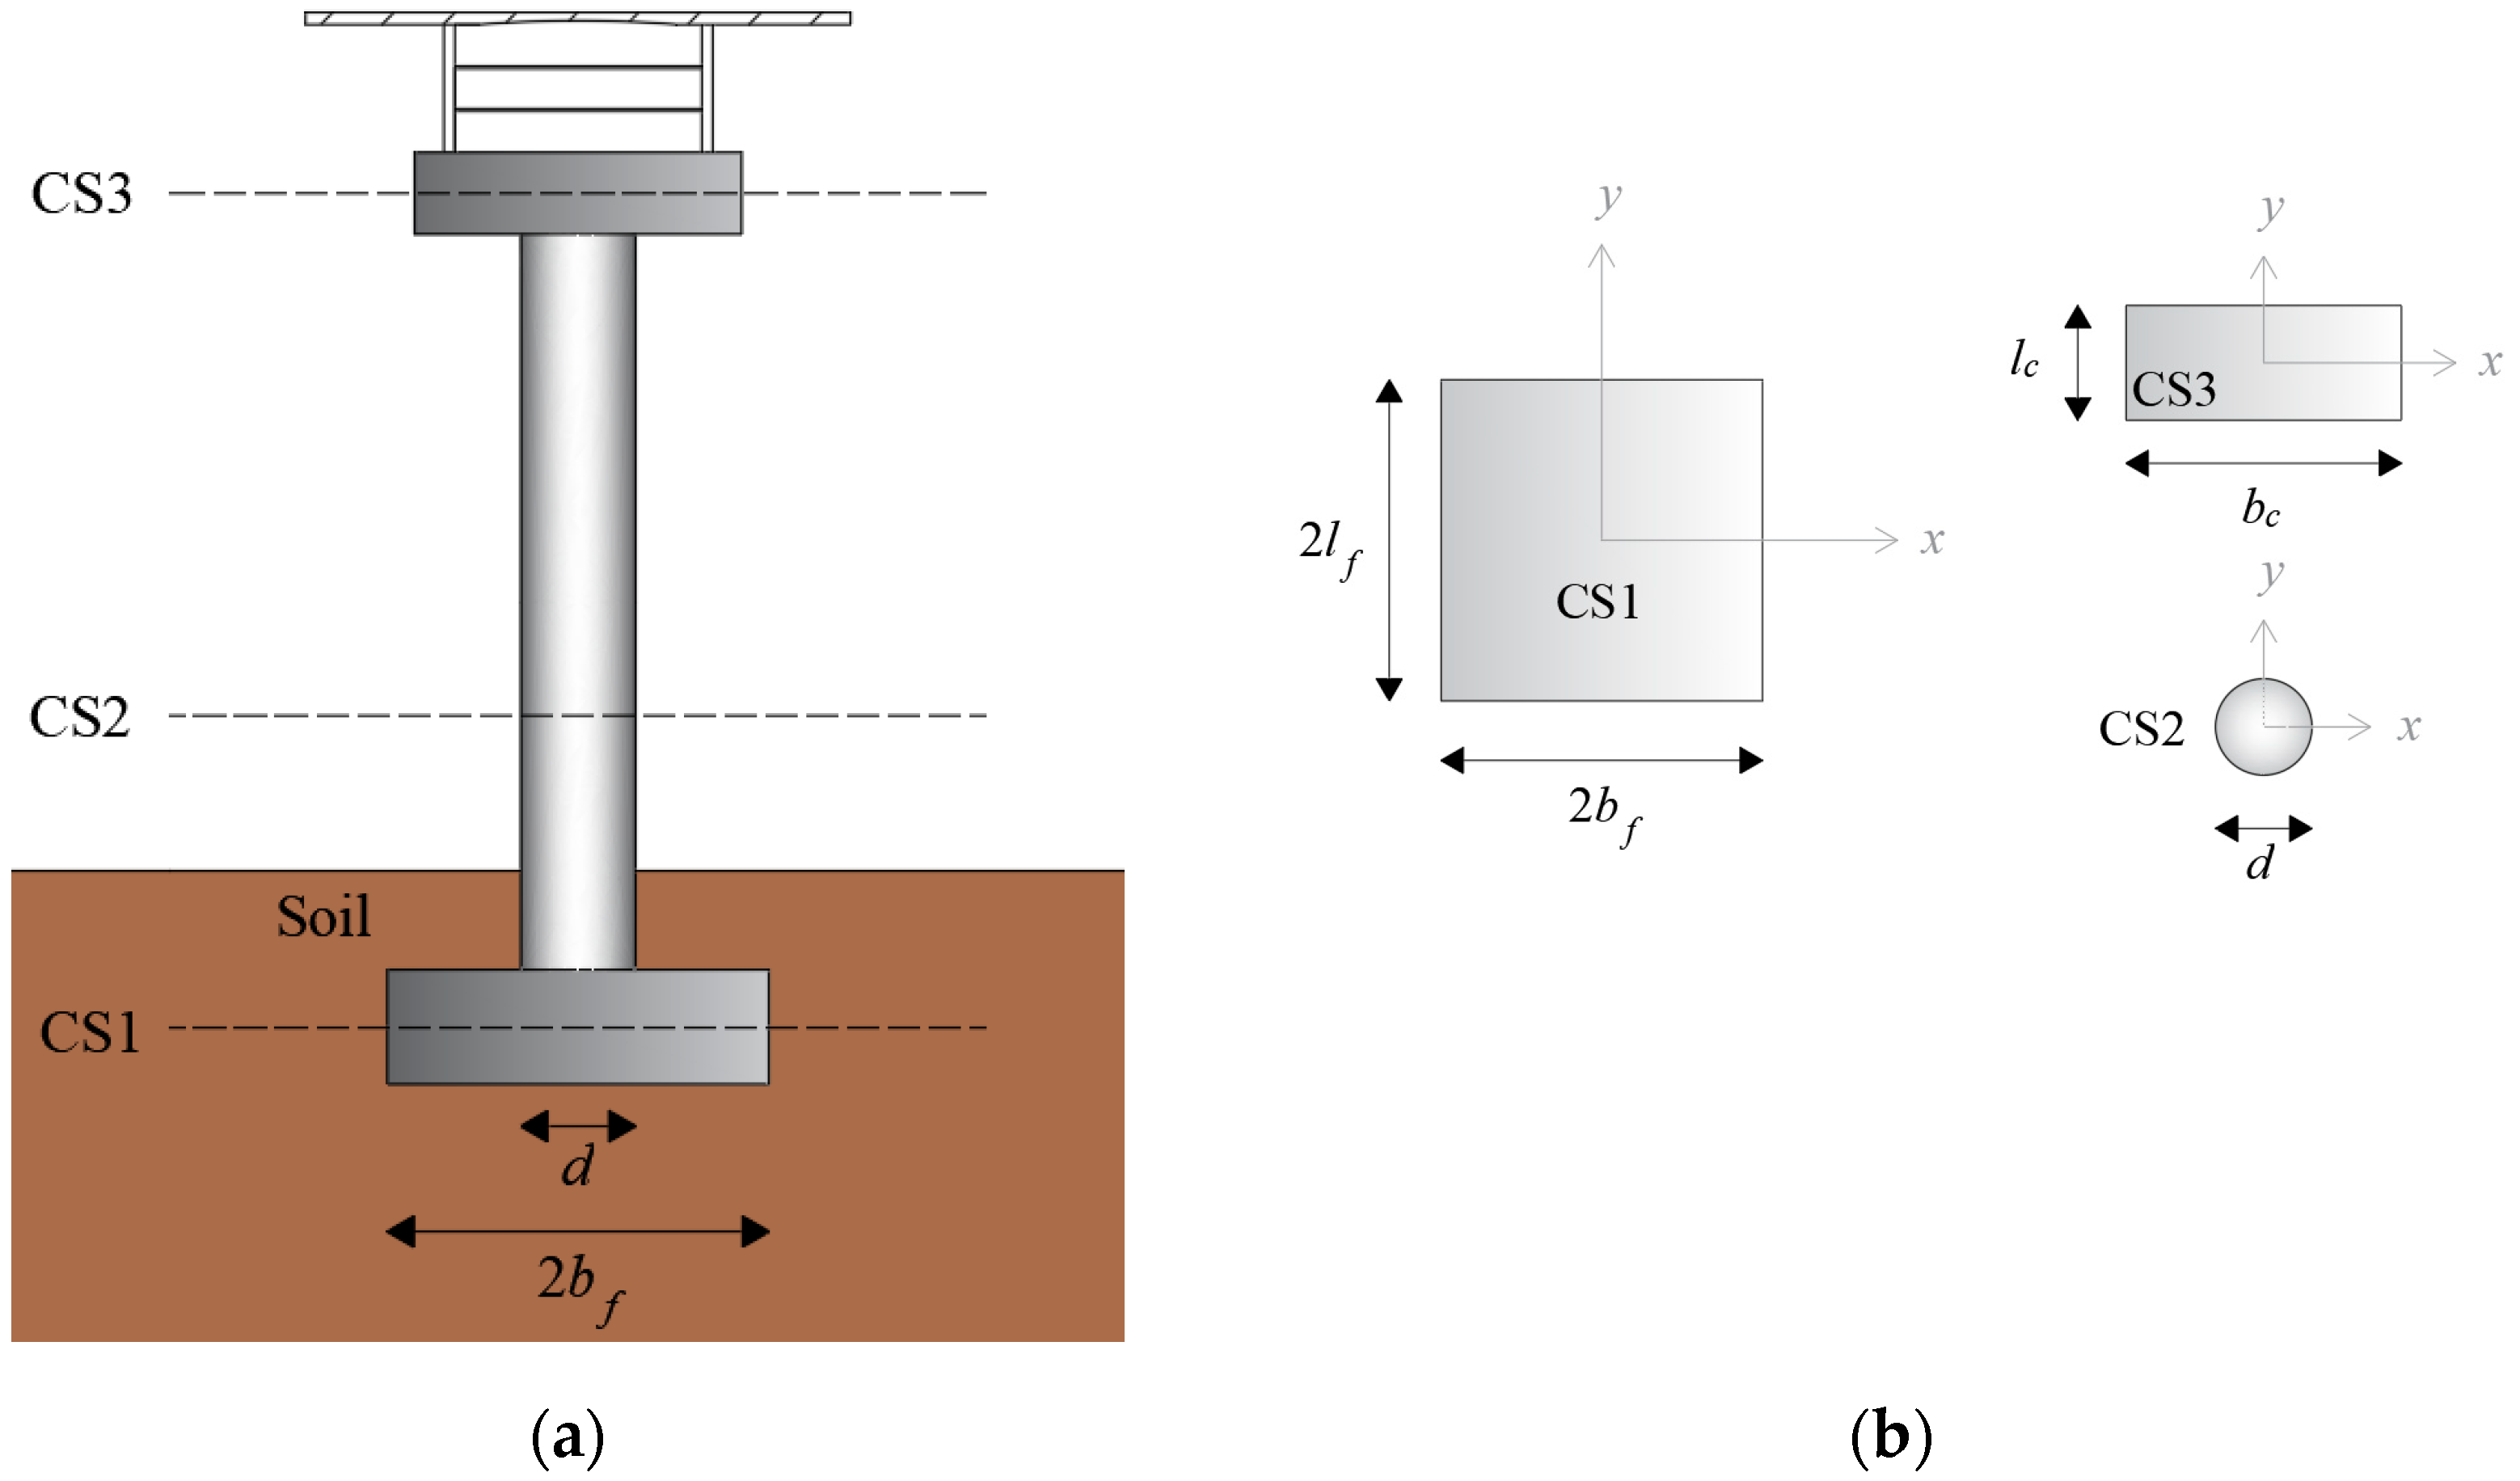
Section 2 illustrates the investigated SFS system, and the modelling approach for the estimation of the foundation impedance functions, the dynamic behaviour, and the seismic response of the SFS system for different scour scenarios. 
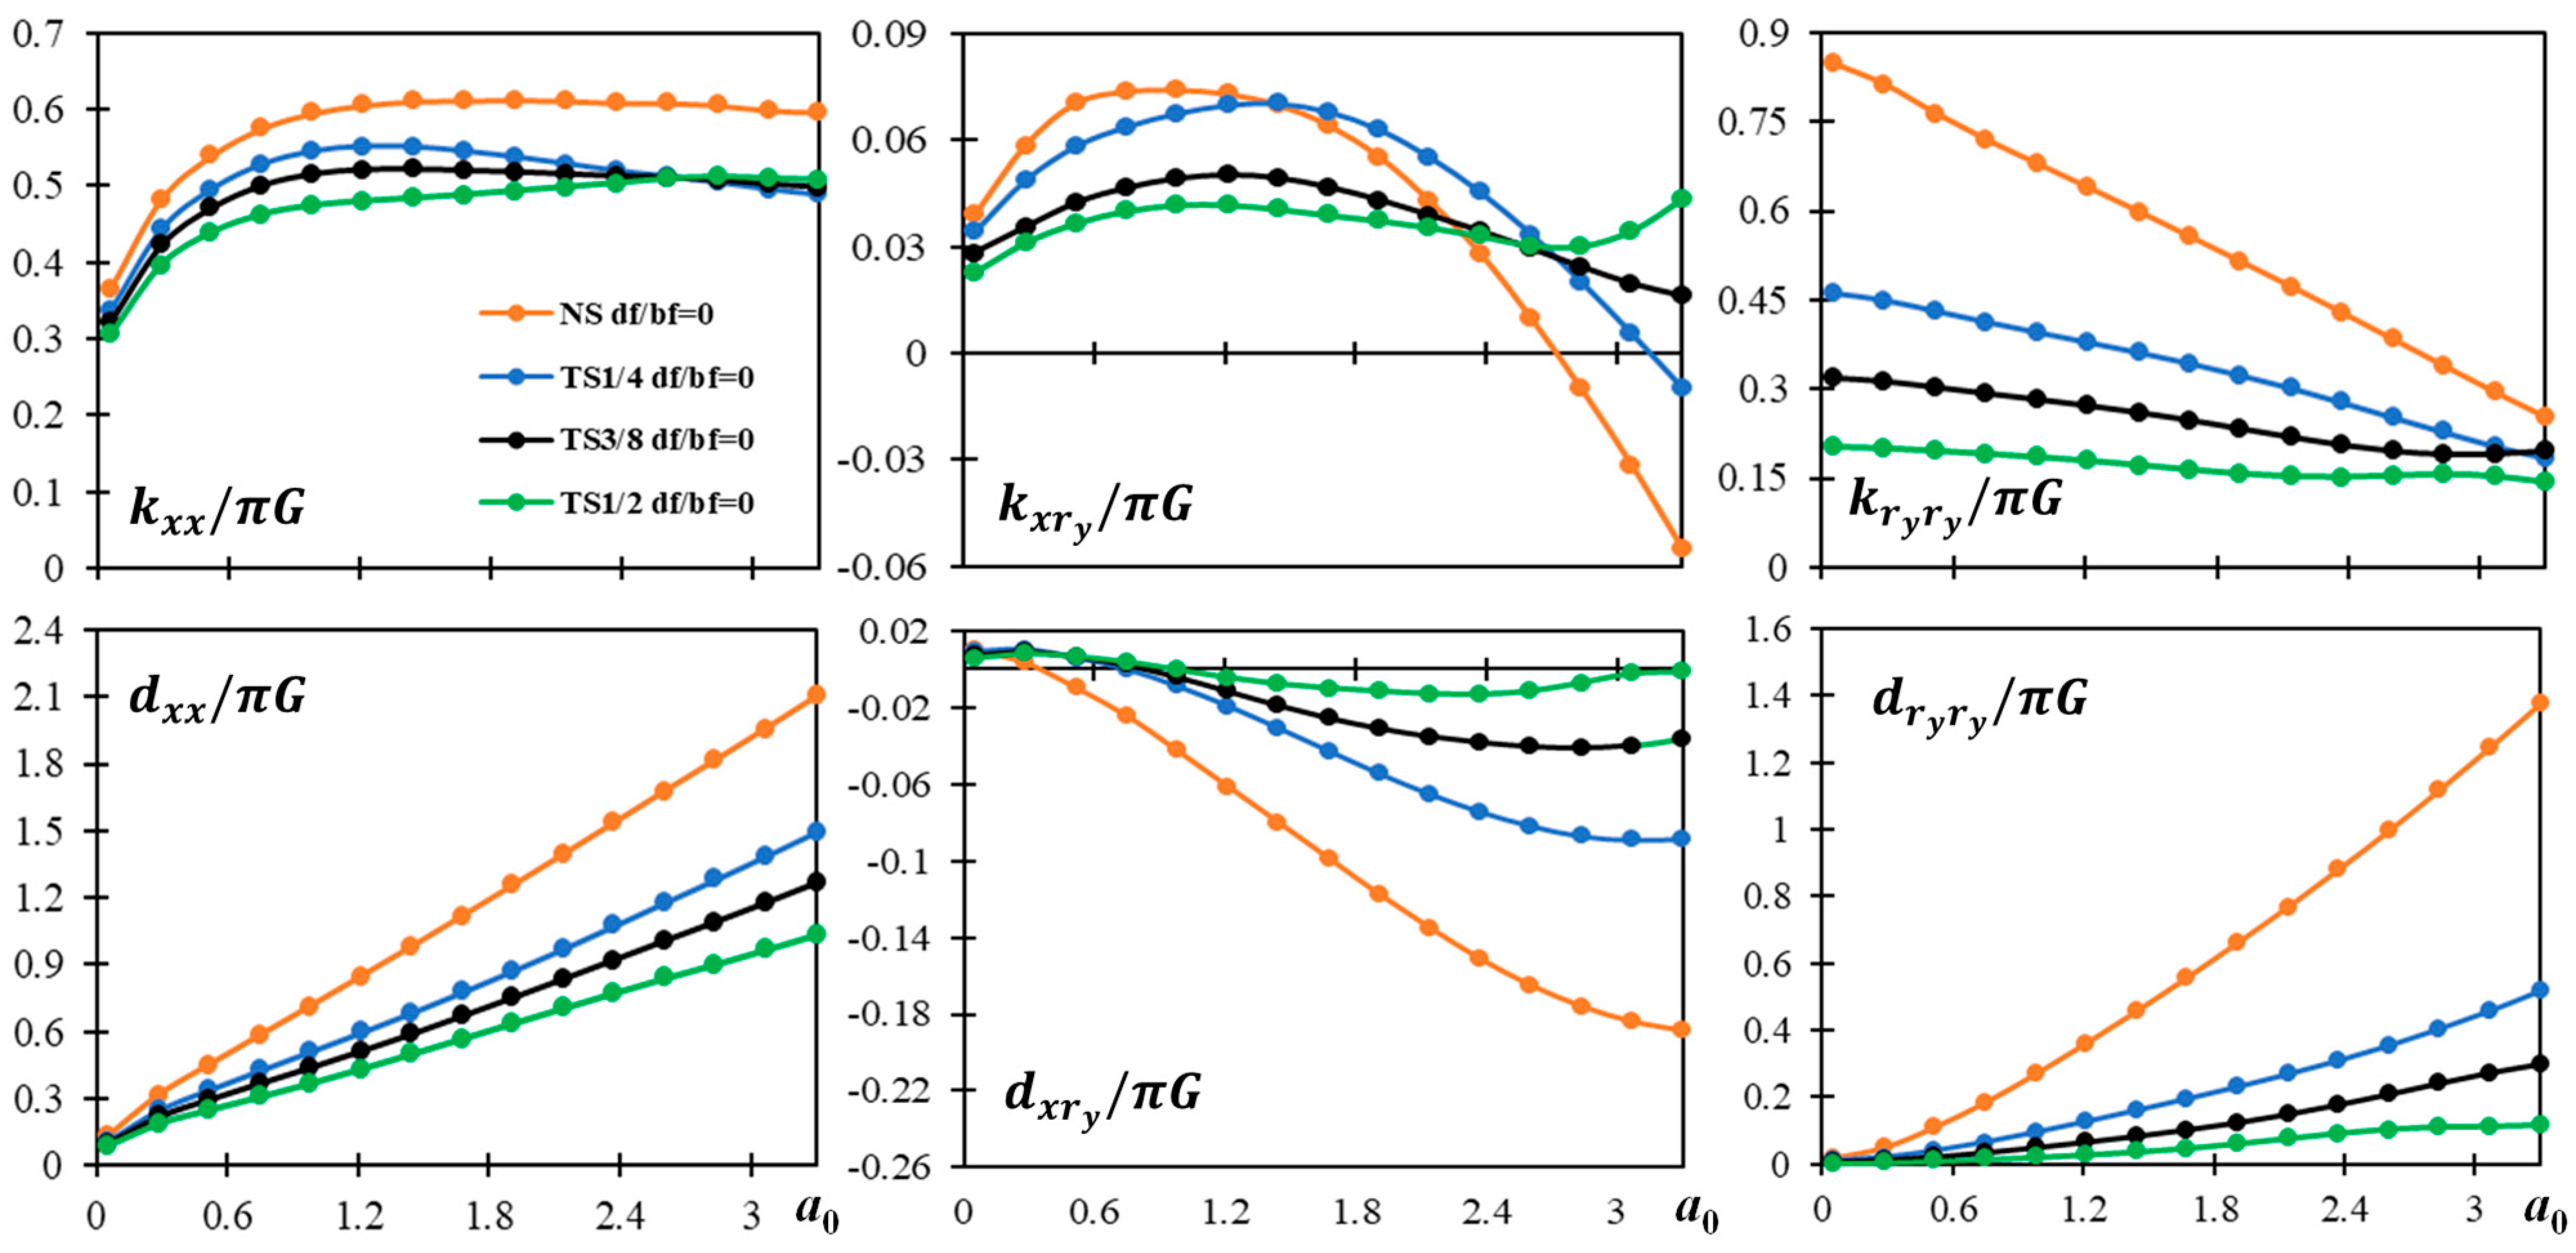
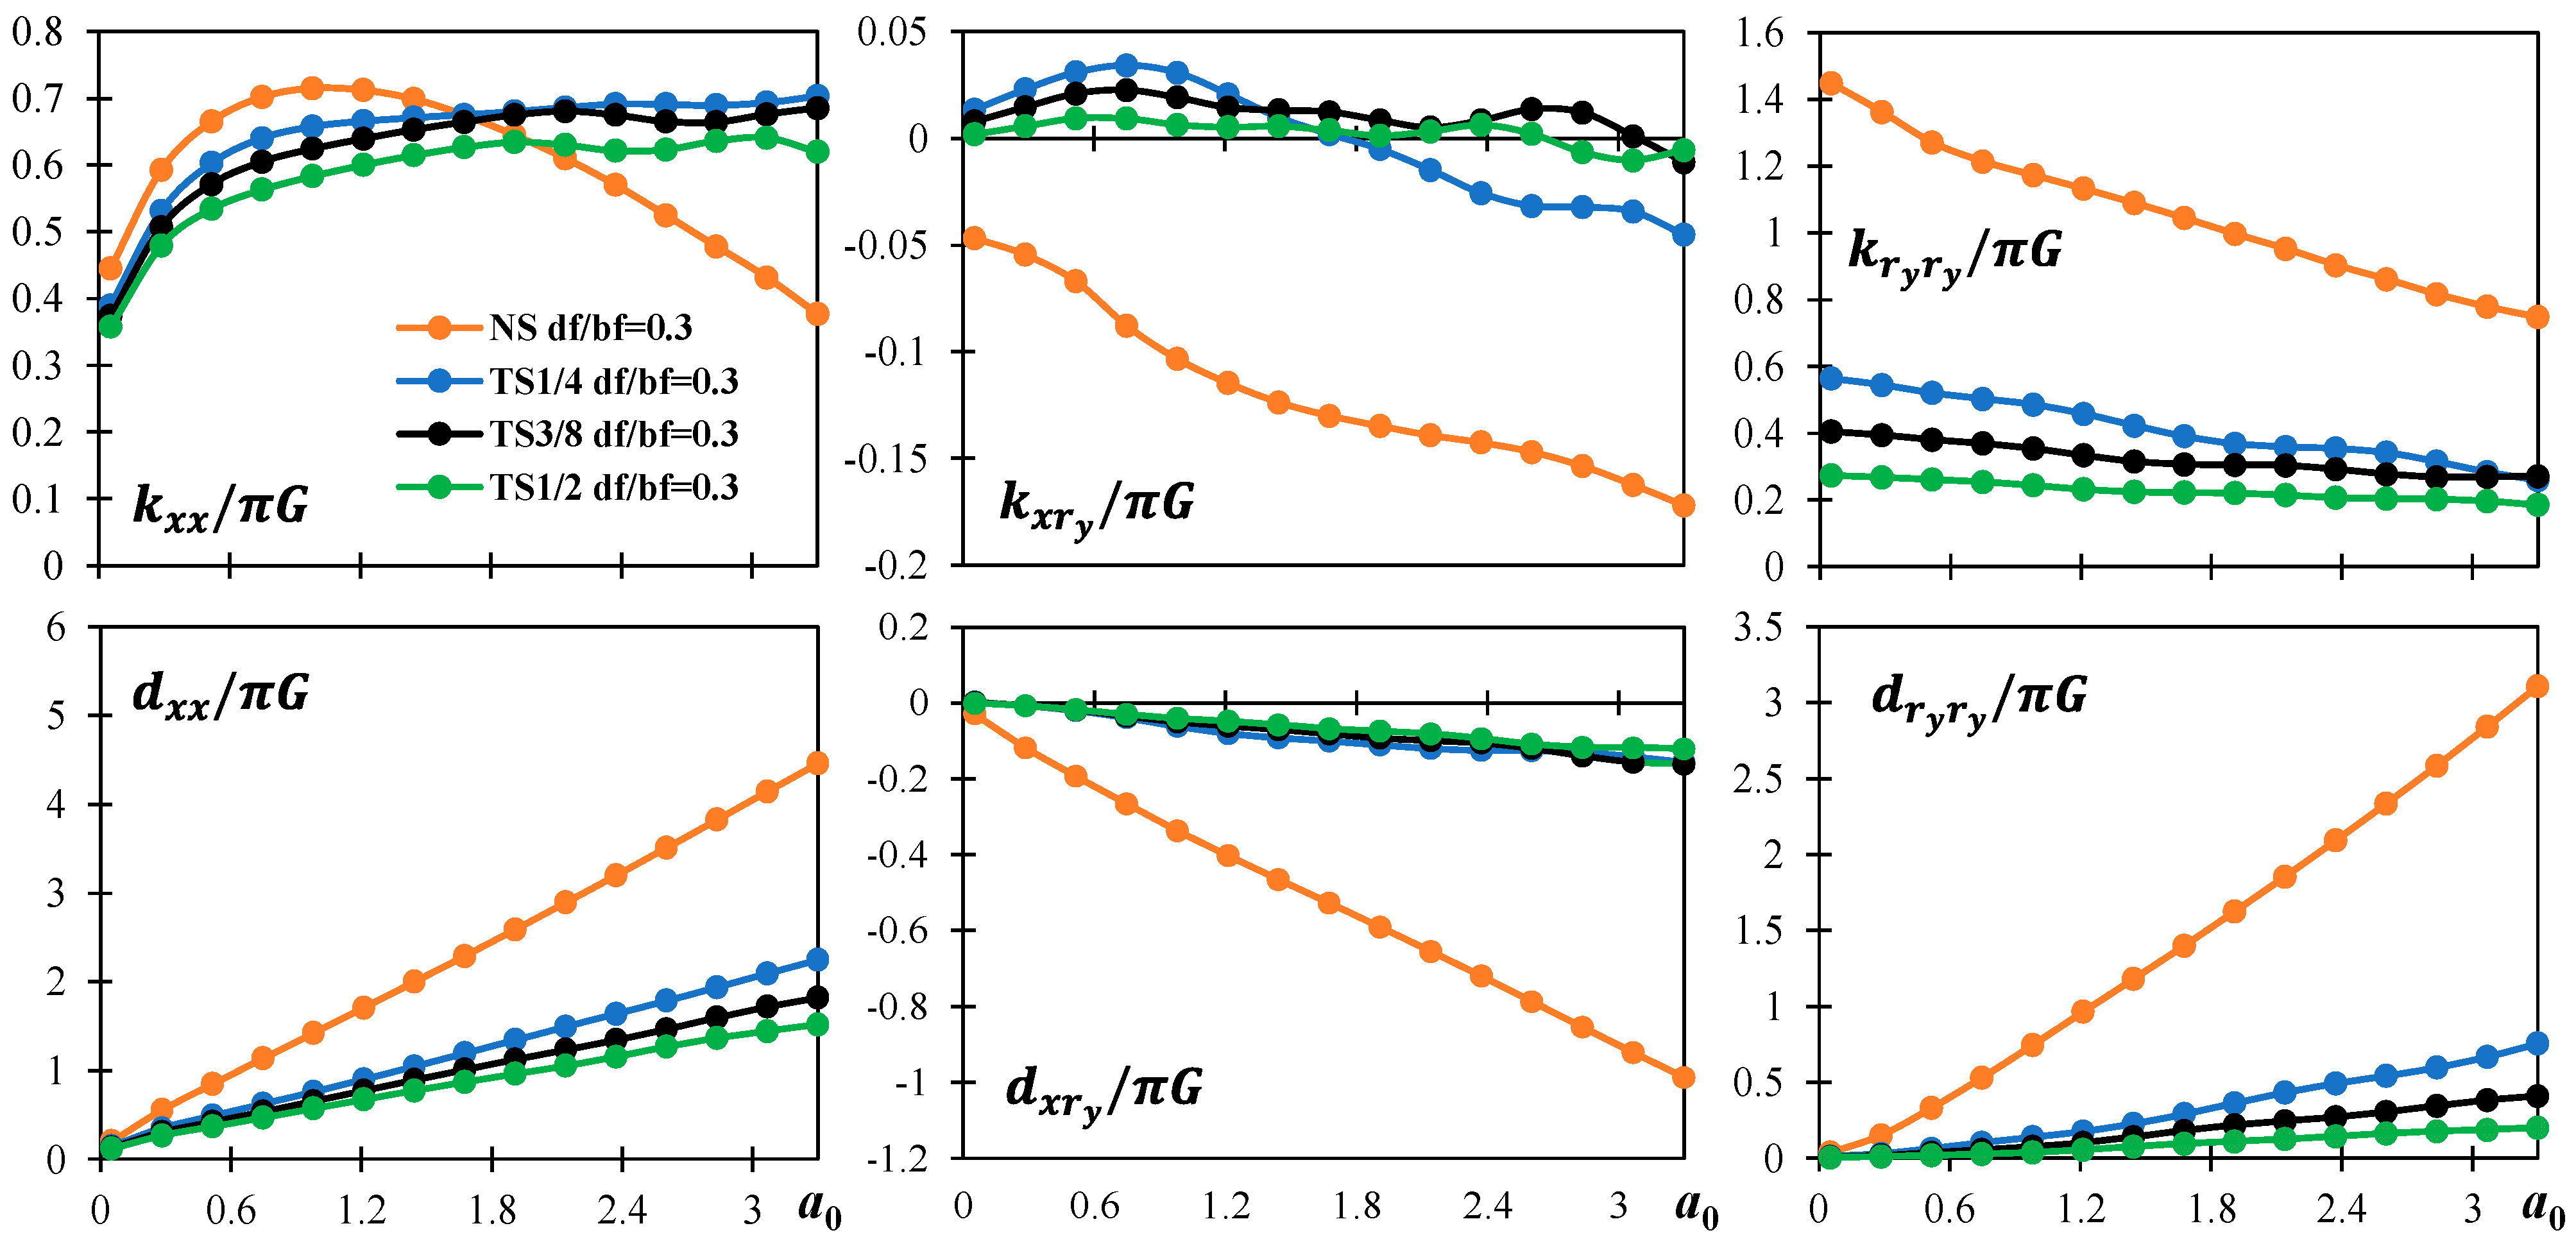
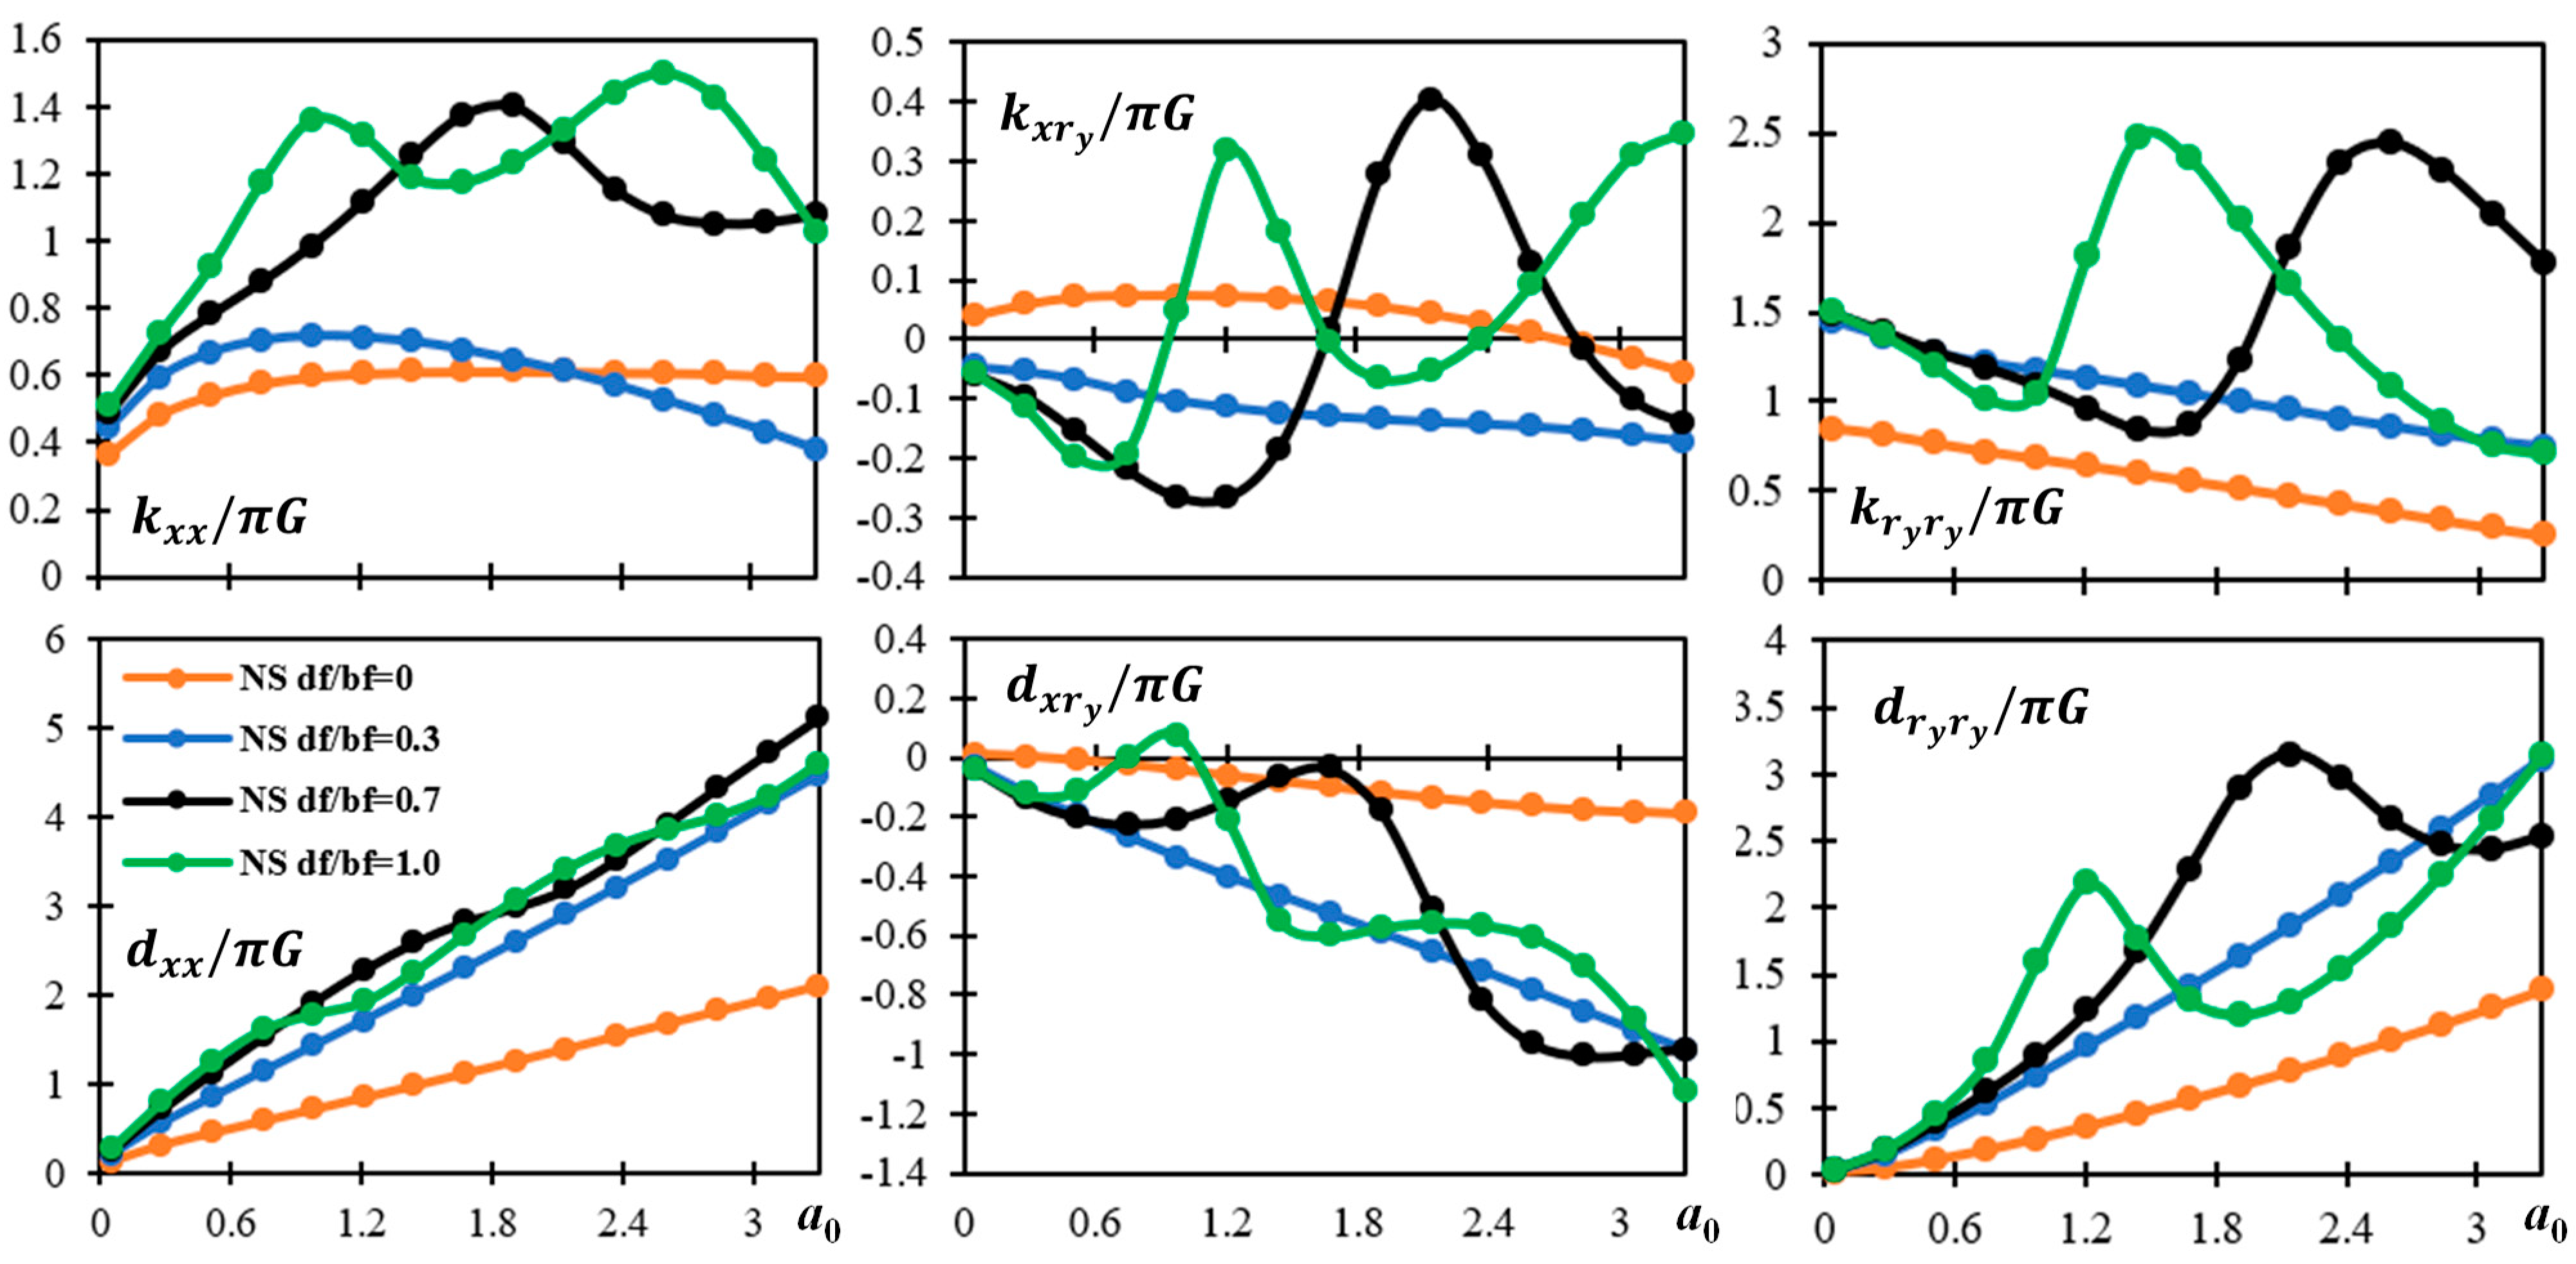
Section 3 presents the impedance functions for the various scour and embedded depth cases considered. 
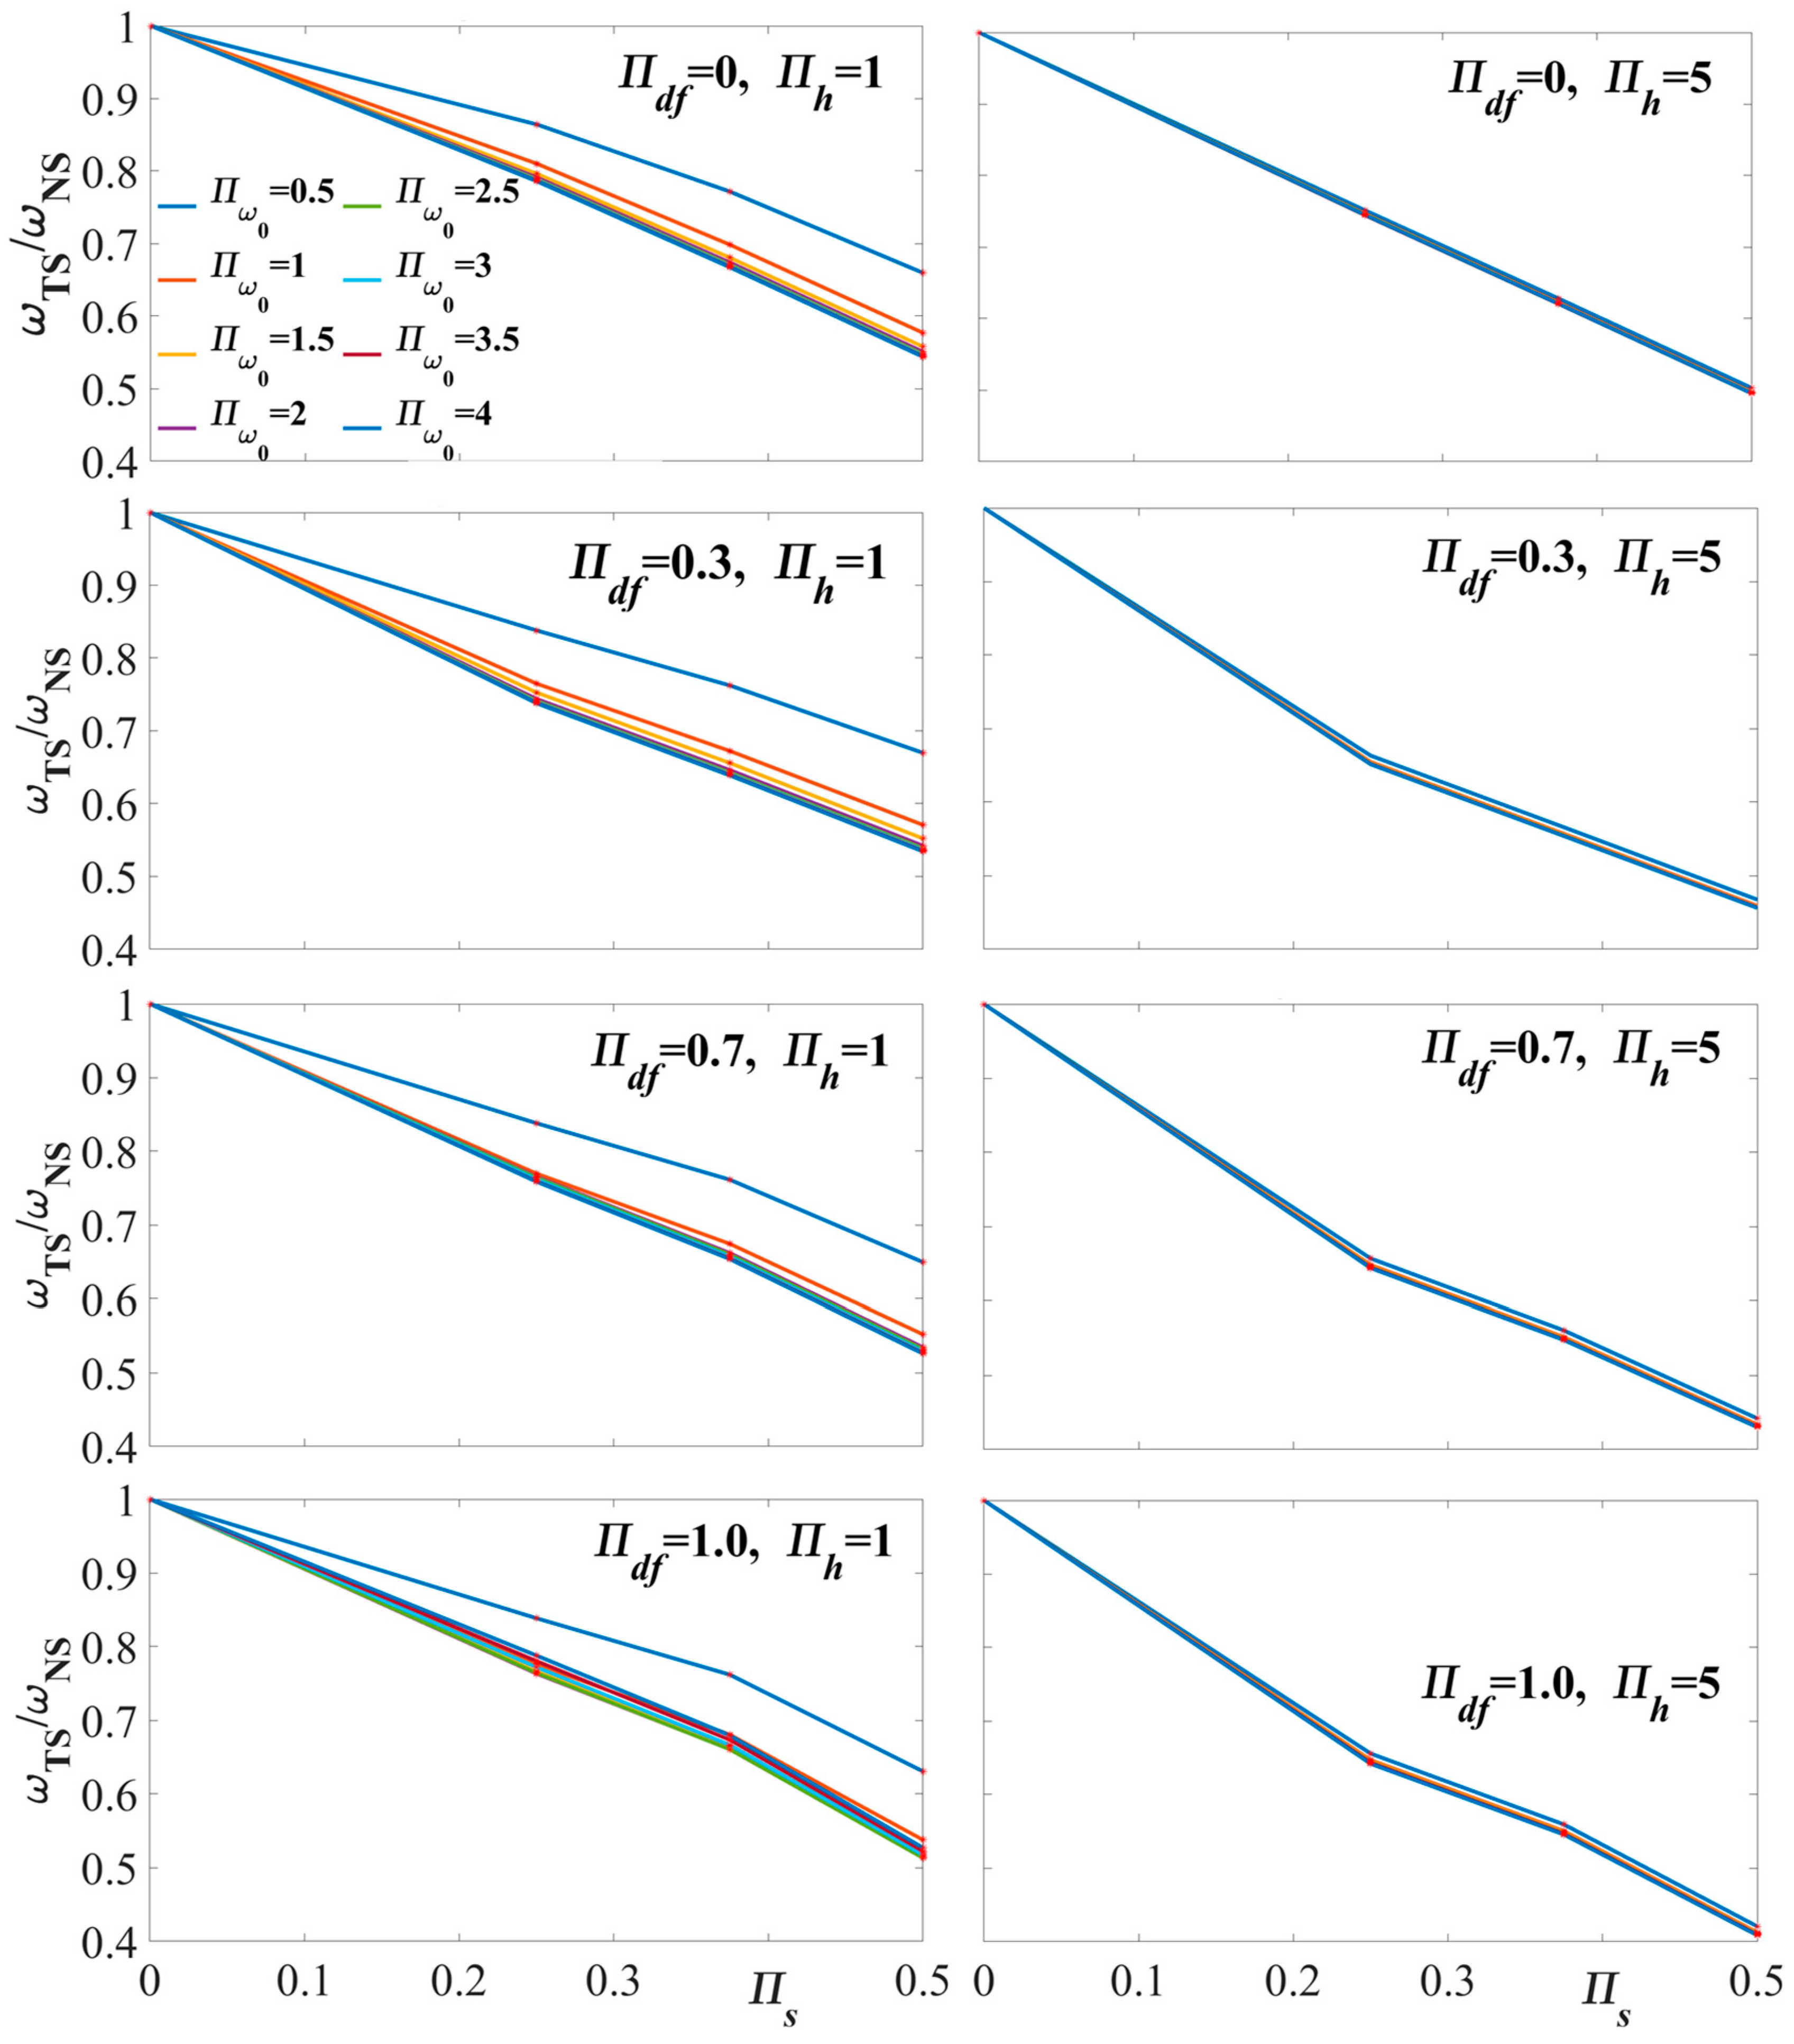
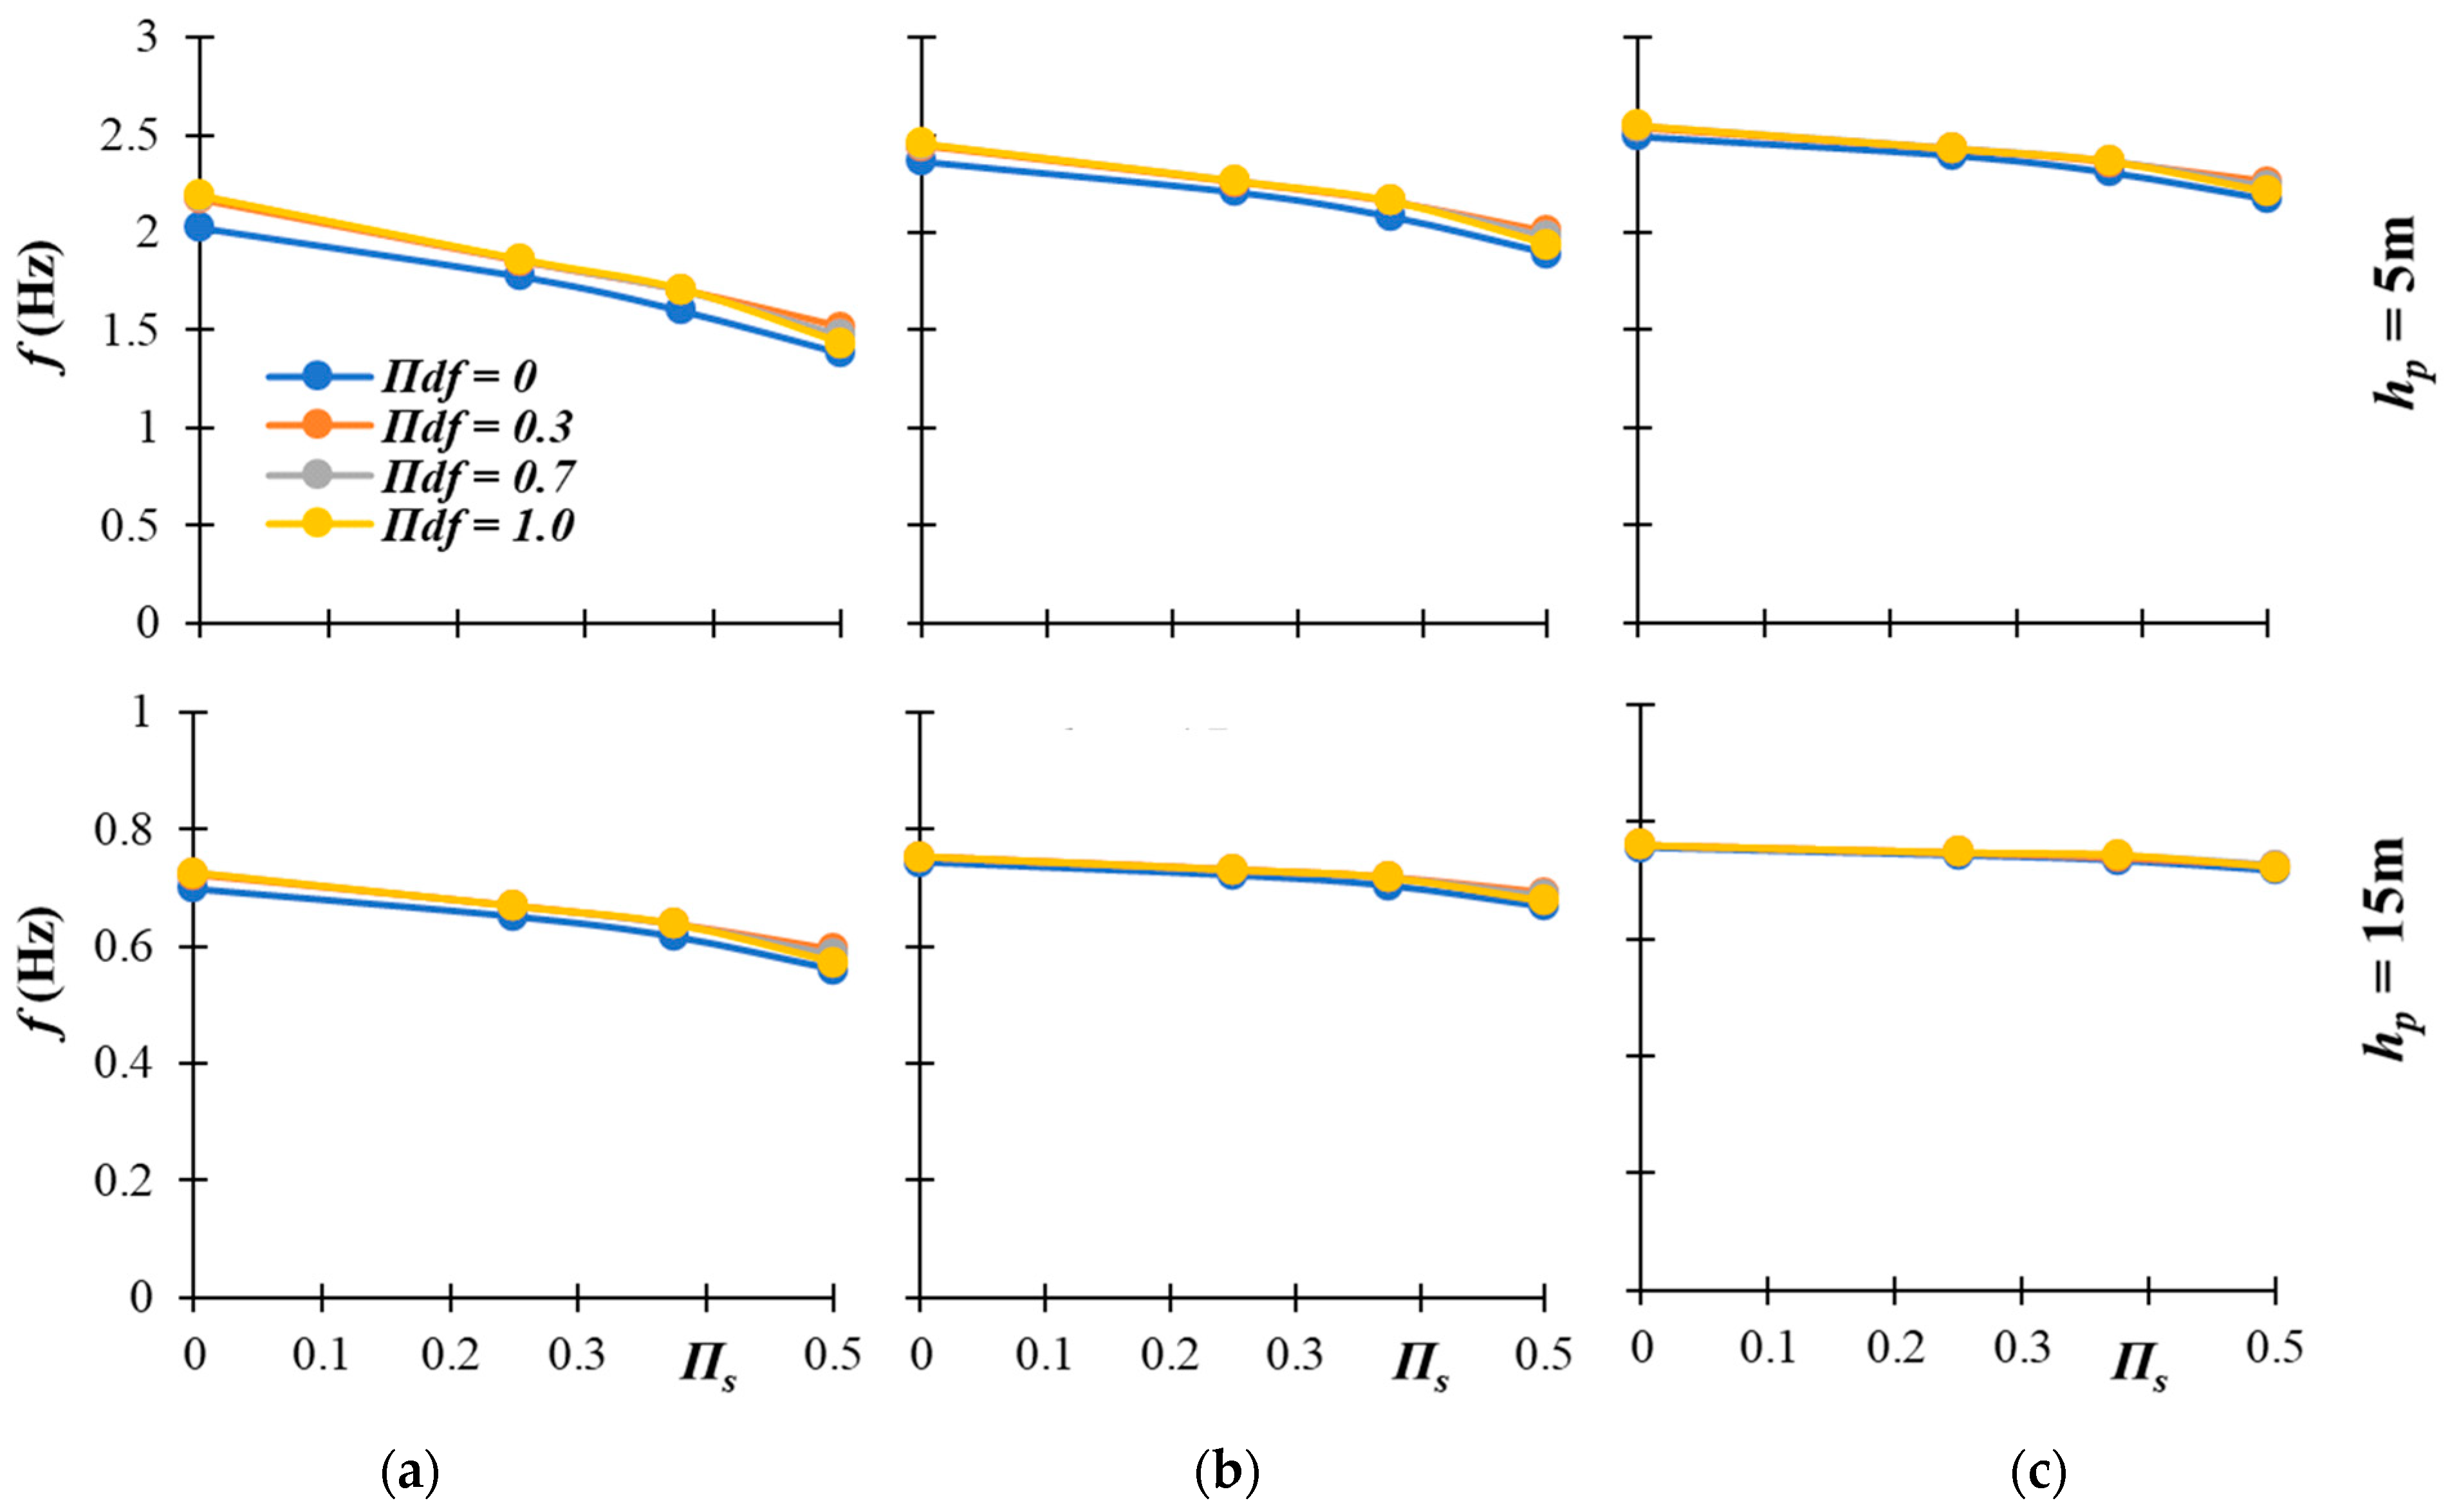
Section 4 presents the result of an extensive parametric study investigating the effect of scour on the SFS system, for a wide range of superstructure mechanical and geometrical properties and soil conditions. 
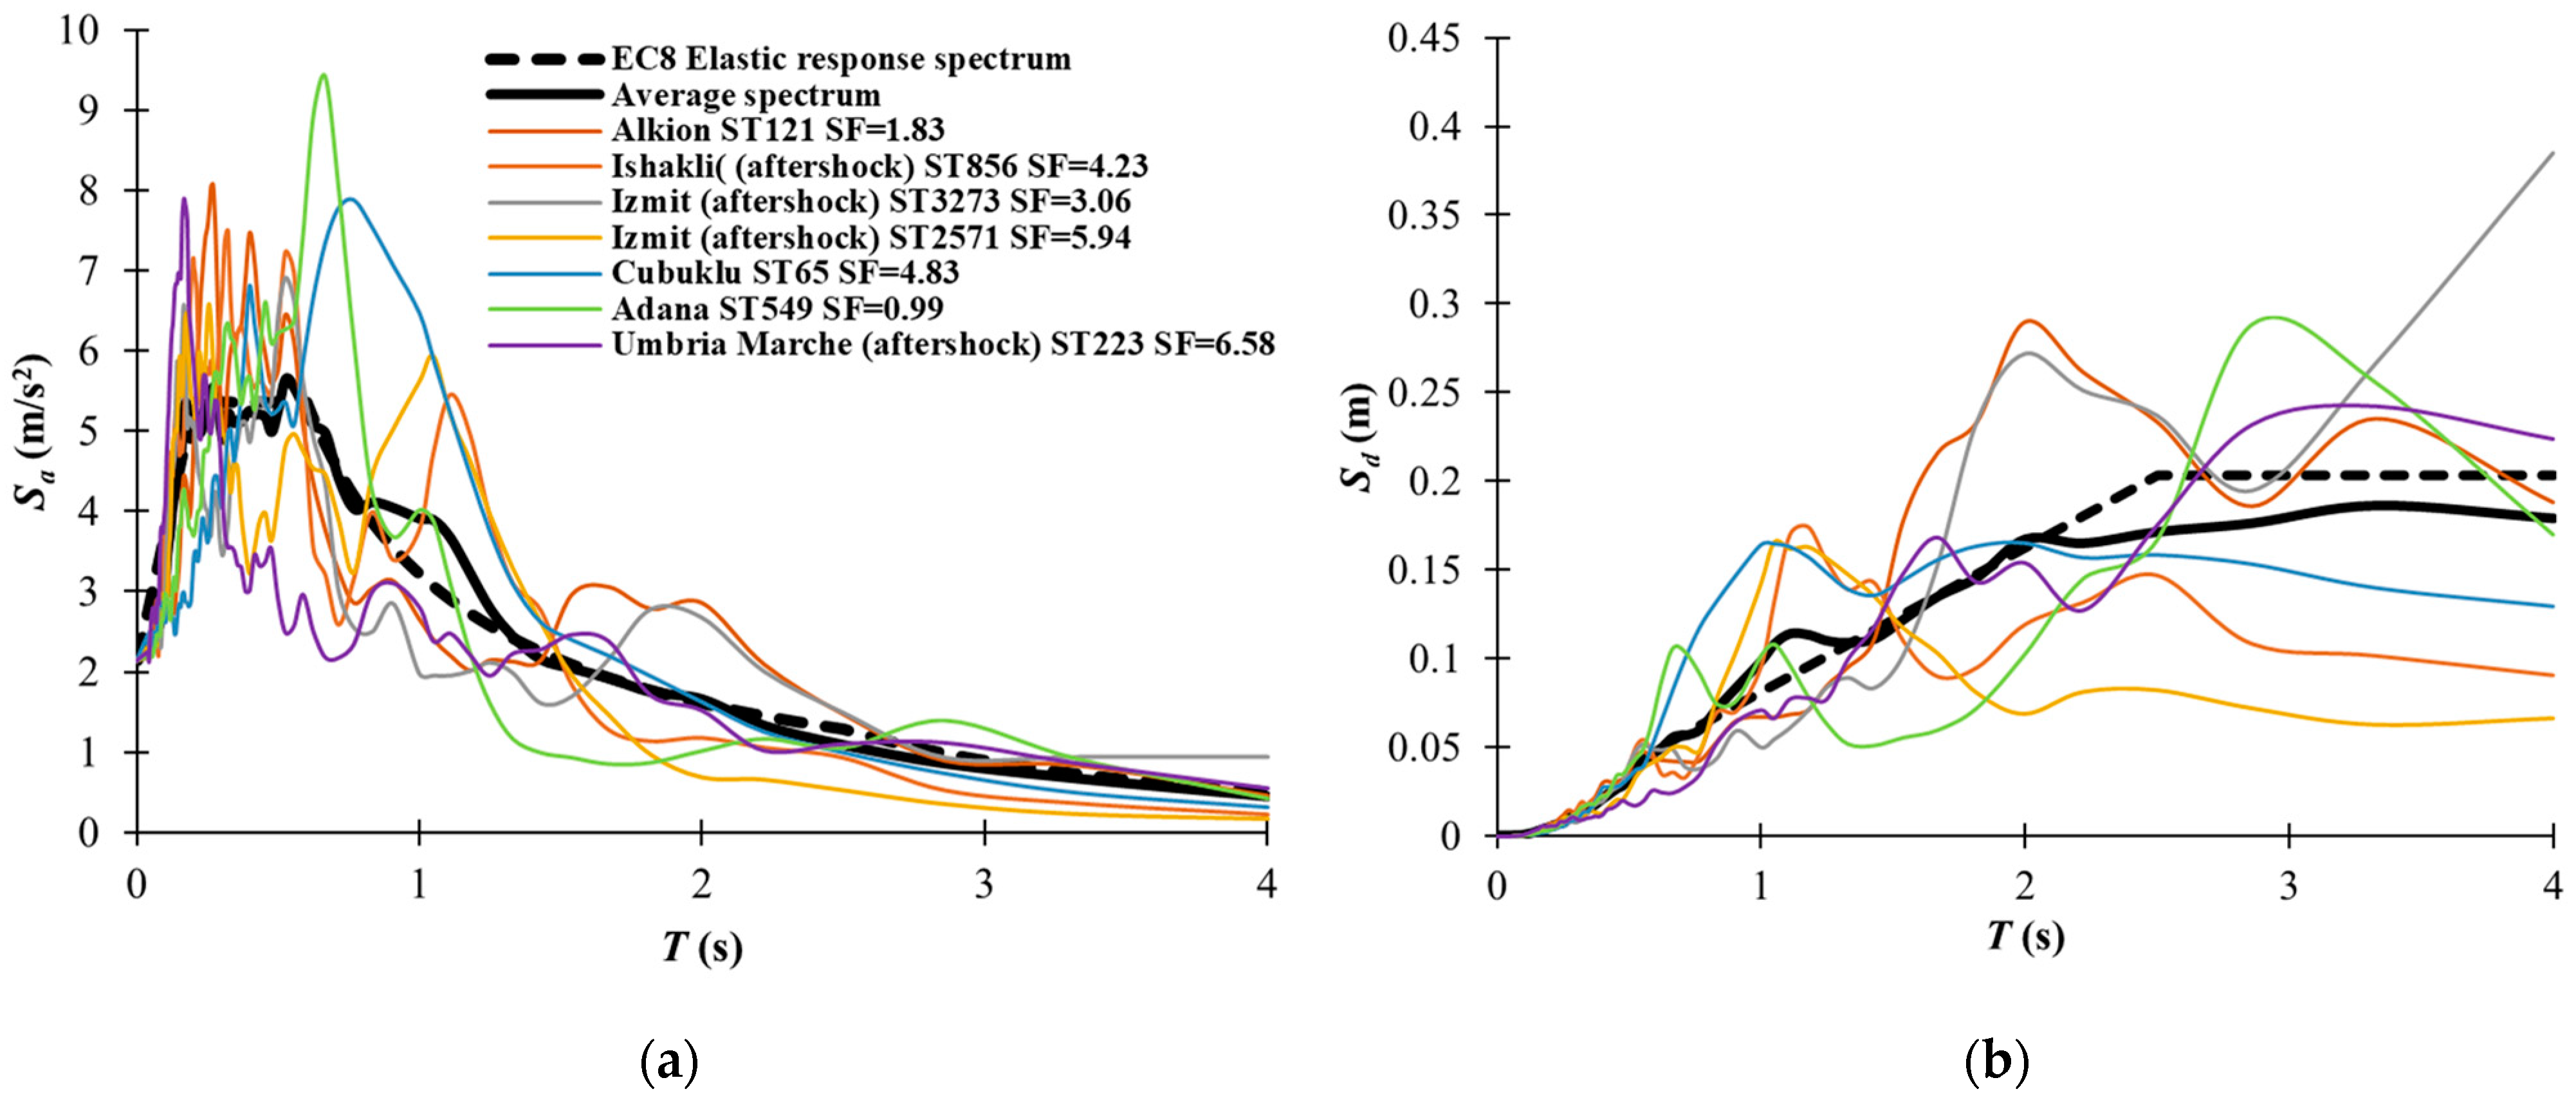
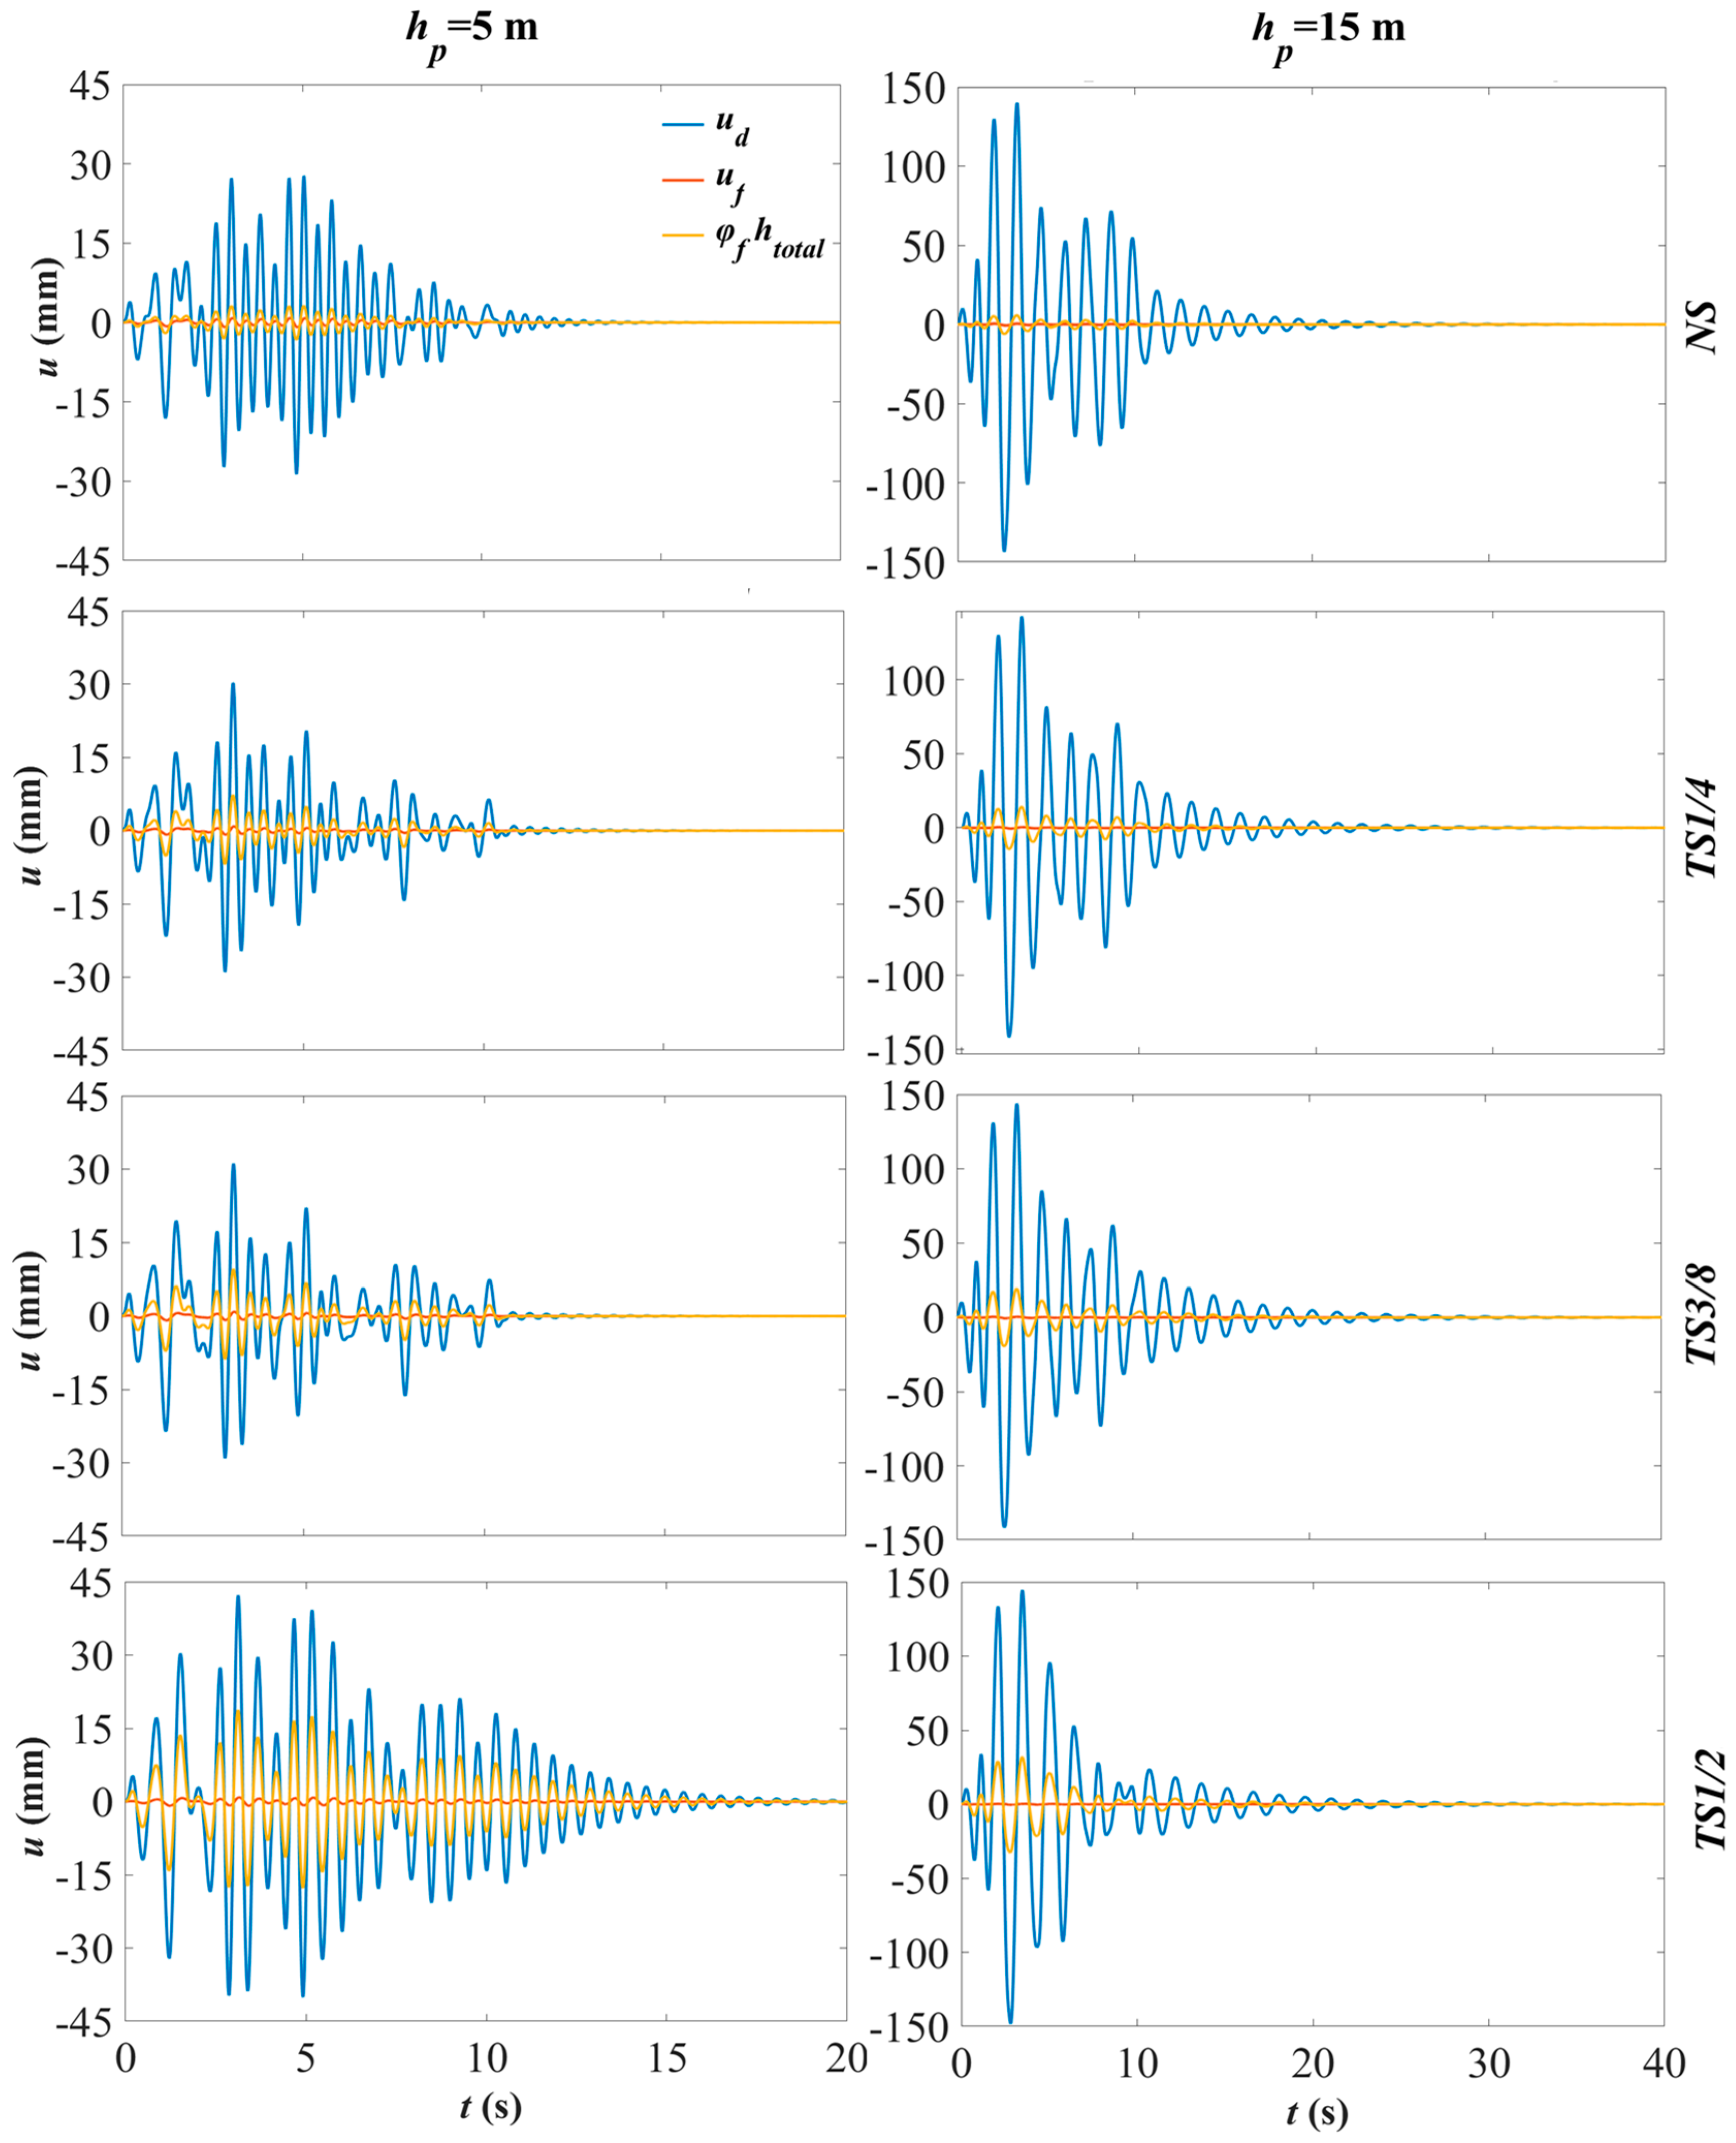
Section 5 investigates the seismic response of some representative bridge prototypes by means of time history analyses. Section 6 ummarises the main findings of the study and future works needed.

2. Model Description

The substructuring approach is a well-established methodology for addressing seismic soil–structure interaction problems. It is based on the superposition principle, and it only requires linear or linear equivalent behaviour for the soil system. By considering degraded shear moduli and enhanced damping properties for the soil, consistently with the shear strains, and by assuming that the foundation remains in the elastic range (as required by modern seismic codes), the substructure approach has already been largely used in the literature to perform soil–structure interaction analysis of both linear and nonlinear structures (e.g., [26,27]), by assuming that inertial effects do not significantly modify the soil shear strain in the soil. The approach consists in analysing, separately, the soil–foundation system, from which the impedance functions and the foundation input motion are obtained, and the superstructure, restrained through compliant supports simulating the soil–foundation impedances and subjected to the foundation input motion.
This section describes the modelling approach followed to estimate the impedance functions of a massless rigid strip foundation rigidly resting on a homogenous elastic soil domain for various embedded depths and scour scenarios. The modelling approach, developed from the previous work of the authors [24], considers a more complex superstructure model and a shallow foundation with different embedded depths rather than one simply resting on the ground surface.
A substructure approach is employed, where the SFS system is divided into two parts, the soil medium and the superstructure. Firstly, the foundation impedance functions for the soil–foundation system are derived numerically by analysing a massless rigid strip foundation resting on a homogeneous elastic soil domain in Abaqus [28]. Then, the derived impedance functions are used to analyse the in-plane dynamic behaviour and seismic response of a bridge pier, modelled as a multiple-degrees-of-freedom (MDOF) system.

2.1. Soil–Foundation System and Impedance Functions

The frequency-dependent impedance functions governing the dynamic response of the soil–foundation system in the frequency domain are described by the following set of equations:
P ω Q ω M ω / b f = k z z + i d z z 0 0 0 k x x + i d x x k x r y + i d x r y 0 k r y x + i d r y x k r y r y + i d r y r y w 0 ω u 0 ω φ 0 ω b f
where w 0 and u 0 are the displacement amplitudes along the z and x directions of the master node (i.e., the node at the foundation centroid at the level of the soil–foundation interface), and φ 0 is the rotation amplitude. Subsequently, P and Q denote the developing forces along the z and x directions at the master node, respectively, whereas M denotes the overturning moment. The frequency-dependent quantities k i j and d i j = c i j ω are the real and imaginary parts, respectively, of the impedance functions, describing the foundation response in the i-th direction due to the excitation in the j-th direction. Figure 1 illustrates forces and displacements along the various directions.
The frequency-dependent impedance functions are derived by considering a plain-strain finite element (FE) model of the soil domain developed in Abaqus [28] for the various investigated embedment depth and scour scenarios. The soil beneath the foundation is assumed to be homogeneous and described by the shear modulus G (the shear modulus can be the secant one resulting from the shear strain level attained in the soil during the propagation of seismic waves), the shear wave velocity Vs, the density ρs, and the Poisson’s ratio ν. The ratio between the height and width of the foundation is assumed to be fixed and equal to hf/bf = 0.3, whereas the Poisson’s ratio ν = 0.4. The assumed values are representative of many real bridges with shallow foundations built on sandy soil. Further details about the FE modelling strategy can be found in [24]. The Abaqus model was developed considering a Young’s modulus value of E = 162.41 MPa for the soil, and a value of ρ = 1600 kg/m3 for the density. However, it is worth pointing out that when results are presented in non-dimensional form, the values considered for these parameters are not important.
A rigid body constraint Is applied to the set of nodes at the Interface between the soil and the foundation. For the embedded cases, the soil located adjacent to the bridge pier over the foundation is disregarded, assuming that its contribution in terms of mass and stiffness is negligible with respect to that of the soil below the foundation. On the contrary, the soil located on the lateral sides of the foundation is assumed to be perfectly bonded to the foundation itself and contributes to the translational and rotational response of the soil–foundation system.
The impedance functions are evaluated with a steady-state analysis, by subjecting the master node to a harmonic unit amplitude displacement along a direction (while restraining the others) and by measuring the corresponding reaction forces along the various directions. It must be mentioned that the modelling approach was validated in a previous study by the authors [24]. The validation was based on a comparison between the impedance functions derived numerically in Abaqus (Figure 2a) and those obtained by Hryniewicz [29] for a model with zero embedded depth and no scour, and for a Poisson’s ratio ν = 0.25.
In the present study, the model considered in [24] is expanded by considering various embedded depths of the foundation for the estimation of the impedance functions (Figure 2b). In particular, three more different embedded depths and three scour layouts are considered (see Section 3), for a total of 12 models.
The scour hole is assumed to have a fixed triangular shape (Figure 3), which is defined by the portion of the foundation base that is undermined (2s). The assumed shape is based on flume tests (see [30] for further details).
The numerical analyses carried out in [25] suggest that the dynamic behaviour of structures with shallow foundations affected by scour is not significantly affected by the scour hole shape (e.g., rectangular or triangular), as long as it results in the same portion of the foundation being undermined. However, experimental studies carried out by Ciancimino et al. [20] on a model with a caisson foundation have proven that the scour hole shape and the type of scour (i.e., general rather than local) have a strong influence on the dynamic response of bridge piers. Nevertheless, a thorough investigation of the influence of the scour hole shape on the dynamic impedances of the foundation, albeit very interesting, is out of the scope of the present study.

2.2. Superstructure

Figure 4 and Figure 5 illustrate the bridge pier and the analytical model of the SFS system considered in this work for studying the transverse response of the overall SFS system. To the authors’ knowledge, this is the first study that investigates the influence of scour on the transverse dynamic behaviour of bridge piers with shallow foundations by considering a multiple-degrees-of-freedom (MDOF) model for describing the superstructure.
The model is suitable to capture the transverse dynamic behaviour of piers in multi-span continuous bridges (sufficiently far from the abutments that may interact with the pier in carrying the lateral forces if equipped with fixed restraints in the transverse direction) and to predict the longitudinal and transverse response of piers in multi-span simply supported bridges where each pier is responsible for its relative tributary mass (i.e., the mass of one span).
The SFS system consists of a rigid foundation with mass mf, a flexible pier with mass mp lumped at the top and bottom nodes, a rigid pier cap with mass mc, the bridge bearings with stiffness kb (in the case of isolated bridges), and the top mass, representative of the deck inertia md. The dofs of the system are constituted by the transverse displacement of the bridge deck, the transverse displacement and rotation of the pier head, and the transverse displacement and rotation at the bottom of the foundation. The soil–structure interaction is taken into account by the previously estimated impedance functions. The pier is treated as an Euler–Bernoulli beam element, having the following stiffness matrix K p :
K p = k 11 k 12 k 13 k 14 k 21 k 22 k 23 k 24 k 31 k 32 k 33 k 34 k 41 k 42 k 43 k 44 = EI 12 h p 3 6 h p 2 12 h p 3 6 h p 2 6 h p 2 4 h p 6 h p 2 2 h p 12 h p 3 6 h p 2 12 h p 3 6 h p 2 6 h p 2 2 h p 6 h p 2 4 h p
where E and I are the elastic modulus and second moment of area of the cross-section of the pier, respectively. The equation of motion of the system can be expressed in the frequency domain, as follows:
K S + K F ω + i C S ω 2 M U ¯ ω = ω 2 M R u ¯ g ω
where
U ¯ = u d u c φ c u f φ f T
collects the Fourier transform of the system generalised displacements, namely the displacement of the deck centroid ( u d ), the displacement ( u c ) and rotation ( φ c ) of the top of the pier, and the foundation base’s translation ( u f ) and rotation ( φ f ). Furthermore, in Equation (3), u ¯ g denotes the Fourier transform of the ground displacement due to the free-field motion. Matrices M, C, K S , and K F denote the mass, hysteretic damping, and contribution to stiffness matrix of the superstructure and the foundation, respectively, and R is the load influence vector. They latter are defined as follows:
K S = k b k b k b h c + h d 0 0 k b k b + k 11 k b h c + h d + k 12 k 13 2 k 13 h f + k 14 k b h c + h d k b h c + h d + k 21 k b h c + h d 2 + k 22 k 23 2 k 23 h f + k 24 0 k 31 k 32 k 33 2 k 33 h f + k 34 0 2 k 31 h f + k 41 2 k 32 h f + k 42 2 k 33 h f + k 43 4 k 33 h f 2 + 2 k 34 h f + 2 k 43 h f + k 44
K F ω = 0 0 0 0 0 0 0 0 0 0 0 0 0 0 0 0 0 0 k xx + i d xx k xry + i d x r y 0 0 0 k x r y + i d x r y k r y r y + i d r y r y
C S = 2 ξ K S
M = m d 0 0 0 0 0 m c + m p 2 m c h c 2 0 0 0 m c h c 2 m c h c 2 4 0 0 0 0 0 m p 2 + m f m p h f + m f h f 0 0 0 m p h f + m f h f 2 m p h f 2 + m f h f 2
R = 1 1 0 1 0 T
The natural frequency of the system can be estimated based on the Frequency Response Function (FRF). This can be obtained by evaluating the amplitude of U ¯ under unit harmonic excitations with different frequencies. The peaks of the FRFs of the components of U ¯ allow us to identify the fundamental frequency of the SFS system.

3. Soil–Foundation System Impedance Functions

This section illustrates the impedance functions of the soil–foundation system obtained following the modelling approach described in the previous section for four different embedded depths and various scour scenarios. The following values of the ratio of the embedded depth (2df) over the foundation width (2bf) are considered: (i) df/bf = 0, (ii) df/bf = 0.3, (iii) df/bf = 0.7, and (iv) df/bf = 1.0. The scour hole scenarios are based on a triangular shape, illustrated in Figure 3 and Figure 6. They are hereafter labelled as (i) “NS”, i.e., no scour, (ii) “TS1/4”, i.e., one-fourth of the width of the foundation scoured, (iii) “TS3/8”, i.e., three-eighths of the width of the foundation scoured, and (iv) “TS1/2”, i.e., half the width of the foundation scoured. The impedance functions are expressed in non-dimensional form as a function of the non-dimensional frequency a0 = ωbf/Vs, where ω is the circular frequency of the excitation, and Vs is the soil shear wave velocity.
Figure 7, Figure 8, Figure 9 and Figure 10 illustrate the variation in the real and imaginary parts of the non-dimensional impedance functions as a function of the non-dimensional frequency a0 for each embedded depth and scour scenario considered. Figure 11, Figure 12, Figure 13 and Figure 14 provide an alternative comparison of the impedance functions where the effect of the embedded depth is highlighted.
In general, in the case of zero embedment (Figure 7), both the real and the imaginary parts of the impedance functions decrease when increasing the scour width. Only the real and imaginary parts of k x r y and d x r y , namely the components expressing the coupling between the rotational and translational response, do not follow this trend, since they increase with scour, and particularly for the real component ( k x r y ) and for high values of the dimensionless frequency a0. The sign difference of the k x r y between the no scoured and scour cases for high values of a0 implies that when the no scoured foundation moves laterally, it tends to rotate in a counterclockwise direction, while the opposite occurs for the scoured foundations. The plots of Figure 7 for the case of zero embedment are very similar to those reported in [24], with only some differences in values due to the higher value of the Poisson ratio considered in this study (0.4 instead of 0.25). As a result of this, higher values are obtained for the real part of the impedance functions k x x and k r y r y in this study.
With regards to the cases with an embedded depth higher than zero, which are not considered in [24], in general there is also a significant reduction in the absolute terms of the real and imaginary parts of the impedance functions for increasing levels of scour width/foundation width ratio. An exception is the translational component k x x for the case corresponding to df/bf = 0.3, which increases with increasing scour width and depth for dimensionless frequencies higher than 1.9. That means that the lateral displacement of a foundation with a low embedded depth on a soft soil with a high excitation frequency is more significant in the case of no scour than in the case of scour. Furthermore, there is a dramatic decrease in the terms k x r y and d x r y of the scour cases for the various embedded depths with increasing a0 compared to the no-scour cases. This can be explained by the fact that the scoured foundation tends to behave as a foundation with no embedment due to the removal of the lateral soil contribution. A minor effect of the embedment level on the impedance functions of the scour cases can be observed in Figure 12, Figure 13 and Figure 14. In more detail, the impedance functions of the system and their sensitivity to scour are significantly affected by the embedment depth. However, when increasing the level of embedment from df/bf = 0.3 to 1, the results are only mildly affected, leading to lower values of the components k x r y and d x r y and higher values of the components k r y r y and d r y r y . It is noteworthy that the scour hole geometry changes significantly with the embedment depth (Figure 3 and Figure 6).

4. Dynamic Behaviour of SFS Model

This section shows the results of a parametric study in which the previously derived impedance functions are used to evaluate the effect of scour on the dynamic response of the considered SFS system for various foundation embedment depths and various geometrical, inertia, and mechanical properties of the superstructure. The analysis expands the results shown in [24], where a simplified three-degrees-of-freedom SFS model was considered for the case of a foundation with no embedment. Similarly to [24], the Buckingham theorem [31] is applied to reduce the number of parameters that control the natural frequency ω ~ of the SFS system shown in Figure 5. Specifically, ω ~ can be expressed as a function of 14 parameters describing the superstructure, foundation, and soil properties, with three reference dimensions, namely length [L], time [T], and mass [M] (Table 1):
ω ~ = f ω 0 ,   h p ,   h c ,   h d ,   h f ,   m p ,   m c ,   m d ,   m f ,   b f ,   ρ ,   V s ,   ν ,   k b
The fixed-base frequency of the superstructure, ω 0 , is controlled by the following parameters:
ω 0 = f E ,   I ,   h p ,   h c ,   h d ,   m p ,   m c ,   m d ,   k b
According to the Buckingham theorem, the number of the dimensionless Π parameters is equal to 15 − 3 = 12 for the case of a foundation with no scour and no embedded depth. Two more parameters must be considered to account for the scour and embedded depth. The Π parameters obtained by choosing the variables bf, ρ, and Vs as the recurring set can be expressed as follows:
Π ω 0     Π h       Π h c       Π h d       Π h f       Π m p       Π m c       Π m d       Π m f       Π ω 0       Π d f       Π s       Π k       ν
It is noteworthy that the number of Π parameters is significantly increased compared to in [24]. This is the result of the more complex superstructure model and also the consideration of the embedment depth of the foundation. In order to reduce the number of parameters to be varied in the study, some simplifying assumptions are introduced. The values of the parameters Π h , Π h c , Π h d , and Π h f are assumed to be fixed, and the bearings are assumed to restrain the relative motion between the top of the pier and the deck ( Π k → +∞). Furthermore, the width and depth of the pier cap are assumed as bc = 2bf and lc = d, respectively, while the width and the depth of the foundation are assumed to be equal. The ratio of the concrete density to soil density is assumed to be ρ c / ρ = 1.5 . Table 2 reports the values of the Π parameters considered in the parametric analysis. After introducing the above simplifying assumptions, the non-dimensional parameters that are varied in the parametric study are Π h , Π m p , Π m c , Π m f , Π ω 0 , Π d f , and Π s . The parameter Π ω 0 varies from 0 to 4, whereas the parameter Πh is assumed equal to either 1 or 5 in order to compare the behaviour of tall and short piers. Once a value is chosen for Π h , the values of Π m p , Π m c , and Π m f are also fixed. Thus, the only parameter that is varied continuously in the analysis is Π ω 0 .
Figure 15 shows the variation in Π ω for increasing values of Π ω 0 corresponding to the four scour case scenarios investigated for the different values of Π d f and Π h considered. In general, the reduction in the vibration frequency of the SFS system due to scour is significantly different between the non-embedded and embedded scenarios, and particularly for taller piers.
The effect of the embedment depth Π d f is generally low, with the exception of the case corresponding to Π s = 0.5 and Π h = 5, where an increase in the embedment depth leads to an increase in the effect of scour in terms of fundamental frequency reduction.
On the other hand, both Π ω 0 and Π h have a significant impact on the dynamic behaviour of the SFS system, and increasing Π ω 0 and Π h result in a reduction in the ratio of the natural frequency of the system due to scour. In other words, the taller the structure or the softer the soil, the higher the reduction in the natural frequency ratio due to scour. It is also interesting to observe that the reduction in natural frequency due to scour tends to approach an asymptotic value for high values of Π ω 0 .
In order to better highlight the effect of scour on the SFS system, Figure 16 illustrates the ratio of the natural frequency of the system with and without scour for increasing values of Π s . The natural frequency ratio decreases almost linearly for increasing scour levels, and taller structures are found to be slightly more sensitive to scour effects. The variation in the frequency ratio with scour for different values of Π ω 0 above 1 tends to follow a single master curve. Thus, a self-similar behaviour is observed for low values of shear wave velocity, for rigid superstructures, and for large foundations. Higher sensitivity to scour is observed for the case of an embedded foundation corresponding to a foundation resting on the surface.
The results obtained for the case of zero embedment depth are quite similar to those obtained in [24] with a simpler superstructure system characterised by a single degree of freedom. It must be mentioned that the value of the Poisson’s ratio of the soil in this study (ν = 0.4) is different from the one considered in [24] (ν = 0.25), whereas the term Π h in this study is dependent on the pier height (hp) compared to the one in [24], which is dependent on the total height of the SFS system. However, these differences have a negligible impact on the results.

5. Seismic Response of SFS Systems Under Scour Hazard

In this section, the dynamic behaviour and the seismic performance of representative bridge piers with shallow foundations are investigated under various scour and embedded depth scenarios. Two different case studies are considered, corresponding to the SFS system shown in Figure 5, and differing only for the pier height. Table 3 reports the values of the parameters of the two investigated SFS systems, and Figure 17 shows the variation in the natural frequency of vibration for increasing levels of scour. The influence of the soil properties on the systems exposed to scour is also investigated, with three different values of the shear wave velocity considered, Vs = 300, 500, and 700 (m/s). As expected, the tall pier has a lower natural frequency of vibration compared to the short pier. Moreover, there is an almost linear decrease in the natural frequency of the SFS systems for increasing scour levels, and increasing the embedded depth increases the natural frequency and the sensitivity to scour only slightly. The seismic behaviour of the two SFS systems is analysed by performing time history analyses under seven different ground motion records selected with the Rexel 2.6.1 software [32], whose properties are reported in Table 4. The ground motions are characterised by an epicentral distance 25 < R < 37, a magnitude 5.5 < M < 6.3, and a shear wave velocity 360 m/s < Vs < 760 m/s. The scaled records were chosen so that the average acceleration elastic response spectrum matches the elastic response spectrum provided by Eurocode 8 [33] for soil class C and ag = 0.19 g. Figure 18a,b illustrate the pseudo-acceleration and displacement response spectrum obtained for the single records for a 5% damping ratio together with the average spectrum and the Eurocode 8 spectrum.
Table 5, Table 6, Table 7, Table 8, Table 9 and Table 10 report the average peak seismic response of the SFS systems considering the seven ground motions for all the abovementioned scour and shear wave velocity scenarios. In addition to the deck displacement and the base foundation displacement and rotation, the contribution of the pier flexure ( u p f = u d u f φ f h t o t a l ) is reported. In general, the peak deck displacement of the SFS systems increases when increasing the values of scour width, and so does the contribution of the base rotation, whereas the contribution of the base displacement and the pier flexure does not change significantly. The contribution of the base rotation in the presence of scour is more significant for the short pier than for the tall pier. When increasing the foundation embedment level, the peak deck displacement decreases in the case of no scour, whereas in the case of scour, it is not possible to identify a clear trend. The effects of scour, in terms of peak deck displacement and the contribution of the foundation rotation, are more significant for low values of Vs.
Figure 19 illustrates the seismic response of the two investigated SFS systems under various scour and embedment conditions for Vs = 500 m/s and for the ground motion recorded at Cubuklu. In particular, the time histories of the total displacement of the deck ( u d ), the displacement of the foundation ( u f ), and the contribution of the rotation of the foundation ( φ f h t o t a l ) are compared to each other in order to highlight the effect of soil–structure interaction on the response. It can be observed that the tall pier is characterised by significantly higher deck displacements, and a lower contribution to the response from soil–structure interaction, compared to the short pier. The peak deck displacement increases with increasing scour levels in the case of the short pier, whereas it does not increase significantly in the case of the tall pier. The general increase in deck displacement due to scour can be attributed to the period elongation (see Figure 18b), which results in an increase in seismic displacement demand.
The contribution of the foundation rotation to the deck displacement response increases when increasing the scour level, as expected. The rest of this section investigates, more in depth, the effect of scour on the seismic response of the two piers and on the contribution of the various degrees of freedom to the deck displacement.
Figure 20 shows the ratio of the displacement due to the rotation of the foundation to the total displacement of the two investigated SFS systems for increasing scour widths and various embedded depths and shear wave velocities. The ratio increases almost linearly for increasing scour widths, whereas it reduces significantly for increasing values of shear wave velocity (i.e., stiffer soil). Moreover, the ratio is higher for the shorter pier, as already discussed above.
Figure 21 shows the contribution of the foundation horizontal displacement to the total displacement of the two SFS systems. As observed for the rocking, this contribution is higher for the short pier. The displacement ratio decreases linearly with increasing scour width and increasing values of Vs. However, it is worth mentioning that the contribution of the foundation displacement ( u f ) to the overall deck displacement ( u d ) is negligible. Figure 22 illustrates the contribution of the flexural displacement of the pier ( u p f ) to the deck displacement, u d . As expected, the ratio is higher for the taller pier, and it decreases almost linearly for increasing scour widths and increases for increasing values of Vs.
It is also interesting to observe that with the embedded depth Π d f increasing from 0 to 0.3, there is a dramatic reduction in the rocking phenomenon, whereas for values of Π d f increasing from 0.3 to 1, there is not a significant change. Thus, the rocking phenomenon is reduced dramatically by having an embedded foundation, with a minor role played by the depth of embedment. However, it must be mentioned that for the embedded cases ( Π d f   > 0) under severe scour, the higher the embedded depth, the more intense the rocking phenomenon.

6. Conclusions

This study investigated the effect of scour on the dynamic behaviour and seismic response of bridges with shallow foundations. A multiple-degrees-of-freedom soil–foundation-structure (SFS) system, which is representative of the transverse response of continuous and simply supported girder bridges, was analysed under various scour scenarios by considering different embedded depths of the foundation and various soil and superstructure conditions. Initially, the frequency-dependent impedance functions of a rigid strip foundation resting on an elastic soil domain were numerically evaluated by performing analyses in Abaqus for different scour and embedded depth conditions. In general, increasing the scour width results in a significant reduction in the absolute values of the impedance functions for the case of no embedment. As for embedded cases, even though the presence of scour results in a dramatic reduction in the absolute values of the impedance functions, increasing scour width decreases them only slightly. Furthermore, the embedment depth did not have a significant effect on the impedance functions for any of the scour scenarios, except for those related to the rotational behaviour and the coupling between the translational and rotational behaviour of the foundation under severe scour conditions.
Subsequently, the dynamic behaviour of the SFS system was investigated in an extensive parametric study considering wide ranges of values of the geometrical, mechanical, and inertia properties of the soil and superstructure. The following results can be drawn:
There is an almost linear reduction in the vibration frequency of the SFS system with increasing length of the foundation base undermined by scour.
Higher sensitivity to scour is observed for the case of an embedded foundation corresponding to a foundation resting on the surface. Increasing the embedded depth affects the results only slightly and yields a significant reduction in the vibration frequency for taller structures under extreme scour cases.
In general, the reduction in the natural frequency of the SFS system due to scour is more significant for tall structures with soft soils.
The variation with scour in the ratio of the natural frequency of an SFS system tends towards a single master curve for low values of shear wave velocity, for rigid superstructures, or for large foundations.
Lastly, the seismic performance of two case studies with the same foundation and different pier heights was investigated by carrying out time history analyses under seven ground motion records and measuring the average peak seismic response of the components of the system. Based on the obtained results, the following conclusions are drawn:
In general, the total displacement of the SFS system increases with increasing scour width and decreasing embedded depth. In particular, this increase is more significant for SFS systems with softer soils and short piers, for which the total displacement doubles for a horizontal penetration of scour beneath the foundation equal to half the foundation length. In the case of tall piers, the increase in displacement due to scour is not significant.
The embedded depth of the foundation only slightly affects the deck displacement and the sensitivity of the response to scour, when the results are presented considering the normalised horizontal penetration of scour beneath the foundation.
The relative contribution of the rocking of the foundation to the deck displacement is more significant for the shorter pier, and it can be of the order of 35% for the case of soft soils. Scour significantly increases this contribution, which doubles for a normalised horizontal penetration of scour beneath the foundation of 50%. The response of the taller pier is dominated by pier bending, with the contribution of rocking of the foundation being less than 20% for all the cases investigated. In the case of significant scour levels, the contribution to rocking can reach values of the order of 40%.
The rocking phenomenon is noticeably reduced for embedded foundations. The embedment level affects the seismic response of the system only slightly.
The contribution of pier flexure to the top displacement, which is higher for the taller pier and stiffer soil, reduces with increasing levels of scour. This reduction is more significant for shorter piers and softer soils, due to the increased contribution of rocking.
The results of this study can be used to inform the development of structural health monitoring techniques for bridges with shallow foundations in flood-prone and seismic active areas. They also provide a quantification of the impact of scour on the seismic response of bridges with shallow foundations for different combinations of the mechanical and geometrical properties of the foundation and pier. The adopted model allows the investigation of a wide range of scenarios. However, it is worth recognising that in real case studies, nonlinear phenomena may develop on both the soil and structure side. Thus, future studies should investigate the problem by also taking into account the nonlinearity of the soil and the superstructure.

Author Contributions

Conceptualisation, E.T., S.C. and F.D.; methodology, E.T., S.C., F.G. and F.D.; software, C.A.; validation, E.T. and S.C.; investigation, C.A.; data curation, C.A.; writing—original draft preparation, C.A. and E.T.; writing—review and editing, S.C. and F.D.; visualisation, C.A. and S.C.; supervision, E.T., S.C., F.G. and F.D.; funding acquisition, E.T. All authors have read and agreed to the published version of the manuscript.

Funding

This study was conducted within the framework of the Transnational Access Project ‘Soil-Frame Interaction Analysis through Large-Scale Tests and Advanced Numerical Finite Element Modeling’, funded by the European project ‘Seismology and Earthquake Engineering Research Infrastructure Alliance for Europe’—SERA-TA, H2020 (Grant Agreement 730900).

Data Availability Statement

Data available upon request.

Conflicts of Interest

The authors declare no conflicts of interest. The funders had no role in the design of the study; in the collection, analyses, or interpretation of data; in the writing of the manuscript; or in the decision to publish the results.

Abbreviations

The following abbreviations are used in this manuscript:
SFSsoil–foundation–structure system
MDOFmultiple-degrees-of-freedom system
FEfinite element
dofsdegrees of freedom
FRFFrequency Response Function

References

  1. Shirole, A.M.; Holt, R.C. Planning for a comprehensive bridge safety assurance program. Transp. Res. Rec. 1991, 1290, 39–50. [Google Scholar]
  2. Briaud, J.L.; Ting, C.F.K.; Chen, H.C.; Gudavalli, R.; Perugu, S.; Wei, G. SRICOS: Prediction of scour rate in cohesive soils at bridge piers. J. Geotech. Geoenvironmental Eng. 1999, 125, 237–246. [Google Scholar] [CrossRef]
  3. Wardhana, K.; Hadipriono, F.C. Analysis of recent failures in the United States. J. Perform. Constr. Facil. 2003, 17, 144–150. [Google Scholar] [CrossRef]
  4. Yashinsky, M.; Moehle, J.; Eberhard, M. Earthquake damage to bridges. In Bridge Engineering Handbook, 2nd ed.; Seismic Design; CRC Press: Boca Raton, FL, USA, 2014; pp. 53–97. [Google Scholar]
  5. Khan, Z.; Amanat, K. Riverbed Scouring Effect in Bridge Pile Foundation during Earthquake. In Advances in Soil Dynamics and Foundation Engineering; ASCE Library: Reston, Virginia, 2014. [Google Scholar] [CrossRef]
  6. Wang, Z.; Song, W.; Li, T. Combined fragility surface analysis of earthquake and scour hazards for bridge. In Proceedings of the 15th World Conference on Earthquake Engineering, Lisbon, Portugal, 24–28 September 2012. [Google Scholar]
  7. Banerjee, S.; Prasad, G.G. Seismic Risk Assessment of Reinforced Concrete Bridges in Flood-Prone Regions. Struct. Infrastruct. Eng. 2013, 9, 952–968. [Google Scholar] [CrossRef]
  8. Kirby, A.M.; Roca, M.; Kitchen, A.; Escarameia, M.; Chesterto, O.J. Manual on Scour at Bridges and Other Hydraulic Structures, 2nd ed.; CIRIA742; Construction Industry Research and Information Association (CIRIA): London, UK, 2015. [Google Scholar]
  9. Pizarro, A.; Manfeda, S.; Tubaldi, E. The Science Behind Scour at Bridge Foundations: A Review. Water 2020, 12, 374. [Google Scholar] [CrossRef]
  10. Wang, Z.; Dueñas-Osorio, L.; Padgett, J.E. Influence of scour effects on the seismic response of reinforced concrete bridges. Eng. Struct. 2014, 76, 212–214. [Google Scholar] [CrossRef]
  11. Prasad, G.G.; Banerjee, S. The Impact of Flood-Induced Scour on Seismic Fragility Characteristics of Bridges. J. Earthq. Eng. 2013, 17, 803–828. [Google Scholar] [CrossRef]
  12. Yilmaz, T.; Banerjee, S.; Johnson, P.A. Performance of Two Real-Life California Bridges Under Regional Natural Hazards. J. Bridge Eng. 2015, 21, 04015063. [Google Scholar] [CrossRef]
  13. Guo, X.; Wu, Y.; Guo, Y. Time-dependent seismic fragility analysis of bridge systems under scour hazard and earthquake loads. Eng. Struct. 2016, 121, 52–60. [Google Scholar] [CrossRef]
  14. Song, S.T.; Wang, C.Y.; Huang, W.H. Earthquake damage potential and critical scour depth of bridges exposed to flood and seismic hazards under lateral seismic loads. Earthq. Eng. Eng. Vib. 2015, 14, 579–594. [Google Scholar] [CrossRef]
  15. Fioklou, A.; Alipour, A. Significance of non-uniform scour on the seismic performance of bridges. Struct. Infrastruct. Eng. 2019, 15, 822–836. [Google Scholar] [CrossRef]
  16. Han, Q.; Wen, J.; Du, X.; Huang, C. Seismic Response of Single Pylon Cable-Stayed Bridge Under Scour Effect. J. Bridge Eng. 2019, 24, 05019007. [Google Scholar] [CrossRef]
  17. Zaky, A.; Özcan, O.; Avşar, Ö. Seismic failure analysis of concrete bridges exposed to scour. Eng. Fail. Anal. 2020, 115, 104617. [Google Scholar] [CrossRef]
  18. Foti, S.; Aimar, M.; Ciancimino, A.; Giordano, L. Influence of scour of foundations on the seismic performance of bridges. In Proceedings of the SECED 2023 Conference, Earthquake Engineering and Dynamics of a Sustainable Future, Cambridge, UK, 14–15 September 2023. [Google Scholar]
  19. Chang, K.C.; Sung, Y.C.; Liu, K.Y.; Wang, P.H.; Lee, Z.K.; Lee, L.S.; Witarto. Seismic performance of an existing bridge with scoured caisson foundation. Earthq. Eng. Eng. Vib. 2014, 13, 151–165. [Google Scholar]
  20. Ciancimino, A.; Jones, L.; Sakellariadis, L.; Anastasopoulos, I.; Foti, S. Experimental assessment of the performance of a bridge pier subjected to flood-induced foundation scour. Géotechnique 2022, 72, 998–1015. [Google Scholar]
  21. Wang, X.; Alipour, A.; Wang, J.; Shang, Y.; Ye, A. Seismic resonance behavior of soil-pile-structure systems with scour effects: Shake-table tests and numerical analyses. Ocean Eng. 2023, 283, 115052. [Google Scholar]
  22. Guo, X. Seismic Vulnerability Analysis of Scoured Bridge Systems. Ph.D. Thesis, University of Missouri-Kansas City, Kansas City, MI, USA, 2014. [Google Scholar]
  23. Malekjafarian, A.; Kim, C.W.; OBrien, E.J.; Prendergast, L.J.; Fitzgerald, P.C.; Nakajima, S. Experimental demonstration of a mode shape-based scour-monitoring method for multispan bridges with shallow foundations. J. Bridge Eng. 2020, 25, 04020050. [Google Scholar]
  24. Antonopoulos, C.; Tubaldi, E.; Carbonari, S.; Gara, F.; Dezi, F. Dynamic Behaviour of Soil-Foundation-Structure Systems Subjected to Scour. Soil Dyn. Earthq. Eng. 2022, 152, 106969. [Google Scholar] [CrossRef]
  25. Tubaldi, E.; Antonopoulos, C.; Mitoulis, S.A.; Argyroudis, S.; Gara, F.; Ragni, L.; Carbonari, S.; Dezi, F.; Vratsikidis, A.; Pitilakis, D.; et al. Field tests and numerical analysis of the effects of scour on a full-scale soil-foundation structural system. J. Civil. Struct. Health Monit. 2023, 13, 1461–1481. [Google Scholar] [CrossRef]
  26. Ciampoli, M.; Pinto, P.E. Effects of soil-structure interaction on inelastic seismic response of bridge piers. J. Struct. Eng. 1995, 121, 806–814. [Google Scholar]
  27. Wallace, J.W. Building Vulnerability Studies: Modeling and Evaluation of Tilt-Up and Steel Reinforced Concrete Buildings (No. 13); Pacific Earthquake Engineering Research Center: Berkeley, CA, USA, 1999. [Google Scholar]
  28. Abaqus, V. 6.14 Documentation; Dassault Systemes Simulia Corporation: Providence, RI, USA, 2014. [Google Scholar]
  29. Hryniewicz, Z. Dynamic response of a rigid strip on an elastic half-space. Comput. Methods Appl. Mech. Eng. 1981, 25, 355–364. [Google Scholar] [CrossRef]
  30. Tubaldi, E.; White, C.J.; Patelli, E.; Mitoulis, S.; De Almeida, G.; Brown, J.; Cranston, M.; Hardman, M.; Koursari, E.; Lamb, R.; et al. Invited Perspectives: Challenges and Future Directions in Improving Bridge Flood Resilience; Natural Hazards and Earth System Sciences Discussions: Göttingen, Germany, 2021; pp. 1–21. [Google Scholar]
  31. Misic, T.; Najdanovic-Lukic, M.; Nesic, L. Dimensional analysis in physics and the Buckingham theorem. Eur. J. Phys. 2010, 31, 893–906. [Google Scholar] [CrossRef]
  32. Iervolino, I.; Galasso, C.; Cosenza, E. REXEL: Computer aided record selection for code-based seismic structural analysis. Bull. Earthq. Eng. 2009, 8, 339–362. [Google Scholar] [CrossRef]
  33. European Committee for Standardization. Eurocode 8: Design of Structures for Earthquake Resistance—Part 1: General Rules, Seismic Actions and Rules for Buildings; European Committee for Standardization: Brussels, Belgium, 2005. [Google Scholar]
Figure 1. (a) Forces and (b) displacements of the strip foundation.
Infrastructures 10 00075 g001
Figure 2. Rigid body constraint used to simulate the massless rigid strip foundation for the case of (a) no embedment and (b) embedded foundation.
Infrastructures 10 00075 g002
Figure 3. Geometry of the considered triangular scour hole for a (a) non-embedded and (b) embedded foundation.
Infrastructures 10 00075 g003
Figure 4. (a) Considered bridge pier; (b) geometry of the system components.
Infrastructures 10 00075 g004
Figure 5. SFS system modelling.
Infrastructures 10 00075 g005
Figure 6. Scour scenarios investigated for different embedded depths: (a) df/bf = 0, (b) df/bf = 0.3, (c) df/bf = 0.7, and (d) df/bf = 1.0.
Infrastructures 10 00075 g006
Figure 7. Comparisons of impedances for embedded depth df/bf = 0 and for different scour scenarios.
Infrastructures 10 00075 g007
Figure 8. Comparisons of impedances for embedded depth df/bf = 0.3 and for different scour scenarios.
Infrastructures 10 00075 g008
Figure 9. Comparisons of impedances for embedded depth df/bf = 0.7 and for different scour scenarios.
Infrastructures 10 00075 g009
Figure 10. Comparisons of impedances for embedded depth df/bf = 1.0 and for different scour scenarios.
Infrastructures 10 00075 g010
Figure 11. Comparisons of impedances for the NS case and for different embedded depths.
Infrastructures 10 00075 g011
Figure 12. Comparisons of impedances for the TS1/4 case and for different embedded depths.
Infrastructures 10 00075 g012
Figure 13. Comparisons of impedances for the TS3/8 case and for different embedded depths.
Infrastructures 10 00075 g013
Figure 14. Comparisons of impedances for the TS1/2 case and for different embedded depths.
Infrastructures 10 00075 g014
Figure 15. Variation in Πω for increasing values of Π ω 0 for various values of Π d f and Π h .
Infrastructures 10 00075 g015
Figure 16. Ratio of the natural frequency of the system with and without scour for various levels of Π d f , Π ω 0 , and Π h .
Infrastructures 10 00075 g016
Figure 17. Vibration frequency estimates of the two investigated SFS systems for various scour and embedded depth scenarios and (a) Vs = 300 m/s, (b) Vs = 500 m/s, and (c) Vs = 700 m/s.
Infrastructures 10 00075 g017
Figure 18. (a) Acceleration and (b) displacement response spectra of the ground motion records and corresponding scale factors (SFs).
Infrastructures 10 00075 g018
Figure 19. Seismic response of the examined SFS systems under Cubuklu earthquake for h p = 5 ,   15 m, Π d f = 1.0 , and Vs= 500 m/s and various scour and embedded depth scenarios.
Infrastructures 10 00075 g019
Figure 20. Contribution of the rotational foundation displacement ( φ f h t o t a l ) to the total deck displacement ( u d ) of the SFS systems for (a) Vs = 300 m/s, (b) Vs = 500 m/s, and (c) Vs = 700 m/s.
Infrastructures 10 00075 g020
Figure 21. Contribution of the foundation displacement ( u f ) to the total deck displacement ( u d ) of the SFS systems for (a) Vs = 300 m/s, (b) Vs = 500 m/s, and (c) Vs = 700 m/s.
Infrastructures 10 00075 g021
Figure 22. Contribution of u p f = u d u f φ f h t o t a l to the total deck displacement ( u d ) of the SFS systems for (a) Vs = 300 m/s, (b) Vs = 500 m/s, and (c) Vs = 700 m/s.
Infrastructures 10 00075 g022
Table 1. Units and dimensions of the involved parameters.
SymbolDefinitionUnitsDimensions
ω ~ natural frequency of the SFS systemrad/s[T−1]
ω 0 natural frequency of the fixed-base systemrad/s[T−1]
kbisolator stiffness on the pierkN/m[MT−2]
h p pier heightm[L]
h c pier cap heightm[L]
h d 65% of the deck heightm[L]
h f half height of the foundationm[L]
m p pier masst[M]
m c pier cap masst[M]
m d deck masst[M]
m f foundation masst[M]
d f half embedment depthm[L]
s half width of the scour–foundation interfacem[L]
b f half width of the foundationm[L]
ρ soil densityt/m3[ML−3]
V s shear wave velocitym/s[LT−1]
ν Poisson’s ratio--
Table 2. Assumed values and expressions of the investigated non-dimensional parameters.
Values of Non-Dimensional Parameters
Π k    
Π h = 1 ,   5
Π h c = 0.5
Π h d = 0.5
Π h f = 0.3
Π m p = m p ρ b f 3 = A h p ρ c ρ b f 3 = ρ c ρ π d 2 2 h p b f 3 = 1.5 π 4 d 2 b f 2 Π h
Π m c = m c m p = 2 b f   d   h c A h p = 2 b f   d   h c π d 2 2 h p = 8 b f π d Π h c Π h
Π m d = 4.7
Π m f = m f m p = 4 b f 2   2 h f A h p = 8 b f 2 h f π d 2 2 h p = 32 b f 2 π d 2 Π h f Π h
Π ω 0 = 0–4
Π d f = 0 ,   0.3 ,   0.7 ,   1
Π s = 0 ,   0.25 ,   0.375 ,   0.5
ν = 0.4
Table 3. Geometry and properties of the examined SFS systems.
Geometry/PropertyValue
Elastic modulus, E35 GPa
Pier diameter, d2.1 m
Pier height, hp5, 15 (m)
Foundation 2bf × 2bf × 2hf7 × 7 × 2.1 (m)
Pier cap 2bf × hc × d7 × 1.75 × 2.1 (m)
Isolator stiffness, kb+∞
Deck mass, md610 ton
65% of the deck height, hd1.75 m
Soil density, ρ1600 kg/m3
Shear wave velocity, Vs300, 500, 700 (m/s)
Table 4. Details of the picked ground motions via Rexel [32].
EarthquakeStation IDDateMagnitude MwEpicentral
Distance R (km)
AlkionST12125 February 19816.325
Ishakli (aftershock)ST8563 February 20025.835
Izmit (aftershock)ST327313 September 19995.825
Izmit (aftershock)ST257111 November 19995.637
CubukluST6520 April 19885.534
AdanaST54927 June 19986.330
Umbria Marche (aftershock)ST22314 October 19975.629
Table 5. Average peak response values for SFS system with h p = 5 m and Vs = 300 m/s for different scour and embedment scenarios.
Π d f = 0 Π d f = 0.3
Π s = 0 Π s = 0.25 Π s = 0.375 Π s = 0.5 Π s = 0 Π s = 0.25 Π s = 0.375 Π s = 0.5
u d 23.4834.9137.5640.8419.0932.7235.8042.28
u f 1.621.891.721.321.481.901.901.95
φ f h t o t a l 8.3117.4522.2228.404.9414.9019.1426.52
u p f 13.7015.7213.7911.2412.7816.1314.8814.01
Π d f  = 0.7 Π d f  = 1.0
Π s  = 0 Π s  = 0.25 Π s  = 0.375 Π s  = 0.5 Π s  = 0 Π s  = 0.25 Π s  = 0.375 Π s  = 0.5
u d 18.6432.6935.8743.0118.3132.8536.0142.06
u f 1.311.761.811.631.211.741.781.34
φ f h t o t a l 4.8114.9219.2228.104.7514.9919.3028.42
u p f 12.6316.1814.9713.5312.4616.2815.0412.44
Table 6. Average peak response values for SFS system for h p = 5 m and Vs = 500 m/s for different scour and embedment scenarios.
Π d f = 0 Π d f = 0.3
Π s = 0 Π s = 0.25 Π s = 0.375 Π s = 0.5 Π s = 0 Π s = 0.25 Π s = 0.375 Π s = 0.5
u d 14.9718.2520.4330.5513.8216.8619.0623.84
u f 0.550.590.590.710.540.560.620.74
φ f h t o t a l 2.585.047.2714.281.604.075.839.41
u p f 11.8812.6612.6215.6411.7212.2712.6413.74
Π d f = 0.7 Π d f = 1.0
Π s  = 0 Π s  = 0.25 Π s  = 0.375 Π s  = 0.5 Π s  = 0 Π s  = 0.25 Π s  = 0.375 Π s  = 0.5
u d 13.6916.8219.0525.6613.6016.8319.0827.90
u f 0.480.530.590.680.450.520.580.63
φ f h t o t a l 1.574.075.8410.751.554.075.8512.37
u p f 11.6712.2612.6714.2911.6312.2812.6914.96
Table 7. Average peak response values for SFS system for h p = 5 m and Vs = 700 m/s for different scour and embedment scenarios.
Π d f = 0 Π d f = 0.3
Π s = 0 Π s = 0.25 Π s = 0.375 Π s = 0.5 Π s = 0 Π s = 0.25 Π s = 0.375 Π s = 0.5
u d 13.4214.7816.4619.2712.7314.2715.3317.40
u f 0.290.300.300.310.290.300.320.36
φ f h t o t a l 1.302.443.696.020.812.012.874.42
u p f 11.8412.0712.5012.9611.6511.9812.1812.64
Π d f  = 0.7 Π d f  = 1.0
Π s  = 0 Π s  = 0.25 Π s  = 0.375 Π s  = 0.5 Π s  = 0 Π s  = 0.25 Π s  = 0.375 Π s  = 0.5
u d 12.6714.2515.3118.1412.6414.2515.3118.78
u f 0.260.280.300.320.250.270.300.29
φ f h t o t a l 0.792.012.874.950.782.012.875.49
u p f 11.6411.9812.1812.8911.6311.9912.1813.03
Table 8. Average peak response values for SFS system for h p = 15 m and Vs = 300 m/s for different scour and embedment scenarios.
Π d f = 0 Π d f = 0.3
Π s = 0 Π s = 0.25 Π s = 0.375 Π s = 0.5 Π s = 0 Π s = 0.25 Π s = 0.375 Π s = 0.5
u d 80.1889.65106.42114.5880.3582.8097.26104.10
u f 0.690.620.640.550.900.720.810.88
φ f h t o t a l 13.5824.5037.6453.218.7819.5129.1840.54
u p f 66.1364.7768.4961.3270.7662.7367.4462.97
Π d f  = 0.7 Π d f  = 1.0
Π s  = 0 Π s  = 0.25 Π s  = 0.375 Π s  = 0.5 Π s  = 0 Π s  = 0.25 Π s  = 0.375 Π s  = 0.5
u d 80.1582.7897.15102.3380.0382.7797.12108.60
u f 0.830.670.770.700.780.660.750.55
φ f h t o t a l 8.5819.5429.1542.248.5219.5429.1547.63
u p f 70.8262.7467.4059.6370.8262.7467.4060.72
Table 9. Average peak response values for SFS system for h p = 15 m and Vs = 500 m/s for different scour and embedment scenarios.
Π d f = 0 Π d f = 0.3
Π s = 0 Π s = 0.25 Π s = 0.375 Π s = 0.5 Π s = 0 Π s = 0.25 Π s = 0.375 Π s = 0.5
u d 71.3774.4474.3474.1970.2273.5074.8973.54
u f 0.270.230.200.180.330.280.290.30
φ f h t o t a l 4.898.9112.2517.642.987.3610.0613.75
u p f 66.2865.3962.0056.5266.9565.9364.6159.57
Π d f  = 0.7 Π d f  = 1.0
Π s  = 0 Π s  = 0.25 Π s  = 0.375 Π s  = 0.5 Π s  = 0 Π s  = 0.25 Π s  = 0.375 Π s  = 0.5
u d 70.1773.5074.8973.2470.1473.4974.8873.91
u f 0.300.260.270.240.280.250.270.18
φ f h t o t a l 2.917.3710.0614.862.887.3710.0716.23
u p f 66.9965.9364.6258.2467.0165.9364.6357.61
Table 10. Average peak response values for SFS system for h p = 15 m and Vs = 700 m/s for different scour and embedment scenarios.
Π d f = 0 Π d f = 0.3
Π s = 0 Π s = 0.25 Π s = 0.375 Π s = 0.5 Π s = 0 Π s = 0.25 Π s = 0.375 Π s = 0.5
u d 69.9171.1672.8374.9569.5670.6471.6873.84
u f 0.140.130.110.100.170.150.160.18
φ f h t o t a l 2.534.626.6710.291.543.795.277.76
u p f 67.2766.4666.1164.6467.8666.7366.2965.95
Π d f = 0.7 Π d f  = 1.0
Π s  = 0 Π s  = 0.25 Π s  = 0.375 Π s  = 0.5 Π s  = 0 Π s  = 0.25 Π s  = 0.375 Π s  = 0.5
u d 69.5470.6471.6774.3369.5470.6471.6774.72
u f 0.160.140.150.140.150.140.150.10
φ f h t o t a l 1.503.805.278.541.493.805.289.38
u p f 67.9066.7466.2965.7067.9266.7366.2965.30
Disclaimer/Publisher’s Note: The statements, opinions and data contained in all publications are solely those of the individual author(s) and contributor(s) and not of MDPI and/or the editor(s). MDPI and/or the editor(s) disclaim responsibility for any injury to people or property resulting from any ideas, methods, instructions or products referred to in the content.

