Article

A Study on the Direct Application of the Gaussian Kernel Smoothing Filter for Bridge Health Monitoring

1
Department of Civil Engineering, University of Kurdistan, Sanandaj 6617715175, Iran
2
Department of Applied Geology, Faculty of Earth Sciences, Kharazmi University, Tehran 1571914911, Iran
*
Author to whom correspondence should be addressed.
Infrastructures 2025, 10(3), 58; https://doi.org/10.3390/infrastructures10030058
Submission received: 22 January 2025 / Revised: 12 February 2025 / Accepted: 15 February 2025 / Published: 10 March 2025
(This article belongs to the Special Issue Structural Health Monitoring in Bridge Engineering)

Abstract

In this paper, the application of the Gaussian Kernel Smoothing Filter (GKSF) in the field of structural health monitoring (SHM) for bridges is explored. A baseline-free, GKSF-based method is developed to detect and localize structural damage in bridges subjected to truckloads. The study reveals that an adjusted GKSF can effectively smooth acceleration responses, where the smoothed response is dominated by the first natural frequency of the bridge. By employing a damage index (DI) based on the normalized energy of the smoothed acceleration signal, the method successfully identifies both the location and severity of structural damage in bridge structures. To validate the proposed approach, a simply supported bridge under a moving sprung mass is numerically modeled, and acceleration responses are obtained along the bridge’s length. The results indicate that the method is capable of accurately identifying the location and severity of structural damage, even in noisy environments. Notably, since the method does not require the determination or monitoring of dynamic modal parameters, it is classified as a baseline-free and rapid damage detection technique.

1. Introduction

The performance of bridges under traffic load is one of the most challenging issues in the field of urban infrastructure health monitoring. The early detection and identification of structural damage in bridges can help prevent future disasters and ensure their safe operation. As a result, this topic has garnered significant attention over the past few decades [1,2,3,4,5]. A practical approach to addressing this challenge involves recording the structural behavior of bridges under traffic loads using acceleration sensors installed at strategic locations along the bridge. Signal processing techniques are then applied to analyze the dynamic response and assess the structural performance of the bridge. This area of research (known as vibration-based bridge health monitoring) has been widely applied in various cases, such as high-speed railway bridges, traffic bridges, and harbor bridges, to develop systematic tools for damage detection. Among the most common methods in this field are transformer-based approaches [3,6,7,8,9,10], time-domain-based methods [5,11,12,13,14,15,16], and source separation-based techniques [4,17,18,19,20,21].
Transformers, such as wavelet transforms, are frequency-based methods commonly used to identify dynamic modal parameters or structural damage characteristics [3,6,7,8,22,23,24]. These methods serve as transformation tools, converting signal data between the time and frequency domains. In some cases, they can also track frequency shifts over time, making them highly effective for specific applications. However, it has been argued that the results of these approaches may be influenced by factors such as frequency content, wavelet structure, and whether the signals are stationary or non-stationary. Additionally, some researchers have noted that wavelet analysis may produce inaccurate results in noisy environments [9]. Furthermore, the impact of road irregularities, wheel dimensions, and velocity limitations can significantly limit the practical application of these methods in real-world projects [10].
In this context, accelerometers can capture the dynamic responses of structures in the form of time-history vibration data. As a result, time-domain-based methods are often considered a more suitable alternative, as they process recorded signals directly without the need for conversion between time and frequency domains. Among these methods, the random decrement technique (RDT) stands out as one of the most widely recognized. This technique can directly extract free vibration signals from measured data and has been successfully applied in numerous studies to detect bridge damage under various loads, including traffic loads [5,13]. The outputs of the random decrement technique can then serve as inputs for advanced methods such as empirical mode decomposition (EMD) or source separation techniques, which are used to further identify structural damage in bridges [14,15,25]. Additionally, an educational and systematic example of bridge health monitoring using the random decrement technique has been provided in [16]. Combining the use of RDT with an Artificial Neural Network was also experimentally reported in [26].
The source separation approach is capable of determining input signals from output responses. Two widely recognized techniques used to implement this approach are independent component analysis (ICA) and second-order blind identification (SOBI) [4,17,18,19]. It has been established that one of the key byproducts of this approach is the identification of structural dynamic modal properties. As a result, many researchers have utilized the source separation approach to monitor these identified dynamic modal properties and thereby locate structural damage in bridges [20,21,27,28].
Although various approaches and techniques for bridge health monitoring have been discussed above, the application of smoothing filters to locate structural damage in bridges remains a novel area that needs further investigation. This concept was first introduced numerically in [29], followed by experimental validation in [4]. In these initial studies, a moving average filter was employed to smooth acceleration signals and identify structural damage in bridges. Subsequently, the Savitzky–Golay smoothing filter (also known as the weighted moving average filter) was utilized to smooth acceleration signals and construct trend lines for bridge health monitoring [30,31]. This paper introduces the Gaussian Kernel Smoothing Filter (GKSF) to bridge health monitoring for the first time, proposing its use as a smoothing tool for acceleration signals to locate and quantify bridge damage, even in noisy environments. Additionally, a damage index (DI) based on normalized energy is proposed to characterize the damage in the bridge structure. This energy-based DI is applied to identify damage without the need to determine or monitor dynamic modal characteristics. The proposed method enhances both the speed and accuracy of conventional approaches by combining signal-smoothing techniques with damage identification indices. To validate the method, a numerical model of a simply supported bridge subjected to a moving sprung mass is analyzed. The results are used to calibrate the filter and optimize its damage-locating capabilities. The proposed GKSF represents a cutting-edge tool for the engineering community, offering a robust solution for detecting damage in bridge structures.

2. GKSF Background

The Gaussian filter is a weighted averaging filter that smooths the signal. At each point of the signal, it calculates an average of the acceleration data around that point. Specifically, it assigns higher weights to acceleration data closer to the point of interest and lower weights to acceleration data farther away. This type of weighted averaging reduces sudden changes in the data, which are often caused by noise, while preserving the overall trend of the signal. Additionally, averaging methods are generally types of low-pass filters, which means they eliminate high frequencies. In many cases, these high frequencies are due to noise. In this paper, it is demonstrated that the Gaussian filter can be adjusted in such a way that noise and higher modes are removed, and the final smoothed signal predominantly contains the first mode of the bridge.
In signal processing, filters can be analyzed in both the time domain and the frequency domain. To understand the Gaussian Kernel Smoothing Filter (GKSF), it is essential to first examine the shape of the Gaussian distribution, as illustrated in Figure 1. In the frequency domain, a filter kernel that mimics the Gaussian distribution is referred to as a Gaussian filter. In the time domain, the Gaussian filter functions as a weighted averaging method, where the weights assigned to the data points are determined by the Gaussian distribution. Since the Gaussian filter is primarily recognized for its de-noising and smoothing capabilities, its performance is more effectively demonstrated in the time domain. The smoothing process involves calculating a weighted average, with even more emphasis placed on data points near the center of the averaging interval. As the filter kernel moves along the signal, the average value is calculated at the center of the kernel, based on the weight distribution of the data points within the kernel.
The equation of the one-dimensional Gaussian filter kernel, used in this paper, can be expressed as Equation (1).
y x = a π × e a x 2
in which a π represents the maximum amplitude of the Gaussian filter kernel.
In this article, the data are smoothed using a Gaussian kernel weighted moving average. Our first step was to apply the weighted moving average method to the data points as follows:
S s m o o s t h e d ( i ) = j = k k   w j S i + j   where   j = k k   w j = 1
where the S i is the value of input signal at time t = i and S s m o o t h e d ( i ) is the smoothed value at time t = i . However, w j are the weighting factors with a total sum of 1. To accomplish this, we will use the Gaussian function to construct the weighted factors.
f ( S i , σ ) = 1 2 π σ 2 e x p 1 2 S i σ 2
The parameter σ in the Gaussian function determines the curve’s width, and the function is practically zero for a value of S i exceeding 3.5 σ .
The primary objective of this paper is to propose a practical method for adjusting the Gaussian Kernel Smoothing Filter (GKSF) such that the smoothed signal retains only the first natural frequency of the bridge. By doing so, noise and higher natural frequencies are effectively removed from the bridge’s acceleration response. Since the Gaussian distribution primarily determines the weight values assigned to each data point, the total weights can be scaled without affecting the outcome. This means that the parameter a in Equation (1) is not critical and can be treated simply as a normalization factor for amplitude. For this reason, a is set to 1, and the only significant parameter in the GKSF that requires identification is the filter span. To determine the filter span, it is recommended to first identify the first natural frequency from the response and then set the filter span equal to the first natural period. For example, if the first natural frequency is 2.933 Hz, the optimal filter span would be 1 / 2.933 = 0.3409 s (i.e., the first natural period). The smoothed signal is then computed as the weighted average of the signal over this 0.3409 s interval, with the weights determined by the Gaussian distribution, namely, an observation at t = t i will be calculated based on the observations from t = t i f i l t e r s p a n 2 to t = t i + f i l t e r s p a n 2 . To ease the calculation for readers, the following MATLAB function was introduced to extract the first natural mode of a signal using the Gaussian filter.
S s m o o t h e d = s m o o t h d a t a ( S , ' g a u s s i a n ' , S p a n , ' S a m p l e P o i n t s ' , T ) ;
In Equation (4), ‘gaussian’ and ‘SamplePoints’ should not be changed. The S p a n is also set according to the first natural period. Moreover, the T denotes the time vector that has the same sampling frequency and length as acceleration responses. For example, if the length of the acceleration response is given as 10 s, a time vector must be created with a length of 10 s, where the number of data per second is the same. The S represents the input signal, which corresponds to the bridge acceleration signal in this paper. In addition, the S s m o o t h e d indicates the smoothed acceleration signal obtained using the Gaussian filter.

3. Numerical Model of Bridge with Simple Supports and Sprung Mass

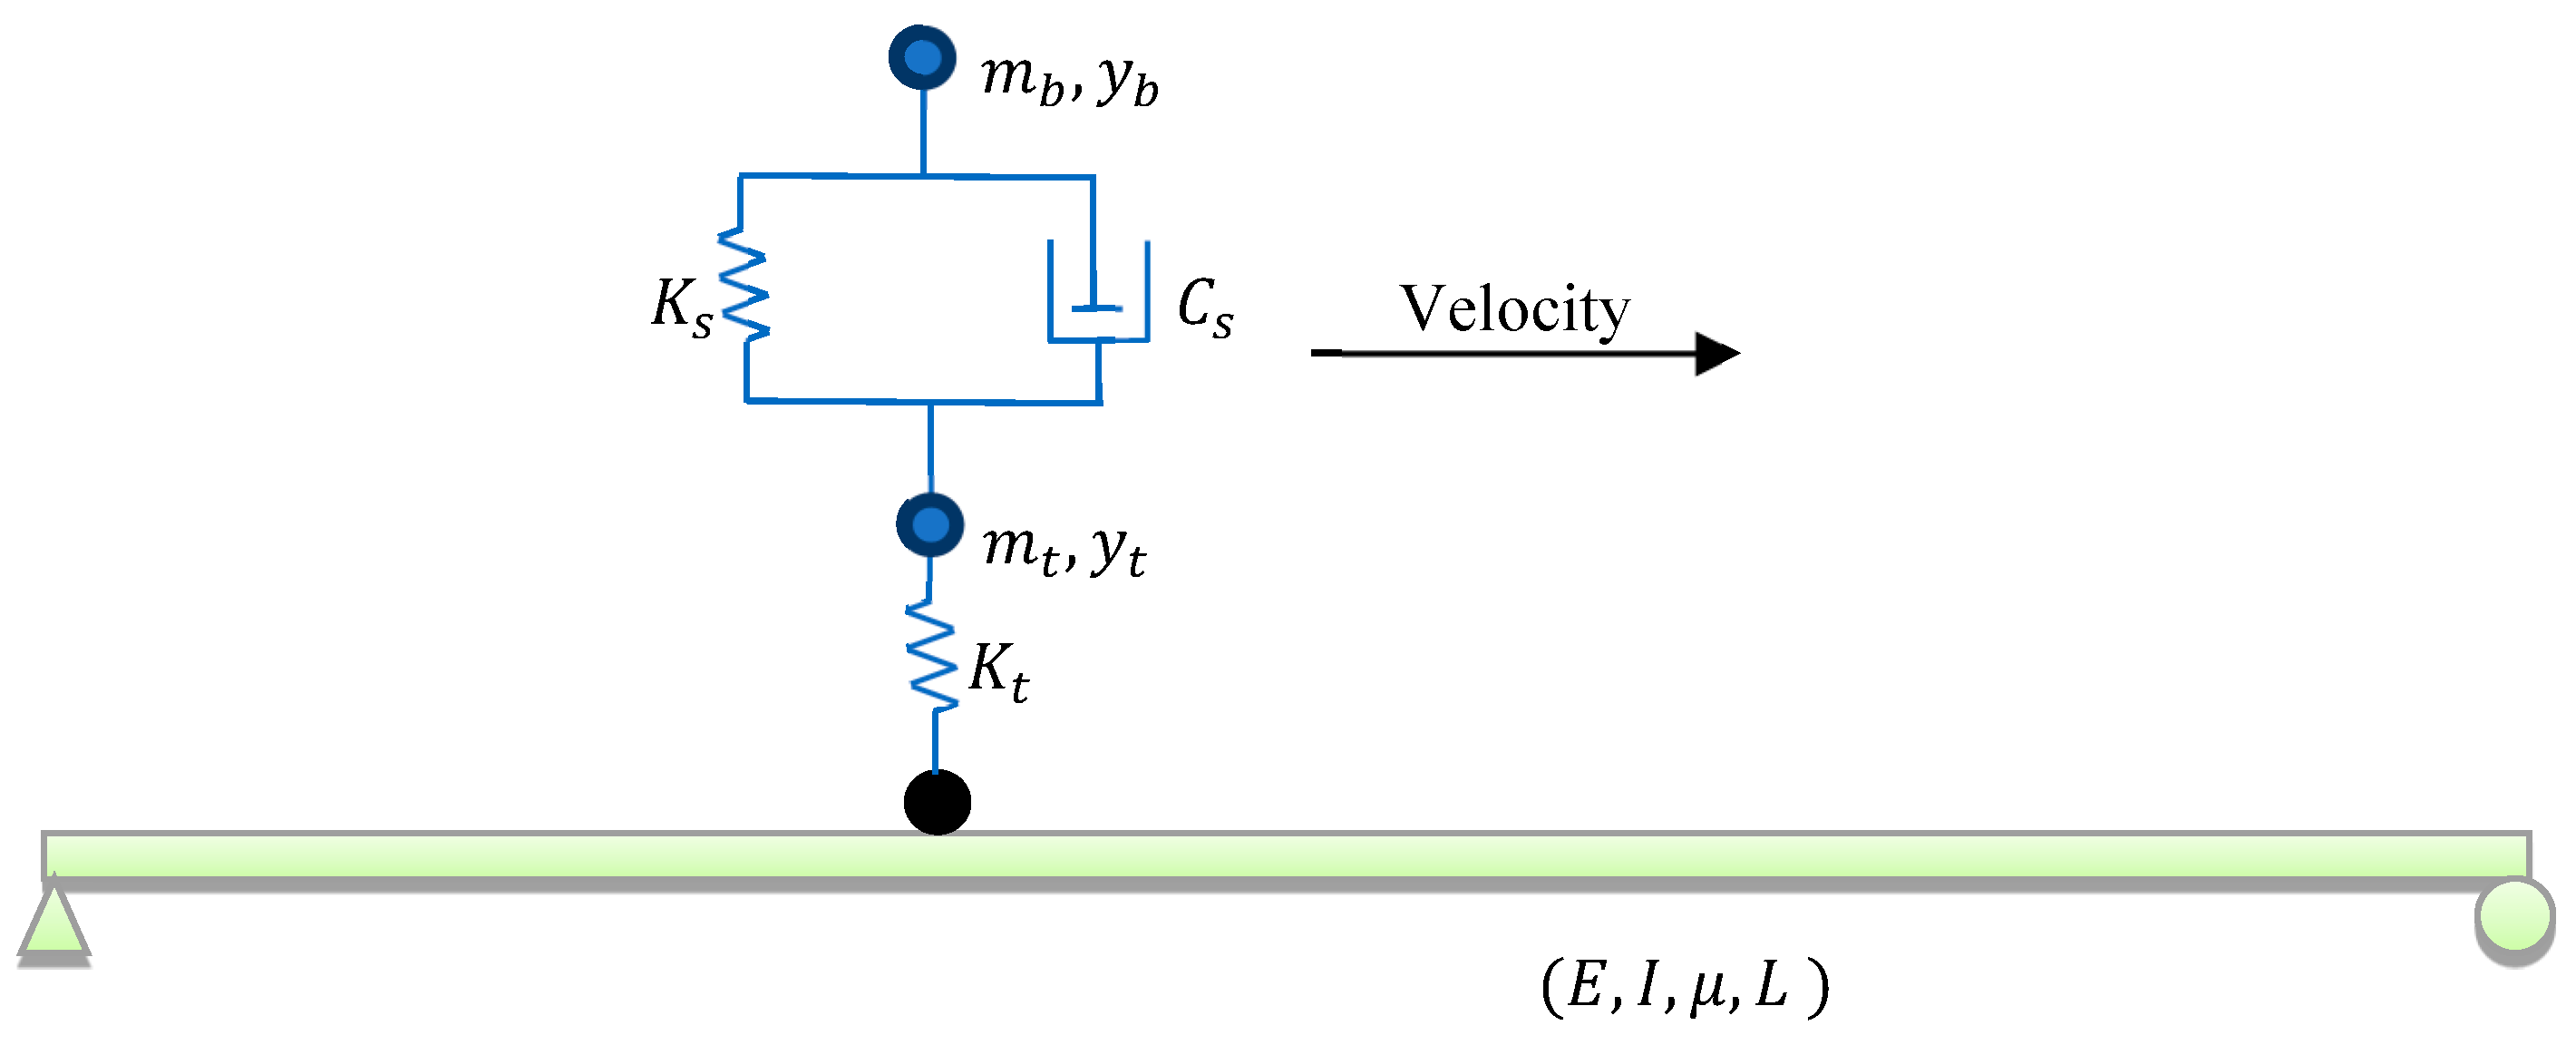
Simply supported bridges subjected to truckloads have been extensively studied over the past few decades [4,29,30,31,32,33]. There are several methods to numerically simulate truckloads on a bridge, including moving concentrated loads, moving masses, and moving sprung masses. Among these, the moving sprung mass approach is particularly effective in capturing the bridge–vehicle interaction [34,35,36,37,38]. In this paper, the Euler–Bernoulli beam theory is employed to model a simply supported bridge under a truckload represented by a spring–mass system, as discussed in [30,31] and illustrated in Figure 2. The details of the moving sprung mass and the simply supported bridge are provided in Table 1 and Table 2, respectively. It is worth noting that the rotational degree of freedom of the moving sprung mass was constrained during the analysis.
In this study, the truckload traverses the bridge at four different constant velocities. Vertical acceleration data were recorded at seven nodes distributed along the bridge as the sprung mass moved across it. The locations of these uniformly distributed nodes are illustrated in Figure 3. Additionally, Table 3 outlines the damage scenarios considered in this paper. Damage was introduced to the simply supported bridge by reducing the cross-sectional area at specific locations. This reduction in cross-sectional area leads to a decrease in the moment of inertia, effectively simulating structural damage. The damage ratio was defined as the difference in height between the attenuated cross-sectional area and the original bridge cross-sectional area.
The numerical simulations were conducted using ABAQUS software, and the acceleration data obtained from the analysis were made publicly available on ResearchGate.com [39], allowing other researchers to test their own structural health monitoring (SHM) methods.

4. Results and Discussion

4.1. Applying GKSF to Acceleration Data

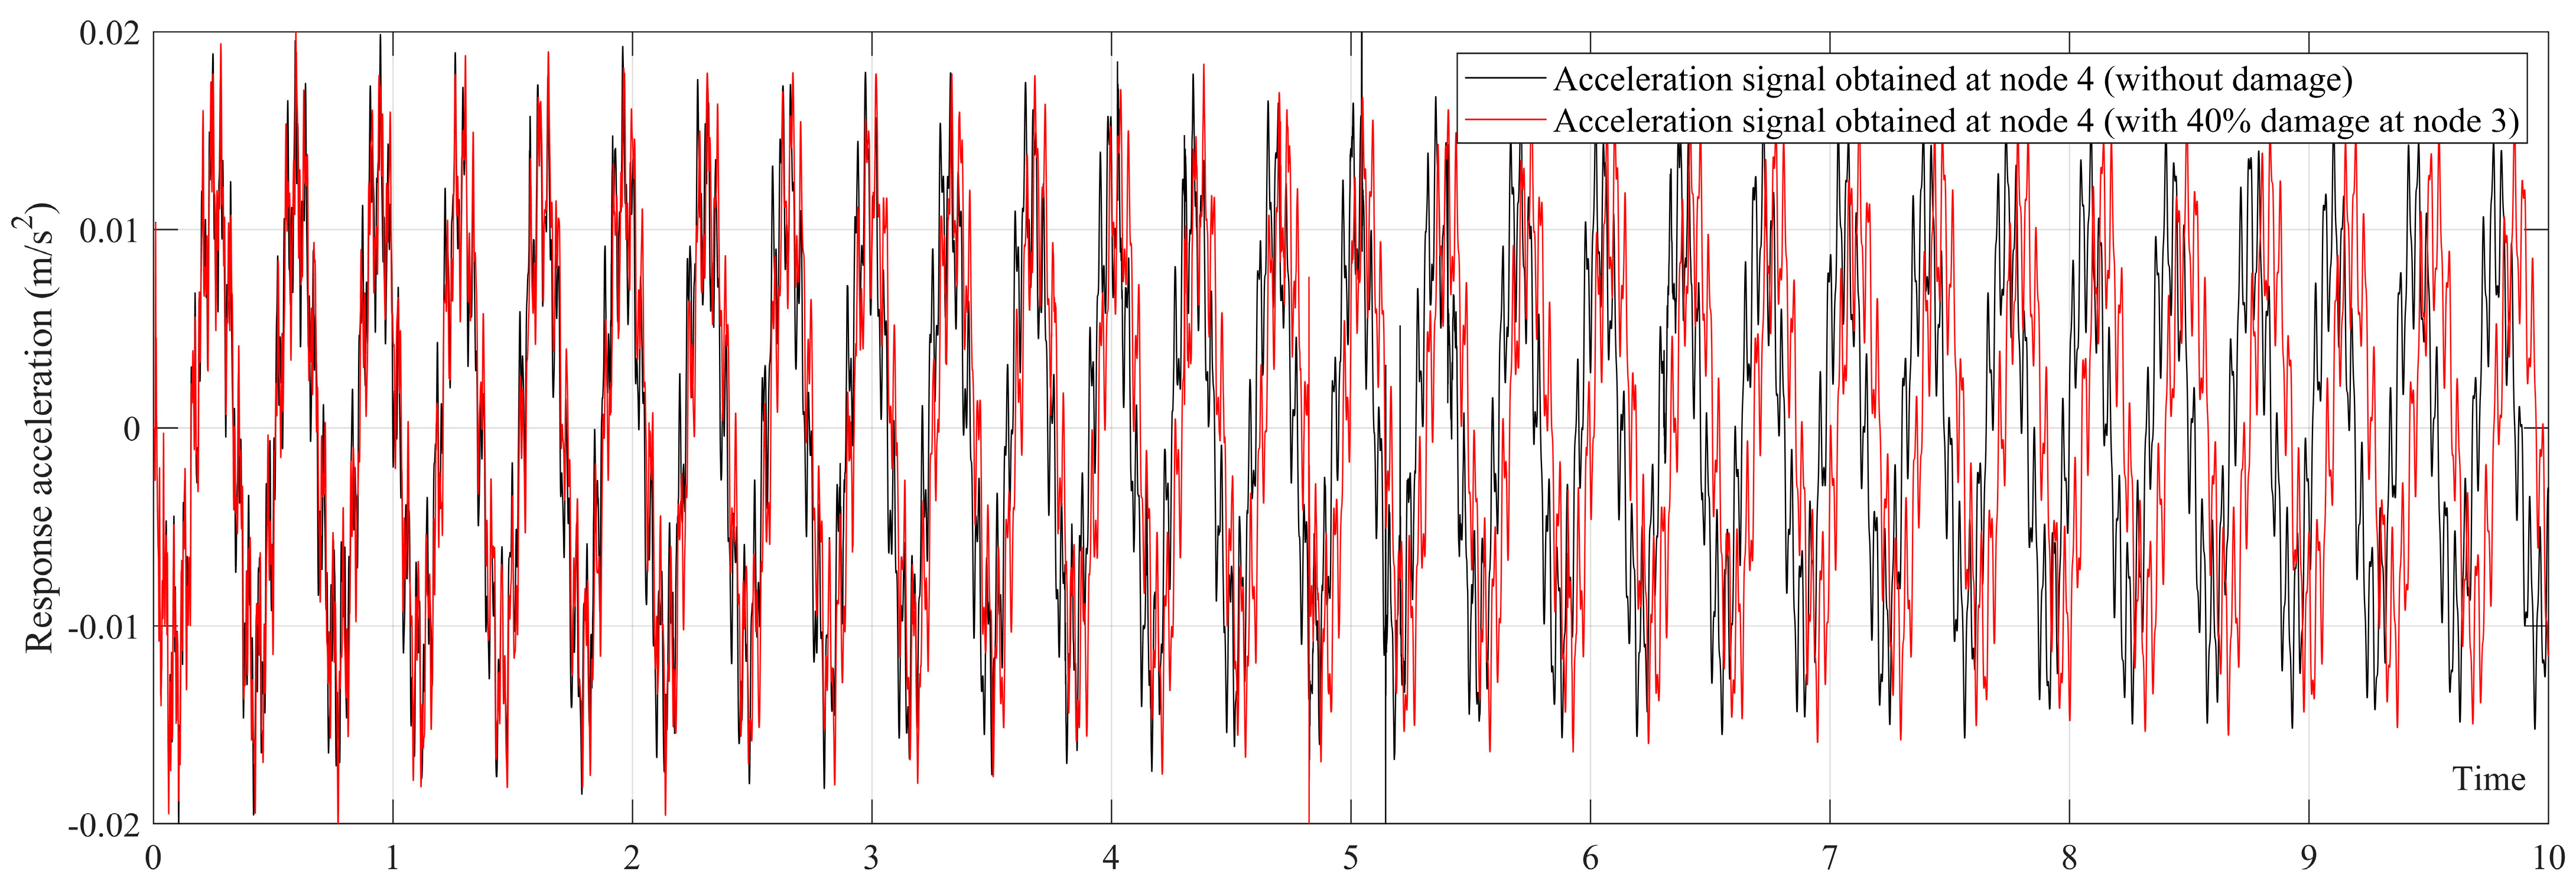
Figure 4 illustrates the vertical acceleration response measured at the midpoint of the simply supported bridge (Node 4 in Figure 3) for two scenarios: no damage and 40% damage at Node 3 (N3D40). It is worth noting that damping was disregarded in this study, as its effect was negligible and could be omitted without significantly impacting the results. As a result, the acceleration does not exhibit an increase when the vehicle is at the midpoint of the bridge. Similar numerical results have been reported in [29].
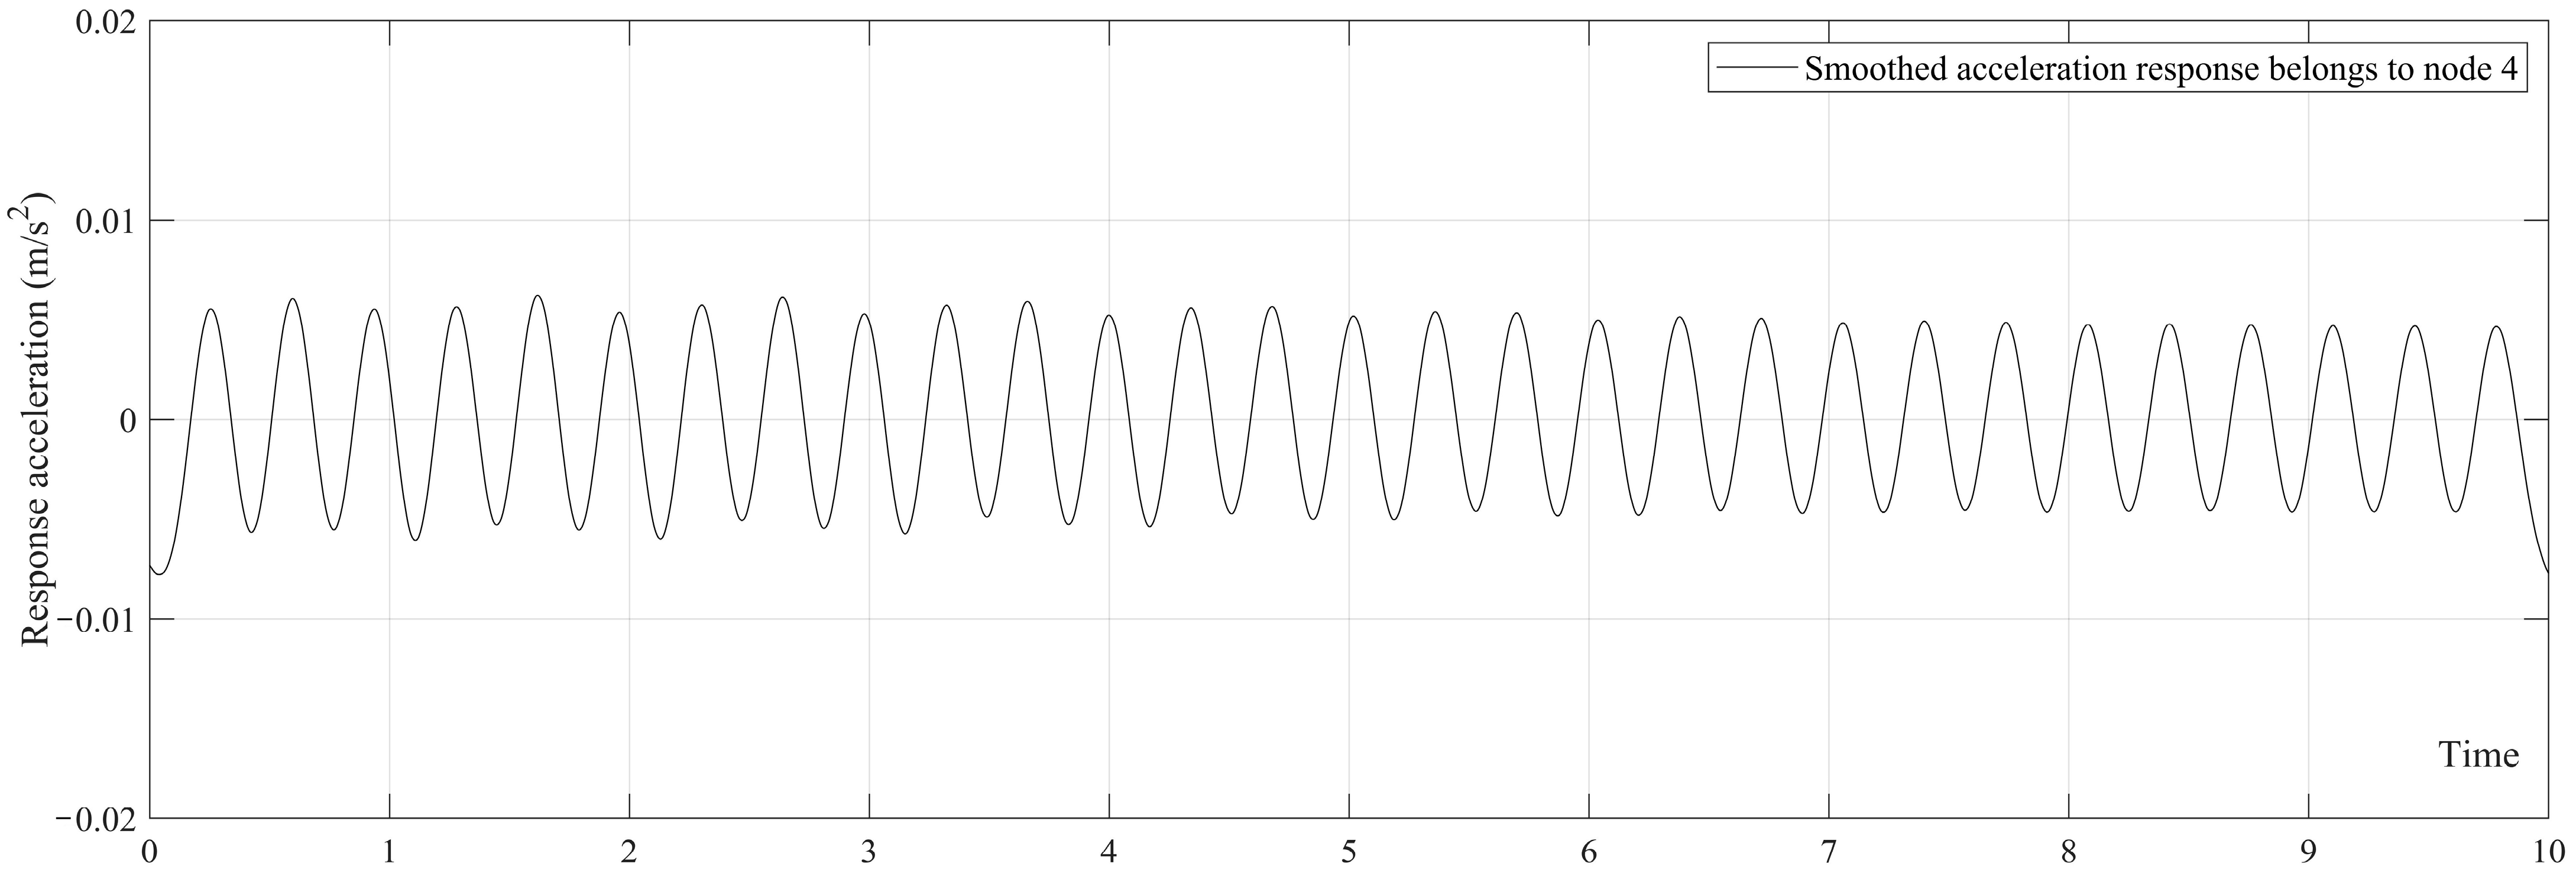
Figure 4 clearly demonstrates that the changes in acceleration data caused by damage are not visible to the naked eye, highlighting the need for a structural health monitoring (SHM) method to detect such changes. As discussed in Section 2, the only parameter requiring determination for the Gaussian Kernel Smoothing Filter (GKSF) is the kernel size. Based on Table 1, the first natural frequency of the simply supported bridge is 2.933 Hz, which corresponds to a period of 1/2.933 = 0.3409 s. Consequently, the GKSF span is set to 0.3409 s and applied to all acceleration signals recorded from various stations and scenarios. The smoothed signal, computed using the GKSF for the undamaged scenario shown in Figure 4, is also plotted in Figure 5. It is evident that Figure 5 exhibits only one natural period, which matches the first natural period of the modeled bridge.

4.2. Locating Structural Damage

Structural damage reduces the stiffness of a bridge. As stiffness decreases, higher amplitudes are expected in both deflection and acceleration responses. Consequently, the energy released by the acceleration response also increases, as energy is proportional to the square of the amplitude. Additionally, the rate of change in energy is more pronounced near the damaged area. Thus, we expect higher energy levels in the acceleration data when structural damage is present.
Dynamic modal parameters such as natural frequencies, mode shapes, and …. represent the global characteristics of a structure. However, a crack is a localized phenomenon that has minimal impact on these global properties. As a result, monitoring such parameters may not provide an effective damage index (DI) [33,40,41]. As an alternative, a non-modal parameter-based DI offers two key advantages: it is more sensitive to local damage and eliminates of the need to determine dynamic modal properties [5]. Zhang et al. also found the same results and claimed that using the energy of the acceleration signal provides higher accuracy [42]. Hence, in this paper, an energy-based DI, as described in [30,31,43,44], is employed. The energy of the signal is calculated as follows:
E = S s m o o t h e d 2   d t
where S s m o o t h e d refers to the smoothed acceleration response, calculated via the GKSF, and E denotes the energy of the smoothed acceleration response. Since the energy of the smoothed acceleration responses, obtained at different nodes, is different, a normalizing factor, as expressed in Equation (6), is needed.
γ i = E I N i E I N ¯
where E I N i indicates the energy of the smoothed acceleration response at node i and E I N ¯ shows the arithmetic mean of E I N i , calculated for the non-damage scenario. Moreover, γ i is the normalization factor. Therefore, the DI based on the normalized energy can be expressed as follows:
D I i = E i E ¯ × 100 γ i
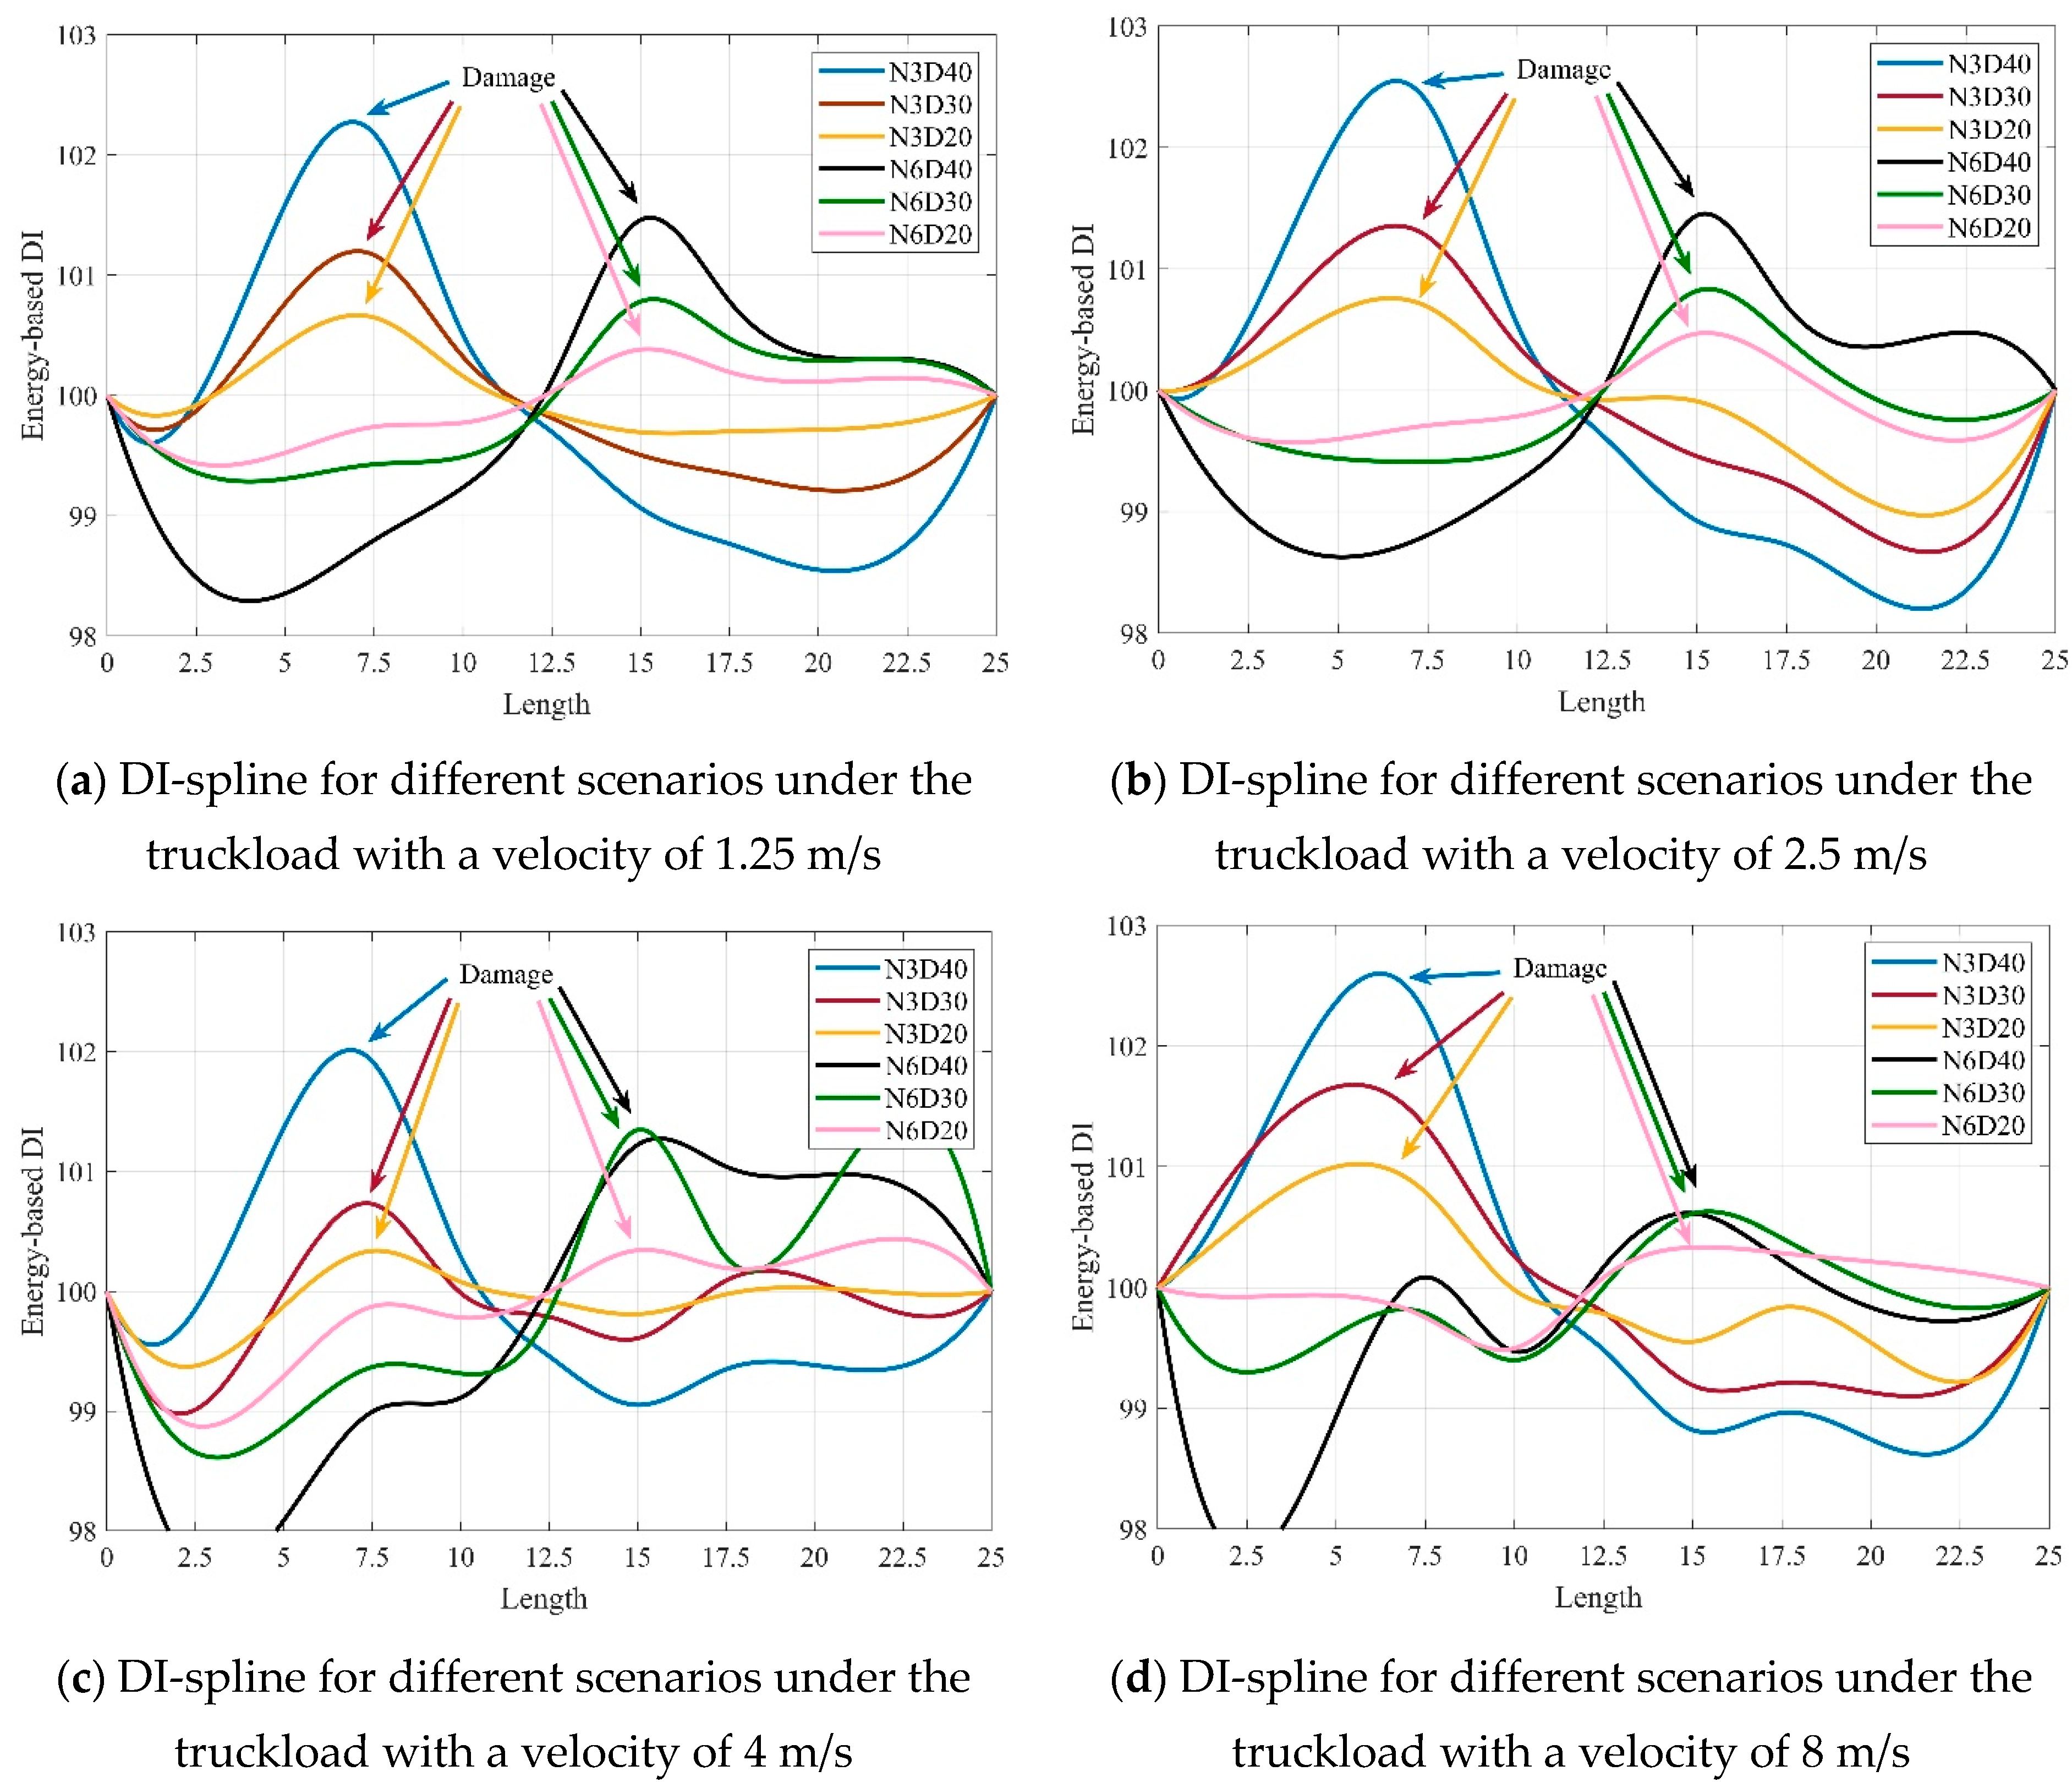
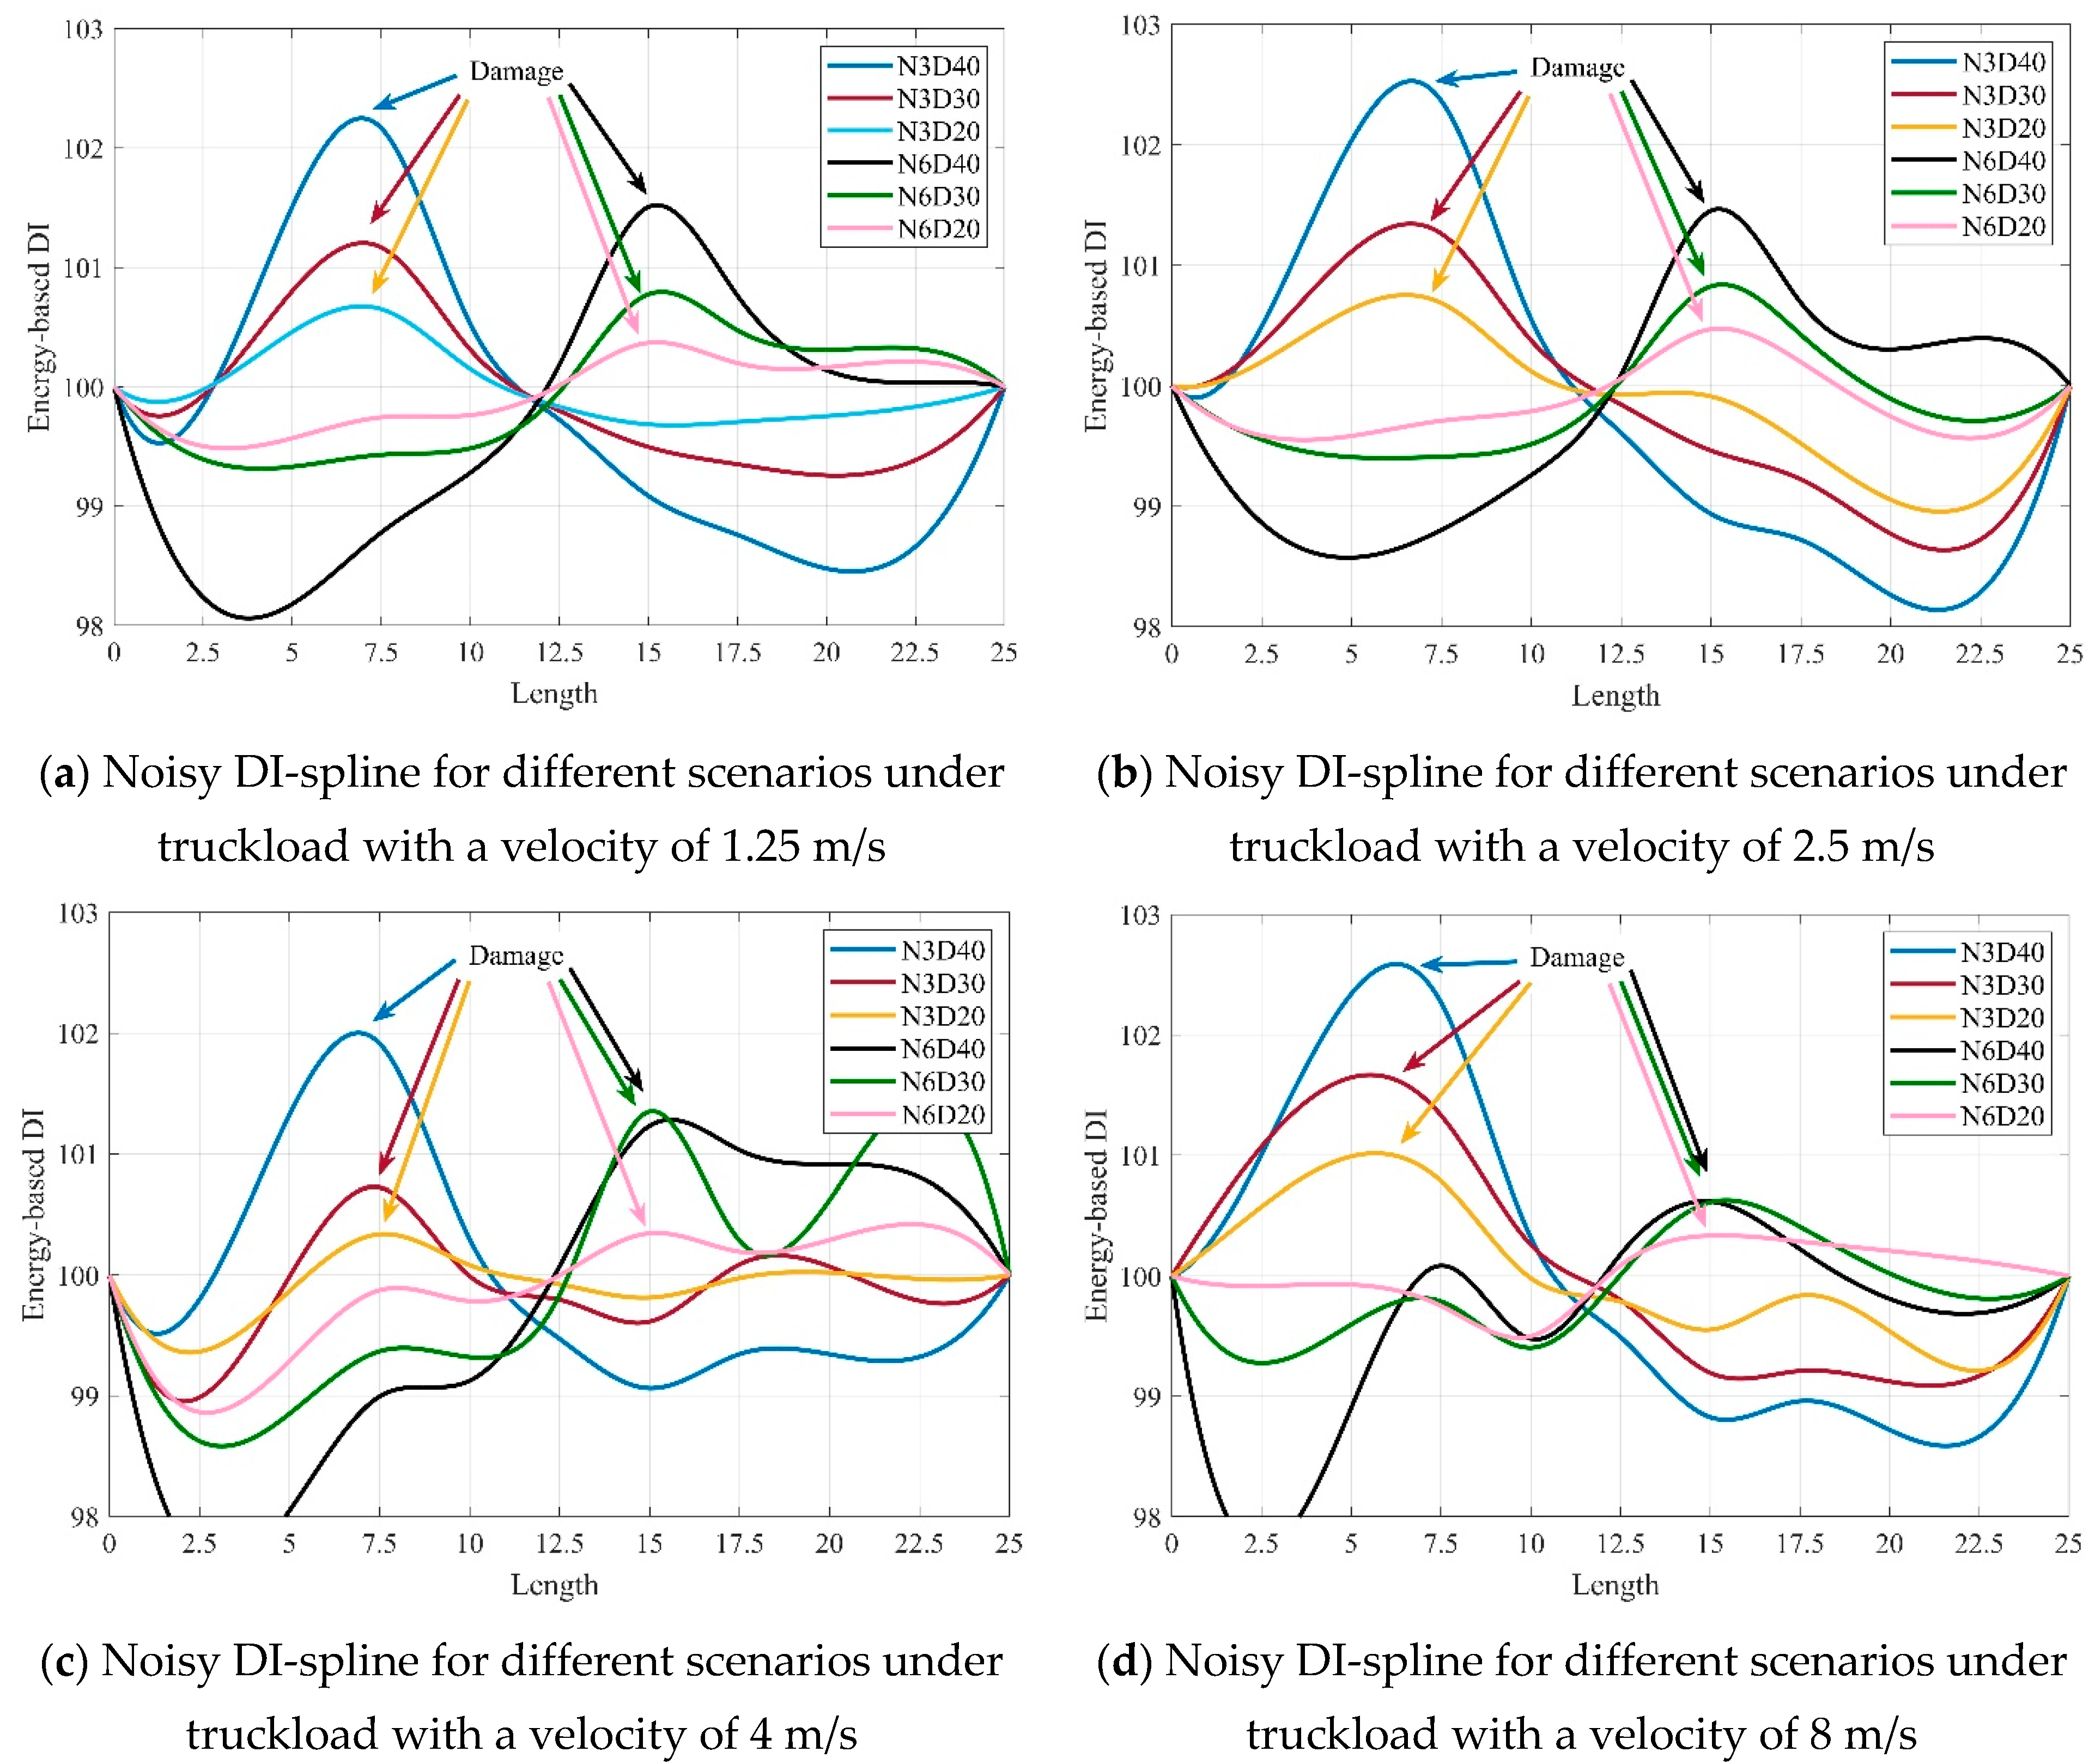
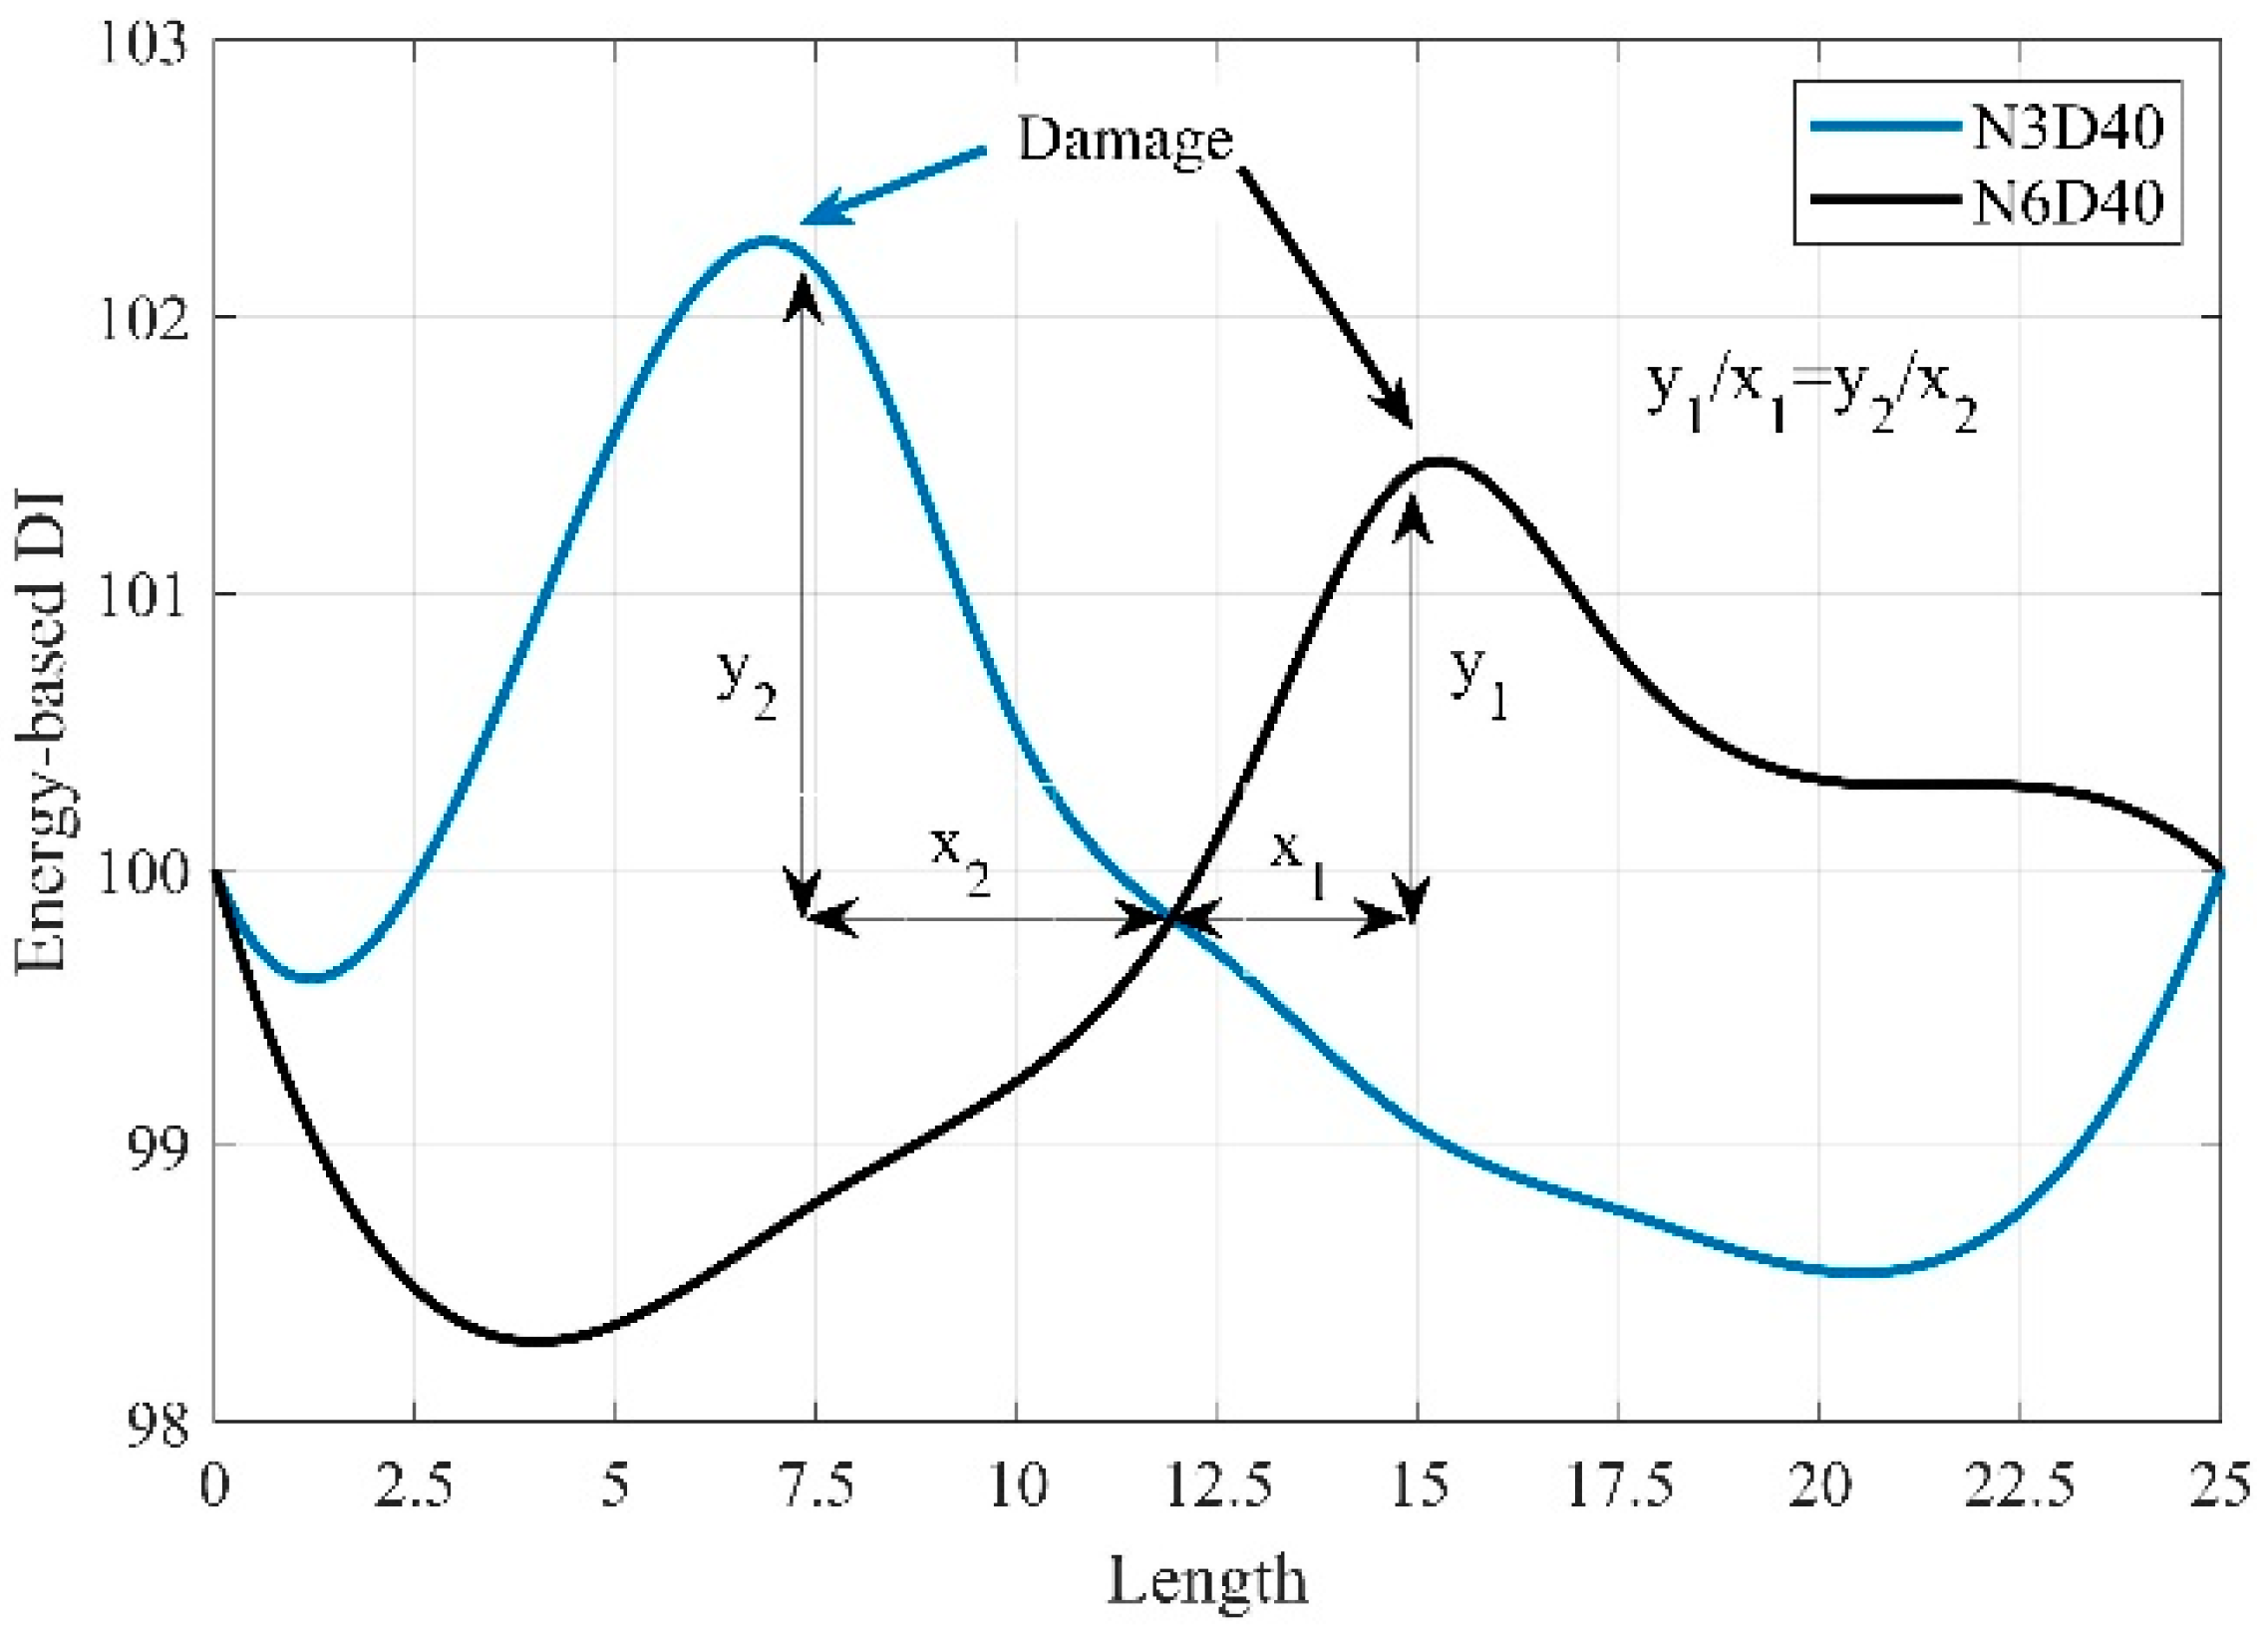
where E i represents the energy of the smoothed acceleration response at node i and E ¯ shows the arithmetic mean of E i , calculated at all nodes. Additionally, the damage index (DI) should be calculated for all nodes along the bridge, and these values can be interconnected using a spline function. However, recording vibration data for the entire bridge is neither practical nor economical. Therefore, only a set of seven sensors, distributed along the bridge, was considered. This approach is more feasible for real-world field applications. The normalized energy values calculated at these sensor locations can be used to construct a curve of normalized energy for the entire bridge. By applying a spline interpolation to the DIs, the DI for a given scenario can be represented as a continuous curve. For simplicity, this resulting spline is referred to as the “DI-spline” in this paper. Since structural damage alters the energy distribution along the bridge under a moving sprung mass, it is expected that the DI-spline will exhibit a peak near the damaged area. An example of the DI-spline is illustrated in Figure 6. The DI-splines calculated for various scenarios and velocities are presented in Figure 7.
The average energy increases as a result of damage. Due to the higher rate of normalized energy variation near the damage location, some nodes may exhibit normalized energies below the new average energy in damaged scenarios, resulting in values below 100. The peak on the DI-spline indicates an increase in the amplitude of acceleration data at that specific location, signaling the presence of structural damage. Other values, particularly those below 100, are not significant and can be disregarded for damage identification.
Since it is not feasible to install an unlimited number of sensors on bridges, only a limited number of acceleration response data responses are typically available. These acceleration responses represent the areas around their respective locations. For example, if the bridge length is 25 m and there are nine acceleration sensors, each sensor represents a 2.5 m segment of the bridge. If damage is detected at a specific sensor location, it should be further investigated in the surrounding area with greater precision. Increasing the number of sensors enhances the precision of damage localization rather than causing significant changes to the overall pattern of the results.
As demonstrated in Figure 6 and Figure 7, the proposed method and the DI-spline can accurately identify structural damage. However, Figure 7 reveals that the accuracy of the method decreases as the velocity of the truckload increases, making it more challenging to precisely locate damage under higher velocities. It is worth noting that since the intersection of the DI-spline at the midpoint of the bridge is used to determine the level of structural damage, the method may struggle to accurately assess damage levels near the middle of the bridge.
Additionally, modeling all possible damage scenarios at every point is practically unfeasible. Therefore, it was decided to examine three damage models at two specific points. Given that most damage detection methods focus on identifying damage at the center of the bridge, this study chose not to define the damage at the midpoint. Due to the symmetrical nature of the bridge, points 3 and 6 were selected. It was believed that by choosing these two points and considering the symmetry of the bridge, points 2 and 7 would also be effectively covered.

4.3. Effect of Noise

The results presented in Figure 6 and Figure 7 are based on noise-free data. To evaluate the feasibility of the proposed method in real-world conditions, uniformly distributed noise was manually added to the bridge’s acceleration responses. The root mean square (RMS) ratios of the noise to the acceleration responses were set to values of up to 27%. The DI-splines calculated from these noisy acceleration responses for different scenarios are displayed in Figure 8.
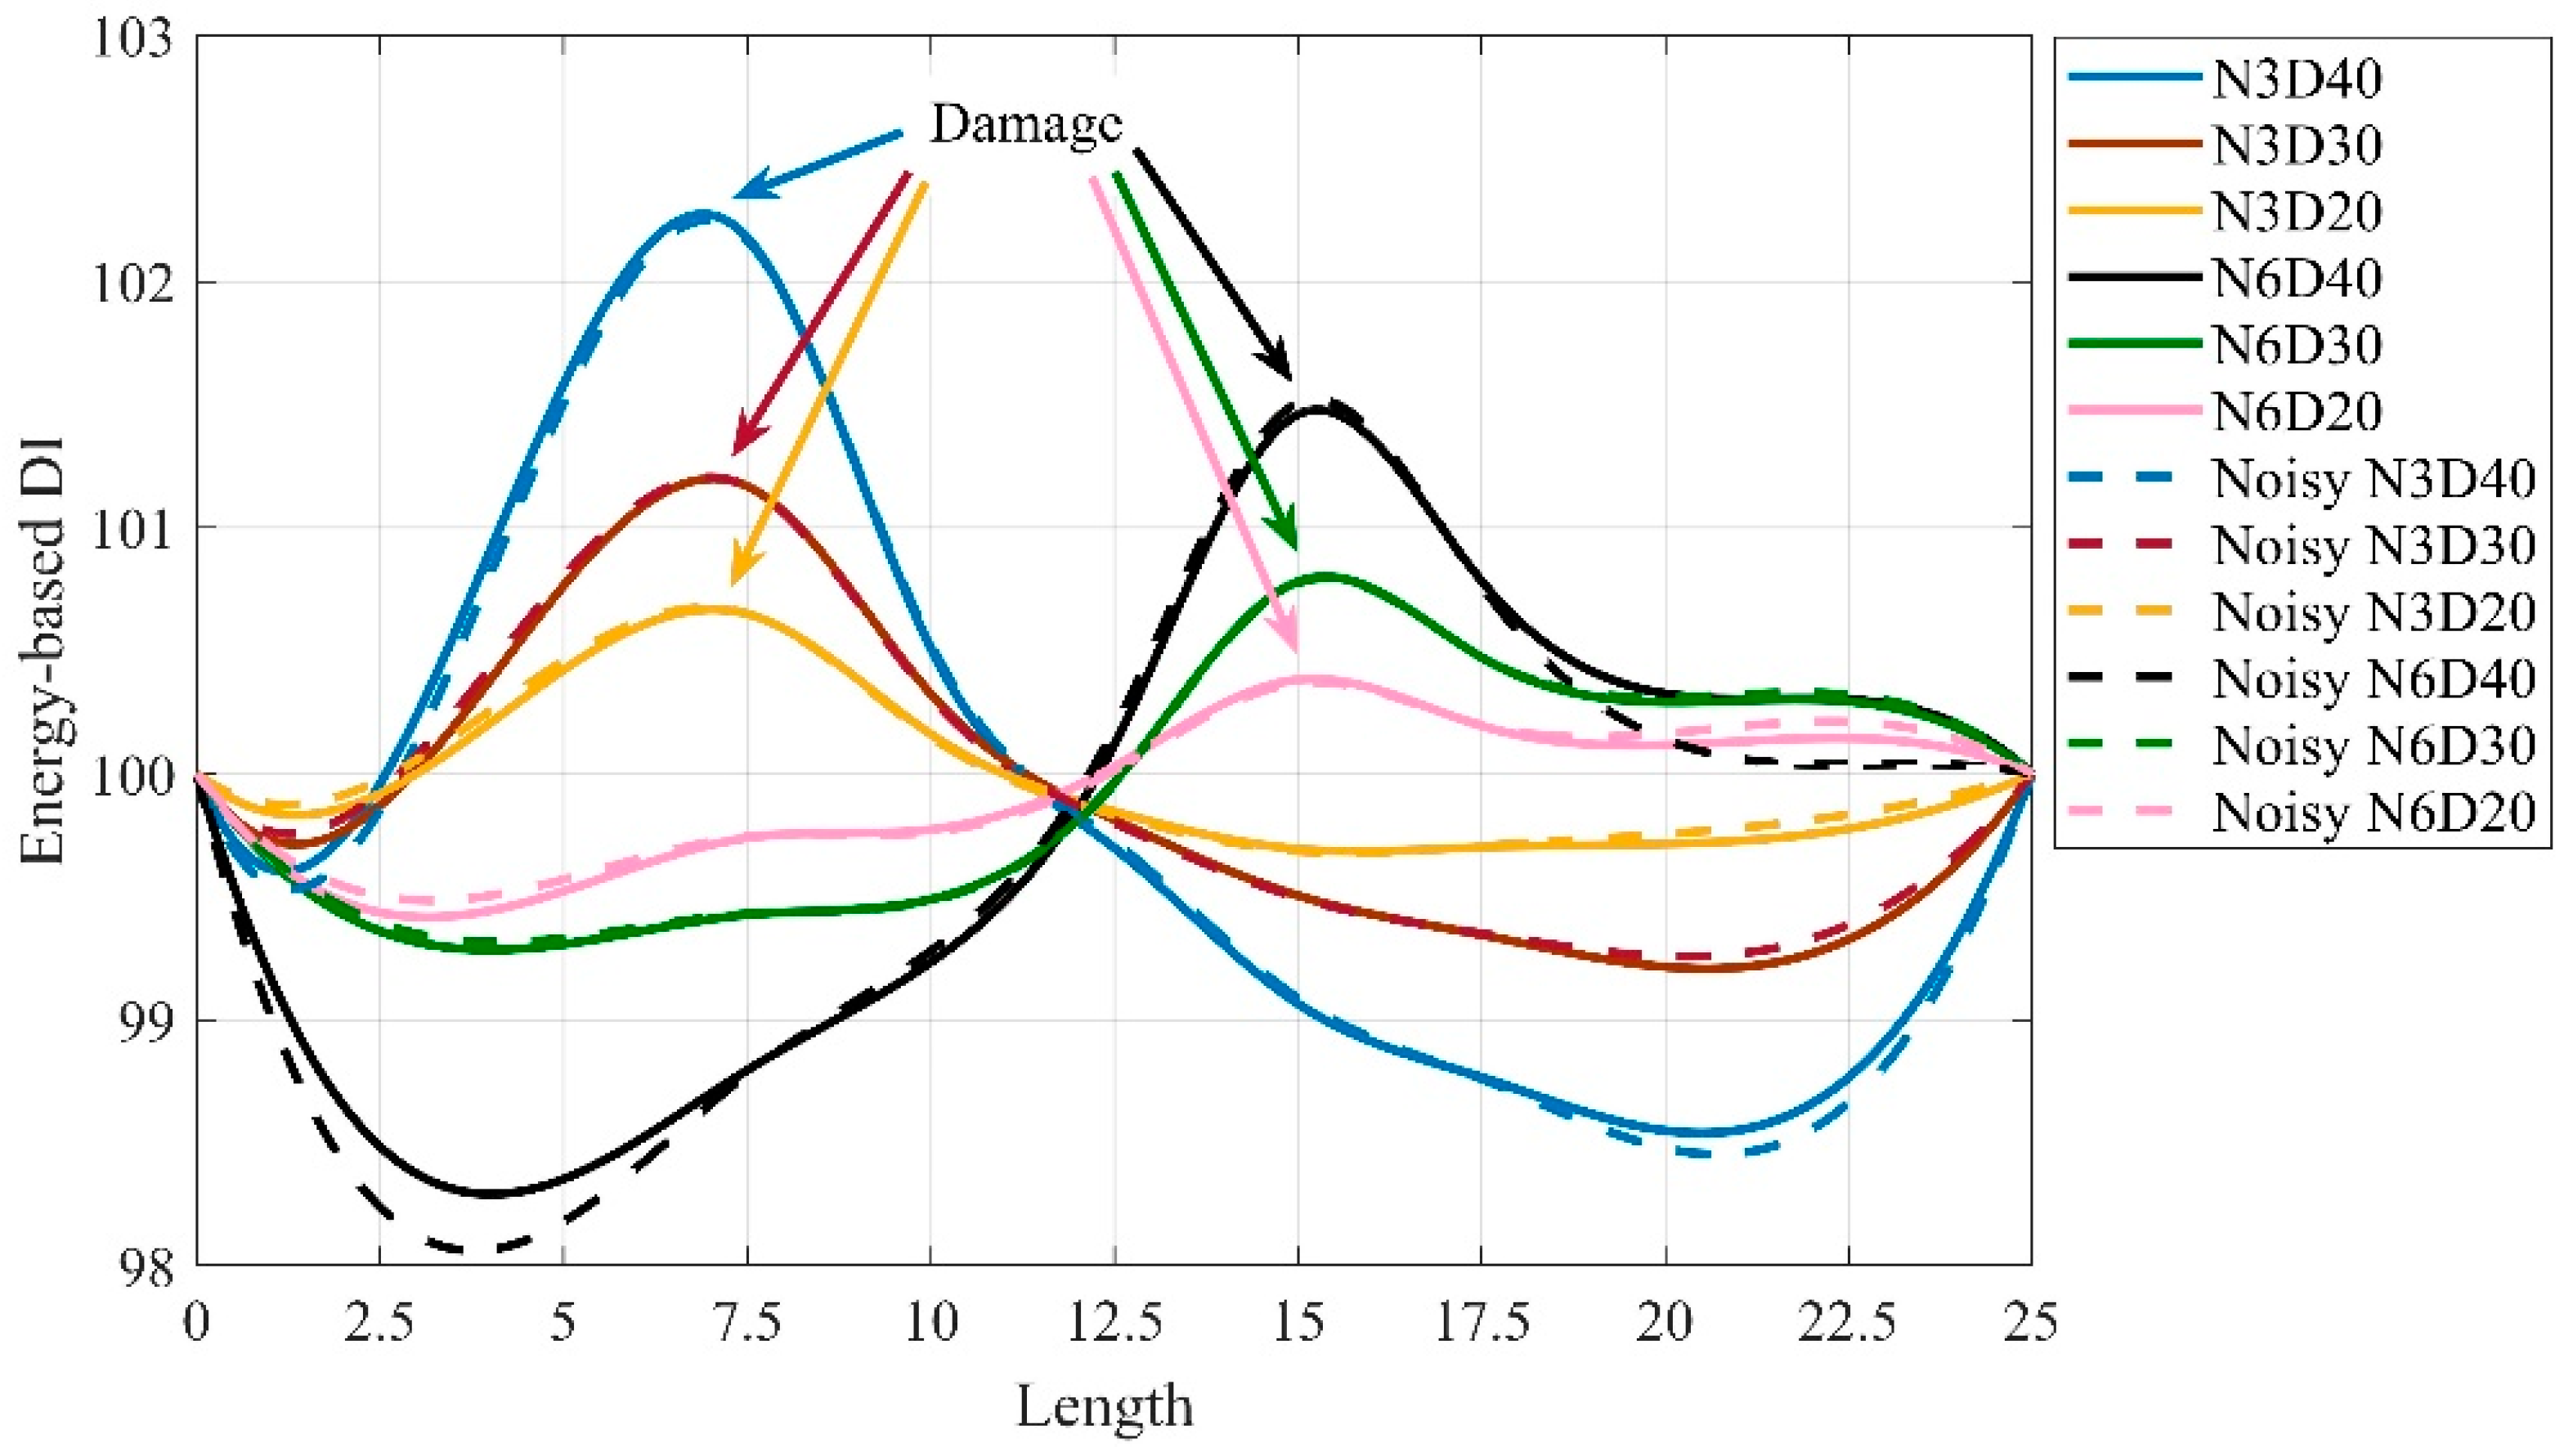
As demonstrated in Figure 8, the proposed method successfully identifies structural damage in the bridge, even when using noisy acceleration data, particularly at lower velocities. To highlight the impact of noise on the DI-splines, Figure 7a and Figure 8a are compared and the results are presented in Figure 9. Given that the Gaussian filter also serves as a de-noising tool, the proposed method exhibits minimal sensitivity to noise, as clearly illustrated in Figure 9.

4.4. Baseline Estimation

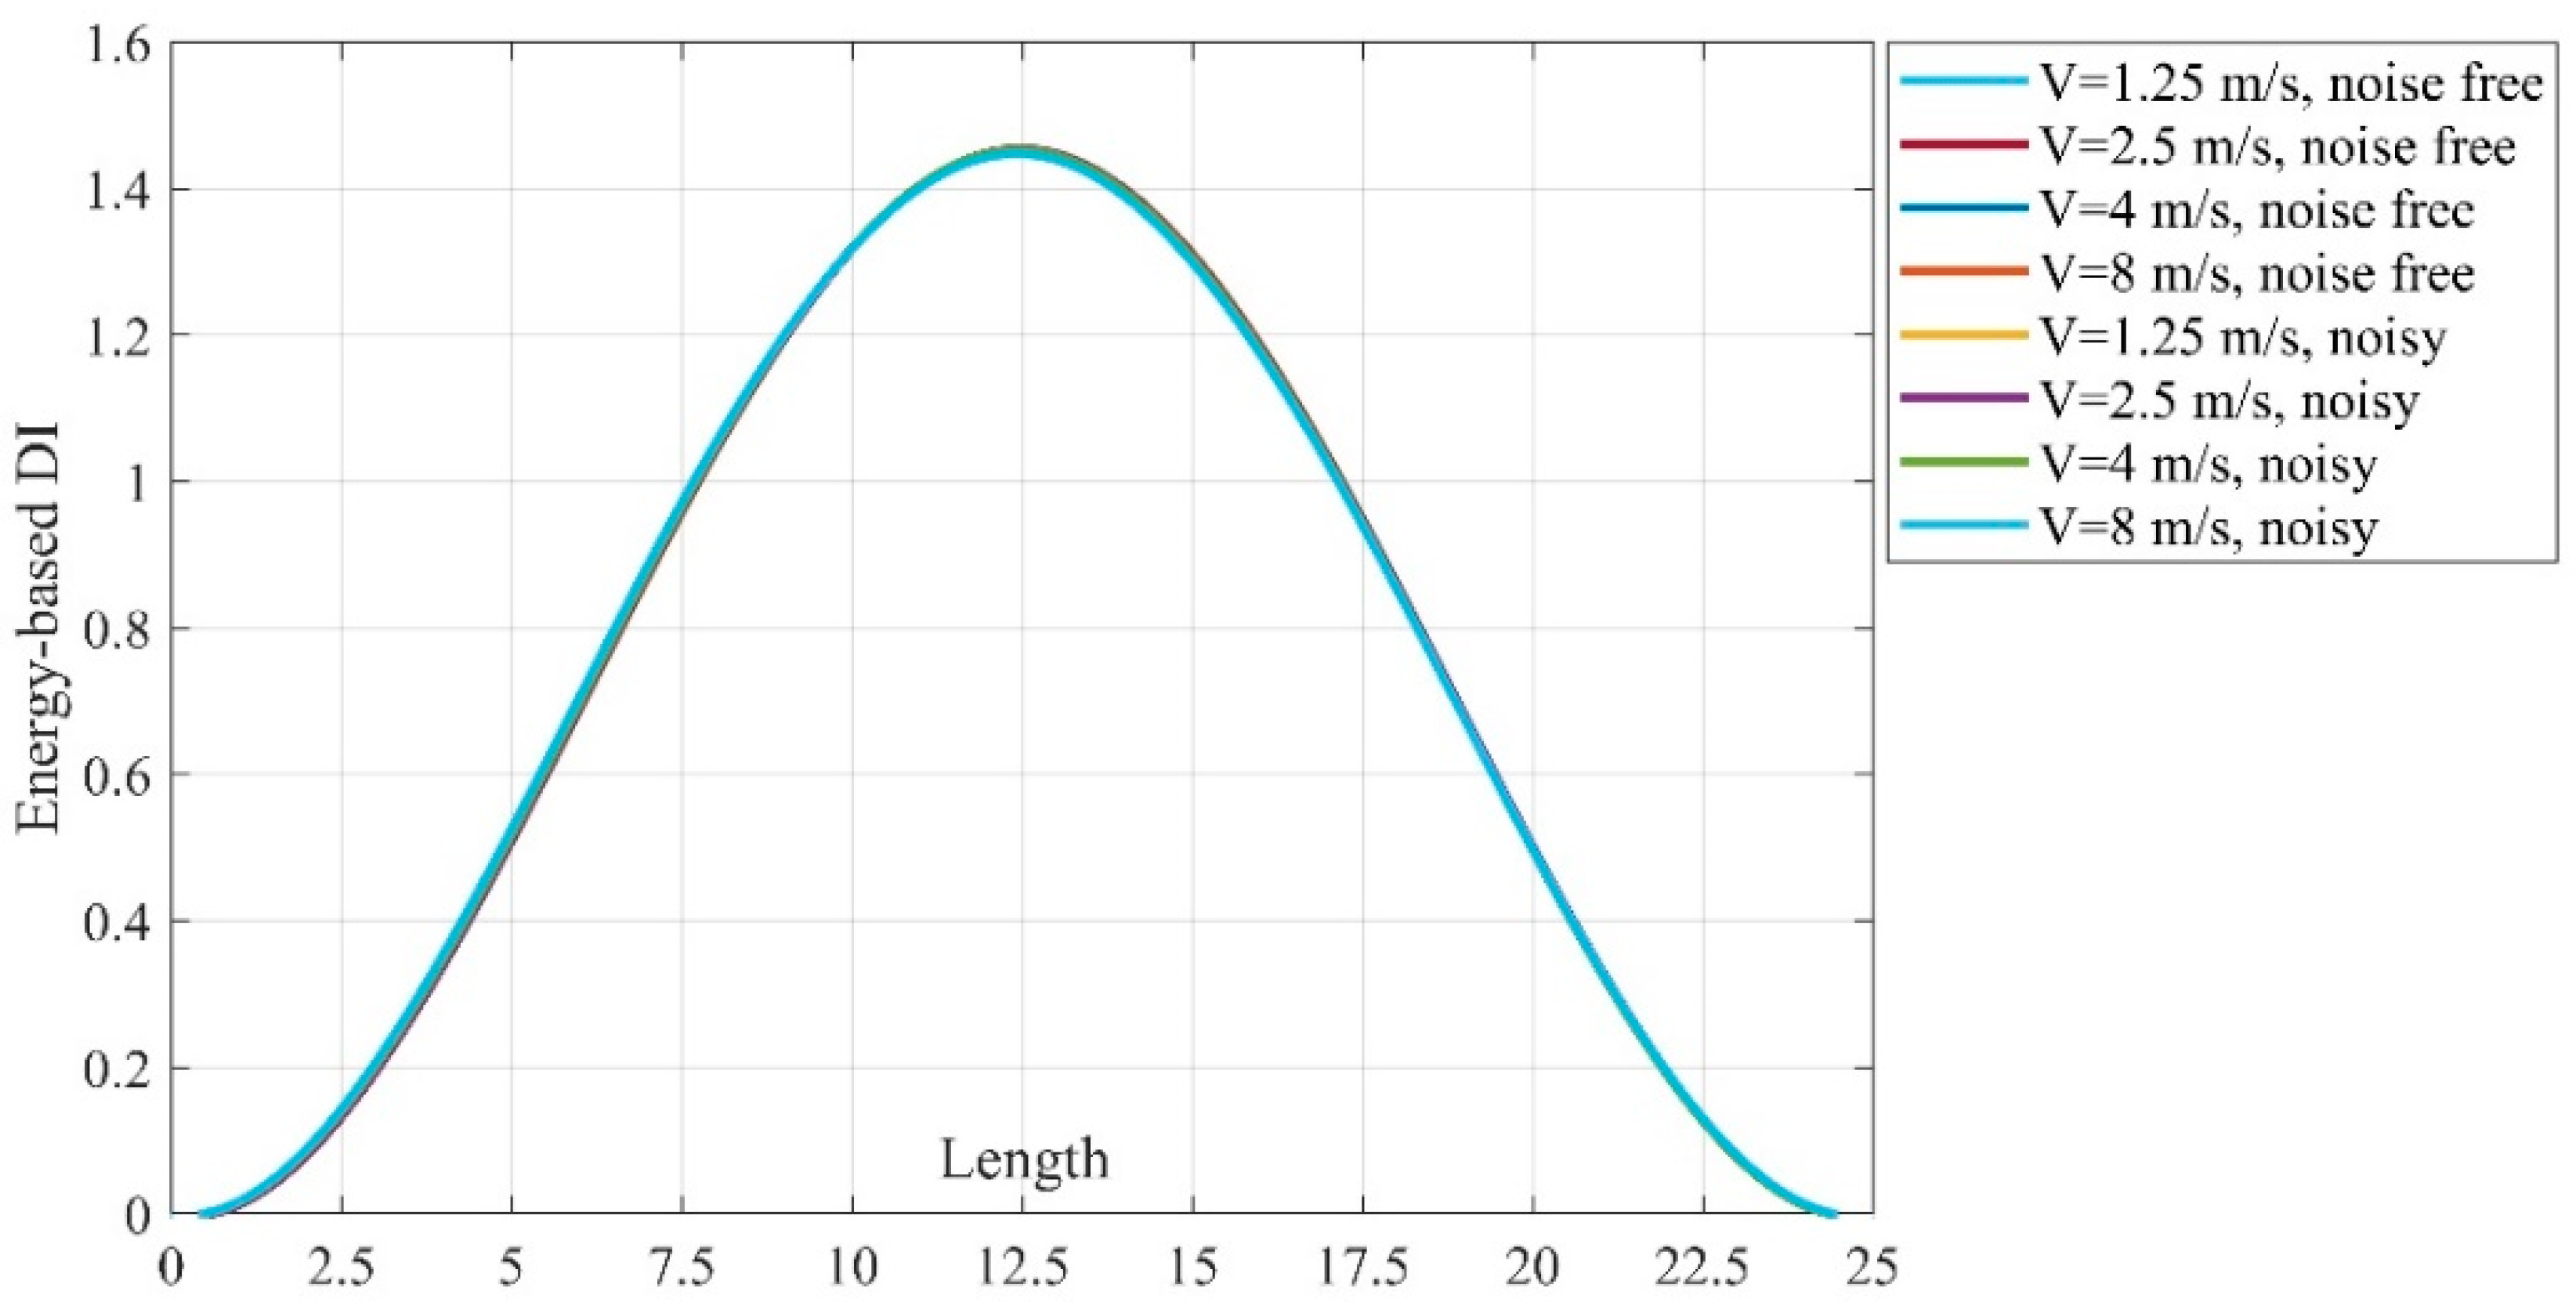
As previously discussed, the normalized energy-based damage index (DI), expressed in Equation (7), can accurately locate structural damage in the bridge. However, its accuracy heavily relies on the normalization factor, γ i , which is calculated solely for the intact bridge. In this section, a method is proposed to estimate γ i for each location along the bridge, allowing the proposed method to serve as a baseline-free damage detection technique. The values of γ i for different velocities, under both noisy and noise-free conditions, are presented in Table 4. These values are interconnected using a spline function, as illustrated in Figure 10.
The splines representing the normalization factors for different velocities overlap, as shown in Figure 10. This confirms that the normalization factor used in the proposed Gaussian Kernel Smoothing Filter (GKSF)-based method also follows a Gaussian distribution. Importantly, the normalization factor exhibits the same pattern along the bridge in terms of amplitude, regardless of velocity or the presence of noise. This characteristic is a significant advantage, as the normalization factor determined for one velocity can be applied to other velocities. The Gaussian distribution illustrated in Figure 10 also serves as the baseline for the proposed GKSF-based method. Consequently, the proposed method can be classified as a baseline-free damage detection technique.

4.5. Structural Damage Quantification

Figure 9 clearly shows that all of the DI-splines have an intersection, which is around the length of 12 m and the amplitude of 99.8 in this paper. Additionally, the intersection of the DI-splines is well concentrated in Figure 7a,b and Figure 8a,b. This provides a suitable tool to quantify the structural damage in the bridge with good accuracy. However, the intersections at higher velocities, as shown in Figure 7c,d and Figure 8c,d, are not well concentrated; therefore, the damage severity cannot be well quantified at these velocities. Figure 11 displays how the structural damage in the bridge is quantified using the proposed GKSF-based method.
As shown in Figure 11, the relative slope between the maximum of the DI-spline and the intersection point for the same severity of damage is as before. Table 5 reports the relative slope between the intersection point and the damage position for all damage scenarios.
As outlined in Table 5, structural damage levels of 40%, 30%, and 20% produce slopes of approximately 0.5518, 0.3241, and 0.2002, respectively. This demonstrates that the proposed GKSF-based method can accurately identify the severity of structural damage in the bridge, particularly at lower velocities.
Since structural damage alters the dynamic modal parameters of a structure, the traditional approach to identifying damage location and severity involves monitoring changes in these parameters. However, the proposed method in this paper offers a significant advantage: it determines the location and severity of damage using the normalized energy of acceleration responses, thereby eliminating the need to monitor dynamic modal parameters.

4.6. Natural Frequency Changes Due to Bridge Structural Damage

To address the changes in natural frequency caused by structural damage in the bridge, it is widely recognized that damage typically softens the structure, leading to a reduction in natural frequency [31]. However, frequency-based damage detection methods can only reliably identify structural damage when the natural frequency changes by more than 5% [43]. Table 6 presents the natural frequencies of the bridge calculated for different scenarios, demonstrating that the proposed GKSF-based method can accurately identify structural damage even when the effect on natural frequency is minimal. This characteristic makes the method highly suitable for practical applications.
It should be noted that, since temperature changes affect the natural frequency, further studies are required to evaluate the effect of temperature on normalized energy, which will be conducted in the future. Moreover, parts of the proposed method, using other kernels, have been experimentally tested in the laboratory. However, for a more accurate assessment, field testing is necessary and will be carried out in the future.

4.7. Further Study on the Span of GKSF

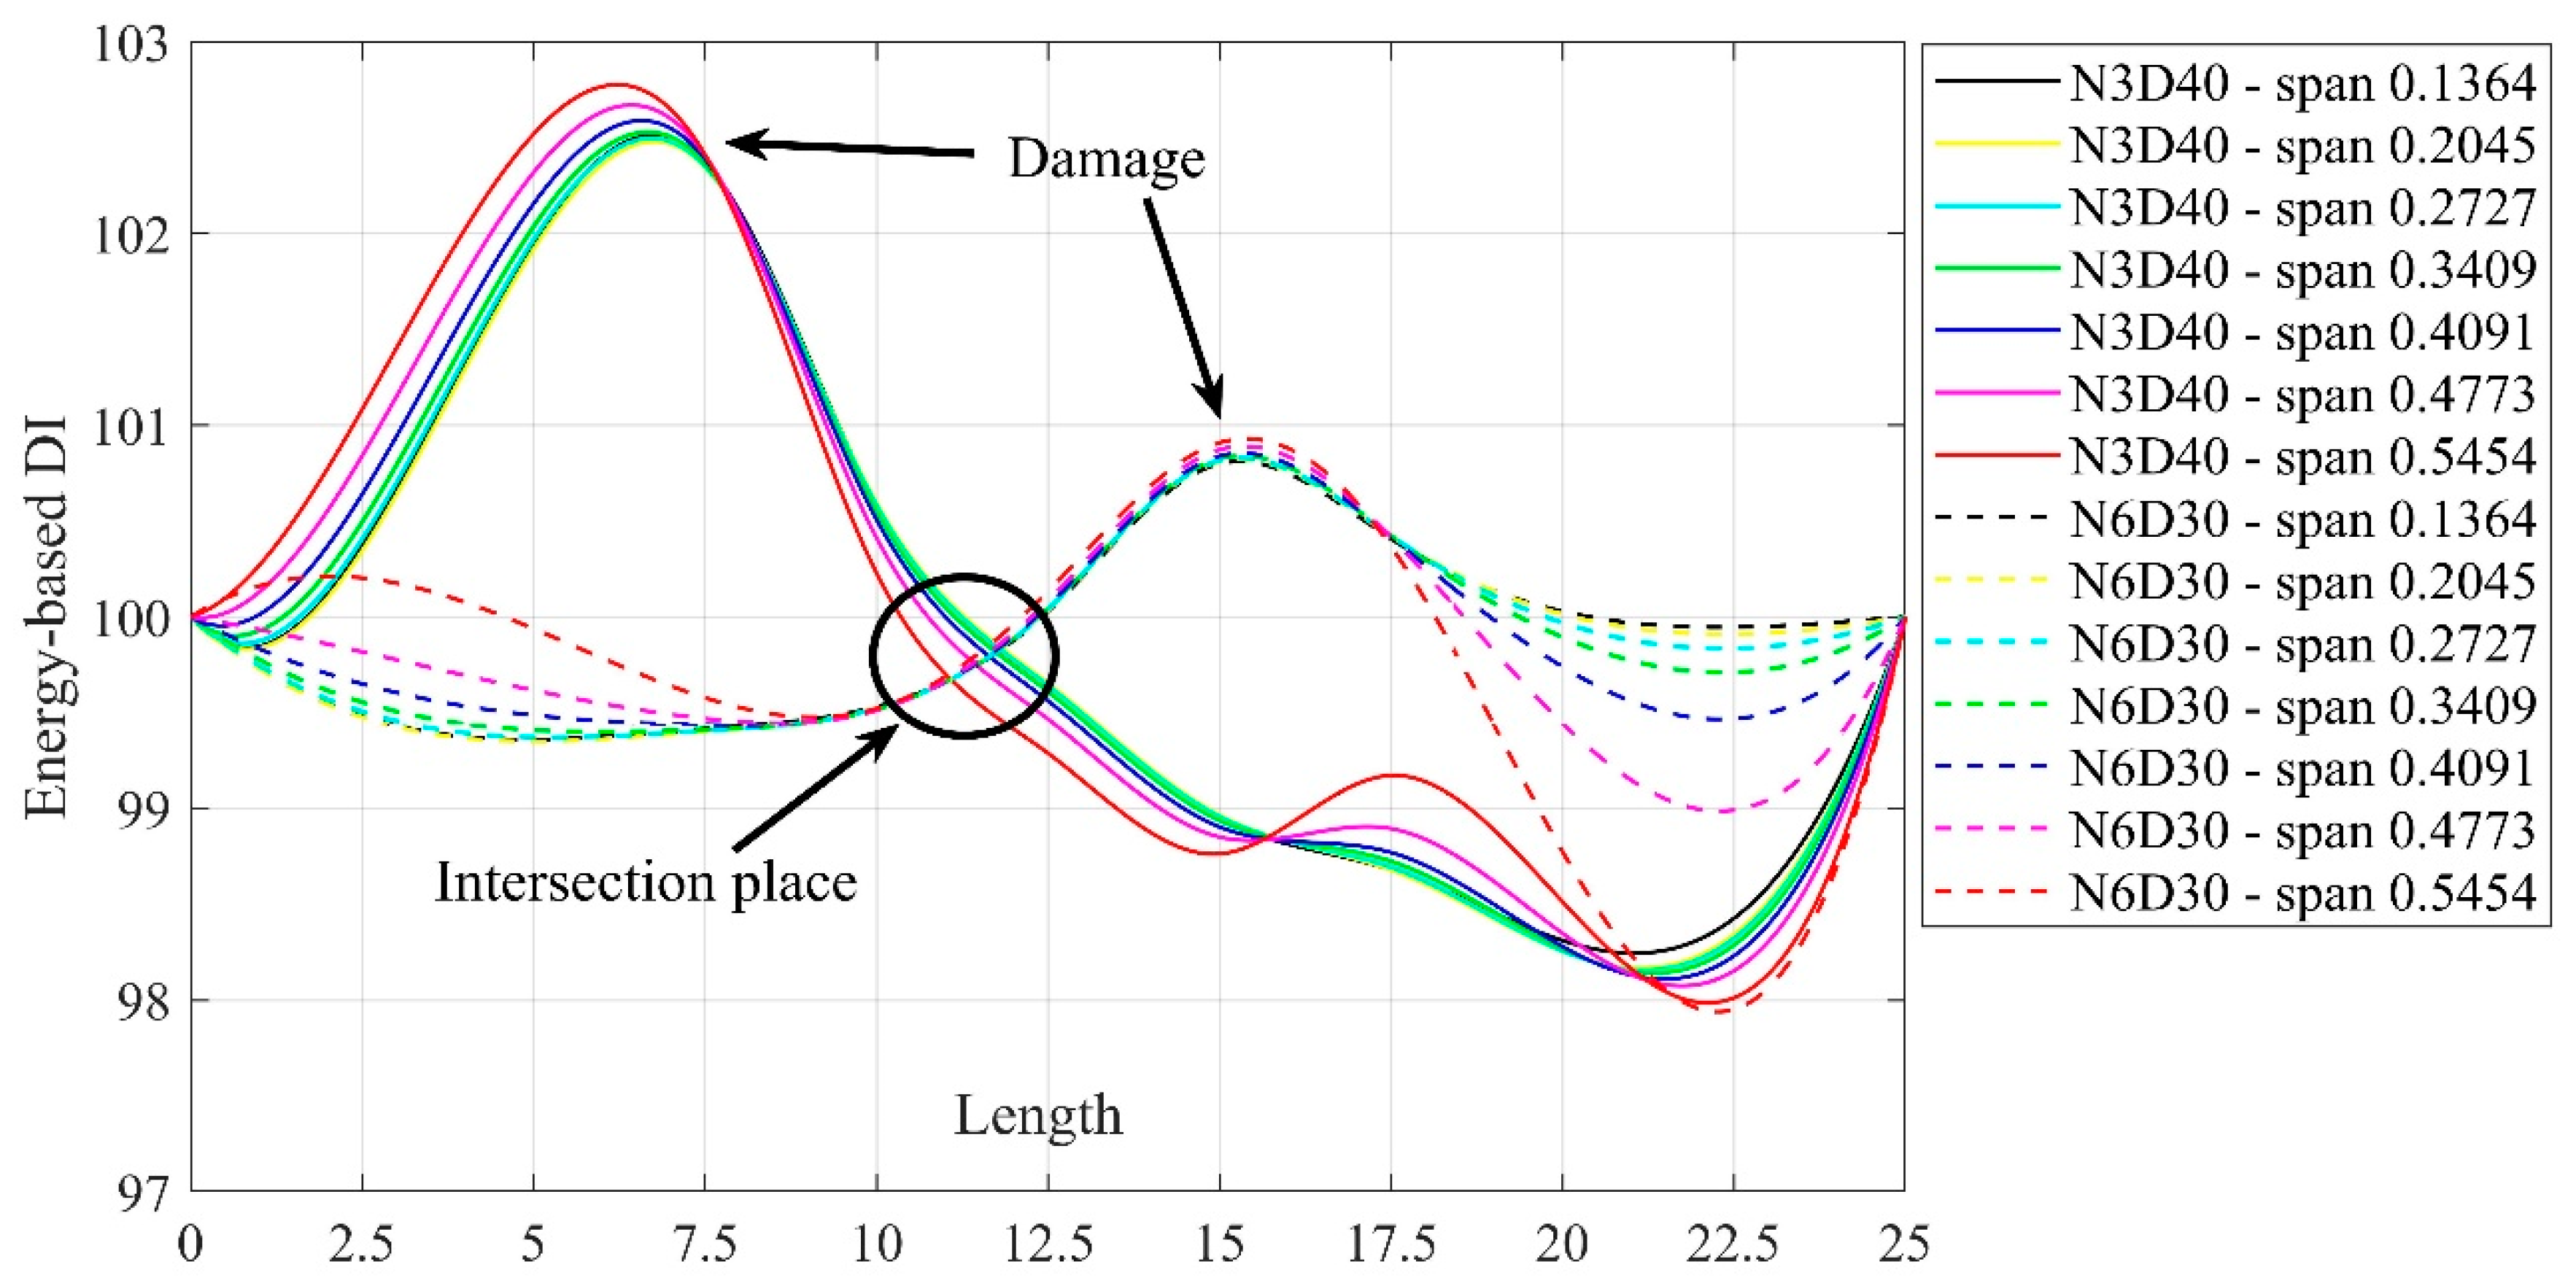
This section delves deeper into span selection and its optimization. It is known that the natural frequency shifts due to structural damage or temperature changes. This means that span determination will be challenging, as the span size cannot be changed dynamically. Therefore, it is necessary to study span determination to evaluate the sensitivity of the proposed method to span size. To this end, a set of different spans is considered for two scenarios: N3D40 and N6D30, under a truckload moving at a speed of 2.5 m/s. Seven distinct spans are selected for adjusting the Gaussian Kernel Smoothing Filter (GKSF): 0.1364 s, 0.2045 s, 0.2727 s, 0.3409 s (natural period), 0.4091 s, 0.4773 s, and 0.5454 s. The smoothed acceleration signals are then calculated for each span. Figure 12 illustrates the DI-spline for different scenarios under the specified truckload conditions.
The results presented in Figure 12 exhibit some noise. Despite this, the location of the damage can still be accurately identified using the GKSF-based method, which employs different filter spans to adjust the Gaussian filter. However, the intersection point shifts slightly, and this movement makes it difficult to quantify the damage precisely. Consequently, using varying spans to adjust the GKSF-based method can reduce the accuracy of the proposed approach. Additionally, as seen in Figure 12, the span of 0.5454 for scenario N6D30 shows a small peak at length 2.5, which represents a false alarm for structural damage.

5. Conclusions

The application of the GKSF in the field of bridge health monitoring was investigated in this study. It was established that the GKSF can effectively smooth acceleration responses, revealing only the first natural frequency of a bridge. Consequently, a baseline-free GKSF-based method was proposed to identify structural damage in bridges. By utilizing a damage index (DI), the proposed method was able to detect both the location and severity of damage without the need to calculate the dynamic modal properties of the bridge. Furthermore, an estimation of the baseline was provided in this study, which allowed the proposed method to be classified as baseline-free. The accuracy of the proposed method was further validated through a simply supported beam subjected to a truckload (uniformly distributed noise manually added to the numerical results). The results demonstrated that the proposed method is capable of accurately locating and quantifying structural damage in bridges using the smoothed acceleration response.
The following are the advantages of the GKSF-based method:
  • The GKSF is widely recognized as a de-noising filter, and the resulting GKSF-based method exhibits strong noise insensitivity.
  • The GKSF-based method is capable of determining both the location and severity of damage in both noisy and noise-free environments.
  • Fitting a Gaussian curve to the normalization factor enables the GKSF-based method to operate as a reference-free approach.
Moreover, the proposed GKSF-based method is capable of identifying damage without requiring prior knowledge of the damage or input data. As a result, the GKSF-based method is classified as an output-only approach. This characteristic makes the output-only GKSF-based method particularly well suited for practical applications.
The limitations of the proposed method are as follows:
  • Effect of speed on accuracy: Increasing the vehicle speed reduces the accuracy of the proposed method.
  • Limitation in detecting damage near the midspan: If damage occurs around the midspan of the bridge, accurately determining its severity is not possible.
  • The provided formula is designed only for single-damage scenarios.

Author Contributions

Conceptualization, H.K.; methodology, H.K.; software, H.K.; validation, H.K.; investigation, H.K.; resources, H.K.; data curation, H.K.; writing—original draft preparation, H.K.; writing—review and editing, H.K. and E.P.; visualization, H.K.; supervision, E.P.; project administration, E.P. All authors have read and agreed to the published version of the manuscript.

Funding

This research received no external funding.

Informed Consent Statement

Not applicable.

Data Availability Statement

The raw material data are available in [39].

Conflicts of Interest

The authors declare no conflicts of interest.

References

  1. He, W.Y.; Ren, W.X.; Zhu, S. Damage detection of beam structures using quasi-static moving load induced displacement response. Eng. Struct. 2017, 145, 70–82. [Google Scholar] [CrossRef]
  2. Yu, Y.; Zhang, C.; Zhu, X.; Kang, W.H.; Mao, X.; Uy, B. Design and experimental investigations of a vibration based wireless measurement system for bridge cable tension monitoring. Adv. Struct. Eng. 2014, 17, 1657–1668. [Google Scholar] [CrossRef]
  3. Pakrashi, V.; O’Connor, A.; Basu, B. A bridge-vehicle interaction based experimental investigation of damage evolution. Struct. Health Monit. 2010, 9, 285–296. [Google Scholar] [CrossRef]
  4. Kordestani, H.; Xiang, Y.Q.; Ye, X.W. Output-only damage detection of steel beam using moving average filter. Shock Vib. 2018, 2018, 2067680. [Google Scholar] [CrossRef]
  5. Kordestani, H.; Xiang, Y.Q.; Ye, X.W.; Jia, Y.K. Application of the random decrement technique in damage detection under moving load. Appl. Sci. 2018, 8, 753. [Google Scholar] [CrossRef]
  6. Hester, D.; Gonzalez, A. A wavelet-based damage detection algorithm based on bridge acceleration response to a vehicle. Mech. Syst. Signal Process. 2012, 28, 145–166. [Google Scholar] [CrossRef]
  7. Balafas, K.; Kiremidjian, A.S. Development and validation of a novel earthquake damage estimation scheme based on the continuous wavelet transform of input and output acceleration measurements. Earthq. Eng. Struct. Dyn. 2015, 44, 501–522. [Google Scholar] [CrossRef]
  8. Cantero, D.; Basu, B. Railway infrastructure damage detection using wavelet transformed acceleration response of traversing vehicle. Struct. Control Health Monit. 2015, 22, 62–70. [Google Scholar] [CrossRef]
  9. Hester, D.; González, A. Impact of road profile when detecting a localised damage from bridge acceleration response to a moving vehicle. In Damage Assessment of Structures X; Trans Tech Publications Ltd.: Zurich, Switzerland, 2013; Volume 569, pp. 199–206. [Google Scholar] [CrossRef]
  10. Zhu, X.; Law, S.S. Structural health monitoring based on vehicle-bridge interaction: Accomplishments and challenges. Adv. Struct. Eng. 2015, 18, 1999–2015. [Google Scholar] [CrossRef]
  11. Asayesh, M.; Khodabandeloo, B.; Siami, A. A random decrement technique for operational modal analysis in the presence of periodic excitations. Proc. Inst. Mech. Eng. Part C J. Mech. Eng. Sci. 2009, 223, 1525–1534. [Google Scholar] [CrossRef]
  12. Rodrigues, J.; Brincker, R. Application of the random decrement technique in operational modal analysis. In Proceedings of the 1st International Operational Modal Analysis Conference, Copenhagen, Denmark, 26–27 April 2005; pp. 191–200. [Google Scholar]
  13. Lee, J.W.; Kim, J.D.; Yun, C.B.; Yi, J.H.; Shim, J.M. Health-monitoring method for bridges under ordinary traffic loadings. J. Sound Vib. 2002, 257, 247–264. [Google Scholar] [CrossRef]
  14. He, X.H.; Hua, X.G.; Chen, Z.Q.; Huang, F.L. EMD-based random decrement technique for modal parameter identification of an existing railway bridge. Eng. Struct. 2011, 33, 1348–1356. [Google Scholar] [CrossRef]
  15. Wu, W.H.; Chen, C.C.; Liau, J.A. A multiple random decrement method for modal parameter identification of stay cables based on ambient vibration signals. Adv. Struct. Eng. 2012, 15, 969–982. [Google Scholar] [CrossRef]
  16. Buff, H.; Friedmann, A.; Koch, M.; Bartel, T.; Kauba, M. Design of a random decrement method based structural health monitoring system. Shock Vib. 2012, 19, 787–794. [Google Scholar] [CrossRef]
  17. Poncelet, F.; Kerschen, G.; Golinval, J.C.; Verhelst, D. Output-only modal analysis using blind source separation techniques. Mech. Syst. Signal Process. 2007, 21, 2335–2358. [Google Scholar] [CrossRef]
  18. Kerschen, G.; Poncelet, F.; Golinval, J.C. Physical interpretation of independent component analysis in structural dynamics. Mech. Syst. Signal Process. 2007, 21, 1561–1575. [Google Scholar] [CrossRef]
  19. Zhou, W.; Chelidze, D. Blind source separation based vibration mode identification. Mech. Syst. Signal Process. 2007, 21, 3072–3087. [Google Scholar] [CrossRef]
  20. Loh, C.H.; Hung, T.; Chen, S.; Hsu, W. Damage detection in bridge structure using vibration data under random travelling vehicle loads. J. Phys. Conf. Ser. 2015, 628, 012044. [Google Scholar] [CrossRef]
  21. Huang, C.; Nagarajaiah, S. Experimental study on bridge structural health monitoring using blind source separation method: Arch bridge. Struct. Monit. Maint. 2014, 1, 69–87. [Google Scholar] [CrossRef]
  22. Manie, S.; Karami, K.; Fatehi, P. Online system identification by sparse component analysis based on wavelet transform. Amirkabir J. Civ. Eng. 2020, 52, 2301–2320. [Google Scholar] [CrossRef]
  23. Karami, K.; Fatehi, P.; Yazdani, A. On-line system identification of structures using wavelet-Hilbert transform and sparse component analysis. Comput.-Aided Civ. Infrastruct. Eng. 2020, 35, 870–886. [Google Scholar] [CrossRef]
  24. Zhu, B.; Leung, A.Y.T.; Wong, C.K.; Lu, W.Z. On-line health monitoring and damage detection of structures based on the wavelet transform. Int. J. Struct. Stab. Dyn. 2008, 8, 367–387. [Google Scholar] [CrossRef]
  25. Talebi, M.; Tabrizian, Z.; Amiri, G.G. Identification of the modal parameters of a concrete bridge deck using traffic loads. Res. Sq. 2024. [Google Scholar] [CrossRef]
  26. Mojtahedi, A.; Hokmabady, H.; Kouhi, M.; Mohammadyzadeh, S. A novel ANN-RDT approach for damage detection of a composite panel employing contact and non-contact measuring data. Compos. Struct. 2022, 279, 114794. [Google Scholar] [CrossRef]
  27. Azizi, S.; Karami, K.; Mariani, S. Full-Field Modal Analysis Using Video Measurements and a Blind Source Separation Methodology. Eng. Proc. 2023, 58, 105. [Google Scholar] [CrossRef]
  28. Yang, Y.; Xie, R.; Li, M.; Cheng, W. A review on the application of blind source separation in vibration analysis of mechanical systems. Measurement 2024, 227, 114241. [Google Scholar] [CrossRef]
  29. Gonzalez, A.; Hester, D. An investigation into the acceleration response of a damaged beam-type structure to a moving force. J. Sound Vib. 2013, 332, 3201–3217. [Google Scholar] [CrossRef]
  30. Kordestani, H.; Zhang, C.; Shadabfar, M. Beam damage detection under a moving load using random decrement technique and Savitzky–Golay Filter. Sensors 2020, 20, 243. [Google Scholar] [CrossRef]
  31. Kordestani, H.; Zhang, C. Direct use of the Savitzky–Golay filter to develop an output-only trend line-based damage detection method. Sensors 2020, 20, 1983. [Google Scholar] [CrossRef]
  32. Kordestani, H.; Zhang, C.; Masri, S.F.; Shadabfar, M. An empirical time-domain trend line-based bridge signal decomposing algorithm using Savitzky–Golay filter. Struct. Control Health Monit. 2021, 28, e2750. [Google Scholar] [CrossRef]
  33. O’Brien, E.J.; Malekjafarian, A.; González, A. Application of empirical mode decomposition to drive-by bridge damage detection. Eur. J. Mech. A Solids 2017, 61, 151–163. [Google Scholar] [CrossRef]
  34. Ouyang, H. Moving-load dynamic problems: A tutorial (with a brief overview). Mech. Syst. Signal Process. 2011, 25, 2039–2060. [Google Scholar] [CrossRef]
  35. Yang, Y.B.; Cheng, M.C.; Chang, K.C. Frequency variation in vehicle-bridge interaction systems. Int. J. Struct. Stab. Dyn. 2013, 13, 1350019. [Google Scholar] [CrossRef]
  36. Cantero, D.; O’Brien, E.J. The Non-Stationarity of Apparent Bridge Natural Frequencies During Vehicle Crossing Events. FME Trans. 2013, 41, 279–284. Available online: https://www.mas.bg.ac.rs/_media/istrazivanje/fme/vol41/4/03_dcantero_ver2.pdf (accessed on 1 January 2025).
  37. Cantero, D.; Ronnquist, A. Numerical evaluation of modal properties change of railway bridges during train passage. Procedia Eng. 2017, 199, 2931–2936. [Google Scholar] [CrossRef]
  38. Malekjafarian, A.; O’Brien, E.J. Identification of bridge mode shapes using short time frequency domain decomposition of the responses measured in a passing vehicle. Eng. Struct. 2014, 81, 386–397. [Google Scholar] [CrossRef]
  39. Available online: https://www.researchgate.net/publication/338358257_Bridge_acceleration_responsesxlsx (accessed on 30 January 2025).
  40. Fan, W.; Qiao, P. Vibration-based damage identification methods: A review and comparative study. Struct. Health Monit. 2011, 10, 83–111. [Google Scholar] [CrossRef]
  41. Qiao, P.; Cao, M. Waveform fractal dimension for mode shape-based damage identification of beam type structures. Int. J. Solids Struct. 2008, 45, 5946–5961. [Google Scholar] [CrossRef]
  42. Zhang, Y.Y.; Ding, Y.; Pang, Y.T. Selection of optimal intensity measures in seismic damage analysis of cable-stayed bridges subjected to far-fault ground motions. J. Earthq. Tsunami 2015, 9, 1550003. [Google Scholar] [CrossRef]
  43. Kordestani, H.; Xiang, Y.Q.; Ye, X.W.; Yun, C.B.; Shadabfar, M. Localization of damaged cable in a tied-arch bridge using Arias intensity of seismic acceleration response. Struct. Control Health Monit. 2019, 27, e2491. [Google Scholar] [CrossRef]
  44. Kordestani, H.; Zhang, C.; Arab, A. An Output-Only, Energy-Based, Damage Detection Method Using the Trend Lines of the Structural Acceleration Response. Buildings 2023, 13, 3007. [Google Scholar] [CrossRef]
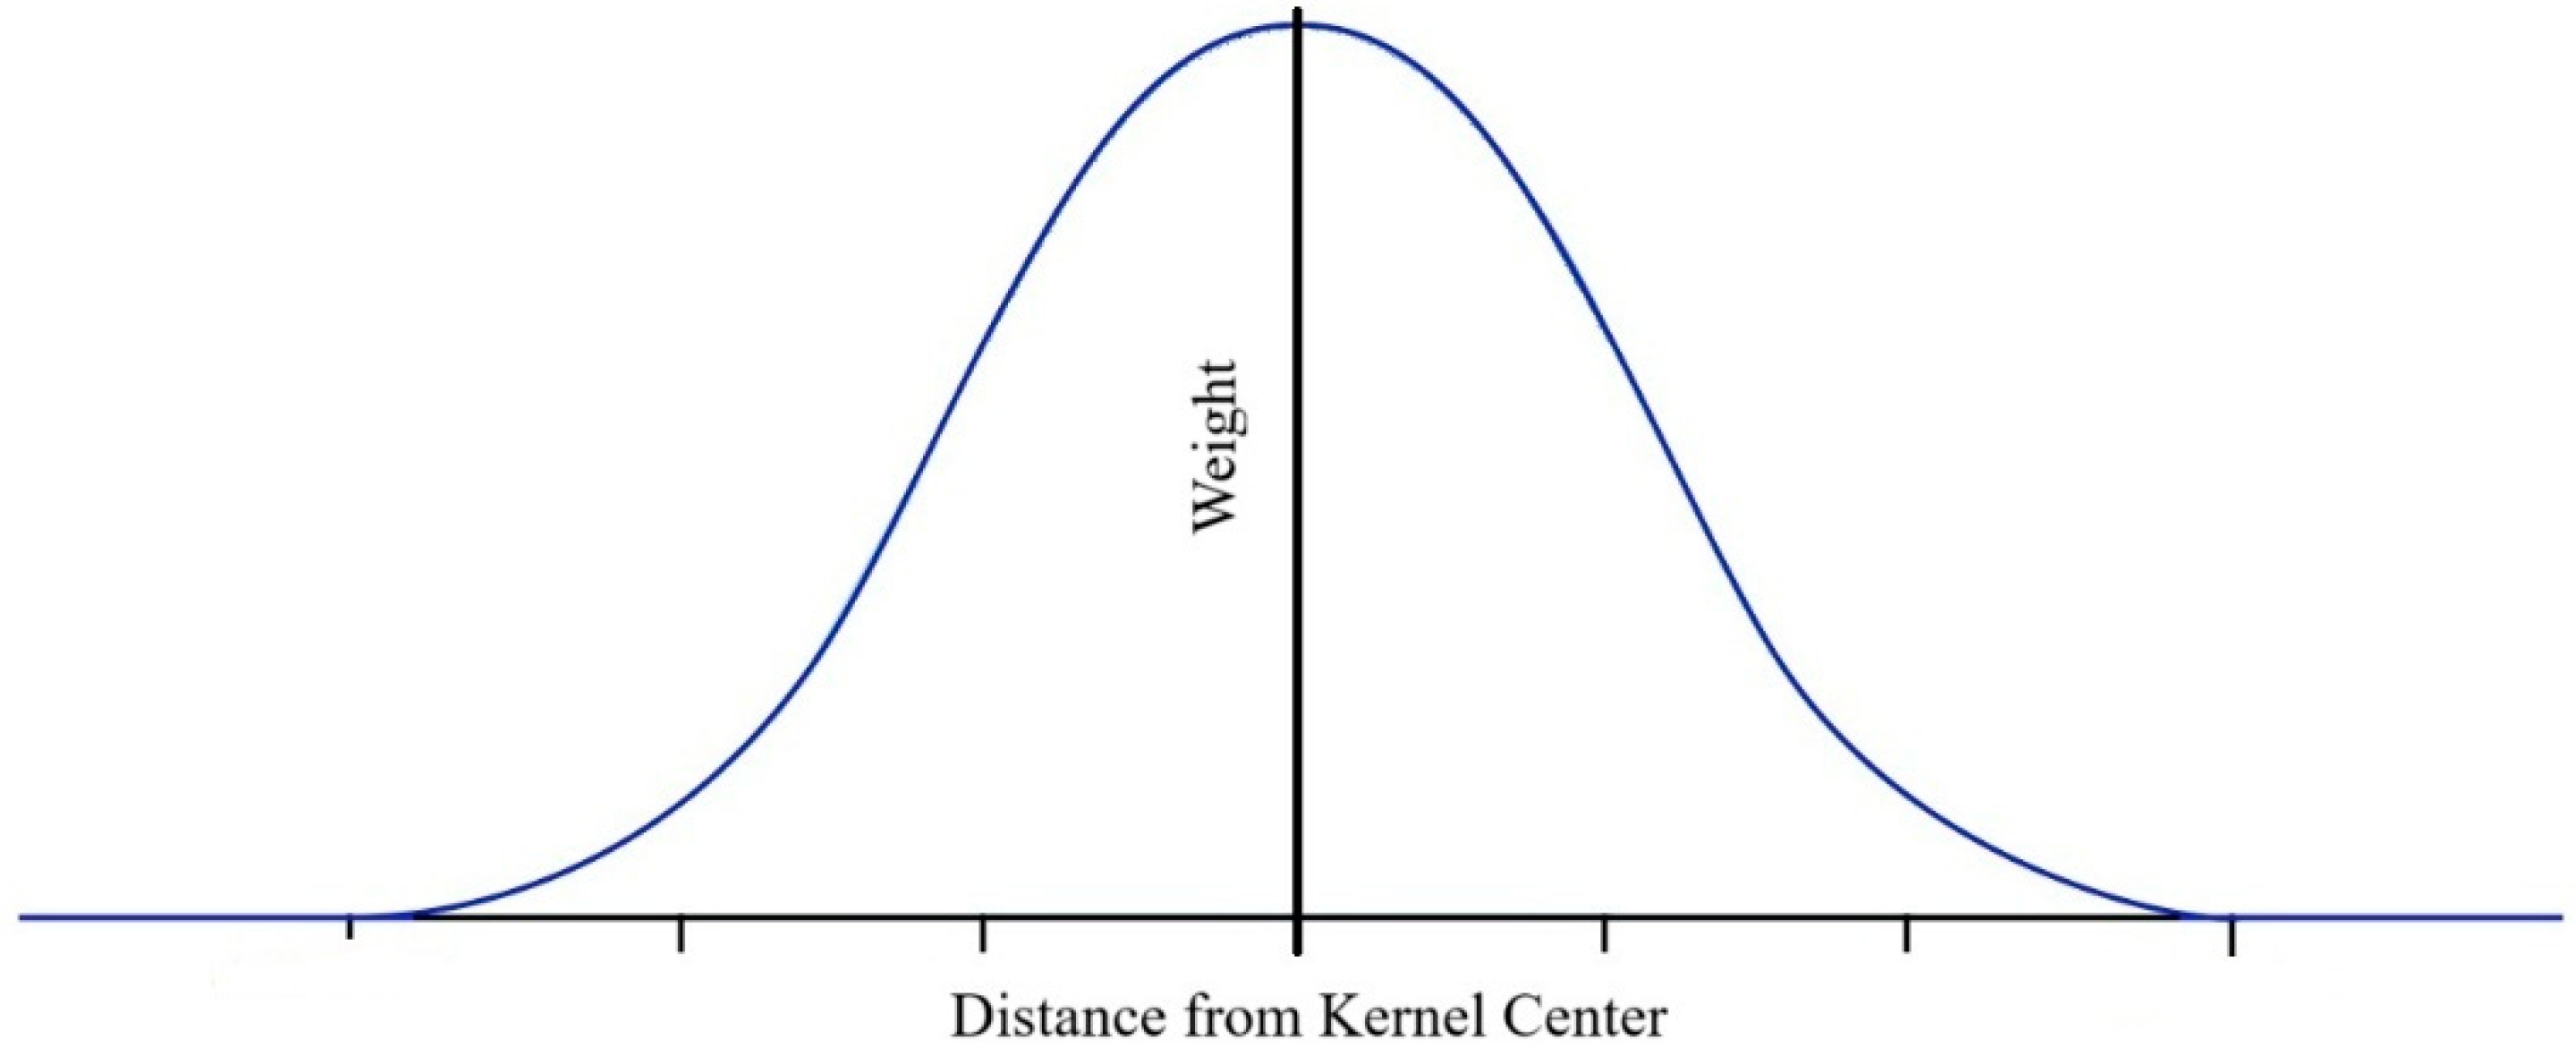
Figure 1. General Gaussian distribution.
Infrastructures 10 00058 g001
Figure 2. A bridge with simple supports under truckload at constant velocity.
Infrastructures 10 00058 g002
Figure 3. Distribution of nodes to obtain acceleration data.
Infrastructures 10 00058 g003
Figure 4. Vertical acceleration response in the middle of the bridge under moving sprung mass with a speed of 2.5 m/s.
Infrastructures 10 00058 g004
Figure 5. Smoothed acceleration signal calculated using the GKSF in Figure 4.
Infrastructures 10 00058 g005
Figure 6. DI-spline for scenarios of N3D40 and N6D40 under the truckload with a velocity of 1.25 m/s.
Infrastructures 10 00058 g006
Figure 7. DI-spline under different damage scenarios and velocities. (a) Truckload with a velocity of 1.25 m/s, (b) truckload with a velocity of 2.5 m/s, (c) truckload with a velocity of 4 m/s, and (d) truckload with a velocity of 8 m/s.
Infrastructures 10 00058 g007
Figure 8. Noisy DI-spline under different damage scenarios and velocities. (a) Truckload with a velocity of 1.25 m/s, (b) truckload with a velocity of 2.5 m/s, (c) truckload with a velocity of 4 m/s, and (d) truckload with a velocity of 8 m/s.
Infrastructures 10 00058 g008
Figure 9. Noisy and noise-free DI-spline for different damage scenarios subjected to a truckload with a velocity of 1.25 m/s.
Infrastructures 10 00058 g009
Figure 10. Noisy and noise-free normalization factors considering different velocities.
Infrastructures 10 00058 g010
Figure 11. Relative gradient between maximum of DI-spline value and intersection point.
Infrastructures 10 00058 g011
Figure 12. Noisy DI-spline calculated using different Gaussian filter spans with varying scenarios under a truckload (speed of 2.5 m/s).
Infrastructures 10 00058 g012
Table 1. Parameters of the bridge with simple supports.
PropertiesUnitSymbolValue
Length m L 25
Mass per unit k g / m μ 18,360
Stiffness N m 2 E I 4.865 × 10¹⁰
First natural frequency Hz ----2.933
Table 2. Parameters of truckload (spring–mass).
PropertiesUnitSymbolValue
Body mass k g m b 16,500
Axle mass k g m t 700
Suspension stiffness N m 1 K s 8 × 10⁵
Suspension damping N s m 1 C s 2 × 10⁴
Tire stiffness N m 1 K t 3.5 × 10⁶
Velocity m / s V1.25, 2.5, 4, 8
Table 3. Six damage scenarios used to numerically model the bridge structural damage.
Scenarios123456
Crack depth to beam height ratio40%30%20%40%30%20%
LocationNode 3Node 3Node 3Node 6Node 6Node 6
NameN3D40N3D30N3D20N6D40N6D30N6D20
Note: These scenarios are chosen as damage location and ratio (N & D). For instance, N3D30 means that the damage ratio equals 30% at Node 3.
Table 4. Normalization factor, γ i , for all four velocities under noisy and noise-free conditions.
SpeedNodes
1234567
Noise-free1.250.5080.9571.3181.4551.3120.9490.500
2.50.5100.9601.3181.4541.3100.9480.501
40.5180.9661.3201.4531.3050.9420.496
80.5270.9731.3181.4471.2980.9390.498
Noisy1.250.5090.9581.3171.4541.3120.9490.501
2.50.5100.9601.3171.4541.3100.9480.501
40.5180.9661.3191.4521.3050.9430.497
80.5270.9731.3181.4471.2980.9390.498
Table 5. Relative slope calculated for all damage scenarios.
ScenarioVelocity
(m/s)
SlopeScenarioVelocity
(m/s)
SlopeAverage
N3D401.250.5283Noisy-N3D401.250.52590.5519
2.50.57092.50.5697
N6D401.250.5532Noisy-N6D401.250.5688
2.50.54682.50.5513
N3D301.250.3040Noisy-N3D301.250.30390.3241
2.50.32592.50.3251
N6D301.250.3271Noisy-N6D301.250.3250
2.50.33972.50.3422
N3D201.250.1887Noisy-N3D201.250.18910.2002
2.50.19732.50.1972
N6D201.250.1941Noisy-N6D201.250.1897
2.50.22242.50.2234
Table 6. Changes in bridge natural frequency for each scenario.
First
Natural
Frequency
Change
%
Second Natural
Frequency
Change
%
Third
Natural
Frequency
Change
%
No damage2.933----11.602----25.638----
N3D202.9280.1711.5710.2725.6310.03
N3D302.9210.4011.5370.5625.6220.06
N3D402.9100.7811.4751.0925.6080.12
N6D202.9250.2711.5900.1025.6130.10
N6D302.9160.5711.5770.2125.5840.21
N6D402.9001.1211.5530.4225.5330.41
Disclaimer/Publisher’s Note: The statements, opinions and data contained in all publications are solely those of the individual author(s) and contributor(s) and not of MDPI and/or the editor(s). MDPI and/or the editor(s) disclaim responsibility for any injury to people or property resulting from any ideas, methods, instructions or products referred to in the content.