Article

An MCDM Approach to Lean Tool Implementation for Minimizing Non-Value-Added Activities in the Precast Industry

1
Department of Civil Engineering, Koneru Lakshmaiah Education Foundation, Vaddeswaram, Guntur (Dt.), Guntur 522205, India
2
Engineering Management Department, College of Engineering, Prince Sultan University, Riyadh 11586, Saudi Arabia
3
Structures and Materials Research Laboratory, College of Engineering, Prince Sultan University, Riyadh 11586, Saudi Arabia
4
School of Construction, NICMAR University, Pune 411045, India
*
Authors to whom correspondence should be addressed.
Infrastructures 2025, 10(3), 55; https://doi.org/10.3390/infrastructures10030055
Submission received: 5 January 2025 / Revised: 26 February 2025 / Accepted: 5 March 2025 / Published: 6 March 2025

Abstract

The construction industry is growing with the shortfall issues of productivity, functionality, and cost. Precast construction has significant potential to address these issues by incorporating lean principles. Lean focuses on enhancing value at every stage of the construction process. By combining these two approaches, the construction industry can effectively tackle these challenges. This research aims to achieve two main objectives: (1). To establish a connection between lean tools and non-value added (NVA) activities, (2). To prioritize these lean tools based on their relevance to major NVA activities. To accomplish this, an extensive review of the literature was conducted to examine the adoption of lean tools in various NVA tasks. A questionnaire survey was then employed to identify the root causes of NVA activities (criteria) and determine the most suitable lean tools for addressing each specific criterion. The findings from multi-criteria decision decision-making (MCDM) analysis highlight that total quality management (TQM) is ranked first in two methods while continuous improvement (CI) ranked first in one method. Comparing all the scenarios, it is observed that 5S and CI have been fluctuating between two and three rankings, and the remaining ranks have very minute changes. Based on all these lean tools are prioritized as TQM > CI > 5S > JIT > VSM > PY.

1. Introduction

Technology breakthroughs, transforming market dynamics, and developing industry practices have all contributed to the construction sector’s tremendous evolution over time. Yet, there are growing issues with productivity, functionality, and cost in the framework of construction processes, which have a significant negative impact on the construction industry and the overall economies [1,2]. Precast construction has an ample of potential to spur the development of innovative, safe, highly effective strategies for construction.
The precast industry is well renowned for its speedy building procedures and superior-quality, enduring products, but it also contains several NVA activities that reduce the efficiency of the approach. The Construction Industry Institute (CII) estimates that only 26% of effort is lost in the manufacturing industry, with value-adding activities accounting for 62% of the total work and supporting activities for 12%. Those figures are 57%, 10%, and 33%, respectively, in the construction industry [3]. It is recommended by Pasquire and Connolly [4], producing more structures, components, sections, and pieces in factories to successfully incorporate lean production into construction projects.
Lean is derived from the Toyota Production System in Japan. Delivering what the consumer values in a product and creating in line with that are the main goals of lean [5]. The lean methodology consistently prioritizes increasing productivity while utilizing fewer resources to satisfy customer expectations. Lean production has already led to considerable gains in the industrial sector, as well as the precast industry for reducing NVA activities. Lean seeks to decrease waste while boosting productivity, safety, and health to better serve customers. NVA activities are frequently seen as waste, which is a significant issue in the precast industry. NVA activities exhibit an adverse impact on both productivity and the environment. Inadequate inventory management, wait times, excessive production, unnecessary movement, improper operations, and defective production represent a few of the NVA activities that lead to the waste of funds, time, and assets [6].
Lean is a broad theory that incorporates many tools or ideas. The studies had already established the best kind of instrument for a certain issue. The sheer number of NVA activities in the precast industry makes it challenging to select the right tool. On a practical level, an industry cannot embrace all new approaches at once because doing so puts greater pressure on the workers and may provide outcomes that are less than satisfactory. It can additionally have negative effects on the production system. Therefore, there are several criteria that must be taken into account when solving this problem, as well as many potential solutions. The aim of this research is to understand the best one by evaluating lean tools that will decrease NVA activities in the precast industry. The multi-criteria decision-making (MCDM) approach is suitable for this kind of problem. The MCDM problem in the present research consists of six criteria, namely NVA activities, and six alternative lean tools. The proposed model within the scope of the study was solved with three MCDM methods consisting of TOPSIS, EDAS, and VIKOR. The methodology proposed in this study represents a novel approach within the context of the specific sector and problem structure it addresses.

2. Literature Review

2.1. Lean Adoption in Construction

Lean philosophy in the construction industry addresses the benefits of lean in construction, barriers to implementing lean, critical success factors, limiting accidents, sustainability issues, and sustainability aspects [7,8]. Although many lean approaches are in their early stages, they are gaining popularity due to their ability to improve project bottom lines [9]. Lean technologies and procedures are the best solutions for these issues [5]. The benefits of these ideas include less weariness and stress, a cultural transformation, a faster turnaround for material traceability, waste elimination, financial gains, less rework, a shorter lead time, and less inventory [7].
Numerous studies have discovered that NVA labor occupies 95% of the time, leaving only 5% for value-added activity, and lean methodology focuses primarily on minimizing NVA activity. An evaluation instrument developed by Salem et al. [9] includes six lean construction tools: the final planner, better visualization, huddle meetings, first-run studies, the 5S, and a fail safe for quality. This review process results in cost savings, enhanced subcontractor–manager communication, on-time project completion, and accident prevention.

2.2. Lean Adoption in Precast Industry

Using lean manufacturing practices, the precast industry can achieve significant improvements in efficiency and cost reduction. Lean principles enable organizations to identify and eliminate waste, streamline processes, and optimize resource utilization. For example, Wang et al. [10] highlighted the potential of lean methods to reduce deficit expenditure and labor demands in precast manufacturing processes. Similarly, Nahmens and Ikuma [11] demonstrated that implementing lean techniques in manufacturing operations can result in measurable benefits, such as reducing labor requirements from 9 to 6.5 workers, lowering equipment space utilization by 12%, and cutting material waste by 10%. These improvements underscore the practicality of lean manufacturing in enhancing production efficiency and reducing operational costs.
Avelar et al. [12] further illustrated the application of lean in the precast industry, showcasing how lean practices reduced inventory space requirements by 42%, leading to a 50% reduction in inventory investment. Additionally, their findings highlighted enhanced product flow, improved labor satisfaction, and increased workplace safety as key outcomes of adopting lean methodologies. These studies demonstrate how lean practices not only address operational inefficiencies but also foster a more productive and safer working environment.

2.3. NVA Activities and Lean Tools

Lean manufacturing, pioneered by Toyota, specifically through the Toyota Production System (TPS), which was developed by Taiichi Ohno and his team and was repackaged by Womack and Jones [13], revolves around five fundamental principles aimed at optimizing processes to deliver maximum value with minimal waste: identifying value streams, creating an uninterrupted value-generating flow, developing consumer pull to align production with demand, and striving for perfection through continuous improvement. These principles serve as the foundation for reducing unnecessary resource consumption, including manpower, materials, and time, while maintaining or enhancing the quality of output. To achieve these objectives, various supporting methodologies and tools are employed, such as total quality management (TQM), just-in-time (JIT), total productive maintenance (TPM), employee engagement, continuous improvement (CI), standardization, concurrent engineering (CE), value-based analysis, and visual management [14]. At its core, lean manufacturing distinguishes between two types of activities: conversions, which add value to processes or products, and flows, which consist of NVA activities that waste resources without contributing to quality or efficiency [15].
The practical application of lean manufacturing principles has been extensively studied to address inefficiencies across various industries. For instance, Wu et al. [15] demonstrated the use of tools like JIT, CI, continuous flow (CF), and TQM to tackle a broad spectrum of inefficiencies, such as reducing defective production, minimizing inventory levels, shortening waiting times, and controlling overproduction. Their study highlighted how JIT and TQM could specifically enhance operational accuracy by mitigating errors. Similarly, Singh and Kumar [16] employed JIT, value stream mapping (VSM), CI, and TQM to optimize production processes. These tools helped eliminate defects, reduce unnecessary inventory, address waiting times, and control overproduction. They also leveraged VSM to identify and eliminate unnecessary movements within operations, improving overall workflow efficiency.
Rubio-Romero et al. [17] focused on using poka-yoke (PY) and the 5S methodology to create mistake-proofing mechanisms and ensure a more organized production environment. PY effectively addressed faulty production and overproduction, while 5S contributed significantly to reducing unnecessary inventory, waiting times, and movement. The integration of these tools improved operational accuracy and streamlined processes. Expanding on this, Yücenur and Şenol [18] demonstrated the combined use of 5S, JIT, and TQM to tackle inefficiencies holistically. Their approach minimized defects, optimized inventory management, improved production flow, and controlled overproduction while addressing unnecessary movements and operational errors.
Ahmad [6] focused on the application of JIT, CF, CI, and the Kanban system, emphasizing the reduction in unnecessary inventory and movement within production processes. Although the study was more targeted, it showcased the versatility of lean tools in addressing specific challenges. However, inefficiencies such as faulty production, waiting times, overproduction, and operational errors were not explicitly explored. Alinaitwe [19] on the other hand, demonstrated the effectiveness of JIT, TQM, and VSM in reducing waiting times, controlling overproduction, and minimizing unnecessary movements while enhancing operational flow and efficiency. Although the study primarily focused on select inefficiencies, it provided valuable insights into lean tools’ ability to optimize specific aspects of the production process. Sundar et al. [20] explored the implementation of lean tools such as VSM, 5S, and Kanban in automotive manufacturing to minimize process inefficiencies. Their study showed significant reductions in defective production and inventory levels through the integration of these tools, while Kanban was particularly effective in ensuring smooth production flow by addressing waiting times and overproduction. Similarly, Mani et al. [21] emphasized the role of JIT and TQM in electronics manufacturing, demonstrating how these tools improved product quality and reduced operational delays. Their research highlighted the importance of CI practices in maintaining consistent performance gains.
JIT aims to decrease the production time flow and minimize the response time from suppliers to end users. It embodies a mindset, approach, and control system to effectively manage and reduce waste in production. It is more effective in material management [22,23]. A case study in Chennai used lean ideas, specifically VSM, in a precast component manufacturing operation. The application reduced lead time from 1102 to 739 min while increasing daily production from 33 to 40 units. Efficiency and effectiveness increased by 49% and 21.2 percent, respectively [24]. Prior research has indicated a strong and favorable correlation between sustainable performance and TQM approaches. Research in the Palestinian construction industry has demonstrated that, while TQM methods and sustainable performance indicators were moderately implemented, they have a favorable impact on economic, environmental, and social sustainability. These findings highlight the importance of TQM in creating holistic and sustainable improvements in the construction industry [25]. Previous research has also found a strong empirical link between employee participation and continuous improvement—two critical components of TQM and product innovation in production firms, particularly in Rivers State. These findings are consistent with the existing literature, highlighting the positive impact of TQM practices on fostering creativity and enhancing innovation in the industrial sector [26].
Collectively, these studies underscore the adaptability of lean manufacturing tools and principles in addressing a wide range of inefficiencies. The consistent application of JIT, TQM, 5S, and VSM across different contexts highlights their versatility and effectiveness. Whether addressing defective production, excessive inventory, waiting times, overproduction, or unnecessary movements, these tools enable organizations to achieve streamlined, cost-effective, and resource-efficient production processes. By continuously refining processes and eliminating waste, lean manufacturing fosters a culture of continuous improvement, enabling businesses to remain competitive in dynamic market environments.

Case Study

A company that we referred to as XYZ Precast Concrete (a company that produces precast concrete components for the construction industry) was in dire straits. Waste, long lead times in production, quality inconsistencies, and frequent rework were among the high points listed. To overcome these challenges, the company decided to apply lean manufacturing principles, mainly in the activities of TQM, CI, and 5S methodology.
That was the first step in their lean transformation—adoption of TQM. This was an approach to improve product quality as well as improving process management in the organization. To standardize its quality, the company began by putting into practice a series of quality audits and organized ongoing training programs to inform employees about quality standards and the necessity to maintain consistency. They also established feedback from customers so they can track and respond to quality issues. Therefore, these defects were reduced by 30% and the customer satisfaction improved greatly.
The company then had a CI through kaizen events, where employees were motivated to experiment with improvements in the production process and then suggest them. By using root cause analysis, they could nail down inefficiencies such as bottlenecks in the assembly line and communication within the departments was not operating as smoothly. The result of these efforts was a 20% increase in overall productivity mitigated by delays preventing delivery schedules.
The 5S methodology was the third key lean tool that was adopted, which aimed to organize the workplace and eliminate waste to improve efficiency. With the 5S approach, XYZ Precast had organized workstations, labeled the tools, and implemented standard operating procedures (SOPs). They were trained on the need for maintaining an orderly environment and were made to perform daily cleaning routines. These actions led to a 25% improvement in worker efficiency by eliminating needless movements and finding time to locate tools.
It was evident that integrating lean manufacturing principles into their operations resulted in the following. Production lead times were shortened, product quality improved, and waste levels were reduced and work continued to improve. The lean transformation of XYZ Precast generated cost savings and strengthened XYZ Precast’s competitiveness in the market.

2.4. Analysis of Lean Through MCDM

The MCDM approach enables decision-makers to rank alternatives according to their relative relevance after evaluating them according to numerous criteria. Vinodh and Swarnakar [27] used a hybrid method based on fuzzy DEMATEL-ANP-TOPSIS for lean six sigma (LSS) projects. Five possible LSS projects were discovered by the investigation, and project P3 was found to be the best LSS project after using the hybrid technique. Bi-objective mathematical modeling with MCDM was also used. Decision-makers can analyze numerous criteria concurrently and optimize supplier selection and order allocation choices by combining MCDM with bi-objective modeling.
Using SWARA (sequential stepwise weight assessment ratio analysis) and fuzzy VIKOR (VlseKriterijumska Optimizacija I Kompromisno Resenje) techniques, Yucenur and Senol [18] investigated the removal of waste and the development of lean building processes. According to the study’s findings visual management and kanban are the two best lean strategies for application in the construction sector. The integrated MCDM technique’s efficacy and showed that applying it to the lean implementation procedure provides a trustworthy and long-lasting strategy for implementing lean.

2.5. Proposed Research Model

A proposed research model between the major lean tools and major NVA activities is created as Figure 1, which shows the causes of NVA activities and how lean tools may assist to lessen those effects. It is evident that NVA activities like unnecessary inventory, waiting time, overproduction, unnecessary movement, incorrect operations and faulty production have a bigger impact than other NVA activities, while JIT, CI, TQM, VSM, PY, and 5S are the most often employed lean tools for minimizing NVA activities. Unnecessary inventory results in a rise in maintenance, storage space, and labor costs, which indirectly raises industry costs. By delaying manufacturing, lengthening the lead time, or wasting resources, waiting time drastically reduces the productivity of the industry.
Overproducing items is not a common practice in the industry; it is preferable to create only what is required rather than waste resources, money, time, and storage space by doing so. Faulty production can have negative repercussions on the precast sector, leading to significant waste including the buildup of scrap materials, rework, and extended production cycle times. Additionally, it may result in increased expenses, decreased productivity, and decreased customer satisfaction. The easiest method to deal with the issues brought on by NVA operations is to employ lean tools. JIT allows for job completion at the proper time and location, which lowers maintenance costs and storage needs. The procedure and effectiveness of new techniques, tools, or worker performance are continuously monitored by CI; doing so reduces defects, boosts productivity, and maximizes budget usage. TQM may recognize customer requirements, reduce overproduction, and identify consumer wants by giving priority to customer values. VSM allows for concentration on the value generating processes by withdrawing the other activities. PY acts as error proofing, which reduces the incorrect processes and faulty production. 5S enables the reduction of waste and utilizes the resources in an optimal way.

2.6. Scope and Objective of Study

In previous work conducted by Dara et al. [28], which focused on reducing NVA activities in the precast industry by exploring the impact of specific lean tools such as JIT, CI, and TQM, the primary objective was to establish a relationship between these tools and NVA activities like unnecessary inventory, waiting times, overproduction, and faulty production. By employing partial least square structural equation modelling (PLS-SEM), the study provides insights into how these lean tools contribute to improving operational efficiency and reducing waste. The emphasis was on demonstrating the effectiveness of these tools in addressing inefficiencies and optimizing processes within the precast industry, forming the foundation for lean tool adoption.
Building on this foundation, the current research extends the scope by not only exploring the connection between lean tools and NVA activities but also by prioritizing these tools based on their effectiveness. It adopts a MCDM framework that includes methods such as TOPSIS, EDAS, and VIKOR to rank the lean tools according to their suitability for mitigating major NVA activities. This structured approach evaluates lean tools against multiple criteria, providing a deeper understanding of their impact and relevance. Additionally, the current research incorporates sensitivity analysis to validate the robustness of the rankings, offering practical guidance for decision-makers in the precast sector. By integrating a broader set of evaluation techniques, the current study moves beyond the findings of the previous research by Dara et al. [28] to deliver a comprehensive framework for systematically identifying and implementing the most effective lean tools.

3. Research Methodology

The research methodology for the study is covered in this part, and it is shown in a generalized way in Figure 2.

3.1. Enactment of Questionnaire Survey

The questionnaire has five sections. Questions include general demographics of the respondents. The next successive sections cover information about the leans and NVA activities relationship. The instrument for gathering data is the five-point Likert scale. On the scale, there appear to be five viable responses: (1) strongly disagree, (2) disagree, (3) neither disagree nor agree, (4) agree, and (5) strongly agree. According to how agreeable they are with the questions posed, respondents are asked to choose a scale. Pilot research is carried out to determine the validity of the modified questionnaire. The participants in this pilot project are experts in the precast industries and lean fields. The questionnaire was then revised to account for the pointed-out mistakes and submitted for the main survey.
According to the conceptual model presented above, the questionnaire is set up so that each factor is connected to each lean tool. In this way, the influence of each lean tool on each NVA activity can be known. For convenience during data analysis, questions are coded as (UI1, UI2, ......, WT1, WT2, etc.).

3.1.1. Sample Population

Data gathering is challenging in this study field due to the large number of businesses and employees. This research used a purposive sample, since it was uncertain how large the targeted sample would be. The majority of the study’s participants are professionals with at least two years of expertise in the construction sector. The population is made up of professionals, including managers in the precast industry, managers in the construction industry, lean associates, academics, project managers, etc. Equation (1) below shows the formula used to produce the sample value taken from [29]. A 95% confidence interval and an 8% error value are considered when calculating sample size [2]. Considering this
n = z 2 × p × q e 2
where n = sample size
  • z = 1.96 @ 95% confidence level
  • p = estimated fraction of the population with a specified standard
  • q = 1 − p
  • e = desired margin of error, i.e., 0.08.

3.1.2. Respondent Profile

In this study, 150 participants were given the completed questionnaire; 99 of them responded, achieving a response rate of 66%. The acquired response rate for the construction research is considerable [2]. Precast industry managers, construction managers, lean associates, academics, and project managers make up these responses. The demographic details of the respondents are given in Table 1 below.

3.1.3. Content Validation

To prove content validity, the instrument must demonstrate that it fairly and completely covers the subject or areas it claims to cover [2]. The expert review was given to five academics and business experts. The questionnaire instrument was modified in response to the advice provided by these experts.

4. Assessing Lean Tools for Recognition and Elimination of Key NVA Activities in the Precast Industry

4.1. Contextualizing the Problem

The precast industry includes various procedures that entail a substantial amount of NVA activities. These activities have a negative effect on the industry’s iron triangle, which lowers productivity. Identifying the NVA activities that affect the processes and eliminating them using appropriate techniques can mitigate losses across all stages and contribute to the development of the global economy in a cascading manner. This research aims to achieve two main objectives:
(1)
to establish a connection between lean tools and NVA activities.
(2)
to prioritize these lean tools based on their relevance to major NVA activities.

4.2. Decision Criteria Description

This literature review assisted in identifying the key NVA activities as well as their root causes and operational-wide impacts. By combining the data from these evaluations and incorporating the insights of industry experts who have extensive knowledge and experience in the field, suitable criteria and tools were determined.

4.2.1. Criteria 1—Unnecessary Inventory

The precast industry includes hidden costs to take into consideration in addition to the direct expenses of surplus or wasted raw resources. Additionally, there are expenses for transporting and managing merchandise in addition to fees for storage containers and proper handling of inventory. The overall impact is also influenced by the insurance expenses associated with holding excess goods. In the precast sector, excess inventory results in missed opportunity costs in addition to the waste of funds, time, and raw materials. The tied-up capital could have been invested in more productive areas, generating higher returns.

4.2.2. Criteria 2—Waiting Time

Waiting time is viewed as one of the NVA activities because it only lengthens the overall lead time and costs and adds no value to the end goods or service. Time wastage can occur for a variety of reasons, such as when workers lack the proper tools, when they need clarification before moving forward with a procedure, or when machines are out of commission or in high demand and require coworkers to take turns using equipment. It is critical for players in the precast sector to address these challenges as soon as possible to improve efficiency and productivity.

4.2.3. Criteria 3—Overproduction

Overproduction is often seen as the biggest contributor to waste since it can have a domino effect on various waste groupings such as transportation, stock, movement, waiting, overprocessing, and flaws. Overproduction can also arise when components are overstocked throughout the manufacturing process. Precast enterprises may cut waste, increase productivity, and improve overall product quality by detecting and rectifying overproduction.

4.2.4. Criteria 4—Unnecessary Movement

Unnecessary movement primarily consists of people’s movements. Walking between different zones, such as the production space, yard, fabricating area, and office, to engage in NVA tasks like authoring internal emails or tackling reports for clients or management, are all examples of motion waste. Identifying and eliminating motion waste is critical for improving efficiency and avoiding wasted effort. Precast sector stakeholders may considerably boost performance through creating a more streamlined and functional working environment by optimizing workflows, organizing workstations, and minimizing unnecessary motions.

4.2.5. Criteria 5—Incorrect Operations

Incorrect operations include any actions that are carried out inadvertently or do not satisfy the specified quality norms, leading to waste, rework, and extra expenditure. Poor training, the absence of standardized operating procedures, inadequate interaction, and insufficient inspection methods are all factors that contribute to incorrect operations. Rework and corrective measures cost both time and money, reducing productivity and profitability.

4.2.6. Criteria 6—Faulty Production

A faulty product in the precast concrete industry is one that does not satisfy the appropriate standards or fails to meet consumer expectations. Faulty products, like any additional kind of trash, create more challenges and expenses throughout the manufacturing process. It is also worth noting that they contribute to environmental waste. For these reasons, specialists in lean quality management frequently see faults as the most significant kind of waste. Defect detection and resolution are crucial to improving overall quality and reducing waste. The use of lean tools makes it easier to complete these jobs successfully. Precast companies can efficiently handle problems and enhance overall performance by implementing lean principles.

4.3. Decision Alternatives Description

The increasing frequency of NVA activities in the precast industry has underlined the importance of embracing lean tools in this industry. To address this issue, the initial strategy is to identify the NVA activities prevalent in the industry, which is done through a literature review, followed by the application of lean tools to reduce these NVA activities. The goal of this study’s challenge is to analyze six alternative lean strategies that have been carefully chosen by the experts to reduce key NVA processes and increase productivity. In the study, various lean tools were analyzed and identified such as JIT, CI, TQM, VSM, PY, and 5S. However, each tool’s effectiveness is dependent on a couple of factors such as industry type, operational complexity, and integration with existing processes are good at inventory and flow control, whereas TQM and PY are better in the quality management and defect prevention. Likewise, these tools have comparative advantages in certain contexts, and the use of these tools in different contexts warrants further exploration. A further analysis of their performance, implementation difficulties, and flexibility across industries would offer significant information to make lean strategies work to their fullest capabilities. The following are the alternative lean tools that were chosen through an in-depth study and survey among the subject experts:

4.3.1. Alternative 1—JIT

JIT highlights the idea of having the correct resources in the right number, quality, and quantity. This management tool is designed to improve production flow by cleaning up inventory. Rather than excessively hoarding resources and goods in order to prepare for unforeseen events, JIT focuses on enhancing product quality and lowering material buffer. This technique contributes to budget reduction by significantly lowering storage costs and material stockpiling [30]. JIT has also been defined as a popular LC, site management, and environmentally friendly practice that has been incorporated as part of traditional construction practices.

4.3.2. Alternative 2—CI

CI is a crucial lean methodology used in the precast sector to enhance productivity and eliminate waste. CI is commonly referred to as kaizen. CI shows that the methods used in this field are planned, organized, and incorporate systematic procedures that lead to improved organizational performance [31]. The LC Institute suggests groups outline the value stream of current industry practices in order to define base criteria of time, cost, safety, and quality to drive CI.

4.3.3. Alternative 3—TQM

TQM is defined by three fundamental words: total, quality, and management. Total refers to taking into account everyone, quality refers to achieving their expectations, and management involves everyone’s commitment [32]. TQM is the primary strategy for sustaining competitive excellence, as well as a method of management that meets the demands of customers and employees, increases productivity and effectiveness, and ultimately results in high-quality solutions and services. TQM has the capability for strengthening the industry over time by reducing waste and increasing profitability.

4.3.4. Alternative 4—VSM

VSM examines the current status of the process and seeks to boost productivity through three methods: process change, elimination of redundant activity, and activity improvement. The VSM rigidly divides operations into three types: (1) non-value adding, (2) essential but non-value adding, and (3) value-adding. The first is sheer waste, with superfluous behaviors that should be avoided at all costs. The second involves acts that are required but that are potentially wasteful. VSM could be used to analyze and aid in the design of processes, trace material flow, and document information flow of a certain product or product family in addition to identifying waste in a system. As a result, the value stream mapping approach provides effective methods for establishing strategic orientations for superior decision-making and work design [33].

4.3.5. Alternative 5—PY

PY serves as a lean tool designed to stop mistakes and flaws in a process from happening. The word “mistake-proofing” or “error-proofing” is of Japanese origin. PY mistakes are prevented or found before they may lead to faults in a process or a product [34]. Instead, then depending on inspection or rectification after the fact, PY aims to remove faults at the point of origin by preventing mistakes from occurring or discovering them earlier in the process. PY may be used in the precast sector in a variety of ways, such as employing color-coded components, creating templates or jigs for precise positioning of reinforcing bars, or putting sensors in place to detect mistakes during the curing process. These techniques aid in the prevention of mistakes and flaws, leading to higher-quality goods and lower prices.

4.3.6. Alternative 6—5S

5S is a work environment management strategy that has a good impact since it aids in the control of critical zones on construction sites. This includes managing employees, materials, tools, and other resources on the job site. The process is divided into five phases: seiri (classify), seiton (order), seiso (clean), seiketsu (standardize), and shitsuke (audit). After all phases are completed, it is projected to improve productivity and minimize waste. The 5S technique assists in maintaining an appropriate site to complete the flow of operations optimally. Visual management is an important component of 5S application in the workplace [35]. 5S can be used in the precast sector to enhance worker efficiency, reduce waste, and improve organization. Precast producers may increase workplace organization and productivity with 5S, lower risk of injury and accident, and boost general quality and output.

5. Data Analysis Methods

5.1. MCDM Analysis

MCDM is a recognized branch within the broader field of operations research models, addressing decision-making challenges involving multiple criteria [36,37]. After establishing the relationship and assessing the amount to which the lean tools affect NVA activities, this study focuses on prioritizing the lean tools for adoption in the precast sector based on the criteria that are NVA activities. Numerous criteria should be taken into account, and changes that are made throughout the adoption process should not reduce final productivity. In the literature review, six alternatives, i.e., lean tools, along with six criteria, i.e., NVA activities as shown in Figure 3, are considered for MCDM analysis. This research integrates entropy and MCDM methods to rank the priority of lean tools for adoption in precast industry. To determine the importance of each criteria entropy, weights are calculated. Three MCDM, i.e., TOPSIS, EDAS, and VIKOR are utilized to rank the alternatives for lean implementation.

5.1.1. Estimation of Entropy Weight

There are two types of weight calculations: subjective weight and objective weight. An expert’s judgment based on experiences and opinions renders the majority of the subjective weight, as with AHP and Delphi; using the entropy weight approach, the objective weight is determined directly from the actual data of the alternative. The entropy weight method’s benefit is a decrease in decision-makers’ subjective influence and an increase in objectivity. The Shannon entropy is often used in information theory to assess the degree of disorder and its applicability to system information. Entropy weight technique, one of the objective fixed-weight methods, bases its weight determination on the quantity of information [38,39]. The entropy weight ( w j ) calculations based on Shannon’s theory are demonstrated in the below flow chart (Figure 4). If there are n NVA activities and m lean tools, then x i j is the value of the jth index in the ith lean tool. Standardizing indexes utilizing the equations of relative optimal membership degree is important to remove the impact of index dimension upon incommensurability.

5.1.2. TOPSIS

Yoon and Hwang formulated TOPSIS (Technique of Order of Preference by Similarity to Ideal Solution), an MCDM tool that has been appreciated by decision-makers at all levels. To choose the best alternative from the discovered collection of alternatives, a compensating aggregation strategy is used. The option that is ranked closest to the ideal solution receives a higher rating than alternatives with lower similarity values. A variety of alternatives are compared using weights assigned to each assessment criterion, and the normalized values of these scores are then calculated. From there, the geometric separation from the ideal solution is determined [40]. Figure 5 depicts the entire process for a typical TOPSIS application.

5.1.3. EDAS

Keshavarz Ghorabaee et al. [41] introduced the EDAS (Evaluation based on Distance from Average Solution) distance approach for the first time within the field on MCDM methods as a ranking method to handle complex decision-making issues where a number of options should be prioritized in accordance with numerous criteria. The normalization procedure of EDAS is one of the main ways it differs from other approaches [42].
Using a normalization approach based on the average answer, EDAS seeks to identify the optimal option. PDA (positive distance from average value) and NDA (negative distance from average value) are two measurements used by EDAS to calculate each alternative’s score and establish their relative ranking order. The process of EDAS analysis is demonstrated in Figure 6.

5.1.4. VIKOR

S. Opricovic first suggested the ViseKriterijumska Optimizacija I Kompromisno Resenje VIKOR MCDM approach in 1979. It is a potent instrument that may be used to solve a wide range of strategic decision-making issues in a variety of contexts, including social, economic, and environmental ones [43]. The VIKOR technique involves discovering multiple solutions to a problem, prioritizing and rating them, and choosing the best compromise answer based on the rankings. Based on criteria that are contradictory in nature and are also challenging to quantify, VIKOR assists in determining the optimal option based on the trade-off among alternatives. The procedure for VIKOR analysis is shown in Figure 7.

5.2. Sensitivity Analysis

Weights are frequently employed in decision-making problems to reflect the relative relevance of various criteria or features in figuring out alternatives or usefulness of other solutions. It is crucial to comprehend how much the weights influence the ranks of the alternatives since determining weights sometimes includes making subjective judgements [44]. Sensitivity analysis entails constantly altering the weights of criteria and tracking how the ranks of the alternatives change consequently. Sensitivity analysis can assist decision-makers in determining which criteria are most important to the choice as well as in locating any biases or inconsistencies that may have occurred throughout the decision-making process [45].

6. Results and Discussion

6.1. Result of MCDM Analysis

To perform MCDM analysis it is required to calculate the weights of the criteria. This is evaluated by the entropy method in the current study. Three types of MCDM analysis TOPSIS, EDAS, and VIKOR are carried out, respectively, to prioritize the alternatives for the implementation in the precast industry.

6.1.1. Entropy Results

Based on the data ( f i j ), as shown in Table 2, obtained from the questionnaire, the entropy weights are calculated. For calculating this entropy weight, Shannon’s entropy weight is used. The decision matrix is first calculated using the data of questionnaire, which is the same for all methods. Table 2, associated with the entropy weight calculation, presents the f i j values. These values are derived from the decision matrix depicted in Figure 4 by following the entropy weight calculation steps. The f i j values represent the normalized performance scores of alternatives across various criteria, which are crucial for computing entropy and determining the weights of each criterion. The obtained entropy weights are shown in Table 3 below.

6.1.2. TOPSIS Results

The TOPSIS technique takes into account RCC values to rank the options according to how far they are from the positive and negative ideal solutions. The optimal alternative is that which is further away from the negative perfect solution and closer to the positive ideal solution. The decision matrix is subjected to the procedure previously suggested in the section above, and normalized weights, as shown in Table 4, are obtained. Table 4, pertaining to the TOPSIS method, displays the normalized decision matrix. This matrix is obtained by applying the normalization steps outlined in Figure 5 to the original decision matrix. The normalization process ensures that all criteria are on a comparable scale, thereby facilitating accurate MCDM analysis.
The results obtained by TOPSIS analysis are shown in Table 5. The results state that CI was the best alternative. The order of alternatives according to TOPSIS method are CI > TQM > 5S > JIT > VSM > PY.

6.1.3. EDAS Results

As previously stated, the EDAS approach uses appraisal score ( A S i ) values to evaluate alternatives based on their positive and negative distance from the average solution. The decision matrix is put through the process outlined in the section above, and the positive and negative distances from the average are computed. Following the normalization of the N D A i j and P D A i j , the appraisal score is derived from this. The values and rankings are displayed in Table 6. The order of alternatives according to EDAS is TQM > CI > 5S > JIT > VSM > PY [36].

6.1.4. VIKOR Results

VIKOR analysis performed based on the compromise method. VIKOR aids in selecting the best choice based on trade-offs between alternatives. The analysis is performed based on the previously mentioned process. The utility measure ( S i ) and regret measure ( R i ) are evaluated based on this VIKOR index ( Q i ). For this, ranking is in ascending order. In VIKOR, the best alternative is selected based on the above three values, which satisfy the two criteria [35]. The result ranking is given in Table 7 below. The order of alternatives according to VIKOR are as follows:

6.2. Sensitivity Results

By the MCDM methodologies, it is evident that criteria weights have influence on the ranking of the alternatives, so the rankings may vary if the weights are changed. To investigate the relationship between the weights and the ranking, sensitivity studies of the weights are carried out. To evaluate these, different scenarios are considered. In Scenario 1, all the dimensions have identical weights. From Scenario 2 through Scenario 6, each of the key dimensions is set. Each primary dimension’s weight is reduced to 0.5, and the remaining weights are distributed evenly among the other dimensions. Based on this, each criterion’s weight is calculated by dividing the weight of each dimension by the total number of criteria it has. Table 8 displays the weights of each criterion in various scenarios.
The radar graphic in Figure 8 clearly illustrates the ranking of lean tools and its differences determined by the MCDM approaches in different scenarios. There are five levels on each radar chart, with the outer layers scoring lowest and the interior layers highest. The dimensions in Scenario 1 weigh the same. The best choice is TQM, followed by 5S. In scenario 2, TQM is the optimal lean tool, followed by 5S, although there is not much of a difference between the two. Scenario 3 still places TQM first. Next is 5s with its respective waiting time, which is more weightage. In the overproduction perspective, TQM comes out on top of all MCDM approaches in Scenario 4, demonstrating its dependability. The last place on this list goes to PY, while according to Scenario 5, TQM and 5S retain their places. In Scenario 6, the rankings are little changed compared to other scenarios. In this, CI was in first place followed by TQM. The last scenario is same as Scenario 1 and Scenario 3. The outcomes of the six radar scenarios are biased in favor of TQM, with 5S coming in second. PY is the least biased. In conclusion, even if the rankings in the six scenarios change slightly, the overall outcomes seem to be the same as those obtained using the MCDM approaches.

6.3. Implication of the Research Finding

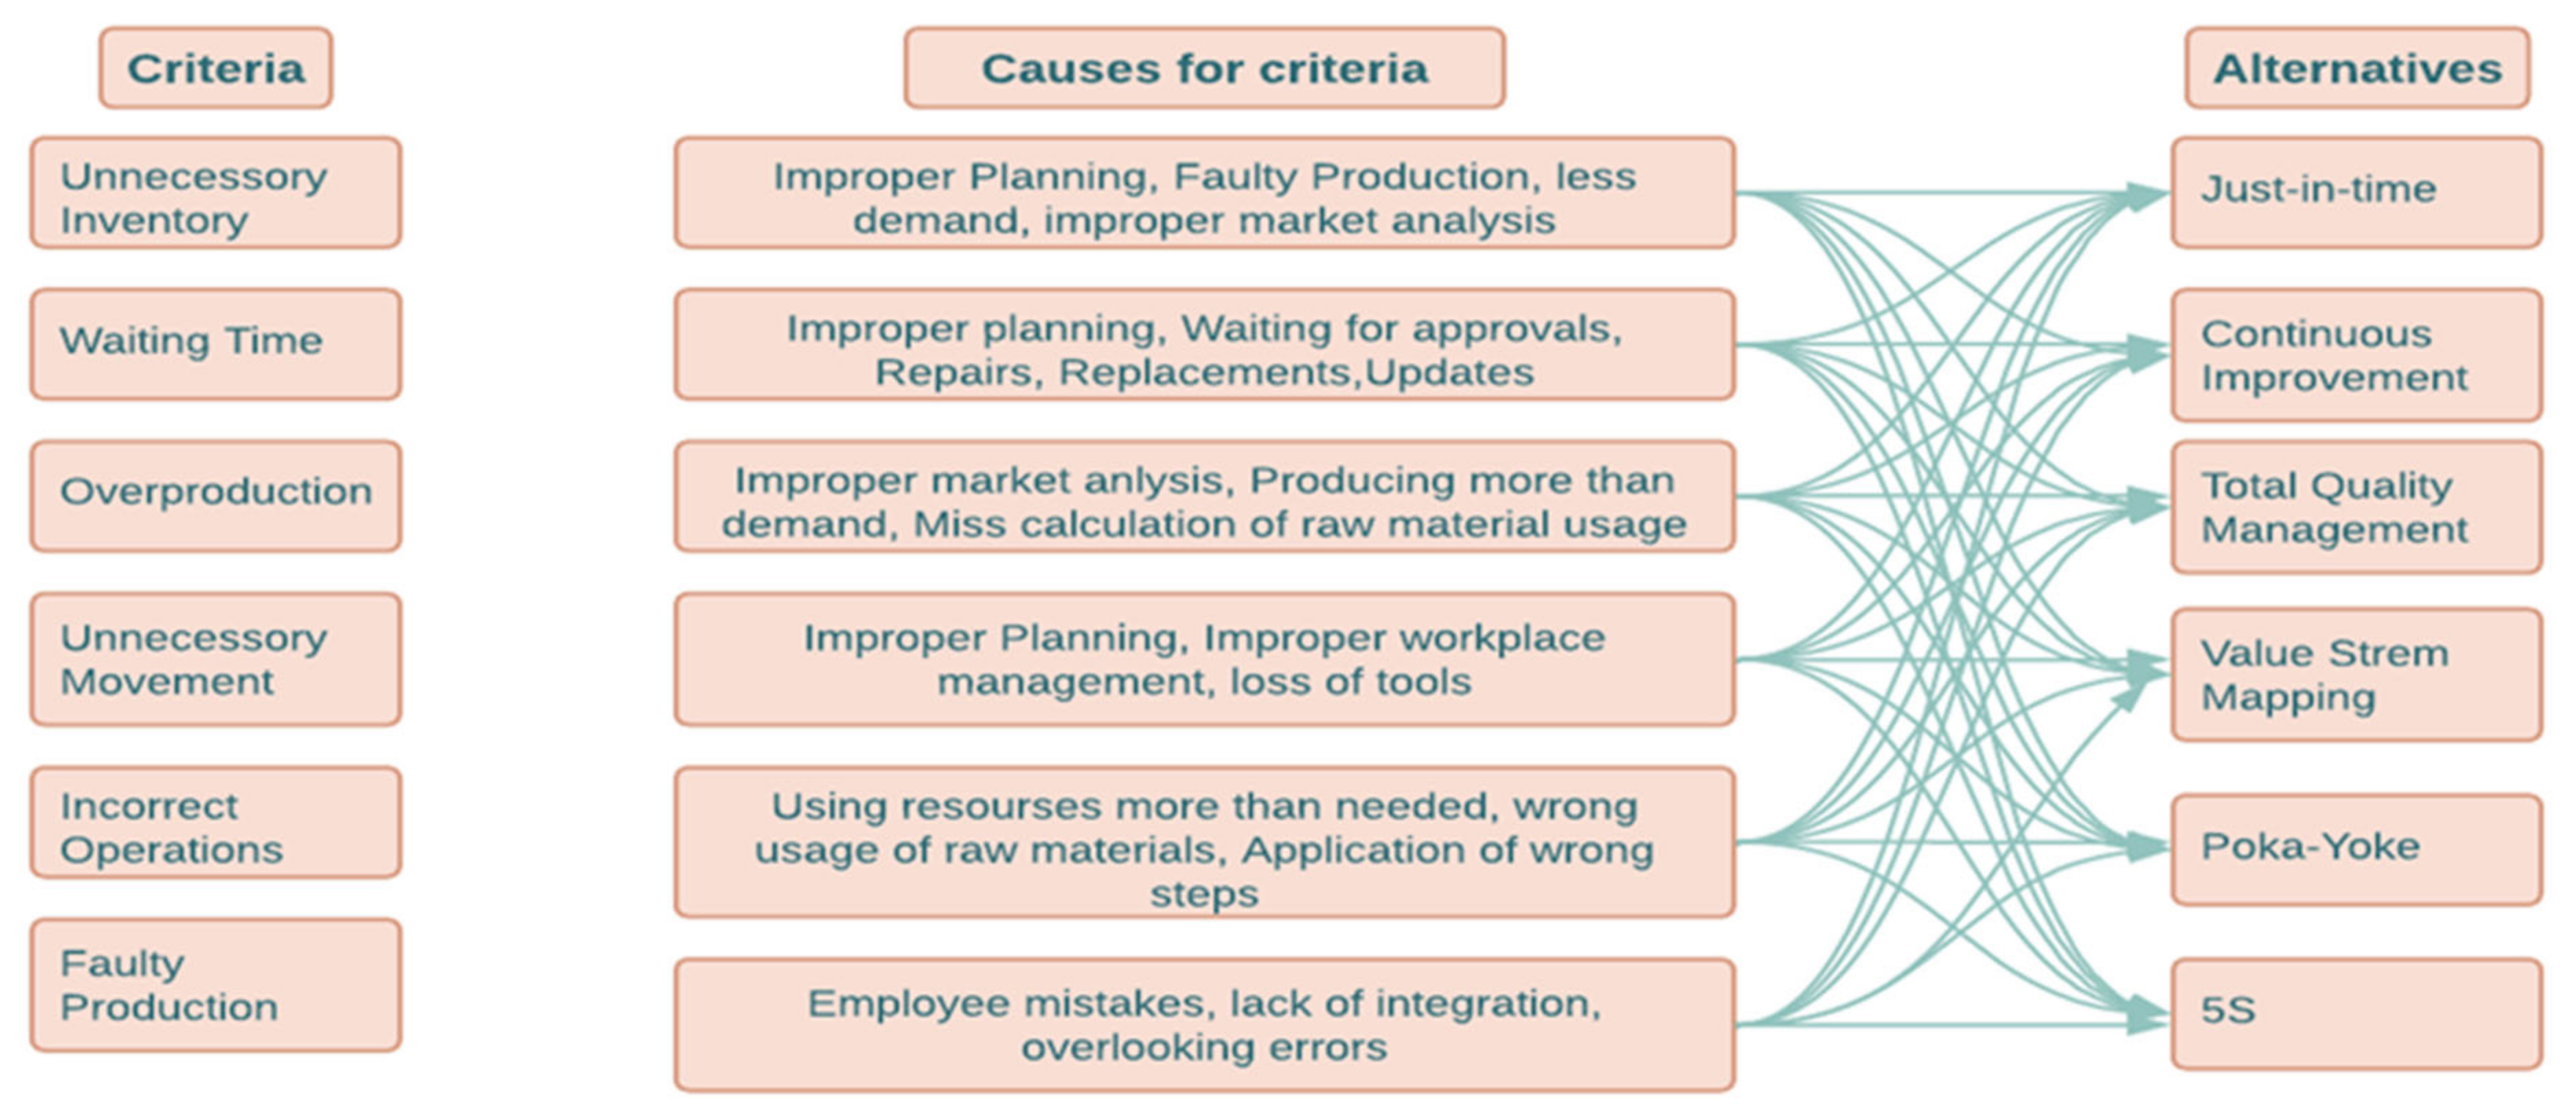
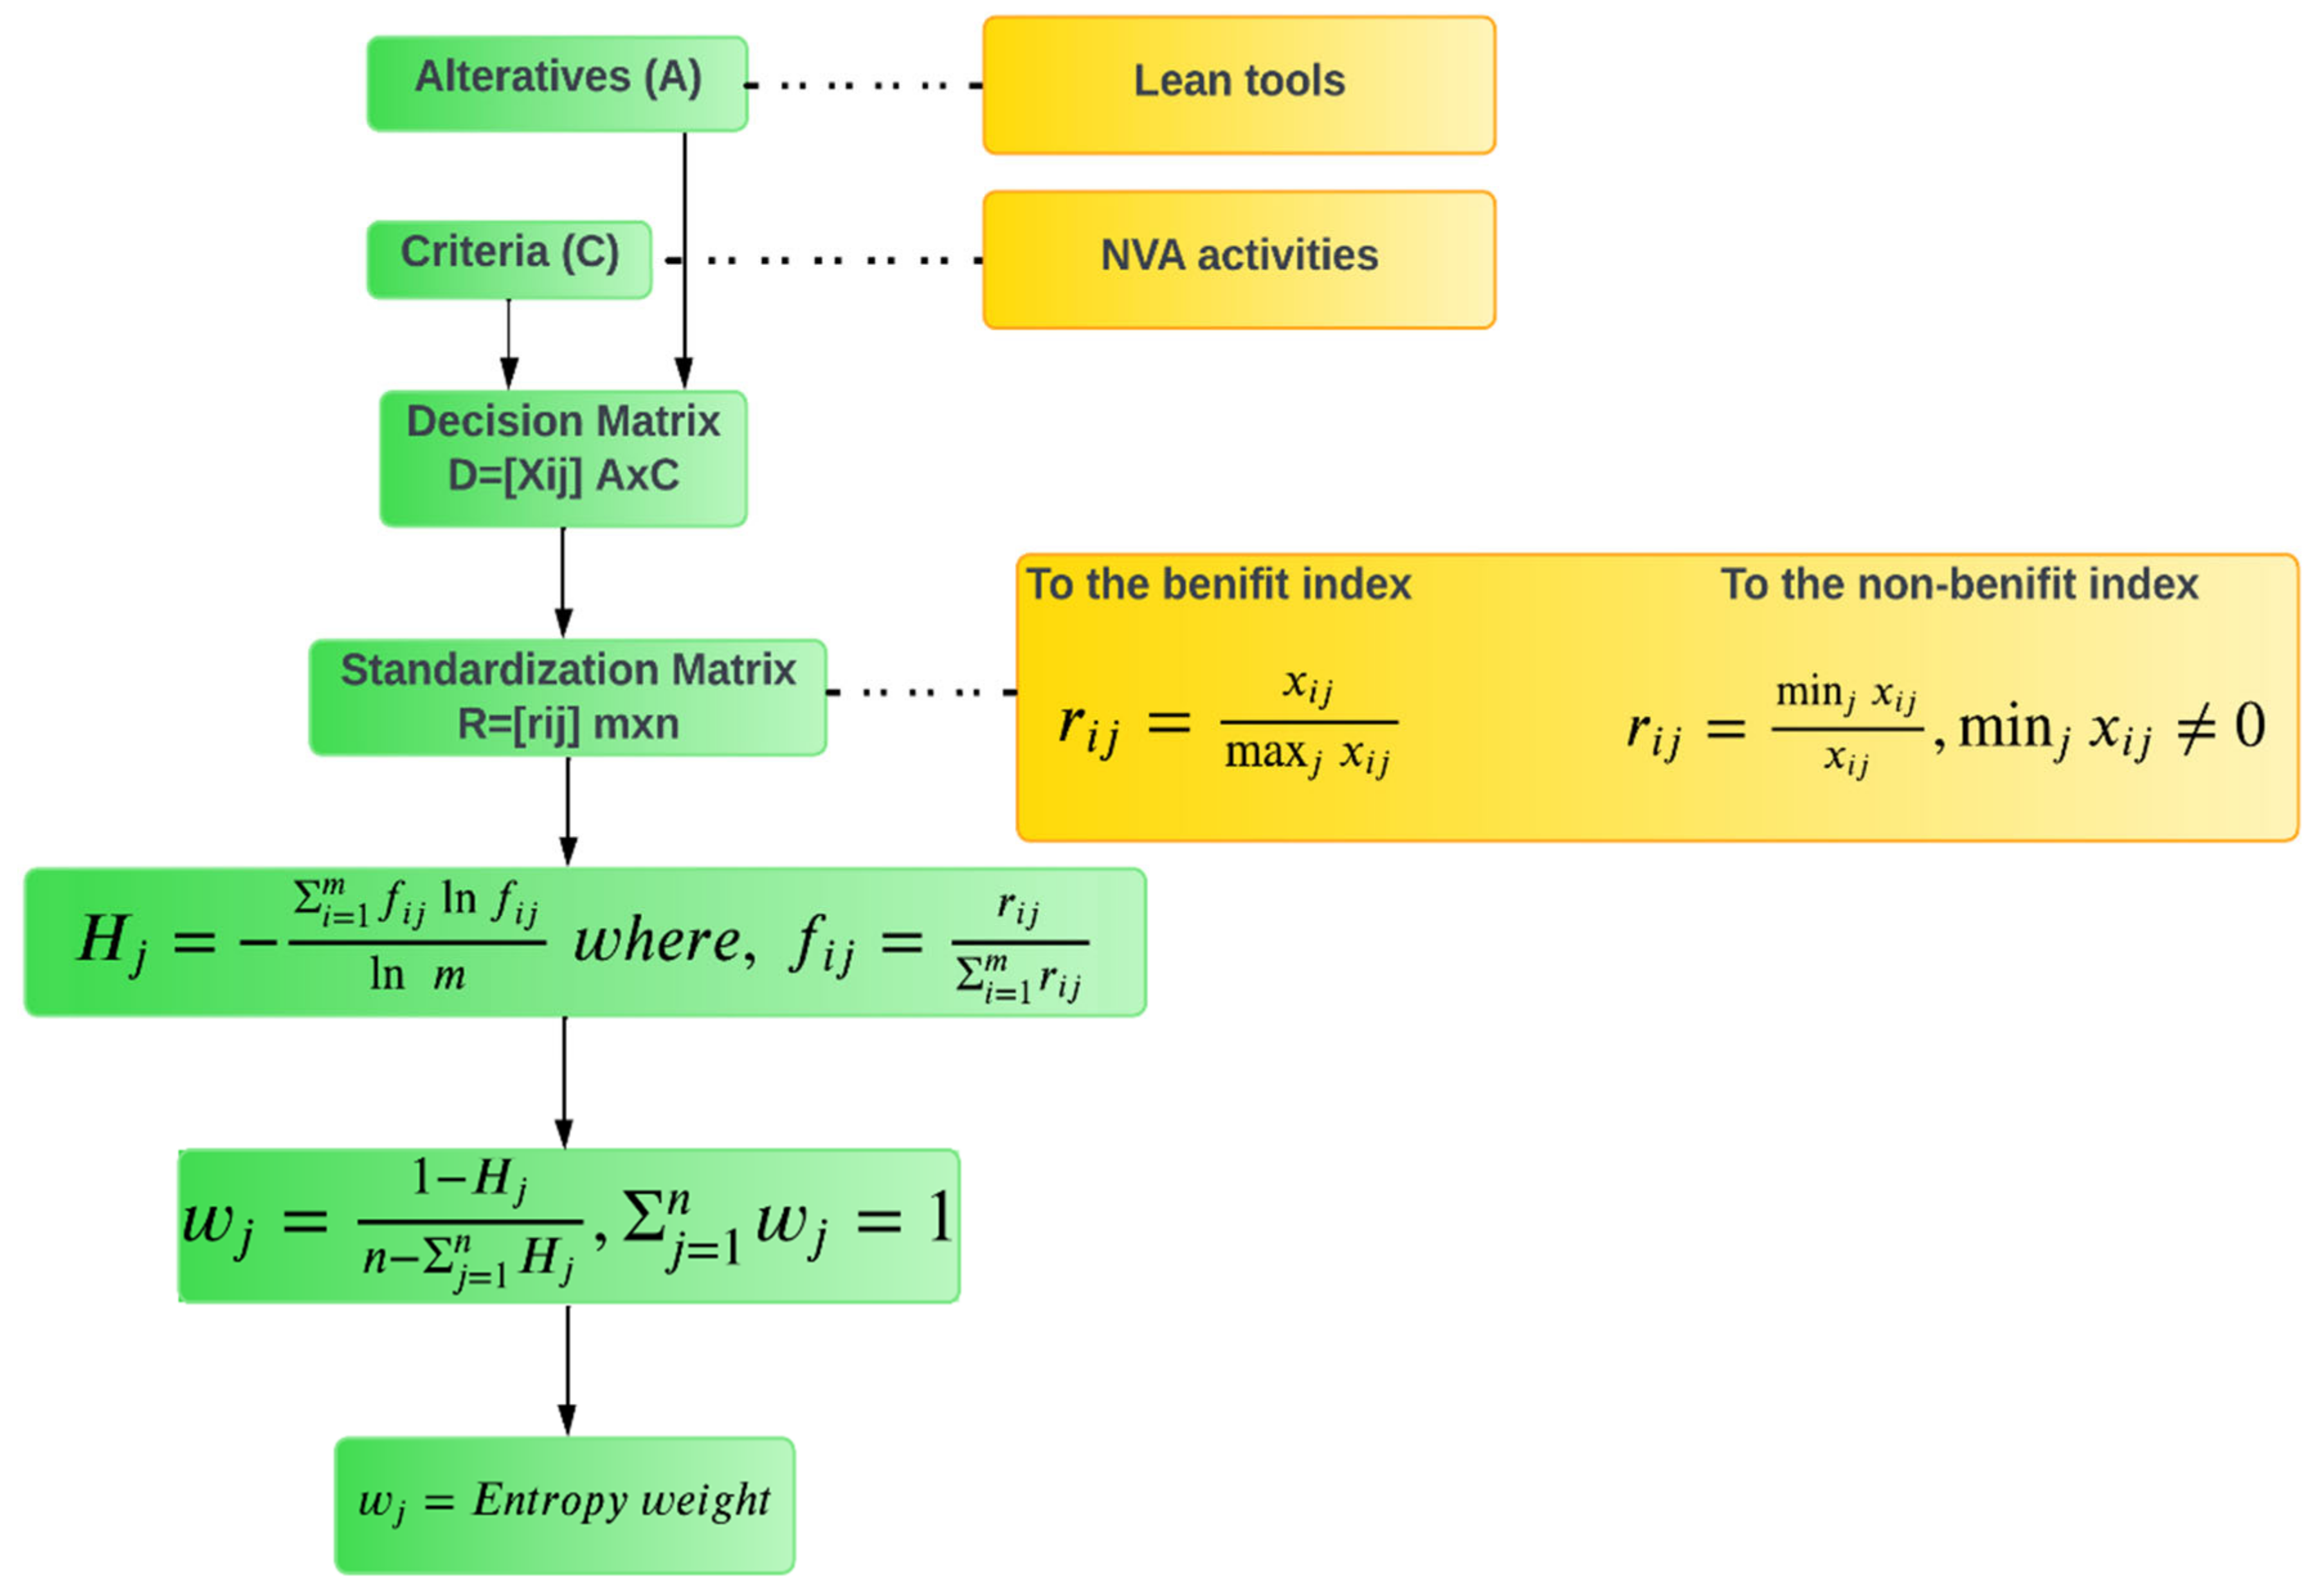
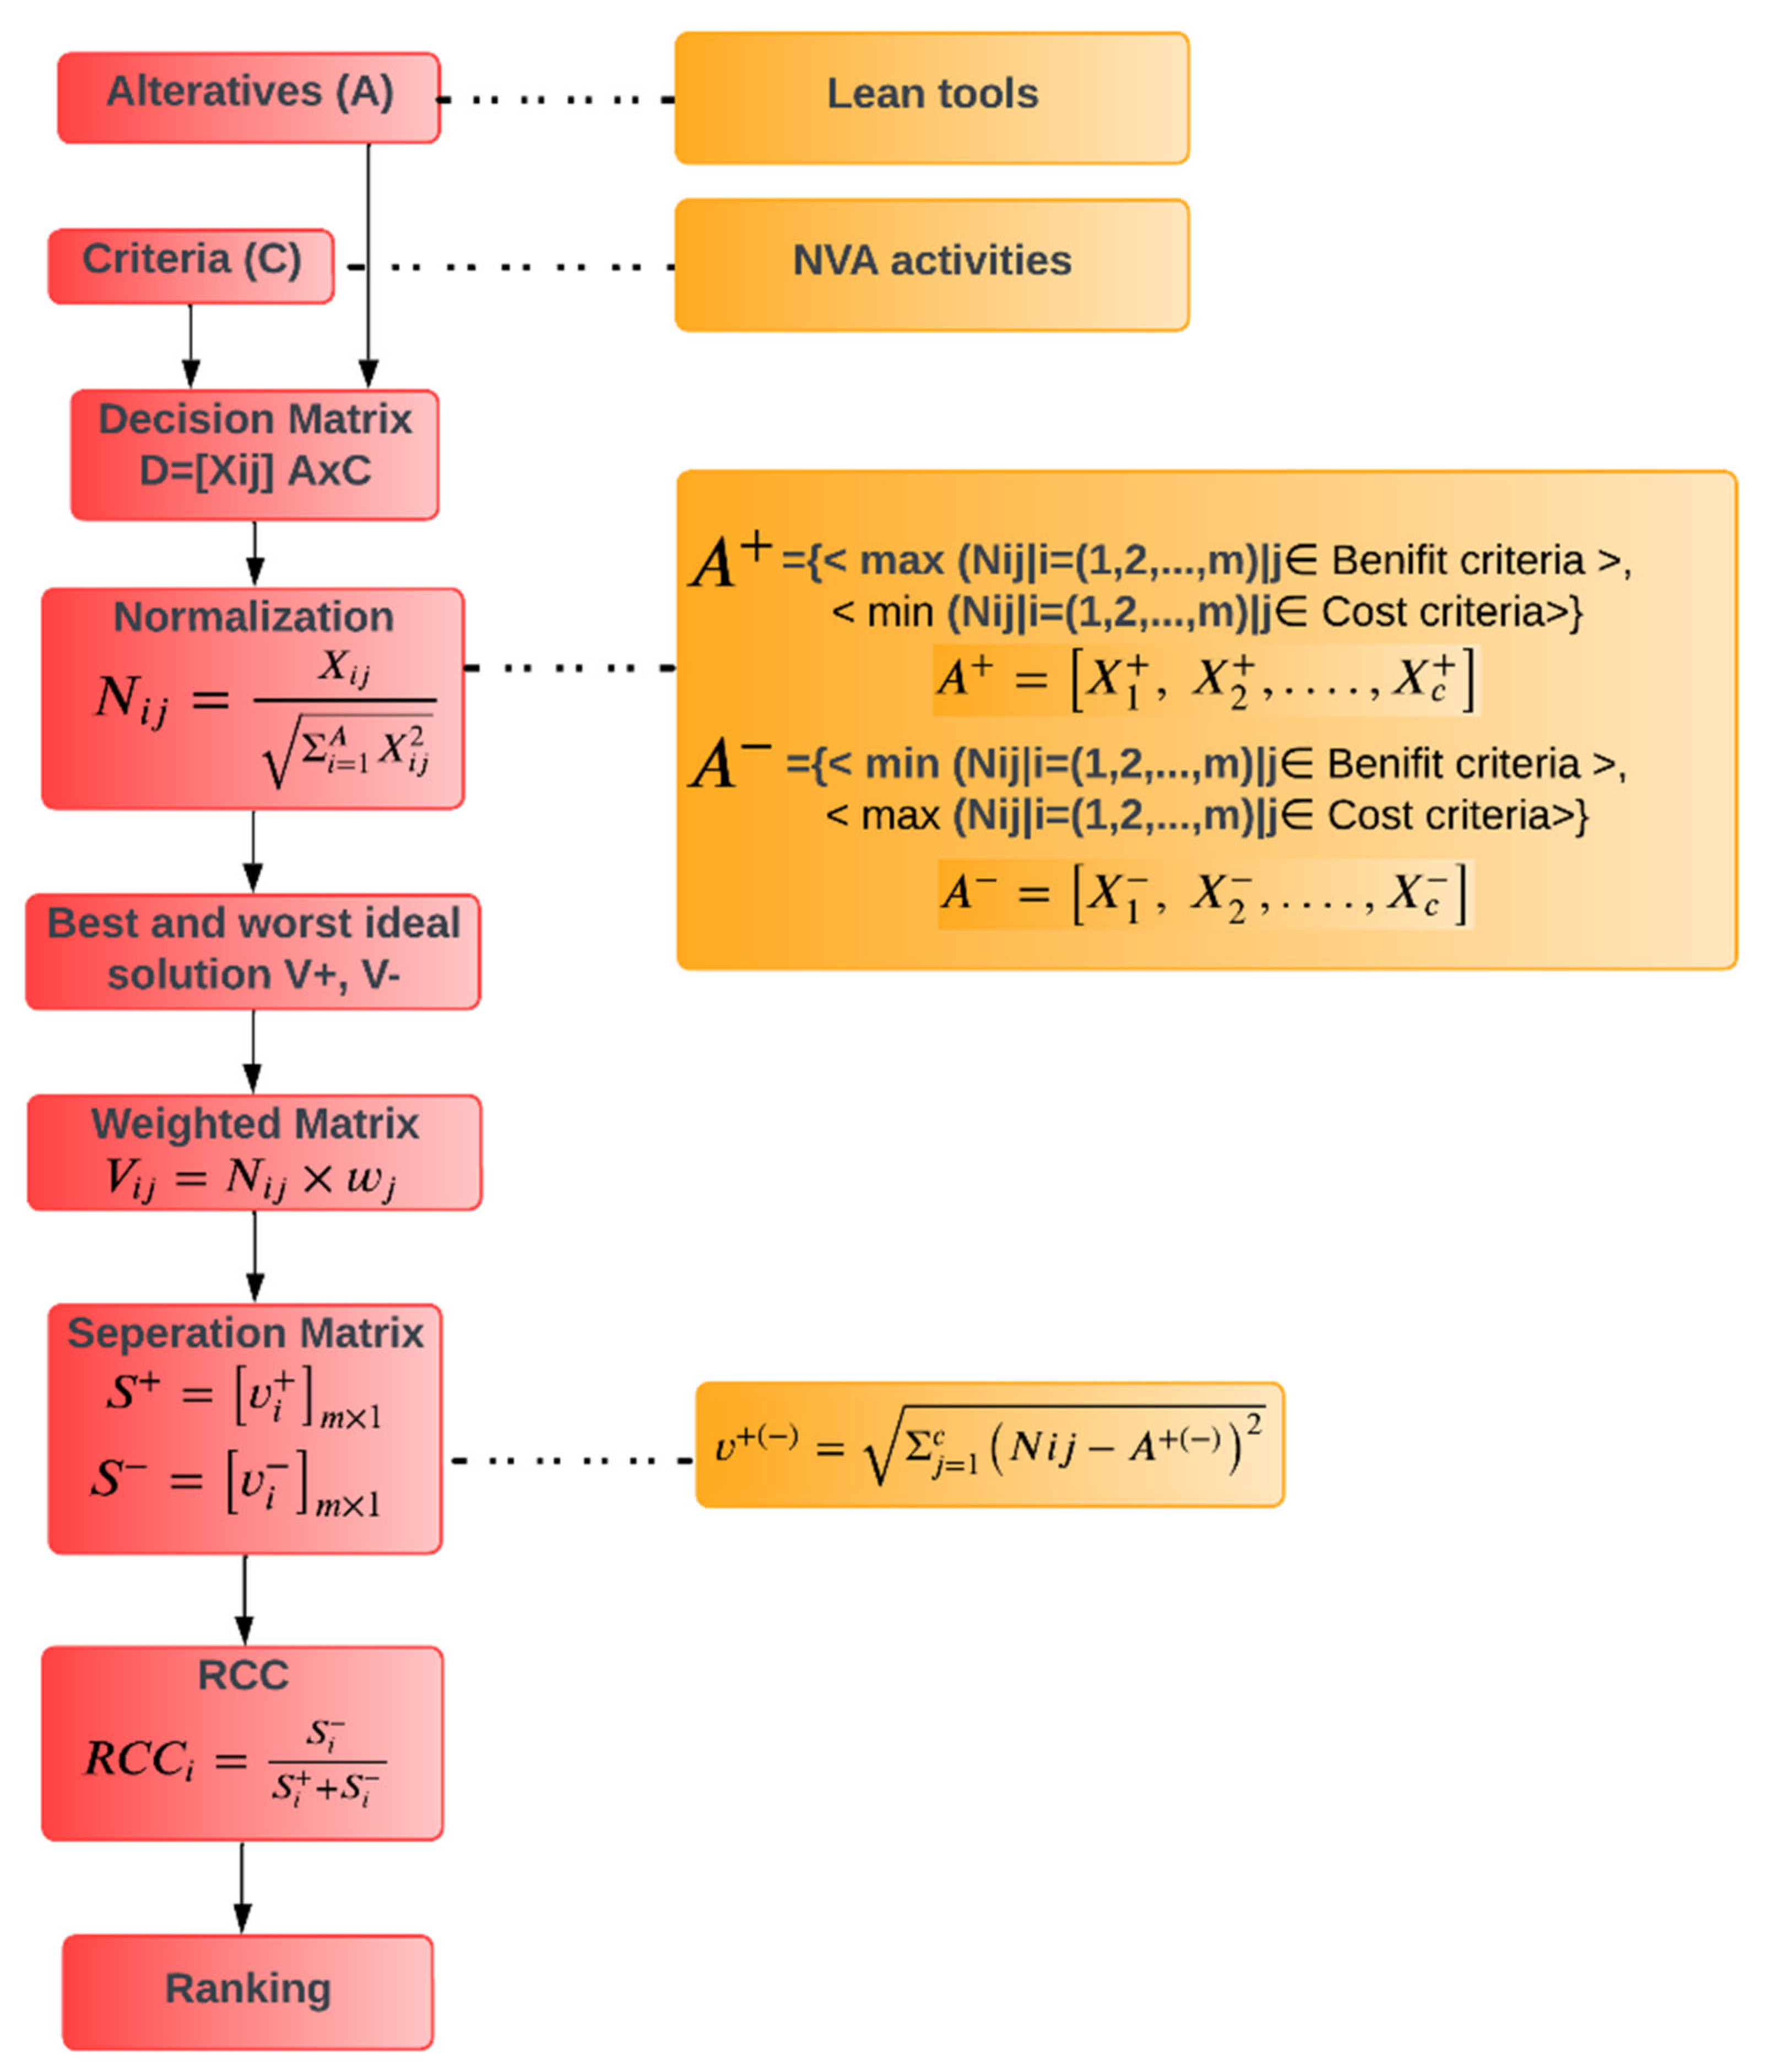
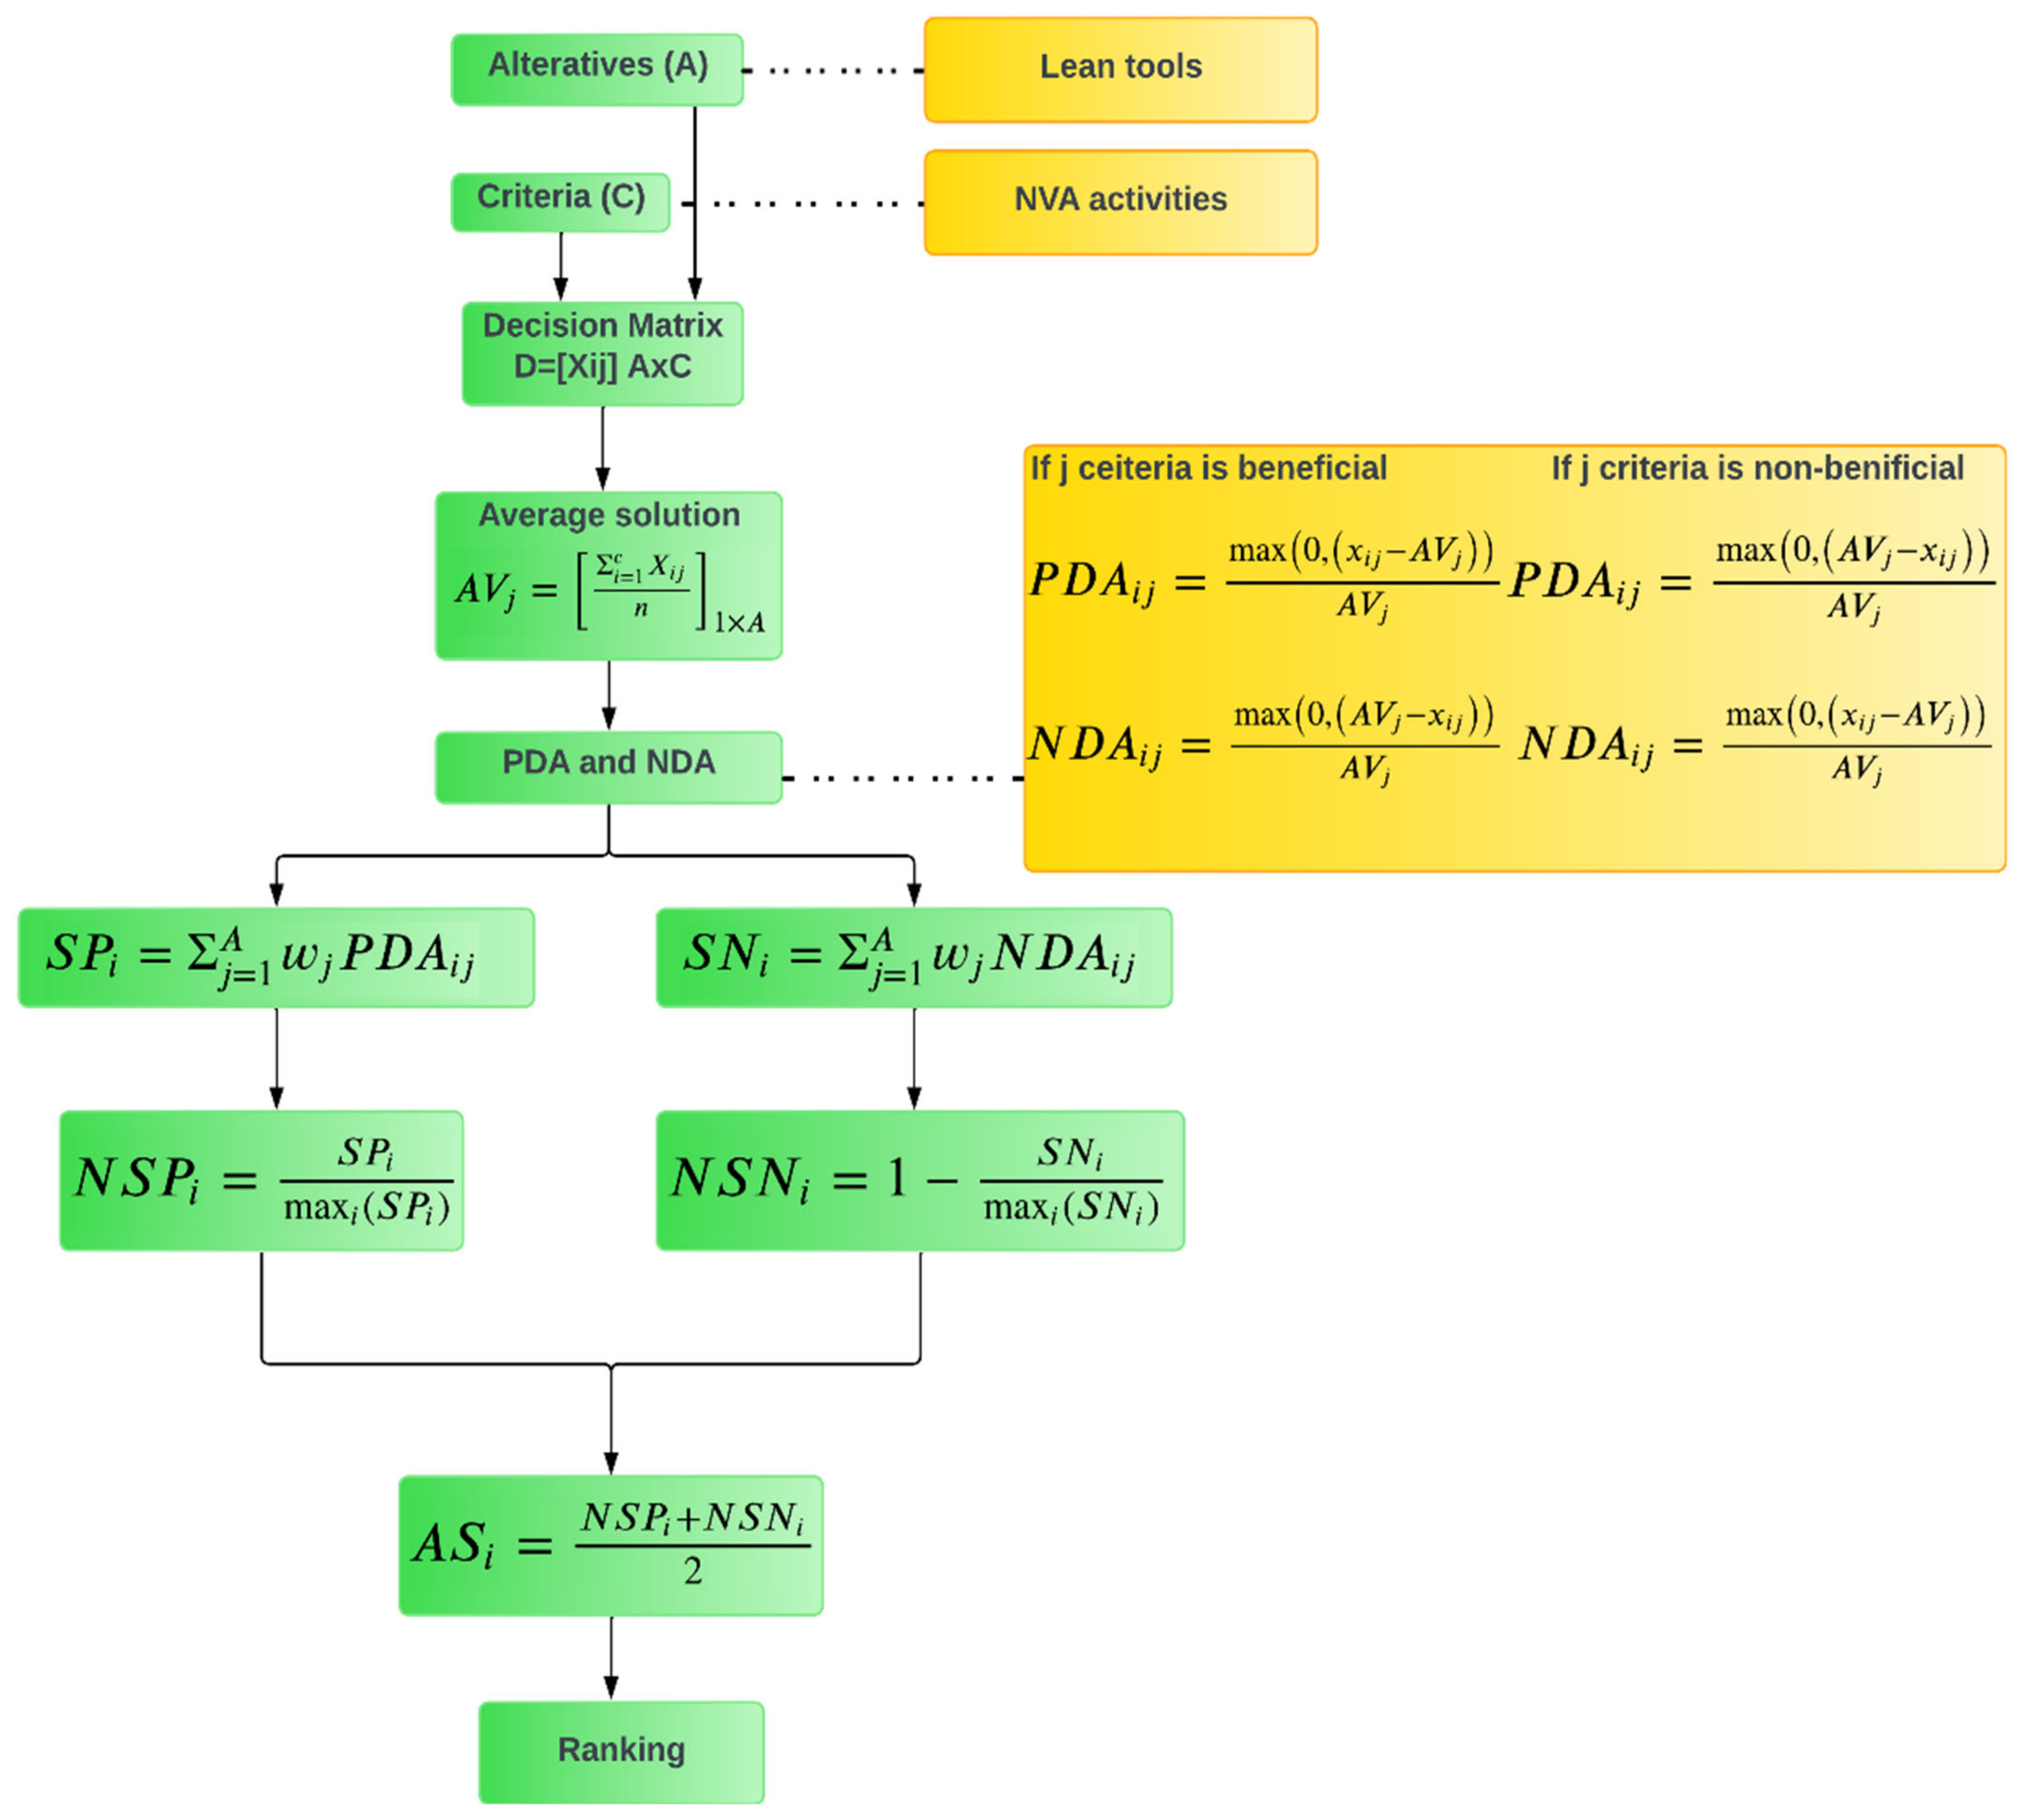
There are two objectives for the research. One is to obtain the relationship between lean tools and NVA activities, and the second is to prioritize these lean tools after attaining the relationship. From the literature review and questionnaire, the relationship between the lean tools and NVA is developed. This results in the adoption of lean tools in the precast industry. The availability of various lean tools might make it challenging for an industrial authority to select one for implementation without affecting the industry’s current productivity or function. MCDM analysis takes various criteria while analyzing the best alternative to the decision problem. Researchers have developed various MCDM analysis methods for this, and TOPSIS, EDAS, and VIKOR are considered for the present study. All these methods come under unique synthesizing methods, and the core function of these methods is to give a best alternative based on the maximum and minimum distances for the ideal solutions, which are considered as the reference. The other categories do not fit for the current study, as one of its outranking methods focuses on the dominance of one alternative over another alternative, and the other is the preliminary methodology. These do not gives the appropriate results.
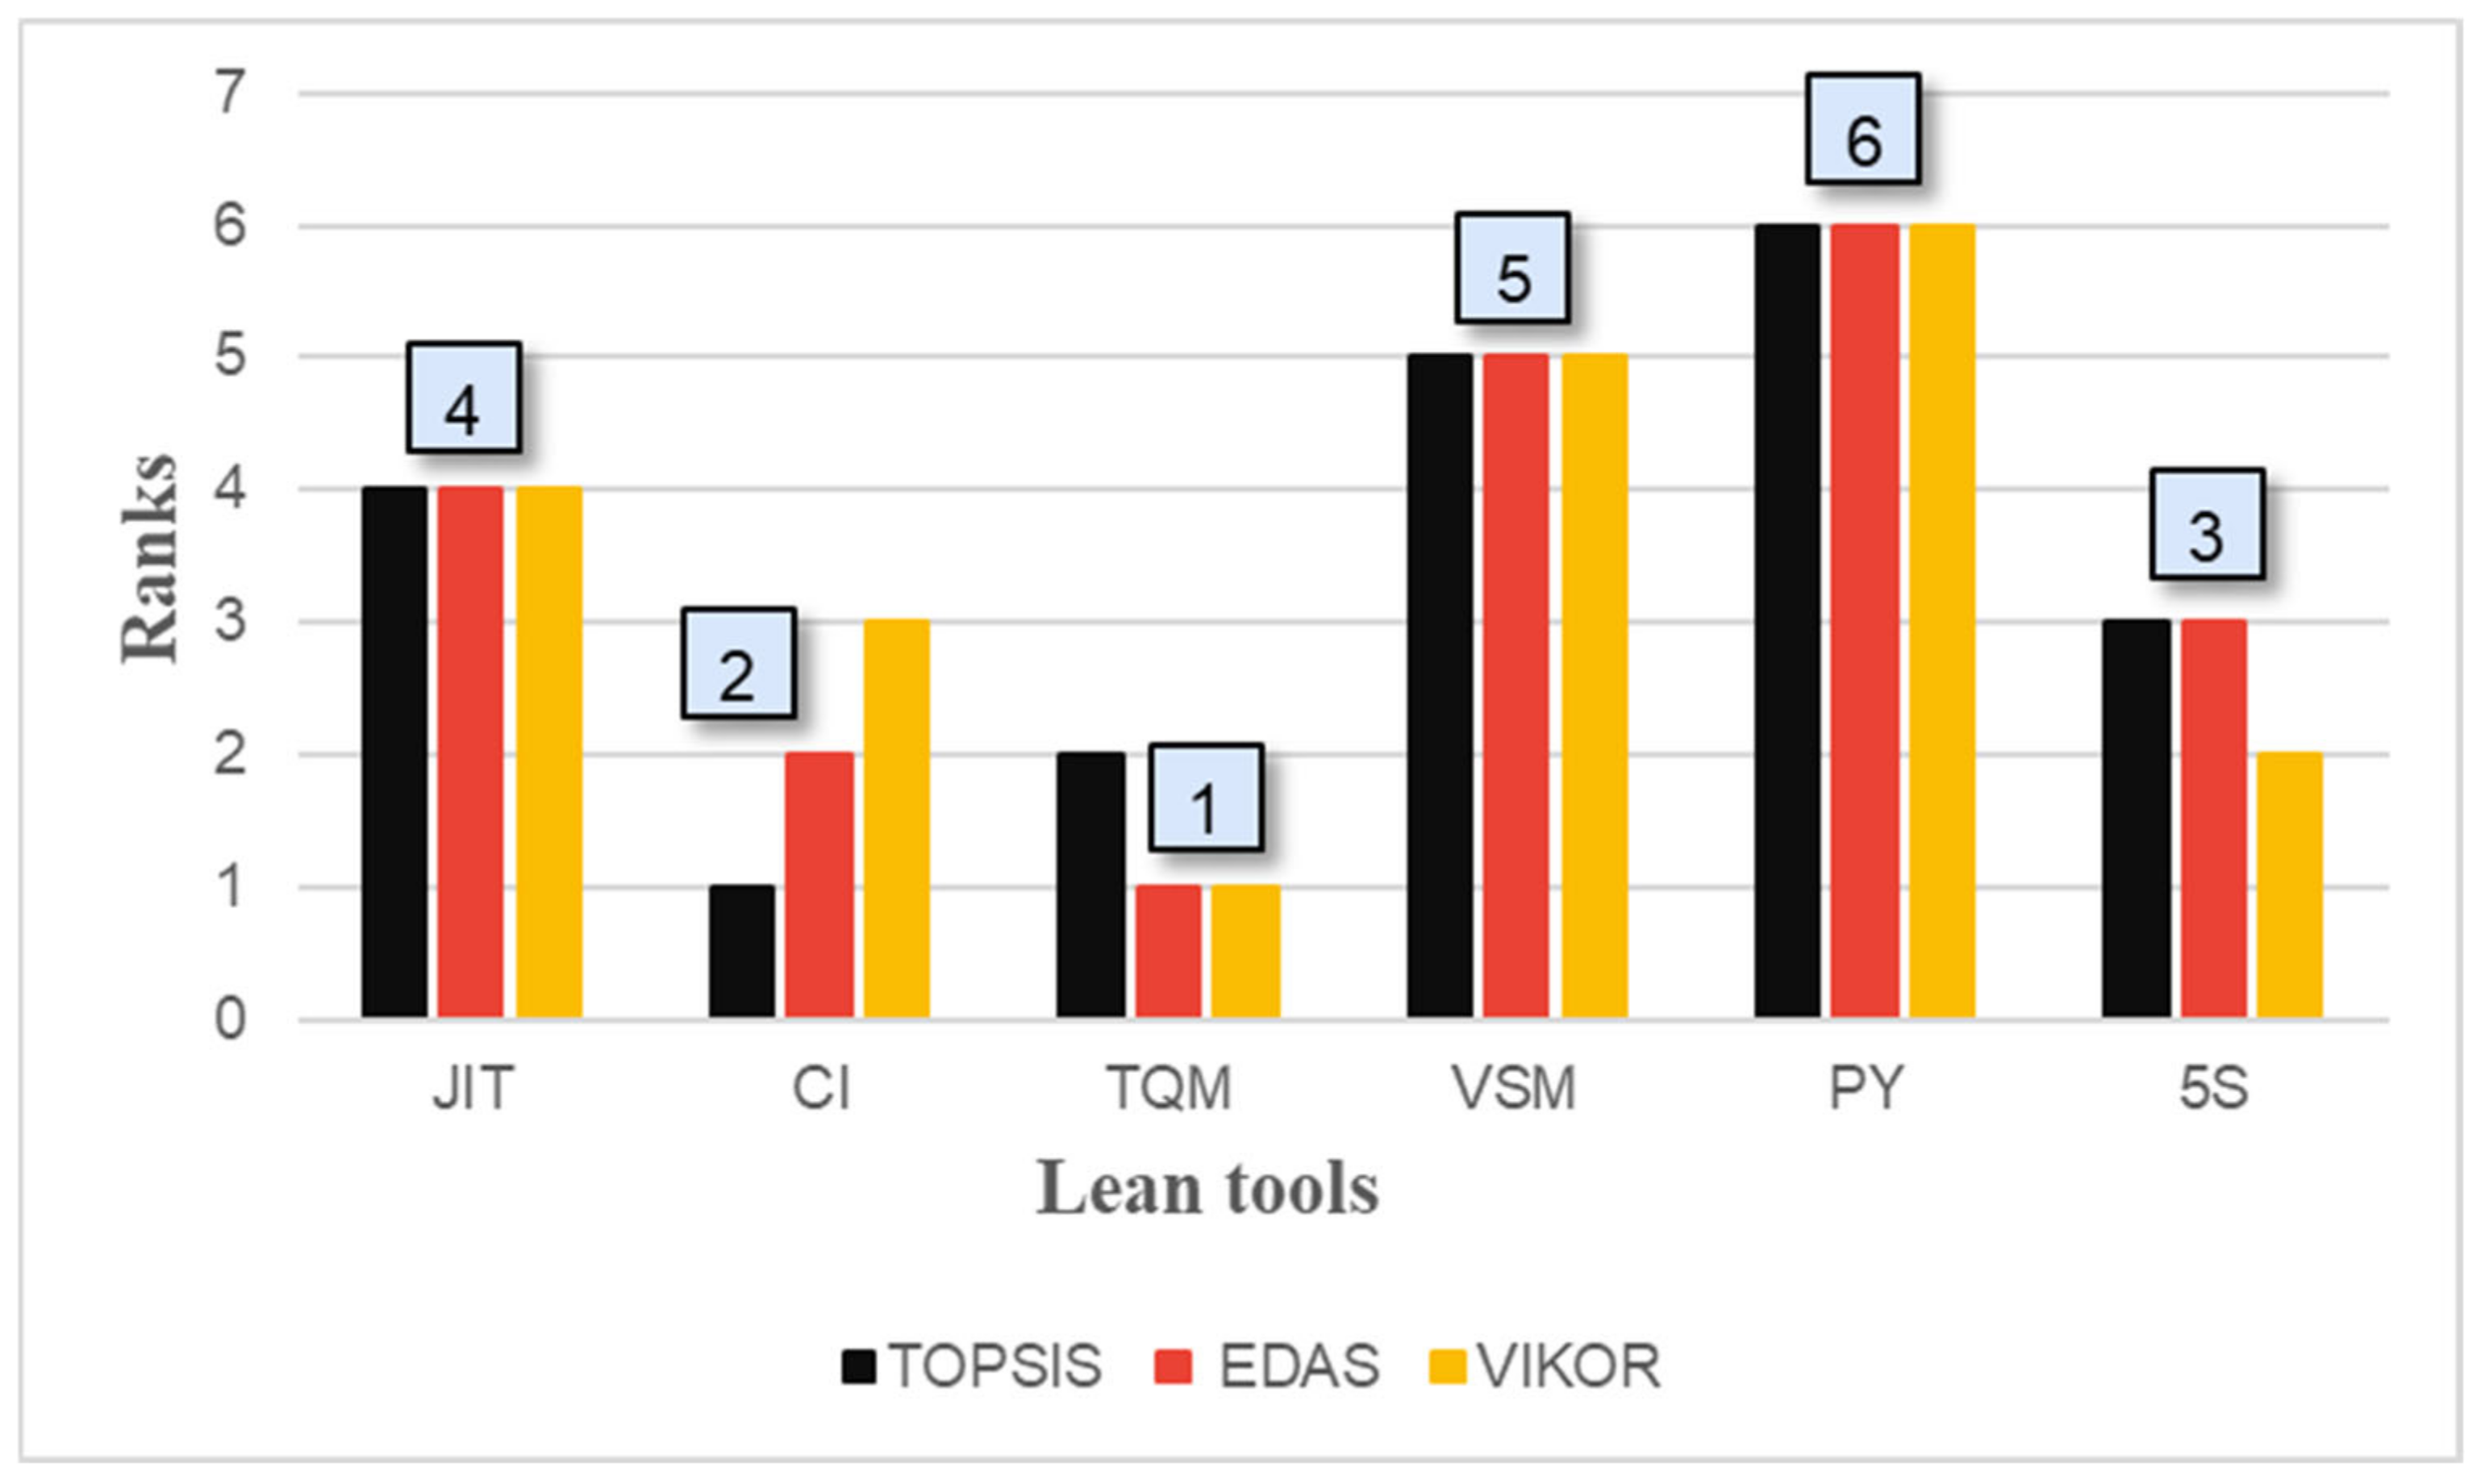
The lean tools are taken as alternatives, and NVA activities are taken as criteria. From the questionnaire, the data obtained represents the favorability of one particular lean tool to one criterion. Through MCDM analysis, the adaptability of lean tools can be known by considering all the criteria. The results of the three MCDM analysis are represented in the graph below as Figure 9. From this, TQM is ranked first in two methods, while CI is ranked first in one method. The three positions also alter between CI, TQM, and 5S. But the remaining ranks are constant; JIT occupies the fourth place, while VSM and PY follow, respectively.
The slight variations in the rankings for positions one, two, and three may be attributed to the relative importance of these tools.
The precast industry is part of the construction sector but has certain characteristics that align it more closely with product-based industries. In product manufacturing, the precast industry involves the production of standardized components in controlled environments, where processes can be optimized for efficiency, quality, and consistency, similar to how products are mass-produced. These industries’ growth is dependent upon the quality of products they produce. This plays a major role when it comes to the precast sector, as quality is the heart of the product. The findings in this research are that the reduction in NVA activities can be achieved when companies in the precast industry simultaneously prioritize TQM, CI, and 5S. Therefore, companies must first develop a strong quality culture by integrating TQM principles throughout their operation. This involves training in how to conform to quality standards, collaboration with suppliers to obtain high-quality raw materials, and process controls to minimize defects and rework. TQM embeds quality in the system to eliminate the activities leading to defects, rework, and scrap, thereby contributing to NVA activities and product, reducing productivity and resource utilization.
Implementing continuous improvement (CI) is another important step in reducing NVA activities. The mindset of problem solving and innovation across all levels of the organization is encouraged by CI. Employee involvement, including regular brainstorming sessions, feedback loops, and data driven analysis should be promoted to find out where the company is struggling among other things. Kaizen or root cause analysis can be used as a tool for small, incremental improvements aimed at root causes of NVA activities, for example, unnecessary waiting times, poor process flow or excessive handling. Companies can keep the process of efficiency and waste reduction in a cycle by continuously seeking to improve processes to optimize time and resources.
An organized, clean and an efficient workplace can be encouraged by utilizing the 5S methodology, which reduces NVA activities. The five actions, to sort, set in order, shine, standardize, and sustain, aid companies in eliminating motion waste, material handling delays, and workplace inefficiencies. The 5S method involves focusing on organization and visual management to make the workflow better, improve safety, and allow for quick spotting of problems before time is lost searching for tools or materials. Therefore, regular audits are needed and 5S is implemented by strong leadership commitment to hold onto these improvements over time. The combination of TQM, CI, and 5S enable a company to systematically reduce NVA activities, make operations more efficient and create a smoother and more productive operation.
JIT makes several changes in the function of the industry. This enables the organization to utilize time perfectly. As the analysis contains several criteria, JIT obtained fourth priority. The reason for this is that to implement JIT, we need good organizational structure, which can be achieved after implementing the above-mentioned tools. VSM enables the industry to identify the NVA activities. This still may not have a direct effect on productivity, but it plays a crucial role in identifying the waste. It also helps to give more attention to the activities, which adds value to the outcomes or processes. The last one is PY, which identifies the mistakes and wrong usage of materials. It is like an inspection, which is performed to improve quality and reduce waste. PY decreases the incorrect operations and faulty production in the industry.
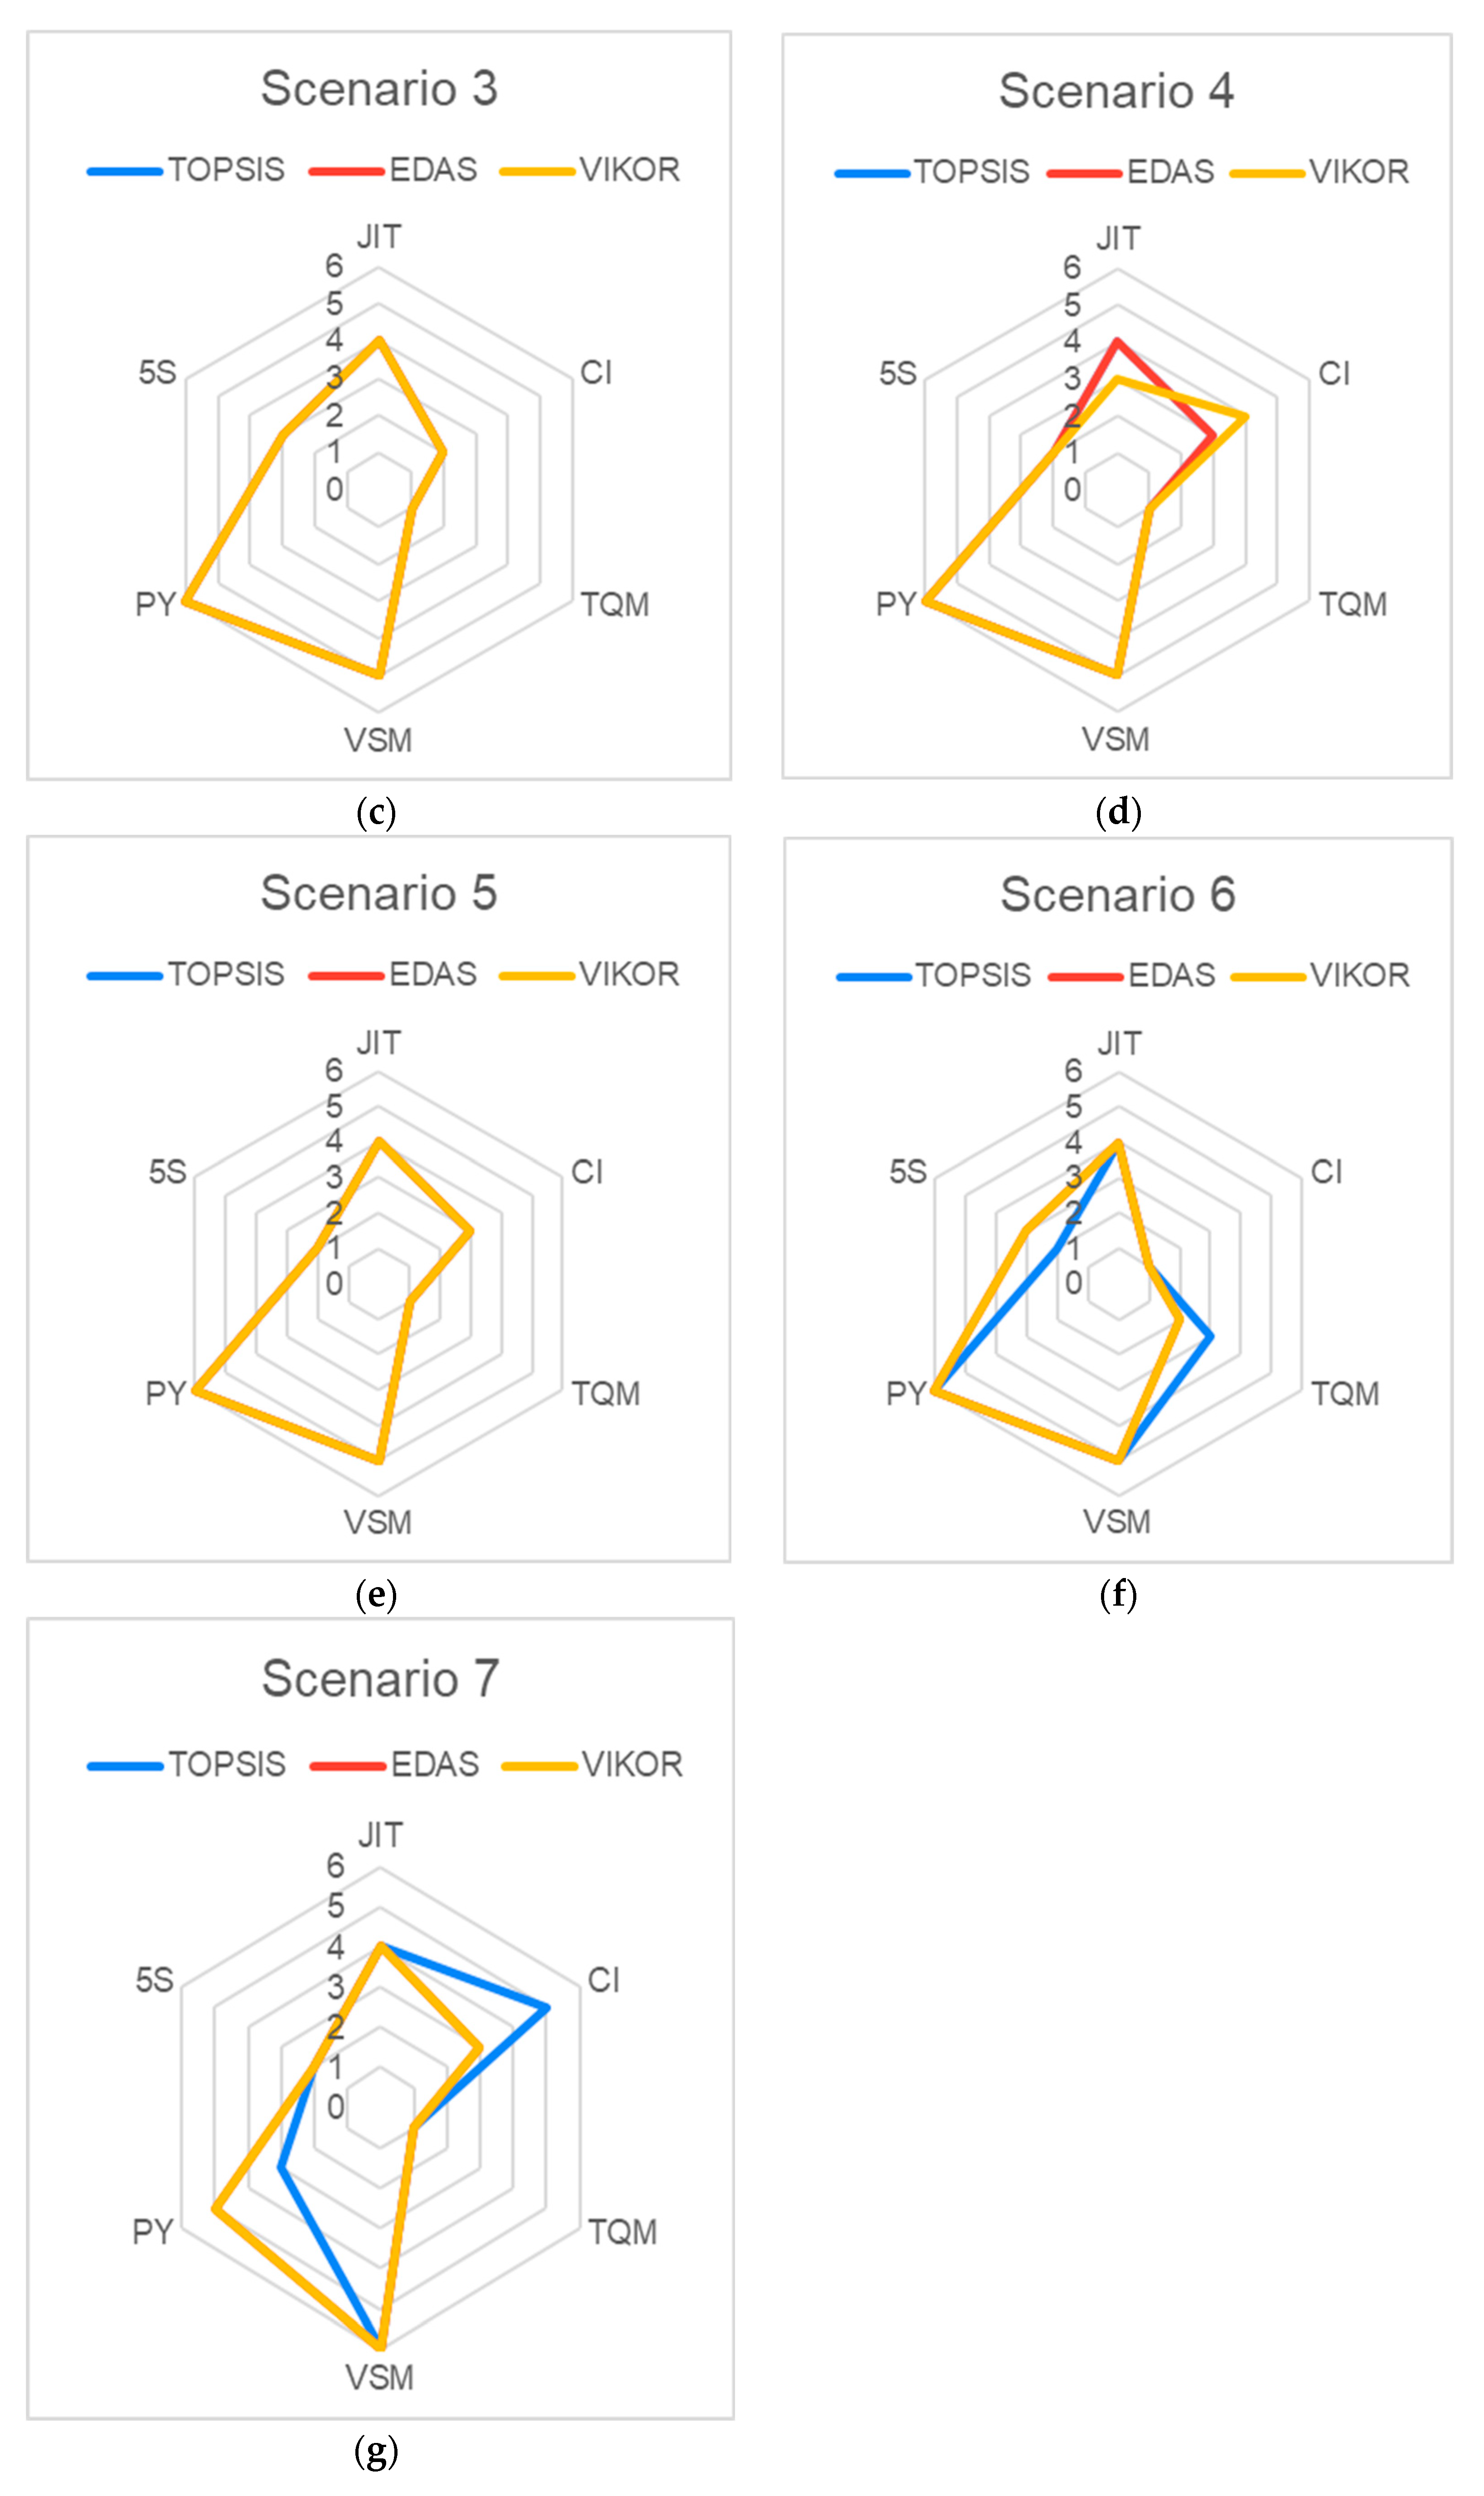
The MCDM analysis results are affected by the criteria weights. So, sensitivity analysis is carried out to learn the influence of the criteria weights on the analysis, and the robustness is inspected. The results of the analysis demonstrate that the criteria weights have the least effect on the ranking. Seven scenarios are considered for checking the sensitivity. Comparing all the scenarios, it is observed that 5S and CI have been fluctuating between second and third rankings, and the remaining ranks have very minute changes. Based on all of this, lean tools are prioritized as TQM > CI > 5S > JIT > VSM > PY.
From a practical aspect, the study presents a prioritized list of lean tools, with TQM, CI, and 5S as the top three effective solutions for reducing NVA operations in the precast industry. Implementing these techniques can lead to increased operational efficiency, higher product quality, and more efficient organizational procedures. For example, TQM not only focusses on product quality but also on process management and regulatory compliance, both of which are essential for maintaining high standards in precast component production. CI prioritizes continuous improvement in processes, products, and workforce dynamics, promoting a culture of excellence and adaptability. The 5S concept improves workplace organization, lowers waste, and promotes a safer working environment, all of which are critical for maintaining efficiency and quality in the sector. Adopting JIT principles simplifies inventory management by aligning production schedules with demand, resulting in less material waste and lower storage costs. This strategy improves operating efficiency and ensures timely delivery of precast components. Bringing production in line with project timeframes enables a full examination of manufacturing processes in order to identify and eliminate non-value-adding activities. By outlining each process, organizations can identify inefficiencies and apply focused improvements, resulting in shorter cycle times and increased production. Implementing PY mechanisms prioritizes error prevention by developing processes that reduce the possibility of mishaps. This proactive strategy improves product quality while reducing rework, resulting in more reliable and efficient production methods.
The use of these lean methods has a substantial impact on the precast industry’s social dimensions in addition to operational benefits. Integrating lean tools promotes continual development and employee involvement. Employees are encouraged to submit ideas and participate in problem-solving activities, which leads to higher job satisfaction and a greater sense of ownership over operations. These approaches help to improve the precast industry’s sustainability by minimizing waste and optimizing resource use. This dedication to environmental stewardship improves the industry’s reputation and benefits the larger community by fostering sustainable growth. These tools help to create a safer and more organized workplace, lowering the chance of accidents and improving employee well-being. Furthermore, by improving product quality and minimizing waste, these techniques promote consumer pleasure and trust, fulfilling broader social objectives such as accountability and sustainability.
  • Implementing lean principles in precast construction is a context-specific process that depends on multiple factors, such as site conditions, work culture, the type of NVA activities, management approach, and awareness of lean tools. Since there is no one-size-fits-all sequence of steps, organizations must customize lean applications based on their unique conditions.
  • Since lean implementation is highly context-dependent, construction firms must first assess their existing processes, identify inefficiencies, and select the most appropriate lean tools accordingly. By adopting a flexible, iterative approach, precast construction companies can gradually improve productivity, reduce waste, and enhance project outcomes.
  • Success of lean implementation can be used to determine the extent to which lean implementation has been successful. Some examples of KPIs for the precast industry are cycle time, defect rates, inventory turnover, etc.
  • A cost–benefit analysis of effecting lean implementation in terms of the reduction in labor hours, material wastage, and inventory can be conducted. Monitoring the time taken to produce each individual precast component from first design through to installation can yield time data to assess how time can be reduced. A reduction in cycle time is a direct indicator that lean practices are having a positive effect.
  • Surveys with contractors or end user of the precast product will feedback improvement in quality and reduction in defects of the precast product indicating success of TQM. These lean principles can be used by precast manufacturers to streamline processes, eliminate waste, and effectively increase productivity and quality.

6.4. Limitations and Recommendations

This study provides useful insights on the use of lean tools in the precast construction industry; nevertheless, certain limitations should be noted. The research is mostly based on expert interviews from the Indian construction sector, which may introduce regional biases and limit the findings’ generalizability to other contexts. Furthermore, the study may investigate other possibly useful lean tools. The study’s cross-sectional design further limits its ability to evaluate the long-term effects of implementing these lean methods on operational efficiency and social outcomes.
To address these limitations, future research should investigate a more diverse and representative sample, including multiple geographical regions and industry sectors, to increase the relevance of the findings. Expanding the scope to cover a larger range of lean tools and processes may provide a more complete knowledge of their relative efficacy in various operational scenarios. Longitudinal studies are required to assess the long-term impact of lean tool implementation, providing more insight into the benefits and potential issues. Engaging a broader range of stakeholders, such as frontline employees, management, customers, and community representatives, would ensure that diverse perspectives are considered, enriching the analysis, and making it easier to develop holistic, socially responsible lean implementation plans.

7. Conclusions

The research successfully achieved its objectives by showcasing how the integration of lean principles and precast construction methods can enhance and streamline construction processes, resulting in waste reduction, increased productivity, and improved overall quality. This integration of lean tools within the precast industry can also contribute to better compliance with regulatory standards, ensuring that organizations align with global regulations and legislation to deliver safe and effective products. The research establishes a relationship between lean tools and NVA activities and employs MCDM methods to prioritize these tools based on their effectiveness.
As the adoption of lean tools is reliable, the research further continued to prioritize the lean tools based on various NVA activities involved in the precast industry. Six lean tools and six NVA activities are considered and MCDM analysis is utilized, as ranking should be performed based on various criteria. From the results of MCDM analysis TQM received the first priority for adopting in precast industry. The order of priority for the adoption is TQM > CI > 5S > JIT > VSM > PY. The results of the MCDM analysis provide valuable insights into the strategic selection of lean tools for the precast industry. The prioritization confirms that TQM is the most effective tool, highlighting its role in process standardization, defect reduction, and quality improvement. CI, which follows closely, plays a crucial role in fostering continuous improvement and adaptability, ensuring that lean initiatives remain sustainable in the long term. The inclusion of 5S in the top three further emphasizes its importance in workplace organization and efficiency, particularly in reducing unnecessary movement and operational inefficiencies. JIT, while effective in optimizing workflow and inventory management, is ranked fourth due to its dependence on a structured operational framework. VSM and PY, though ranked lower, contribute to waste identification and error-proofing, serving as supportive tools for lean implementation.
The interpretation of these rankings reveals that TQM and CI significantly impact productivity by enhancing overall process efficiency and ensuring continuous improvement. The 5S method plays a crucial role in workforce optimization, maintaining an organized and structured workplace to reduce inefficiencies. The lower ranking of JIT, VSM, and PY suggests that while they support lean implementation, they require a well-established system to be fully effective. This understanding is essential for decision-makers in the precast industry, helping them prioritize lean adoption strategies based on their organizational readiness.
This study concludes that there is a significant opportunity to reduce waste and enhance value within the construction industry. It becomes apparent from this study that a substantial portion of NVA activities exists within the precast construction processes rather than activities that contribute value. Approximately 50% of these NVA activities can be attributed to factors that fall under the purview of management. For instance, frequent instances of rework occur on-site due to errors originating in the precast fabrication phase. The implementation of the PY technique emerges as the optimal solution to this problem. PY allows manufacturers to identify the root causes of errors in real-time and take immediate corrective actions instead of reacting after the fact. This study presents a methodology for detecting and improving waste in precast processes by combining existing precast industry practices with lean techniques. Notably, this model’s major advantage lies in its simplicity, requiring minimal specialized training. The key factors for the successful implementation of such new methodologies include the commitment of all participants at various organizational levels and the promotion of a problem-solving culture. To instill a culture of waste minimization, reward mechanisms can be linked to waste reduction by introducing “continuous improvement projects” as a key performance indicator. The research analysis assists in determining where to commence the implementation process, emphasizing that systematic identification and elimination of NVA activities can lead to significant process improvements.
By adhering to this ranking, industry practitioners can achieve a structured and data-driven approach to lean implementation. The benefits include minimized waste, enhanced operational efficiency, and optimized resource utilization, ultimately leading to cost reductions and improved project timelines. Furthermore, the sensitivity analysis validates the robustness of this ranking, indicating that even with variations in criteria weights, the top-ranked tools remain consistently impactful. This reinforces the practical applicability of the proposed framework, providing a clear roadmap for decision-makers in the precast sector.

Author Contributions

Conceptualization, P.V.I. and A.R.; methodology, H.M.D. and A.R.; software, M.A. and A.R.; validation, P.V.I., M.A. and Y.E.I.; formal analysis, H.M.D. and A.R.; investigation, H.M.D. and A.R.; resources, M.A. and Y.E.I.; data curation, MA. and A.R.; writing—original draft preparation, H.M.D., M.A. and A.R.; writing—review and editing, P.V.I. and Y.E.I.; visualization, P.V.I. and Y.E.I.; supervision, A.R. and Y.E.I.; funding acquisition, M.A. and Y.E.I. All authors have read and agreed to the published version of the manuscript.

Funding

This research received no external funding. The APC was funded by Prince Sultan University.

Data Availability Statement

Data will be available on request.

Acknowledgments

The authors would like to thank the Structures and Materials Research Laboratory, Prince Sultan University, for their viable support. The authors would also like to thank Prince Sultan University for paying the article processing charges (APC) for this publication.

Conflicts of Interest

The authors declare no conflicts of interest.

Abbreviations

The following abbreviations are used in this manuscript:
NVAnon-value added
MCDMmulti-criteria decision-making
TQMtotal quality management
CIcontinuous improvement
JITjust-in-time
PYpoka-yoke

References

  1. Ibrahim, M.W.; Hanna, A.S. Comparative analysis of project performance between different project delivery systems. In Proceedings of the 27th Annual Conference of the International Group for Lean Construction, London, UK, 1 July 2019; pp. 663–674. [Google Scholar]
  2. Ingle, P.V.; Gangadhar, M.; Deepak, M. Developing a project performance assessment model for benchmarking the project success of Indian construction projects. Benchmarking Int. J. 2024, 31, 1426–1452. [Google Scholar] [CrossRef]
  3. Bayhan, H.G.; Demirkesen, S.; Jayamanne, E. Enablers and barriers of lean implementation in construction projects. IOP Conf. Ser. Mater. Sci. Eng. 2019, 471, 022002. [Google Scholar] [CrossRef]
  4. Pasquire, C.L.; Connolly, G.E. Leaner construction through off-site manufacturing. In Proceedings of the IGLC, Gramado, Brazil, 6 August 2002; pp. 263–266. [Google Scholar]
  5. Innella, F.; Arashpour, M.; Bai, Y. Lean methodologies and techniques for modular construction: Chronological and critical review. J. Constr. Eng. Manag. 2019, 145, 04019076. [Google Scholar] [CrossRef]
  6. Ahmad, S.; Soetanto, R.; Goodier, C. Lean approach in precast concrete component production. Built Environ. Proj. Asset Manag. 2019, 9, 457–470. [Google Scholar] [CrossRef]
  7. Gupta, S.; Jain, S.K. A literature review of lean manufacturing. Int. J. Manag. Sci. Eng. Manag. 2013, 8, 241–249. [Google Scholar] [CrossRef]
  8. Enshassi, A.; Saleh, N.; Mohamed, S. Barriers to the application of lean construction techniques concerning safety improvement in construction projects. Int. J. Constr. Manag. 2021, 21, 1044–1060. [Google Scholar] [CrossRef]
  9. Salem, O.; Solomon, J.; Genaidy, A.; Minkarah, I. Lean construction: From theory to implementation. J. Manag. Eng. 2006, 22, 168–175. [Google Scholar] [CrossRef]
  10. Wang, S.; Tang, J.; Zou, Y.; Zhou, Q. Research on production process optimization of precast concrete component factory based on value stream mapping. Eng. Constr. Archit. Manag. 2020, 27, 850–871. [Google Scholar] [CrossRef]
  11. Nahmens, I.; Ikuma, L.H. An Empirical Examination of the Relationship between Lean Construction and Safety in the Industrialized Housing Industry. Lean Constr. J. 2009, 1–12. [Google Scholar] [CrossRef]
  12. Avelar, W.; Meiriño, M.; Tortorella, G.L. The practical relationship between continuous flow and lean construction in SMEs. TQM J. 2020, 32, 362–380. [Google Scholar] [CrossRef]
  13. Womack, J.P.; Jones, D.T. Beyond Toyota: How to root out waste and pursue perfection. Harv. Bus. Rev. 1996, 74, 140–151. [Google Scholar]
  14. Marhani, M.A.; Jaapar, A.; Bari, N.A.A.; Zawawi, M. Sustainability through lean construction approach: A literature review. Procedia-Soc. Behav. Sci. 2013, 101, 90–99. [Google Scholar] [CrossRef]
  15. Wu, P.; Low, S.P.; Jin, X. Identification of non-value adding (NVA) activities in precast concrete installation sites to achieve low-carbon installation. Resour. Conserv. Recycl. 2013, 81, 60–70. [Google Scholar] [CrossRef]
  16. Singh, S.; Kumar, K. Review of literature of lean construction and lean tools using systematic literature review technique (2008–2018). Ain Shams Eng. J. 2020, 11, 465–471. [Google Scholar] [CrossRef]
  17. Rubio-Romero, J.C.; del Carmen Pardo Ferreira, M.; López-Arquillos, A. Poka-yokes as occupational preventive measures in construction safety. A review. In Advances in Safety Management and Human Factors, Proceedings of the AHFE 2018 International Conference on Safety Management and Human Factors, Orlando, FL, USA, 21–25 July 2018; Springer: Berlin/Heidelberg, Germany, 2019; pp. 556–562. [Google Scholar]
  18. Yücenur, G.N.; Şenol, K. Sequential SWARA and fuzzy VIKOR methods in elimination of waste and creation of lean construction processes. J. Build. Eng. 2021, 44, 103196. [Google Scholar] [CrossRef]
  19. Alinaitwe, H.M. Prioritising Lean Construction Barriers in Uganda’s Construction Industry. J. Constr. Dev. Ctries. 2009, 14, 15–30. [Google Scholar]
  20. Sundar, R.; Balaji, A.; Kumar, R.S. A review on lean manufacturing implementation techniques. Procedia Eng. 2014, 97, 1875–1885. [Google Scholar] [CrossRef]
  21. Mani, V.; Gunasekaran, A.; Delgado, C. Enhancing supply chain performance through supplier social sustainability: An emerging economy perspective. Int. J. Prod. Econ. 2018, 195, 259–272. [Google Scholar] [CrossRef]
  22. Bamana, F.; Lehoux, N.; Cloutier, C. Simulation of a construction project: Assessing impact of just-in-time and lean principles. J. Constr. Eng. Manag. 2019, 145, 05019005. [Google Scholar] [CrossRef]
  23. Ahmed, S.; Hossain, M.M.; Haq, I. Implementation of lean construction in the construction industry in Bangladesh: Awareness, benefits and challenges. Int. J. Build. Pathol. Adapt. 2021, 39, 368–406. [Google Scholar] [CrossRef]
  24. Shabeen, S.R.; Krishnan, K.A. Application of lean manufacturing using value stream mapping (VSM) in precast component manufacturing: A case study. Mater. Today Proc. 2022, 65, 1105–1111. [Google Scholar] [CrossRef]
  25. Jabi, I.; Faour, M.; Saleh, Y. Impact of total quality management on the sustainable performance in the Palestinian construction industry. TQM J. 2024; ahead-of-print. [Google Scholar] [CrossRef]
  26. Ofoegbu, W.C.; Eromosele, H.O. Total quality management and product innovation of manufacturing firms in rivers state. IJO-Int. J. Bus. Manag. 2024, 7, 01–19. [Google Scholar]
  27. Vinodh, S.; Swarnakar, V. Lean Six Sigma project selection using hybrid approach based on fuzzy Dematel–Anp–Topsis. Int. J. Lean Six Sigma 2015, 6, 313–338. [Google Scholar] [CrossRef]
  28. Dara, H.M.; Raut, A.; Adamu, M.; Ibrahim, Y.E.; Ingle, P.V. Reducing non-value added (NVA) activities through lean tools for the precast industry. Heliyon 2024, 10, e29148. [Google Scholar] [CrossRef]
  29. Ellis, P.D. Effect sizes and the interpretation of research results in international business. J. Int. Bus. Stud. 2010, 41, 1581–1588. [Google Scholar] [CrossRef]
  30. Fauzan, M.; Sunindijo, R. Lean construction and project performance in the Australian construction industry. IOP Conf. Ser.: Earth Environ. Sci. 2021, 907, 012024. [Google Scholar] [CrossRef]
  31. Khan, S.A.; Kaviani, M.A.; J. Galli, B.; Ishtiaq, P. Application of continuous improvement techniques to improve organization performance: A case study. Int. J. Lean Six Sigma 2019, 10, 542–565. [Google Scholar] [CrossRef]
  32. Riaz, H.; Khan, K.I.A.; Ullah, F.; Tahir, M.B.; Alqurashi, M.; Alsulami, B.T. Key factors for implementation of total quality management in construction Sector: A system dynamics approach. Ain Shams Eng. J. 2023, 14, 101903. [Google Scholar] [CrossRef]
  33. Gunduz, M.; Fahmi Naser, A. Cost based Value Stream Mapping as a sustainable construction tool for undergraound pipeline construction projects. Sustainability 2017, 9, 2184. [Google Scholar] [CrossRef]
  34. Lv, Z.; Guo, J.; Lv, H. Safety poka yoke in zero-defect manufacturing based on digital twins. IEEE Trans. Ind. Inform. 2022, 19, 1176–1184. [Google Scholar] [CrossRef]
  35. Cabrera, O.; Tejeda, J.; Llontop, J.; Mendoza, P.; Alvarez, J.C.; Demirkesen, S. A validation model to reduce non-contributory time based on Lean tools: Case of a construction company in Perú. Cogent Eng. 2023, 10, 2236838. [Google Scholar] [CrossRef]
  36. Jomhari, N.; Alias, N.A.A.; Ellah, A.A.A.; Magableh, A.A.; Ghazali, E.M. A Multi-Criteria Decision-Making for Legacy System Modernization With FUCOM-WSM Approach. IEEE Access 2024, 12, 48608–48619. [Google Scholar] [CrossRef]
  37. Agrawal, A.; Alenezi, M.; Kumar, R.; Khan, R.A. A unified fuzzy-based symmetrical multi-criteria decision-making method for evaluating sustainable-security of web applications. Symmetry 2020, 12, 448. [Google Scholar] [CrossRef]
  38. Li, X.; Wang, K.; Liu, L.; Xin, J.; Yang, H.; Gao, C. Application of the entropy weight and TOPSIS method in safety evaluation of coal mines. Procedia Eng. 2011, 26, 2085–2091. [Google Scholar] [CrossRef]
  39. Magabaleh, A.A.; Ghraibeh, L.L.; Audeh, A.Y.; Albahri, A.; Deveci, M.; Antucheviciene, J. Systematic Review of Software Engineering Uses of Multi-Criteria Decision-Making Methods: Trends, Bibliographic Analysis, Challenges, Recommendations, and Future Directions. Appl. Soft Comput. 2024, 163, 111859. [Google Scholar] [CrossRef]
  40. Thakkar, J.J. Multi-Criteria Decision Making; Springer: Berlin/Heidelberg, Germany, 2021; Volume 336. [Google Scholar]
  41. Keshavarz Ghorabaee, M.; Zavadskas, E.K.; Olfat, L.; Turskis, Z. Multi-criteria inventory classification using a new method of evaluation based on distance from average solution (EDAS). Informatica 2015, 26, 435–451. [Google Scholar] [CrossRef]
  42. Torkayesh, A.E.; Deveci, M.; Karagoz, S.; Antucheviciene, J. A state-of-the-art survey of evaluation based on distance from average solution (EDAS): Developments and applications. Expert Syst. Appl. 2023, 221, 119724. [Google Scholar] [CrossRef]
  43. Lee, H.-C.; Chang, C.-T. Comparative analysis of MCDM methods for ranking renewable energy sources in Taiwan. Renew. Sustain. Energy Rev. 2018, 92, 883–896. [Google Scholar] [CrossRef]
  44. Li, T.; Li, A.; Guo, X. The sustainable development-oriented development and utilization of renewable energy industry—A comprehensive analysis of MCDM methods. Energy 2020, 212, 118694. [Google Scholar] [CrossRef]
  45. Mostafaeipour, A.; Hosseini Dehshiri, S.J.; Hosseini Dehshiri, S.S.; Jahangiri, M.; Techato, K. A thorough analysis of potential geothermal project locations in Afghanistan. Sustainability 2020, 12, 8397. [Google Scholar] [CrossRef]
Figure 1. Proposed research model.
Infrastructures 10 00055 g001
Figure 2. Flowchart of research methodology.
Infrastructures 10 00055 g002
Figure 3. Conceptual diagram for MCDM analysis.
Infrastructures 10 00055 g003
Figure 4. Entropy weight calculation procedure.
Infrastructures 10 00055 g004
Figure 5. TOPSIS method application procedure.
Infrastructures 10 00055 g005
Figure 6. EDAS method application procedure.
Infrastructures 10 00055 g006
Figure 7. VIKOR method application procedure.
Infrastructures 10 00055 g007
Figure 8. (a) Radar charts of Scenario 1; (b) radar charts of Scenario 2; (c) radar charts of Scenario 3; (d) radar charts of Scenario 4; (e) radar charts of Scenario 5; (f) radar charts of Scenario 6; (g) radar charts of Scenario 7.
Infrastructures 10 00055 g008aInfrastructures 10 00055 g008b
Figure 9. Results of the three MCDM analysis.
Infrastructures 10 00055 g009
Table 1. Demographic details of respondents.
CategoryVariablesFrequency
Experience1–5 (Years)42
6–10 (Years)34
11–15 (Years)17
15 and above6
PositionPrecast Industry Managers22
Lean Associates17
Project Mangers23
Academics16
Others21
Table 2. Data from questionnaire.
Criteria
AlternativesUIWTOPUMIOFP
JIT0.167700.166850.165830.163660.166080.16541
CI0.167700.170660.164700.168730.175450.16425
TQM0.169400.169570.173120.174360.168420.17468
VSM0.167140.165220.164700.163660.164910.15962
PY0.160360.159230.162460.160290.154960.16831
5S0.167700.168480.169190.169290.170180.16773
Table 3. Entropy weights.
Criteria w j
UI0.07325
WT0.12259
OP0.10541
UM0.18425
IO0.33611
FP0.17839
Table 4. Normalized weights.
Criteria
AlternativesUIWTOPUMIOFP
JIT0.410720.408590.406100.400740.406530.40502
CI0.410720.417910.403350.413140.429460.40219
TQM0.414880.415250.423950.426930.412260.42770
VSM0.409340.404590.403350.400740.403660.39085
PY0.392730.389940.397860.392470.379310.41211
5S0.410720.412580.414340.414520.416560.41069
Table 5. TOPSIS results.
AlternativesSi+Si−RCC *Rank
JIT0.01020.010010.495334
CI0.005650.017790.758821
TQM0.005790.015030.722032
VSM0.012210.008620.413875
PY0.018820.003790.167766
5S0.00590.014080.704863
* RCC: Relative closeness coefficient.
Table 6. EDAS results.
Alternatives N S P i * N S N i * A S i Rank
JIT0.021000.846640.433824
CI0.834000.908020.871012
TQM1.000001.000001.000001
VSM0.007380.598020.302705
PY0.062630.000000.031326
5S0.517561.000000.758783
* NSPi: Normalized weighted sum of PDAij. * NSNi: Normalized weighted sum of NDAij.
Table 7. VIKOR results.
Alternatives S i Rank   ( S i ) R i Rank   ( R i ) Q i Rank   ( Q i ) VIKOR Rank
JIT0.5301840.1536540.3964244
CI0.2941520.1235030.1828233
TQM0.1269110.1152420.0576911
VSM0.6511850.1783950.5245355
PY0.8970860.3361161.0000066
5S0.3110130.0864310.1195222
Table 8. Criteria weights of different scenarios.
ScenariosUIWTOPUMIOFP
Scenario 10.166670.166670.166670.166670.166670.16667
Scenario 20.50.10.10.10.10.1
Scenario 30.10.50.10.10.10.1
Scenario 40.10.10.50.10.10.1
Scenario 50.10.10.10.50.10.1
Scenario 60.10.10.10.10.50.1
Scenario 70.10.10.10.10.10.5
Disclaimer/Publisher’s Note: The statements, opinions and data contained in all publications are solely those of the individual author(s) and contributor(s) and not of MDPI and/or the editor(s). MDPI and/or the editor(s) disclaim responsibility for any injury to people or property resulting from any ideas, methods, instructions or products referred to in the content.

