1. Introduction
Earthquakes pose substantial risks to urban areas, particularly in densely populated cities with aging or vulnerable infrastructure. High population densities exacerbate the potential for casualties and injuries during seismic events, as individuals are at risk of being trapped in collapsing structures or facing difficulties during evacuation [
1]. Furthermore, critical urban infrastructure, including transportation networks, bridges, and utilities, often lacks the resilience to withstand the dynamic forces generated by earthquakes [
2]. Such vulnerabilities can result in critical failures, including gas-line ruptures, power outages, and obstructed evacuation routes, which significantly hinder emergency response efforts. Older buildings, particularly those constructed before the adoption of modern seismic codes, are especially vulnerable, increasing both structural losses and the likelihood of fatalities [
3,
4]. To mitigate these risks, cities must adopt effective preparedness and mitigation strategies, including enforcing and updating building codes, raising public awareness and education about earthquake risk [
5], and establishing emergency response plans aimed at minimizing the impact of earthquakes on urban populations [
6,
7]. Additionally, leveraging innovative technologies, such as digital mapping, can enhance crisis management by providing accurate and timely information to support decision-making during and after seismic events [
8,
9]. Seismic resilience study often begins with a numerical analysis of a designated area, based on a relevant seismic scenario, to determine the performance of a specific structural system [
10]. This analysis helps evaluate parameters such as economic losses and injury levels. To enable community-scale level assessments [
11,
12,
13], some case studies incorporate software such as Hazus [
14], which allows the examination of broader geographic areas. Depending on the chosen level of analysis, these methodologies can produce results with varying degrees of precision.
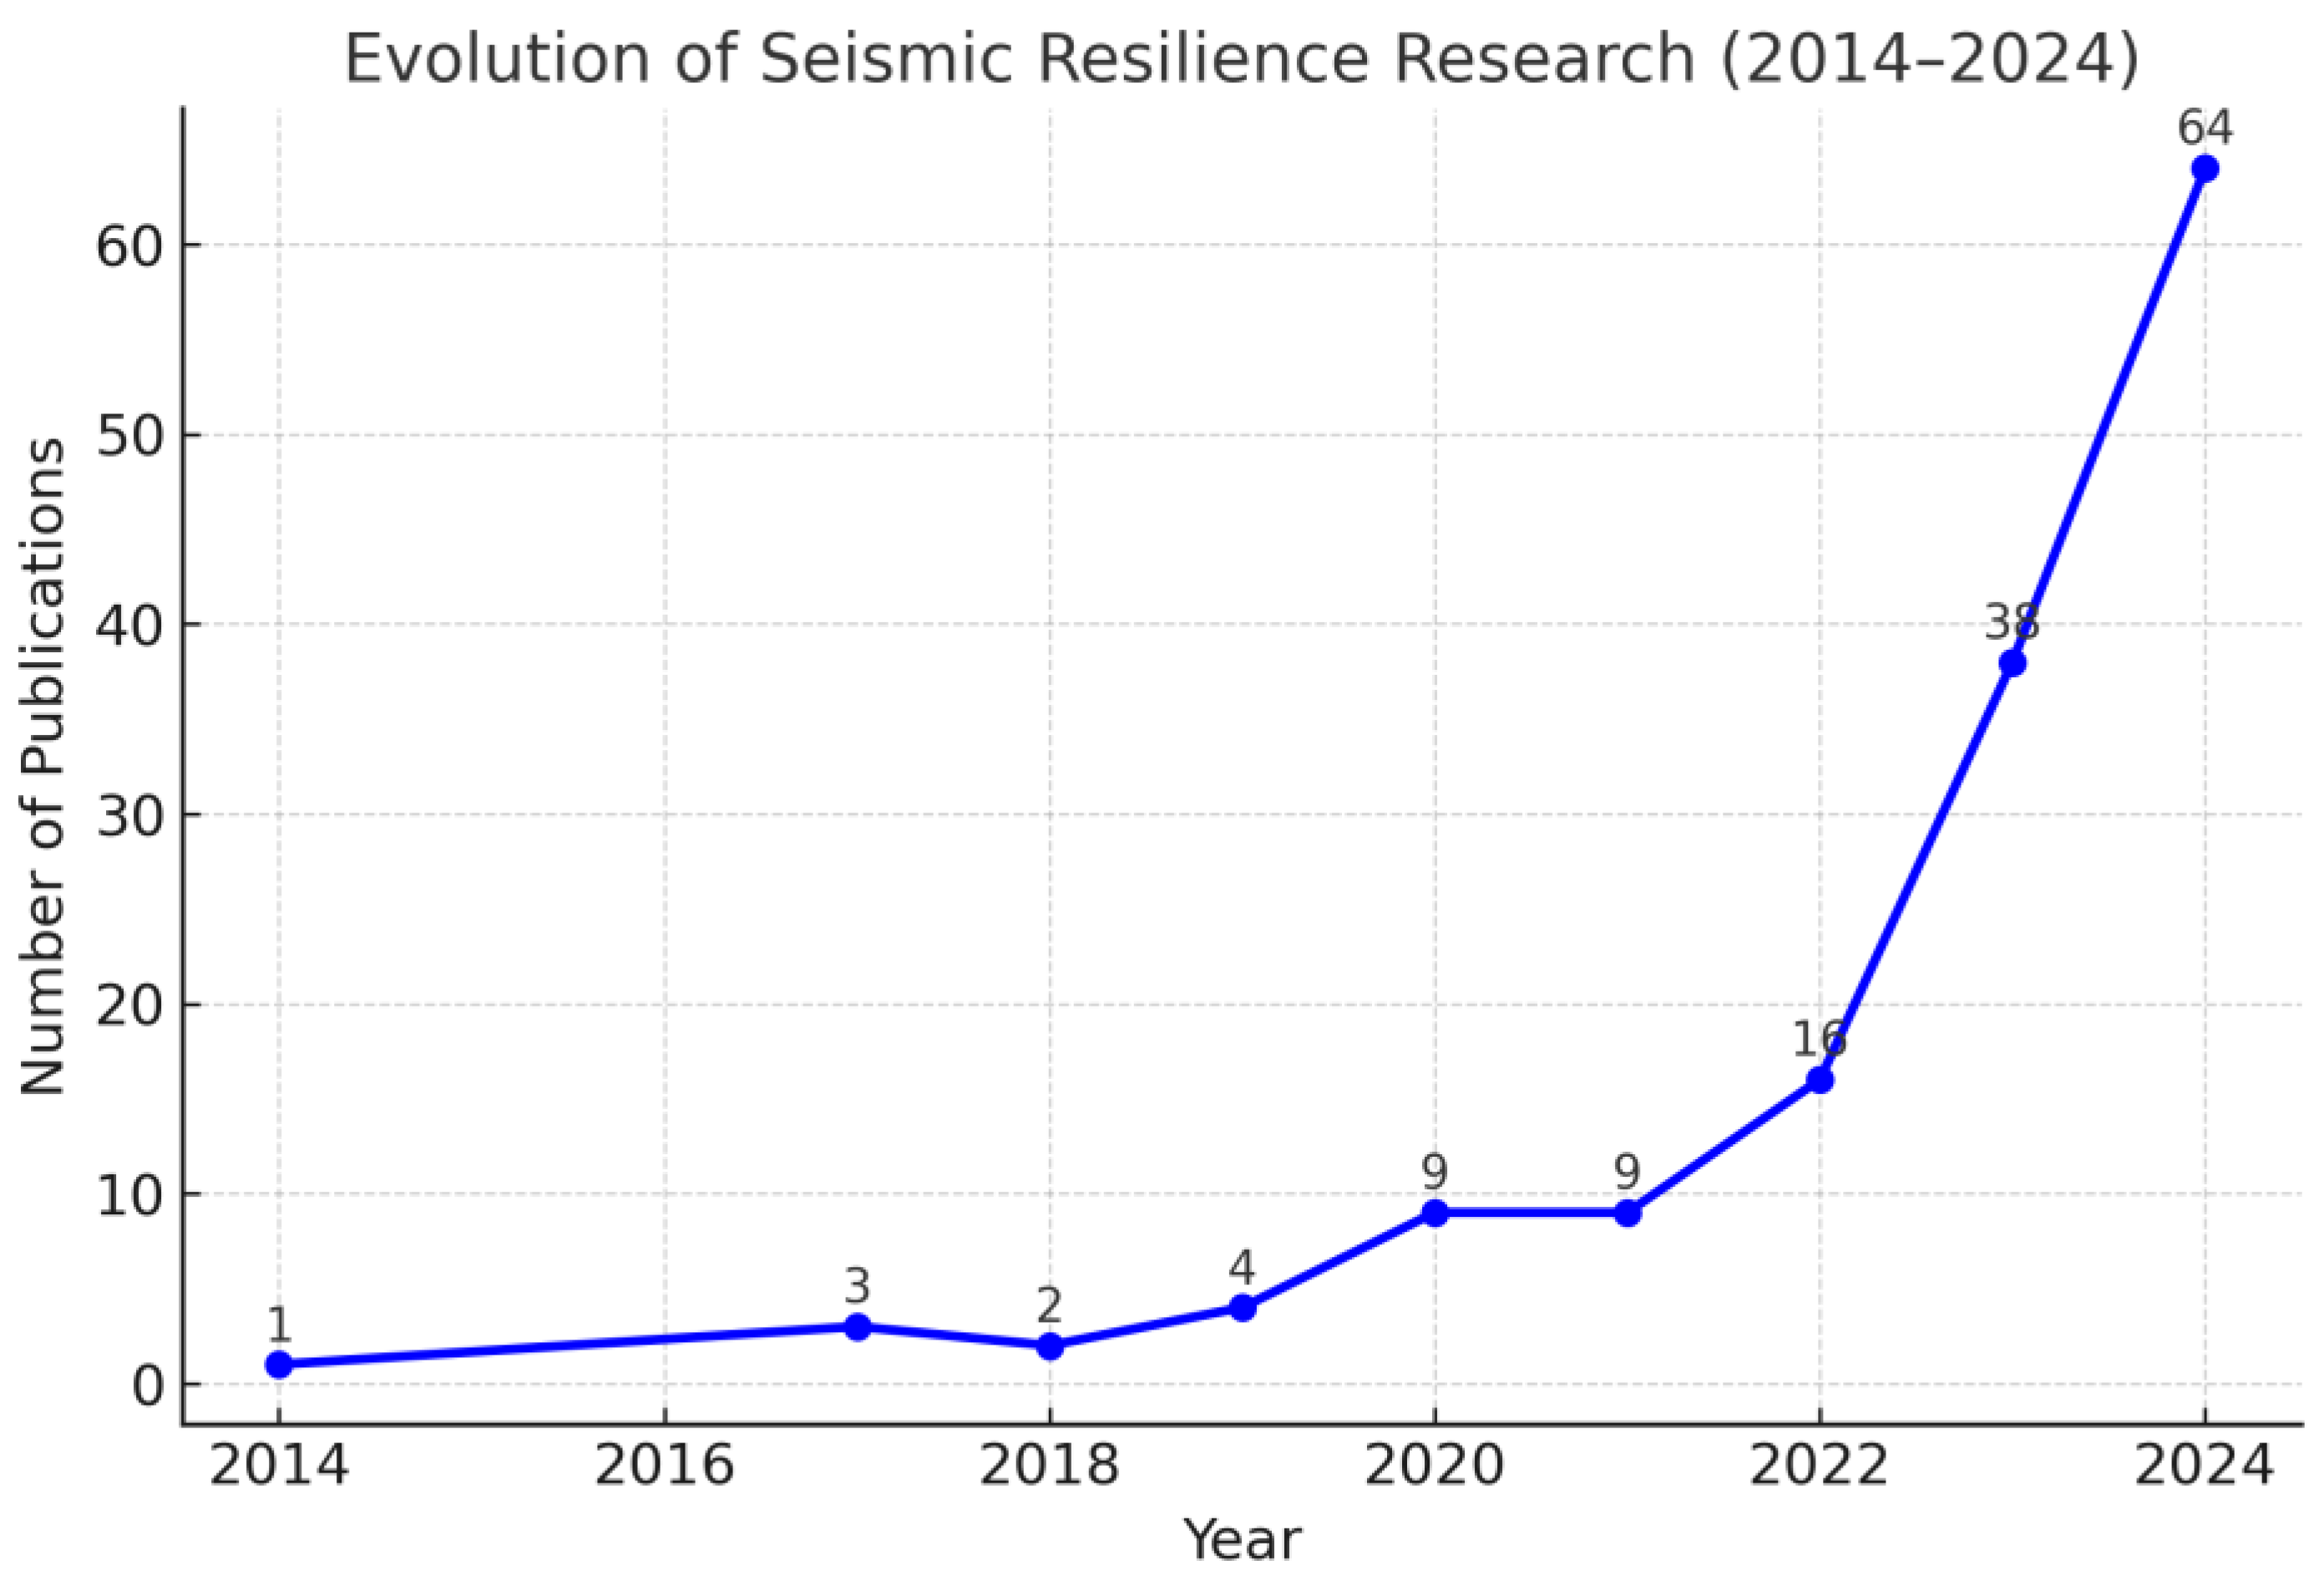
Numerous studies have focused on hazard awareness, knowledge, and perception of people. For example, the authors [
15] examined the earthquake preparedness in Erzincan Province, Turkey, analyzing the earthquake knowledge and behavior levels of the residents through a cross-sectional survey targeting individuals aged 18 years and older. Similarly, the authors [
16] developed an assessment tool for evaluating public emergency preparedness in Slovak municipalities, with potential for adaptation to other regions. Complementing these studies, the authors [
17] examined strategies for enhancing Italy’s regulatory framework for managing earthquake debris. Furthermore, the authors [
18] applied a qualitative approach using realist thematic analysis, combining both deductive and inductive coding, to evaluate official earthquake recommendations from European countries exposed to seismic risk, identifying similarities and differences between research findings and policy frameworks.
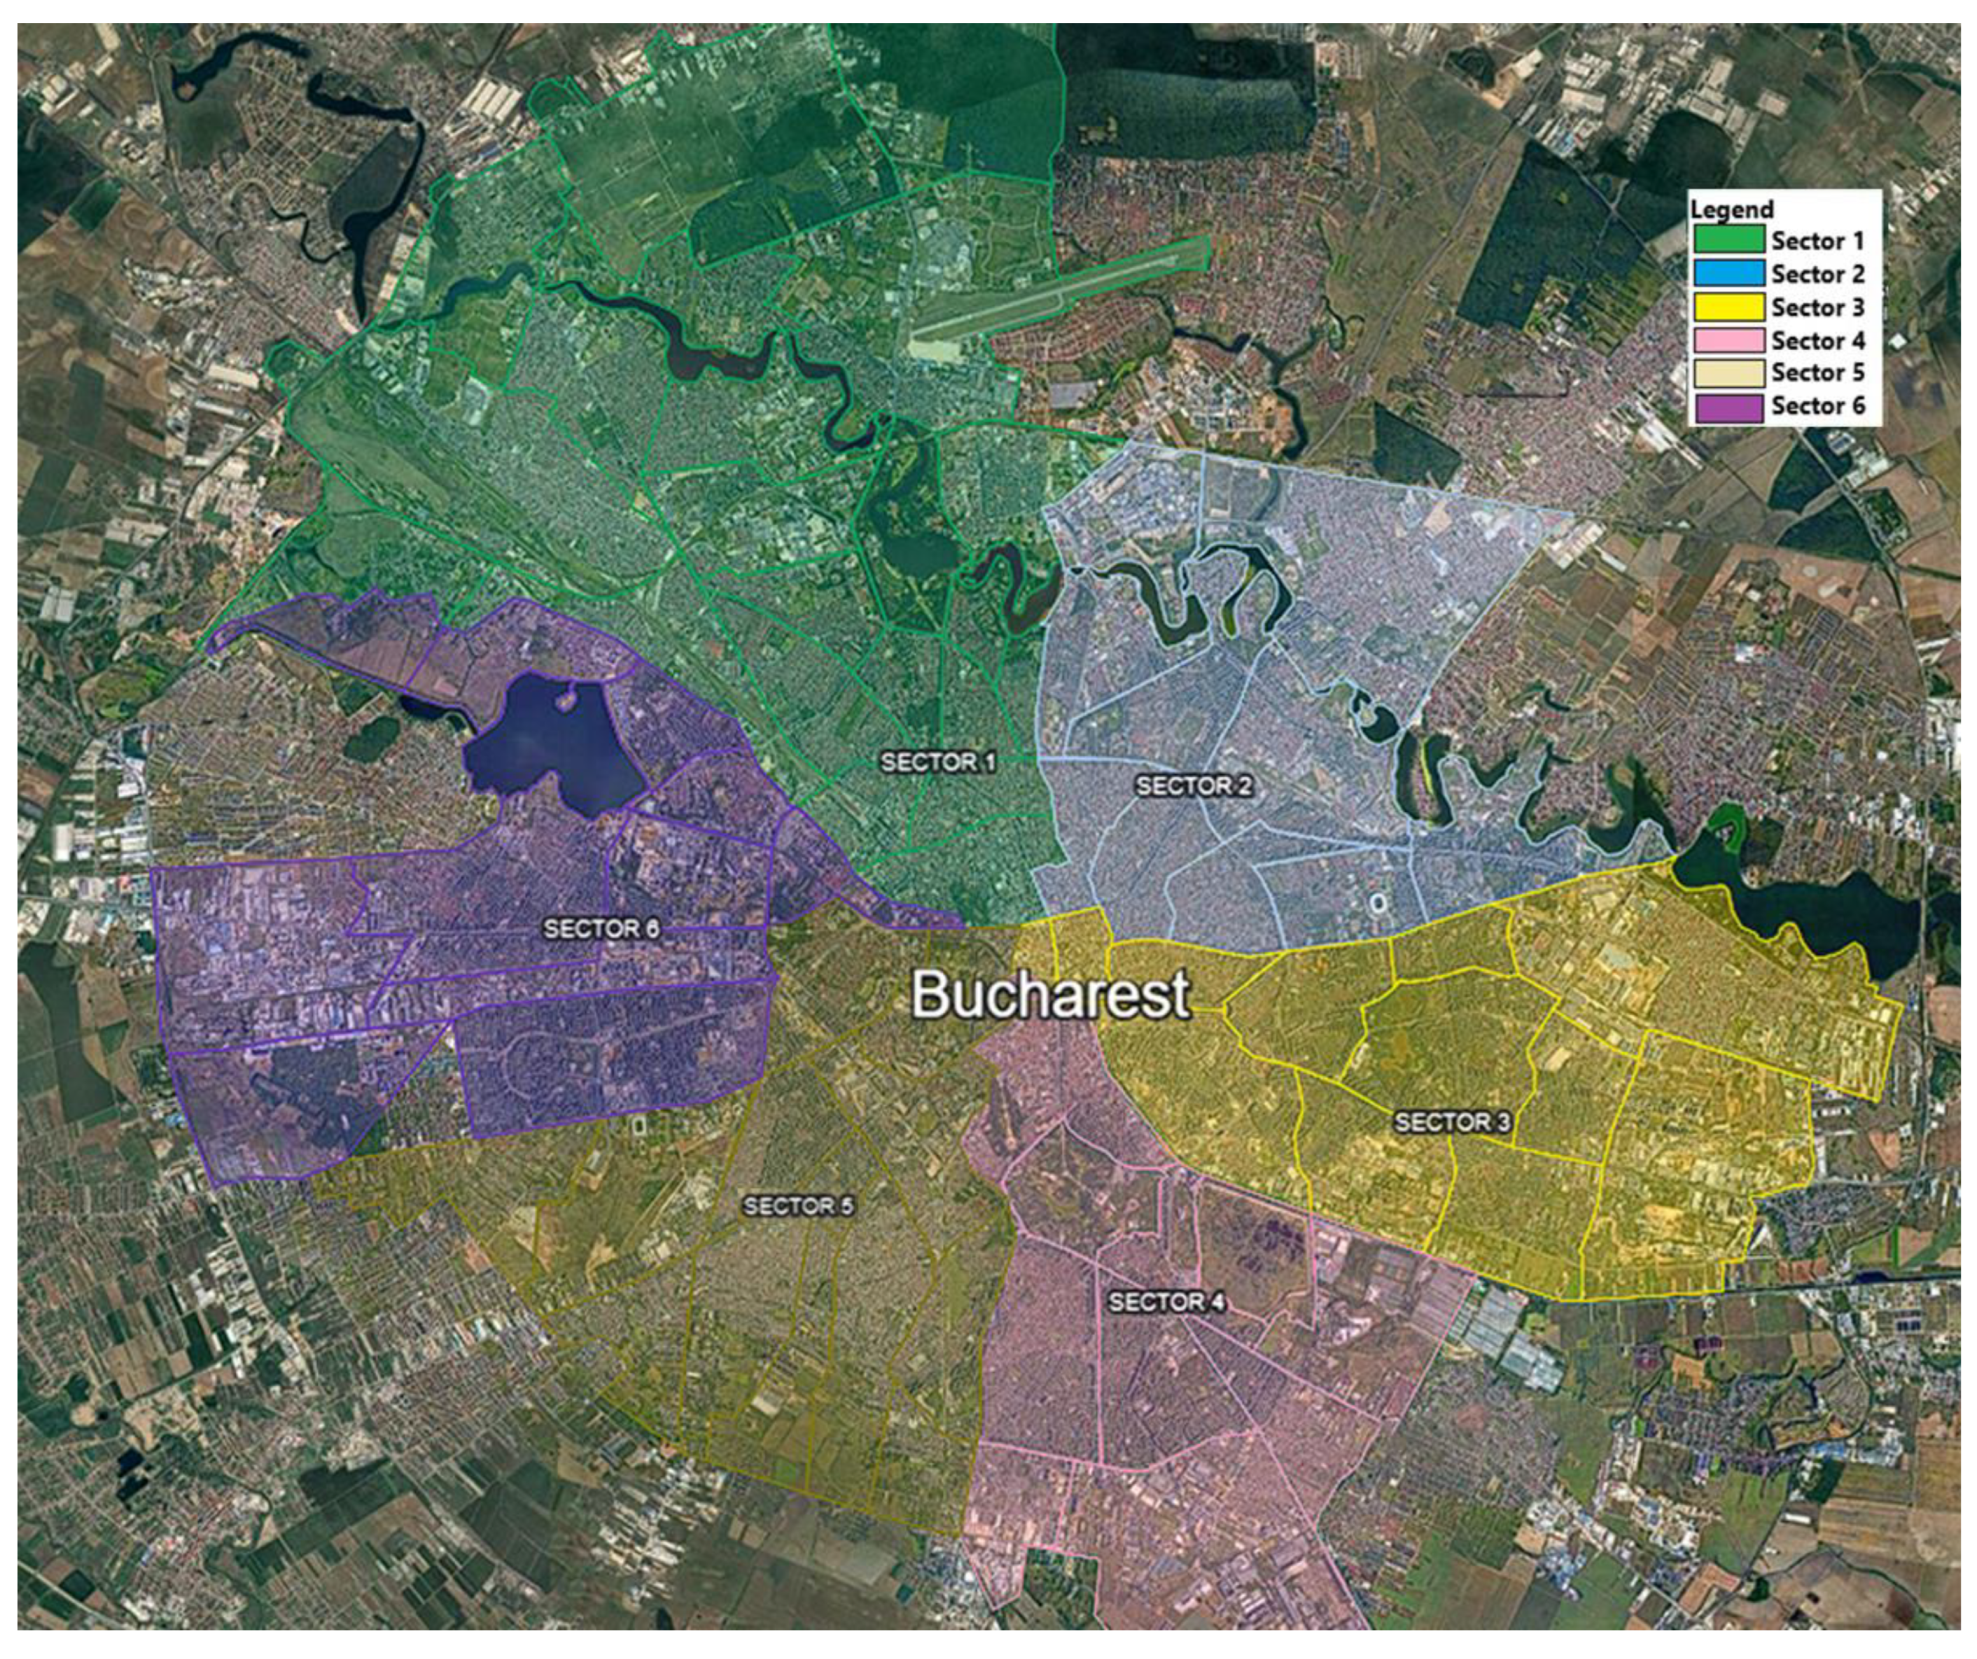
These findings underscore the critical role of preparedness in mitigating risks in seismically active regions, particularly those with high vulnerability. Vrancea, one of the most seismically active zones in Europe, exemplifies such a critical area. Bucharest, located within Vrancea’s influence area, is among the most seismically vulnerable capital cities in Europe [
19,
20,
21,
22,
23,
24,
25,
26]. This heightened vulnerability exacerbates the risk of earthquake-induced damage emphasizing the need for targeted mitigation strategies. For example, the authors [
27] explored regulatory and operational measures for identifying seismically vulnerable buildings, detailing the roles and responsibilities of both public and private stakeholders in implementing these measures. Additionally, studies such as [
19,
28] highlighted the alarming number of at-risk buildings in Bucharest, posing a severe threat to the population and increasing the likelihood of significant casualties and extensive property damage in the event of an earthquake.
Internationally, studies such as [
29] have highlighted the widespread use of maps for disaster mitigation planning, including marking vulnerable areas [
30]. These mapping tools play a critical role in enabling real-time decision-making, which is essential for effective disaster response and recovery.
In Romania, a post-earthquake intervention methodology has been developed based on international best practices. This methodology facilitates rapid building inspections, prioritizes interventions, and ensures the stabilization of severely damaged structures to enable safe rescue operations with minimal risk [
31]. Moreover, Romania’s National Strategy for Seismic Risk Reduction addresses buildings’ vulnerabilities, fosters collaboration among state institutions, and proposes legislative and policy measures to minimize seismic damage [
32]. However, despite these advancements, a research gap persists, concerning the identification of relocation areas during the mitigation phase of an earthquake crisis.
This study aims to contribute to Bucharest’s seismic resilience by integrating multi-sectoral inputs, identifying vulnerable areas, mapping key relocation zones, and analyzing seismic data to support emergency preparedness, infrastructure planning, resource allocation, and stakeholder engagement. The research focuses on improving earthquake mitigation efforts by identifying key relocation zones to facilitate rapid and safe evacuation during seismic events. Additionally, the study seeks to identify Bucharest’s most vulnerable district by correlating seismic resilience indicators with the city’s existing seismic micro-zoning map [
21,
33]. Insights from this analysis are intended to guide future preparedness strategies, enhance infrastructure planning, and optimize resource allocation, ultimately strengthening the city’s overall seismic resilience.
Considering the outlined objective, the research questions (RQs) are formulated as follows:
RQ 1: What are the key indicators of seismic resilience for urban areas, and how can they be tailored to Bucharest’s specific context?
RQ2: Which district in Bucharest demonstrates the highest vulnerability to seismic risks, based on the correlation between seismic resilience indicators and the city’s seismic micro-zonation map?
RQ3: What are the critical areas designated for emergency use, and how can these areas ensure the rapid and safe relocation of at-risk populations during seismic events?
RQ4: What are the strengths, weaknesses, opportunities, and threats (SWOT) of the proposed mitigation strategy for Bucharest?
The novelty of this study lies in the development of a digital mapping tool that integrates seismic resilience data with Bucharest’s seismic micro-zonation map, providing an innovative and data-driven approach to seismic resilience planning. This tool facilitates the identification and designation of key relocation areas and medical facilities, enhancing emergency response coordination and enabling the rapid and safe evacuation of at-risk populations during seismic events. Additionally, it highlights vulnerable neighborhoods, providing local and central government decision-makers with a valuable resource for planning preventive interventions in high-risk areas. In the aftermath of an earthquake, the tool becomes essential for emergency response, facilitating efficient management of relocation operations. Furthermore, it bridges the gap between theoretical research and practical application by offering the public real-time access to shelter and treatment locations via personal smartphones. This approach establishes a multi-sectoral strategy tailored to Bucharest’s specific seismic risks and serves as a model for other high-risk urban areas. To the best of our knowledge, this article represents the first interdisciplinary study to validate the key elements of the proposed earthquake mitigation strategy through workshop and interview techniques.
The structure of the paper is as follows:
Section 2, Literature Review, provides an overview of relevant studies, highlighting the context for research.
Section 3, Materials and Methods outlines the data, tools, and methodologies utilized throughout the study.
Section 4: Results presents the main findings, including the identification of vulnerable neighborhoods and designated relocation areas.
Section 5, Conclusions summarizes the study’s contributions and implications for disaster management, offering recommendations for future research and applications.
3. Materials and Methods
The Vrancea region is one of Europe’s most significant seismic zones, characterized by earthquakes occurring at intermediate depths, ranging from 70 to 180 km [
44]. This region has historically been the epicenter of frequent low-magnitude seismic activity, interspersed with major seismic events that have had profound impacts, such as the earthquakes on 10 November 1940 (M
GR = 7.4), 4 March 1977 (M
GR = 7.2) and 30 August 1986 (M
GR = 7.0) [
33]
To ensure clarity and coherence throughout the study, a structured methodology was adopted, with the key steps outlined in the
Figure 2:
The first three steps of the methodology involve collecting relevant information and defining the focus area of the study. The subsequent three steps focus on processing this information and converting it into a digital map, which forms the study’s final output. The steps will be applied to two of the city’s six administrative districts, allowing for a comparative analysis of the differences between the districts based on the defined indicators.
Step 1. Identification of relevant seismic resilience indicators observed in similar studies. In a preliminary evaluation of the municipality, based on relevant indicators identified from similar studies [
29,
45,
46,
47,
48], it was observed that while Bucharest is located in a significant seismic zone, certain variables have the potential to mitigate seismic hazards. Positive impacts on seismic assessment refer to factors that contribute to reducing hazard risks and facilitating faster recovery for the population, such as well-maintained infrastructure or effective emergency preparedness measures. Conversely, negative impacts encompass factors that hinder recovery following a seismic event, such as inadequate urban planning, informal settlements, and aging infrastructure.
Step 2. The selection of relevant indicators was based on discussions held during a dedicated workshop in October–November 2024, involving ten specialists representing local authority officials, urban planners, public health experts, school teachers, and members of civil society organizations. These discussions were supplemented by the collection of indicator values for Bucharest from various official sources [
49,
50,
51,
52,
53], providing a robust foundation for local analysis. During the workshop, the specialists examined the chosen indicators for their relevance and applicability to Bucharest’s specific seismic risk profile. Particular attention was given to context-specific challenges, such as informal settlements, aging infrastructure, and resource constraints to ensure the indicators adequately captured the complexities of the city’s seismic vulnerability.
The socio-demographic characteristics of the specialists involved in the workshop are outlined in
Table 1:
Step 3. Detection of Vulnerable Areas in Bucharest was conducted by incorporating the selected seismic resilience indicators into a digital map, as shown in
Figure 3. This digital map identifies and highlights key infrastructure, including essential buildings that play a vital role in post-hazard mitigation efforts.
To initiate an assessment of Bucharest’s resilience to seismic hazards and identify the most vulnerable areas in Bucharest it is essential to determine which areas of the city are most susceptible to seismic risks. This can be achieved by analyzing peak ground acceleration (PGA) studies for each zone. The research conducted in [
21,
33] provides PGA values for each district in Bucharest based on the maximal seismic event scenario for the Vrancea region (Mw = 7.8 at a depth of 150 km). According to [
21], the highest PGA of Bucharest is 300 cm/s
2 observed in the 2nd District while the lowest PGA is 220 cm/s
2 recorded in the 4th District.
Step 4. Identification and mapping of relevant public and private medical facilities that could be mobilized during an emergency situation.
A digital map was created to highlight key medical facilities in Bucharest and identify zones suitable for setting up medical tents or temporary shelters. While the concept of using digital maps to enhance seismic resilience has been explored in previous studies [
54], our approach specifically focuses on facilitating response efforts during and after seismic events. Utilizing the previously described indicators, we included essential buildings on the map, such as hospitals, kindergartens, schools, high-schools, and medical facilities capable of providing at least basic first aid.
During the development phase, various options for the digital map were considered, including GIS software and open-source platforms like Google Earth 10.73.0.1 and Google My Maps. Google My Maps, a widely accessible tool developed by Google [
55], was selected due to its practical applicability during emergencies. This platform allows users to create custom maps, download them for offline use, and access critical information even if mobile data and GSM services are disrupted [
56,
57]. While GIS software offers professional mapping capabilities, it is less user-friendly for the general public and lacks the accessibility required in emergency scenarios. Google My Maps also provides a replicable and scalable solution. Its open-source nature allows for adaptation in other cities or regions, extending its use beyond seismic resilience to various emergency applications. This feature makes it particularly valuable for local authorities with limited funding to implement similar tools. The digital map is designed to benefit both the general population and emergency response units by providing real-time updates and routes to the nearest medical facilities or relocation zones. Additionally, its offline functionality ensures reliability during critical response phases, serving as both a backup solution and a vital tool for first responders during search and rescue operations. This adaptability and practicality underscore its role as an effective resource in enhancing emergency preparedness and response.
Step 5. Designation of Open Areas for Emergency Use such as parking lots, parks, and stadiums, for the potential setup of emergency tents intended for medical treatment or population resettlement.
Drawing on international best practices [
58,
59,
60,
61] and the previously mentioned building categories, the study emphasizes the need for designated areas within the city to relocate affected populations and provide medical care for minor injuries that do not require hospitalization. Temporary medical facilities can be rapidly set up in these open areas to facilitate triage, isolation, or treatment services. Proximity to residential areas, such as parking lots and parks, enables faster medical response and reduces delays in delivering critical care. Stadiums, in particular, offer additional benefits, including space for medical helicopters, ensuring quick transport of severely injured individuals.
However, to avoid logistical challenges, not all potential locations within the city were mapped. Instead, the focus was on identifying easily accessible areas for both the public and emergency response teams.
Step 6. Integration of Educational Buildings that could serve as shelters or treatment centers during a crisis in the final version of the digital map (kindergartens, schools, and high-schools). Educational buildings are typically well distributed across urban areas, ensuring accessibility for nearby populations. A study by [
62] highlights that proximity to emergency services significantly reduces disaster-related casualties and stress. Schools, in particular, often feature critical amenities such as large open spaces (e.g., gymnasiums or assembly halls) and restroom facilities, which can be repurposed for emergency shelter needs. The World Bank [
63] underscores the importance of utilizing multipurpose public facilities during emergencies to reduce costs and response times. Educational facilities frequently serve as community hubs, making them ideal locations for providing psychological first aid and support to affected populations. Research, such as [
64], advocates for the use of familiar spaces to help alleviate anxiety and stress among displaced or traumatized individuals.
Depending on the magnitude and scale of the earthquake, educational buildings may not always be suitable as temporary shelters, as preserving the continuity of education is a critical societal function. For instance, during significant seismic events like the Kahramanmaraş earthquake, 1,915,687 individuals were relocated to temporary shelters such as tents for the recovery phase [
65]. In scenarios with such extensive displacement, educational facilities are often relied upon due to their capacity and accessibility. However, it is essential to prioritize restoring these buildings to their primary educational function to minimize disruptions to the education system and support long-term community recovery.
Ensuring the functionality and safety of designated areas from Steps 4 to 6 after an earthquake requires proactive measures during the planning, construction, and post-event phases. A key preliminary stage has been implemented, namely preventive structural assessments to evaluate the seismic resistance of these facilities. To ensure preparedness, regular maintenance of designated facilities is essential to ensure compliance with updated safety standards. Establishing rapid inspection protocols allows for quick post-earthquake assessments, confirming the suitability of these areas for emergency use. In addition, equipping open spaces with temporary earthquake-resistant infrastructure (for example, modular shelters or portable facilities) can provide immediate functionality even in the event of minor damage. Regular disaster preparedness exercises further enhance readiness, ensuring that these spaces and facilities can effectively fulfill their critical roles during emergencies. By integrating these measures into the planning and management process, designated areas can be protected from damage and remain viable for emergency use following an earthquake.
Step 7. A SWOT analysis was conducted to assess the strengths, weaknesses, opportunities, and threats associated with the proposed key aspects of the seismic-mitigation strategy, ensuring a more complete evaluation of its effectiveness. This method provides a balanced framework for examining internal and external factors, systematically categorizing them to identify the strategy’s potential and areas for improvement. The process began with a clearly defined objective—to assess the effectiveness and viability of the proposed strategy components. Data collection involved input from stakeholders, including government officials, urban planners, public health experts, teachers, and civil society organizations, who participated in the workshop described in Step 2. Research techniques included short interviews to gather insights into the tool’s applicability, functionality, and limitations in real-time disaster management scenarios. The evaluation criteria focused on three primary aspects: the tool’s effectiveness in facilitating real-time earthquake response, its user-friendliness, and its potential for integration with existing disaster management systems. To enhance the technical depth of the SWOT analysis, follow-up interviews were conducted with two structural engineers and two architects. These discussions addressed knowledge gaps identified during the workshop, particularly regarding structural vulnerabilities, retrofitting techniques, and seismic design principles. The gathered information was then organized into a four-quadrant framework. Internal factors, including strengths and weaknesses, highlighted the inherent characteristics of the strategy, while external factors, such as opportunities and threats, examined external influences and challenges.
This methodology provides a comprehensive framework for analyzing seismic risks and emergency preparedness in Bucharest, ensuring a thorough and integrated approach to resilience planning. Its replicable nature makes it adaptable for application in other urban areas experiencing similar seismic challenges.
4. Results
The results from Step 1, which focused on identifying relevant seismic resilience indicators from the literature, reveal a multidimensional perspective on the city’s capacity to prepare for, respond to, and recover from seismic events.
In this study, a subset of indicators was utilized for the assessment, selected based on the methodology outlined in Step 2. The list of indicators in
Table 2 remains adaptable and can be expanded in future studies or applied to other cases, reflecting evolving needs or the integration of novel information as research in seismic resilience progresses.
Regarding indicator 2, the population under 50 years old, age plays a crucial role in recovery from shocks, injuries, and trauma, as noted by [
73]. “
While this population is generally more mobile and resilient, it also means that a significant portion of the population is active in the labor force, increasing the potential for workplace casualties and economic disruption during a seismic event”, remarked the public health expert. “
It’s well known that recovery tends to become more difficult after the age of 65, but people under 50 are usually still active and in better health, which helps them recover more easily”.
Regarding indicator 3, identified in Step 1, the average population density in European cities is approximately 3000 residents per square kilometer, according to [
74]. In contrast, Bucharest’s population density is 8090 residents per square kilometer, more than twice the EU average, which could exacerbate the severity of any hazardous situation. High population density is a key factor in this study, with the final assessment incorporating population density data for each district to evaluate seismic risk. Areas in Bucharest with higher population density are anticipated to experience a greater number of casualties, as density is positively correlated with the likelihood of victims during an earthquake [
75,
76,
77,
78]. This indicator was further validated during the discussions in Step 2, confirming its relevance and importance: “
Bucharest faces increased risk during seismic events”, said one local urban planning expert. “
The concentration of residents in high-risk areas could lead to catastrophic challenges, including mass casualties, blocked evacuation routes and stressed emergency response systems”, she added. “
Population density really matters when it comes to disasters and especially the earthquakes. In crowded areas more people are at risk and it’s harder to evacuate them quickly”, indicated the local authority representative. The junior urban planner mentioned that “
…as urban planners, we focus on population density rather than just the total number of people because population density is a more practical measure when planning for safety, evacuation routes, and resource allocation”.
In relation to indicator 4, the engineering literature [
2] highlights that Romania conducted a wave of technical assessments of buildings between 1990 and 1995. These assessments revealed that many structures constructed prior to 1977 were deemed structurally deficient and classified as high risk. With 28 years having passed since the conclusions of these assessments in 1995, the condition of these buildings may have further deteriorated, increasing their potential danger in the event of seismic activity. Buildings constructed before 1995 are of particular concern [
20,
33], as they may not adhere to seismic standards or may have aged to the point of significant vulnerability. During Step 2, the civil engineer specialized in urban planning mentioned that “…
many of the older structures were built before modern seismic codes were implemented, leaving them highly vulnerable to collapse during an earthquake. This is especially critical in older neighborhoods, where densely packed buildings amplify the risk to residents and complicate emergency response efforts”.
Schools have multiple roles and capacities both before and after disasters, functioning as centers for emergency preparedness, education, and response [
78]. In Romania, seismic design standards [
79] assign educational buildings a higher importance class, reflecting their critical role in disaster scenarios. This classification imposes stricter design requirements to ensure enhanced structural performance. “
Kindergartens, schools, and high schools in Bucharest hold immense potential as safe relocation spaces during seismic emergencies. Many of these institutions have undergone retrofitting to improve their seismic resilience, and their large open spaces, such as gymnasiums and assembly halls, make them ideal for accommodating displaced populations” highlighted one of the teachers. Therefore, kindergartens, schools, and high-schools (indicators 5 and 6) are considered prime candidates for relocation spaces for the population.
Hospitals (indicator 7) represent the most critical facilities for medical treatment, providing essential medical services to individuals injured during earthquakes [
71]. Beyond their medical role, hospitals act as coordination centers for disaster response, facilitating communication among emergency services, managing the allocation of resources, and overseeing patient distribution to maintain system-wide functionality [
80]. “
It’s essential to enhance their capacity, equip hospitals with emergency response systems, and ensure redundancy in utilities like power and water, so they can serve as stable anchors of care and coordination during a disaster” indicated the public health specialist. The representative of local administration stated that “
the priority is to ensure that existing hospitals have contingency plans to expand capacity during emergencies and that temporary medical facilities can be quickly set up to supplement the available beds, ensuring no one is left without care in the aftermath of a disaster.” “
As a community, we rely on hospitals to be there for us when disaster strikes, especially during something as devastating as an earthquake. But let’s be honest—some of our hospitals aren’t in the shape they need to be. There are buildings that are old, not up to modern safety standards, and at risk themselves during a quake. How can we expect them to take care of us if they can’t even withstand the disaster? We need to prioritize making our hospitals safe and functional, no matter what” replied the civic society representative.
One public health specialist intervened that “during a disaster, relying on day hospitalization units would create serious problems. They lack the capacity for critical care, don’t have the necessary equipment like ventilators or surgical suites for major operations, and can’t manage overnight stays. For future these units could potentially be included, but only if their role is clearly defined—for example, as secondary care centers for minor injuries or as backup facilities once the main hospitals reach capacity”.
“
I can’t stress enough, however, how important it is to have the number of hospital beds. When a disaster, like an earthquake, hits, we need to know exactly where patients can go for care and how many people each hospital can handle. Without that information, we risk sending too many patients to one place while others might still have space. It also helps us figure out where extra resources, like temporary medical tents, might be needed. Having this data ready can make all the difference in saving lives” considered the second public health specialist. We have considered the number of beds (indicator 9) not only in state-administered hospitals but also in private hospitals and small clinics. The goal was to account for every medical facility, from basic first aid centers to those equipped for advanced surgery [
81,
82,
83,
84]. According to [
85], EU countries had in 2020, on average, around five beds per 1000 population. Romania, alongside Germany, Bulgaria, and Austria, had the highest number, with more than seven beds per 1000 population. For Bucharest, there are around 12 beds per 1000 population.
One representative of civil society emphasized that “
Bucharest is fortunate to have a strong network of medical professionals who are vital in managing seismic crisis. However, ensuring they can operate effectively during a disaster requires our administration to prioritize investments in resilient healthcare infrastructure”. According to [
85], in 2018, the average number of practicing physicians (indicators 10 and 11) per 1000 population was 3.8, while Romania had 3.1 at the national level. In Bucharest, based on available data from the National Institute of Statistics, there are 8.4 medical doctors per 1000 population.
During the discussions, the representative of public administration stepped out to notice that “Parking lots, parks, and stadiums are great spots for setting up emergency tents during an earthquake. They’re big, open spaces, which makes them easy to get to and safe for large groups of people. Plus, because there are no tall buildings around, there’s no risk of things like falling debris or collapsing structures, which is really important after the earthquake”.
Based on insights from the literature review (Step 1) and the expertise shared during the workshop with specialists (Step 2), the key information selected for mapping includes the number of public and private medical facilities, hospital bed capacities, and the locations of parks, stadiums and educational buildings. This approach directly addresses Research Question 1 (RQ1).
Moving to Step 3, as illustrated in
Figure 4, the most vulnerable districts in Bucharest are 2, 5, and 6, with PGAs ranging from 260 to 300 cm/s
2. To further analyze Bucharest’s seismic resilience, a comparative analysis was conducted between the district with the highest PGA and the one with the lowest, as determined by the city’s seismic micro-zonation map. According to this map, District 2 exhibits the highest peak ground acceleration at 300 cm/s
2, while District 4 has the lowest PGA at 220 cm/s
2. Although the digital map encompasses the entire city, this study specifically focuses on these two districts, which are the most and least affected by ground movement.
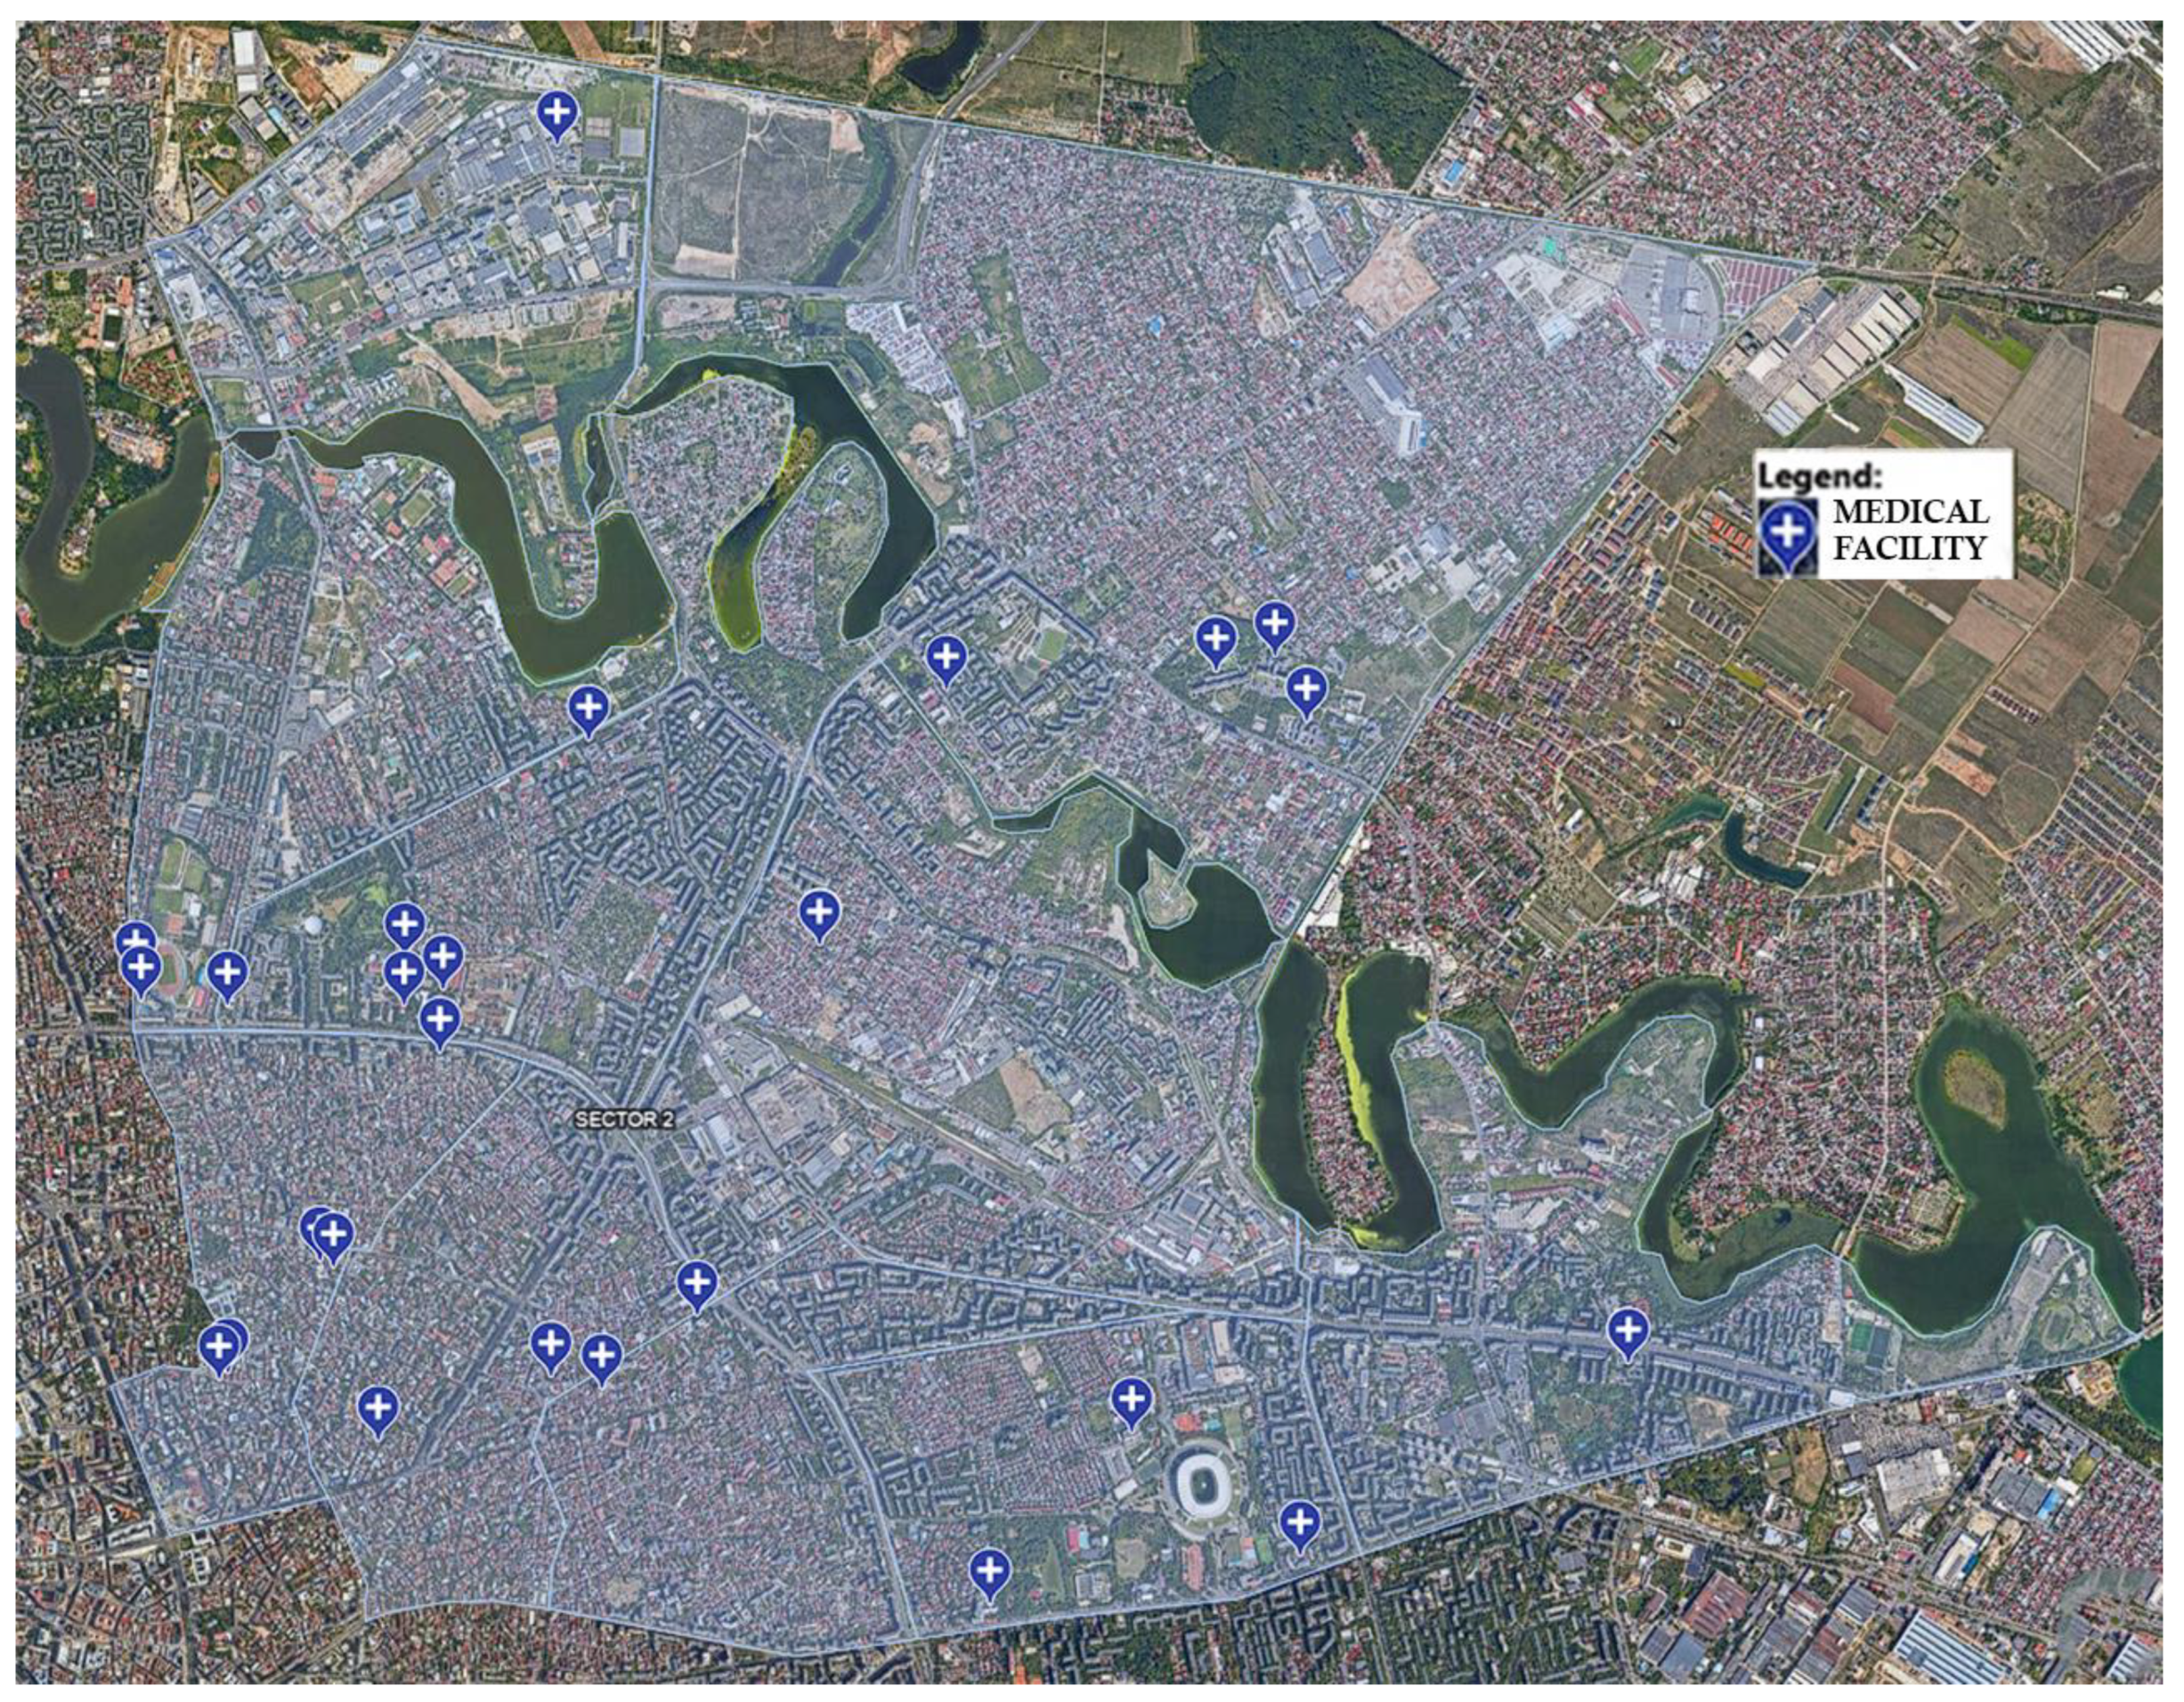
In this context, District 2, with a population of 364,603 as recorded in the 2023 census [
51] poses significant challenges for emergency planning. The district is served by 26 medical facilities, relevant for seismic emergencies, including both state-administered units and private facilities. These medical centers, ranging from medium to large capacities, are equipped to provide at least basic first aid (see
Figure 5).
Although Romania ranks among the top countries in hospital beds per 1000 inhabitants [
85,
86], insights from the specialists’ workshop highlight that hospitals alone are insufficient to meet the demands of a large-scale emergency [
19]. This underscores the critical need to utilize wide open areas, such as parking lots, parks, and stadiums for setting up emergency tents to provide medical care and temporary resettlement. A significant discrepancy exists between the hospital capacities of the Bucharest districts. District 4, with a population of 337,071 [
51], has 27,532 fewer residents than District 2; yet, it is served by only 9 major medical facilities (
Figure 5)—17 fewer than the 26 facilities available in District 2 (
Figure 4).
Figure 4 and
Figure 5, representing the result of Step 4 in the analysis, highlight the uneven distribution of critical medical infrastructure across districts, emphasizing the necessity for targeted planning to address resource disparities.
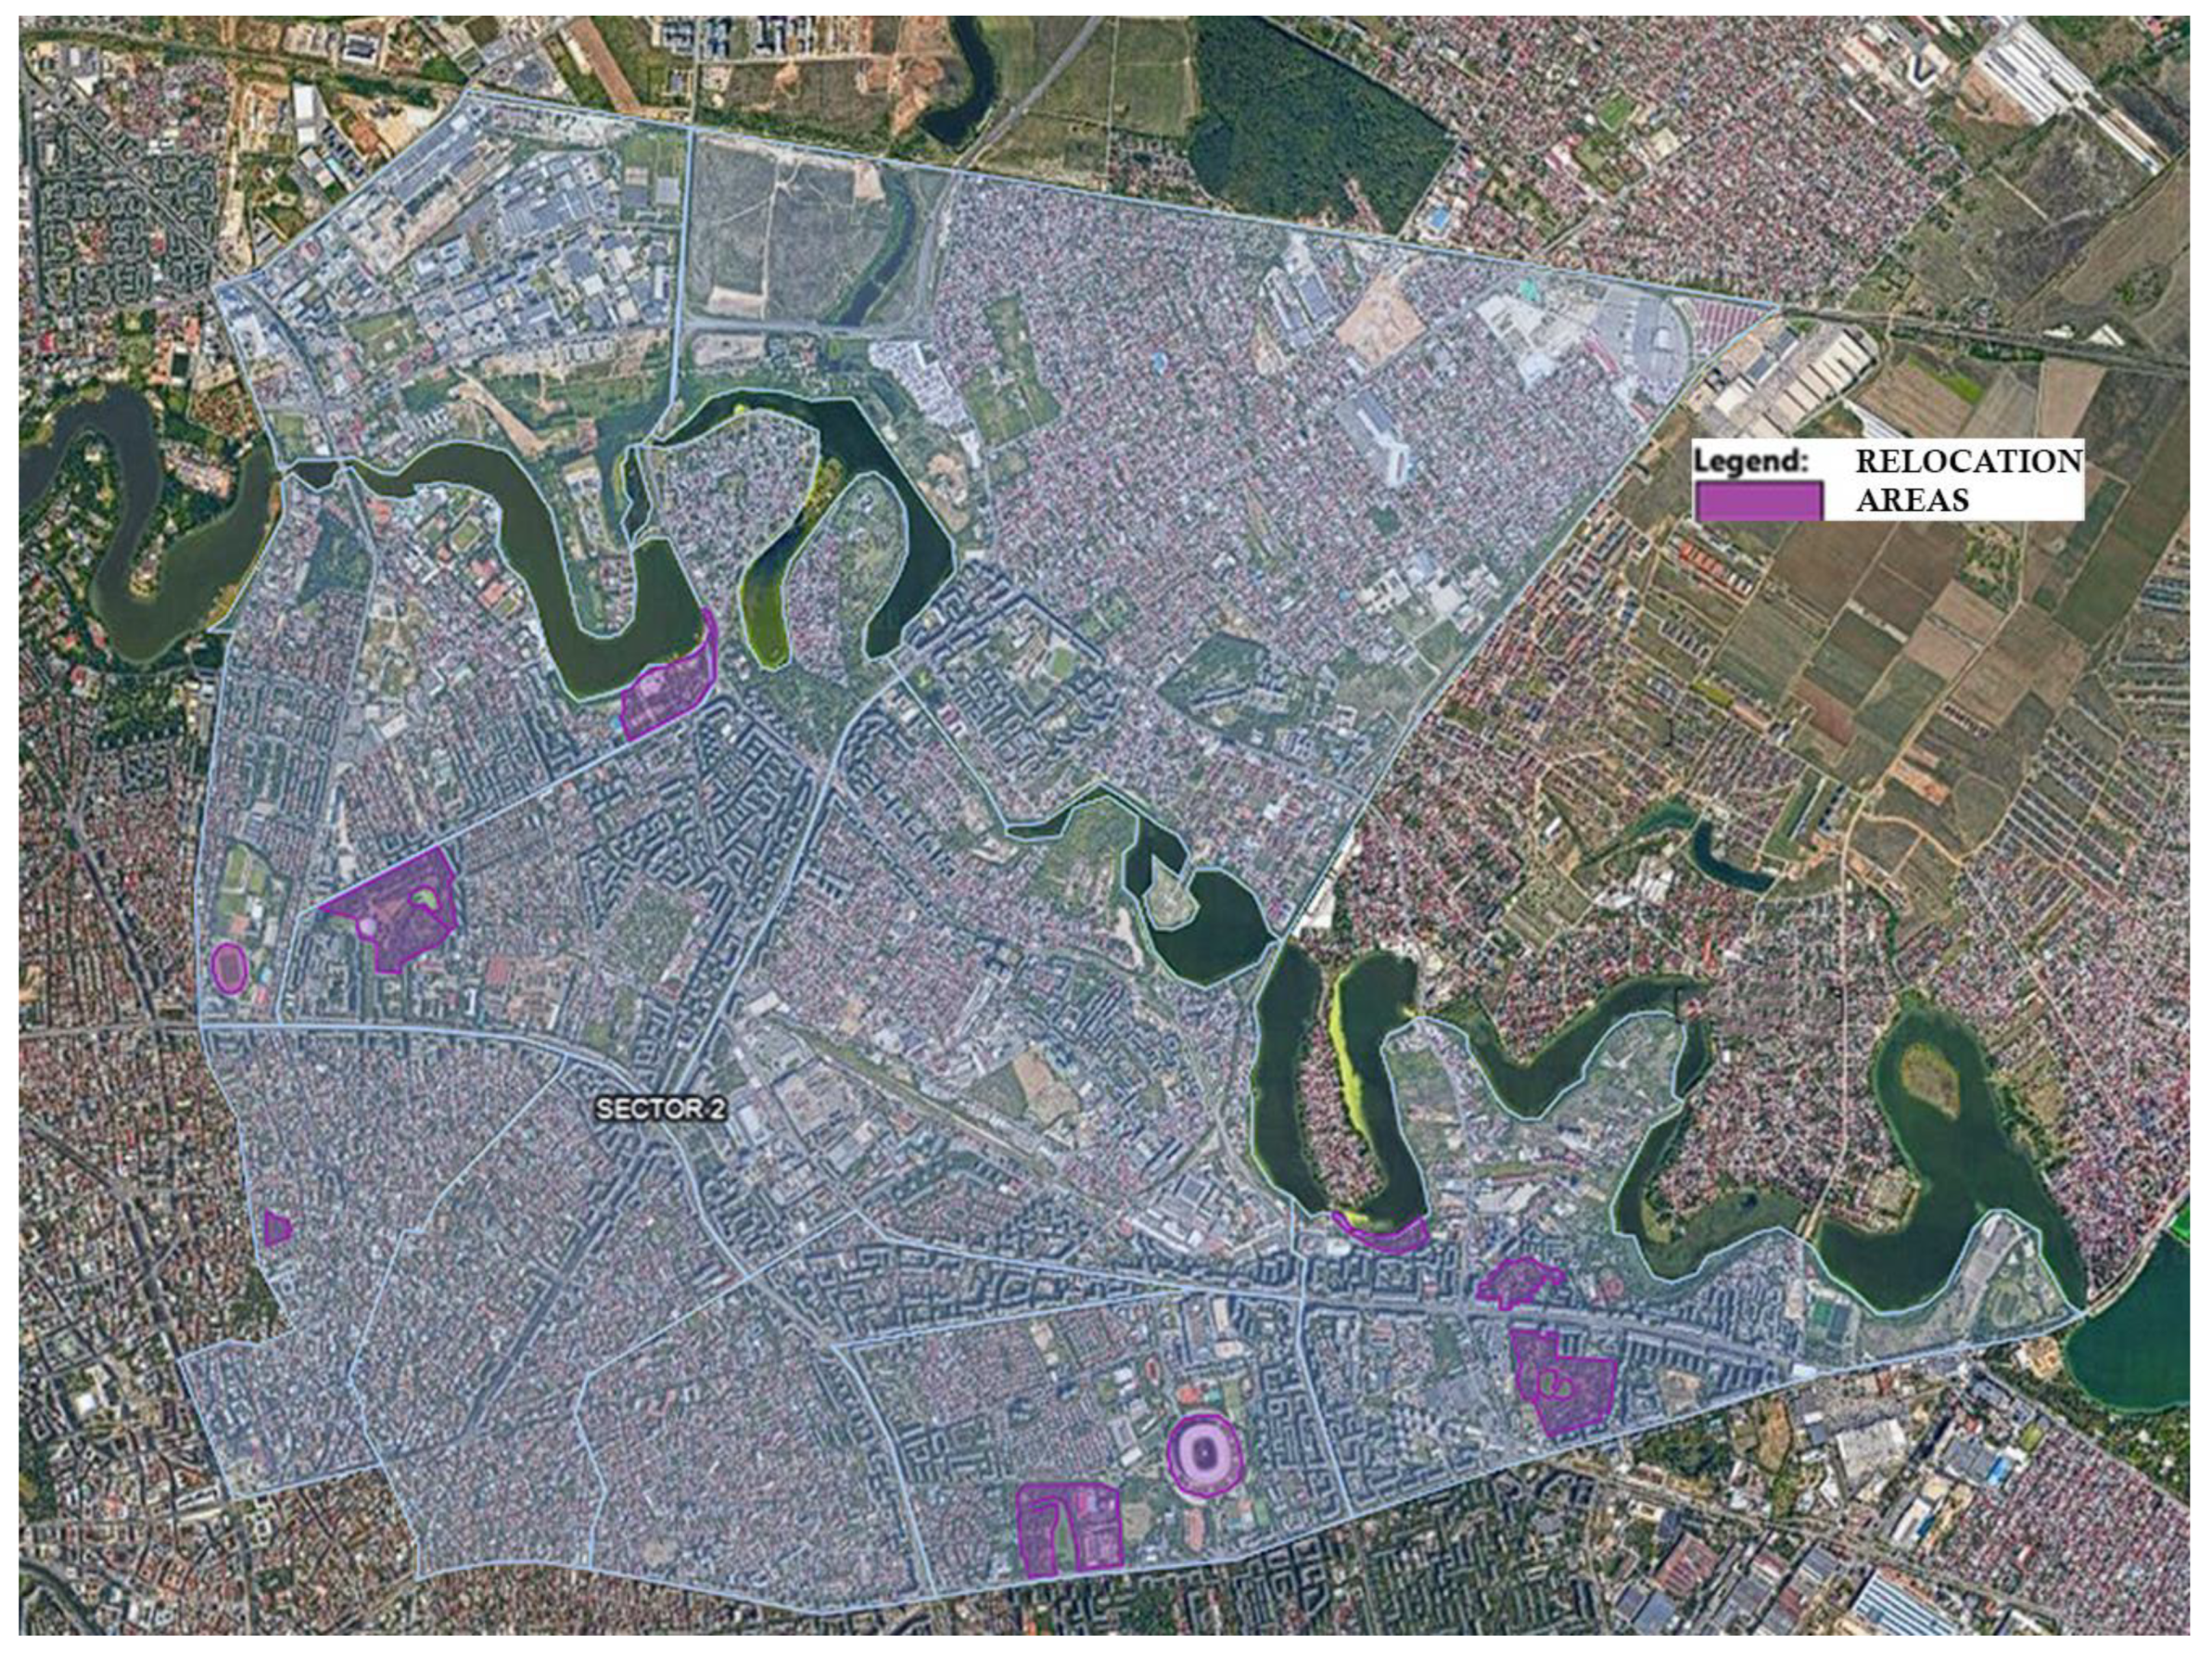
The areas designated for medical tents or temporary relocation must be limited in number to ensure effective management, while providing adequate coverage for key zones in Bucharest. These areas should be strategically located near hospitals to facilitate access to medical equipment and staff. Proximity to densely populated areas is also essential to maximize service coverage. Additionally, each selected site must be suitable for the landing and take-off of at least one medical helicopter.
In District 2, eight parks and two stadiums were selected, covering a total area of 515,705 m
2 (
Figure 6). The selection criteria included accessibility for the population, proximity to medical facilities, and capacity to accommodate medical helicopters.
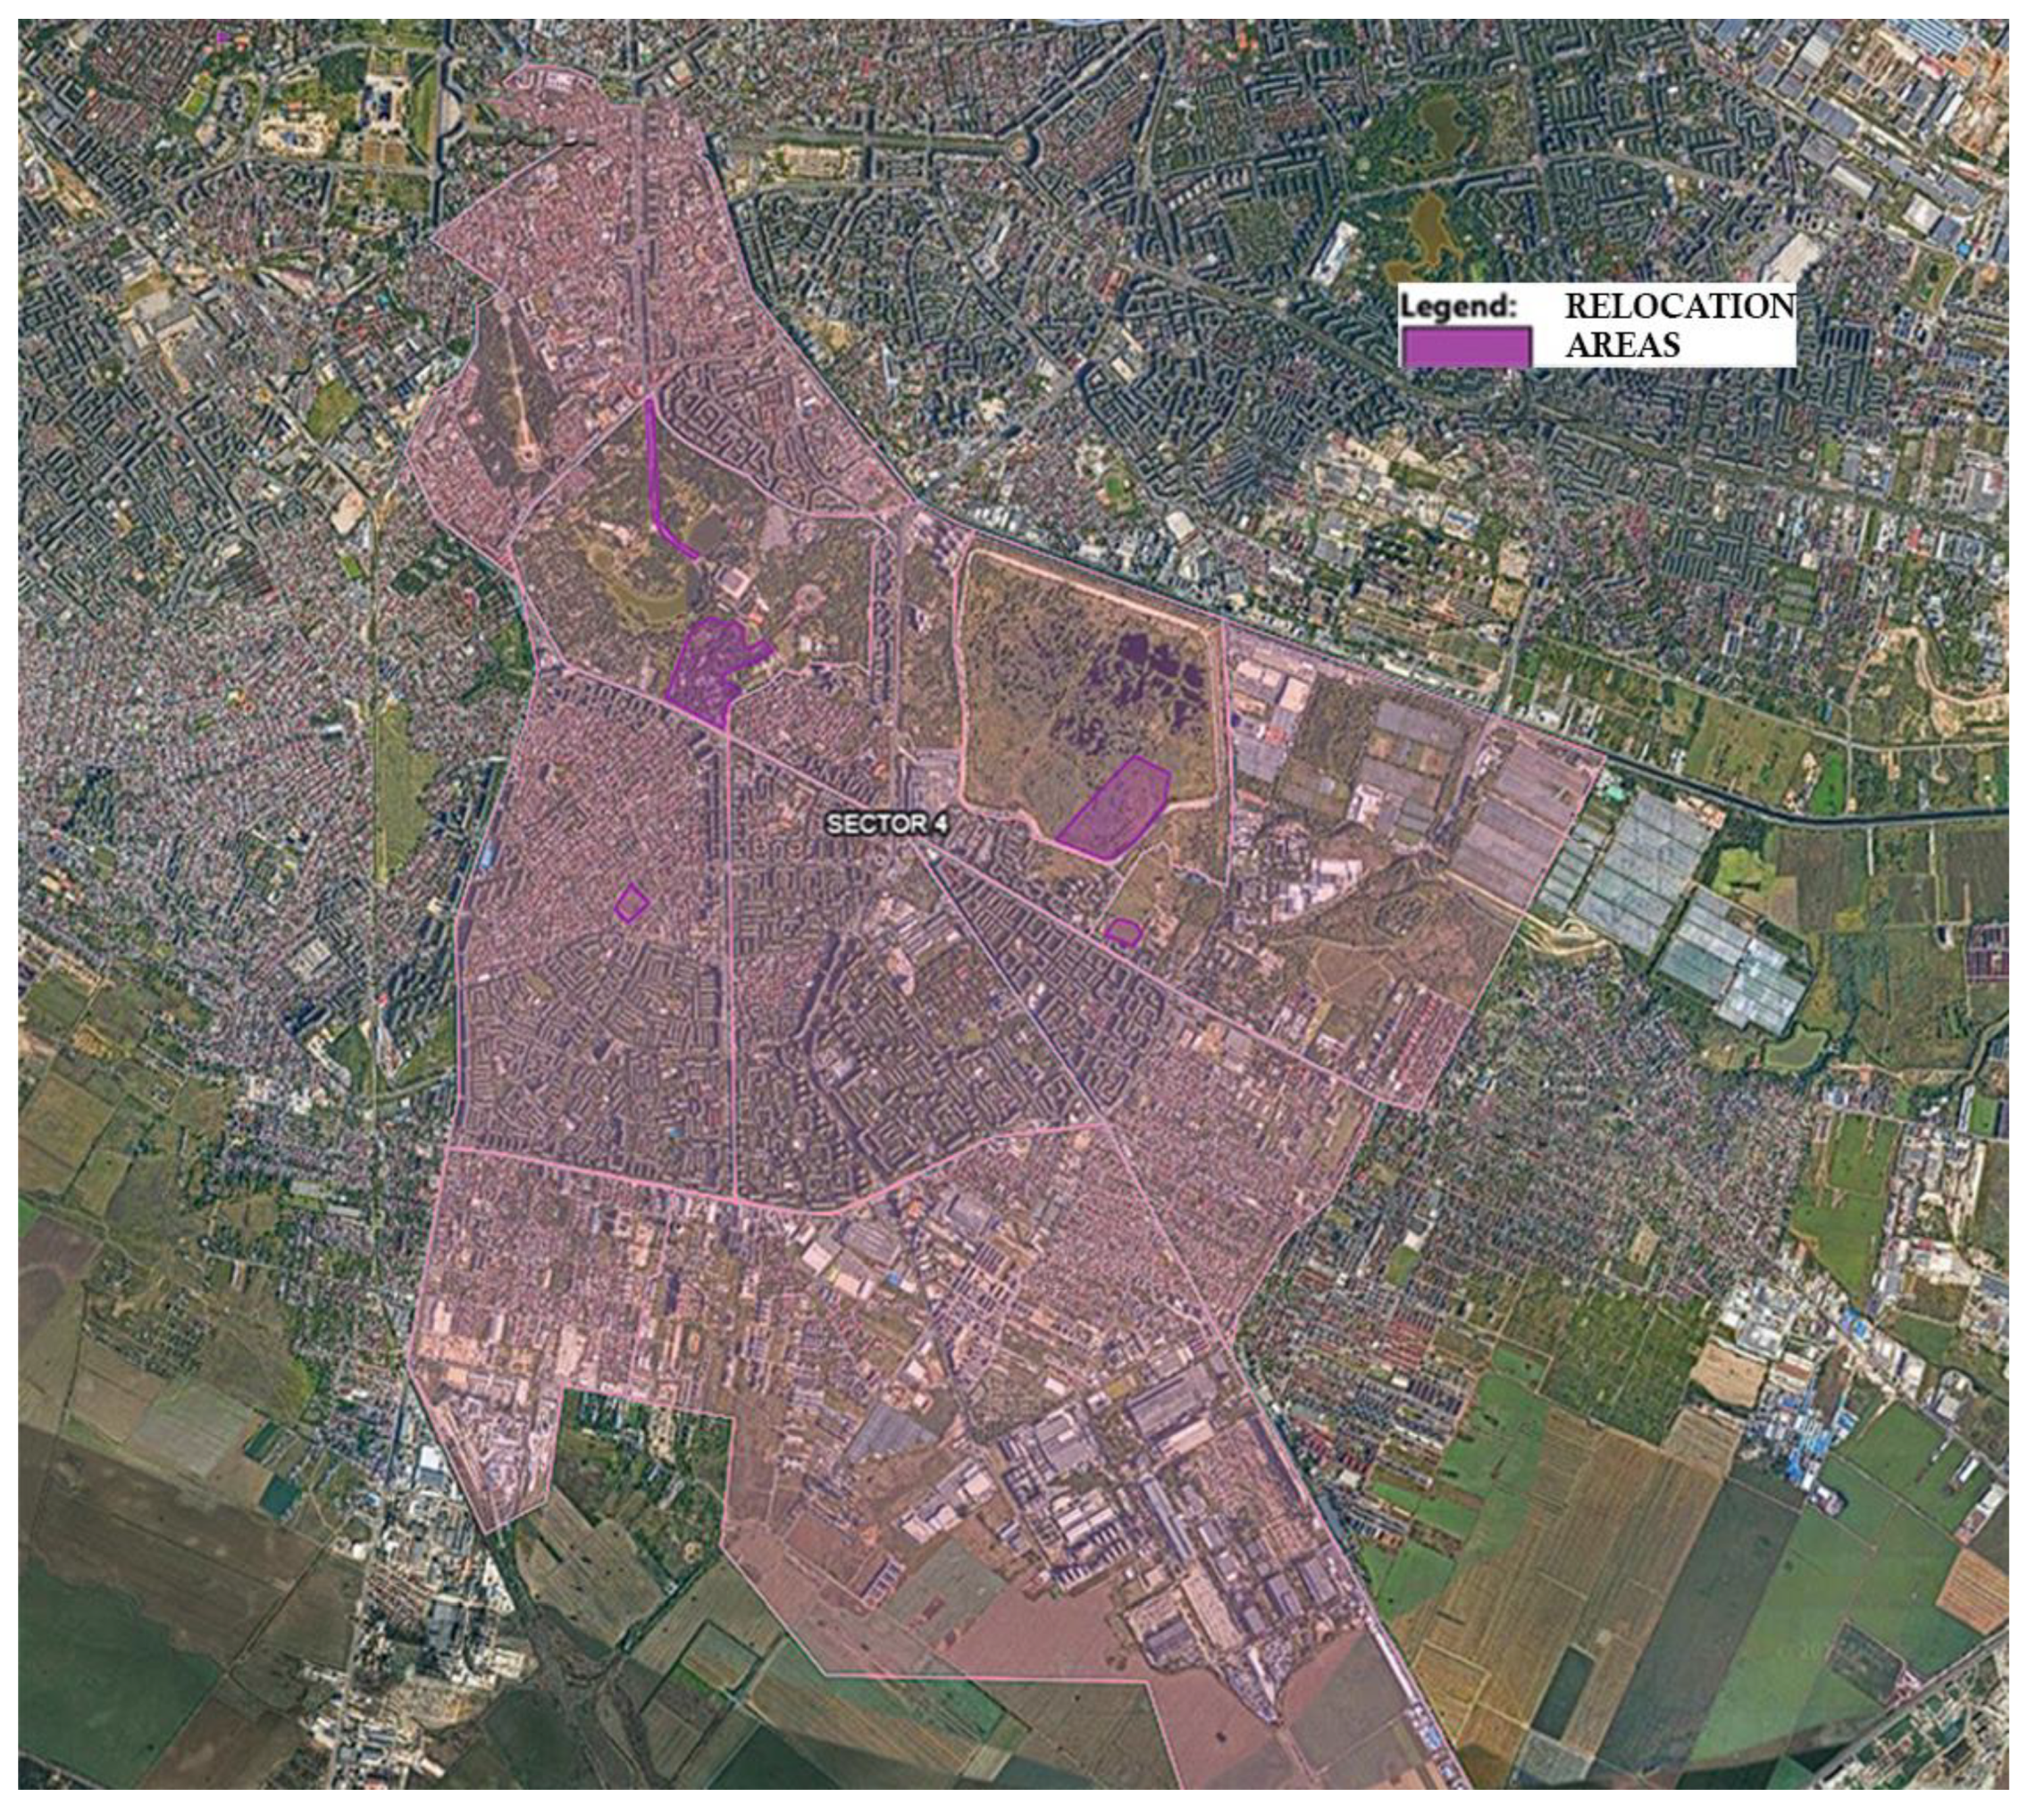
For District 4, two of the largest natural spaces—Vacaresti Natural Park and Tineretului Park—were considered as potential relocation areas. However, the dense vegetation and marshy terrain within these parks limit their full utilization for emergency purposes. Consequently, only the most accessible and strategically suitable sections of these parks were included in this study. Two selected sections were evaluated based on criteria such as proximity to major roads, flat terrain, and availability of open spaces for setting up emergency tents or shelters. Overall, 383,166 m
2 of usable area was identified in District 4, distributed across three parks and two stadiums (
Figure 7). These findings represent the results of Step 5 in the analysis.
Considering the potential for earthquakes to occur during extreme weather conditions—whether hot or cold—and the likelihood of prolonged recovery periods, we have conducted an additional evaluation of the suitability of educational buildings for use as emergency shelters or treatment facilities. Educational institutions are well suited for this purpose due to their capacity to accommodate a significant number of people during emergencies. Their infrastructure typically includes large indoor spaces, such as gymnasiums or assembly halls, which can be repurposed for shelter or medical care. Additionally, these buildings are often equipped with essential amenities such as restrooms and kitchens, further supporting their functionality in post-disaster scenarios. The widespread distribution of educational institutions across urban areas ensures accessibility for affected populations, making them a critical component of emergency preparedness and response strategies [
58,
87]. Romania’s seismic design code, P100/2013, ensures that buildings, such as educational facilities and stadiums, are designed to higher safety standards by assigning them a higher class of importance (I or II), based on factors such as capacity, size, and functionality. This classification imposes a 20–25% increase in design factors, increasing ductility and overall structural safety, thus improving the likelihood that they will remain functional and fit for use after an earthquake. One stadium is a recently constructed facility, designed and built by highly qualified teams in compliance with the latest standards, ensuring optimal seismic performance. The other two stadiums, being single-story ground-floor structures, present minimal seismic risk due to their inherent structural simplicity and lower susceptibility to collapse. These considerations underscore their potential usability during and after seismic events.
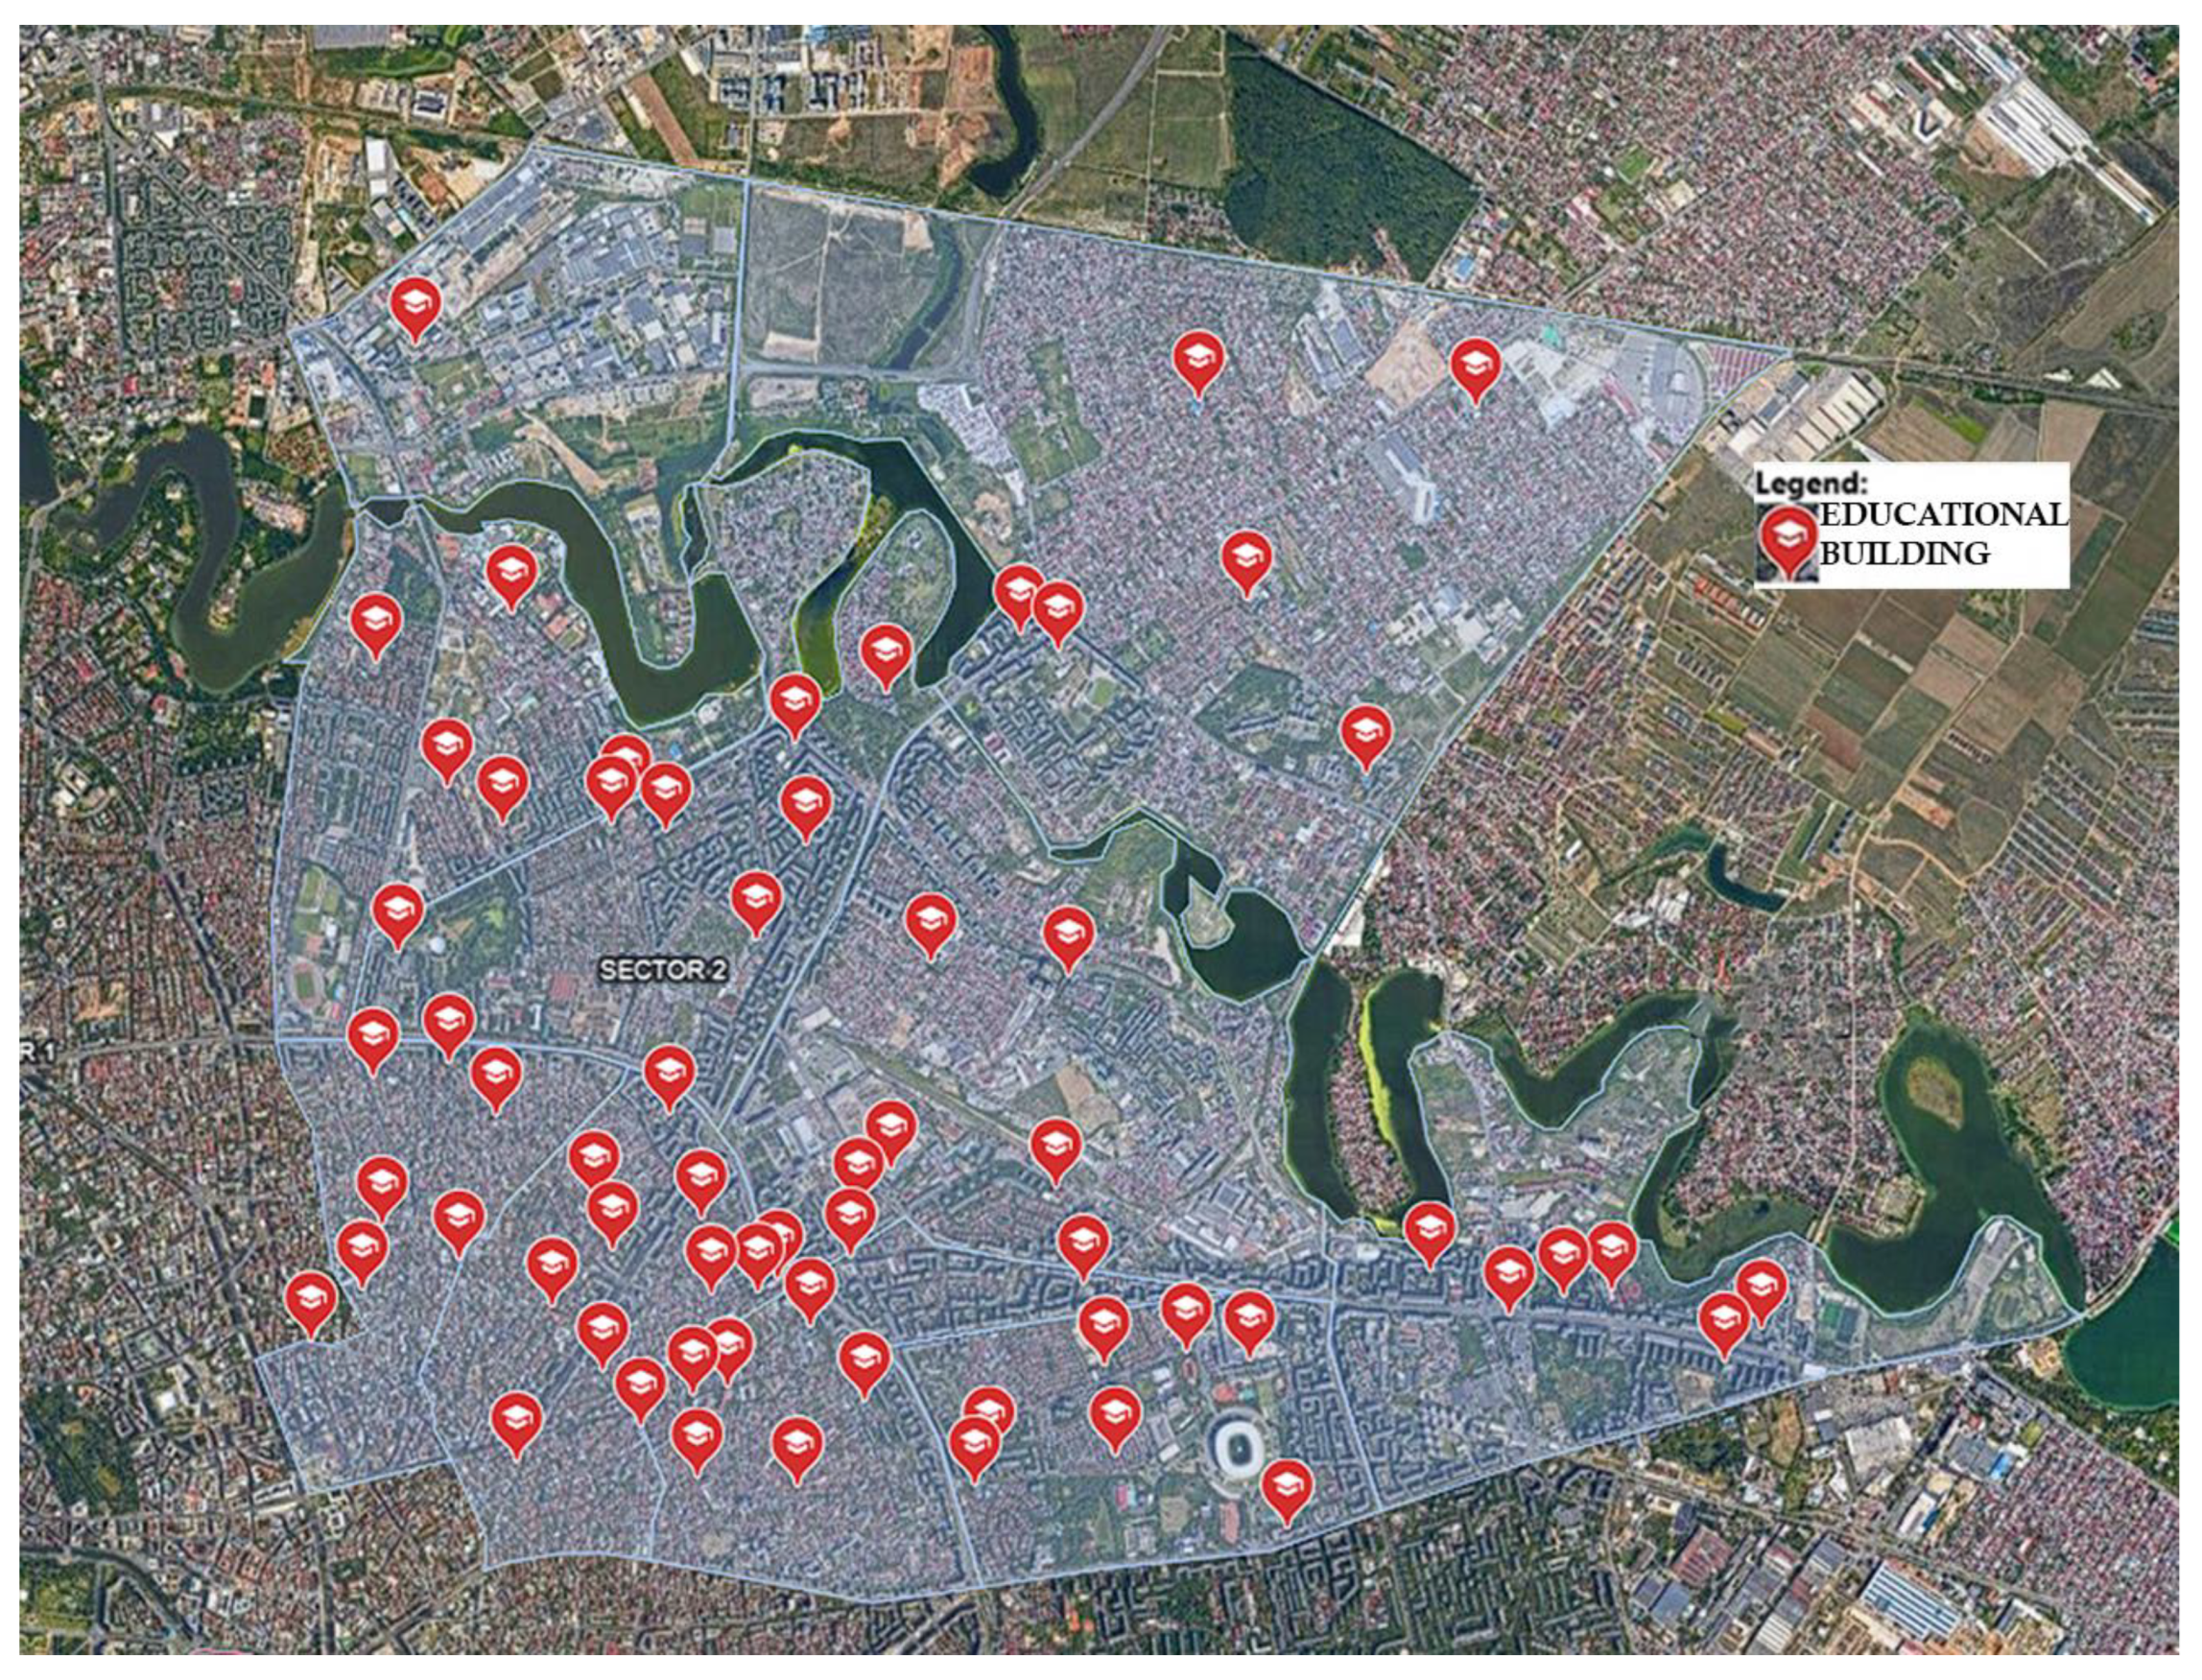
Kindergartens, schools, and high-schools were included in this study due to their large number of classrooms, which can be repurposed as temporary shelters during seismic emergencies. To ensure an accurate count, multiple data sources were cross-referenced [
51,
52,
53], accounting for the inclusion of private institutions as well as the potential closure of some facilities. Following this process, a total of 62 educational buildings were identified and included in the digital map, as illustrated in
Figure 8.
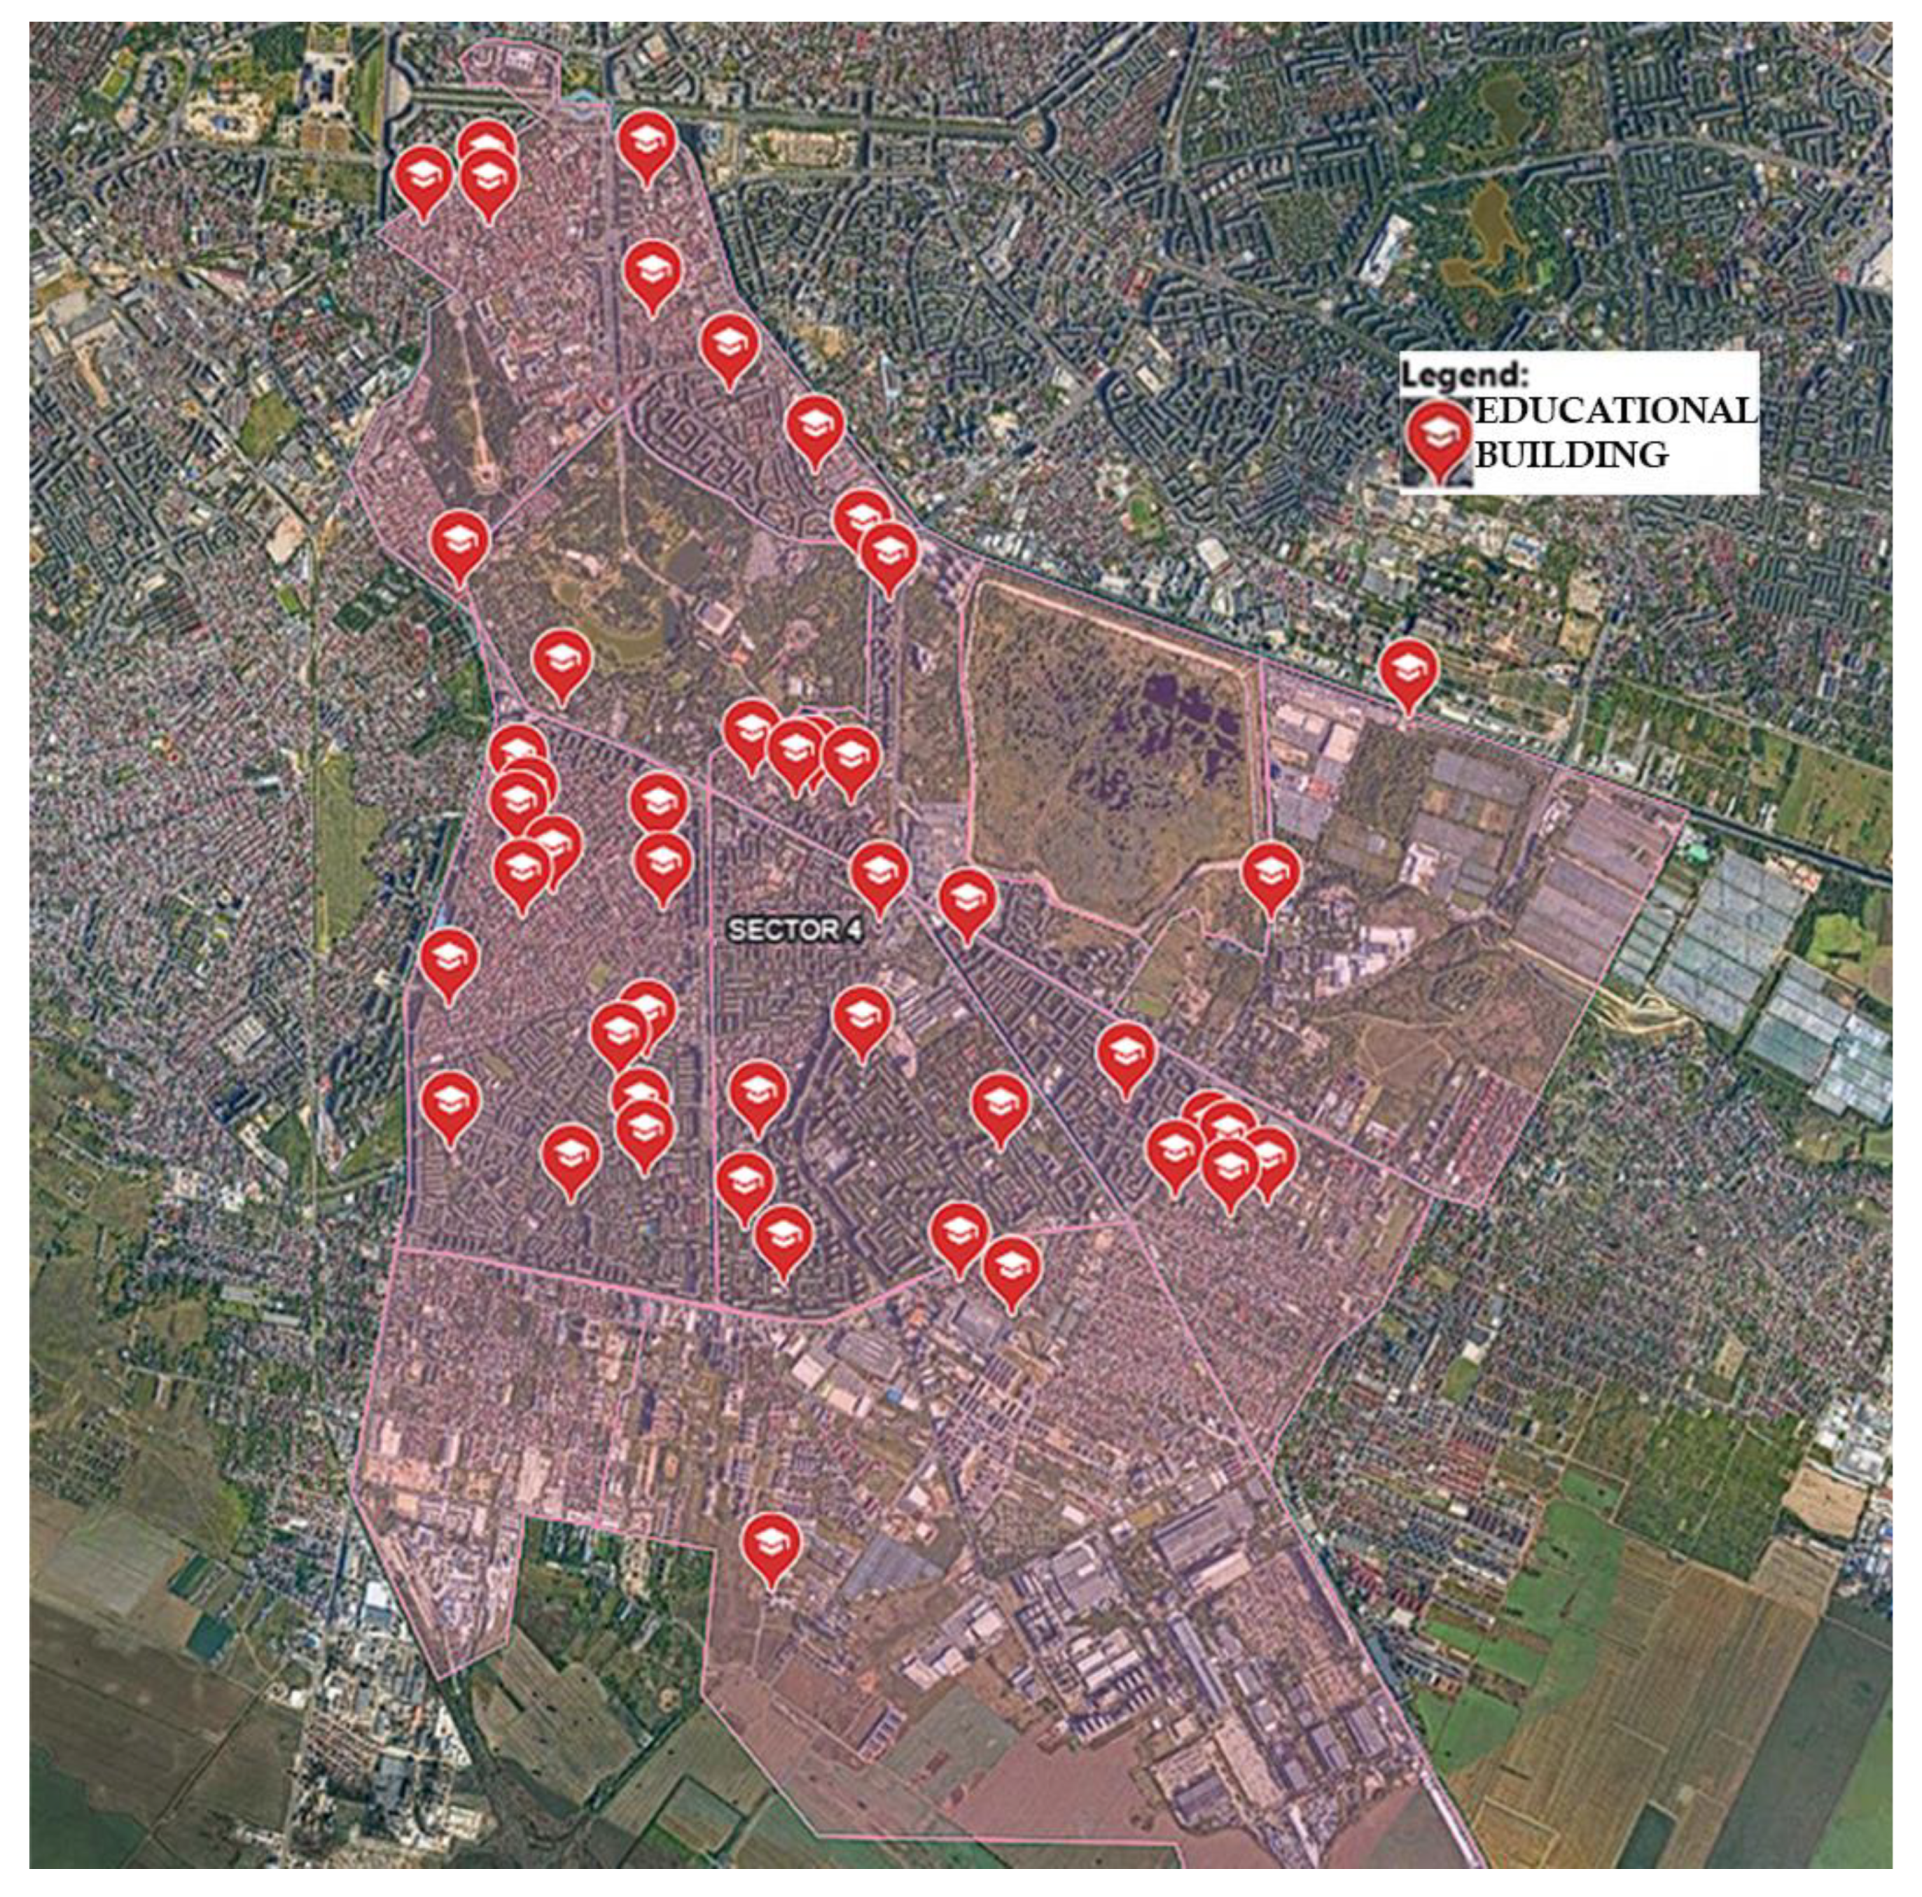
A total of 44 educational buildings were identified in 4th District that can be temporarily repurposed for resettlement purposes, similar to the findings for 2nd District (
Figure 9).
As mentioned above, the most vulnerable district in Bucharest based on PGA is the 2nd District, with 300 cm/s2. Along with the 1st District, it accounts for 26 medical facilities out of a total of 92, representing 28.26% of all medical facilities. 2nd District also has a relatively high medical capacity, with 7224 hospital beds serving its 364,603 inhabitants. In contrast, the 4th District, despite having the lowest PGA and being the safest sector in terms of seismic ground movement, demonstrates lower resilience due to its limited medical facilities. With only nine medical facilities, accounting for just 9.7% of the total, the 4th District offers 2846 hospital beds for its 337,071 residents.
The number of hospital beds currently available serves only a small percentage of the population, highlighting the importance of designating relocation areas. In the absence of specific information regarding the emergency tents utilized by the General Inspectorate for Emergency Situations, our estimation assumes a tent with a total area of 60 m2, capable of accommodating 10 beds. Under these conditions, the 2nd District, with a total available area of 515,705 m2, could theoretically host a maximum of 8545 tents serving 85,450 individuals. Similarly, the 4th District, with an available area of 383,166 m2, could accommodate up to 6386 tents serving a population of 63,860 individuals. However, a limitation of this paper is that the high number of tents and the associated population present substantial logistical challenges, potentially rendering such large-scale implementation impractical. Consequently, these estimates should be regarded as theoretical, representing maximal scenarios intended to provide a baseline for planning considerations rather than actionable figures.
Regarding the utilization of educational facilities for relocation purposes, precise data on the number of classrooms in kindergartens, schools, and high-schools were unavailable. Consequently, an assumption was made that each institution contains an average of 10 classrooms. This estimate accounts for variations across educational levels, acknowledging that kindergartens generally have fewer classrooms, while high-schools have more. Each classroom was considered to accommodate 15 individuals, based on the standard capacity of 30 students per classroom. For the 2nd District, with a total of 62 educational establishments, this estimate suggests that approximately 150 people can be housed per facility, resulting in a total capacity of approximately 9300 individuals. Similarly, in the 4th District, which includes 44 educational establishments, the same average capacity results in an estimated accommodation of 6600 people.
In terms of overall treatment and relocation capacity in the 2nd District, provisions include 7224 individuals accommodated in hospital beds, 85,450 in tents, and 9300 in educational establishments, yielding a total capacity of 101,974 individuals. This represents 27.96% of the district’s total population. In the 4th District, the corresponding capacities are 2846 individuals in hospital beds, 63,860 in tents, and 6600 in educational establishments, resulting in a total capacity of 73,306 individuals, which represents 21.74% of the district’s population.
Based on the analysis, District 2 is identified as the most vulnerable district to seismic risks in Bucharest, addressing RQ2. This conclusion is substantiated by the district’s high PGA value of 300 cm/s2, as indicated in the city’s seismic micro-zonation map, and its significant population density of 364,603 residents. While District 2 possesses relatively greater resources, including medical facilities and relocation areas, the high demand for these assets due to the dense population significantly limits their operational effectiveness during a seismic event. The combination of elevated seismic exposure and strained resources highlights District 2’s heightened vulnerability when compared to districts like District 4, which exhibits a lower PGA and a smaller population.
The developed digital map is a valuable asset for the General Inspectorate for Emergency Situations, serving as a robust tool for the management and mitigation of seismic disasters. Created using Google Maps’ My Maps service, the map ensures seamless accessibility and usability. It integrates essential data, including information on relocation areas, medical facilities, and vulnerable neighborhoods, providing a comprehensive platform for improved decision-making during emergency response efforts. Furthermore, the map is publicly accessible via the following link, facilitating real-time information dissemination and fostering public involvement in disaster preparedness and response initiatives: Bucharest medical facilities and shelter zones.
As Bucharest is a large and complex urban area, the digital map is continually evolving. Our next step involves incorporating all hotels and accommodations that can serve as temporary shelters for the population whose dwellings have been destroyed by a disaster. Additionally, given the higher importance class assigned to educational buildings in seismic design, these structures are less likely to collapse during an earthquake, making them particularly suitable for providing shelter. To enhance the map’s utility, we will integrate all educational buildings in Bucharest into the digital map, finalizing the Results of Step 6.
Educational buildings, such as kindergartens, schools, and high-schools, are widespread and evenly distributed across urban areas, making them highly accessible during emergencies. Their spacious interiors, including classrooms, gymnasiums, and assembly halls, can accommodate large numbers of evacuees. Additionally, many educational buildings are constructed to higher safety standards, ensuring their structural integrity during seismic events. Temporary shelters such as parks, stadiums, and other open spaces play a critical role in emergency response by providing safe locations for setting up emergency tents and temporary shelters. These open areas minimize exposure to the risk of building collapses during aftershocks and facilitate large-scale, organized housing of displaced populations, ensuring that essential needs such as shelter, water, and sanitation are met effectively. Hospitals are indispensable for providing essential medical care for the injured, ranging from basic first aid to advanced trauma care. The availability of medical resources, including hospital beds and emergency equipment, is vital for treating casualties and stabilizing patients during the critical hours following an earthquake. Mapping these facilities and understanding their capacities enables efficient triage and patient distribution, ensuring an optimized emergency response. Together, these facilities form the backbone of a city’s seismic emergency response system. They ensure that at-risk populations are relocated to safe areas while receiving the necessary medical and logistical support during earthquakes, thereby directly addressing RQ3.
In the final step, a SWOT analysis was conducted individually with the participating workshop specialists. This analysis aimed to critically evaluate the strengths, weaknesses, opportunities, and threats associated with the proposed mapping tool as a key component of the mitigation strategy. This yielded valuable insights into the tool’s practical applications, while also identifying specific areas that require improvement to enhance its effectiveness in future development efforts. “Having a tool that’s simple to use and widely available, like Google Maps, makes it easier for us to plan and act quickly when every second counts”, highlighted the representative of local authorities. One of the urban planners mentioned that “what’s great about this study is that it gives us a clear overview of the city’s capacity to relocate and manage people during emergencies. This kind of tool is practical and adaptable for other emergencies too, not just earthquakes”. Teachers appreciated that “the tool’s ability to map relocation sites, like schools, is reassuring. It makes it easier to plan where children and families can go to stay safe”. The junior structural engineer indicated that “one strength is that the framework can easily integrate with modern tools like seismic simulation software or digital twins. For example, we could simulate how specific buildings would react in an earthquake, then use the MyMaps platform to visualize those vulnerabilities”.
One of the junior urban planners suggested that “one of the biggest issues we face is the outdated data—we’re often working with numbers that don’t reflect the current reality. On top of that, there’s not enough cooperation between public authorities, researchers, and civil society, which means we’re not as effective as we could be”. Senior structural engineer added that “lack of detailed structural data is a big gap. If we don’t have information about the materials of each building, the year of construction or compliance with seismic codes, it is difficult to accurately assess risk”. “Without collaboration between schools, government, and researchers, it’s hard to ensure that all necessary data for school safety and emergency use is included”, mentioned by one of the teachers.
“The problem is that we’re not all on the same page—government, researchers, and us in civil society. But there’s hope. More NGOs are stepping up to study seismic risks, and if we work together, we can expand these maps and make them even more useful for identifying safe spaces and managing emergencies”, mentioned by one of the civil society representatives. “There’s a chance to enhance the map by including safe road access, which would greatly improve evacuation planning”, suggested by one junior urban planner. “If we include information about seismic risk in schools, it could become an educational tool as well, teaching students and parents about earthquake preparedness”, indicated by one teacher. “We could introduce drones for mapping or IoT sensors for real-time structural health monitoring. Imagine being able to check the safety of a building immediately after an earthquake—this kind of data could really strengthen the strategy aspects. Also adding early warning systems could give us those critical seconds or minutes of advance notice. This would allow us to take proactive steps like stopping transportation, evacuating buildings, or protecting key infrastructure. It’s also really important to make sure the real-time monitoring systems work hand-in-hand with these early warning mechanisms so that the data flows smoothly to decision-makers and first responders when it’s needed the most. Plus, the map itself could become a training tool for other engineers or even an awareness campaign for local communities” mentioned by one structural engineer. Mid-level architect highlighted, “I think professionals like civil engineers, architects, and urban planners should ignite a discourse about earthquake resilience, the risks that might follow an earthquake, and how we, as citizens, can prepare for a disaster like this. Public awareness, education, and a good understanding of natural disasters are key aspects of building a strong community that can respond to and recover more efficiently after an earthquake”.
The teachers suggested that “schools can really make a difference in emergencies. They’re safe spaces for children and can also be used as shelters for the community. Plus, involving NGOs in studies like this could help us improve school safety and preparedness for everyone”. “What worries me is the threat posed by the sheer number of aging, at-risk buildings. It’s a massive challenge to retrofit everything in time, especially with limited budgets. On top of that, slow policy adoption could delay the implementation of these measures. We need to push hard to make sure these changes happen”, mentioned by the senior civil engineer.
From the perspective of a senior architect, “…such studies bring the multi-role component for the buildings enhancing the efficient use of limited space in a city. It would be useful for a future study to add the traffic management in post hazard phase”
The public health expert mentioned that “the constant risk of cyberattacks on digital platforms like Google is a real concern. If the map becomes unavailable during a crisis, it could cause major disruptions”. “The high number of seismic-risk buildings in Bucharest poses a threat that even the best planning can’t fully mitigate. It’s an issue that requires more investment and attention”, outlined by one urban planner. “Seismic activity in the Vrancea area remains a constant and unpredictable threat, making it even more crucial to ensure that tools like this are reliable and accessible”, indicated by the civic community representative.
The SWOT analysis presented in
Figure 10 addresses RQ4 and highlights the strong potential of the proposed tool in enhancing seismic risk management in Bucharest. It emphasizes the tool’s strengths in facilitating informed decision-making and improving disaster response strategies. However, the analysis also identifies critical areas such as the need for improved data quality, platform improvements, and increased collaboration among stakeholders to optimize the tool’s practical utility in real-world disaster scenarios. These findings represent the results of Step 7 in the methodology.
5. Conclusions
The study concludes that the key elements of seismic-mitigation strategy outlined in this research provide a systematic framework for addressing Bucharest’s specific vulnerabilities, combining seismic resilience indicators with expert input to identify risks and plan effective interventions. This approach ensures a structured response to seismic risks and culminates in the development of a comprehensive digital mapping tool. This tool consolidates critical information on relocation areas, medical facilities, and vulnerable neighborhoods, transforming theoretical insights into a functional resource for both immediate disaster response and long-term urban resilience planning.
Building on the micro-zonation study of [
21], which depicts the more affected district of Bucharest in a specific seismic scenario (Mw 7.8, 150 km, Vrancea), our assessment offers sufficient information to support informed decision-making.
Bucharest’s District 2 is identified as the most vulnerable to seismic risks, with a high population density and peak ground acceleration (PGA) of 300 cm/s2. While the district has significant resources, including medical facilities and relocation areas, the high demand created by its dense population undermines its effectiveness during seismic events. District 4, with a lower PGA of 220 cm/s2, exhibits reduced resilience due to limited medical and relocation resources, highlighting disparities in preparedness across the city.
The digital map, developed using Google My Maps, addresses these disparities by centralizing infrastructure data, improving coordination, and empowering decision-making during disasters. Its real-time accessibility to emergency professionals and the public further enhances its utility in both disaster preparedness and response. However, its effectiveness is limited by data availability and quality, as well as gaps in resilience indicators, which fail to fully capture localized building practices, soil conditions, and socio-economic vulnerabilities.
The SWOT analysis highlights the tool’s significant potential to support seismic risk management while identifying areas for improvement, including enhanced data quality, platform scalability, and greater collaboration among stakeholders.
By incorporating scientific rigor and stakeholder input, the methodology integrates the designation of emergency open areas, the mapping of medical facilities, and the inclusion of educational buildings. Lessons from the study emphasize the importance of accurate, real-time data, multi-sectoral collaboration, and localized strategies tailored to Bucharest’s urban and socio-economic characteristics.
Despite these strengths, the tool’s effectiveness is constrained by several limitations. Its reliance on accurate and complete data means that outdated, inconsistent, or incomplete information can undermine reliability. Indicators designed for general resilience contexts may fail to capture localized complexities such as unique building practices, soil conditions, or socio-economic vulnerabilities. Logistical barriers in mapping all potential relocation and treatment areas, technological accessibility issues, and risks related to network outages or cyber threats also present challenges to its implementation.
To address these limitations and expand the tool’s scope, the second phase of this research initiative will focus on incorporating additional data layers, such as hotels and temporary accommodations, to broaden shelter coverage. Detailed evacuation routes and mobilization strategies will also be added to improve disaster response efficiency. Seismic-scenario simulations will provide estimates of damage and casualties, offering insights into preemptive resource allocation. Additionally, to further enhance the digital mapping process, we are exploring ways to incorporate an analysis using the HAZUS methodology, which will enable a more comprehensive assessment of potential seismic impacts.
The third phase of this research initiative will investigate the systematic integration of advanced technologies to enhance the digital mapping tool’s capabilities for seismic resilience, for example, the incorporation of early warning systems to provide proactive disaster notifications, facilitating timely evacuations and infrastructure protection. Additionally, the research will investigate the integration of real-time monitoring systems, such as IoT sensors, to assess structural health and support immediate post-disaster evaluations.
Ultimately, this threefold research approach will enhance Bucharest’s capacity to mitigate seismic risks while offering a scalable and replicable model for global application. By addressing vulnerabilities, integrating advanced tools, and fostering collaboration among stakeholders, this comprehensive strategy establishes a benchmark for urban resilience planning in seismically active regions.


