Article

Optimization of Mechanical Performance of Full-Scale Precast Concrete Pipes with Varying Concrete Strengths and Reinforcement Using Factorial Design

Civil Engineering Department, University of Engineering and Technology, Lahore 54890, Pakistan
Infrastructures 2025, 10(2), 29; https://doi.org/10.3390/infrastructures10020029
Submission received: 25 November 2024 / Revised: 5 January 2025 / Accepted: 21 January 2025 / Published: 24 January 2025

Abstract

The use of precast concrete pipes for water and sewage transportation systems is a very important element of a country’s infrastructure. The main aim of this study was to investigate the effects of concrete’s compressive strength and reinforcement levels on the mechanical performance of spun-cast full-scale precast concrete pipes in the local construction industries of developing countries. A test matrix was adopted using a full 32 factorial design. The studied concrete’s compressive strength was 20, 30, and 40 MPa, and reinforcement levels were 60%, 80%, and 100%, representing low, medium, and high levels, respectively. The medium level of reinforcement represented the reinforcement requirement of ASTM C76 in concrete pipes. A total of eighteen full-scale pipes of 450 mm diameter were cast in an industrial precast pipe unit using a spin-casting technique and were tested under a three-edge bearing load. The experimental results showed that the crack load and ultimate load of the tested pipes increased with higher levels of concrete strength and reinforcement levels. For example, an approximately 35% increase in the 0.30 mm crack load was observed when the concrete strength increased from 20 MPa to 30 MPa for all tested levels of reinforcement. Similarly, around a 19% increase in ultimate load was observed for pipes with 80% reinforcement compared to identical pipes with 60% reinforcement. It was found that the pipe class, as per ASTM C76, is highly dependent on the concrete strength and reinforcement levels. All of the pipes exhibited the development of flexural cracks at critical locations (crown, invert, and springlines). Moreover, concrete pipes cast with low-level strength and reinforcement also showed signs of crushing at the crown location near to the pipe failure. The analysis of variance (ANOVA) results showed that the main factors (compressive strength and reinforcement levels) were significantly affected by the cracking loads of precast pipes. No significant effect of the interaction of factors was observed on the crack load response. However, interaction factors, along with main factors, have significant effects on the ultimate load capacity of the concrete pipes, as indicated by the F-value, p-value, and Pareto charts. This study made an effort to illustrate and optimize the mechanical performance of pipes cast with various concrete strengths and reinforcement levels to facilitate the efficient use of materials for more resilient pipe infrastructure. Moreover, the exact optimization of concrete strength and reinforcement level for the desired pipe class will make the pipe design economical, leading to an increased profit margin for local spin-cast pipe fabricators without compromising the pipe’s quality.

1. Introduction

The efficient sewage system in any locality is very important for the daily routine of the surrounding neighborhoods. Due to the underground nature of the majority of sewer systems, it is very challenging yet critical to assess their existing conditions before any failure or disruption appears on the surface. Therefore, ensuring that a sewer system is suitable at the start of its design and prior to laying is vital and plays an important role in its long-term performance. Precast concrete pipes are currently employed in sewer systems due to their enhanced quality control, easy manufacturing and installation, and the economical solution they present for sustainable construction in rural and urban areas. Precast concrete pipes are manufactured using conventional steel rebars and prestressed wires for various applications [1]. In conventional reinforced concrete pipes, circular rings are provided to deal with the flexural stresses generated in the precast pipes, and longitudinal bars are provided for maintaining the exact spacing and position of the circular rebars. Furthermore, single- and double-reinforcement cages are used depending on the diameter of the pipe and its applications [2,3].
Extensive experimental and numerical studies have been conducted on the mechanical performance and durability of concrete pipes. For instance, Faisal et al. (2023) [4] investigated the mechanical performance of full-scale precast concrete pipes under three-edge load bearing and patch load tests. The studied variables were the amount of reinforcement and steel fiber dosages. It was observed that pipes incorporating higher reinforcement (steel rebars and steel fibers) exhibited higher cracking and ultimate loads. Similarly, Faisal et al. (2024) [5] conducted laboratory and field studies on precast concrete pipes with various reinforcement levels. No cracks were detected on the pipes tested in buried conditions under various passing vehicles. Nedal (2015) [6] studied the effect of various types and dosages of fibers on the structural performance of precast concrete pipes using a three-edge bearing test. Dry-cast concrete was used for casting various full-scale pipes in an industrial precast plant. It was reported that the current pipe design codes are conservative. The finite element analysis and experimental results were comparable. Moreover, the pipes were buried in the ground and passed over by various vehicles to measure their response [6]. Ramadan et al. (2020) [7] modeled concrete pipes using an elliptical steel reinforcement cage through finite element analysis. It was observed that the rotation of the elliptical steel cage had a significant effect on the load-carrying capacity of concrete pipes. Sun et al. (2022) [8] studied the flexural behavior of prestressed concrete pipes using finite element analysis. An internal pressure of 2 MPa was applied, and crack distribution was monitored. The finite element results were analogous with the experimental findings. Hata et al. (2022) [9] used various waste materials to produce concrete pipes. High-temperature curing was the main contributing factor towards the development of compressive strength. It was observed that the pipes made with ordinary cement concrete and cementless concrete exhibited fracture loads of 35 and 34 kN/m, respectively. Alshboul et al. (2022) [10] conducted a parametric study on buried concrete pipes of various sizes using finite element analysis. The studied deflection in the concrete pipe was up to 13 mm. It was reported that fill heights of around 9, 15, and 18 m were optimal for pipes with diameter-to-thickness ratios of 6, 4.2, and 3.8 m, respectively. Ancas et al. (2022) [11] also studied the structural performance of different types of buried pipes using finite element analysis. An optimum pipe depth-to-diameter ratio of 3 was concluded in their study. A radius-to-thickness ratio of 10 and above was recommended for the pipes. Merachtsaki et al. (2020) [12] investigated various types of coating materials to protect sewer pipes. A spray test using sulfuric acid was conducted to explore the duration of the coatings used. It was observed that methylcellulose coatings exhibited better acid-resistant behavior. Zhang et al. (2023) [13] investigated the restoration of corrosion-affected pipes using ultra-high-performance concrete. It was observed that the ultimate capacity of the pipe decreased with increased corrosion level. Mei et al. (2023) [14] studied the structural performance of corroded rectangular concrete pipes using a three-edge bearing test. A decrease in load carrying capacity due to corrosion was evident because of the reduced effective wall thickness. With higher corrosion depth, the load capacity of the pipe decreased. The load carrying capacity decreased by approximately 31% when the corrosion depth and protective layer thickness were the same. A comparable result between the experimental results and numerical simulation was observed [14]. Li et al. (2022) [15] conducted a three-edge bearing test on reinforced concrete pipes. Under applied loading, the damage behavior of the tested pipe was recorded through the acoustic emission (AE) technique. It was reported that the AE energy can be correlated with pipe damage behavior. Mostofizadeh and Tee (2021) [16] studied the seismic behavior of geopolymer concrete (GPC) pipes using finite element analysis. It was observed that the GPC pipe incorporating 20% fly ash exhibited around a 25% decrease in vertical displacement. Zhang et al. (2020) [17] studied the behavior of cracked concrete pipes. The studied variables were the depth, length, and location of cracks and their effect on the mechanical behavior of concrete pipes tested under a three-edge bearing load. Finite element analysis was also conducted. The pipes failed along the pre-defined crack locations. The load-carrying capacity of pipes decreased by around 46% and 41% when the location of the pre-defined crack was at the crown or invert and springlines, respectively [17]. Basit et al. (2024) [18] studied the joint behavior of precast concrete pipes. It was observed that the conventional joining material (cement–sand mortar) showed improved cracking performance and ultimate load-carrying capacity compared to non-shrinkage grout. The conducted numerical simulations exhibited a comparable response with the conducted experimental joint test [18]. Similarly, Zhai et al. (2021) [19] studied the spigot and bell joint of a pipe using finite element analysis. The studied variables were applied loading and its location, depth of the pipe, and internal pressure. Rotation angle, displacement, and force at the joint were the response variables. Wong and Nehdi (2018) [20] reviewed the various international standards on concrete pipes and presented their critical analysis. Various research gaps in terms of concrete pipes were identified, along with recommendations regarding the connection between various global codes [20]. Abbas et al. (2025) [21] conducted a thorough literature review on investigating the various parameters that affect the performance of concrete pipes. It was observed that the manufacturing process of concrete pipes is a significant factor that affects their quality and mechanical strength. Moreover, various pipe failure cases were discussed along with different challenges associated with concrete pipes [21]. Hongfang et al. (2025) [22] studied the traction force behavior for the pipe insertion process with various bends. For a greater number of bends and higher coefficient of friction, the traction force increased and decreased with higher bend angles [22]. Liu et al. (2025) [23] studied the use of sensors for investigating the cracks on prestressed concrete pipes. It was reported that the main cause of cracks was the concentration of stress near the pipe joint locations. Fang et al. (2025) [24] investigated the effect of the dislocation of pipe joints on the bending moment behavior. It was observed that the location of traffic load and the buried depth of pipes were the significant factors affecting the bending moment behavior. Li et al. (2024) [25] explored the effect of steam-curing on the chloride ion penetration of concrete pipes. It was reported that the diffusion coefficient of steam-cured specimens was higher than that of ordinary curing. The diffusion coefficient of specimens containing fly ash was a function of age, exhibiting increased behavior during early age and decreased at a later age [25]. Based on literature surveys, it can be argued that most of the studies conducted on precast pipes used numerical modeling due to its economical nature for conducting parametric studies. Moreover, the previous experimental studies were conducted on concrete pipes cast via the advanced method of manufacturing (i.e., vertical casting) and employed accelerated curing through steam.
Full factorial design is an efficient method for handling data by considering all of the possible combinations of various factors at different levels [26,27,28]. This technique processes the data simultaneously to examine the contribution of individual factors and their interaction effects on the response variables [29]. Various studies have been conducted in the past to examine the optimum combination of various factors at different levels on the response variables. For instance, Mukharjee and Barai (2014) [30] used the full factorial method for investigating the effect of nano-silica and water–cement ratio on the water absorption and compressive strength of various tested mixtures. The analysis of variance indicated that the individual studied factors significantly affected the response; however, no interaction effects were dominant. Moreover, the F-value of individual factors was very high compared to the interaction factors [30]. Similarly, Senff et al. (2010) [31] studied the addition of micro- and nano-silica on the physical and mechanical properties of mortar mixtures using a factorial design. Alqadi et al. (2013) [27] used a 2k factorial design for estimating the proportions of ingredients in self-compacting concrete. Phanpheta and Bangphan (2021) [32] investigated the manufacturing procedure of turning machines using the full factorial design method. Three factors at three various levels were examined. The optimization of spindle speed, depth, and flow rate on the turning machine was conducted using response surface and contour plot methodology.
Full-scale precast concrete pipes were manufactured in industrial precast plants using various methods, for example, the vertical vibro-compaction method, which is commonly adopted in developed countries. Zero-slump concrete or dry concrete is used in pipes cast through the vibro-compaction method. However, in developing countries, most full-scale precast pipes are cast through the spinning method due to the easy and economical plant installation. The control of concrete mixture design and quality is very difficult when using the spinning method. Therefore, achieving uniform strength in spun-cast concrete pipes is very challenging. Moreover, the quality of the reinforcement used in the pipe cage is also very important to achieve a certain pipe strength. In developing countries, steel rebar reinforcement is normally achieved using unsegregated scrap, which may affect the quality of the final product. Therefore, the main objective of this study was to evaluate the mechanical performance of reinforced concrete pipes with different concrete compressive strengths and reinforcement levels used in developing countries for the manufacture of full-scale concrete pipes using spin-casting. A full-factorial analysis was utilized to determine various combinations of concrete strengths and reinforcement levels. The main novelty (original contribution) of this study is that the findings can be used by various stakeholders including clients, consultants, and contractors to facilitate the selection of the optimum combination of concrete strength and reinforcement level for a certain class of pipe for various applications. Moreover, this study also helps practitioners to select the best combination of concrete strength and amount of reinforcement suitable for already-available, locally installed spin-casting techniques for sustainable pipe manufacturing. Therefore, this research aims to optimize the mechanical performance of sewer pipes, assisting practitioners to more efficiently utilize materials for superior, stronger, and more robust pipe infrastructure.

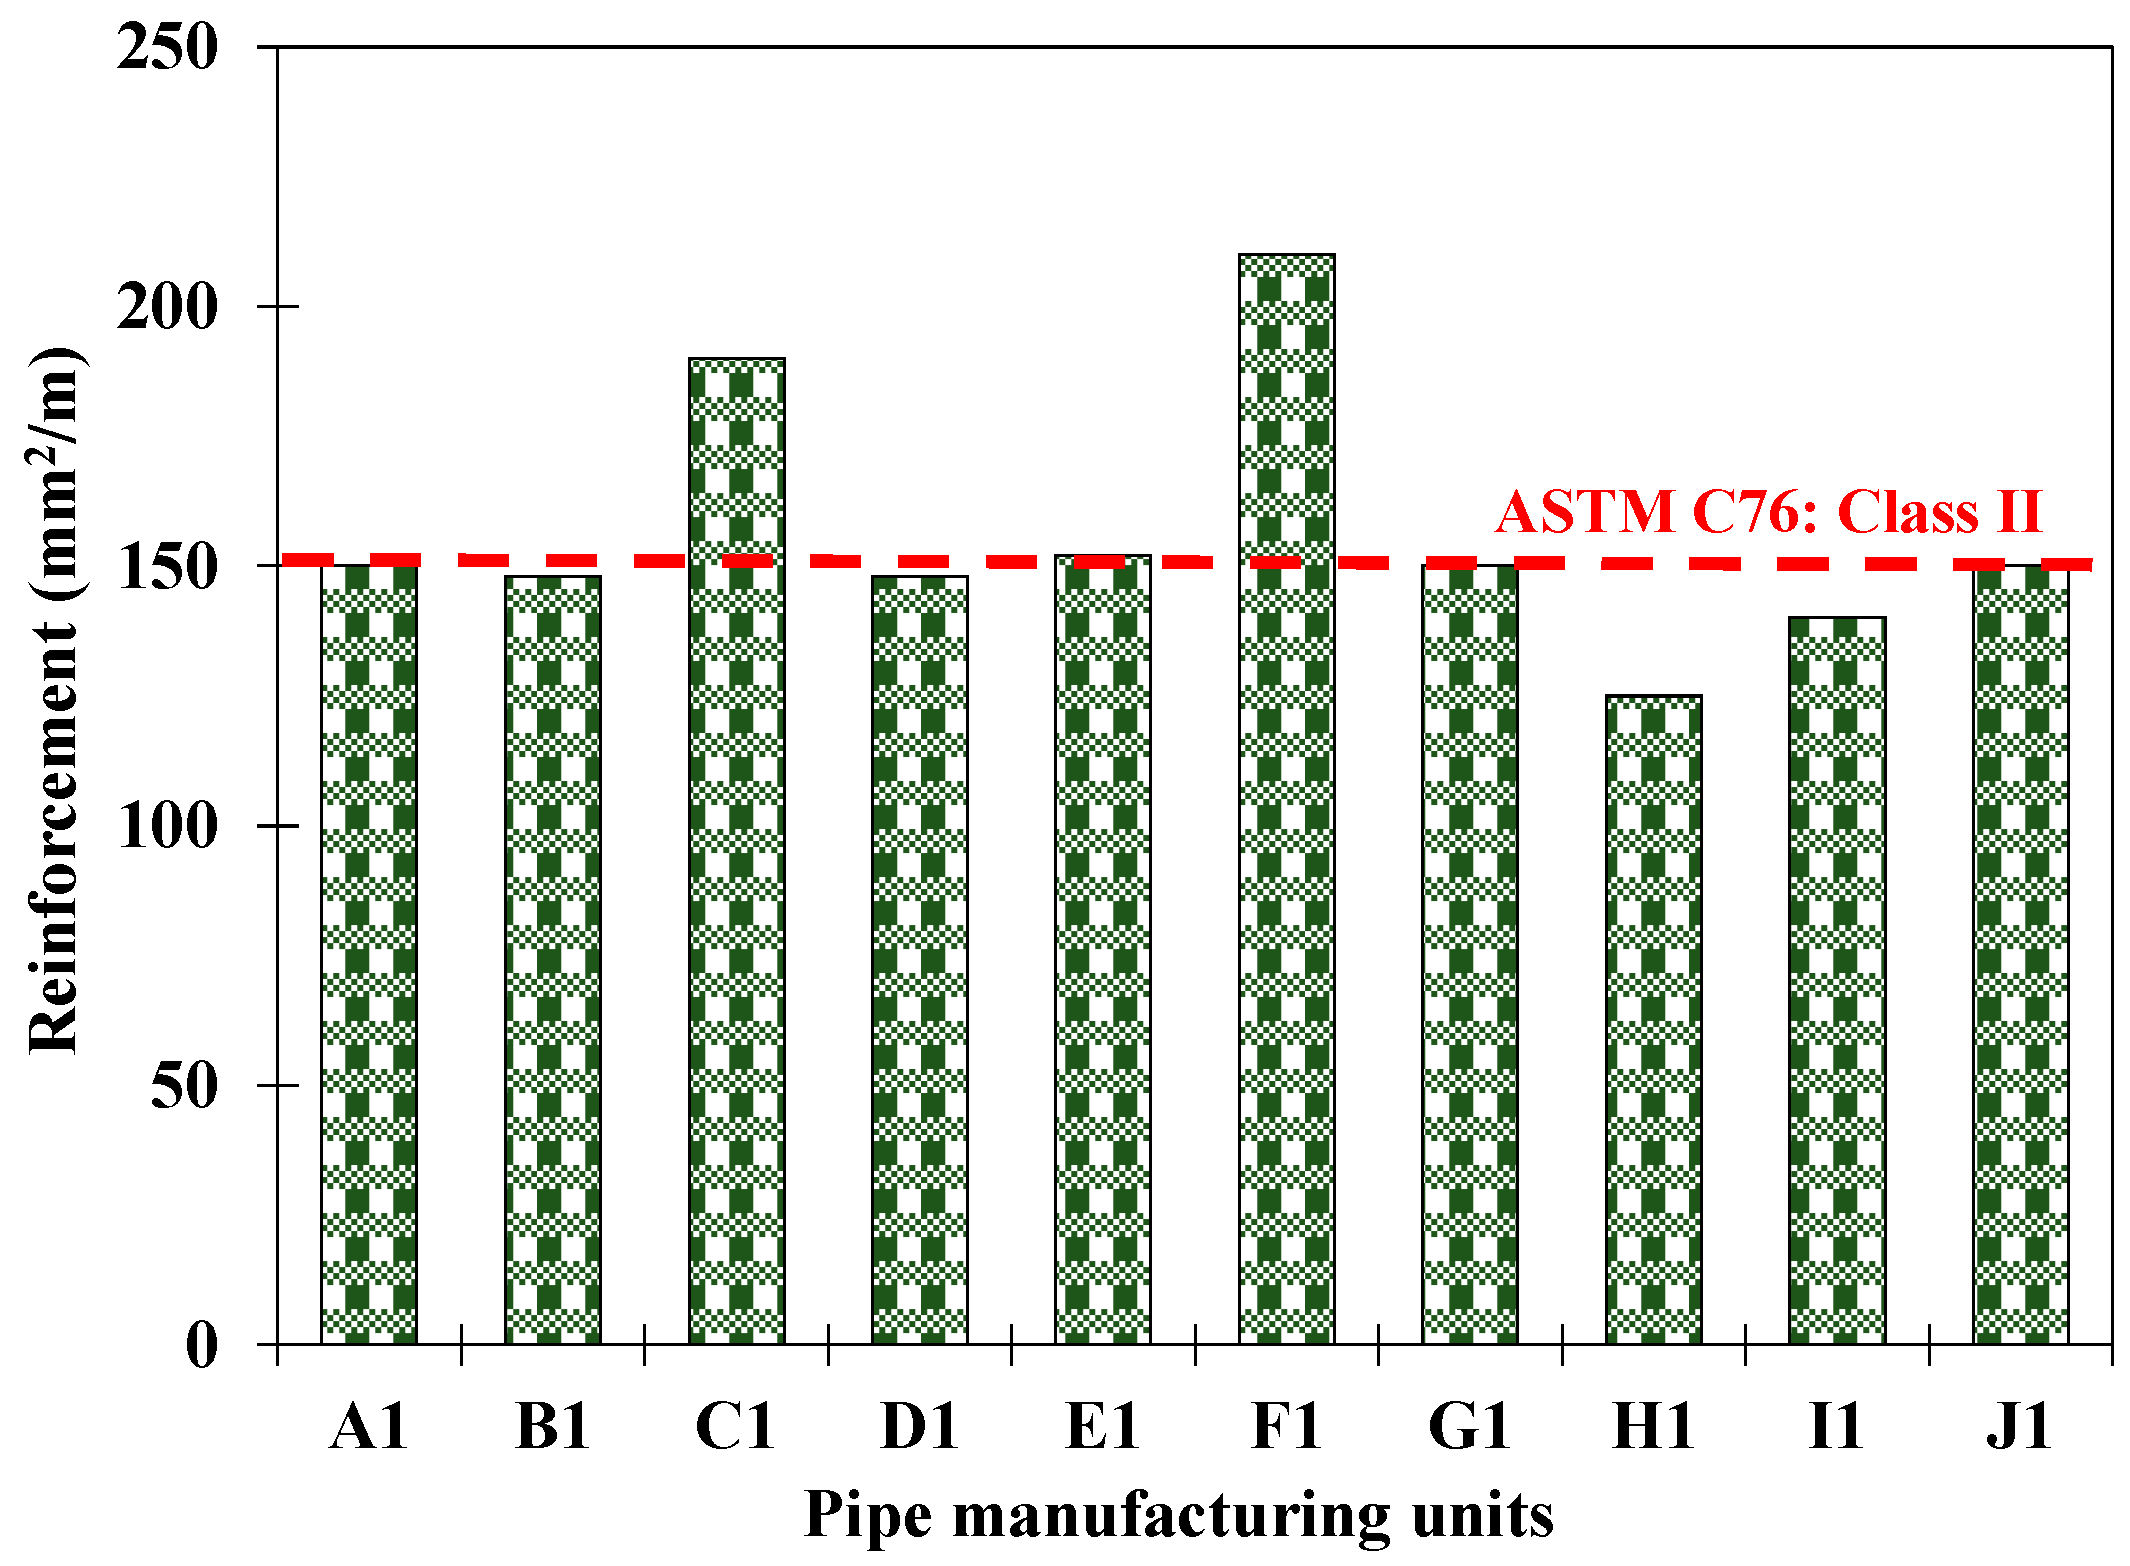
2. Selection of Concrete Materials and Reinforcement for Pipe Manufacturing

Initially, various local precast pipe factories were visited to examine the local practices and the material used for the industrial manufacturing of full-scale pipes. It was observed that not a single concrete mixture design was used in the visited factories. Various industries used different concrete mixture designs even for casting various sizes of pipes. Moreover, it was also noticed that the water/cement ratio used in their factories was relatively high (>0.70). The cement dosages varied between 220 kg/m3 and 325 kg/m3. Figure 1 shows the 28-day compressive strength achieved for the manufacturing of precast pipes. It was observed that the pipes manufactured in all of the pipe factories visited exhibited lower compressive strength than that required by ASTM C76 [33] (i.e., 27.6 MPa). The reinforcement provided in the manufacture of full-scale pipes also marginally satisfied the ASTM C76 guidelines [33]. Figure 2 shows the reinforcement provided by various local factories for casting their Class II pipes.
Based on the pipe factories visited, two factors (concrete strength and rebar reinforcement) were identified as the main controlling parameters. Three concrete strengths (20, 30, and 40 MPa) and reinforcement levels (60%, 80%, and 100%) were investigated to explore the overall picture of the local practice of casting full-scale concrete pipes. These chosen concrete strengths and reinforcements represented low, medium, and high levels. Medium levels of concrete strength (30 MPa) and reinforcement (80%) basically represented satisfactory conditions of the ASTM C76 guidelines [33]. A full-factorial analysis (32), representing the two factors at three levels (Table 1), was selected for the design of the experiment. A total of nine pipe combinations (Figure 3) were cast based on the 32 factorial analysis, representing various concrete strengths and reinforcement levels. Table 2 shows the test matrix of the cast pipe specimens based on the factorial analysis.
The concrete mixture for the selected combination based on the strength requirements was designed according to ACI 211.3R [34]. Table 3 shows the concrete mixture design used for casting various types of pipes with different compressive strengths. Figure 4 shows pictures of steel rebars and coarse and fine aggregates used for casting full-scale precast concrete pipes.

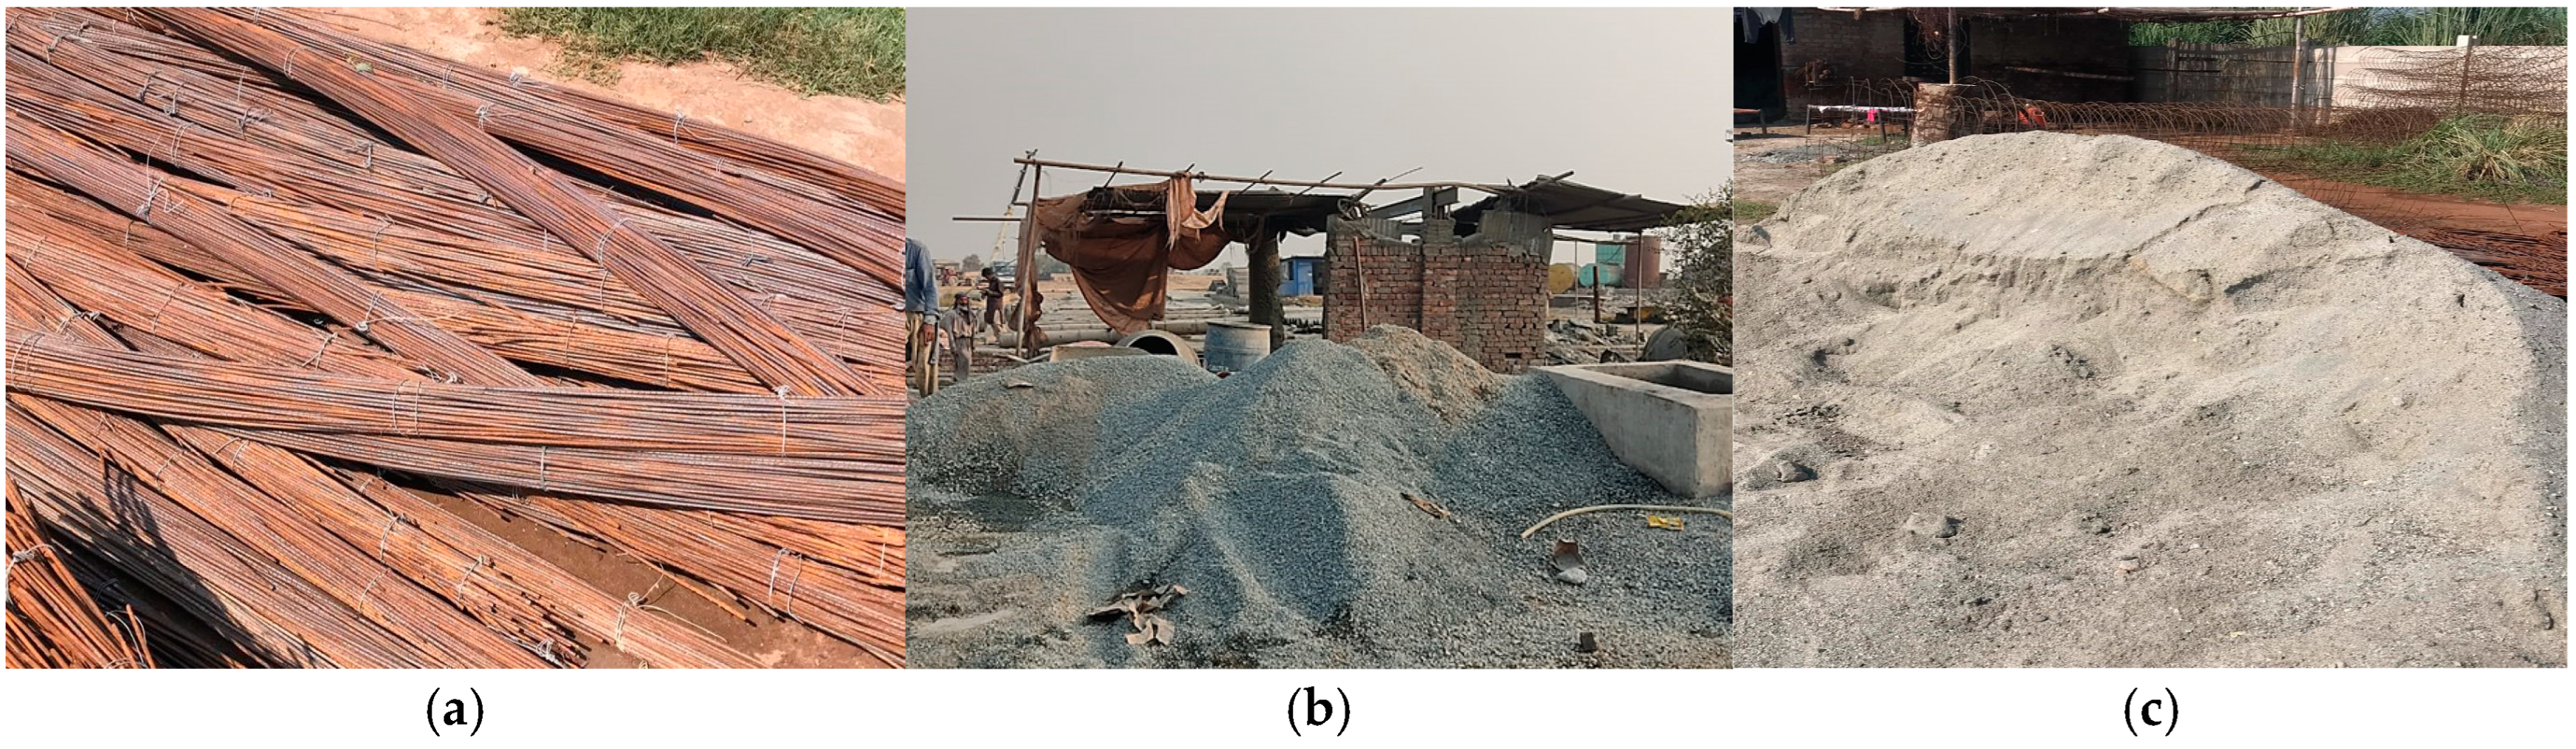
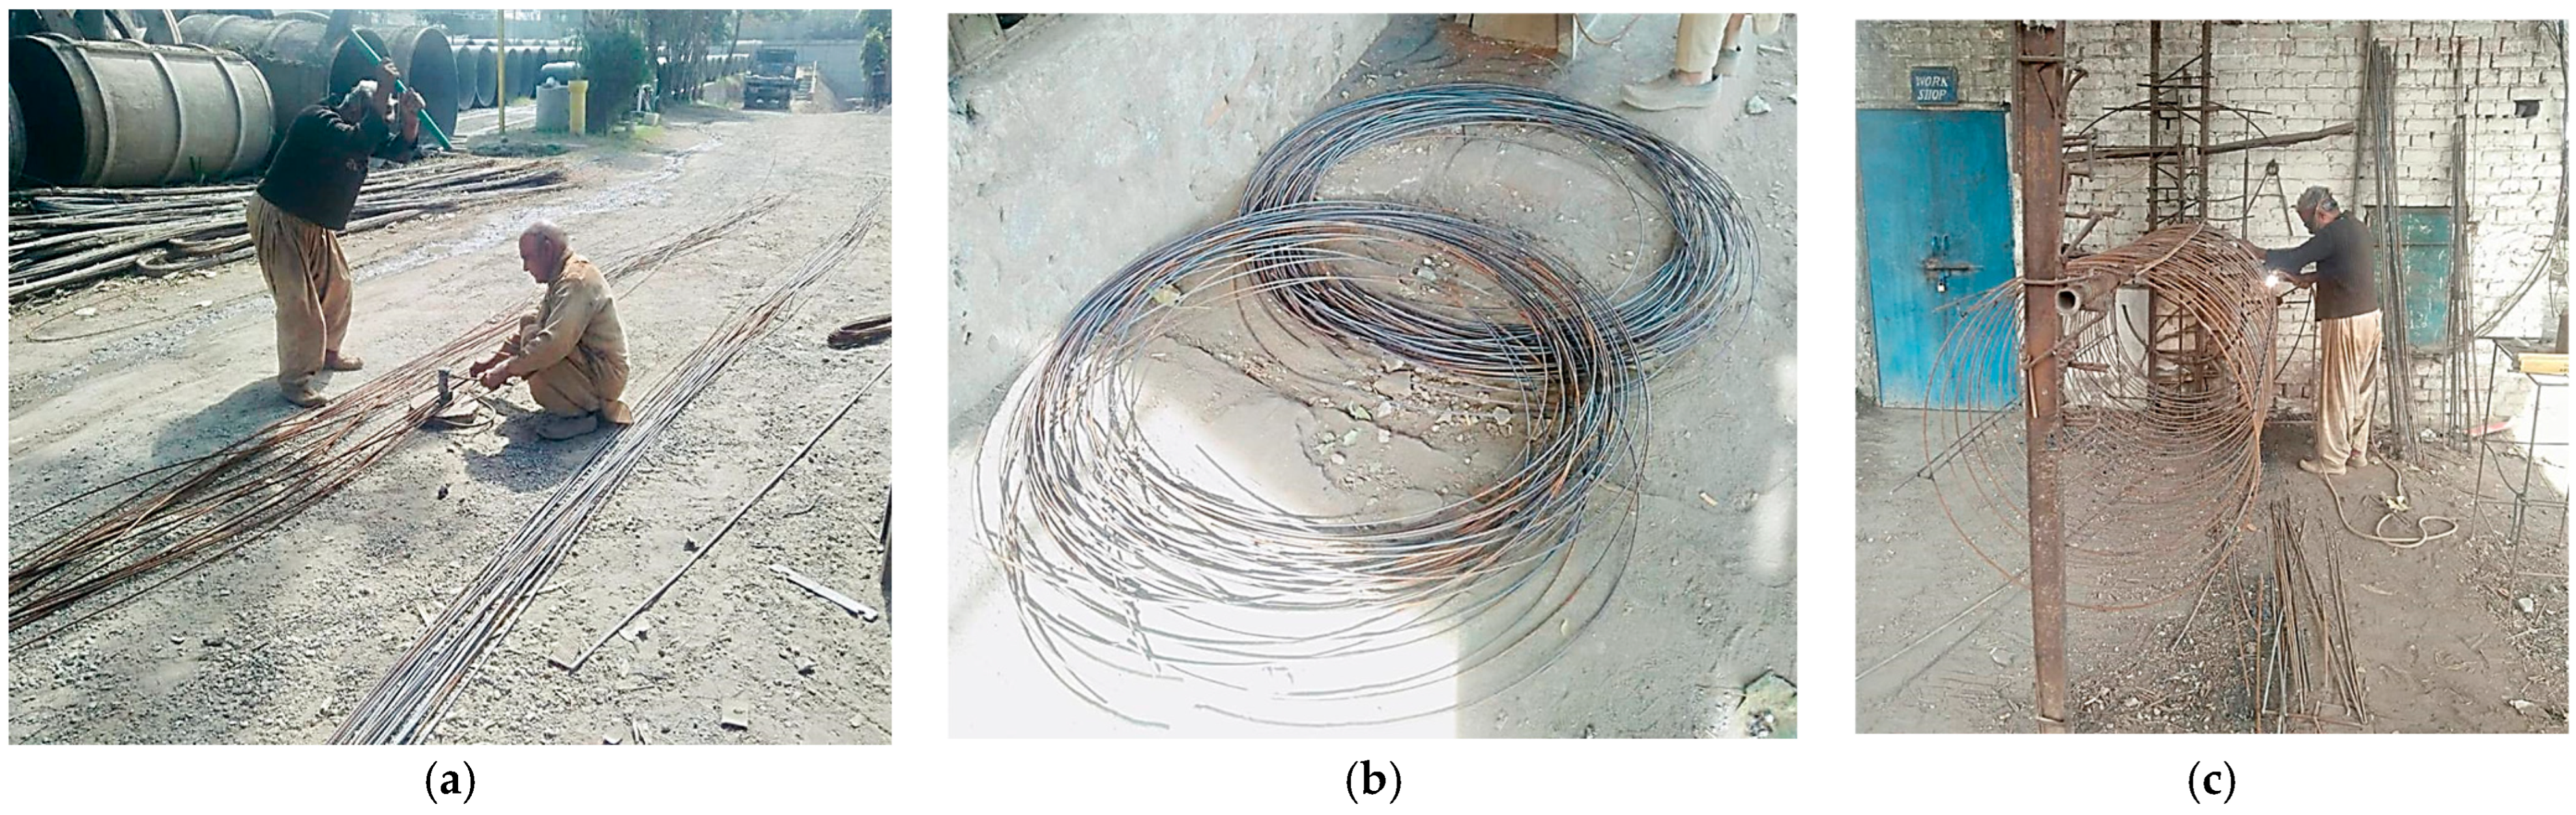
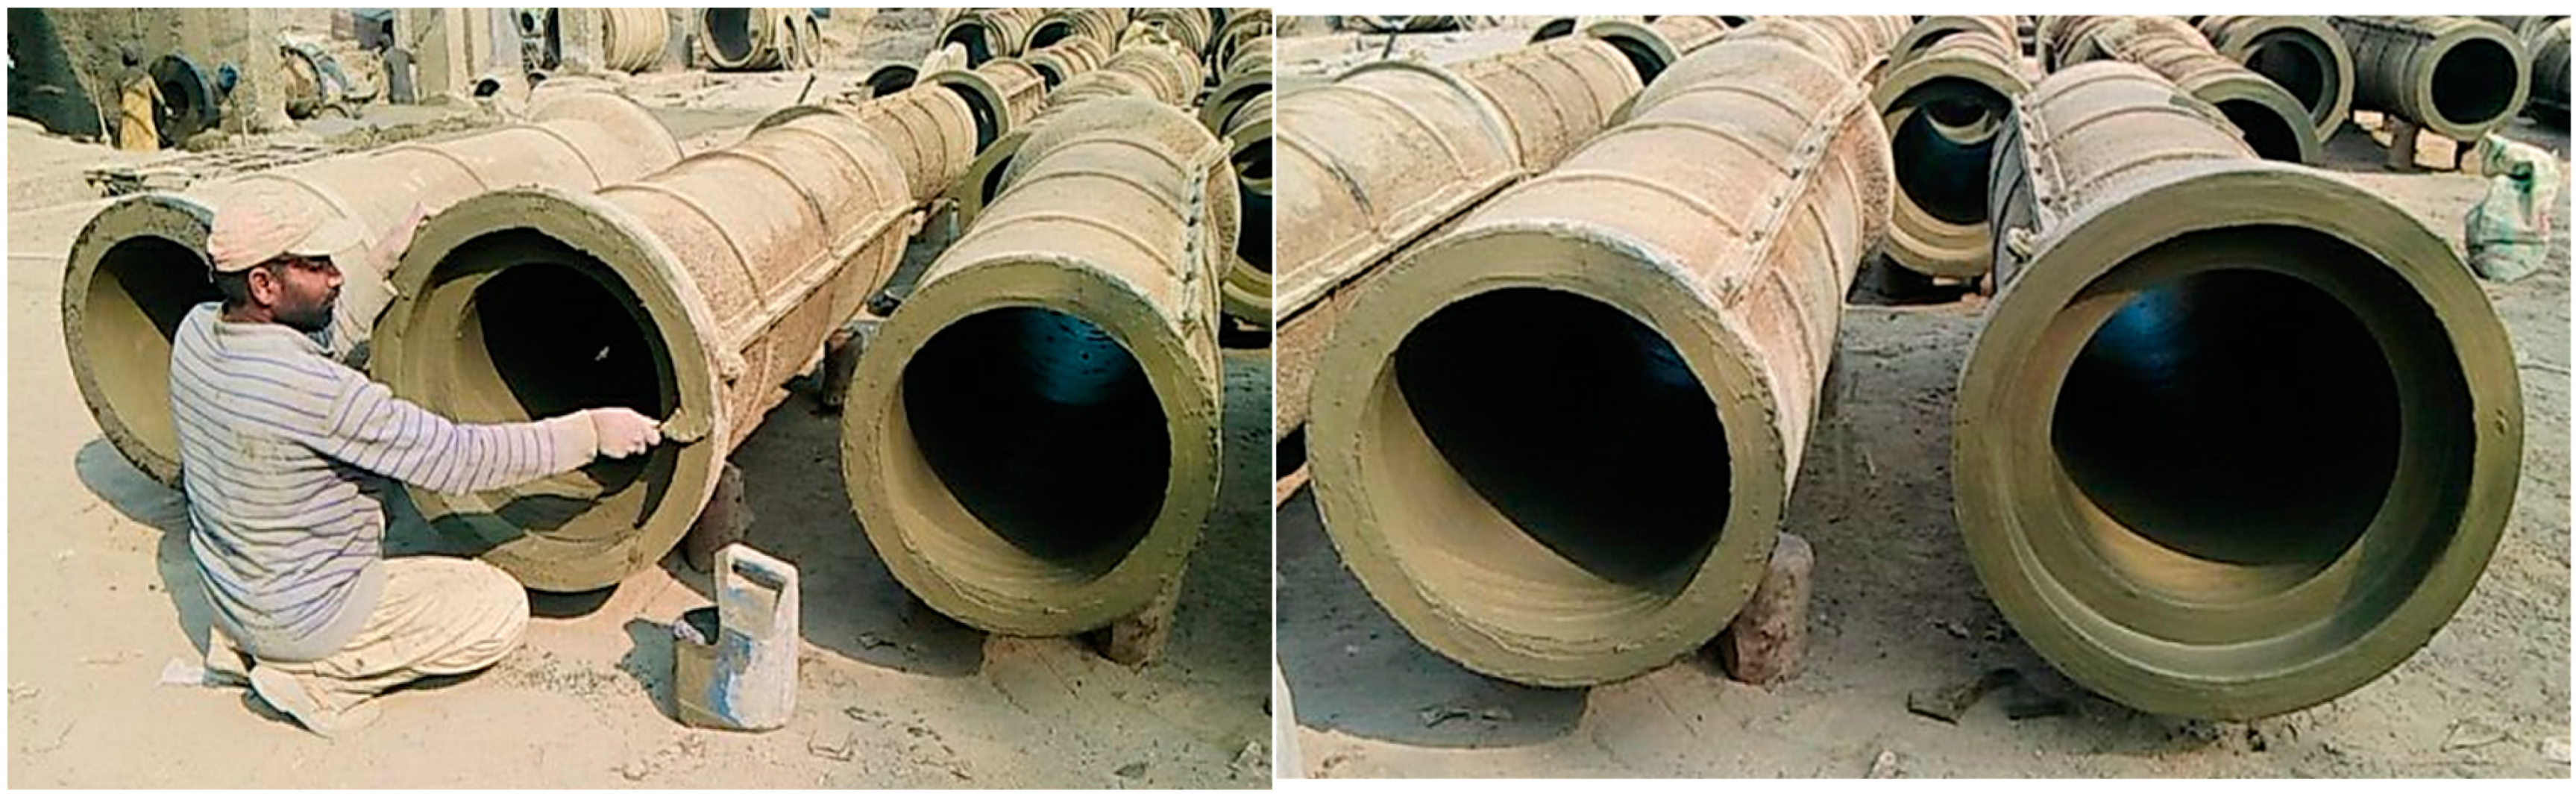
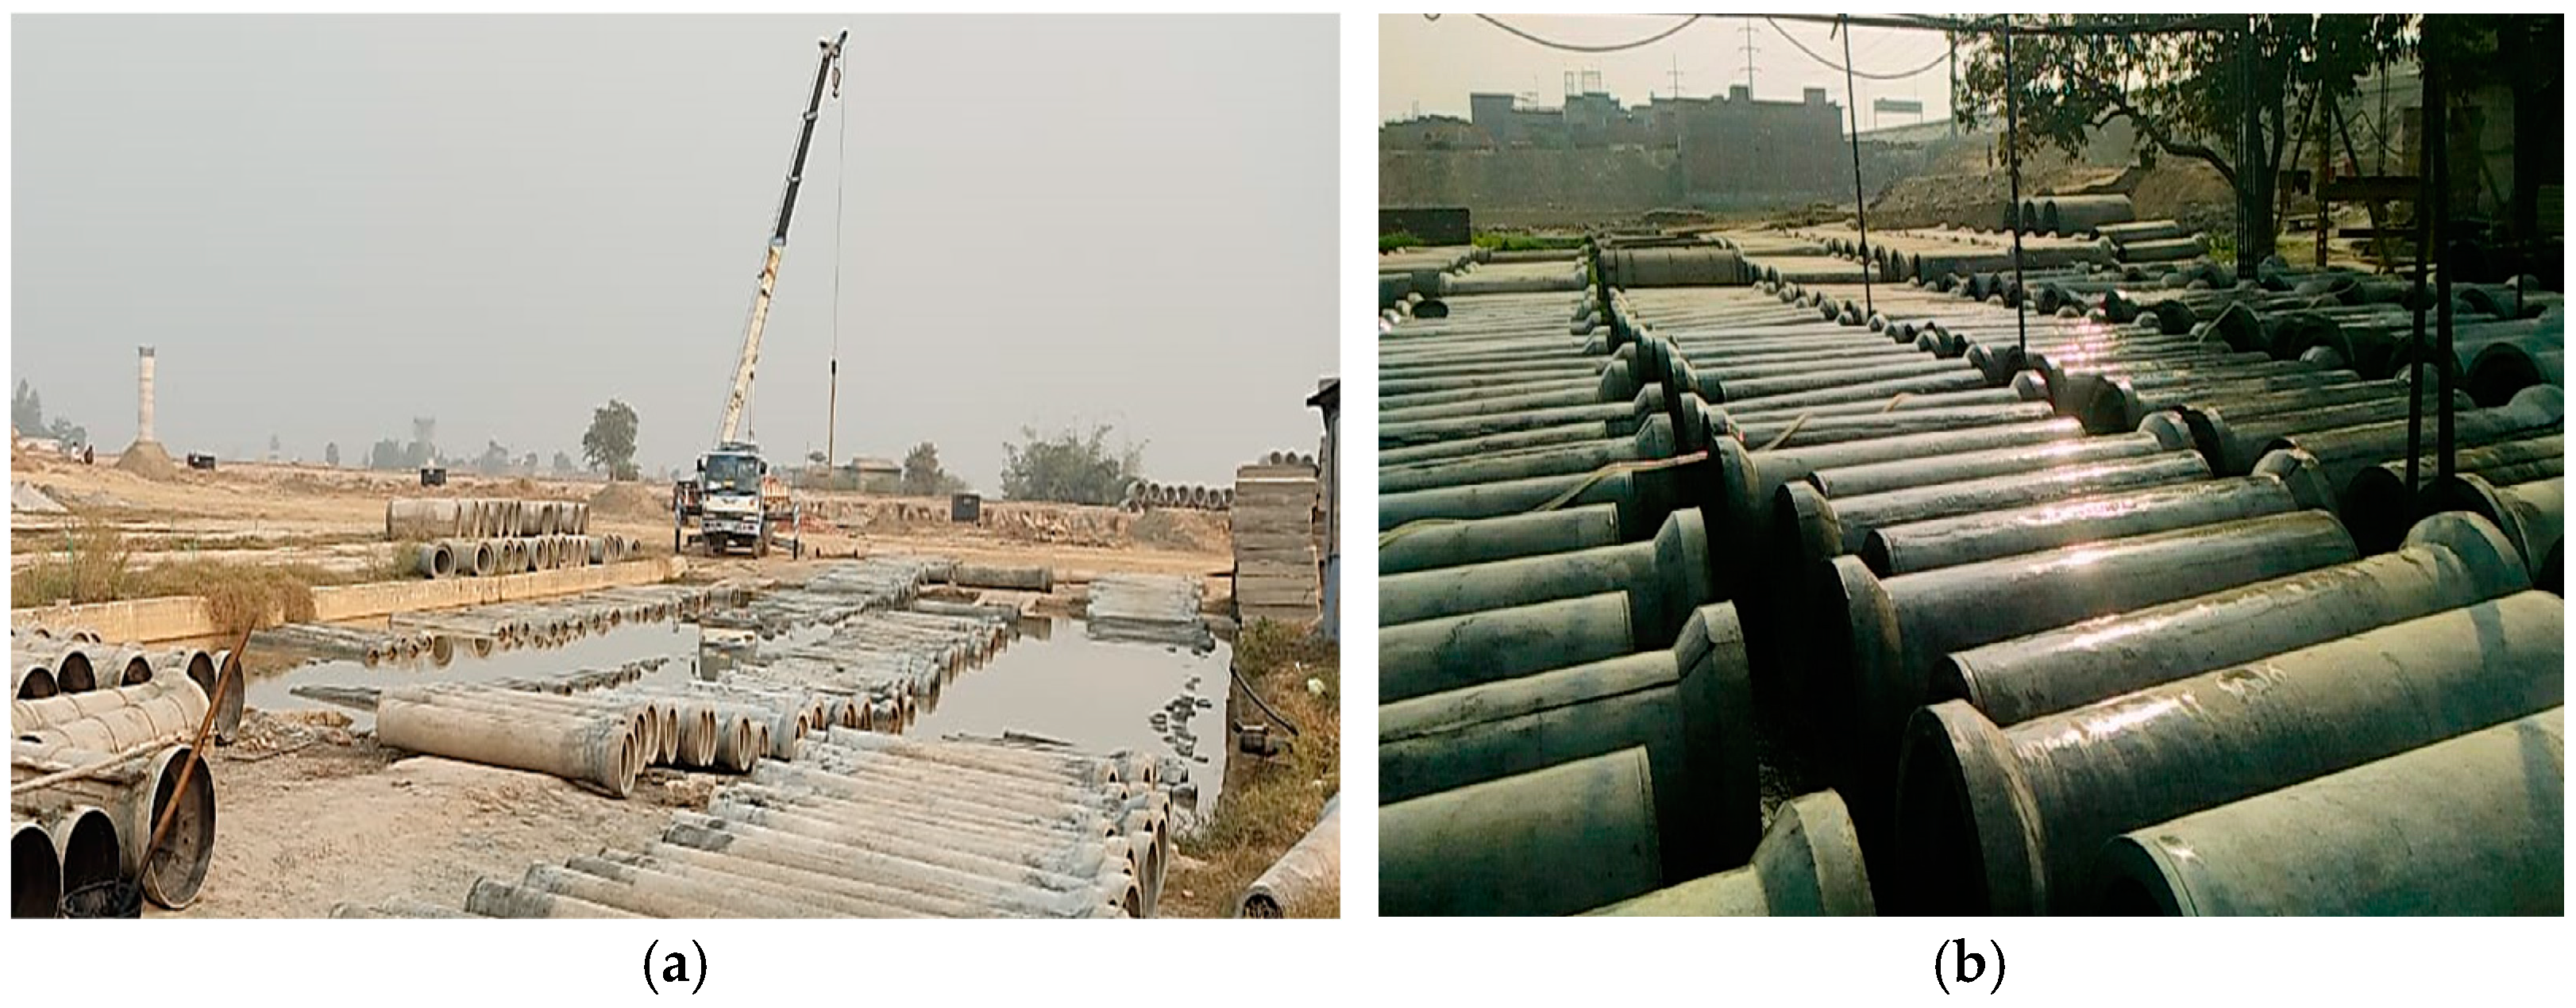
3. Manufacturing of Full-Scale Pipes

The tested pipes were cast through a locally available spin-casting technique. Initially, reinforcement cages were prepared on site using long steel rebars (Figure 5). The rebars used had a diameter of 5 mm and an ultimate tensile strength of 900 MPa. Longitudinal rebars were cut to the length of the pipe (2.43 m). Circular rings were prepared by rotating straight bars along a fixed ring assembly of desired circular diameters (Figure 5b). These rings were connected to longitudinal bars through welding (Figure 5c). Subsequently, these prepared cages were transferred to the pipe molds (Figure 6a). The pipe molds typically consisted of two half-circular steel plates that were joined together with nuts and bolts to form a circular mold of the desired size. The pipe molds were oiled from the inside and end rings were inserted at each longitudinal end of the pipe (Figure 6b). The inner sides of the end rings were used as a reference for achieving the desired wall thickness. The two end rings were connected through a rod and placed over the rollers of the spinning assembly. The concrete ingredients were mixed according to the design matrix (Table 2 and Table 3) in the surroundings of the spin-cast assembly using a rotating concrete mixer (Figure 6c).
The concrete was then shifted to the platform and manually poured through two operators into the pipe mold, which was rotating on the runners (Figure 6d). Due to the rotation of the mold, the concrete mixture was forced to move to the outer side of the mold. The initial speed of rotation of the spin-cast assembly runners was slower (75 rotations per minute (rpm)) during the concrete feeding process. However, it increased to 325 rpm when the concrete was completely filled into the pipe mold. The rotation process continued for around 3 minutes to ensure that the concrete was placed all over the pipe mold and formed the required thickness of the pipe wall. It was noticed that excess water appeared on the inner surface of the pipe mold during rotation and it was removed manually with the help of a brush. Moreover, at the end, a dry cement–sand mixture was sprinkled to create a smooth inner concrete surface on the pipe (Figure 7).
The concrete pipe was then taken out from the spin-cast assembly and moved to the storage yard near the curing region. Afterwards, the side walls of the mold were disconnected from the pipe mold, and their edges were smoothed with cement slurry (Figure 8). After 24 hours, the pipe molds were removed, and the pipes were cured in a water pond for 21 days (Figure 9a). After 21 days, the pipes were removed from the water pond and placed in a water sprinkler area for another 7 days (Figure 9b). After curing, the pipes were moved to the laboratory (Figure 10) for the evaluation of their structural performance.

4. Testing Methodologies

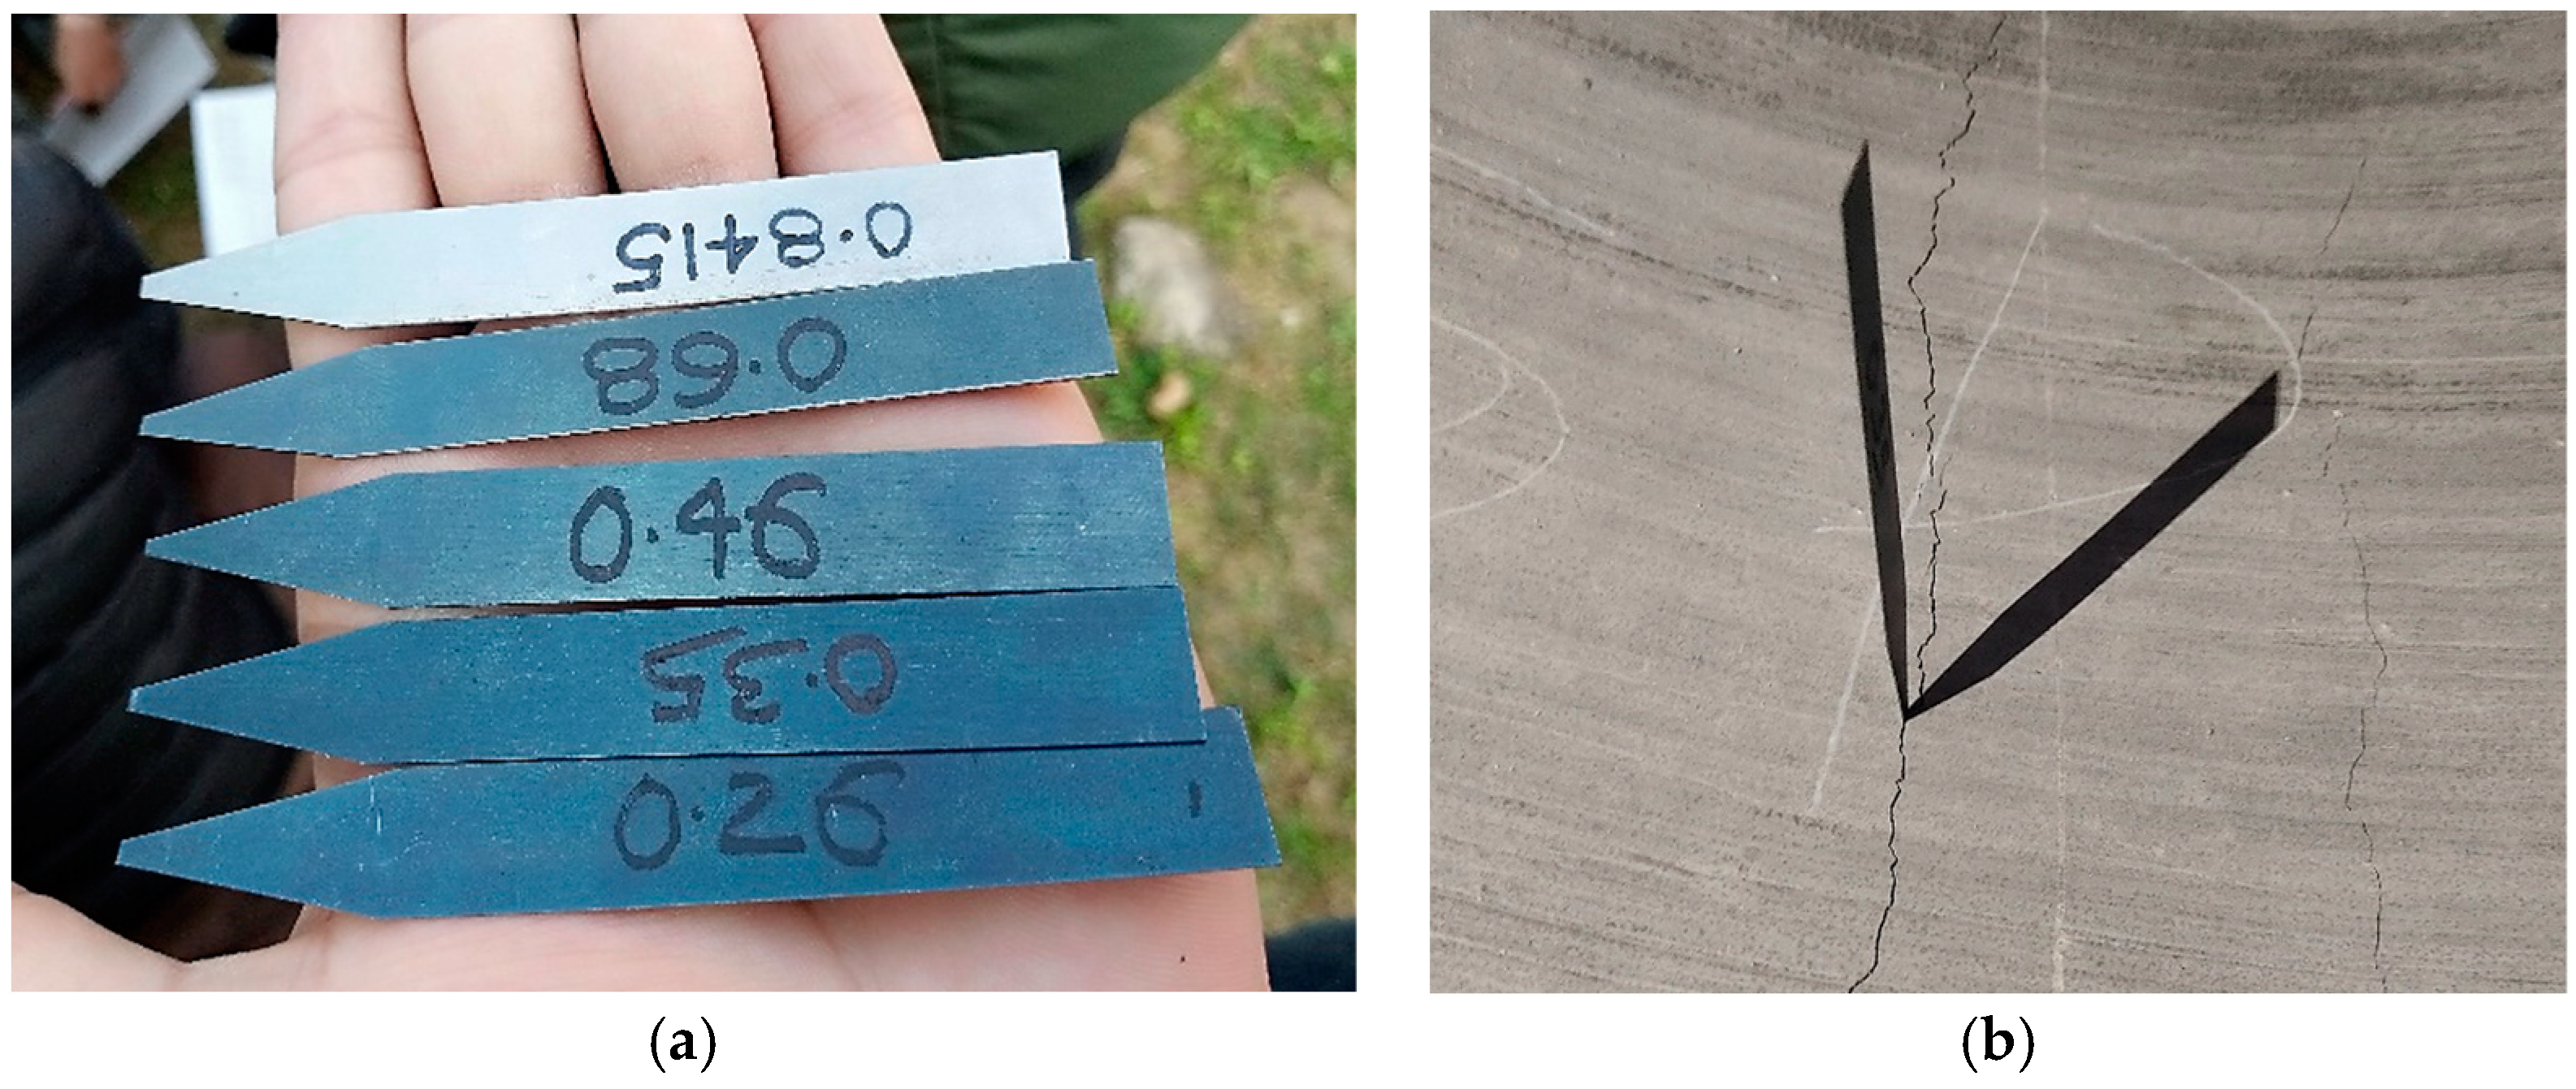
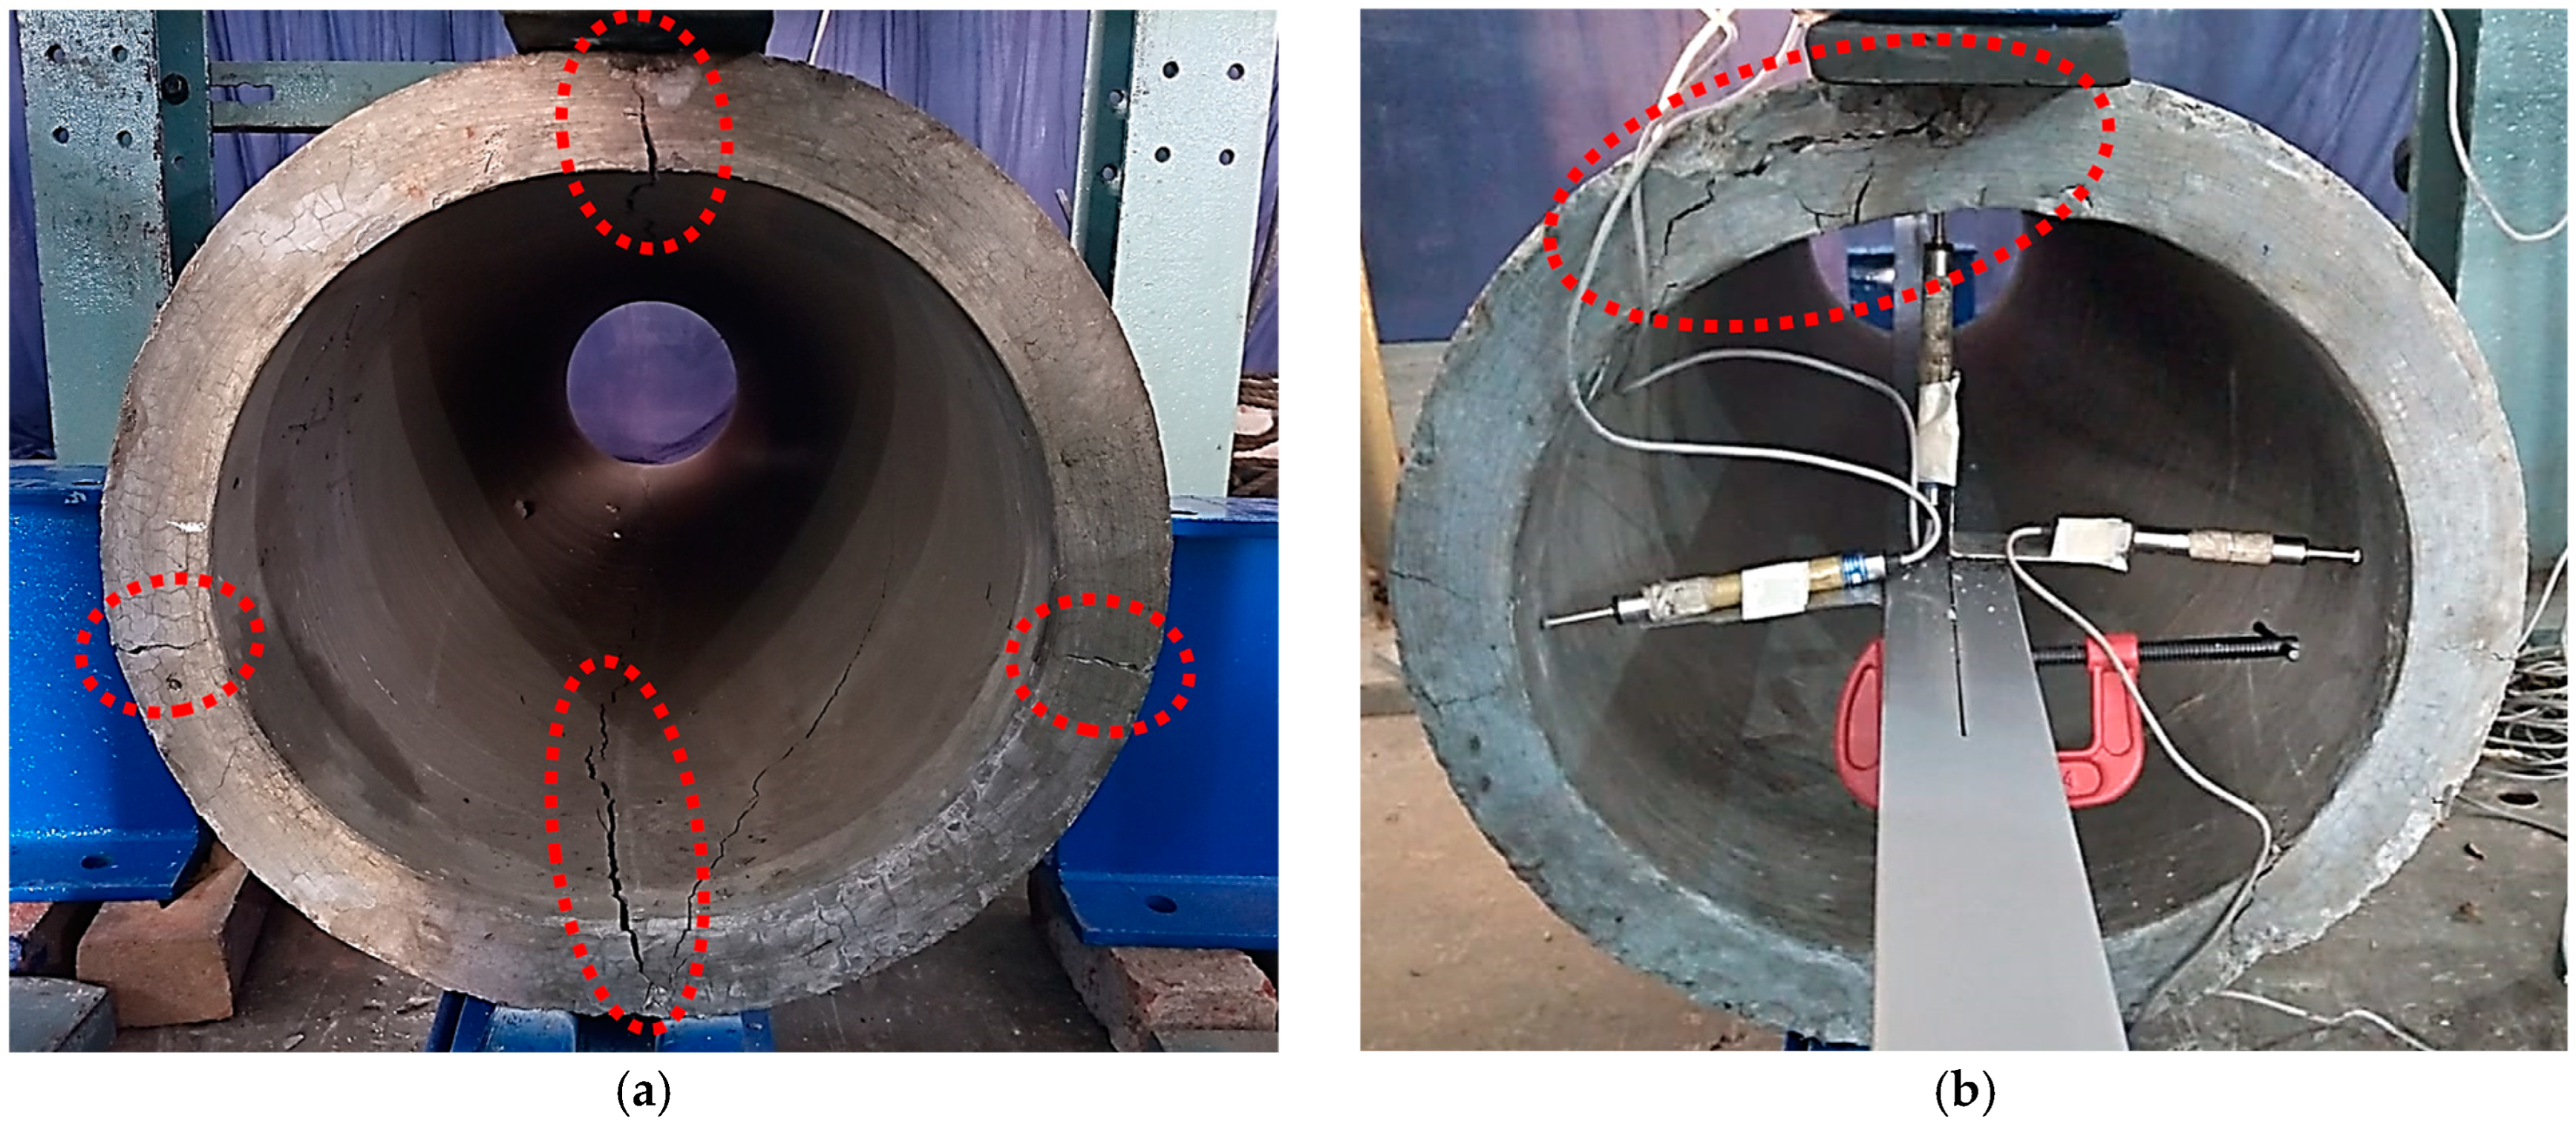
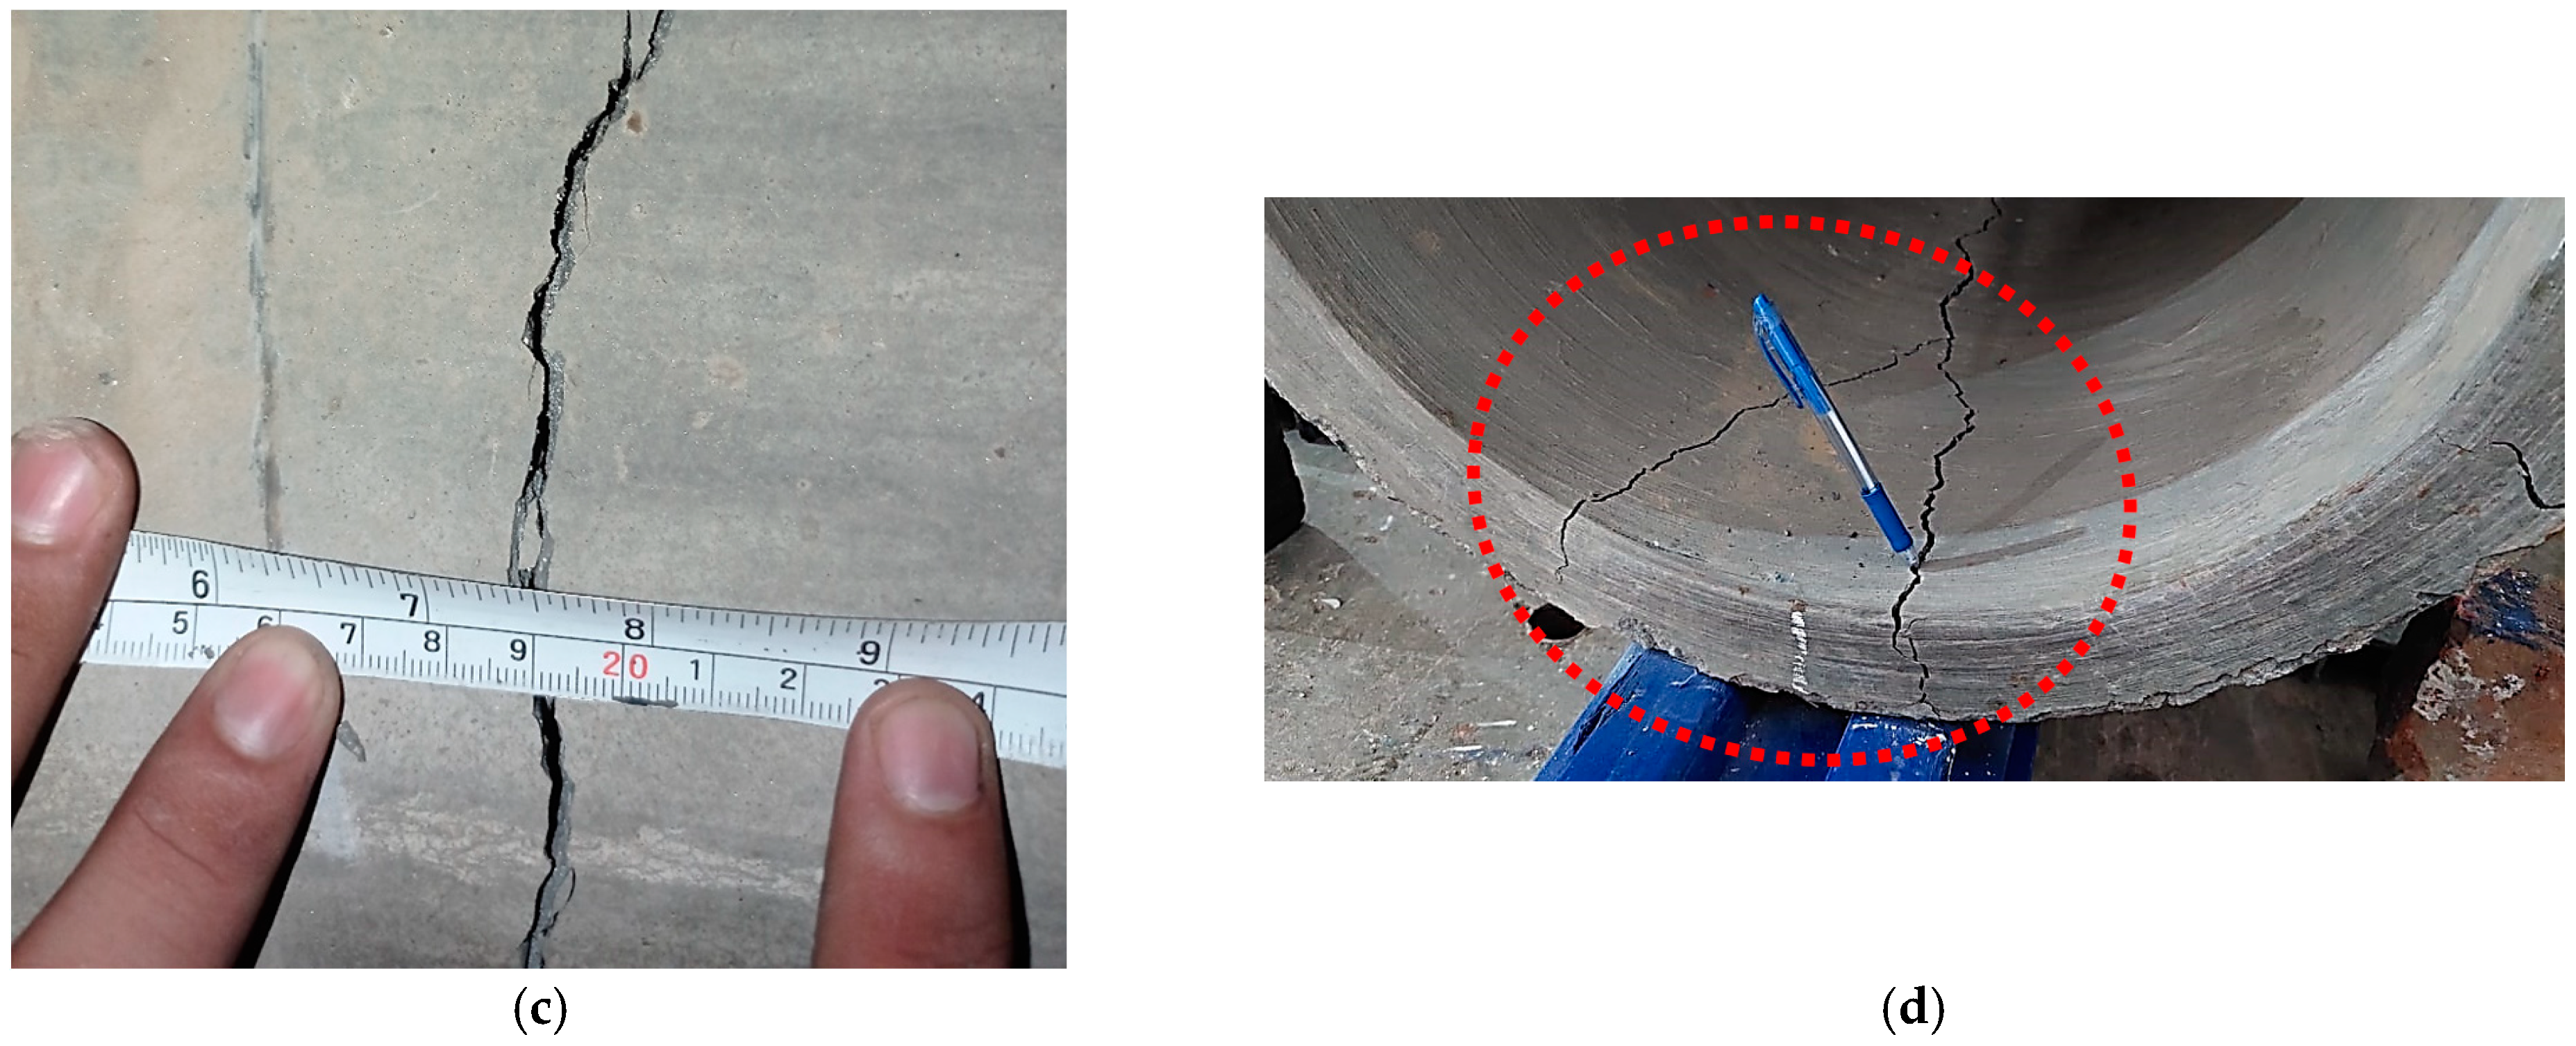
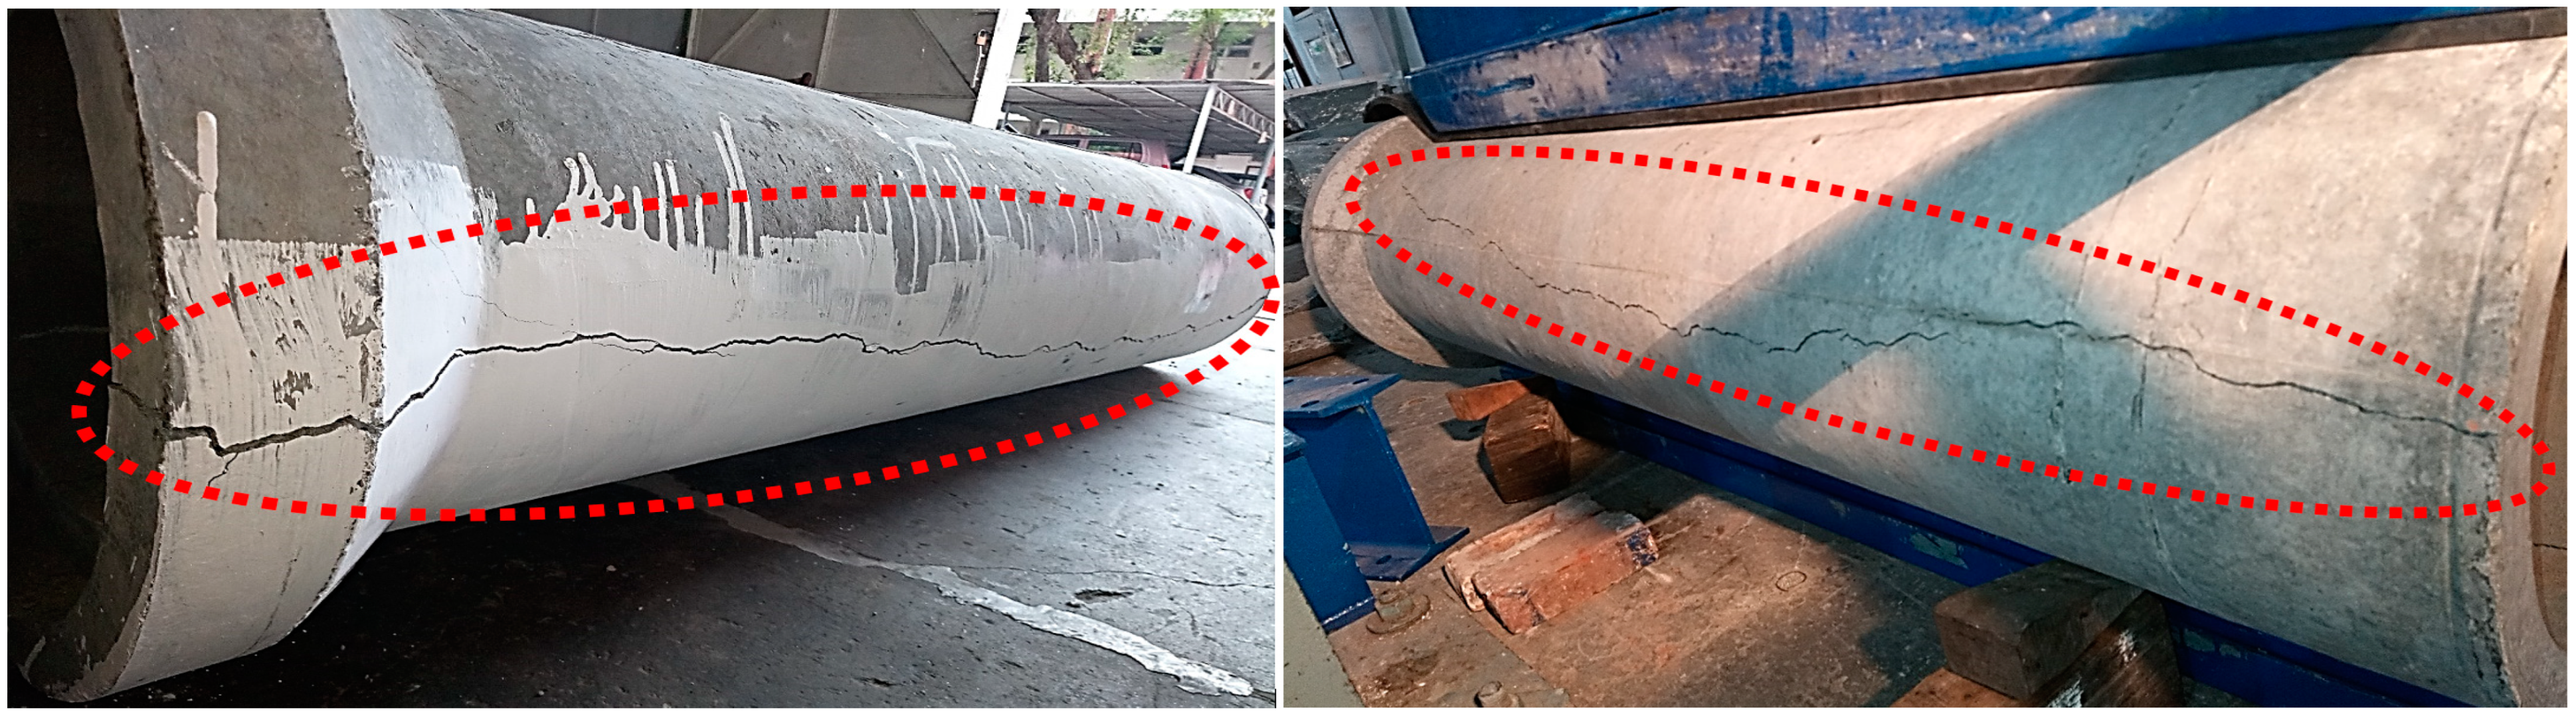
4.1. Experimental Perfromance: Three-Edge Bearing Test

The mechanical performance of the manufactured 450 mm diameter pipes was determined by performing a three-edge bearing test (TEBT) as per ASTM C497 [35] and ASTM C76 [33]. TEBT is commonly used worldwide to evaluate the structural and flexural behavior of precast concrete pipes. It involves measuring the D-load at a 0.30 mm crack width and the D-load at ultimate capacity. The measurement of the load at which the crack width equals to 0.30 mm is subjective and dependent on the operator’s observation, which can lead to errors and is considered a serious limitation of the TEBT setup. Similarly, testing lined (internally coated) concrete pipes is very challenging and requires stripping the coating to reveal the underlying concrete for crack measurement. Additionally, in the TEBT, loading is applied at the center of the specimen, which may lead to non-uniform stress distribution and may not reflect actual field conditions. The results of the TEBT may be skewed if the thickness of the pipe wall is not uniform around the length and circumference.
In this study, reinforced concrete pipes without internal coating were tested. A TEBT was conducted by placing the test assembly on a reaction floor (Figure 11). Figure 12 shows a schematic of the TEBT setup for further clarification. A reaction frame was fixed to the reaction floor through 2-foot-long anchor bolts. A loading jack assembly was attached to the reaction frame along with a load cell for monitoring the applied load. A flat steel frame was placed on the reaction floor, on which the lower bearing was fastened. The lower bearing consisted of two wooden supports, each around 52 mm wide and 28 mm thick, spaced 52 mm apart. The manufactured pipe was seated on this lower bearing. A 22 mm thick rubber pad was positioned on top of the pipe to distribute the load uniformly and remove any uneven concrete surfaces. A cubical cross-sectional wooden beam was placed on top of the rubber pad. A load was applied at the top of the steel beam, which was distributed to the pipe. At the cross-section of the pipe, linear variable displacement transducers (LVDTs) were installed to measure deformations. Two LVDTs were positioned at the springlines, and one LVDT was pointed at the crown to measure horizontal and vertical deflections, respectively. The load cell and LVDTs were connected to an automatic data acquisition system for simultaneous data recording. During testing, personnel were assigned to different locations near the testing setup to monitor crack initiation and propagation. The load value at a 0.30 mm crack width was carefully noted by multiple operators. Additionally, the maximum load value acting on the pipe was recorded. Load was continuously applied until excessive deformations occurred in the tested pipe. At this stage, the load value remained constant. The load was then stopped, and the complete cracking pattern was mapped. Various pictorial views of the tested pipes were taken. Finally, with the help of a crane, the tested pipe specimen was removed from the TEBT assembly, and a new pipe was placed in to it for further testing. A total of eighteen pipes, as per the test matrix (Table 2), were tested, with two pipe replicates used for each combination.

4.2. Design of Experiment Methodology: Factorial Analysis

The design of an experiment is an efficient technique for dealing with a large set of data and factors to optimize the effects of various variables [36,37,38]. In this study, a 32 full factorial design was utilized to examine the contribution of the main factors and their interaction effects. Two factors, compressive strength and steel rebar reinforcement at three various levels (Table 1), were studied to evaluate the mechanical performance of the precast concrete pipes. These levels are considered as low (L), medium (M), and high (H) levels of concrete compressive strength and steel rebar reinforcement in precast pipes. A total of nine combinations (Figure 3 and Table 2) were tested based on the 32 factorial design, considering all the factors at various levels. All data were analyzed and processed using the Minitab Statistical package.
The studied response variable was the crack load at 0.30 mm width and the ultimate load of the tested pipes. Equation (1) shows the model for the response variables (y) corresponding to the chosen factors [30,39].
y = a 0 + a 1 f 1 + a 2 f 2 + a 12 2 f 1 f 2 + a 11 f 1 2 + a 22 f 2 2 + e
where ai are the regression coefficients, fi are the chosen factors, and e is the error.

5. Results

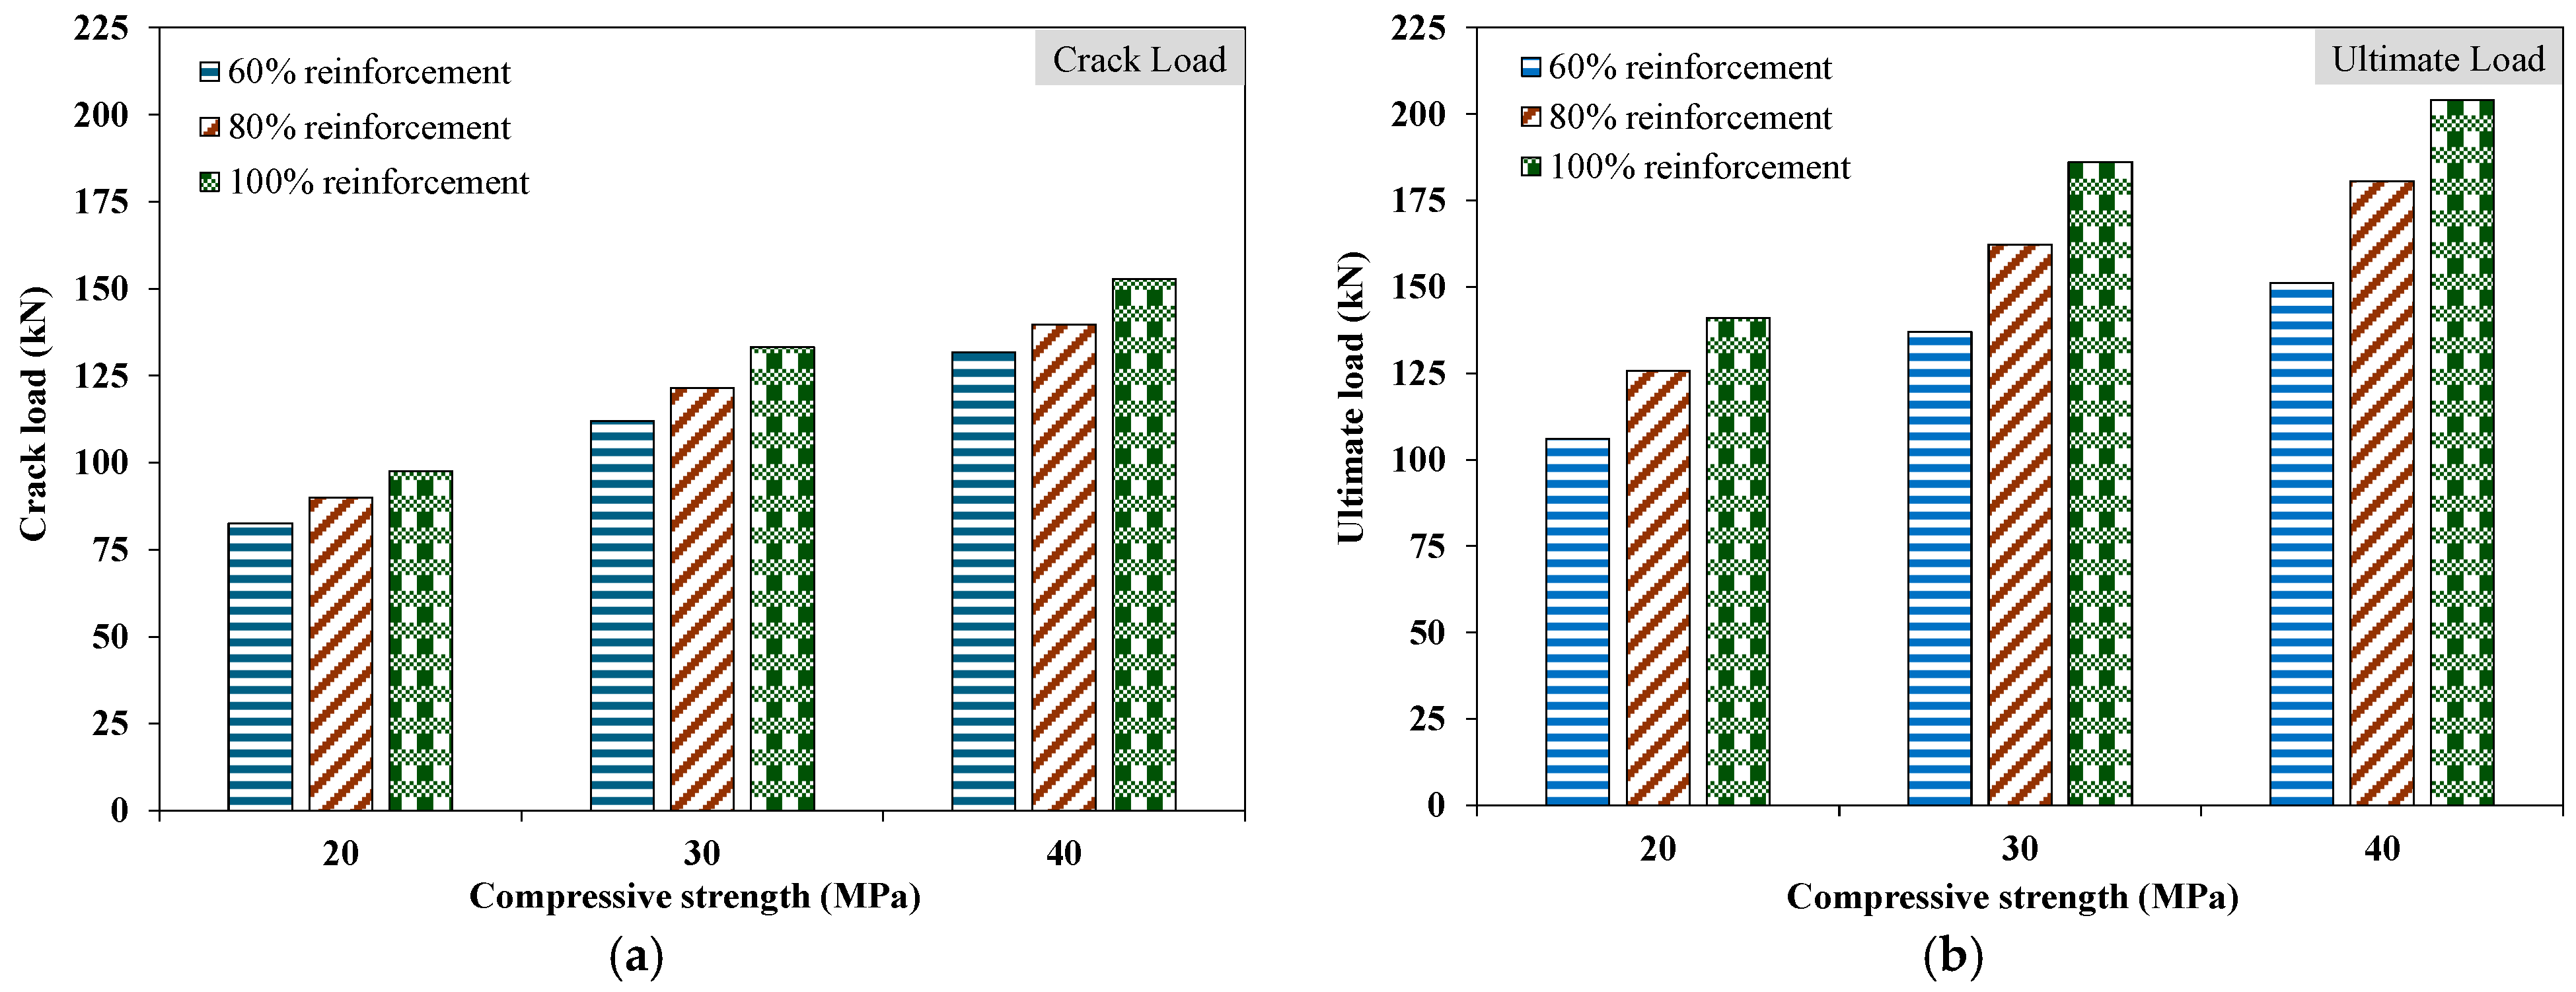
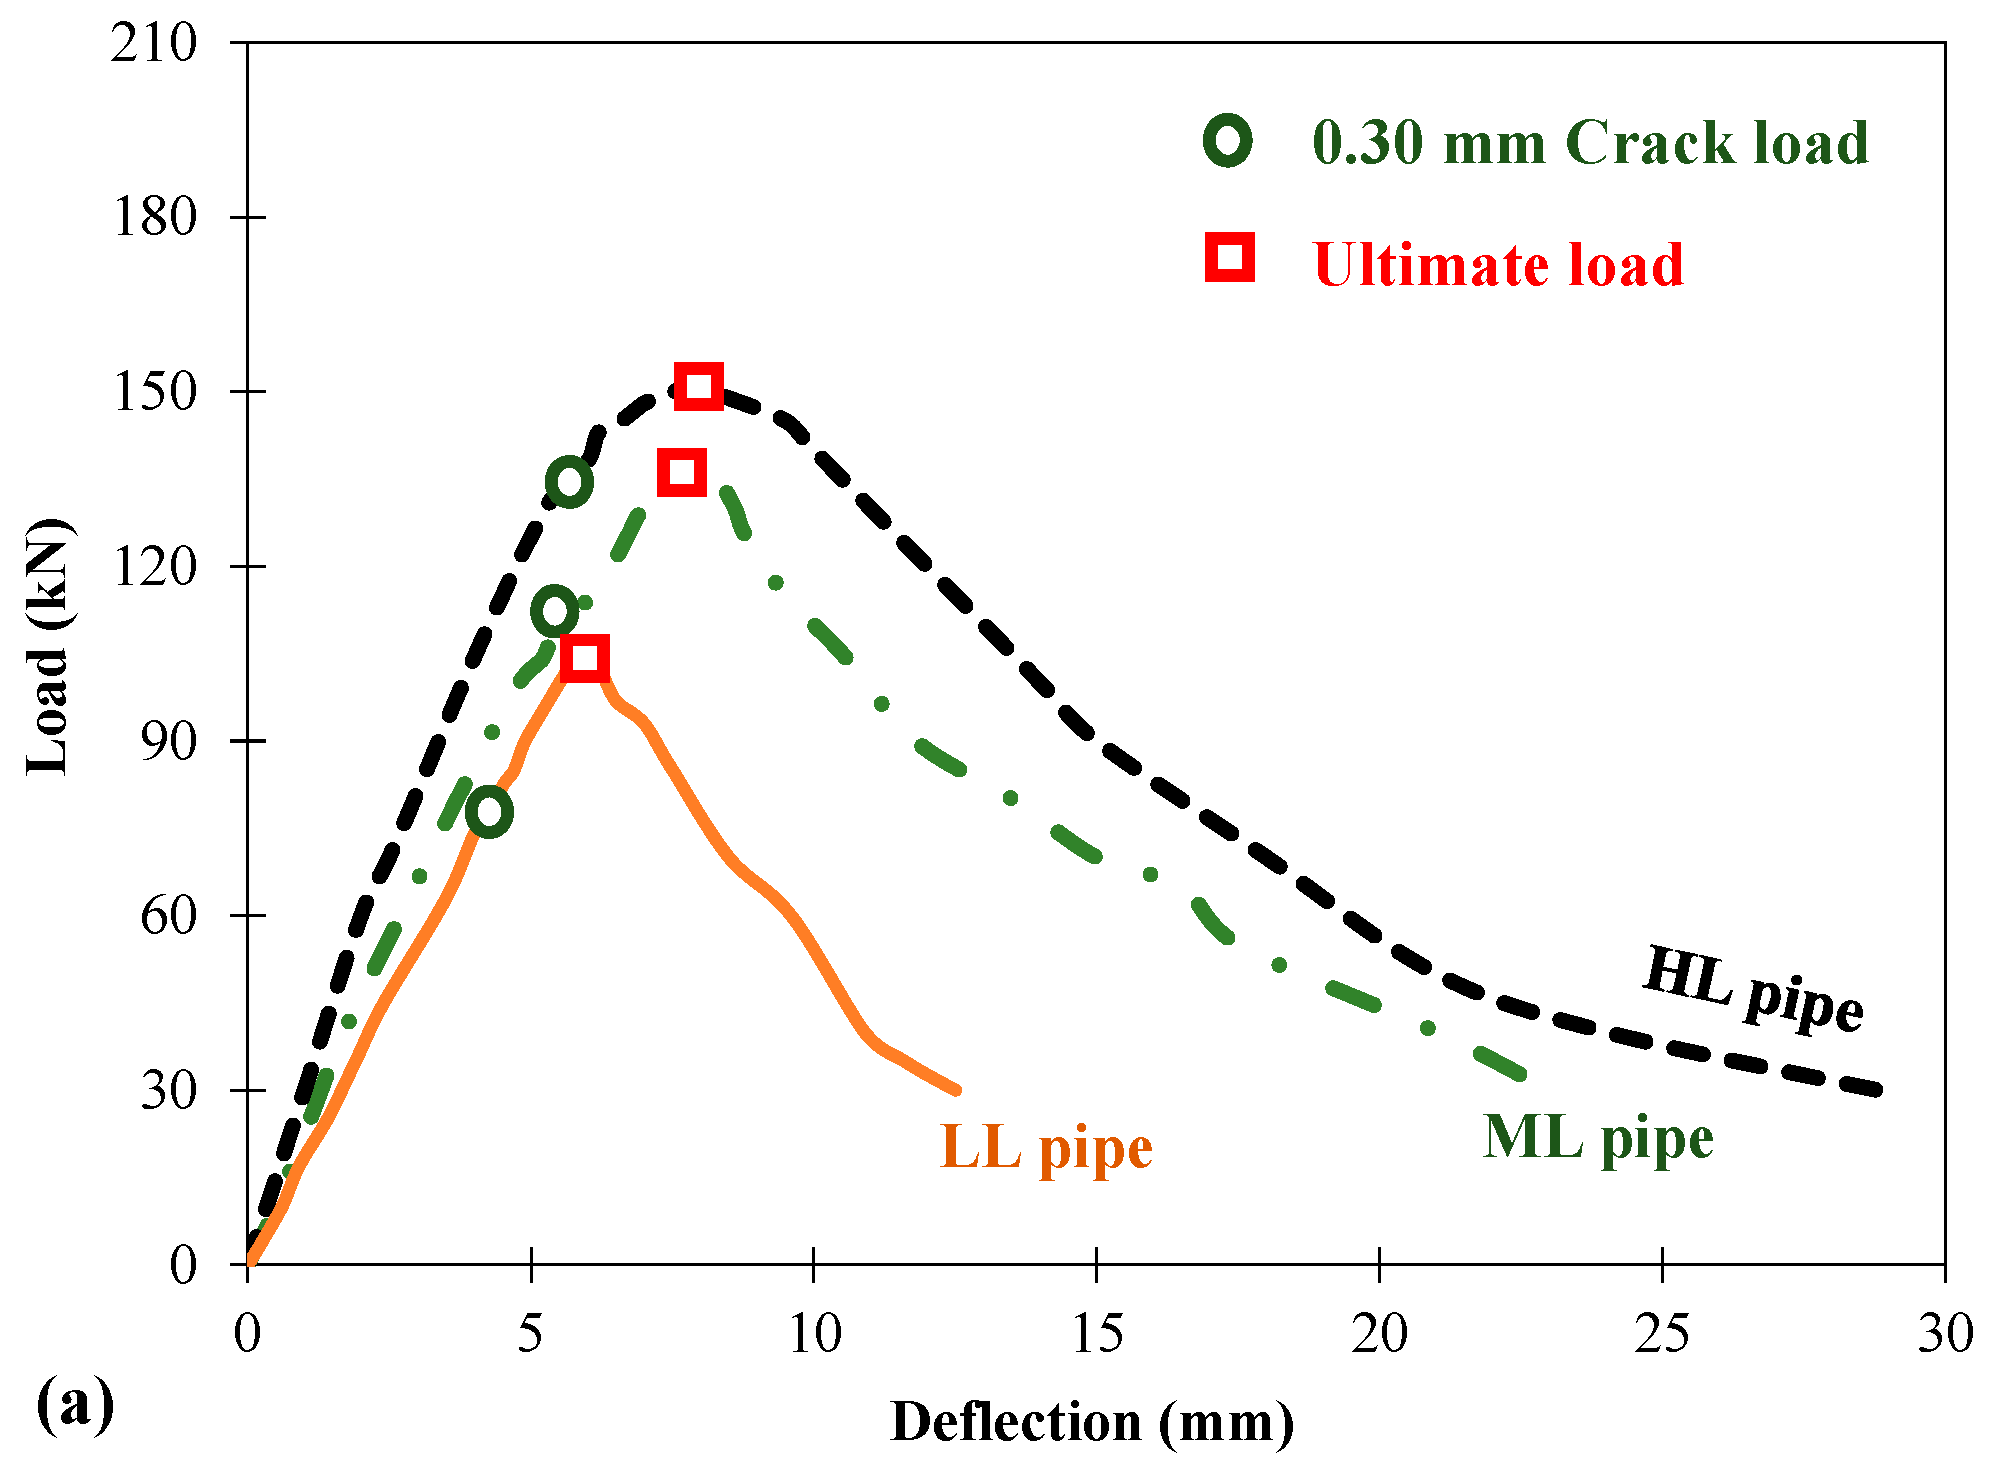
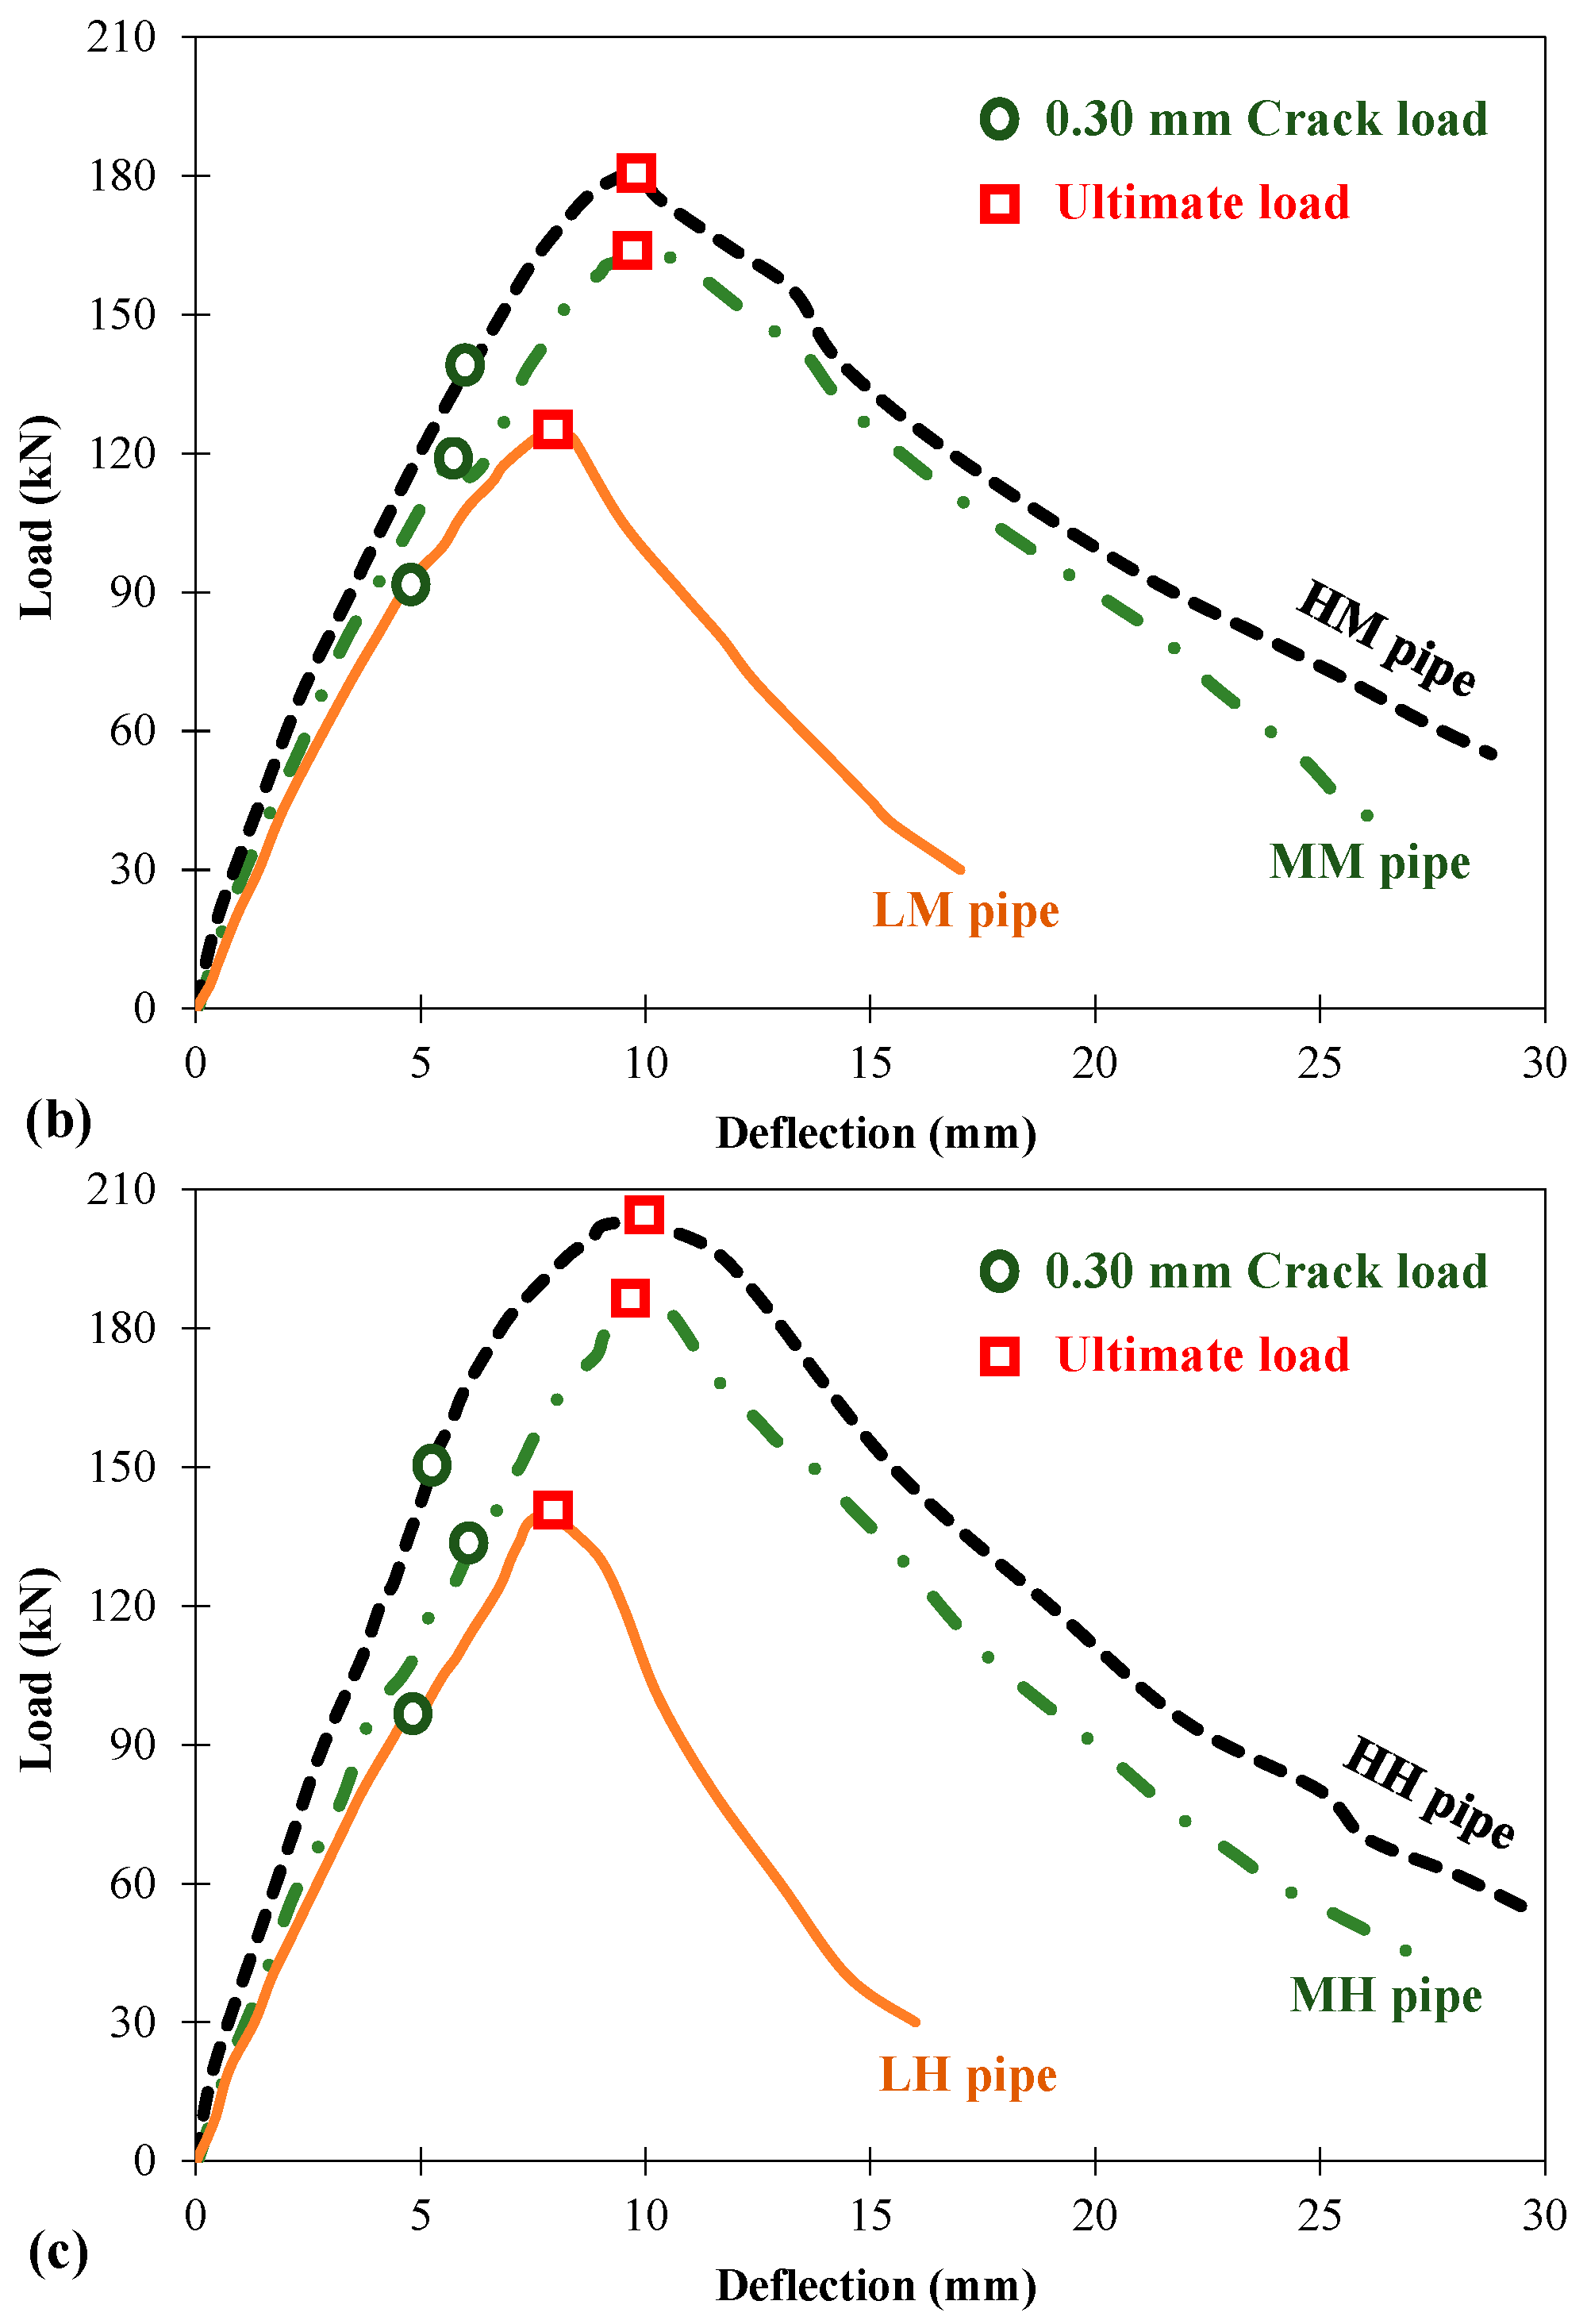
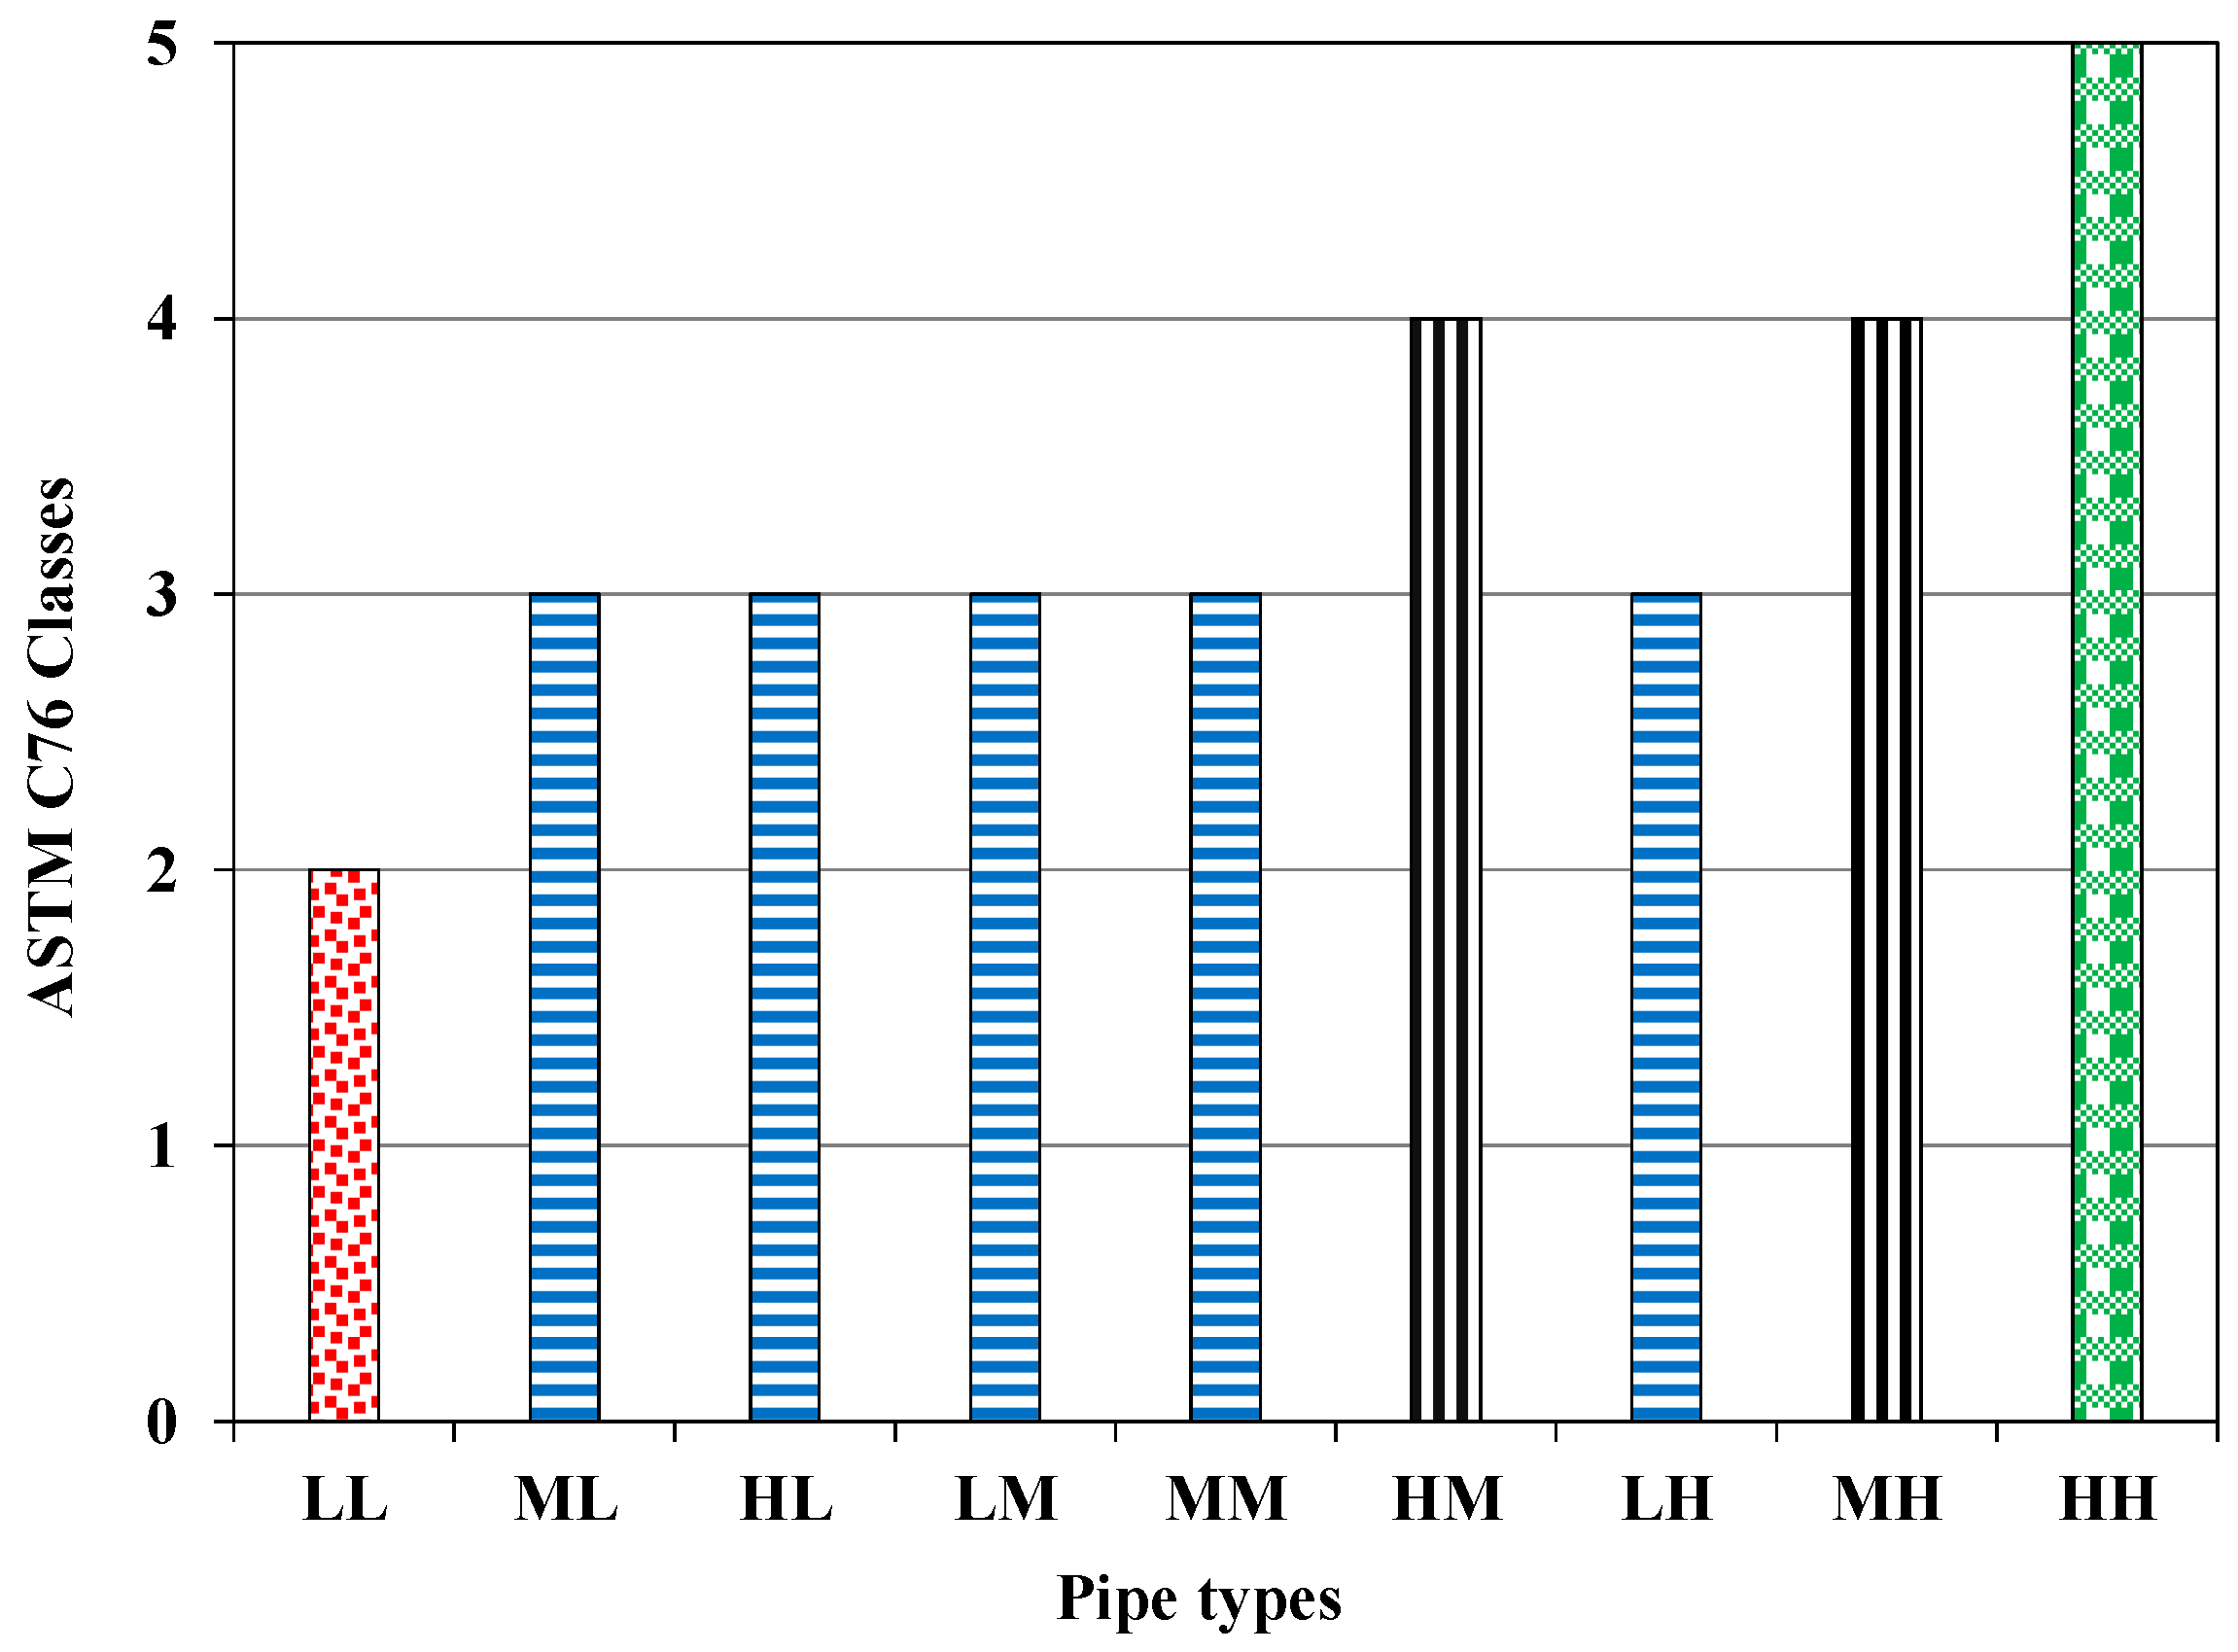
5.1. Crack and Ultimate Loads: Experimental Results

Under the three-edge bearing load, the crack load corresponding to various crack widths was determined by inserting crack width strips of various sizes into the cracks (Figure 13). The ultimate load is the maximum load recorded by the load cell applied through the loading jack. Table 4 shows the crack load at a 0.30 mm crack width and ultimate load for the tested pipes. Two replicates for each pipe type were tested, and insignificant differences in the results (crack and ultimate loads) were found among the replicates.
Figure 14 shows the average of two replicate pipes for the crack and ultimate loads of the tested pipes. It was observed that the crack load of the tested pipes increased with a higher level of concrete strength. For instance, the pipe specimen made with concrete of 20 MPa exhibited a 0.30 mm crack load of around 90 kN compared to 140 kN for an identical pipe with 40 MPa concrete compressive strength at an 80% reinforcement level. Similar trends of increased crack load with higher strength were observed for specimens with 60% and 100% of reinforcement levels.
Figure 15 shows the load versus vertical deflection for all of the tested pipes. The general trend of the load–deflection behavior of the tested pipes was comparable. Ascending and descending branches of the curve were observed, representing the behavior of the pipe’s deflection under the application of load. It was observed that the initial slope (stiffness) of the curve was relatively higher for pipes cast with higher concrete strength and reinforcement levels. In the ascending branch, a constant slope of the load–deflection plot was observed up to the cracking point. Afterwards, the slope of the curve changed and reached the ultimate point. A continuous decrease in the load-carrying capacity of pipes was noted in the descending branch of the load–deflection curve.
Figure 16 and Figure 17 show the cracking pattern of the various tested pipes. Typical flexural cracks were observed in all of the tested pipes. For example, initially, hairline cracks at the invert and crown levels were observed at around 25% of the peak load applied. Afterwards, at around 45% of the peak load, cracks at the springlines also developed and propagated (Figure 16). The crack width gradually increased as the load proceeded.
The crack width was continuously monitored with the help of crack strips (Figure 13) and the load at which the width increased to 0.30 mm was recorded. It was observed that the 0.30 mm crack load increased from 83 kN to 132 kN when the concrete strength was increased from 20 MPa to 40 MPa for pipe specimens with 60% reinforcement. However, for the same concrete strength, the levels of reinforcement had relatively less significant impact on the 0.30 mm crack load. For instance, the 0.30 mm crack load of a pipe specimen exhibited 90 kN at 80% reinforcement level compared to 97 kN at 100% reinforcement level with a similar concrete strength of 20 MPa. It was observed that the pipe specimens cast with lower-strength concrete (i.e., 20 MPa) also exhibited crushing of the concrete at the crown zone of the pipe, along with the development of radial cracks (Figure 16b). After passing the 0.30 mm crack load, cracks propagated along the length of the pipes (Figure 17) and reached the ultimate load. The crack width at the ultimate load was higher than 2 mm (Figure 16c) for all of the tested pipes. Moreover, at some locations, multiple cracks were also observed after achieving the ultimate load (Figure 16d).
It was observed that the ultimate load was significantly affected by the reinforcement levels. For instance, a pipe specimen with 60% reinforcement exhibited an ultimate load of 151 kN compared to 181 kN for a specimen with 80% of reinforcement, which further increased to 204 kN for a specimen with 100% reinforcement for the identical 40 MPa concrete strength. Moreover, a pipe specimen with 60% reinforcement showed around 42% higher ultimate load for 40 MPa concrete compared to that of an identical specimen made with 20 MPa concrete. After reaching the peak load, the crack width increased significantly, especially for pipes cast with lower-strength concrete and lower reinforcement levels. Near the final failure, the tested pipes exhibited excessive deformation along with the significant widening of cracks at critical locations.
Figure 18 shows the classes of the tested pipes as per ASTM C76. For Class II, the 0.30 mm crack load (D0.3) and ultimate load (Du) limits are 50 and 75 kN/m/m, respectively. If D0.3 and Du loads are higher than 65 and 100 kN/m/m, respectively, the pipe can be categorized as Class III. For Class IV pipes, the D0.3 and Du loads limits are 100 and 150 kN/m/m, respectively. Similarly, for a pipe to be classified as Class V, the D0.3 and Du loads need to satisfy the 140 and 175 kN/m/m limits, respectively, as per ASTM C76. The tested pipes HL, MH, and HH, exhibited Class III, IV, and V, respectively, for 40 MPa concrete strength at various reinforcement levels. The tested pipes ML, MM, and MH can be classified as Class III, III, and IV respectively, for 30 MPa concrete based on their achieved D0.3 and Du loads. Similarly, pipes with 20 MPa concrete, i.e., the LL, LM, and LH combination, showed Class II, III, and III, respectively, at various reinforcement levels. It was observed that the classes of the pipes as per ASTM C76 were dominantly affected by the reinforcement levels; i.e., for the same concrete strength, the reinforcement levels changed the pipe class (Figure 18).

5.2. Factorial Analysis Results
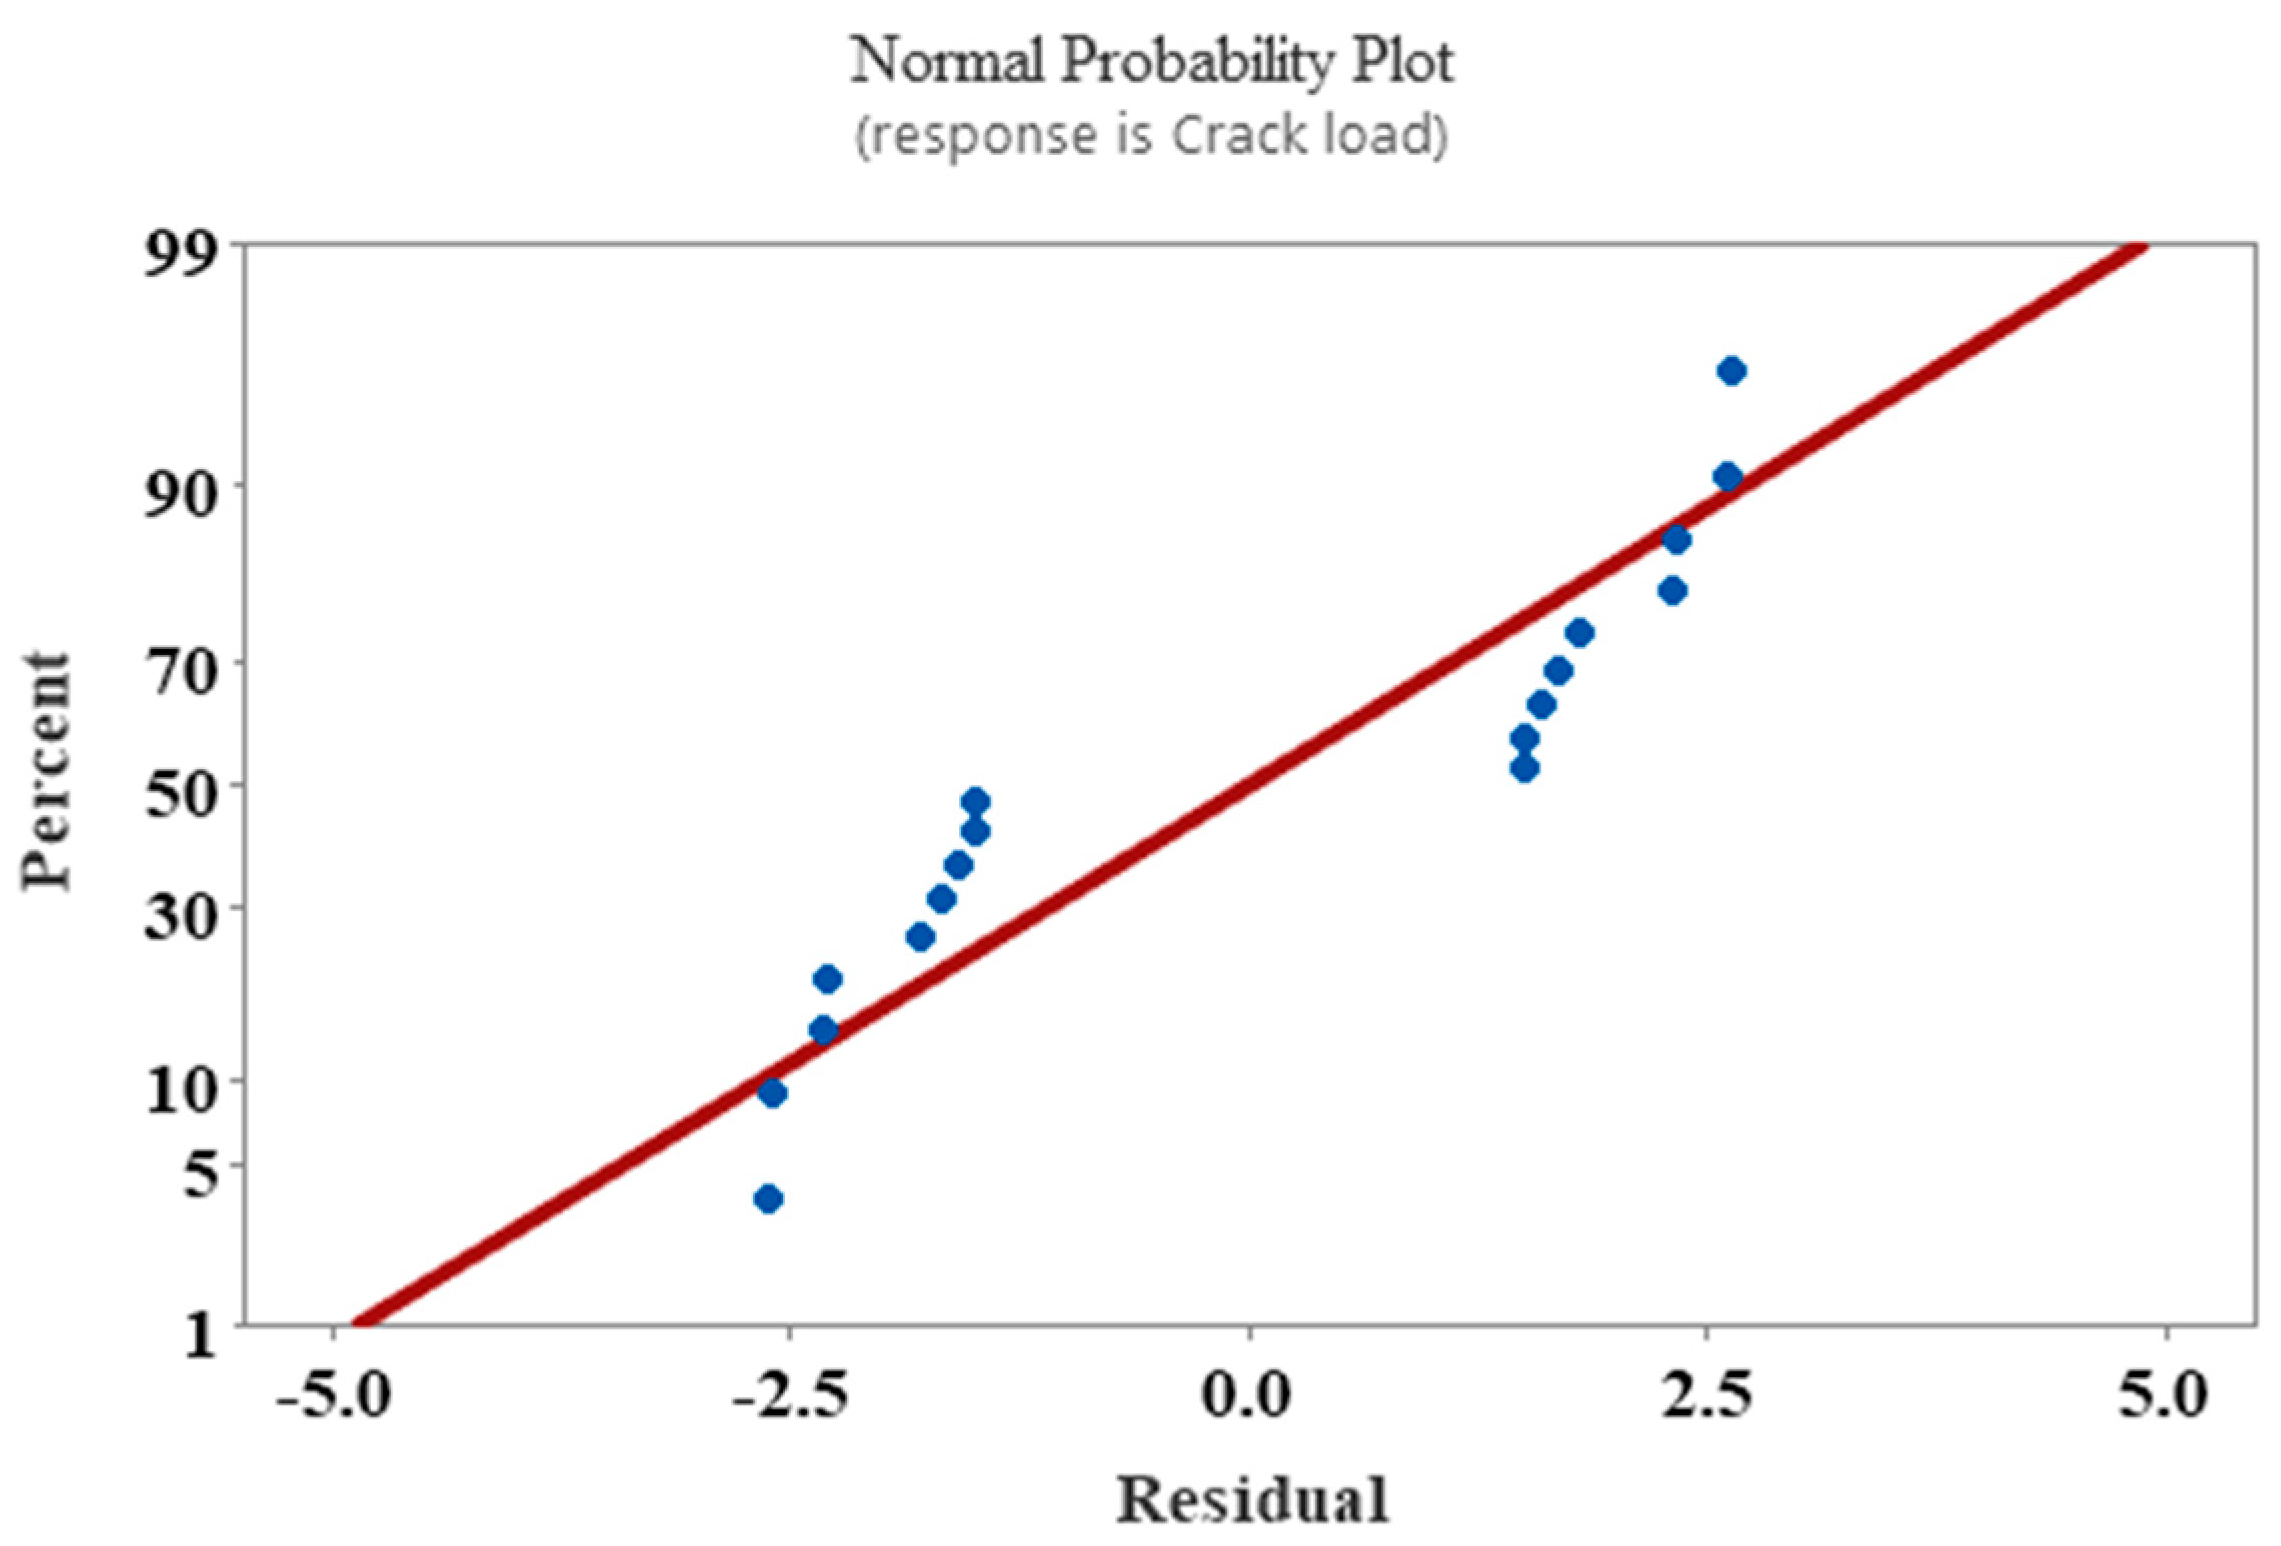
5.2.1. Crack Load

Table 5 shows the analysis of variance (ANOVA) for the response variable crack load. The regression coefficient (R2) for crack load response was 99.19%. The F-value was determined by dividing the mean square effect by the mean square error [40]. The F-value indicates the importance of individual factors and their interaction effects on the response variables. A higher F-value indicates a greater contribution of that particular factor. The ANOVA results (Table 5) showed that the individual factors (concrete strength and reinforcement) had higher F-values compared to their interaction effects. Moreover, concrete strength had a higher F-value compared to the reinforcement factor. Therefore, it can be argued that the concrete strength significantly affected the crack load. A null hypothesis leads to rejection for a higher F-value [41]. Similarly, a p-value lower than 0.05 represents the significance of the factors. In this analysis, the interaction of factors showed p-value equal to 0.490 (higher than 0.050), indicating its non-significance towards the response variable (crack load). However, individual factors showed a p-value lower than 0.050, representing statistically significant factors. The p-value of 0.050 represents a 95% confidence interval.
Equation (2) shows the regression equation along with regression coefficients for determining the response variable (crack load).
C r a c k   l o a d = 117.89 27.82   C o n c r e t e   s t r e n g t h L + 4.30   C o n c r e t e   s t r e n g t h M + 23.51   C o n c r e t e   s t r e n g t h H 9.12   R e i n f o r c e m e n t L 0.85   R e i n f o r c e m e n t M + 9.98   R e i n f o r c e m e n t H
A Pareto chart was also plotted to observe the effects of main factors and their interactions on the crack load response. A t-test at a 95% confidence interval was performed and its value was 2.26, as shown in the Pareto chart (Figure 19) with a red dashed line on the vertical axis. In this study, it was observed that the concrete strength and reinforcement factors crossed the 2.26 value, indicating the significance of the main factors. However, their interactions were below the line (2.26), representing the insignificant effect of interaction on the crack load response. Figure 20 shows the normal probability graph for the crack load. This graph predicted the normal distribution of the data and analyzed the residual values. A few points deviated from the straight line; however, most of the values were aligned along the straight line (Figure 20). Similar findings were also reported in another study [41]. Figure 21 shows the main effect plots of concrete strength and reinforcement on the crack load. It was observed that the crack load increased when the level of concrete strength and reinforcement changed from a low level to a high level. Figure 22 shows the interaction plot of concrete strength and reinforcement for the crack load response. The interaction plot (Figure 22) showed parallel lines, indicating insignificant effects.

5.2.2. Ultimate Load

Table 6 shows the ANOVA for the response variable of ultimate load. The regression coefficient (R2) for the ultimate load response was 99.50%. The ANOVA results (Table 6) showed that the individual factors concrete strength and reinforcement have F-values of 526.24 and 356.22, respectively, in comparison with 5.21 for their interaction effects. A higher F-value indicates a significant effect on the ultimate load. Similarly, the p-values of individual factors and their interaction effects were lower than 0.05, representing their significant effect on the ultimate load.
Equation (3) shows the regression equation along with regression coefficients for determining the ultimate load response.
U l t i m a t e   l o a d = 154.87 30.62   C o n c r e t e   s t r e n g t h L   + 6.94   C o n c r e t e   s t r e n g t h M + 23.68   C o n c r e t e   s t r e n g t h H   23.50   R e i n f o r c e m e n t L + 1.25   R e i n f o r c e m e n t M   + 5.30   R e i n f o r c e m e n t H
Figure 23 shows the Pareto chart for the main factors and their interactions on the ultimate load response. A dashed red line along the vertical axis in Figure 23 represents the T-value (2.26). It was observed that the main factors and their interactions crossed the 2.26 threshold, indicating their significant effects on the ultimate load. Figure 24 shows the factorial plot for ultimate load. It was observed that the ultimate load increased when the levels of concrete strength and reinforcement changed from low to high levels.
From the factorial analysis, it may be argued that the main factors (concrete strength and reinforcement) are significant factors that affect the 0.30 mm crack load of the tested pipes. However, their interaction effects were insignificant on the crack load response. On the other hand, the main factors and their interaction effects were dominant on the ultimate load of the precast reinforced concrete pipes.

6. Discussion

According to ASTM C76 [33], the minimum compressive strength for concrete pipes is 27.6 MPa. Similarly, for a 450 mm pipe, the reinforcement should be 150 mm2/m for Class II and III pipes [33]. In developing countries, the normal spinning method of pipe casting is used for the manufacture of full-scale precast concrete pipes. In this method of casting, wet concrete is poured inside the mold while it rotates over spin-cast runners. Due to centrifugal forces, the heavier material (i.e., aggregates) settles towards the outer edge of the pipe’s wall and the matrix slurry moves to the inside. Moreover, exact control over the concrete mixture design (especially the water content) is very challenging when using the spin-cast methodology. The pipes are taken out from their respective molds after 24 days to achieve a certain strength. In the spin-cast technique, pipes are usually placed in water ponds or the water sprinkling technique is used rather than the more advanced steam method for accelerating curing. This will ultimately affect the desired concrete strength and the pipe’s performance. Abbas et al. (2025) [21] compared various types of pipe casting methods and materials and their effects on the overall performance of precast concrete pipes. The rebars used in the manufacture of reinforcement cages are made from unsegregated scrap in developing countries, which may affect the overall performance of the reinforced concrete pipes. Moreover, it was observed that the local precast factories used reinforcement cages that only marginally satisfied the ASTM C76 guidelines [33]. Therefore, the optimum utilization of materials for pipe casting through the spin-cast technique for various intended applications is vital for long-term and sustainable infrastructure.
In the present study, it was observed that the concrete compressive strength and the amount of reinforcement are vital factors that affect the mechanical performance of pipes. For instance, concrete pipes made with higher-compressive-strength concrete (40 MPa) showed an approximately 55% increase in 0.30 mm crack load compared to identical pipes made with 20 MPa-strength concrete. Similarly, when the concrete strength increased from 20 MPa to 40 MPa, the ultimate strength of the pipes increased by 43%. Therefore, it may be argued that concrete compressive strength has a more dominant effect on the initial cracking behavior of pipes. This advocates the optimum use of a concrete mixture design for achieving the desired crack and ultimate loads for economical pipe infrastructure. Similarly, it was observed that reinforcement levels from 60% to 100% have a significant effect on the ultimate load-carrying capacity (more than 35%) of the pipes for all of the tested concrete strengths. This effect highlights the significance of optimizing the steel rebar reinforcement for pipes subjected to extreme environmental and loading conditions. Faisal et al. (2023, 2024) [4,5] reported similar observations in that the amount of reinforcement has significant effect on the ultimate load-carrying capacity of pipes. Chao and Kuo (2018) [42] optimized various reinforcement- and concrete-related parameters for the ultimate strength of concrete pipes. It was reported that the optimum value of wire diameter and its winding pitch were 6.5 mm and 33 mm, respectively, for reinforcement. Similarly, the water-to-cement ratio for the optimum ultimate strength of the pipe was found to be 33.5% [42].
Moreover, it was observed that the pipe with lower concrete strength and reinforcement levels exhibited a lower ASTM C76 class, indicating the importance of the optimum selection of pipe materials. Pipe classification, as per ASTM C76, is very important for pipe manufacturing stakeholders in terms of tailoring pipe specifications for the desired infrastructure needs. During experimental testing, cracks were observed at the critical zones of the pipe, indicating the potential weaker points in the pipe that need special attention during the design and manufacturing processes to prevent early cracking. The conducted factorial analysis also revealed that concrete compressive strength and reinforcement levels are important factors that affect the mechanical performance of concrete pipes. For ultimate load, it was observed that the individual factors (concrete strength and reinforcement) and their interactions have a dominant effect, as indicated by the ANOVA and Pareto charts.
The main contribution of this study is to underline the practical significance of choosing optimum materials for the precast plant industry in developing countries where economic and sustainable solutions are crucial for the development of resilient infrastructure. Local manufacturers can enhance the quality of spun-cast pipes using optimized materials to satisfy the requirements of various needs and requirements. This will not only lead to a more robust pipe infrastructure, but also contribute to an enhanced profit margin for the pipe manufacturers.

7. Summary and Conclusions

This research study aimed to explore the mechanical behavior of full-scale precast concrete pipes with different concrete compressive strengths and reinforcement levels. The concrete strengths investigated were 20, 30, and 40 MPa, representing the conventional strengths used in precast industries in developing countries. Three different reinforcement levels (125, 167, and 209 m2/mm) were also inspected, corresponding to low, medium, and high reinforcement levels. A test matrix was adopted by conducting a full-factorial 32 analysis, resulting in nine pipe combinations with different concrete strengths and reinforcement levels. Two replicates of each pipe combination were manufactured at the spin-cast assembly of an industrial precast plant.
The cast pipes, after 28 days of curing, were transferred to the laboratory and three-edge bearing tests were conducted on those pipes to evaluate their mechanical performance. It was observed that the concrete compressive strength had a significant effect on the 0.30 mm crack load. For instance, around a 55% increase in crack load was observed for a pipe cast with 40 MPa concrete compared to an identical pipe with 20 MPa concrete at 80% reinforcement level. Moreover, the concrete strength had a relatively lower effect on the ultimate load. For example, for the same pipe cast with 40 MPa concrete, the ultimate load increased by 43% compared to a pipe cast with 20 MPa concrete at an 80% reinforcement level. The reinforcement level had a more significant effect on the ultimate load-carrying capacity of the pipes. For instance, around a 35% increase in the ultimate load of the pipes was observed when the reinforcement level changed from 60% to 100% for all tested concrete strengths. The pipes with lower levels of concrete strength (20 MPa) and reinforcement levels (60%) exhibited 0.30 mm crack and ultimate loads of 82 and 106 kN, respectively. Higher values of crack and ultimate loads of 152 and 204 kN were observed for the pipe made with 40 MPa concrete and a 100% reinforcement level.
It was observed that the higher concrete strengths and reinforcement levels changed the class of the pipes. The tested LL pipe exhibited a 0.30 mm crack load and ultimate load of over 50 and 75 kN/m/m, respectively, representing Class II according to ASTM C76. Similarly, the ML pipe exhibited a Class III pipe, and the MH pipe showed a Class IV pipe according to ASTM C76. All of the tested pipes showed cracking patterns at their critical zones near the invert, crown, and springlines. Moreover, concrete crushing of the pipe was also noted near the crown zone for pipes cast with low-strength concrete and reinforcement levels (LL pipe). The crack width after reaching the ultimate load was higher than 2 mm for all of the tested pipes.
The analysis of variance (ANOVA) for the response variable crack load showed that the individual factors (concrete compressive strength and reinforcement) had significant effects, as the p-value was lower than 0.05. No effect of the interaction between the main factors was evident in terms of crack load, as indicated by the Pareto chart. On the other hand, for the pipes’ ultimate load, it was observed that both the main factors and their interaction effects had significant effects. It was observed that both the crack load and ultimate load increased when the concrete strength and reinforcement levels increased from a low level to a high level, as indicated by the main effect plots of the factorial analysis.
This study will assist in the potential use of locally available spin-cast techniques for pipe casting using optimized concrete strength and reinforcement levels. It is envisioned that the quality issues related to the casting procedures used in local pipe industries in developing countries will be addressed, providing a more efficient and cost-effective solution with the use of optimized materials for concrete pipe casting. Moreover, the provision of technical training for pipe manufacturer stakeholders for the adoption of advanced practices of material selection and fabrication processes will ensure the quality of the produced pipe products. This approach will contribute towards the development of high-performance and sustainable infrastructure.

Funding

This research received no external funding.

Institutional Review Board Statement

Not applicable.

Data Availability Statement

All data is available in the manuscript.

Acknowledgments

The authors would like to thank the BSc and MSc students for assisting in the collection of various pictures and with the performance of experimental work. Moreover, the individuals associated with the Civil Engineering Department laboratory, UET, Lahore, Pakistan, are acknowledged.

Conflicts of Interest

The author declares no conflicts of interest.

References

  1. Joshi, N.G. Prestressed Concrete Pipes and Pipelines, 1st ed.; Alpha Science: Paris, France, 2012; 248p. [Google Scholar]
  2. Erdogmus, E.; Skourup, B.N.; Tadros, M. Recommendations for Design of Reinforced Concrete Pipe. J. Pipeline Syst. Eng. Pract. 2010, 1, 25–32. [Google Scholar] [CrossRef]
  3. Abel, T.; Pelczar, N. Modern Concrete Pipes: A Review of Reinforcement and New Technologies. Stud. Geotech. Mech. 2010, 43, 548–557. [Google Scholar] [CrossRef]
  4. Faisal, A.; Abbas, S.; Ahmed, A. Mechanical Performance of Spun-Cast Full-Scale Precast Pipes incorporating Hybrid Conventional Rebar Cage and Steel Fibers. Structures 2023, 52, 104–116. [Google Scholar] [CrossRef]
  5. Faisal, A.; Abbas, S.; Khan, A.H.; Ahmed, I.; Shaukat, S. Field Buried and Laboratory Investigation of Full-Scale Eco-friendly Spun-Cast Concrete Pipes under Various Construction Loading Regimes. Tunn. Undergr. Space Technol. 2024, 149, 105813. [Google Scholar] [CrossRef]
  6. Nedal, M. Experimental and Numerical Study on Full-Scale Precast Steel Fibre-Reinforced Concrete Pipes. Ph.D. Thesis, University of Western Ontario, London, ON, Canada, 2015. Available online: https://ir.lib.uwo.ca/etd/2795 (accessed on 14 December 2024).
  7. Ramadan, A.; Shehata, A.; Younis, A.; Wong, L.S.; Nehdi, M. Modeling Structural Behavior of Precast Concrete Pipe with Single Elliptical Steel Cage Reinforcement. Structures 2020, 27, 903–916. [Google Scholar] [CrossRef]
  8. Sun, Y.; Huang, Y.; Yin, Y.; Wang, Y.; Hu, S. Experimental and Numerical Study of a Rebar-prestressed Cylinder Concrete Pipe (RPCCP) under Internal Load. Materials 2022, 15, 7771. [Google Scholar] [CrossRef] [PubMed]
  9. Hata, M.; Sato, M.; Miyazawa, S. Experimental Study on the Application of Cementless Material with Industrial By-products to Steam-cured Precast Concrete Products. Materials 2022, 15, 7624. [Google Scholar] [CrossRef] [PubMed]
  10. Alshboul, O.; Almasabha, G.; Shehadeh, A.; Al Hattamleh, O.; Almuflih, A.S. Optimization of the Structural Performance of Buried Reinforced Concrete Pipelines in Cohesionless Soils. Materials 2022, 15, 4051. [Google Scholar] [CrossRef]
  11. Ancaș, A.D.; Țurcanu, F.-E.; Verdes, M.; Hudisteanu, S.V.; Cherecheș, N.C.; Popovici, C.G.; Profire, M. Comparative Numerical Studies on the Structural Behavior of Buried Pipes subjected to Extreme Environmental Actions. Materials 2022, 15, 3385. [Google Scholar] [CrossRef]
  12. Merachtsaki, D.; Fytianos, G.; Papastergiadis, E.; Samaras, P.; Yiannoulakis, H.; Zouboulis, A. Properties and Performance of Novel Mg(OH)2 based Coatings for Corrosion Mitigation in Concrete Sewer Pipes. Materials 2020, 13, 5291. [Google Scholar] [CrossRef]
  13. Zhang, P.; Gong, C.; Wu, Q.; Zeng, C. Experimental Study on the Bearing Capacity of Reinforced Concrete Pipes with Corrosion-thinning Defects Repaired by UHP-ECC Mortar Spraying. Appl. Sci. 2023, 13, 7800. [Google Scholar] [CrossRef]
  14. Mei, Z.; Zhang, P.; Zeng, C. Experimental Study on Mechanical Properties of Rectangular Reinforced Concrete Pipe with Corrosion Defects. Appl. Sci. 2023, 13, 7570. [Google Scholar] [CrossRef]
  15. Li, P.; Zhang, W.; Ye, Z.; Wang, Y.; Yang, S.; Wang, L. Analysis of Acoustic Emission Energy from Reinforced Concrete Sewage Pipeline under Full-Scale Loading Test. Appl. Sci. 2022, 12, 8624. [Google Scholar] [CrossRef]
  16. Mostofizadeh, S.; Tee, K.F. Static and Seismic Responses of Eco-Friendly Buried Concrete Pipes with Various Dosages of Fly Ash. Appl. Sci. 2021, 11, 11700. [Google Scholar] [CrossRef]
  17. Zhang, Z.; Fang, H.; Li, B.; Wang, F. Mechanical Properties of Concrete Pipes with Pre-Existing Cracks. Appl. Sci. 2020, 10, 1545. [Google Scholar] [CrossRef]
  18. Basit, A.; Abbas, S.; Ajmal, M.M.; Mughal, U.A.; Kazmi, S.M.S.; Munir, M.J. Joint Behavior of Full-Scale Precast Concrete Pipe Infrastructure: Experimental and Numerical Analysis. Infrastructures 2024, 9, 69. [Google Scholar] [CrossRef]
  19. Zhai, K.; Zhang, C.; Fang, H.; Ma, H.; Ni, P.; Wang, F.; Li, B.; He, H. Mechanical Responses of Bell-and-Spigot Joints in Buried Prestressed Concrete Cylinder Pipe under Coupled Service and Surcharge Loads. Struct. Concr. 2021, 22, 827–844. [Google Scholar] [CrossRef]
  20. Wong, L.S.; Nehdi, M.L. Critical Analysis of International Precast Concrete Pipe Standards. Infrastructures 2018, 3, 18. [Google Scholar] [CrossRef]
  21. Abbas, S.; Faisal, A.; Khan, M.A.; Nehdi, M.L.; Hameed, R.; Shaukat, S. Systematic State-of-the-Art Review on Precast Concrete Pipes. Results Eng. 2025, 25, 103826. [Google Scholar] [CrossRef]
  22. Hongfang, L.; Cuiwei, L.; Xing, Z.; Haoyan, P.; Houming, N.; Tom, I. Prediction of Construction Traction Force for Corroded Pipeline Rehabilitation Using Multilayer Composite Liners. J. Pipeline Syst. Eng. Pract. 2025, 16, 04024080. [Google Scholar] [CrossRef]
  23. Liu, S.; Li, Y.; Zhang, Y.; Ma, M.; Qiu, W.; She, L.; Zhou, H.; Li, K.; Sun, K. Monitoring the Circumferential Cracking of Inner Concrete Core in Prestressed Concrete Cylinder Pipe during Wire-wrapping using Distributed Optical Fiber Sensors. Tunn. Undergr. Space Technol. 2025, 157, 106330. [Google Scholar] [CrossRef]
  24. Fang, H.; Sun, J.; Li, B.; Du, X.; Wang, N.; Di, D.; Zhai, K. Longitudinal and Circumferential Bending Moment Responses of Dislocated Concrete Pipes Rehabilitated with CIPP Liners under Traffic Loads. Tunn. Undergr. Space Technol. 2025, 155 Pt 1, 106222. [Google Scholar] [CrossRef]
  25. Li, C.; Hu, S.; Hu, Y.; Ye, Y. Investigating the Impact of Steam Curing Parameters on the Chloride Ion Penetration Resistance of the Prestressed Concrete Cylinder Pipe (PCCP) Protective Layer. J. Build. Eng. 2024, 92, 109777. [Google Scholar] [CrossRef]
  26. Pour, M.; Eskandari-Naddaf, H.; Pakzad, A. Linear and Non-linear SVM Prediction for Fresh Properties and Compressive Strength of High Volume Fly Ash Self-compacting Concrete. Constr. Build. Mater. 2020, 230, 117021. [Google Scholar] [CrossRef]
  27. Alqadi, A.N.; Mustapha, B.; Naganathan, S.; Al-Kadi, Q.N. Development of Self-compacting Concrete using Contrast Constant Factorial Design. J. King Saud Univ.-Eng. Sci. 2013, 25, 105–112. [Google Scholar] [CrossRef]
  28. Coo, M.; Pheeraphan, T. Effect of Sand, Fly Ash, and Coarse Aggregate Gradation on Preplaced Aggregate Concrete studied through Factorial Design. Constr. Build. Mater. 2015, 93, 812–821. [Google Scholar] [CrossRef]
  29. Colette, D.A.; Martial, A.; Joseph, A.; Benjamin, Y.; Patrick, D. Optimization of the Compressive Strength of used Tire/Cement Phase Composite Concretes using a Full Factorial Design. Constr. Build. Mater. 2023, 404, 133252. [Google Scholar] [CrossRef]
  30. Mukharjee, B.; Barai, S. Assessment of the Influence of Nano-Silica on the Behavior of Mortar using Factorial Design of Experiments. Constr. Build. Mater. 2014, 68, 416–425. [Google Scholar] [CrossRef]
  31. Senff, l.; Hotza, D.; Repette, W.L.; Ferreira, V.M.; Labrincha, J.A. Mortars with Nano-SiO2 and Micro-SiO2 investigated by Experimental Design. Constr. Build. Mater. 2010, 24, 1432–1437. [Google Scholar] [CrossRef]
  32. Phanpheta, S.; Bangphan, S. Application of Full Factorial Design for Optimization of Production of Product Process by some Materials. J. Tianjin Univ. Sci. Technol. 2021, 54, 35–54. [Google Scholar]
  33. ASTMC76; Standard Specification for Reinforced Concrete Culvert, Storm Drain, and Sewer Pipe. American Society for Testing and Materials: West Conshohocken, PA, USA, 2022.
  34. ACI Committee 211. Guide for Selecting Proportions for No-Slump Concrete (ACI 211.3R-02); American Concrete Institute: Farmington Hills, MI, USA, 2009. [Google Scholar]
  35. ASTM C497; Standard Test Methods for Concrete Pipe, Concrete Box Sections, Manhole Sections, or Tile. American Society for Testing and Materials: West Conshohocken, PA, USA, 2020.
  36. Madadi, A.; Tasdighi, M.; Eskandari-Naddaf, H. Structural Response of Ferrocement Panels incorporating Lightweight Expanded Clay and Perlite Aggregates: Experimental, Theoretical and Statistical Analysis. Eng. Struct. 2019, 188, 382–393. [Google Scholar] [CrossRef]
  37. Rezaifar, O.; Hasanzadeh, M.; Gholhaki, M. Concrete made with Hybrid Blends of Crumb Rubber and Metakaolin: Optimization using Response Surface Method. Constr. Build. Mater. 2016, 123, 59–68. [Google Scholar] [CrossRef]
  38. Azimi-Pour, M.; Eskandari-Naddaf, H. Synergistic Effect of Colloidal Nano and Micro-silica on the Microstructure and Mechanical Properties of Mortar using Full Factorial Design. Constr. Build. Mater. 2020, 261, 120497. [Google Scholar] [CrossRef]
  39. Montgomery, D. Design and Analysis of Experiments, 9th ed.; John Wiley & Sons Inc: Hoboken, NJ, USA, 2017; 749p. [Google Scholar]
  40. Bingol, D.; Tekin, N.; Alkan, M. Brilliant Yellow Dye Adsorption onto Sepiolite using a Full factorial design. Appl. Clay Sci. 2010, 50, 315–321. [Google Scholar] [CrossRef]
  41. Yong-Jie, H.; Cheng-Yong, H.; Yun-Ming, L.; Abdullah, M.; Yeng-Seng, L.; Ern-Hun, K.; Shee-Ween, O.; Wan-En, O.; Hui-Teng, N.; Yong-Sing, N. Strength Optimization and Key Factors Correlation of One-part Fly Ash/Ladle Furnace Slag (FA/LFS) Geopolymer using Statistical Approach. J. Build. Eng. 2023, 63 Pt A, 105480. [Google Scholar] [CrossRef]
  42. Chao, L.; Kuo, C. Optimizing the Ultimate Strength of Precast Reinforced Concrete Pipes in Three-edge Bearing Tests. Struct. Concr. 2018, 19, 1174–1184. [Google Scholar] [CrossRef]
Figure 1. Concrete compressive strength used in local pipe factories for manufacturing concrete pipes.
Infrastructures 10 00029 g001
Figure 2. Steel rebar reinforcement used in local pipe factories for casting concrete pipes.
Infrastructures 10 00029 g002
Figure 3. Factorial design of tested pipe combinations.
Infrastructures 10 00029 g003
Figure 4. Pipe casting materials in precast pipe unit: (a) steel rebars, (b) crush, (c) sand.
Infrastructures 10 00029 g004
Figure 5. Manufacturing of reinforcement cage for pipes: (a) manual cutting of rebars, (b) manufacturing of steel rings, (c) rebar steel cage.
Infrastructures 10 00029 g005
Figure 6. Concrete pipe casting through the spinning technique: (a) pipe mold and steel cage, (b) transfer of pipe mold with steel cage to the spin-cast assembly, (c) mixing of concrete ingredients, and (d) manual placement of concrete into the pipe mold while on spin-cast rollers.
Infrastructures 10 00029 g006
Figure 7. Inner surface of prepared concrete pipes.
Infrastructures 10 00029 g007
Figure 8. Prepared pipes after removal from the spin-cast assembly.
Infrastructures 10 00029 g008
Figure 9. Concrete pipe curing: (a) pipes immersed in water, (b) pipes cured through water sprinkling.
Infrastructures 10 00029 g009
Figure 10. Transportation of pipes to the laboratory: (a) pipes in truck and attachment of lifter cable, (b) pipes transferred to laboratory for testing purposes.
Infrastructures 10 00029 g010
Figure 11. Experimental test setup of three-edge bearing test for pipes.
Infrastructures 10 00029 g011
Figure 12. Schematic of three-edge bearing test setup for pipes: (a) longitudinal view, (b) cross-sectional view.
Infrastructures 10 00029 g012
Figure 13. Crack width measurement: (a) crack measurement leaf gauges, (b) illustration of crack measurement.
Infrastructures 10 00029 g013
Figure 14. Three-edge bearing test: (a) crack load, (b) ultimate load.
Infrastructures 10 00029 g014
Figure 15. Load–deflection curve of tested pipes: (a) pipe with 60% of reinforcement, (b) pipe with 80% of reinforcement, (c) pipe with 100% of reinforcement.
Infrastructures 10 00029 g015aInfrastructures 10 00029 g015b
Figure 16. Cracking pattern in tested pipes: (a) typical cracks observed in all tested pipes, (b) cracking and crushing at crown level in LL tested pipe (pipe with 20 MPa concrete and 60% reinforcement), (c) crack width measurement after achieving the peak load, and (d) multiple cracks at the invert level. (The red dashed line in the pictures shows the location of the developed cracks.).
Infrastructures 10 00029 g016aInfrastructures 10 00029 g016b
Figure 17. Longitudinal cracks near the springlines. (The red dashed line in the pictures shows the location of the developed cracks).
Infrastructures 10 00029 g017
Figure 18. Classes of tested pipes as per ASTM C76. (Different colors in the figure shows the different strength classes of pipes).
Infrastructures 10 00029 g018
Figure 19. Pareto chart for the crack load response.
Infrastructures 10 00029 g019
Figure 20. Normal probability graph for crack load response.
Infrastructures 10 00029 g020
Figure 21. Main effects plot for crack load. (The dashed line in the figure shows the average value of the response variable).
Infrastructures 10 00029 g021
Figure 22. Interaction plot of concrete strength and reinforcement. (* in the figure represents the combined or interaction symbol of two factors).
Infrastructures 10 00029 g022
Figure 23. Pareto chart for the ultimate load response.
Infrastructures 10 00029 g023
Figure 24. Main effects plot for ultimate load.
Infrastructures 10 00029 g024
Table 1. Details of manufactured pipes.
LevelsConcrete strength (C)Reinforcement (R)
Low (L)20 MPa60% (125 mm2/m)
Medium (M)30 MPa80% (167 mm2/m)
High (H)40 MPa100% (209 mm2/m)
Table 2. Test matrix for various tested pipe combinations.
Pipe TypePipe CombinationConcrete StrengthReinforcement
1LL20 MPa60%
2ML30 MPa60%
3HL40 MPa60%
4LM20 MPa80%
5MM30 MPa80%
6HM40 MPa80%
7LH20 MPa100%
8MH30 MPa100%
9HH40 MPa100%
Table 3. Concrete mixture design for pipe casting.
IngredientsMass/Cement Mass
20 MPa30 MPa40 MPa
Cement1.001.001.00
Coarse aggregates5.253.052.62
Fine Aggregates2.251.601.35
Water0.730.450.39
Table 4. Crack and ultimate load results.
PipesCrack Load (kN)Ultimate Load (kN)
Replicate 1Replicate 2AverageSD *Replicate 1Replicate 2AverageSD *
LL81.1284.1082.612.11104.26107.85106.062.54
ML113.52110.34111.932.25138.24135.78137.011.74
HL130.25133.24131.752.11148.24153.87151.063.98
LM88.2491.8590.052.55124.23127.12125.682.04
MM119.15123.75121.453.25164.5160.14162.323.08
HM137.28141.92139.603.28177.85183.15180.503.75
LH99.2495.8797.562.38142.95139.10141.032.72
MH130.58135.85133.223.73187.25184.95186.101.63
HH155.48150.25152.873.70201.25206.95204.104.03
* SD = Standard deviation.
Table 5. ANOVA results for response variable crack load.
SourceDFSSMSF-Valuep-Value
Concrete strength28072.354036.17483.900.000
Reinforcement21102.98551.4966.120.000
Concrete strength × Reinforcement
(interaction)
430.927.730.930.490
Error975.078.34
Total179281.31
DF = degree of freedom, SS = sum of squares, MS = mean square.
Table 6. ANOVA results for the response variable of ultimate load.
SourceDFSSMSF-Valuep-Value
Concrete strength29278.804639.40526.240.000
Reinforcement26281.003140.50356.220.000
Concrete strength × Reinforcement
(interaction)
4183.8045.945.210.019
Error979.308.82
Total1715,822.9
Disclaimer/Publisher’s Note: The statements, opinions and data contained in all publications are solely those of the individual author(s) and contributor(s) and not of MDPI and/or the editor(s). MDPI and/or the editor(s) disclaim responsibility for any injury to people or property resulting from any ideas, methods, instructions or products referred to in the content.

