Article

Effects of Gypsum and Limestone on Early-Age Hydration and Strength Optimization in Belite Calcium Sulfoaluminate Cement

1
Department of Materials Science and Engineering, Missouri University of Science and Technology, Rolla, MO 65409, USA
2
Hamilton High School, Chandler, AZ 85248, USA
3
School of Sustainable Engineering and the Built Environment, Arizona State University, Tempe, AZ 85287, USA
4
Civil and Environmental Engineering, University of California Los Angeles, Los Angeles, CA 90095, USA
*
Author to whom correspondence should be addressed.
Infrastructures 2025, 10(2), 27; https://doi.org/10.3390/infrastructures10020027
Submission received: 6 December 2024 / Revised: 4 January 2025 / Accepted: 17 January 2025 / Published: 21 January 2025

Abstract

:
Belite calcium sulfoaluminate cement (CSAB), an alternative to Portland cement, exhibits excellent strength at both early and later ages. However, due to its high belite content, the carbon reduction from this type of cement is not sufficient when compared to other alternative cements. To further enhance CSAB’s sustainability, this study investigates the performance of CSAB when partially replaced by low-carbon mineral additives (i.e., limestone and gypsum). The primary objective is to identify the optimal mixture design by incorporating gypsum and limestone to formulate a sustainable binder that maintains high compressive strength. The CSAB is replaced (with both additives) by up to 51% at two different liquid-to-solid ratios of 0.4 and 0.5. gypsum replacements ranging from 0% to 27%, resulting in three unique gypsum-to-ye’elimite molar ratios (M). Limestone replacements range from 0% to 30% in 10% increments. The investigation focuses on the development of hydrates, hydration kinetics, and compressive strength of the sustainable binders after 3 days. The results indicate that a higher replacement level of limestone provides more free water to react with ye’elimite and belite, thereby enhancing the hydration kinetics, but decreasing the compressive strength. It also shows that the addition of gypsum enhances the formation of ettringite, enabling the maintenance of great compressive strength within the binder even at high limestone replacement levels. The binder containing 12% gypsum and 20% limestone was identified as the optimal mixture, yielding a compressive strength of 39 MPa. This performance, when compared to the plain CSAB (compressive strength of 49 MPa), demonstrates that the optimized binder achieves adequate sustainability while maintaining mechanical properties without significant compromise.

1. Introduction

The worldwide demand for concrete is rapidly increasing, leading to the annual production of Portland cement (PC) reaching 4 billion tons, with an annual growth rate of 80 million tons [1,2]. However, this massive production contributes significantly to CO2 emissions (around 9% of the global emission) and consumes a substantial amount of energy (11 EJ/year) [3,4,5,6]. To address the significant CO2 emissions from PC production, the cement industry is exploring sustainable solutions such as alternative fuels [7], carbon capture technologies [8], clean energy [9], and innovative techniques [10,11,12] to reduce carbon footprint. Additional initiatives gaining popularity include using non-carbonated lime instead of limestone, reducing clinker-to-cement ratios, and developing cement-free binders [13]. To minimize the return-on-investment risks and to utilize current infrastructure to meet the cement demand, alternative cementitious binders like calcium sulfoaluminate (CSA) cement are being explored [14,15]. CSA cement is considered to be a low-carbon emission and environmentally beneficial infrastructural material. Compared to PC, CSA cement has lower limestone requirements and can also be manufactured at a lower temperature (~1250 °C) and requires less energy for grinding [16]. Therefore, CSA has the potential to reduce 30% of carbon emission and substantial energy consumption from the cement industry [17,18]. In addition to these benefits, significant amounts of industrial waste (e.g., fly ash, desulfurization sludge, incinerated municipal waste, etc. [19,20,21,22,23,24,25,26]) can be used to manufacture CSA cement, thereby reducing the overexploitation of natural minerals.
Despite the good energy and carbon efficiency of CSA cement, its widespread adoption in the construction industry has been hindered by its high cost and low strength at later ages. To resolve this, a new type of CSA [i.e., belite calcium sulfoaluminate (CSAB) cement] is being researched. CSAB cement requires less expensive aluminum feedstocks compared to conventional CSA cement. CSAB contains 40-to-60%wt of belite (Ca2SiO4; C2S. Cement chemistry notation: C = CaO; S = SiO2; A = Al2O3; $ = SO3; F = Fe2O3; H = H2O; C ¯ = CO2), and ye’elimite (Ca4(AlO2)6SO4; C4A3$) as its main phases [20,21], along with ferrite (Ca4Al2Fe2O10;C4AF) and gypsum (CaSO4.2H2O;C$H2) as its minor phases. Compared to CSA cement, CSAB cement has higher CO2 emissions due to the decomposition of limestone required for belite production. However, CSAB cement is gaining popularity since it shows improved mechanical properties compared to PC, especially at early ages [27]. The rapid setting of CSAB cement is mainly due to the quick hydration of ye’elimite to ettringite (C6A$3H32) formation. Due to the delayed hydration of belite, the long-term strength and durability of CSAB cement potentially exceed those of CSA. CSAB has shown good resistance to sulfate attacks and other chemical exposures [28,29] because ettringite can block pathways for aggressive ions, reducing the risk of degradation. Despite the high C2S in CSAB, the hydration of other CSAB components is similar to that of CSA. C4A3$ reacts with C$H2 in the presence of water leading to the formation of ettringite as the main crystalline hydration product and amorphous (short-order) aluminum hydroxide (AH3) [17,27,30,31,32,33]. Upon the depletion of C$H2, C4A3$ react with water to precipitate monosulfoaluminate (MSA) [30,34,35,36]. Moreover, C2S reacts with water to form calcium silicate hydrate (CSH) and portlandite (CH) [30,31,37,38]. In the presence of high concentrations of amorphous AH3, C2S will react with it, leading to the formation of straetlingite.
To reduce the carbon footprint associated with CSA cement, researchers have explored the partial replacement of CSA cements with mineral additives such as limestone (CaCO3; C C ¯ ) [39,40] and C$H2 [34,40]. In CSA cements, C4A3$ reacts with C C ¯ to form monocarboaluminate (MCA) or hemicarboaluminate (HCA), which reduces MSA formation, thereby, preventing the Cl ions from binding with the MSA to form Friedel salt [41,42]. The presence of MCA and/or HCA helps in providing additional strength to the binders [39,43,44,45,46]. The addition of C$H2 significantly influences the “M-ratio” in a CSAB binder. The “M-ratio” is the molar ratio of C$H2 to ye’elimite in a binder, which affects the hydration kinetics and compressive strength of CSA binders [16,27,33,47,48]. Zhang et al. [49] found that an M-ratio of 0-to-1.5 is typical for CSA cements showing fast setting, between 1.5-to-2.5 is self-stressing, and 2.5-to-6.0 shows expansive properties, while Hargis et al. [40] observed higher early-age compressive strength development in CSA replaced with 15% C$H2 at a liquid-to-solid ratio (L/s) of 0.5 when compared to plain CSA. Another study found that at an l/s of 0.55, the compressive strength of CSA increased with the addition of C$H2 [50]. However, García-Maté et al. [51] found contradictory results, indicating that higher replacement levels of C$H2 led to a deterioration in compressive strength at both l/s ratios of 0.4 and 0.5. Studies [39,40,52] found that C C ¯ addition at an M-ratio less than 2 showed the formation of HCA and/or MCA. All the existing literature has focused on maintaining a constant M-ratio (i.e., 2.0) in CSAB binders while incorporating C C ¯ ; however, the effect of higher M-ratios in conjunction with increased C C ¯ replacements has not been explored. This gap highlights an area worth investigating to better understand the potential for optimizing binder performance.
Most research has focused on enhancing the sustainability of CSA, but relatively few studies have explored improving the sustainability of CSAB, posing a significant knowledge gap in the understanding of the effects of mineral additives on its hydration kinetics and compressive strength. Furthermore, those studies explored the hydration kinetics and compressive strength of CSAB independently, without indicating underlying correlations between hydration kinetics, compressive strength, and microstructure. The contradicted findings from CSA exacerbate the challenge of effectively utilizing mineral additives in CSAB. Additionally, there is a prevailing assumption that high amounts of MCA could form in CSAB containing C C ¯ , despite the fact that C C ¯ ’s reactivity is kinetically limited. Prior research has not quantified the reactivity of C C ¯ and provided solid evidence to support this assumption. Therefore, these knowledge gaps highlight the importance of studying the influences of C$H2 and C C ¯ on the hydration kinetics and mechanical properties of CSAB cement.
This study investigates the influences of C C ¯ and C$H2 on the compressive strength, hydration kinetics, and microstructure development of CSAB binders. To achieve this, the replacement levels of C$H2 and C C ¯ range from 0 to 27% and 0 to 30% at an l/s of 0.4 and 0.5, respectively. The C$H2 replacement range enables the exploration of various M-ratios (2.29, 2.99, and 4.83) allowing for the investigation of the effects of different levels of C C ¯ replacement at these M-ratios on properties such as compressive strength, hydration kinetics, formed hydrates, and reactivities of C C ¯ and C$H2. Additionally, thermodynamic simulations are developed to understand the phase assemblages of CSAB binders at given ages, aiding in the interpretation of the hydration kinetics and strength development, and the elucidation of correlations between compressive strength and hydration kinetics. Moreover, the optimal mixture design that can achieve maximum sustainability without compromising strength is also explored. The findings from this research could accelerate the adoption of CSAB, thereby reducing carbon emissions from the cement sector.

2. Materials and Methods

2.1. Materials and Mixture Designs

In this study, commercially available CSAB (supplied by Buzzi Unicem, San Antonio, TX, USA) was utilized. Limestone (Mississippi Lime Company, Saint Louis, MO, USA) and gypsum (Alfa Asear, Tewksbury, MA, USA) powders were used as received without additional milling processes. The oxide composition of CSAB was measured using an X-Supreme8000 X-ray fluorescence system (XRF, Oxford Instruments, Aubney Woods, Abingdon, UK). The phase composition of the materials was determined using Quantitative X-ray Diffraction (QXRD, Philips, Panalytical X-Pert PRO diffractometer, Irvine, CA, USA), which confirmed the presence of C4A3$, β-C2S, C$H2, and CaCO3 as major phases, and minor phases like mayenite and gehlenite were also seen in CSAB. The particle size distribution (PSD) of each material was measured using a Microtrac (York, PA, USA) S3500 static light scattering particle size analyzer. The chemical composition, phase composition, median particle size, and specific surface area of CSAB are shown in Table 1. The particle size distribution of CSAB, gypsum, and limestone used in this study are shown in Figure 1.
In this study, CSAB was partially replaced by C$H2, and C C ¯ to achieve various gypsum-to-ye’elimite molar ratios (M) and limestone-to-binder ratios. The mixture design of each binder is shown in Table 2. The replacement level of limestone ranged from 10% to 30%, while the gypsum-to-ye’elimite ratio varied between 2.29 and 4.83. We believed that replacement levels below our minimum threshold would fail to achieve adequate carbon reduction, whereas higher replacement levels would significantly compromise performance. Two l/s ratios (e.g., 0.4 and 0.5) were applied to all binders. The dry powders were initially blended for 5 min to achieve homogeneity. Afterward, water was added to the binder, and the mixture was further blended for 5 min to ensure complete contact between the cement particles and water.

2.2. Characterization Techniques

X-ray powder diffraction (XRD) was performed on raw materials and selected binders. The hydrated samples were then cast into silicon molds and after 3 days the cubic samples were crushed into powders and isopropanol is added to stop the hydration. XRD patterns were obtained using a Panalytical X-Pert PRO diffractometer in standard continuous mode with a fixed divergence slit size of 0.125°. The scan was performed with a step size of 0.05° 2θ, covering a scan range from 5° to 90° with Kα1 wavelength of 1.54056 Å. The X-ray tube operated at 45 kV and 40 mA. The qualitative analysis was conducted on the XRD patterns using X’Pert HighScore Plus v5.1 software, incorporated with the ICSD (Inorganic Crystal Structure Data) diffraction database. The quantitative analysis was performed using Rietveld refinement (RIQAS4 v4 software, Materials Data Incorporated, Livermore, CA, USA).
Thermogravimetric Analysis (TGA) was performed on CSAB binders to evaluate the reactivity of C C ¯ and C$H2. TGA was conducted using an SDT600 instrument (TA Instruments, New Castle, DE, USA), featuring temperature and mass sensitivities of 0.25 °C and 0.1 µg, respectively. The samples were prepared for TGA on a time-bound basis. Each sample was measured at 72 h without the cessation of hydration and was then placed in a closed alumina pan and heated in a nitrogen atmosphere at a flow rate of 100 mL/min. The furnace temperature was increased to 900 °C at a constant ramp rate of 10 °C/min.
The heat release during the hydration of CSAB binders was measured using an isothermal microcalorimeter (TAM IV, TA Instruments v3.2). CSAB binders were mixed according to the abovementioned mixing protocol. The sample was then transferred into a glass ampoule and sealed with a Teflon cap. The microcalorimeter, maintained at 20 ± 0.2 °C, recorded the heat evolution profiles for 3 days.
Compressive strength of CSAB binders was measured based on ASTM C109 standards [53]. The binders were cast into cubic molds (6 mm × 6 mm × 6 mm) and cured at >98% relative humidity and 20 ± 0.1 °C for 3 days. Compressive strength testing was performed using an Instron-5881 (Instron, Norwood, MA, USA). The reported compressive strength was calculated from triplicate measurements.

2.3. Thermodynamic Modeling

To understand the phase assemblages of hydrated CSAB binders, thermodynamic simulation was performed using Gibbs Energy Minimization v3 software (GEMS). GEMS uses an extended Debye–Huckle method to calculate the activity coefficients of the aqueous species [54,55,56,57]. The Cemdata18 database was used as the main database for thermodynamic parameters [58]. The steps involved in performing thermodynamic simulations included the addition of standard inputs (i.e., oxide composition, l/s, temperature), and along with this the model also incorporated the reactivities of C$H2 and C C ¯ . Reactivity was assessed based on the ratio of the reacted compound to the total compound, as analyzed by TGA. The simulation was performed to model the phase formations and their volume at each degree of hydration of the CSAB binder. This approach ensured that the thermodynamic simulation could accurately represent the phase formations of [CSAB + C$H2 + C C ¯ ] binders. More details about the thermodynamic simulation can be found in our previous studies [54,55].

3. Results and Discussion

3.1. XRD Analysis

XRD analyses were performed on plain CSAB and selected [CSAB + C$H2 + C C ¯ ] binders after 3 days to understand the effect of C$H2 and C C ¯ replacements at l/s ratios of 0.4 and 0.5 on formed phases, as shown in Figure 2. The amorphous products (i.e., CSH and AH3) do not show peaks in XRD. Figure 2a compares the XRD patterns between plain CSAB and M(2.99) binders with different C C ¯ replacement levels at an l/s ratio of 0.4. The M(2.99) binder is chosen because at this composition, this mixture design allows C$H2 to clearly show its influences without becoming a major phase. In the plain CSAB, the XRD pattern shows the presence of ettringite, straetlingite, and MSA as the hydration products, which is in agreement with prior studies [52,59,60,61]. The anhydrous phases (i.e., ye’elimite, anhydrite, belite, and C C ¯ ) also appear in the XRD patterns, indicating the incomplete hydration of CSAB after 3 days. The belite peak is small due to the lower belite content relative to ye’elimite in CSAB, with some belite also reacting within 3 days. As the C C ¯ content increases, the intensity of C C ¯ peak at ~300 increases. Meanwhile, the increased C C ¯ leads to the formation of more ettringite, which can be attributed to the higher amount of free water available to react with ye’elimite. The intensity of the C$H2 peak remains relatively unchanged with varying C C ¯ replacement levels, suggesting that C C ¯ accelerates the hydration of ye’elimite rather than gypsum. A small peak at ~100 appears and can be associated with MSA, which suggests its minimum formation after 3 days. Theoretically, MSA should not form until all the gypsum content in the binder is completely depleted. However, the observed formation of MSA may be attributed to localized depletion of gypsum. The straetlingite peaks appear with very low intensity indicating its poor crystalline form, suggesting that AH3 reacts with belite within 3 days. C C ¯ may react with ye’elimite to form MCA, but the formation is too low to observe in XRD.
Figure 2b shows the XRD patterns for binders with an l/s of 0.5, revealing similar patterns to those observed in binders with an l/s of 0.4. However, the intensity of the C$H2 peak decreases as the C C ¯ replacement level increases. With more water (L/s = 0.5), the dissolution of ye’elimite significantly increases, leading to a sulfur deficiency for aluminate ions forming ettringite, which promotes gypsum dissolution to access additional sulfur. Meanwhile, the absence of MCA reinforces the notion that C C ¯ has extremely low reactivity.
Figure 3 presents the XRD patterns for binders where CSAB is replaced with 20% C C ¯ and varying M-ratio at l/s of 0.4 and 0.5. Ettringite is the primary hydration product that is affected by the M-ratio at both l/s ratios. As the M-ratio increases, the intensity of the C$H2 peak also rises, as expected, indicating that gypsum does not fully react within 3 days. Therefore, it is important to understand the reactivity of C$H2 to further perform thermodynamic simulations. The XRD analysis shows that more ettringite forms in binders with an l/s of 0.5, likely due to the increased water facilitating the dissolution of ye’elimite and gypsum, thereby accelerating ettringite formation. Interestingly, the intensity of the C C ¯ peak increases in binders with an l/s of 0.5 with increased gypsum content, a trend not observed in binders with an l/s of 0.4. As previously discussed, the l/s of 0.4 does not significantly enhance the reactivity of gypsum and ye’elimite. However, for l/s 0.5 binders, more amorphous AH3 forms, which could cover the surface of C C ¯ and interfere with the XRD scan. Palomino-ore et al. [62] have observed that the dissolved Al could precipitate as a coating on the calcite surface, which blocks ion transfer. When more gypsum is added, aluminate ions prefer to form ettringite with sulfur, leading to less AH3 formation. Consequently, less C C ¯ is covered by amorphous AH3, resulting in high peak intensity at high M-ratios. For l/s 0.4 binders, the amount of formed AH3 is not enough to affect XRD measurement. As can be seen in Figure 2, straetlingite is also formed but is affected by the M-ratio, i.e., as the M-ratio increases, the C2S content in the binder decreases. A small MSA peak is also observed. These XRD analyses provide insights into the phase formations in CSAB binders, which can further be used to validate thermodynamic simulations.

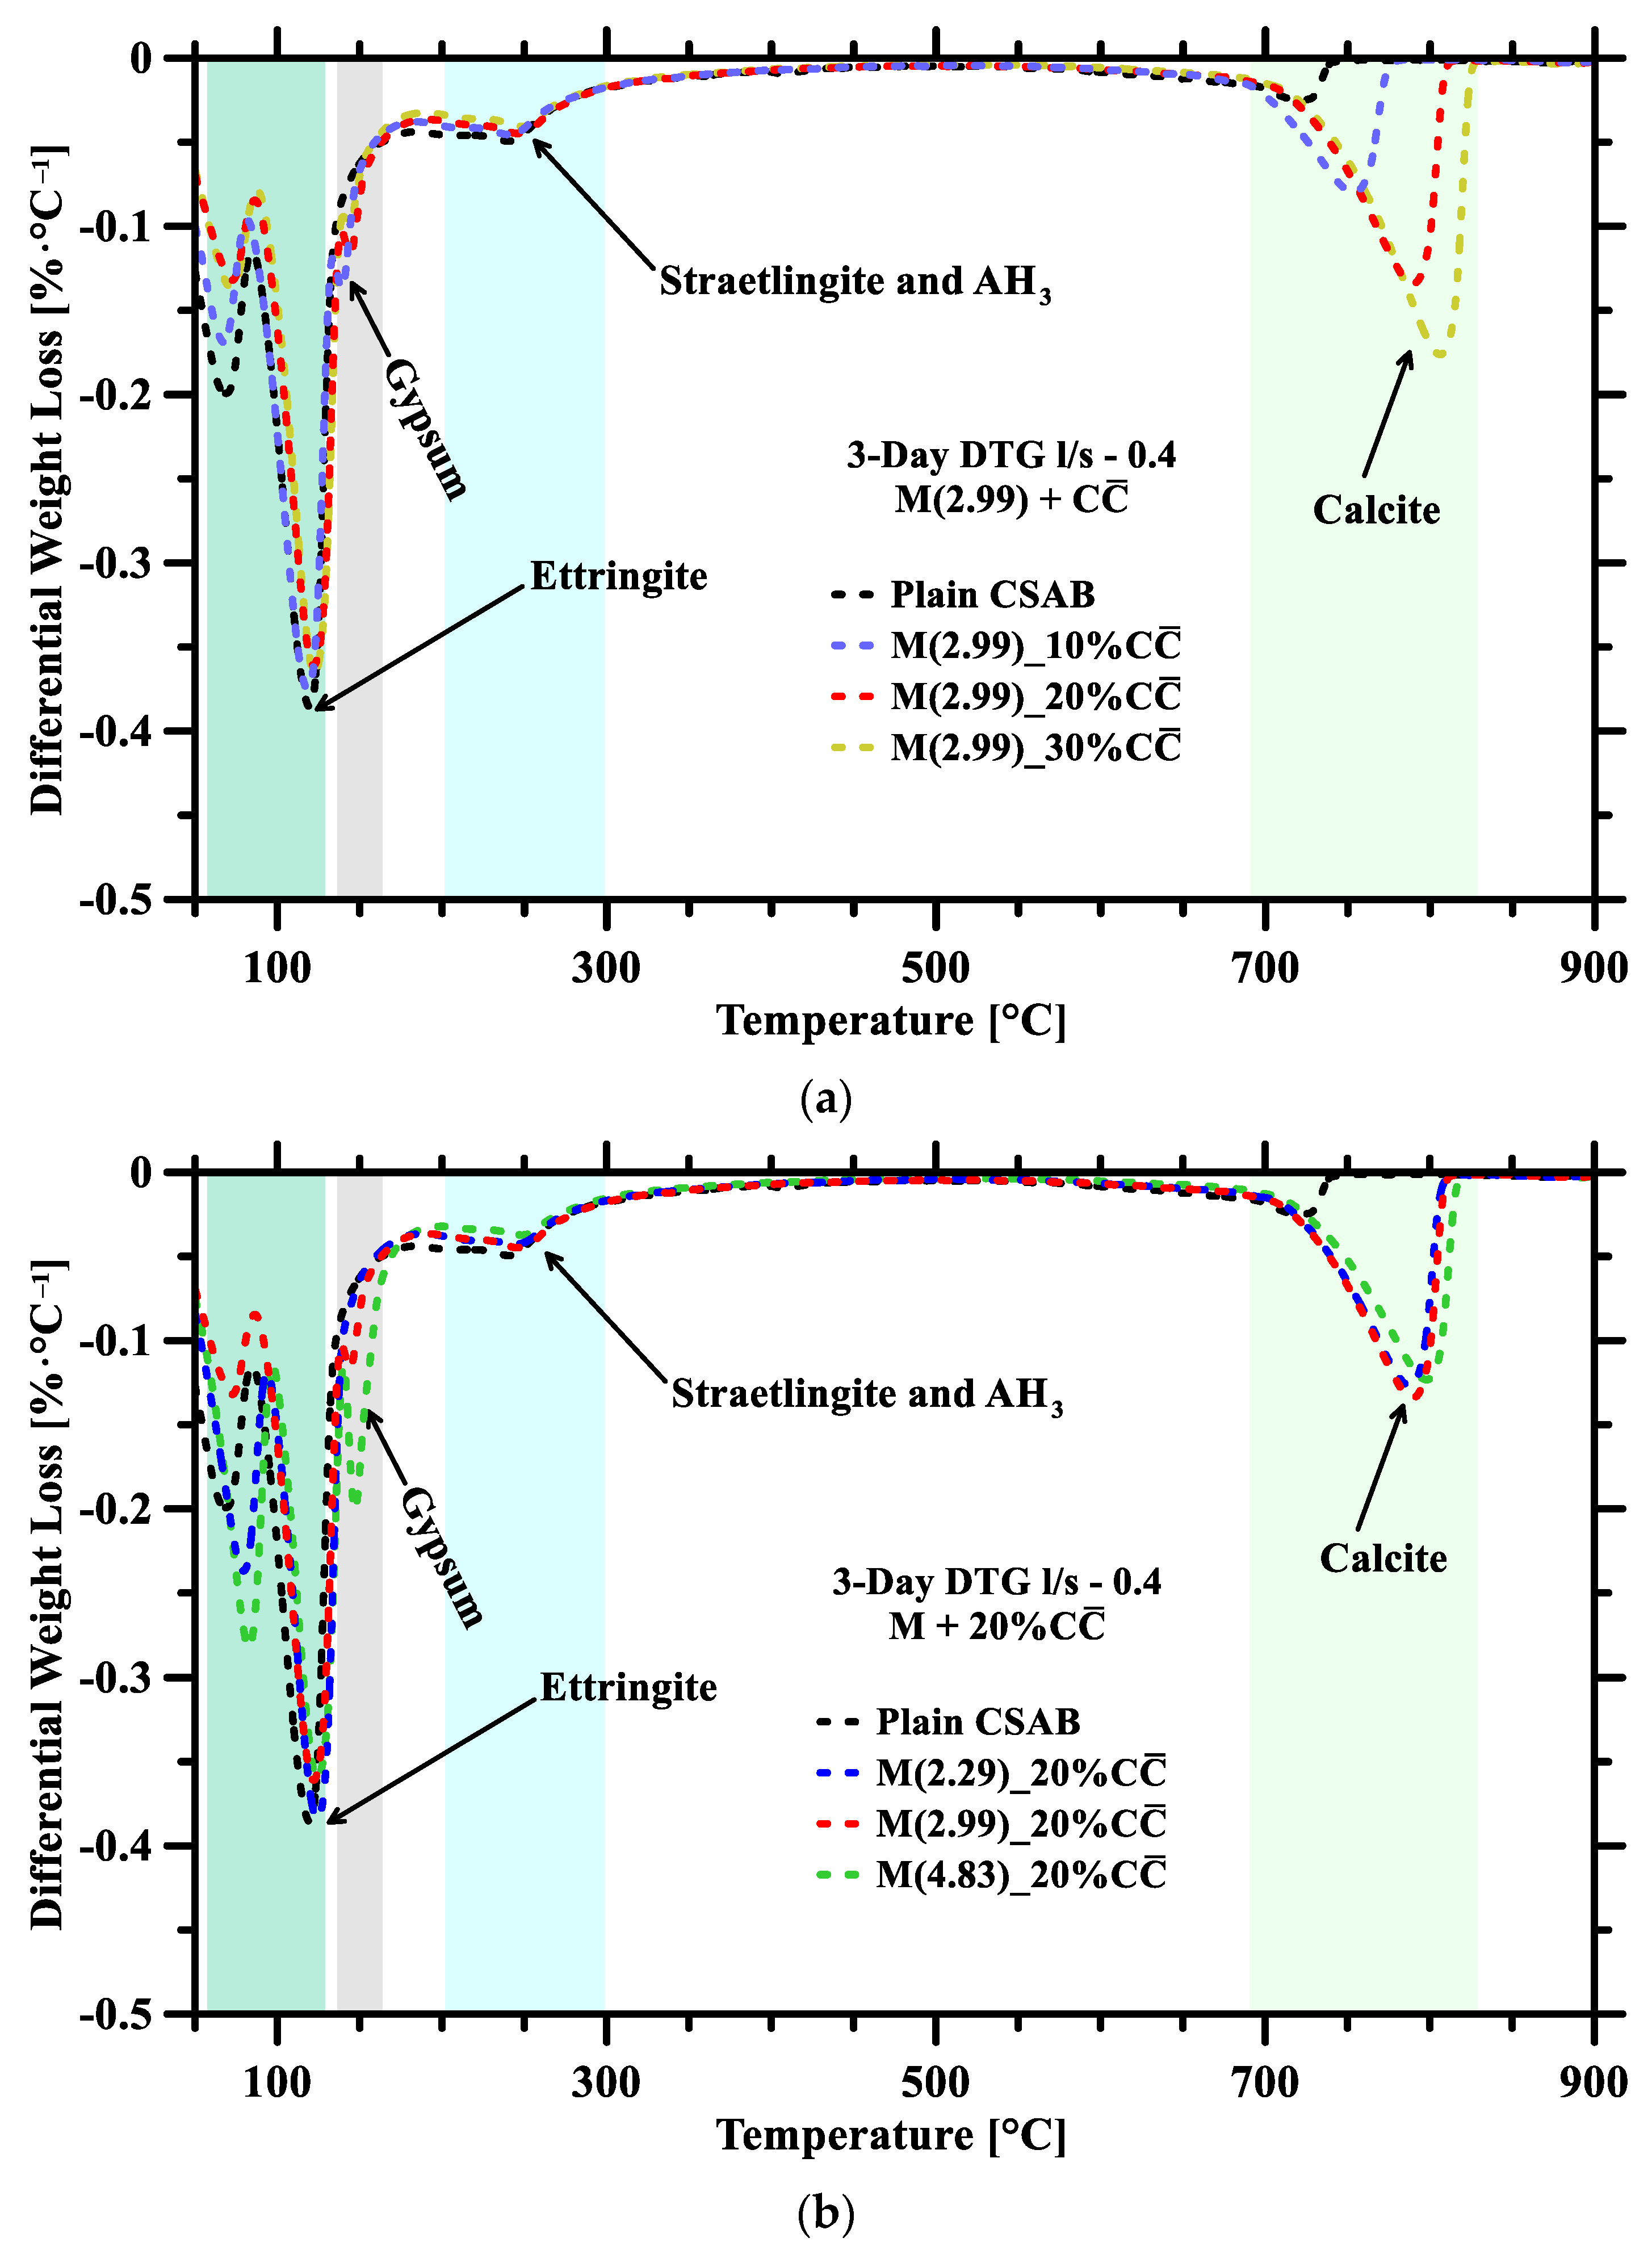
3.2. Thermogravimetric Analysis

This section presents the TGA analyses for CSAB binders, which reconfirms the formed hydrates and evaluates the degree of reaction of C C ¯ and C$H2 after 3 days. Figure 4 shows weight loss profiles of plain binders and selected [CSAB + C$H2 + C C ¯ ] binders (same binders for XRD) at an l/s of 0.4. The TGA analyses for the same representative binders at an l/s of 0.5 have been presented in the Supplementary Information. Four mass loss zones have been identified. A significant mass loss peak around 120 °C, observed for all binders, corresponds to the dihydroxylation of ettringite and CSH, consistent with prior studies [63,64]. At 150 °C, a small hump can be observed which is attributed to bonded water evaporation from C$H2. Similarly, the straetlingite and AH3 (added to the remanent of ettringite) loses bonded water between 200 °C and 300 °C [63]. C C ¯ is decarbonized between 700 °C and 850 °C [65].
Figure 4a shows the TGA profiles of M(2.99) binders with three C C ¯ replacement levels. The plain binder demonstrates the highest ettringite weight loss, consistent with the XRD patterns. On the other hand, the weight loss associated below 100 °C is a combination of both free water as well as bound water from CSH. This makes it difficult to estimate the weight loss from CSH formation alone. Hence, this weight loss is associated with CSH formation, as the amount of free water available for hydration is limited after 3 days. As the C C ¯ replacement level increases, the weight losses of ettringite and CSH decrease because of the reduced availability of ye’elimite and belite for hydration. However, the overall reactivity of CSAB increases due to higher availiable water, still leading to the formation of significant amounts of ettringite. At 150 °C, the mass loss associated with C$H2 in the plain binder is minimal, indicating ye’elimite consumes nearly all the C$H2, while the weight loss of C$H2 consistently decreases in M(2.99) binders as the C C ¯ replacement level increases because less C$H2 is in the binder and there is more free water to accelerate the hydration. A wide range of weight loss is seen between 200 °C and 300 °C, this can be attributed to the straetlingite and AH3 phases. It is also difficult to quantify the weight loss for these as both of their weight loss peaks align closely between the above-mentioned temperatures. The significant mass loss observed between 700 °C and 850 °C suggests that the reactivity of C C ¯ is limited. The quantification of phases like CSH, straetlingite, and AH3 appears to be difficult from these TGA profiles but the use of thermodynamic simulations might provide better validation for these phases.
Figure 4b demonstrates the TGA profiles for CSAB binders with 20% C C ¯ replacement at different M-ratios. The mass loss associated with ettringite is slightly higher in the M(2.29) binders compared to other M-ratios, which aligns with the XRD pattern. This is because the M(2.29) binders have sufficient ye’elimite and C$H2 to form ettringite, also resulting in lower gypsum weight loss for this binder. In contrast, excessive unreacted C$H2 remains in M(4.83) binders. Additionally, less straetlingite and AH3 are present in binders with higher C$H2 content, clearly due to the reduced cement content in the binders. The variation in weight loss due to C C ¯ decarbonization across different binders is negligible. The TGA profile for the binder with an l/s of 0.5 shows a similar pattern to that of the binder with an l/s of 0.4, but with more free water loss.
As variations in respective mass loss peaks for C$H2 and C C ¯ content were observed in the TGA analyses, it is important to calculate their respective consumption amounts, which will help in determining their reactivity. The relative reactivity of C$H2 and C C ¯ were determined by evaluating their initial and final weight in the binders. The reactivity values for all binders are shown in Supplementary Material (Figure S2). The average reactivities of C C ¯ in l/s 0.4 and 0.5 binders are 0.70% and 1.25%, respectively. The average reactivities of C$H2 in l/s 0.4 and 0.5 binders are 81.8% and 84.4%, respectively. These reactivity values will be used as important parameters to produce the phase assemblages of CSAB binders in thermodynamic simulations.

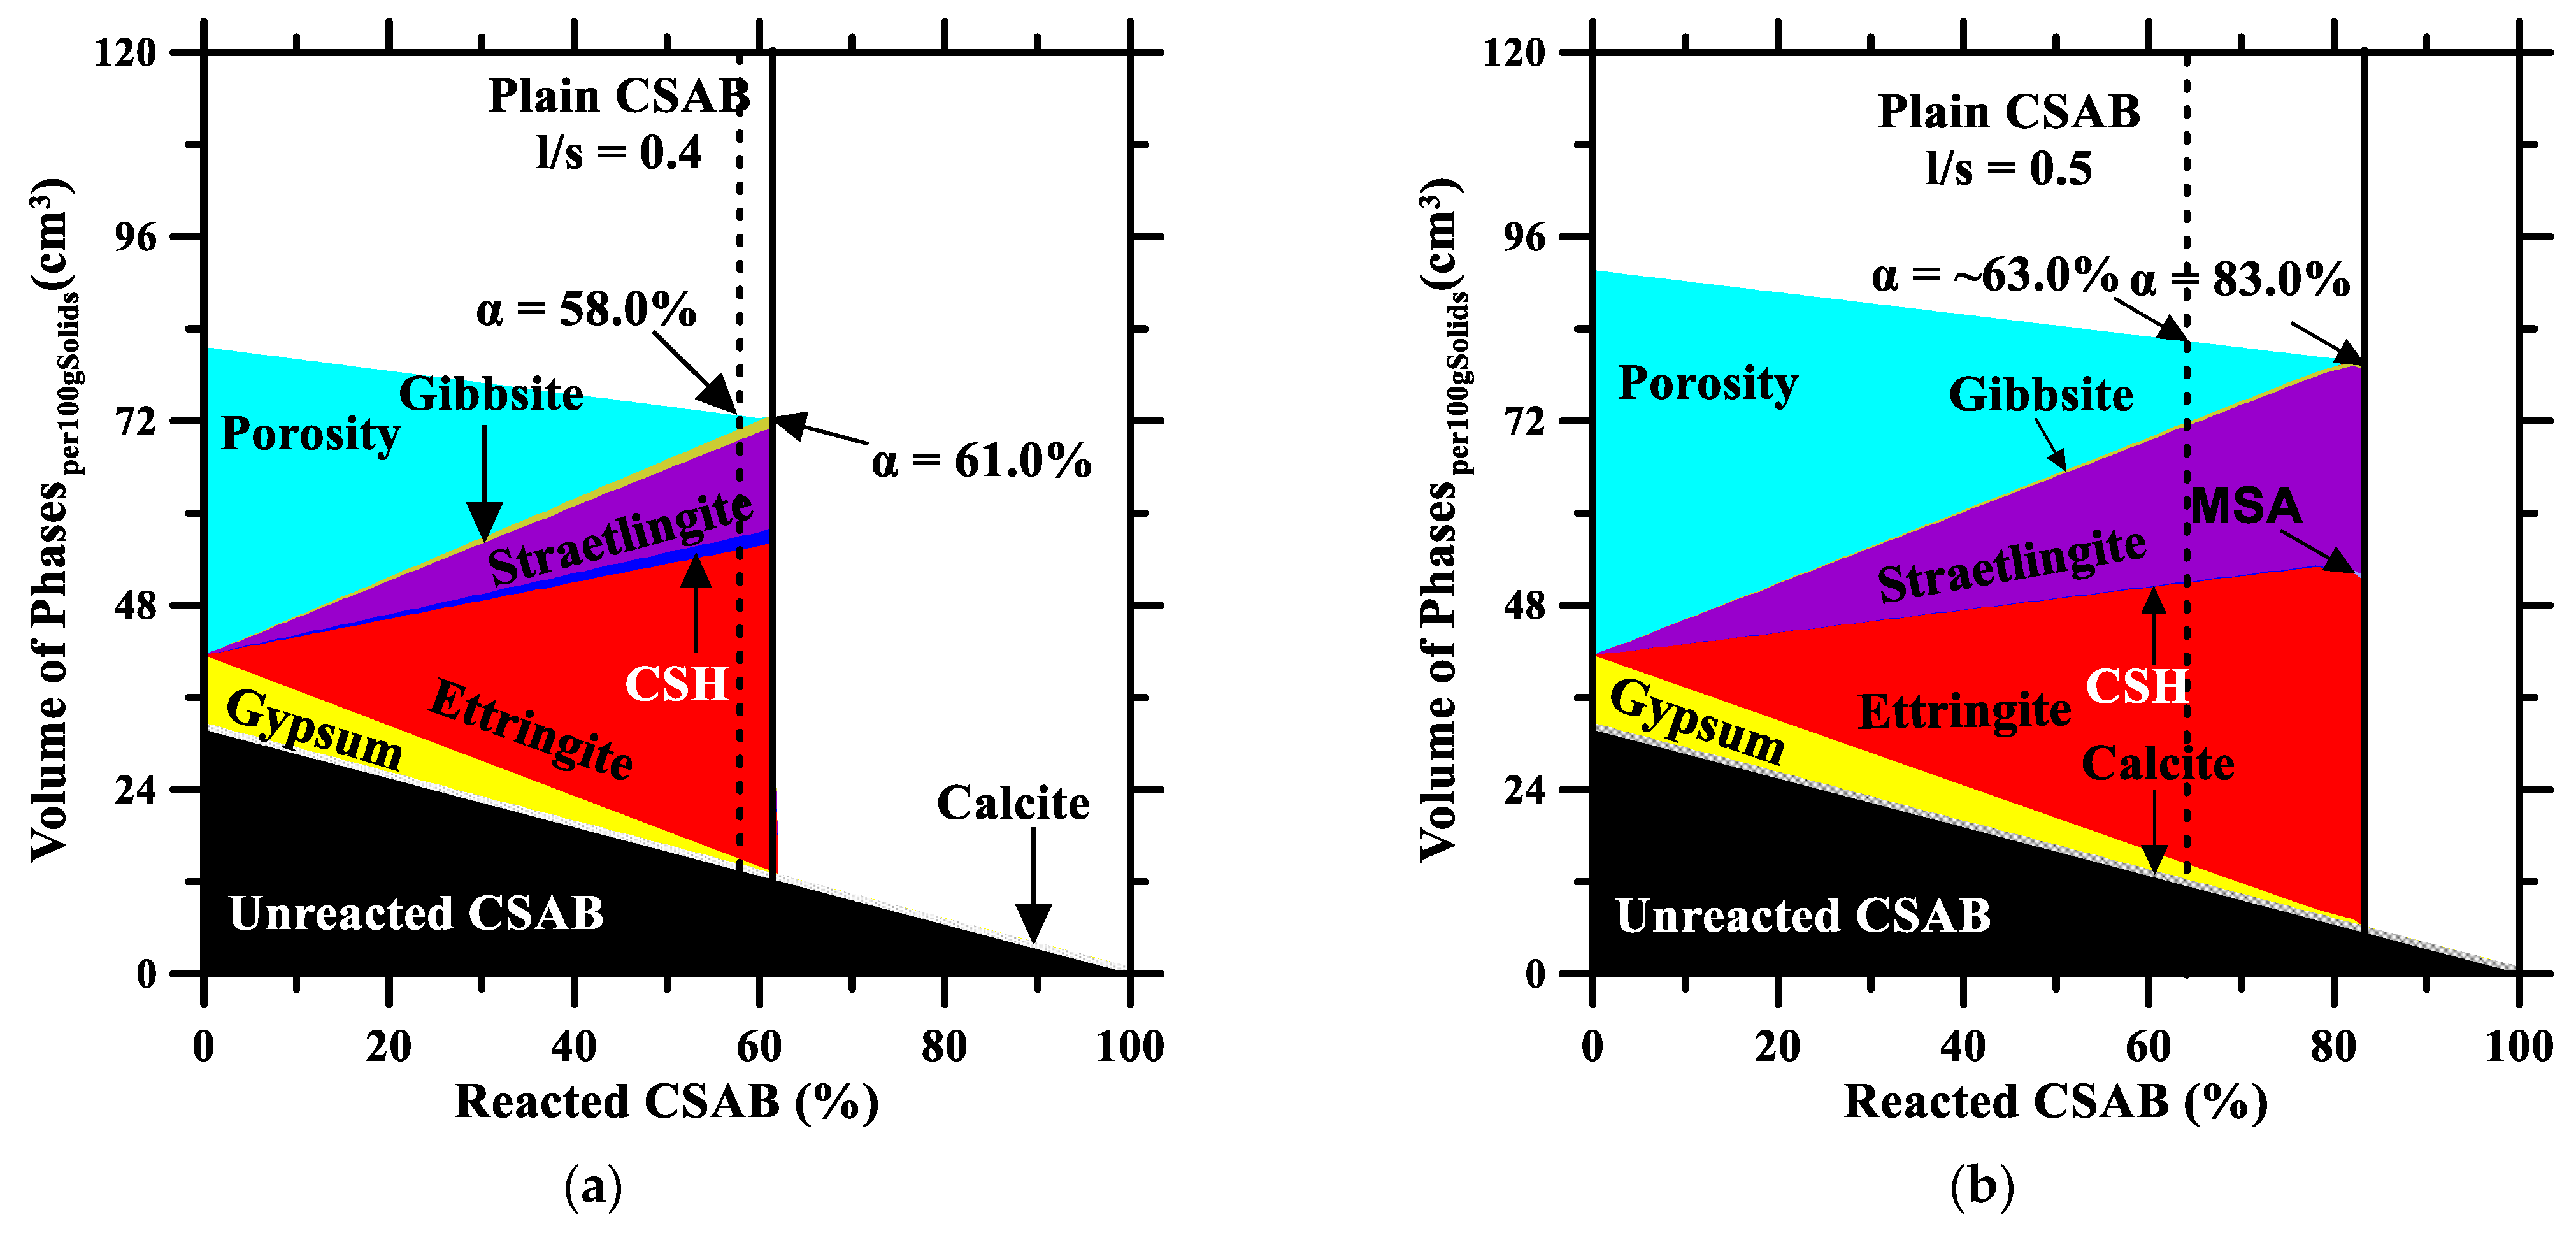
3.3. Thermodynamic Simulations

As mentioned earlier, the reactivities of C C ¯ and C$H2 are key parameters to perform reliable thermodynamic simulations for both plain and blended binders. The reactivities of C C ¯ and C$H2 obtained from TGA were used as theoretical reactivities after 3 days. This section presents the phase assemblages of plain and blended CSAB binders at l/s ratios of 0.4 and 0.5, as shown in Figure 5. These phase assemblages provide insights into the volume fraction of hydration products and unreacted precursors relative to the degree of hydration of CSAB after 3 days. After 14 days, ~90% of CSAB in the binder reacts with water, which can be considered as the enthalpy of hydration of CSAB [66,67,68]. In this context, the degree of hydration of the binders after 3 days was determined as the ratio of the cumulative heat release after 3 days to that after 14 days.
Figure 5a,b illustrate the phase assemblages resulting from the hydration of plain CSAB binders at l/s ratios of 0.4 and 0.5. After 3 days, a 58% degree of hydration was observed for the CSAB binder at an l/s ratio of 0.4. The maximum degree of hydration for this binder reached up to 61%, beyond which hydration ceased due to a lack of water. Due to insufficient water, the porosity in the binder is reduced, thereby forming a dense pore structure, leading to higher compressive strength [69,70]. The hydrates formed are ettringite, straetlingite, CSH, and gibbsite, as shown in the literature [15,32,38,71]. Both the XRD and TGA results confirm the presence of ettringite as the main hydrate. CSAB contains a low amount of C C ¯ , whose limited reactivity might result in minimal MCA/HCA formation based on water availability, but as observed in both experimental methods and thermodynamic simulations, the presence of MCA/HCA was not observed due to the presence of C$H2, even after the cessation of hydration. MSA does not appear in the phase assemblage and both thermodynamic simulations and TGA confirm that the MSA observed in XRD may be a localized phenomenon. Figure 5b shows a similar phase assemblage but with a higher degree of hydration (63.0%) and higher degree of cessation (83.0%) for CSAB at an l/s ratio of 0.5. The higher reactivity of CSAB is associated with the higher availability of water. Compared to a binder at an l/s of 0.4, straetlingite formation has shown an increase in its volume content while the CSH formation and gibbsite formation are reduced, indicating that a higher presence of water and a higher presence of amorphous gibbsite favors straetlingite formation. MSA formation can be seen at the 80.0% degree of hydration as the gypsum content is completely consumed at this point. Though C C ¯ is present in the binder, due to its limited dissolution kinetics, instead of MCA/HCA formation ye’elimite prefers to react with water to form MSA.
Figure 5c–e show the phase assemblages of M(2.99) binders with 10%, 20%, and 30% C C ¯ replacement levels at an l/s of 0.4. As the C C ¯ replacement level increases, the degree of hydration of CSAB increases. This is attributed to the higher presence of C C ¯ , which results in less CSAB in the binder, thereby allowing more water contact. Another notable observation is the presence of CSH in these phase assemblages. Identifying CSH in XRD patterns is challenging due to its amorphous structure. Additionally, in TGA, the CSH profiles overlap with those of ettringite, making it difficult to quantify its weight loss accurately. However, thermodynamic simulation allows for the identification of the volume fraction of CSH in the binders which will help in understanding the development of short-order phases. In these binders, more ettringite is seen, but less straetlingite is formed compared to the plain binder, primarily because the additional C$H2 and the C C ¯ replacement reduce the belite content.
Figure 5d,f,g compare the phase assemblages of binders with a 20% C C ¯ replacement level at three different M-ratios. It is clear that as the C$H2 increases, the degree of hydration of CSAB after 3 days rises, leading to an increase in ettringite formation but a decrease in straetlingite phase. More C$H2 in the binders allows more ettringite formation, which enhances the driving force aluminate ion dissolution and accelerates the hydration of ye’elimite [72]. As the amount of CSAB in the binders decreases, belite also decreases, resulting in less straetlingite formation.
Figure 5d,h compare the phase assemblages of CSAB binders with the same C C ¯ replacement level and M-ratio, but at different l/s ratios. It is evident that as l/s increases, the degree of hydration of CSAB also increases due to the increased water available for hydration. Although the ettringite formation is greater at an l/s of 0.5, the binder exhibits more capillary porosity compared to a binder with an l/s of 0.4. This difference in porosity will influence the mechanical properties of the binders, which will be discussed in Section 3.5. Additional water also enables the binder to achieve complete hydration at later ages. These phase assemblages will be used to understand and explain the hydration kinetics and mechanical behavior of the plain CSAB and blended binders. The phase assemblages of other CSAB binders in this study are shown in Supplementary Information.

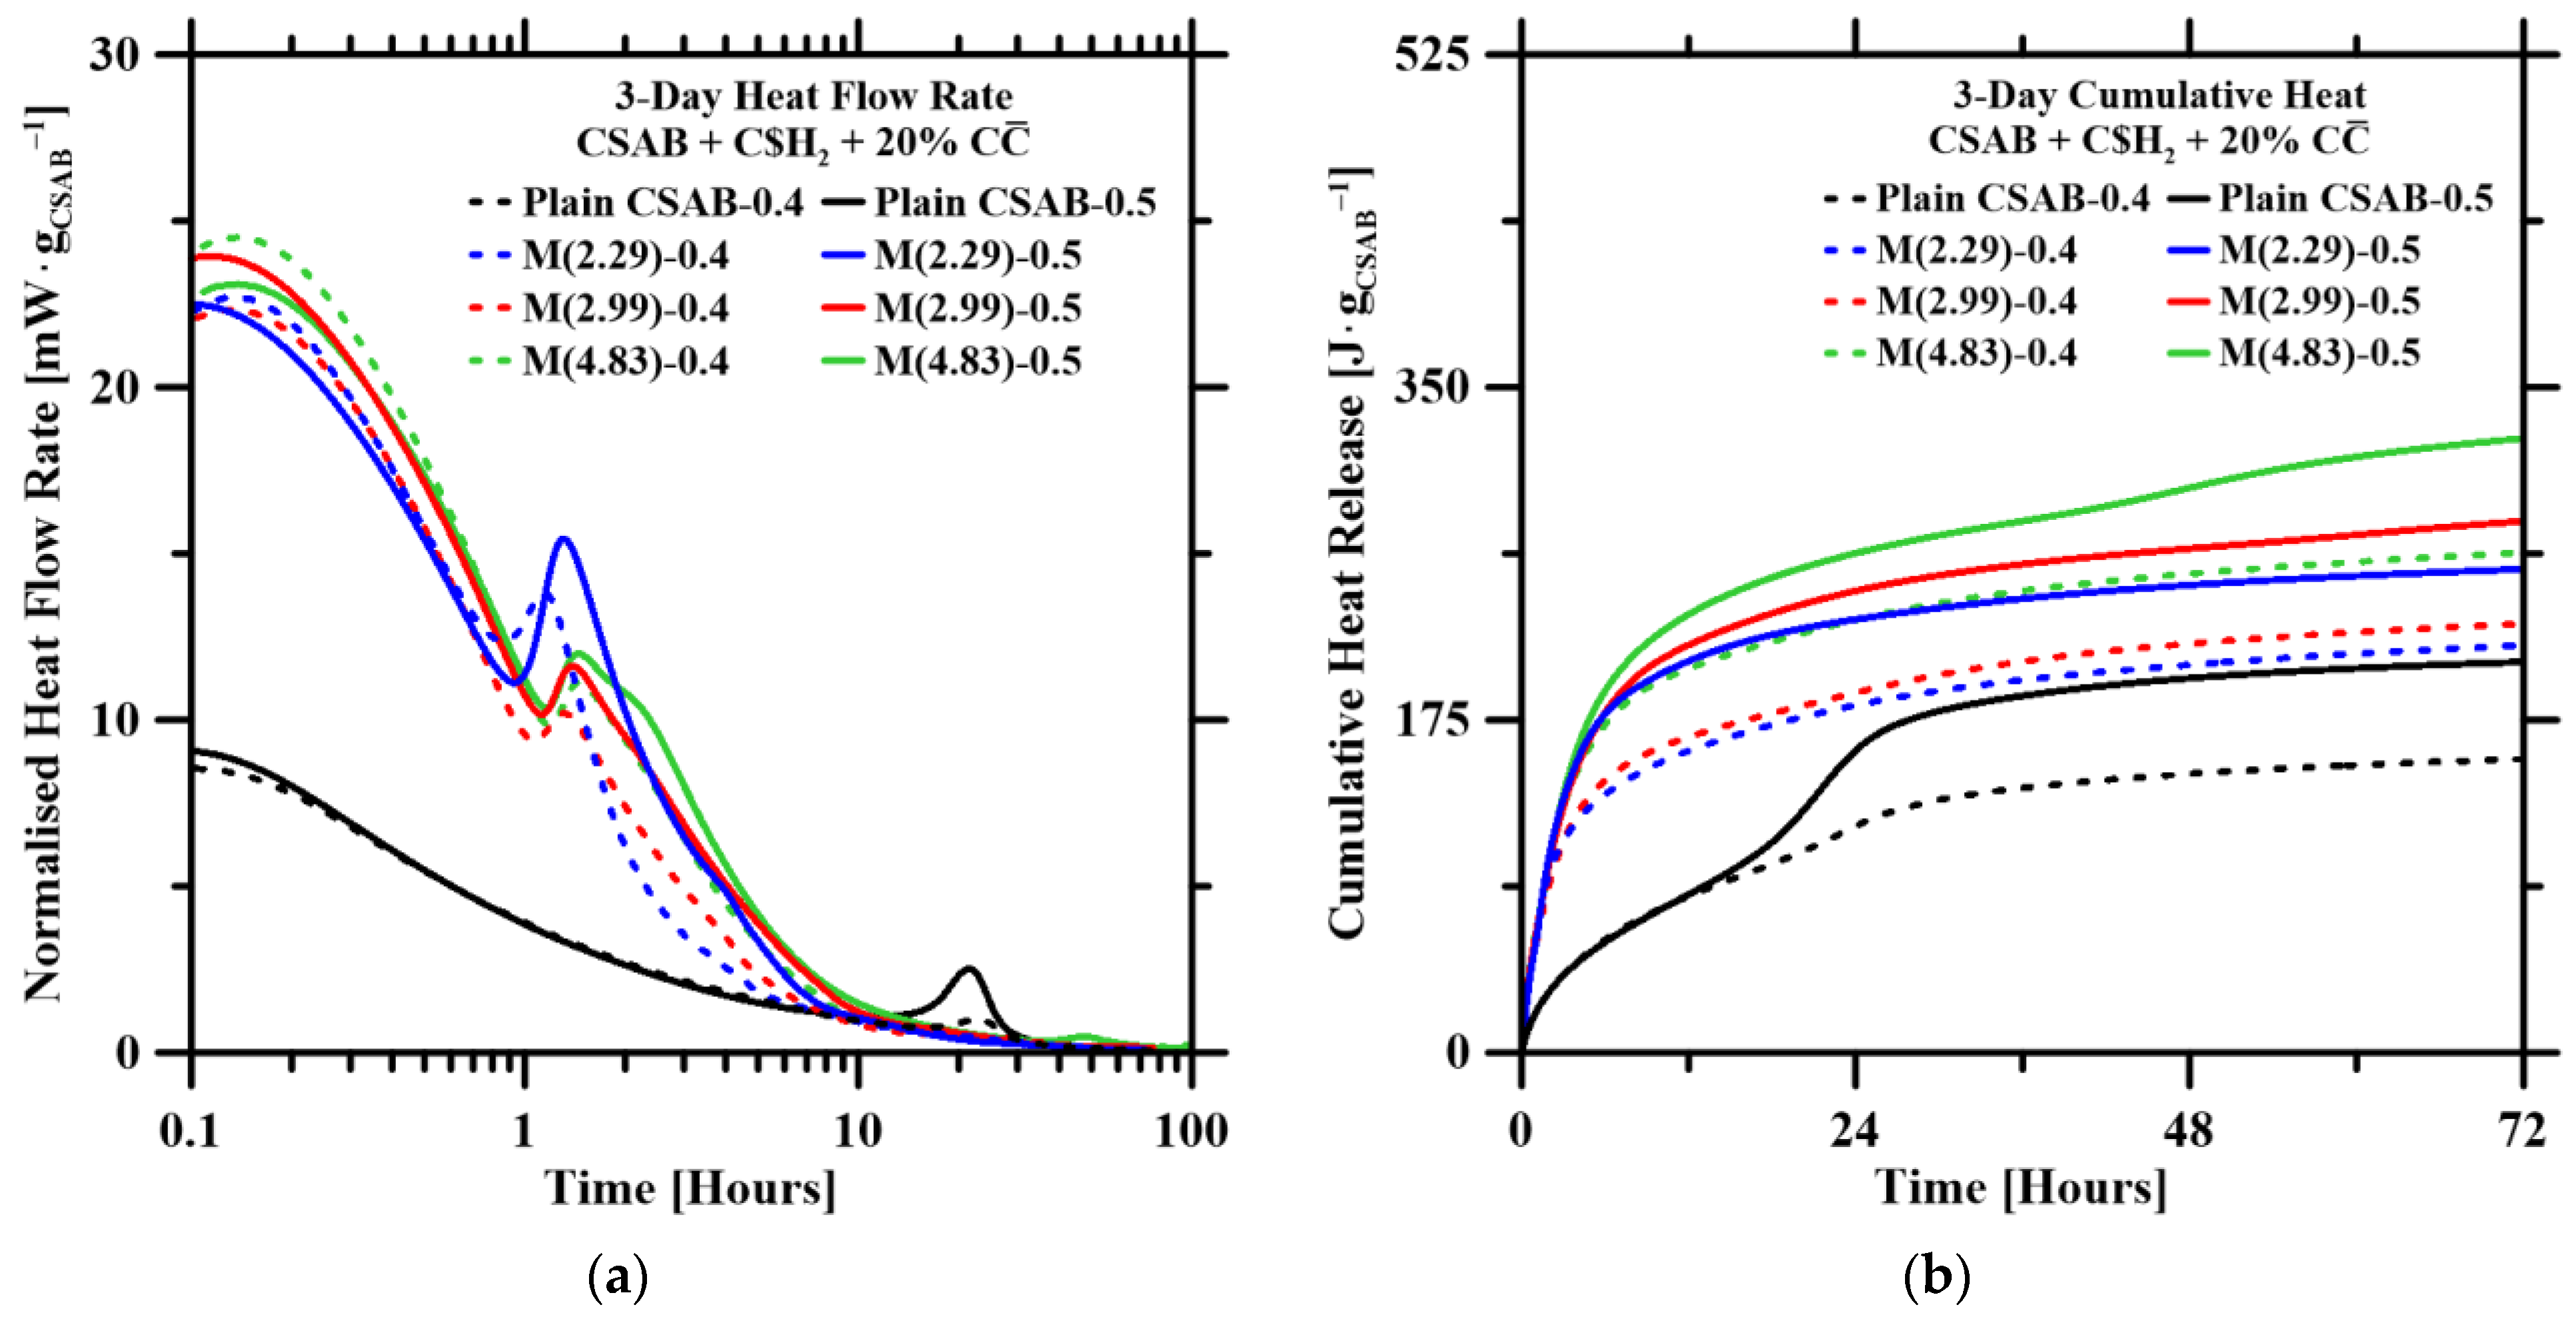
3.4. Hydration Kinetics

Figure 6 shows the calorimetry profiles for plain CSAB and blended binders with a fixed M-ratio, i.e., M(2.99) across varying C C ¯ replacement levels at both l/s ratios of 0.4 and 0.5, over a 3-day period. To clearly present the early-age hydration kinetics, a logarithmic time scale is used in the heat flow rate profiles.
In Figure 6a, the initial exothermic peak (at 0.1 h) for plain CSAB binders ranges from ~7–9 mW·gCSAB−1 at both the l/s ratios, while for M(2.99) binders it ranges from ~22–25 mW·gCSAB−1. This higher peak is attributed to the wetting of the sample and the rapid dissolution of ye’elimite and C$H2, leading to the rapid formation of ettringite [73,74]. Additionally, the main hydration peak in the plain CSAB at both l/s ratios are observed at approximately 24 h, which is attributed to local MSA formation, found in XRD. Even though small amounts of MSA formed, the enthalpy of MSA formation is high (∆Hf° = −8758.6 kJ/mol), causing a clear heat flow peak. The peak for the belite hydration does not appear because belite reacts slowly at later stages, resulting in the absence of an obvious peak [73,75,76]. For M(2.99) binders, the main hydration peak is observed at 1-to-3 h; this can be attributed to the high content of C$H2 enhancing the formation of ettringite [48,50]. The thermodynamic simulation confirms this assumption, where M(2.99) binders form 10% more ettringite compared to plain binders at early ages. Prior studies [39,77] have found that C C ¯ contributes to early-age hydration through two mechanisms: (1) additional surface area provides additional nucleation sites for ettringite and CSH, and (2) CO32− reacts with ye’elimite forming MCA. The filler effect largely depends on the SSA of C C ¯ , and the C C ¯ used in this study is coarse, thus limiting its filler effect, while, from TGA, the C C ¯ was identified to be non-reactive (reactivity < 2%), resulting in the absence of MCA. The calorimetry profiles for M(2.99) binders reveal that as the C C ¯ replacement level increases, the intensity of the heat peak also rises, regardless of l/s. This increase is attributed to the additional free water enhancing CSAB hydration. Additionally, the profiles show no hydration peak after 24 h, which suggests little-to-no formation of MSA and MCA, consistent with XRD, TGA, and thermodynamic analyses.
Figure 6b shows that a higher l/s ratio leads to greater heat release. Increased water availability enhances ettringite formation, with a 5% increase observed in binders with an l/s of 0.5 compared to those with an l/s of 0.4, as indicated by thermodynamic simulations. The higher heat release associated with elevated C C ¯ replacement levels further supports the argument that greater amounts of free water facilitate more intensive ye’elimite hydration.
Figure 7 presents the calorimetry profiles for plain CSAB and blended binders with a 20% C C ¯ replacement level and different M-ratios at l/s ratios of 0.4 and 0.5 for 3 days. In Figure 7a, the main hydration peaks for all blended binders occur at approximately the same time (1-to-3 h). It is also observed that higher amounts of C$H2 result in a larger area under the peaks, indicating enhanced ettringite formation, which is consistent with thermodynamic simulations. The intensity of the hydration peak decreases as the M-ratio increases. In the early stages of hydration, the binder with a high C$H2 content forms a significant amount of ettringite that acts as a dense protective barrier around the ye’elimite particles, impeding CSAB hydration and reducing reaction intensity [56,57,78,79]. However, sufficient C$H2 is present to maintain the driving force for continued ye’elimite dissolution. Notably, peaks for MSA and MCA formation do not appear, reinforcing the low reactivity of C C ¯ . Figure 7b shows that a higher amount of heat is released at a higher l/s ratio, due to the increased water availability. From the isothermal calorimetry profiles, it can be concluded that greater C$H2 content enhances ye’elimite hydration kinetics, which is primarily influenced by ettringite formation and water availability.

3.5. Compressive Strength

Figure 8 demonstrates the 3-day compressive strength for [CSAB + C$H2 + C C ¯ ] binders at l/s ratios of 0.4 and 0.5. In Figure 8a, the compressive strength is plotted against C C ¯ replacement levels for all M-ratios at an l/s of 0.4. The plain CSAB exhibits the highest compressive strength compared to the blended binders. This can be attributed to its lower porosity and higher ratio of hydration phases without unreacted mineral additives, as evident from the phase assemblages. As the C C ¯ replacement level increases, the compressive strength decreases, likely due to the dilution effect [52,80], where inert and unreacted additives linearly reduce the strength of the cement. For the 10% C C ¯ binders, increasing the M-ratio leads to a decrease in strength, highlighting the impact of unreacted C$H2, which does not contribute to strength. Although more ettringite forms, it provides less strength compared to CSH [32,35,71]. For the 20% C C ¯ binders, M(2.29) and M(2.99) show strength above the dilution line, as they contain sufficient belite to form an adequate amount of straetlingite and CSH phases. Most of the C$H2 reacts with aluminate ions to form ettringite, leaving little to no C$H2 remaining in the binder, as confirmed by thermodynamic simulations and TGA analyses. Among these, M(2.99) demonstrates the highest strength due to its optimal content of straetlingite, CSH, and ettringite. From the phase assemblages, M(2.99) shows more ettringite, reasonable amounts of straetlingite, CSH, and less AH3 (which does not contribute to strength significantly [72]) compared to M(2.29), while having higher straetlingite content but lower ettringite, and CSH content. Additionally, M(2.99) contains more straetlingite and less unreacted C$H2 than M(4.83). Similarly, at the 30% C C ¯ replacement level, despite the reduced amount of CSAB, M(2.99) still exhibits the highest strength among all binders.
Figure 8b presents the compressive strength values for [CSAB + C$H2 + C C ¯ ] binders at an l/s of 0.5. Similarly to the results of binders at an l/s of 0.4, the plain CSAB exhibits the highest compressive strength compared to the blended binders. However, binders with an l/s of 0.5 generally show lower compressive strength than those with an l/s of 0.4 due to increased porosity. It is evident that C C ¯ replacement level significantly impacts compressive strength negatively at an l/s of 0.5, highlighting the adverse effects of increased porosity caused by the additional water. Among the binders, M(2.99) consistently demonstrates the highest compressive strength, indicating that it is a balanced binder with sufficient straetlingite, CSH, and ettringite, while minimizing the impact of unreacted C$H2. Considering the overall compressive strength, it can be concluded that the M(2.99)_20% C C ¯ replacement level is the optimal mixture design at both l/s ratios. This formulation replaces approximately 32% of CSAB with mineral additives, potentially reducing carbon emissions from CSAB production while maintaining strong mechanical properties.
The correlations between the hydration kinetics and compressive strengths of [CSAB + C$H2 + C C ¯ ] binders after 3 days are shown in Figure 9. Previous studies [54,56,81,82,83,84,85] suggest that compressive strength depends on both solid connectivity and capillary porosity. Normalizing cumulative heat by the initial water content allows us to account for porosity in the binder. Several studies [54,55,86,87] have shown a broadly linear correlation between cumulative heat release (J·gwater−1) and compressive strength in cementitious binders. In Figure 9, a clear linear correlation, as expected, is observed for binders with an l/s of 0.5. In contrast, the l/s 0.4 binders show a less linear trend, likely due to limited water availability, which restricts water contact with cement particles and increases trend variability. It is evident that at the same cumulative heat, the binder with an l/s of 0.4 exhibits higher compressive strength. This is because the additional water in the binder with an l/s of 0.5 introduces more porosity, significantly reducing its compressive strength. Thermodynamic simulations in Figure 5 clearly indicate the higher porosity in the binders with l/s of 0.5.

4. Conclusions

This study investigated the influence of C$H2 and C C ¯ mineral additives on the hydration kinetics, compressive strength development, and phase evolution of CSAB binders. Nine CSAB binders with various C$H2 and C C ¯ replacement levels (up to 51% by mass) at l/s ratios of 0.4 and 0.5 were comprehensively evaluated. XRD analyses were used to explore hydration phases, while TGA was employed to estimate the reactivity of C$H2 and C C ¯ . The TGA and XRD results were used as guidelines for performing thermodynamic simulations. The phase assemblages of binders assisted in interpreting the compressive strength and hydration kinetics.
The key findings in this study are as follows:
  • Ettringite is the main hydration phase. The presence of other hydrates like CSH, straetlingite, and gibbsite are minimal when compared to ettringite. There is no formation of HCA/MCA in any other binders due to the minimal reactivity of C C ¯ .
  • Higher C C ¯ replacement levels were found to enhance the CSAB hydration due to more free water for ye’elimite hydration. Due to the increase in C$H2, more ettringite is expected to form, and less AH3 appears in binders due to straetlingite formation. TGA confirms the average reactivity of C$H2 and C C ¯ at both the l/s ratios to be ~83.60% and ~1.25%, respectively.
  • Isothermal calorimetry revealed that the addition of C$H2, C C ¯ , and water accelerated early-age hydration, leading to increased cumulative heat release. However, C$H2, C C ¯ , and water could reduce compressive strength due to the dilution effect.
  • It was found that CSAB cement with an M-ratio of 2.99 and 20% C C ¯ replacement level were the optimal mixture design, achieving high carbon reduction and maintaining high compressive strength (i.e., 39 MPa).
This study presents a thorough investigation into the influence of two mineral additives and water content on hydration kinetics, compressive strength, and phase evolution in CSAB binders. The findings provide critical insights for optimizing mixture designs tailored to specific applications, while also contributing to the reduction in the carbon footprint associated with CSAB. Moreover, producing CSAB binders requires only the addition of gypsum and limestone at the final stage, enabling production in existing cement plants without the need for infrastructure upgrades.

Supplementary Materials

The following supporting information can be downloaded at: https://www.mdpi.com/article/10.3390/infrastructures10020027/s1, Figure S1: Thermogravimetric analysis; Figure S2: Reactivity calculation of C C ¯ in the binders; Figure S3: Thermodynamic phase assemblages of 20% C C ¯ binders.

Author Contributions

S.A.P.: Investigation; methodology; formal analysis; and writing—original draft. B.K.A.-P.: Investigation; formal analysis; and writing—original draft. T.H.: Supervision and writing—review and editing. A.N.: Investigation and formal analysis. G.S.: Supervision; writing—review and editing; and funding acquisition. N.N.: Supervision; writing—review and editing; and funding acquisition. A.K.: Conceptualization; writing—review and editing; and funding acquisition. All authors have read and agreed to the published version of the manuscript.

Funding

This research received no external funding.

Data Availability Statement

The raw data supporting the conclusions of this article will be made available by the authors on request.

Acknowledgments

The authors acknowledge financial support from the National Science Foundation (NSF-DMR:2228782).

Conflicts of Interest

The authors declare no conflict of interest.

References

  1. Shi, C.; Jiménez, A.F.; Palomo, A. New cements for the 21st century: The pursuit of an alternative to Portland cement. Cem. Concr. Res. 2011, 41, 750–763. [Google Scholar] [CrossRef]
  2. World Energy Outlook 2021—Analysis, IEA. 2021. Available online: https://www.iea.org/reports/world-energy-outlook-2021 (accessed on 12 April 2024).
  3. Cheng, D.; Reiner, D.M.; Yang, F.; Cui, C.; Meng, J.; Shan, Y.; Liu, Y.; Tao, S.; Guan, D. Projecting future carbon emissions from cement production in developing countries. Nat. Commun. 2023, 14, 8213. [Google Scholar] [CrossRef] [PubMed]
  4. 4 Ways to Make the Cement Industry More Sustainable. World Economic Forum. 2024. Available online: https://www.weforum.org/agenda/2024/09/cement-production-sustainable-concrete-co2-emissions/ (accessed on 7 October 2024).
  5. Barbhuiya, S.; Bhusan Das, B.; Adak, D. Roadmap to a net-zero carbon cement sector: Strategies, innovations and policy imperatives. J. Environ. Manag. 2024, 359, 121052. [Google Scholar] [CrossRef]
  6. Liao, S.; Wang, D.; Xia, C.; Tang, J. China’s provincial process CO2 emissions from cement production during 1993–2019. Sci. Data 2022, 9, 165. [Google Scholar] [CrossRef]
  7. Wirthwein, C.R.; Emberger, B. Burners for alternative fuels utilization-Optimisation of kiln firing systems for advanced alternative fuel co-firing. Cem. Int. 2010, 8, 42–46. [Google Scholar]
  8. Technology Roadmap—Carbon Capture and Storage 2009—Analysis, IEA. 2009. Available online: https://www.iea.org/reports/technology-roadmap-carbon-capture-and-storage-2009 (accessed on 2 July 2024).
  9. Tsiligiannis, A.; Tsiliyannis, C. Renewable energy in cement manufacturing: A quantitative assessment of energy and environmental efficiency of food residue biofuels. Renew. Sustain. Energy Rev. 2019, 107, 568–586. [Google Scholar]
  10. Making Concrete Change: Innovation in Low-Carbon Cement and Concrete | Chatham House—International Affairs Think Tank. 2018. Available online: https://www.chathamhouse.org/2018/06/making-concrete-change-innovation-low-carbon-cement-and-concrete (accessed on 2 July 2024).
  11. Wood, J. 5 Innovations Building a More Sustainable Future for Cement, Spectra. 2024. Available online: https://spectra.mhi.com/5-innovations-building-a-more-sustainable-future-for-cement (accessed on 2 July 2024).
  12. Truscott, J. New Low-Carbon Innovations in Cement and Concrete Production. CarbonCure Technologies Inc. 2020. Available online: https://www.carboncure.com/concrete-corner/new-low-carbon-innovations-in-cement-and-concrete-production/ (accessed on 2 July 2024).
  13. Schneider, M.; Romer, M.; Tschudin, M.; Bolio, H. Sustainable cement production—Present and future. Cem. Concr. Res. 2011, 41, 642–650. [Google Scholar] [CrossRef]
  14. Gartner, E. Industrially interesting approaches to “low-CO2” cements. Cem. Concr. Res. 2004, 34, 1489–1498. [Google Scholar] [CrossRef]
  15. Lothenbach, B.; Albert, B.; Morin, V.; Gartner, E. Hydration of Belite-Ye’elimite-Ferrite cements: Thermodynamic modeling. In Proceedings of the 14th International Congress on the Chemistry of Cement (ICCC), Beijing, China, 13–16 October 2015. [Google Scholar]
  16. Glasser, F.P.; Zhang, L. High Performance Cement Matrices Based on Calcium Sulfoaluminate—Belite Compositions. Cem. Concr. Res. 2001, 31, 1881–1886. [Google Scholar] [CrossRef]
  17. Cuberos, A.J.M.; De la Torre, Á.G.; Álvarez-Pinazo, G.; Martín-Sedeño, M.C.; Schollbach, K.; Pöllmann, H.; Aranda, M.A.G. Active Iron-Rich Belite Sulfoaluminate Cements: Clinkering and Hydration. Environ. Sci. Technol. 2010, 44, 6855–6862. [Google Scholar] [CrossRef]
  18. Quillin, K. Performance of belite–sulfoaluminate cements. Cem. Concr. Res. 2001, 31, 1341–1349. [Google Scholar] [CrossRef]
  19. Chen, I.A.; Juenger, M.C.G. Incorporation of coal combustion residuals into calcium sulfoaluminate-belite cement clinkers. Cem. Concr. Compos. 2012, 34, 893–902. [Google Scholar] [CrossRef]
  20. Sahu, S.; Majling, J. Preparation of sulphoaluminate belite cement from fly ash. Cem. Concr. Res. 1994, 24, 1065–1072. [Google Scholar] [CrossRef]
  21. Arjunan, P.; Silsbee, M.R.; Della, M. Roy Sulfoaluminate-belite cement from low-calcium fly ash and sulfur-rich and other industrial by-products. Cem. Concr. Res. 1999, 29, 1305–1311. [Google Scholar] [CrossRef]
  22. Wu, K.; Shi, H.; Guo, X. Utilization of municipal solid waste incineration fly ash for sulfoaluminate cement clinker production. Waste Manag. 2011, 31, 2001–2008. [Google Scholar] [CrossRef] [PubMed]
  23. Beretka, J.; de Vito, B.; Santoro, L.; Sherman, N.; Valenti, G.L. Hydraulic behaviour of calcium sulfoaluminate-based cements derived from industrial process wastes. Cem. Concr. Res. 1993, 23, 1205–1214. [Google Scholar] [CrossRef]
  24. Singh, M.; Upadhayay, S.N.; Prasad, P.M. Preparation of special cements from red mud. Waste Manag. 1996, 16, 665–670. [Google Scholar] [CrossRef]
  25. Use of Fluidized Bed Combustion Wastes for the Synthesis of Low-Energy Cements. Available online: https://iris.unibas.it/handle/11563/17078 (accessed on 26 April 2024).
  26. Pace, M.L.; Telesca, A.; Marroccoli, M.; Valenti, G.L. Use of Industrial Byproducts as Alumina Sources for the Synthesis of Calcium Sulfoaluminate Cements. Environ. Sci. Technol. 2011, 45, 6124–6128. [Google Scholar] [CrossRef]
  27. Winnefeld, F.; Lothenbach, B. Hydration of calcium sulfoaluminate cements—Experimental findings and thermodynamic modelling. Cem. Concr. Res. 2010, 40, 1239–1247. [Google Scholar] [CrossRef]
  28. Dillard, R.J.; Murray, C.D.; Deschenes, R.A. Belitic calcium sulfoaluminate cement subjected to sulfate attack and sulfuric acid. Constr. Build. Mater. 2022, 343, 128089. [Google Scholar] [CrossRef]
  29. Bescher, E.; Rice, E.K.; Ramseyer, C.; Roswurm, S. Sulfate resistance of calcium sulphoaluminate cement. J. Struct. Integr. Maint. 2016, 1, 131–139. [Google Scholar] [CrossRef]
  30. Álvarez-Pinazo, G.; Santacruz, I.; Aranda, M.A.G.; De la Torre, Á.G. Hydration of belite–ye’elimite–ferrite cements with different calcium sulfate sources. Adv. Cem. Res. 2016, 28, 529–543. [Google Scholar] [CrossRef]
  31. Chen, I.A.; Juenger, M.C.G. Synthesis and hydration of calcium sulfoaluminate-belite cements with varied phase compositions. J. Mater. Sci. 2011, 46, 2568–2577. [Google Scholar] [CrossRef]
  32. García-Maté, M.; De la Torre, A.G.; León-Reina, L.; Losilla, E.R.; Aranda, M.A.G.; Santacruz, I. Effect of calcium sulfate source on the hydration of calcium sulfoaluminate eco-cement. Cem. Concr. Compos. 2015, 55, 53–61. [Google Scholar] [CrossRef]
  33. Telesca, A.; Marroccoli, M.; Pace, M.L.; Tomasulo, M.; Valenti, G.L.; Monteiro, P.J.M. A hydration study of various calcium sulfoaluminate cements. Cem. Concr. Compos. 2014, 53, 224–232. [Google Scholar] [CrossRef]
  34. Jansen, D.; Spies, A.; Neubauer, J.; Ectors, D.; Goetz-Neunhoeffer, F. Studies on the early hydration of two modifications of ye’elimite with gypsum. Cem. Concr. Res. 2017, 91, 106–116. [Google Scholar] [CrossRef]
  35. Winnefeld, F.; Martin, L.; Müller, C.; Lothenbach, B. Using gypsum to control hydration kinetics of CSA cements. Constr. Build. Mater. 2017, 155, 154–163. [Google Scholar] [CrossRef]
  36. Zajac, M.; Skocek, J.; Bullerjahn, F. Effect of retarders on the early hydration of calcium-sulpho-aluminate (CSA) type cements. Cem. Concr. Res. 2016, 84, 62–75. [Google Scholar] [CrossRef]
  37. Gastaldi, D.; Paul, G.; Marchese, L.; Irico, S.; Boccaleri, E.; Mutke, S.; Buzzi, L.; Canonico, F. Hydration products in sulfoaluminate cements: Evaluation of amorphous phases by XRD/solid-state NMR. Cem. Concr. Res. 2016, 90, 162–173. [Google Scholar] [CrossRef]
  38. Bullerjahn, F.; Schmitt, D.; Ben Haha, M. Effect of raw mix design and of clinkering process on the formation and mineralogical composition of (ternesite) belite calcium sulphoaluminate ferrite clinker. Cem. Concr. Res. 2014, 59, 87–95. [Google Scholar] [CrossRef]
  39. Pelletier-Chaignat, L.; Winnefeld, F.; Lothenbach, B.; Müller, C.J. Beneficial use of limestone filler with calcium sulphoaluminate cement. Constr. Build. Mater. 2012, 26, 619–627. [Google Scholar] [CrossRef]
  40. Hargis, C.W.; Telesca, A.; Monteiro, P.J.M. Calcium sulfoaluminate (Ye’elimite) hydration in the presence of gypsum, calcite, and vaterite. Cem. Concr. Res. 2014, 65, 15–20. [Google Scholar] [CrossRef]
  41. Paul, G.; Boccaleri, E.; Buzzi, L.; Canonico, F.; Gastaldi, D. Friedel’s salt formation in sulfoaluminate cements: A combined XRD and 27Al MAS NMR study. Cem. Concr. Res. 2015, 67, 93–102. [Google Scholar] [CrossRef]
  42. Bertola, F.; Gastaldi, D.; Irico, S.; Paul, G.; Canonico, F. Behavior of blends of CSA and Portland cements in high chloride environment. Constr. Build. Mater. 2020, 262, 120852. [Google Scholar] [CrossRef]
  43. Damidot, D.; Lothenbach, B.; Herfort, D.; Glasser, F.P. Thermodynamics and cement science. Cem. Concr. Res. 2011, 41, 679–695. [Google Scholar] [CrossRef]
  44. Moser, R.D.; Singh, P.M.; Kahn, L.F.; Kurtis, K.E. Chloride-induced corrosion resistance of high-strength stainless steels in simulated alkaline and carbonated concrete pore solutions. Corros. Sci. 2012, 57, 241–253. [Google Scholar] [CrossRef]
  45. Shakouri, M.; Ahmed, A.A.; Teymouri, M.; Trejo, D. Corrosion Resistance of Calcium Sulfoaluminate Cementitious Systems. J. Mater. Civ. Eng. 2023, 35, 04023238. [Google Scholar] [CrossRef]
  46. Bullard, J.W.; Scherer, G.W.; Thomas, J.J. Time dependent driving forces and the kinetics of tricalcium silicate hydration. Cem. Concr. Res. 2015, 74, 26–34. [Google Scholar] [CrossRef]
  47. Winnefeld, F.; Barlag, S. Calorimetric and thermogravimetric study on the influence of calcium sulfate on the hydration of ye’elimite. J. Therm. Anal. Calorim. 2010, 101, 949–957. [Google Scholar] [CrossRef]
  48. Beltagui, H.; Jen, G.; Whittaker, M.; Imbabi, M.S. The influence of variable gypsum and water content on the strength and hydration of a belite-calcium sulphoaluminate cement. Adv. Appl. Ceram. 2017, 116, 199–206. [Google Scholar] [CrossRef]
  49. Development of the Use of Sulfo- and Ferroaluminate Cements in China | Advances in Cement Research. Available online: https://www.icevirtuallibrary.com/doi/10.1680/adcr.1999.11.1.15 (accessed on 6 December 2024).
  50. Berger, S.; Coumes, C.C.D.; Le Bescop, P.; Damidot, D. Influence of a thermal cycle at early age on the hydration of calcium sulphoaluminate cements with variable gypsum contents. Cem. Concr. Res. 2011, 41, 149–160. [Google Scholar] [CrossRef]
  51. García-Maté, M.; Santacruz, I.; De la Torre, Á.G.; León-Reina, L.; Aranda, M.A.G. Rheological and hydration characterization of calcium sulfoaluminate cement pastes. Cem. Concr. Compos. 2012, 34, 684–691. [Google Scholar] [CrossRef]
  52. Martin, L.H.J.; Winnefeld, F.; Müller, C.J.; Lothenbach, B. Contribution of limestone to the hydration of calcium sulfoaluminate cement. Cem. Concr. Compos. 2015, 62, 204–211. [Google Scholar] [CrossRef]
  53. Standard Test Method for Compressive Strength of Hydraulic Cement Mortars (Using 2-in. or [50 mm] Cube Specimens). Available online: https://www.astm.org/c0109_c0109m-20b.html (accessed on 30 September 2022).
  54. Ponduru, S.A.; Han, T.; Huang, J.; Neithalath, N.; Sant, G.; Kumar, A. Understanding roles and evaluating reactivity of fly ashes in calcium aluminate binders. Constr. Build. Mater. 2024, 414, 135062. [Google Scholar] [CrossRef]
  55. Bhat, R.; Han, T.; Sant, G.; Neithalath, N.; Kumar, A. A comprehensive analysis of hydration kinetics and compressive strength development of fly ash-Portland cement binders. J. Build. Eng. 2024, 88, 109191. [Google Scholar] [CrossRef]
  56. Lapeyre, J.; Ponduru, S.A.; Okoronkwo, M.; Ma, H.; Kumar, A. Hydration of high-alumina calcium aluminate cements with carbonate and sulfate additives. J. Therm. Anal. Calorim. 2022, 147, 5575–5587. [Google Scholar] [CrossRef]
  57. Ponduru, S.A.; Han, T.; Huang, J.; Kumar, A. Predicting Compressive Strength and Hydration Products of Calcium Aluminate Cement Using Data-Driven Approach. Materials 2023, 16, 654. [Google Scholar] [CrossRef]
  58. Lothenbach, B.; Kulik, D.A.; Matschei, T.; Balonis, M.; Baquerizo, L.; Dilnesa, B.; Miron, G.D.; Myers, R.J. Cemdata18: A chemical thermodynamic database for hydrated Portland cements and alkali-activated materials. Cem. Concr. Res. 2019, 115, 472–506. [Google Scholar] [CrossRef]
  59. Jeong, Y.; Hargis, C.W.; Chun, S.; Moon, J. Effect of Calcium Carbonate Fineness on Calcium Sulfoaluminate-Belite Cement. Materials 2017, 10, 900. [Google Scholar] [CrossRef]
  60. Jeong, Y.; Hargis, C.W.; Chun, S.-C.; Moon, J. The effect of water and gypsum content on strätlingite formation in calcium sulfoaluminate-belite cement pastes. Constr. Build. Mater. 2018, 166, 712–722. [Google Scholar] [CrossRef]
  61. Borštnar, M.; Lengauer, C.L.; Dolenec, S. Quantitative in Situ X-ray Diffraction Analysis of Early Hydration of Belite-Calcium Sulfoaluminate Cement at Various Defined Temperatures. Minerals 2021, 11, 297. [Google Scholar] [CrossRef]
  62. Palomino-Ore, S.B.; Rimstidt, J.D.; Chermak, J.A.; Schreiber, M.E.; Seal, R.R. Aluminum hydroxide coatings in limestone drains. Appl. Geochem. 2019, 103, 23–30. [Google Scholar] [CrossRef]
  63. Scrivener, K.; Snellings, R.; Lothenbach, B. (Eds.) A Practical Guide to Microstructural Analysis of Cementitious Materials; CRC Press: Boca Raton, FL, USA, 2018; ISBN 978-1-351-22849-7. [Google Scholar]
  64. Chitvoranund, N.; Lothenbach, B.; Londono-Zuluaga, D.; Winnefeld, F.; Scrivener, K. Influence of temperature on phase assemblages of belite-ye’elimite cement. Cem. Concr. Res. 2023, 174, 107339. [Google Scholar] [CrossRef]
  65. Brien, J.V.; Henke, K.R.; Mahboub, K.C. Observations of Peak Strength Behavior in CSA Cement Mortars. J. Green Build. 2013, 8, 97–115. [Google Scholar] [CrossRef]
  66. Skalamprinos, S.; Galan, I.; Hanein, T.; Glasser, F. Enthalpy of formation of ye’elimite and ternesite. J. Therm. Anal. Calorim. 2018, 131, 2345–2359. [Google Scholar] [CrossRef]
  67. Burris, L.E.; Kurtis, K.E. Water-to-cement ratio of calcium sulfoaluminate belite cements: Hydration, setting time, and strength development. Cement 2022, 8, 100032. [Google Scholar] [CrossRef]
  68. Kleib, J.; Aouad, G.; Benzerzour, M.; Abriak, N.E.; Zakhour, M. Managing the Heat Release of Calcium Sulfoaluminate Cement by Modifying the Ye’elimite Content. Materials 2023, 16, 2470. [Google Scholar] [CrossRef]
  69. Beretka, J.; Marroccoli, M.; Sherman, N.; Valenti, G.L. The influence of C4A3S content and WS ratio on the performance of calcium sulfoaluminate-based cements. Cem. Concr. Res. 1996, 26, 1673–1681. [Google Scholar] [CrossRef]
  70. Bernardo, G.; Telesca, A.; Valenti, G.L. A porosimetric study of calcium sulfoaluminate cement pastes cured at early ages. Cem. Concr. Res. 2006, 36, 1042–1047. [Google Scholar] [CrossRef]
  71. Mrak, M.; Winnefeld, F.; Lothenbach, B.; Dolenec, S. The influence of calcium sulfate content on the hydration of belite-calcium sulfoaluminate cements with different clinker phase compositions. Mater. Struct. 2021, 54, 212. [Google Scholar] [CrossRef]
  72. Tambara, L.U.D.; Cheriaf, M.; Rocha, J.C.; Palomo, A.; Fernández-Jiménez, A. Effect of alkalis content on calcium sulfoaluminate (CSA) cement hydration. Cem. Concr. Res. 2020, 128, 105953. [Google Scholar] [CrossRef]
  73. Pérez-Bravo, R.; Morales-Cantero, A.; Cuesta, A.; Aranda, M.A.G.; Santacruz, I.; De la Torre, A.G. Early hydration of belite-ye’elimite-ferrite cements: Role of admixtures. Constr. Build. Mater. 2023, 371, 130765. [Google Scholar] [CrossRef]
  74. Bullerjahn, F.; Boehm-Courjault, E.; Zajac, M.; Ben Haha, M.; Scrivener, K. Hydration reactions and stages of clinker composed mainly of stoichiometric ye’elimite. Cem. Concr. Res. 2019, 116, 120–133. [Google Scholar] [CrossRef]
  75. Borštnar, M.; Daneu, N.; Dolenec, S. Phase development and hydration kinetics of belite-calcium sulfoaluminate cements at different curing temperatures. Ceram. Int. 2020, 46, 29421–29428. [Google Scholar] [CrossRef]
  76. Taylor, H.F.W. Cement Chemistry, 2nd ed.; T. Telford: London, UK, 1997; ISBN 978-0-7277-2592-9. [Google Scholar]
  77. Oey, T.; Kumar, A.; Bullard, J.W.; Neithalath, N.; Sant, G. The Filler Effect: The Influence of Filler Content and Surface Area on Cementitious Reaction Rates. J. Am. Ceram. Soc. 2013, 96, 1978–1990. [Google Scholar] [CrossRef]
  78. Minard, H.; Garrault, S.; Regnaud, L.; Nonat, A. Mechanisms and parameters controlling the tricalcium aluminate reactivity in the presence of gypsum. Cem. Concr. Res. 2007, 37, 1418–1426. [Google Scholar] [CrossRef]
  79. Quennoz, A.; Scrivener, K.L. Hydration of C3A–gypsum systems. Cem. Concr. Res. 2012, 42, 1032–1041. [Google Scholar] [CrossRef]
  80. Winnefeld, F.; Barlag, S. Influence of calcium sulfate and calcium hydroxide on the hydration of calcium sulfoaluminate clinker [Einfluss von Calciumsulfat und Calciumhydroxid auf die Hydratation von Calciumsulfoaluminat-Klinker]. ZKG Int. 2009, 62, 42–53. [Google Scholar]
  81. Chen, X.; Wu, S.; Zhou, J. Influence of porosity on compressive and tensile strength of cement mortar. Constr. Build. Mater. 2013, 40, 869–874. [Google Scholar] [CrossRef]
  82. Lian, C.; Zhuge, Y.; Beecham, S. The relationship between porosity and strength for porous concrete. Constr. Build. Mater. 2011, 25, 4294–4298. [Google Scholar] [CrossRef]
  83. Popovics, S. New Formulas for the Prediction of the Effect of Porosity on Concrete Strength. J. Am. Concr. Inst. 1985, 82, 136–146. [Google Scholar]
  84. Li, L.; Aubertin, M. A general relationship between porosity and uniaxial strength of engineering materials. Can. J. Civ. Eng. 2003, 30, 644–658. [Google Scholar] [CrossRef]
  85. Roy, D.M.; Gouda, G.R. Porosity-Strength Relation in Cementitious Materials with Very High Strengths. J. Am. Ceram. Soc. 1973, 56, 549–550. [Google Scholar] [CrossRef]
  86. Mehdipour, I.; Kumar, A.; Khayat, K.H. Rheology, hydration, and strength evolution of interground limestone cement containing PCE dispersant and high volume supplementary cementitious materials. Mater. Des. 2017, 127, 54–66. [Google Scholar] [CrossRef]
  87. Lothenbach, B.; Le Saout, G.; Gallucci, E.; Scrivener, K. Influence of limestone on the hydration of Portland cements. Cem. Concr. Res. 2008, 38, 848–860. [Google Scholar] [CrossRef]
Figure 1. Particle size distribution of CSAB, C$H2, and C C ¯ with d50 of ~8.45 µm, ~9.99 µm, and ~42.15 µm, respectively.
Infrastructures 10 00027 g001
Figure 2. XRD patterns of plain CSAB and M(2.99) binder with 10%, 20%, and 30% C C ¯ replacement at l/s of (a) 0.4, and (b) 0.5 after 3 days of hydration. Notation: E—ettringite; M—monosulfoaluminate; G—gypsum; A—anhydrite; S—straetlingite; Y—ye’elimite; B—belite; C—calcite.
Infrastructures 10 00027 g002aInfrastructures 10 00027 g002b
Figure 3. XRD patterns of plain CSAB and binder with 20% C C ¯ and three M-ratios at l/s of (a) 0.4, and (b) 0.5 after 3 days of hydration. Notation: E—ettringite; M—monosulfoaluminate; G—gypsum; A—anhydrite; S—straetlingite; Y—ye’elimite; B—belite; C—calcite.
Infrastructures 10 00027 g003
Figure 4. TGA profiles of l/s 0.4 (a) M(2.99) binders with three C C ¯ replacement levels and (b) 20% C C ¯ binders with three M-ratios.
Infrastructures 10 00027 g004
Figure 5. Thermodynamic phase assemblages of plain CSAB at l/s of (a) 0.4 and (b) 0.5; M(2.99) binder at l/s of 0.4 with (c) 10%, (d) 20%, and (e) 30% C C ¯ replacement levels; 20% C C ¯ binders at l/s of 0.4 with (f) 2.29 and (g) 4.83 M-ratios; and (h) M(2.99) binder at l/s of 0.5 with 20% C C ¯ replacement levels. Phase assemblages after 3 days are indicated with dashed lines.
Infrastructures 10 00027 g005aInfrastructures 10 00027 g005b
Figure 6. 3-day (a) heat flow rate profile and (b) cumulative heat release of M(2.99) binders at 10%, 20%, and 30% C C ¯ replacement levels.
Infrastructures 10 00027 g006
Figure 7. 3-day (a) heat flow rate and (b) cumulative heat release of CSAB binder with 20% C C ¯ and three M-ratios at l/s of 0.4 and 0.5.
Infrastructures 10 00027 g007
Figure 8. Compressive strengths of [CSAB + C$H2 + C C ¯ ] binders after 3 days. (a,b) C C ¯ replacement levels at l/s ratios 0.4 and 0.5.
Infrastructures 10 00027 g008
Figure 9. Correlations between compressive strength and cumulative heat released (J·gwater−1) after 3 days for both l/s ratios. Dashed line indicates trend between cumulative heat and compressive strength.
Infrastructures 10 00027 g009
Table 1. Oxide and phase composition, median particle size (d50, µm), and specific surface area (SSA, cm2/g) of CSAB.
Oxides%wt.Phases%wt.
CaO51.92Ye’elimite (C4A3$)48.50
SiO211.86Anhydrite (C$)23.20
Al2O320.45Belite (C2S)25.80
SO39.86Calcite (CaCO3)2.51
Fe2O33.34
TiO20.57
MgO1.12Particle Size d50 (µm)~8.45
Other0.89SSA (g.cm−2)5500
Table 2. Mixture designs of CSAB binders replaced by gypsum (C$H2,) and limestone ( C C ¯ ). “M-ratio” denotes the molar ratio of gypsum to ye’elimite.
Sample IDM-RatioCSAB (%wt.)C$H2 (%wt.) C C ¯ (%wt.)
Plain CSAB1.7010000
M (2.29)_10% C C ¯ 2.2983.256.7510
M (2.29)_20% C C ¯ 2.2974.06.0020
M (2.29)_30% C C ¯ 2.2964.755.2530
M (2.99)_10% C C ¯ 2.9976.513.510
M (2.99)_20% C C ¯ 2.9968.012.020
M (2.99)_30% C C ¯ 2.9959.510.530
M (4.83)_10% C C ¯ 4.8363.027.010
M (4.83)_20% C C ¯ 4.8356.024.020
M (4.83)_30% C C ¯ 4.8349.021.030
Disclaimer/Publisher’s Note: The statements, opinions and data contained in all publications are solely those of the individual author(s) and contributor(s) and not of MDPI and/or the editor(s). MDPI and/or the editor(s) disclaim responsibility for any injury to people or property resulting from any ideas, methods, instructions or products referred to in the content.

