Article

Seismic Vulnerability Assessment and Prioritization of Masonry Railway Tunnels: A Case Study

1
Department of Civil Engineering, K. N. Toosi University of Technology, No. 1346, Vali Asr Street, Mirdamad Intersection, Tehran P.O. Box 15875-4416, Iran
2
Department of Civil Engineering, University of British Columbia, 6250, Applied Science Lane, Vancouver, BC V6T1Z4, Canada
*
Author to whom correspondence should be addressed.
Infrastructures 2025, 10(10), 254; https://doi.org/10.3390/infrastructures10100254
Submission received: 3 August 2025 / Revised: 9 September 2025 / Accepted: 18 September 2025 / Published: 23 September 2025

Abstract

Assessing seismic vulnerability and prioritizing railway tunnels for seismic rehabilitation are critical components of railway infrastructure management, especially in seismically active regions. This study focuses on a railway network in Northwest Iran, consisting of 103 old masonry rock tunnels. The vulnerability of these tunnels is evaluated under 12 active faults as seismic sources. Fragility curves derived from the HAZUS methodology estimate the probability of various damage states under seismic intensities, including peak ground acceleration (PGA) and peak ground displacement (PGD). The expected values of the damage states are computed as the damage index (DI) to measure the severity of damage. A normalized prioritization index (NPI) is proposed, considering seismic vulnerability and life cycle damages in tunnel prioritizing. Finally, a detailed prioritization is provided in four classes. The results indicate that 10% of the tunnels are classified as priority, 33% as second priority, 40% as third priority, and 17% as fourth priority. This prioritization is necessary when there are budget limitations and it is not possible to retrofit all tunnels simultaneously. The main contribution of this study is the development of an integrated, data-driven framework for prioritizing the seismic rehabilitation of aging masonry railway tunnels, combining fragility-based vulnerability assessment with life-cycle damage considerations in a high-risk and data-limited region. The framework outlined in this study enables decision-making organizations to efficiently prioritize the tunnels based on vulnerability, which helps to increase seismic resilience.

1. Introduction

Railway tunnels are vital transportation infrastructure components, facilitating efficient and reliable transit. However, the structural integrity of these tunnels, particularly those constructed using traditional masonry techniques, has often been compromised by seismic activities. This study investigates a railway network in Northwest Iran, which includes 103 masonry tunnels, each over 50 years old and manually constructed. The Northwest of Iran is a seismic-prone area with several powerful active faults, and there is a lack of research on the integrated vulnerability assessment of railway tunnels in this region.
Past earthquakes have consistently demonstrated the vulnerability of tunnels to various types of damage, including cracking, spalling, and collapse [1,2,3,4]. For example, in the 1995 Kobe earthquake, more than 30 tunnels sustained minor damage, and 10 tunnels needed significant repairs to ensure their safety [5]. During the 1999 Chichi earthquake in Taiwan, damage was reported in 50 tunnels, with 26 experiencing minor damage, 11 suffering moderate damage, and 13 being severely damaged [6]. In the 2008 Wenchuan earthquake with a moment magnitude of 7.8, inspections have revealed that 42 out of 52 tunnels have been damaged. Among these, 20 tunnels have experienced severe damage such as portal collapses, rock falls, and significant lining cracks, necessitating major repair [7]. The 2016 Kumamoto Earthquake in Japan, with a magnitude of 7.3, has caused various types of damage to the Tawarayama tunnel, including lining spalling and collapse, joint failures, groundwater leakage, and pavement deterioration [8]. However, there are numerous reports of tunnel damage caused by earthquakes [9,10,11,12,13], and it is vital to evaluate their seismic vulnerability and prioritize them for retrofitting, especially in old tunnels.
In recent years, there has been a growing body of research focusing on the seismic response of tunnels using a variety of experimental, numerical, and analytical approaches. Tsinidis et al. presented a comprehensive state-of-the-art review, including case studies of actual tunnel responses during earthquakes, shaking-table and centrifuge experiments, and modern numerical models, thereby highlighting current gaps and future research directions [14]. More recently, Wang et al. carried out shaking-table experiments and numerical analyses to investigate the seismic interaction mechanisms between adjacent horizontal parallel tunnels, revealing that tunnel spacing, burial depth, motion type, and soil characteristics significantly influence seismic behavior [15]. Zhao et al. developed three-dimensional numerical models to analyze the dynamic response of curved tunnels subjected to transverse SV-wave incidence, offering insights into deformation and internal force distributions under realistic conditions [16]. Complementing these studies, Lei et al. conducted shaking-table tests on overlapping tunnels simulating oblique intersecting configurations and evaluating structural responses under seismic loading. Collectively, these recent contributions underline the importance of accounting for complex tunnel geometries, soil–structure interactions, and multi-tunnel effects when assessing seismic vulnerability—strengthening the rationale for adopting an integrated prioritization framework as proposed in the present study [17]. In addition, recent studies have begun to address challenges unique to masonry structures. For instance, a study on the seismic retrofitting of a rubble masonry tunnel evaluated alternatives such as steel fiber shotcrete and inner concrete lining, offering insights into effective strengthening strategies for aging masonry tunnels. Meanwhile, post-earthquake investigations of tunnel performance during the February 2023 Kahramanmaraş earthquake sequence revealed that existing seismic risk models could be verified and refined based on real-world behavior, underscoring the need for reliable assessment frameworks, especially relevant to vulnerable or aged tunnels [18].
There are limited studies on old masonry tunnel modeling [19,20,21]. The existing technical literature is typically focused on modern reinforced concrete tunnel seismic vulnerability assessment [22,23,24,25,26]. Fragility curves serve as a main approach to represent the probability of a tunnel reaching or exceeding a specific damage state given a specific seismic intensity [27]. These curves have been developed using observational data from past earthquakes and analytical tunnel models [28]. Fragility curves provide a probabilistic assessment of tunnel performance under seismic loading and are widely used in vulnerability and risk assessment frameworks such as HAZUS [29]. Argyroudis and Pitilakis [30] proposed a numerical method for analyzing the seismic fragility of shallow tunnels located in alluvial deposits. Huang et al. [31] developed an analytical technique to create seismic fragility curves for rock tunnels by employing support vector machines (SVM), taking into account various uncertainties. Jamshidi Avanaki et al. [32] introduced a set of fragility curves for steel fiber-reinforced concrete used in segmental tunnels. Zhao et al. [33] developed fragility curves for circular tunnels by numerical modeling, taking into account factors such as the properties of the concrete, the dimensions of the tunnel lining, and the reinforcement ratio. Ansari et al. [34] assess the seismic vulnerability of circular tunnels in Jammu and Kashmir (India), utilizing fragility functions and microzonation to evaluate damage probabilities across different hazard zones.
Other methods based on finite element analysis (FEA) provide a more detailed approach by simulating the seismic response of tunnels specifically [35]. FEA divides the tunnel structure and surrounding ground into small, discrete elements governed by mathematical equations, offering insights into stress distributions, deformation, and potential failure points in tunnel structures. Several studies have applied FEA to different tunnel types, including circular and rectangular tunnels, shallow and deep tunnels, as well as tunnels in soft and rock soils, highlighting tunnel-specific behavior under seismic loading [36,37,38]. The simplified method for seismic analysis of long tunnels is a practical approach widely used by practitioners. This method generally models the tunnel as a beam supported by mass-spring systems connected to the ground, enabling analytical solutions for seismic response while significantly reducing computational effort compared to FEA [39]. Tunnel-specific applications of simplified methods have been reported in recent studies, demonstrating their effectiveness in predicting tunnel deformation and potential damage during earthquakes [40]. Recent advancements in artificial intelligence (AI) have also introduced new dimensions to seismic vulnerability assessment. Machine learning techniques, including deep learning [41], random forest [42], artificial neural networks [43,44], fuzzy seismic fragility analysis [45], and fuzzy multi-criteria decision-making analysis [46], are used to analyze large and complex datasets for predicting tunnel performance and damage.
As mentioned, the majority of the existing research has concentrated on modern tunnels constructed with reinforced concrete or advanced linings, whereas masonry tunnels—widely used in historical railway networks and still in service in many countries—have received far less attention in terms of seismic vulnerability assessment. Their age, material degradation, and construction techniques make them substantially more fragile than modern counterparts. Furthermore, unlike concrete tunnels, masonry tunnels often exhibit irregular geometries, discontinuities, and weaker interfaces, which exacerbate their susceptibility to seismic damage. This knowledge gap underlines the necessity of studies dedicated to the seismic response and prioritization of masonry tunnels, particularly within critical transportation networks, as pursued in the present research.
However, the mentioned studies have been limited to the seismic vulnerability of one tunnel, and there is no study in the literature that prioritizes tunnels of a large network for seismic retrofitting, especially old railway tunnels. This study aims to address the gaps in existing research by providing an integrated vulnerability assessment of old railway tunnels under seismic excitation and establishing a systematic prioritization framework for their retrofitting. The present study investigates the seismic vulnerability of aging railway network tunnels in northwest Iran, which is a highly seismic-prone area. In this area, there are 103 tunnels, all over 50 years old. Five major active faults and seven micro faults are seismic sources threatening the tunnels. In this study, the term “micro faults” refers to smaller-scale faults that are typically less significant than major faults but can affect seismic activity. The seismic intensities, including peak ground acceleration (PGA) and peak ground displacement (PGD) at each tunnel location, have been calculated based on the seismic scenarios of each fault. The damage index (DI) of the tunnels has been obtained using the fragility curves provided in the HAZUS [29] methodology. Then, a normalized prioritization index (NPI) has been proposed to classify the tunnels for retrofitting. NPI not only takes into account seismic damage but also evaluates damage from the tunnel’s lifecycle based on visual inspections. Finally, based on the NPI criteria, the tunnels are prioritized for seismic rehabilitation into four categories. The findings of this study can significantly improve the safety of railway infrastructure in seismic regions when there are budget limitations for rehabilitation.
The study’s remaining sections are organized as follows. Section 2 introduces the network topology of the study area and tunnel locations. Section 3 presents the topology of faults, seismicity characteristics of faults, and seismic intensity measures in the location of each tunnel. Section 4 describes the vulnerability analysis of tunnels. Section 5 develops the procedure for prioritizing tunnels, and Section 6 is the conclusion of this research.

2. Network Topology and Tunnel Location Identification

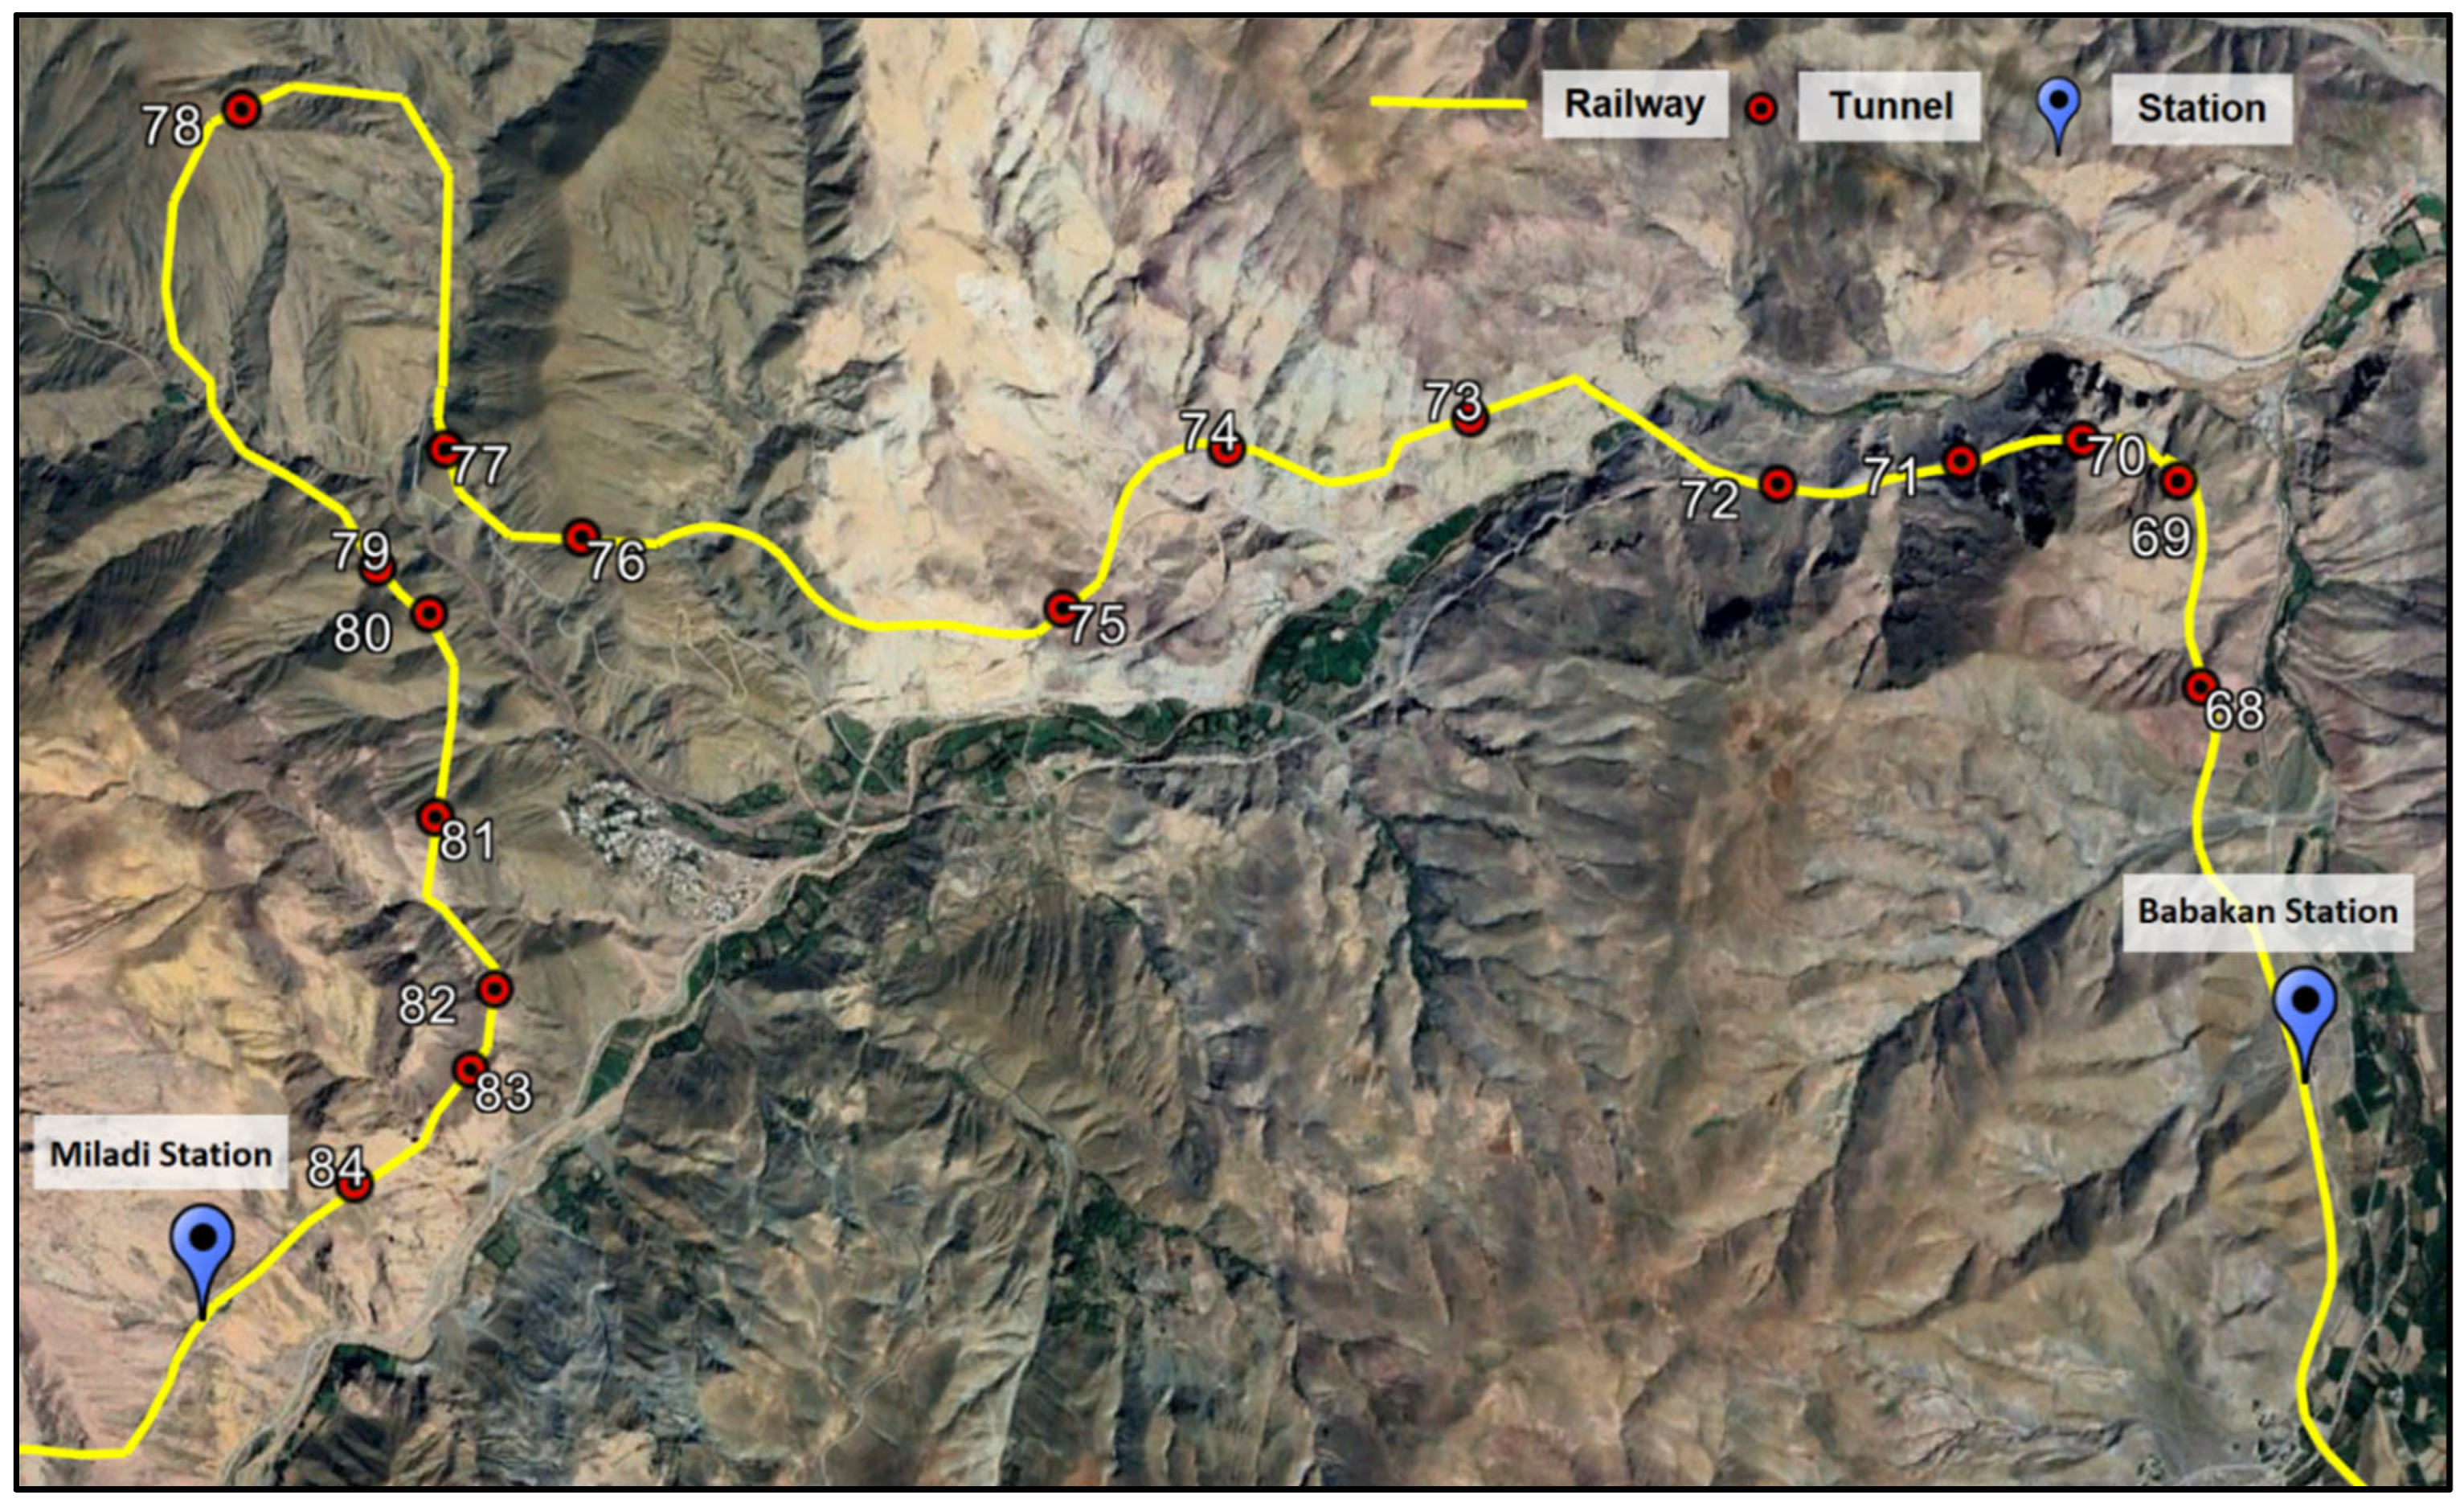
The railway network examined in this research, located in the northwest region of Iran, is marked on the Google Earth map and displayed in Figure 1. As shown in Figure 1, the railway network that is investigated in this research starts from Zanjan station and finally ends at Jolfa and Razi stations in East and West Azerbaijan provinces. Figure 2 provides a close-up view of tunnel locations and the railway line. Figure 3 provides examples of railway tunnels within the study area.
In the first step, the geographic coordinates (longitude and latitude) of the tunnels need to be extracted. These coordinates will then be used in the next steps to calculate the distance of each tunnel from the faults. The parameters of the tunnels in the network, including the number and type of tunnels, have been obtained from the Railway Organization of the Islamic Republic of Iran. The location of each tunnel has been manually extracted on the Google Earth map with high accuracy. The study area contains 83 tunnels and 20 galleries (in total 103 cases). In railways, galleries are used to prevent rocks and debris from falling onto the trains and tracks. These protective structures, often designed as semi-open tunnels or reinforced shelters, safeguard the railway infrastructure from natural hazards such as rockfalls and landslides. By providing a barrier between the mountain and the railway line, these galleries enhance safety for trains and passengers while also extending the lifespan of the railway tracks and related infrastructure.

3. Identification of Active Faults in the Region and Calculation of Intensity Measures

Earthquakes are primarily caused by the movement of faults in the Earth’s crust. Faults are fractures or zones of weakness where blocks of rock can move relative to each other. Over time, tectonic forces accumulate tension along these faults. When this stress surpasses the rock’s strength, the energy is released as seismic waves. This sudden release of energy causes the ground to shake, resulting in an earthquake. The location where the fault initially ruptures is known as the focal point, and the point on the Earth’s surface directly above it is the epicenter. Faults are categorized into three main types based on geometry and displacement: normal faults (extension of the crust), reverse faults (compression of the crust), and strike-slip faults (lateral movement).
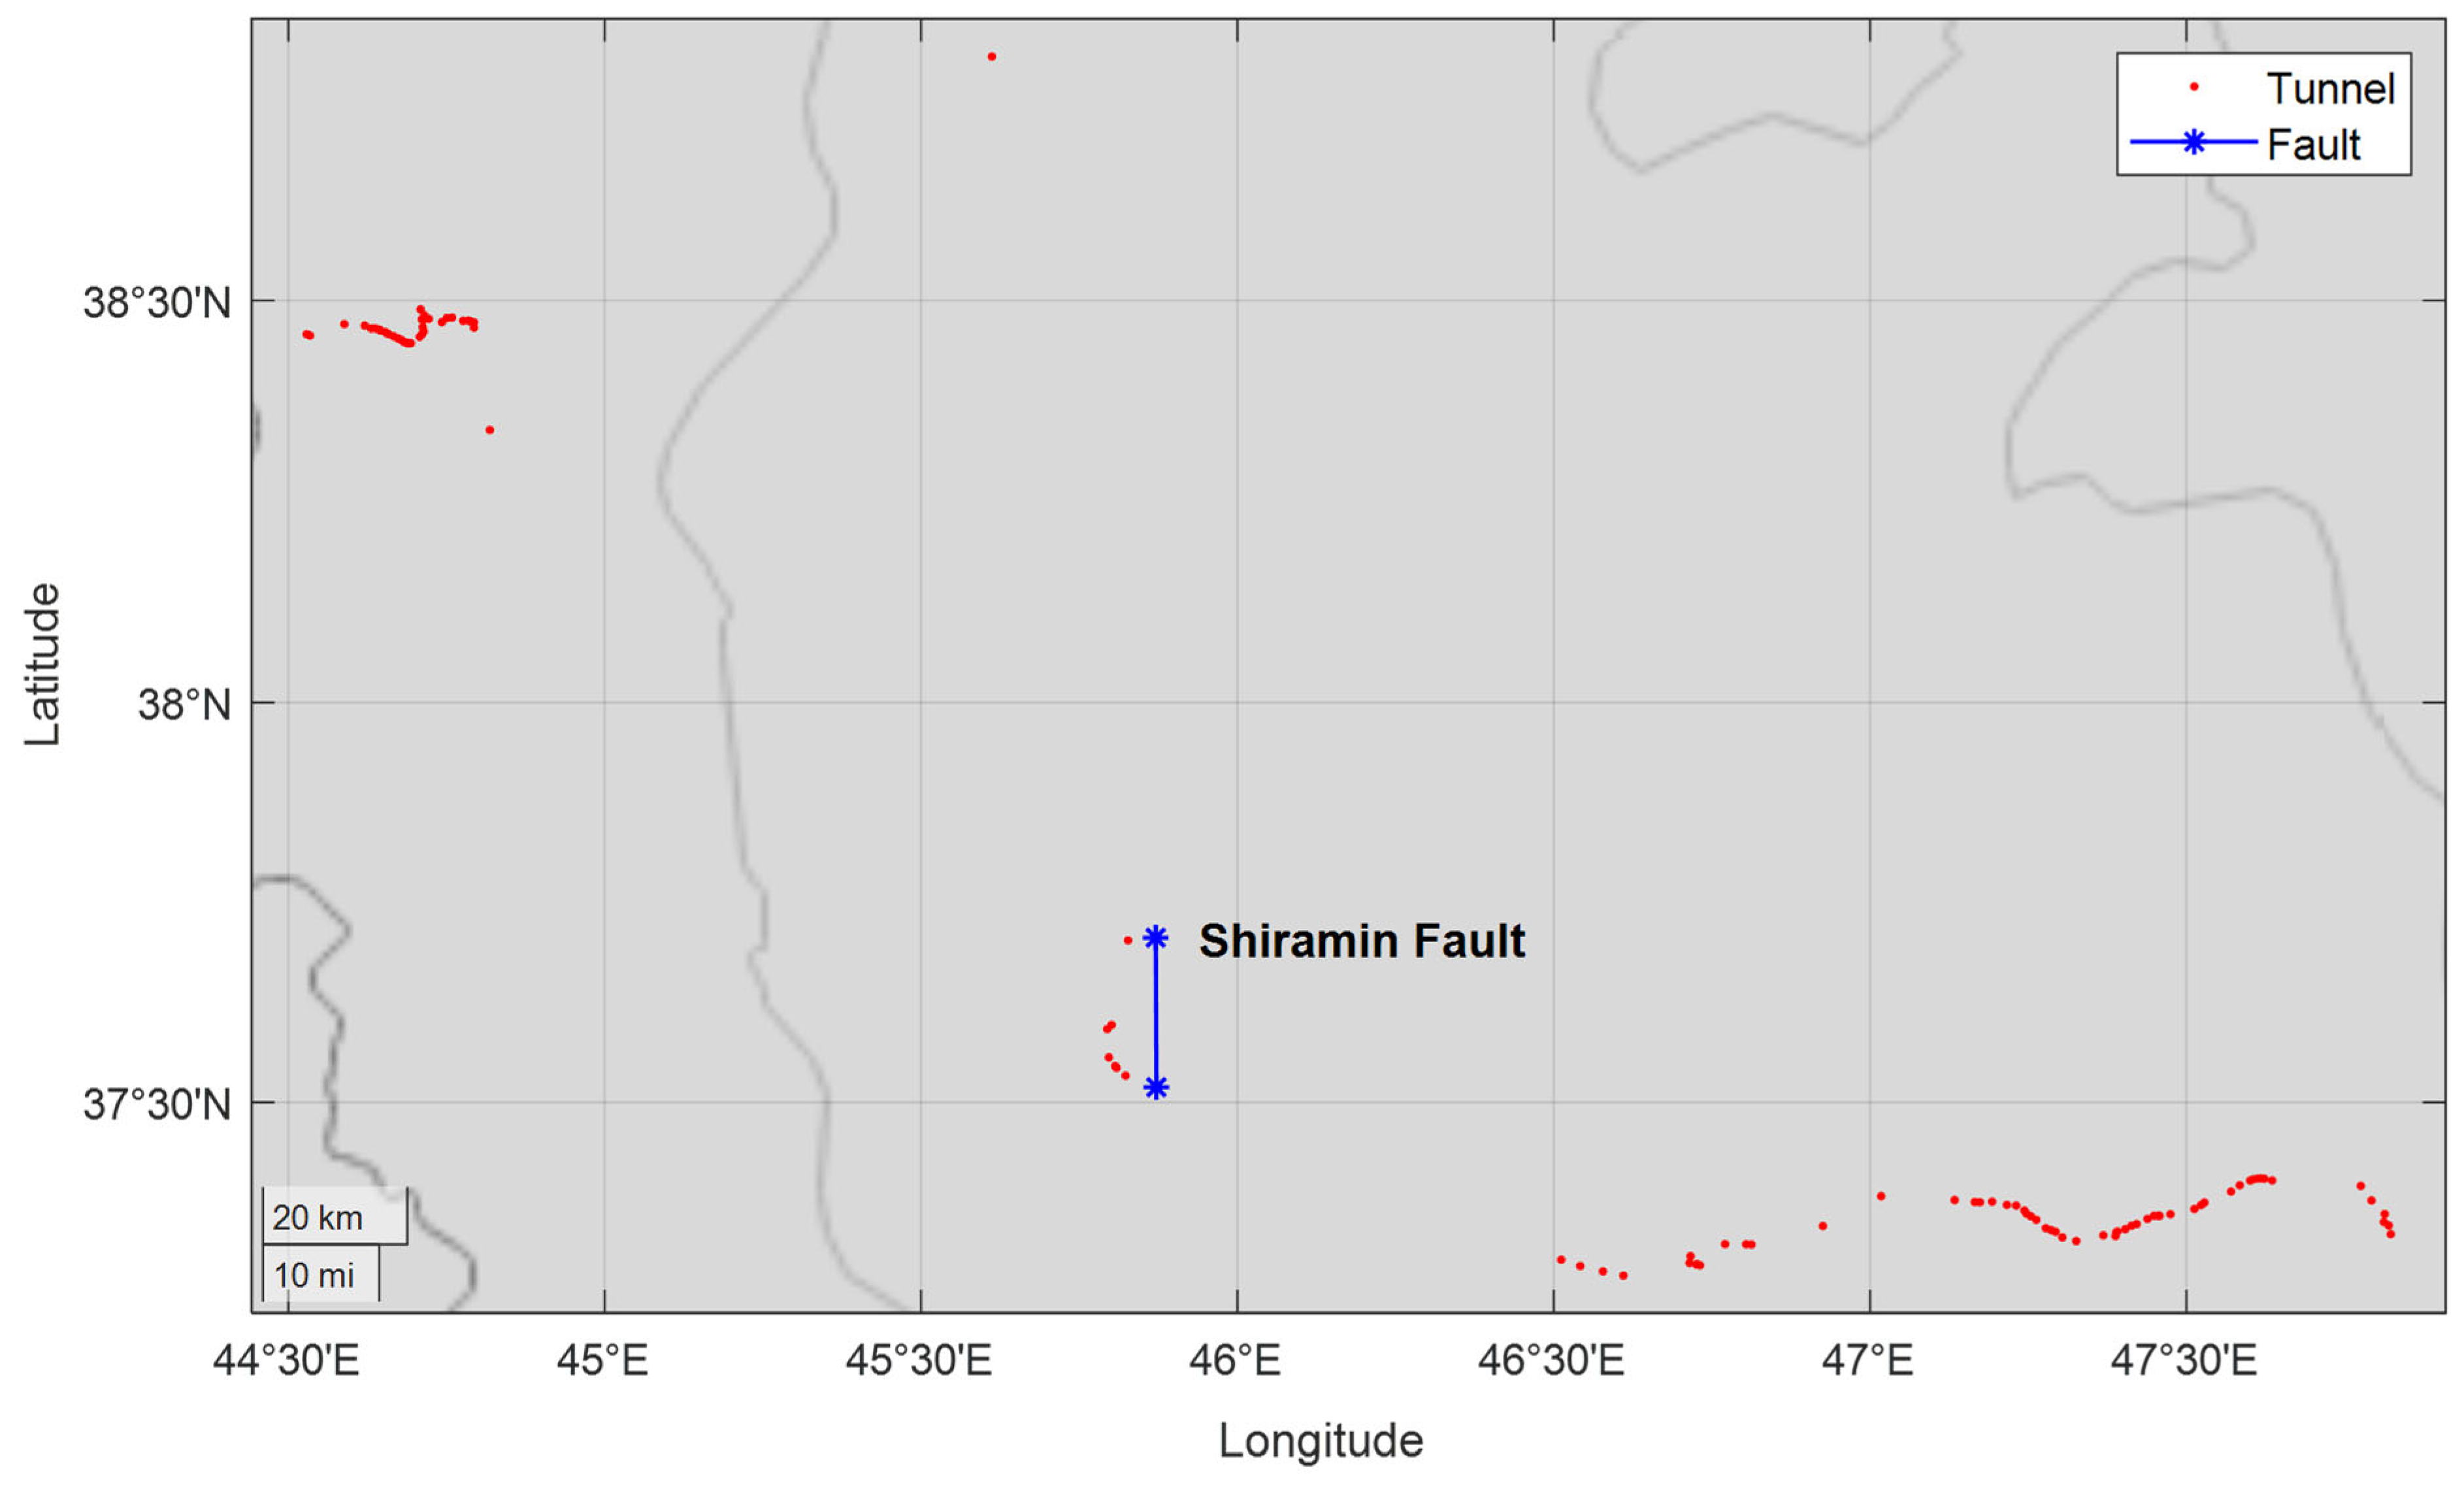
In this research, faults are modeled by multi-segment lines on the ground surface. The main active faults that affect the tunnels have been determined based on the studies of the Seismography Center of the Geophysics Institute of Tehran University. Five active faults, including Tabriz, Maku, Ahar, Bozqush, and Takhte Solaiman, are the main faults that will affect the tunnels. Due to their significant length and potential to generate high-magnitude seismic events, the maximum ground acceleration (PGA) caused by these faults has been investigated in the vulnerability analysis of the tunnels. To consider the effects of micro-faults on the vulnerability of tunnels, the GIS layer of the fault map has been received from the Geological Organization of Iran, and seven effective micro-faults have been identified in the region. Due to their short length and limited seismic energy release, micro-faults may not generate significant ground acceleration at the regional scale. However, if these micro-faults are located in proximity to tunnels, the resulting ground displacement can pose a serious risk of structural damage [47,48]. For this reason, the maximum ground displacement (PGD) may be more important than acceleration in assessing tunnel damage influenced by micro-faults. Figure 4 shows the location of the tunnels, main faults, and micro-faults near the tunnels.

3.1. Determining Seismicity Parameters of Faults

Determining the seismicity characteristics of faults in a region is an important parameter in estimating seismic vulnerability. To analyze the seismic vulnerability, it is necessary to collect the required data from the seismic sources. Seismicity parameters of faults, such as the geometry of faults, length of faults, faulting mechanism, maximum magnitude, etc., are crucial for understanding earthquake potential hazards and vulnerability assessments.

3.1.1. Determination of Fault Length and Faulting Mechanism

Fault length and faulting mechanism are the most important influencing parameters in predicting the seismic power of faults. In this section, the length of the faults and their mechanism of faulting are extracted from the data taken from the Geological Organization of Iran and the Seismography Center of the Institute of Geophysics of Tehran University and are shown in Table 1.
In Table 1, the faults are classified into strike-slip and reverse types. A fault that mostly moves horizontally along the fault line with little to no vertical displacement is known as a strike-slip fault. These faults are characterized by lateral motion, which can be either right-lateral or left-lateral. When compressional forces push the hanging wall upward to the footwall, typically at angles greater than 45 degrees, a reverse fault is formed. A specific type of reverse fault with a shallow dip of less than 45 degrees is called a thrust fault. Both types result from compressional stresses and are significant in mountain regions, capable of generating powerful earthquakes due to the substantial energy released when these faults slip.

3.1.2. Determination of the Maximum Magnitude of the Fault

In this research, the maximum magnitude that the fault has the potential to create has been used to evaluate the damage of tunnels because this is the worst-case seismic scenario in network vulnerability assessment. Several relations are provided to calculate the maximum magnitude of a fault [49]. In this study, four relationships are employed to determine the maximum moment magnitude of faults ( M m a x ) according to Equations (1) to (4). These relationships have been respectively proposed by Wells and Coppersmith [50], Nowroozi [51], Ghassemi [52], and Thingbaijam et al. [53]. The detailed formulations are presented in the following.
S t r i k e s l i p M w = 1.21   L o g L + 5.16 R e v e r s e M w = 1.22   L o g L + 5 N o r m a l M w = 1.32   L o g L + 4.86
A l l M w = 0.86   L o g L + 5.36
S t r i k e s l i p M w = 0.81   L o g L + 5.66 T h r u s t M w = 0.97   L o g L + 5.29
S t r i k e s l i p M w = 1.47   L o g L + 4.32 R e v e r s e M w = 1.63   L o g L + 4.38 N o r m a l M w = 2.06   L o g L + 3.55
where (L) represents the fault length in kilometers. In this research, to reduce uncertainty, all the above 4 relationships have been used to calculate the maximum magnitude of faults, and their average is considered as the maximum possible magnitude of each fault listed in Table 2.

3.1.3. Calculation of the Peak Ground Acceleration and Peak Ground Displacement

Attenuation relationships are employed to calculate the seismic intensity measure, including PGA and PGD. In this research, the attenuation relationship developed by Darzi et al. [54] has been used to calculate the PGA at the location of each tunnel. This attenuation relationship, developed using seismic data from Iranian earthquakes, is highly accurate in determining seismic intensity. The general form of this attenuation relationship is presented in the following Equation (5):
L o g 10 y = f M + f R + f s i t e + f S o F + ε
where
f M = c 1 + m 1 M w + m 2 M w 2
f R = r 1 L o g 10 R 2 + h 2
f s i t e = S I I I I + S I I I I I I
f S o F = f R V R V + f S S S S
In Equation (5), y is the seismic intensity measure including PGA (cm/s2), PGV (m/s), and spectral acceleration SA (cm/s2) in different periods and f M is magnitude function, f R is distance function, f s i t e is a function of soil type and f S o F is a function of the faulting mechanism of faults.
In Equation (5a), M w is the moment magnitude, and c 1 , m 1 and m 2 are regression coefficients. In Equation (5b), R is the closest distance of the structure (in this study, the tunnel) from the fault, r 1 and h are linear regression coefficients. In Equation (5c), II = 1, III = 0 for type soil II ( 375 < V s 30 < 750 ) and III = 1, II = 0 for type soil III ( 375 < V s 30 ) which V s 30 is the shear wave velocity in m/s and S I I , S I I I are regression coefficients. In Equation (5d), parameters R V = 1 and SS = 0 for thrust-reverse fault and R V = 0 and SS = 1 for strike-slip fault, and for other faults, both parameters are equal to zero, also f R V and f S S are regression parameters. All the regression parameters in Equations (5a) to (5b) are provided in Darzi et al. [54].
To calculate the peak ground displacement (PGD) at each tunnel’s location, the attenuation relationship developed by Alavi et al. [55] is used. This attenuation relationship is according to Equation (6):
L n P G D c m = 8 + M w + 4 M w 4 L n R C l s t D 6 + L n R C l s t D 8 + L n R C l s t D + M w 2 / L n R C l s t D + M w L n R C l s t D M w 9 2 M w L n R C l s t D 3 L n R C l s t D 2 sin γ + V s 30   M w 3 M w 15  
where M w is the moment magnitude, R C l s t D is the closest distance from the structure to the fault, V s 30 is the shear wave velocity at a depth of 30 (m) of the earth and sin γ is the function of the faulting mechanism as follows:
sin γ = 0.25   strike slip 1   N o r m a l 1   Reverse
Since this attenuation relationship is based on a comprehensive database of Iranian earthquakes and provides highly accurate ground displacement estimates, other attenuation relationships are not employed in this study.

4. Tunnel Vulnerability Assessment

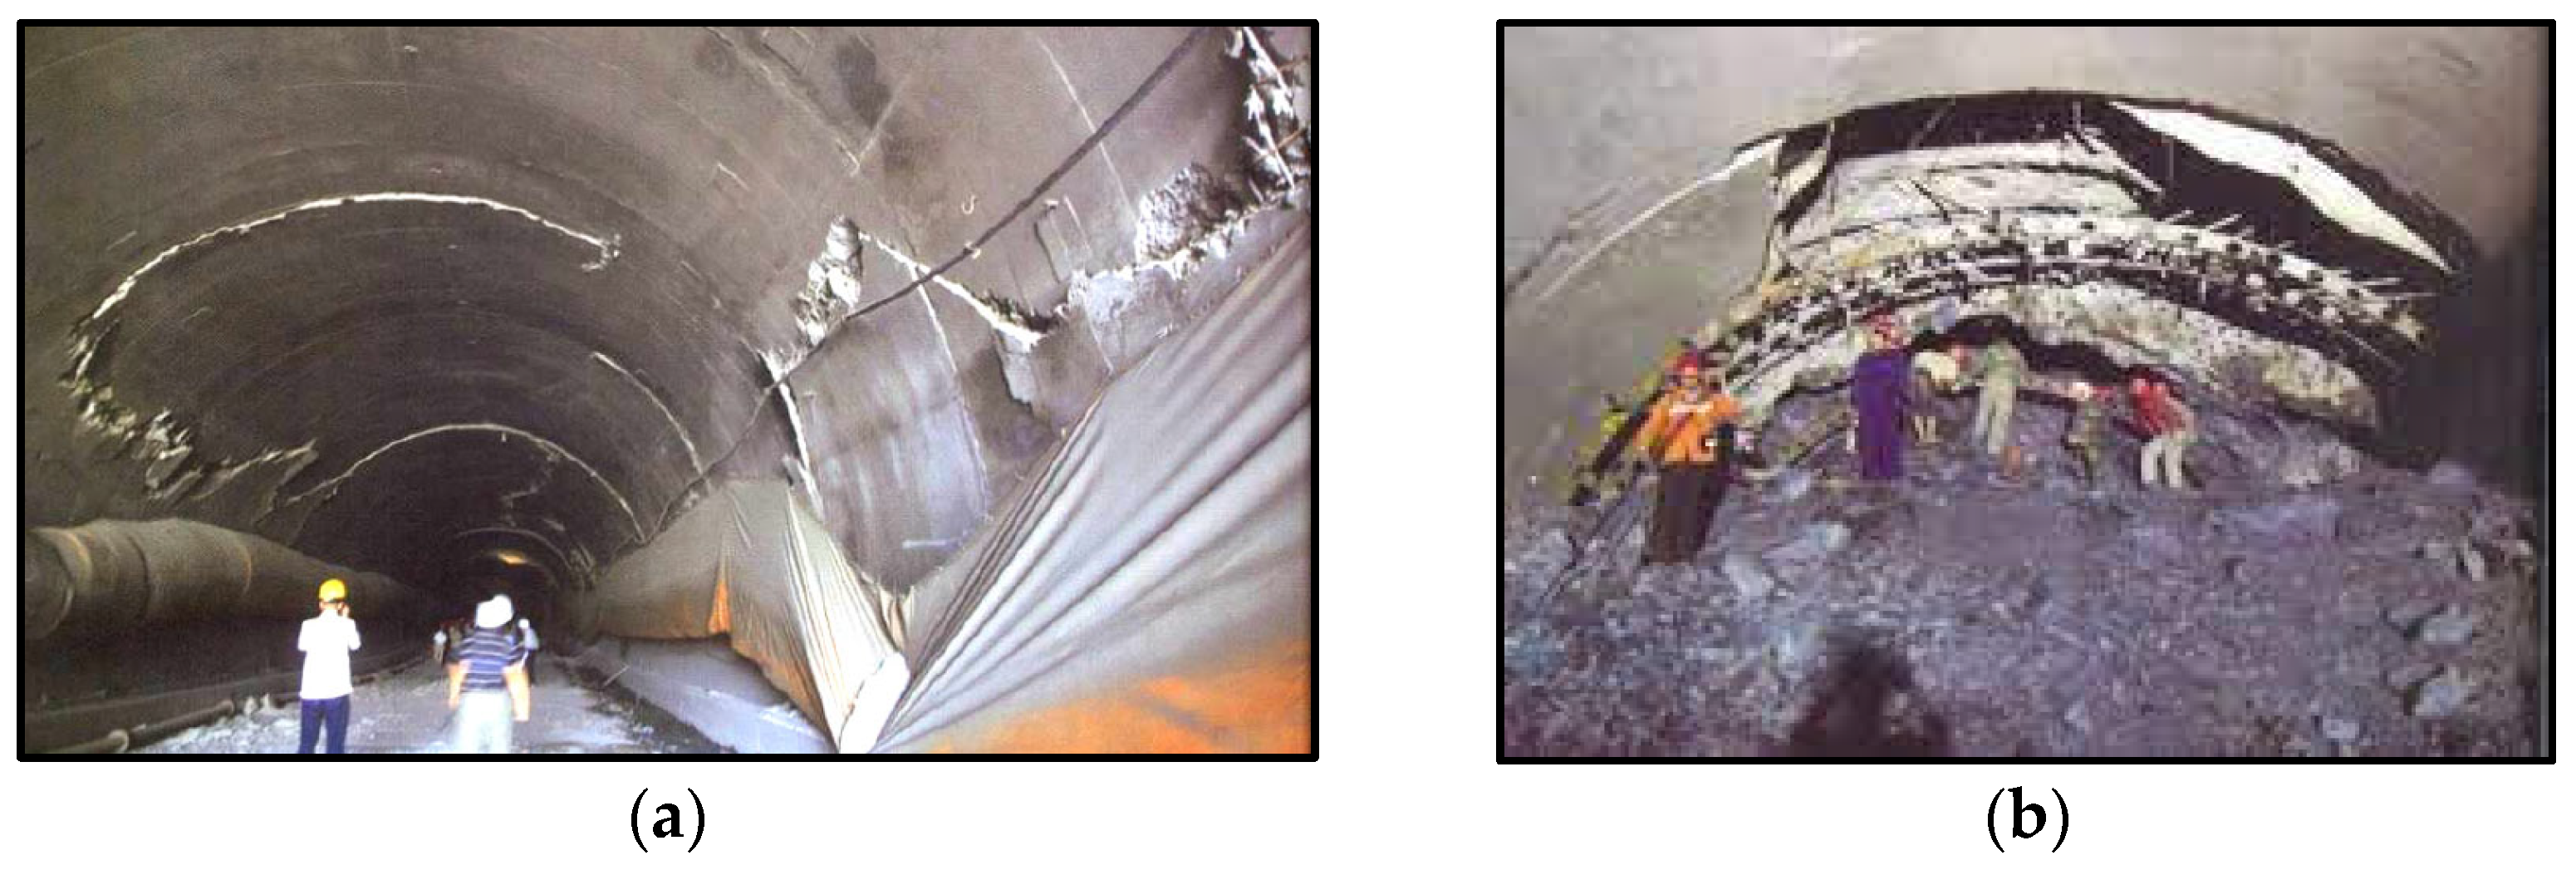
Historical earthquakes have demonstrated that tunnels are vulnerable to seismic events. Significant damage can occur due to ground shaking, fault rupture, or soil-structure interaction. For instance, Figure 5 illustrates examples of tunnel damage from various past earthquakes, highlighting the range and severity of impacts that seismic events can have on tunnel structures.
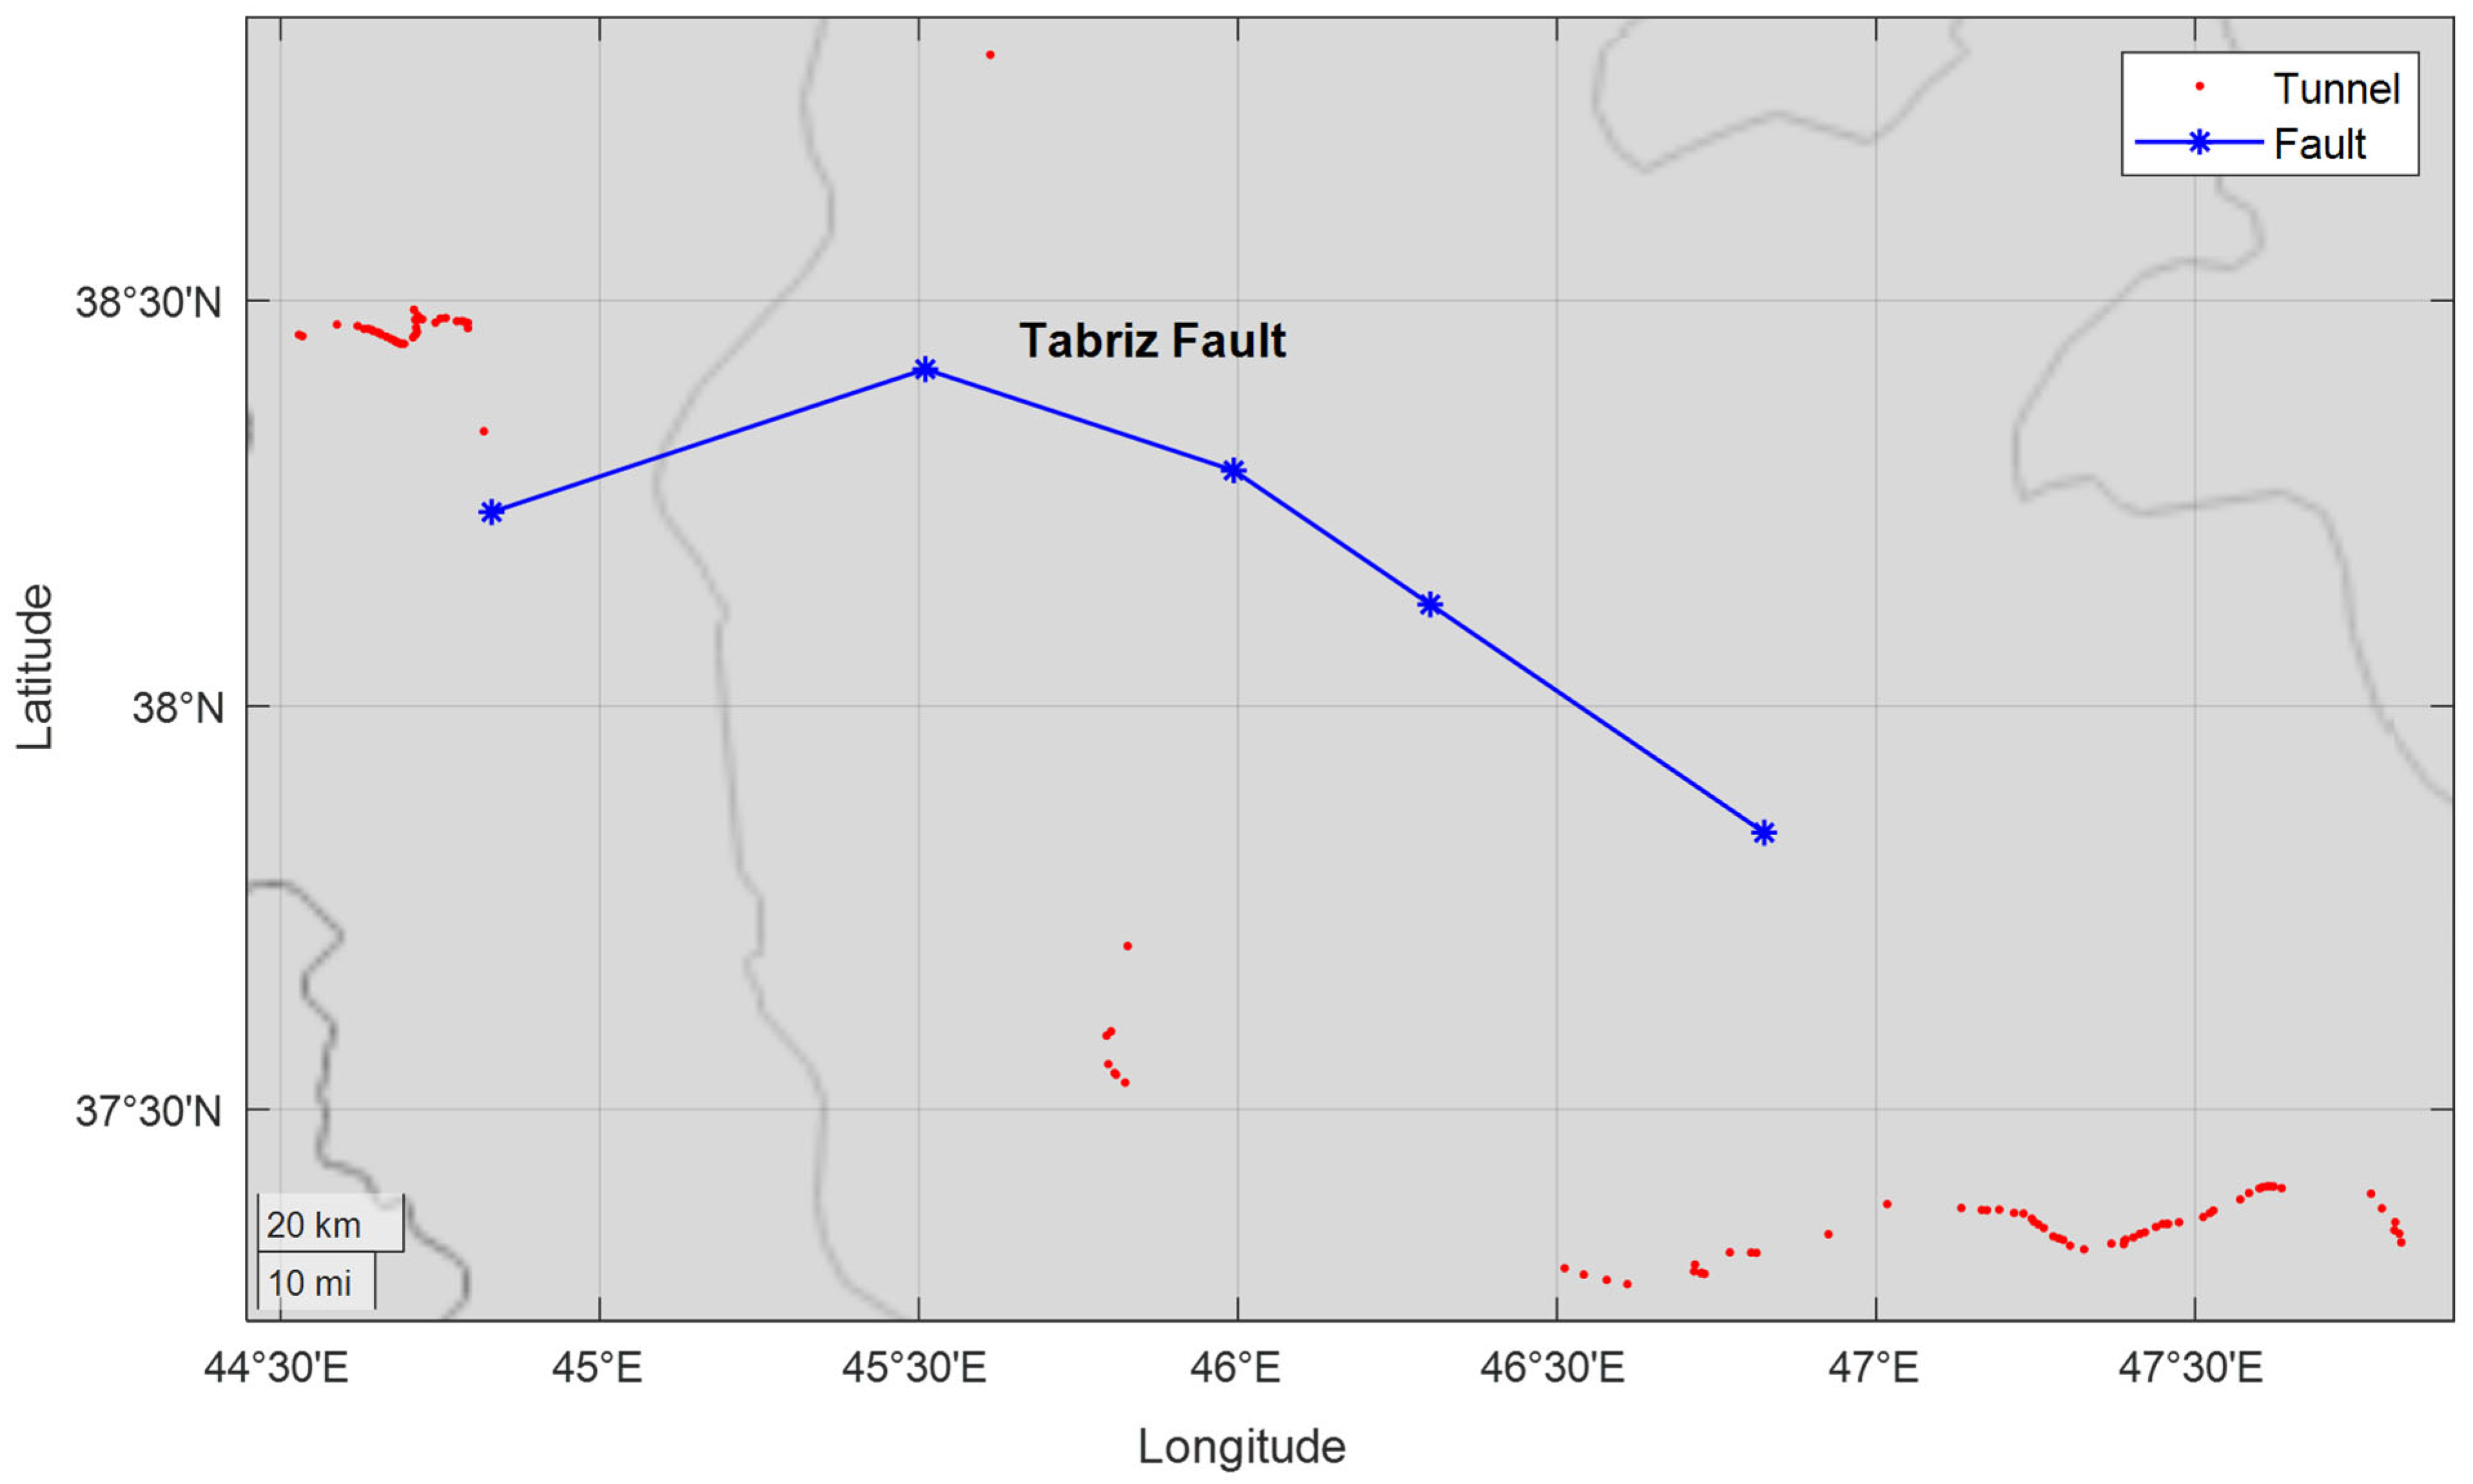
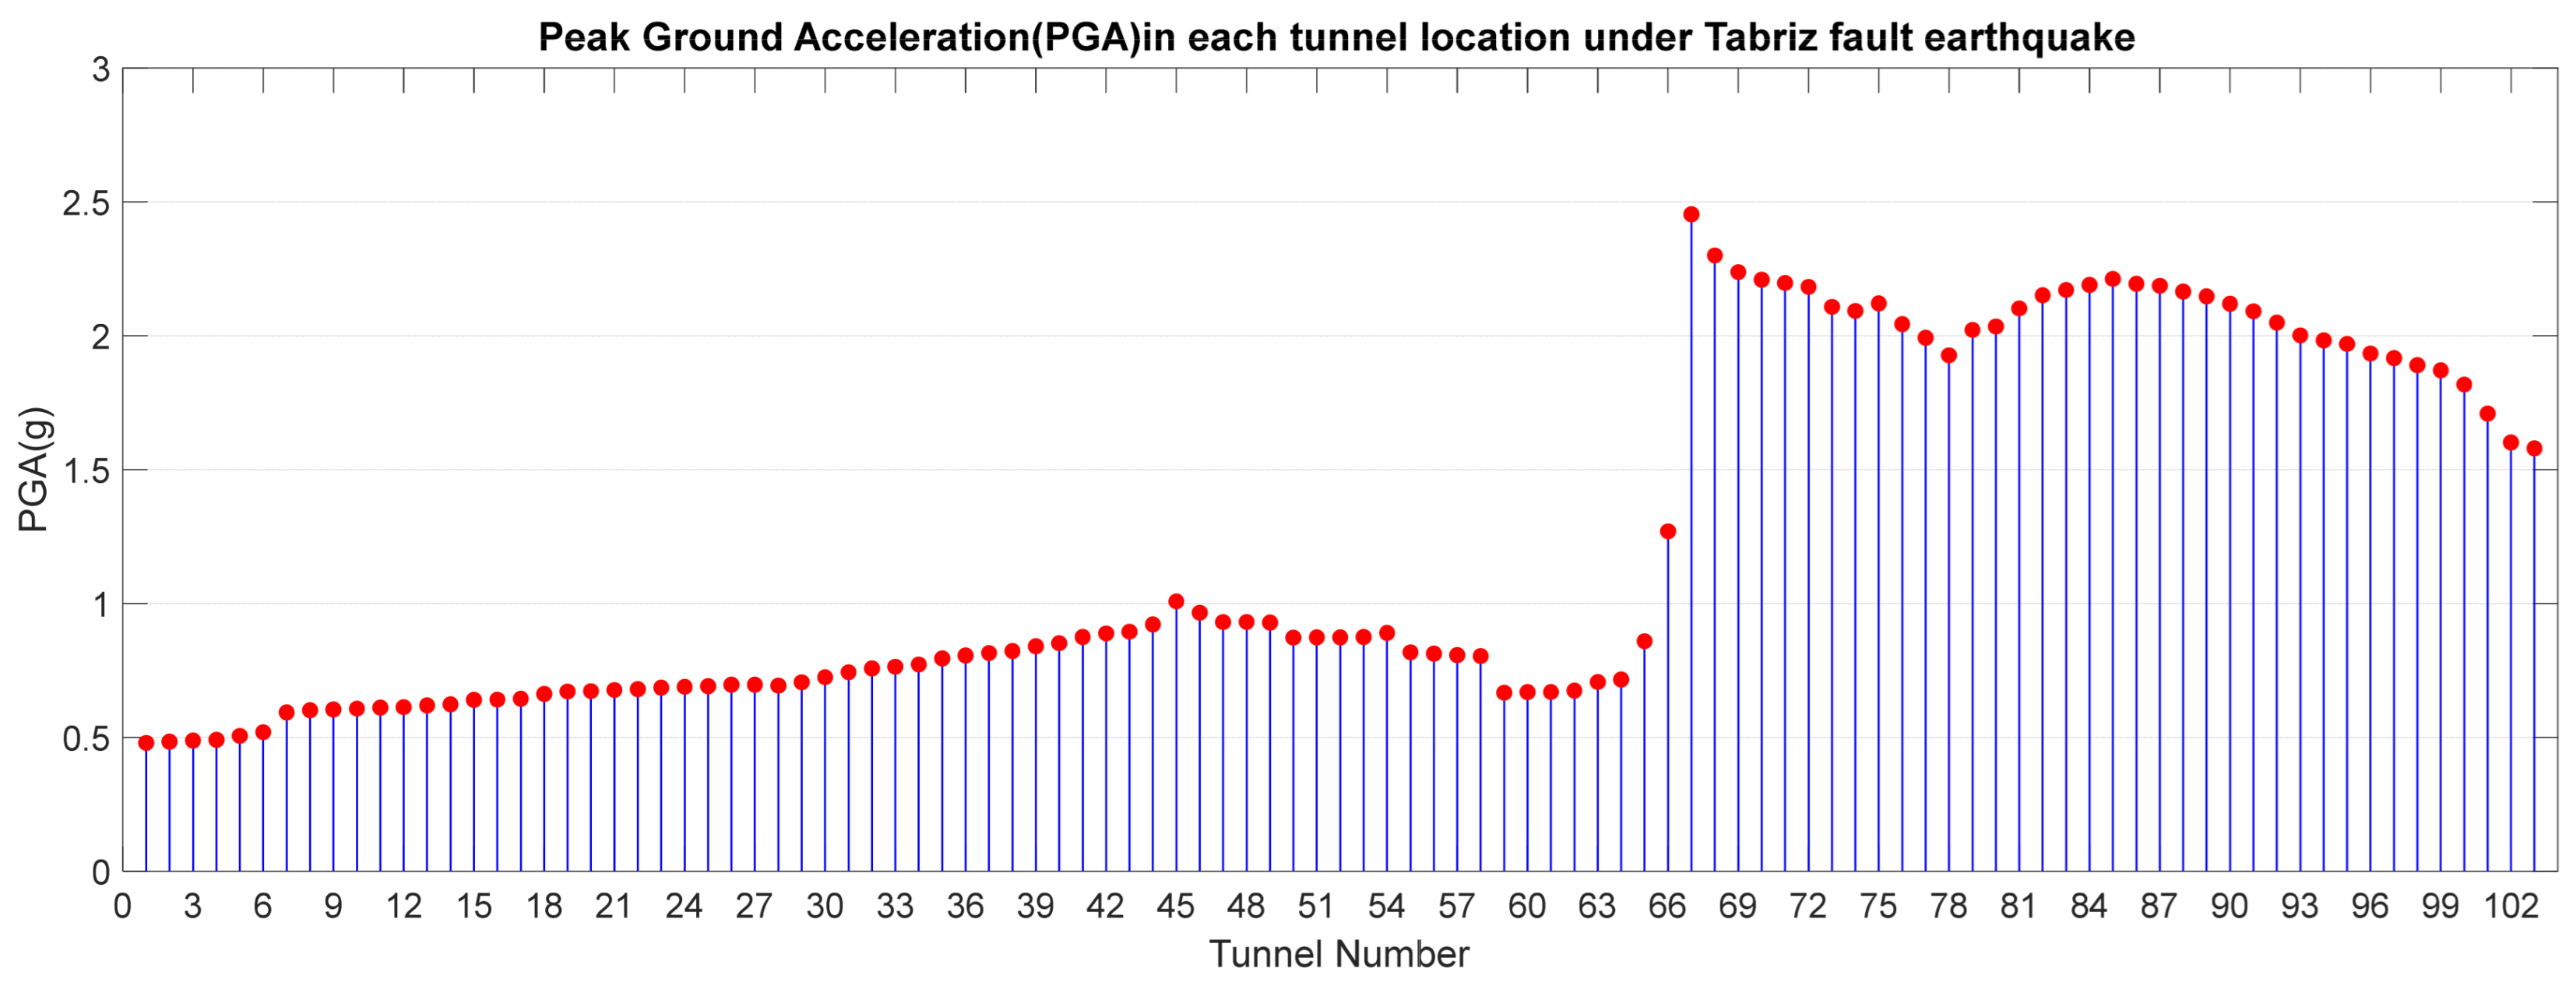
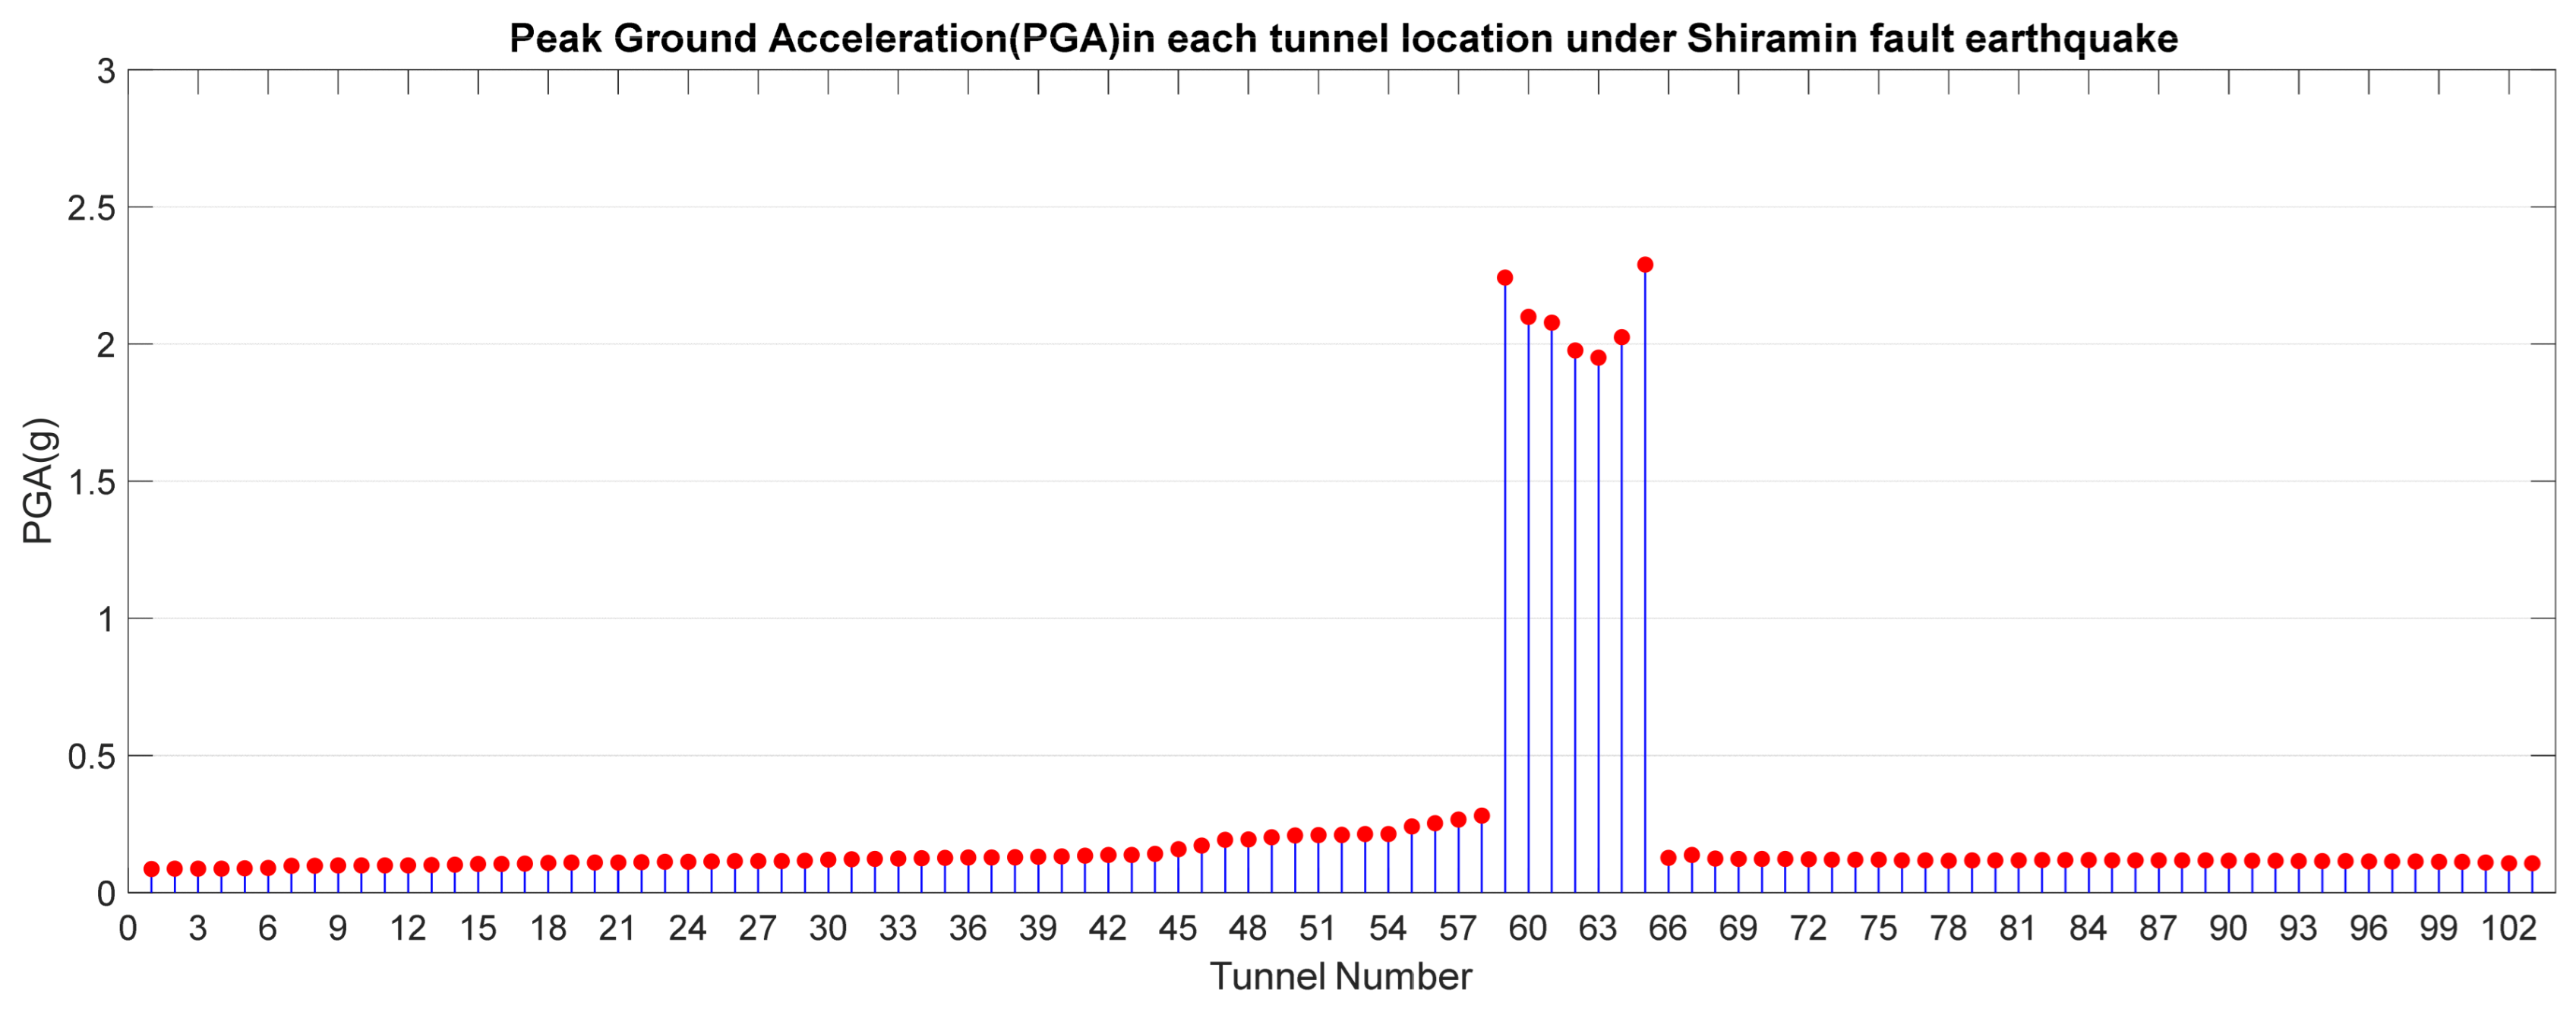
The PGD and PGA at the location of each tunnel have been calculated based on Equations (5) and (6) for the earthquake caused by each of the 12 faults. As an example, Figure 6, Figure 7, Figure 8, Figure 9, Figure 10 and Figure 11 show the PGD and PGA at the location of each tunnel under the Tabriz fault and Shiramin fault earthquake, respectively.
In this research, the approach for analyzing tunnel vulnerability is based on fragility curves. The fragility curve shows the probability of exceeding a damage state (DS) for various levels of seismic intensity. The fragility curve is usually expressed based on the lognormal distribution according to Equation (7):
  P D S D S k | I M = Φ ln I M ln Θ k β k
where P D S D S k | I M is the probability of exceeding the k-th damage state, Φ is the cumulative standard normal probability function, IM is the seismic intensity measure including PGA and PGD, Θ k and β k     are the median and standard deviation of the k-th damage state. Considering that the tunnels in the study network are rock-type, the fragility parameters of these tunnels should be extracted from the technical instructions. An identical fragility curve, which is derived from the HAZUS [29] and SYNER-G [56] methodologies, is used to analyze the vulnerability of all tunnels. Generating a specific fragility curve for each tunnel using analytical methods, such as incremental dynamic analysis (IDA), would be more beneficial. This process requires rock mechanics tests to determine the properties of the tunnel lining, such as compressive strength, modulus of elasticity, and other required parameters. However, due to the large number of old masonry tunnels (103 in total) and the limited availability of geotechnical data, tunnel-specific fragility development is out of the scope of this study.
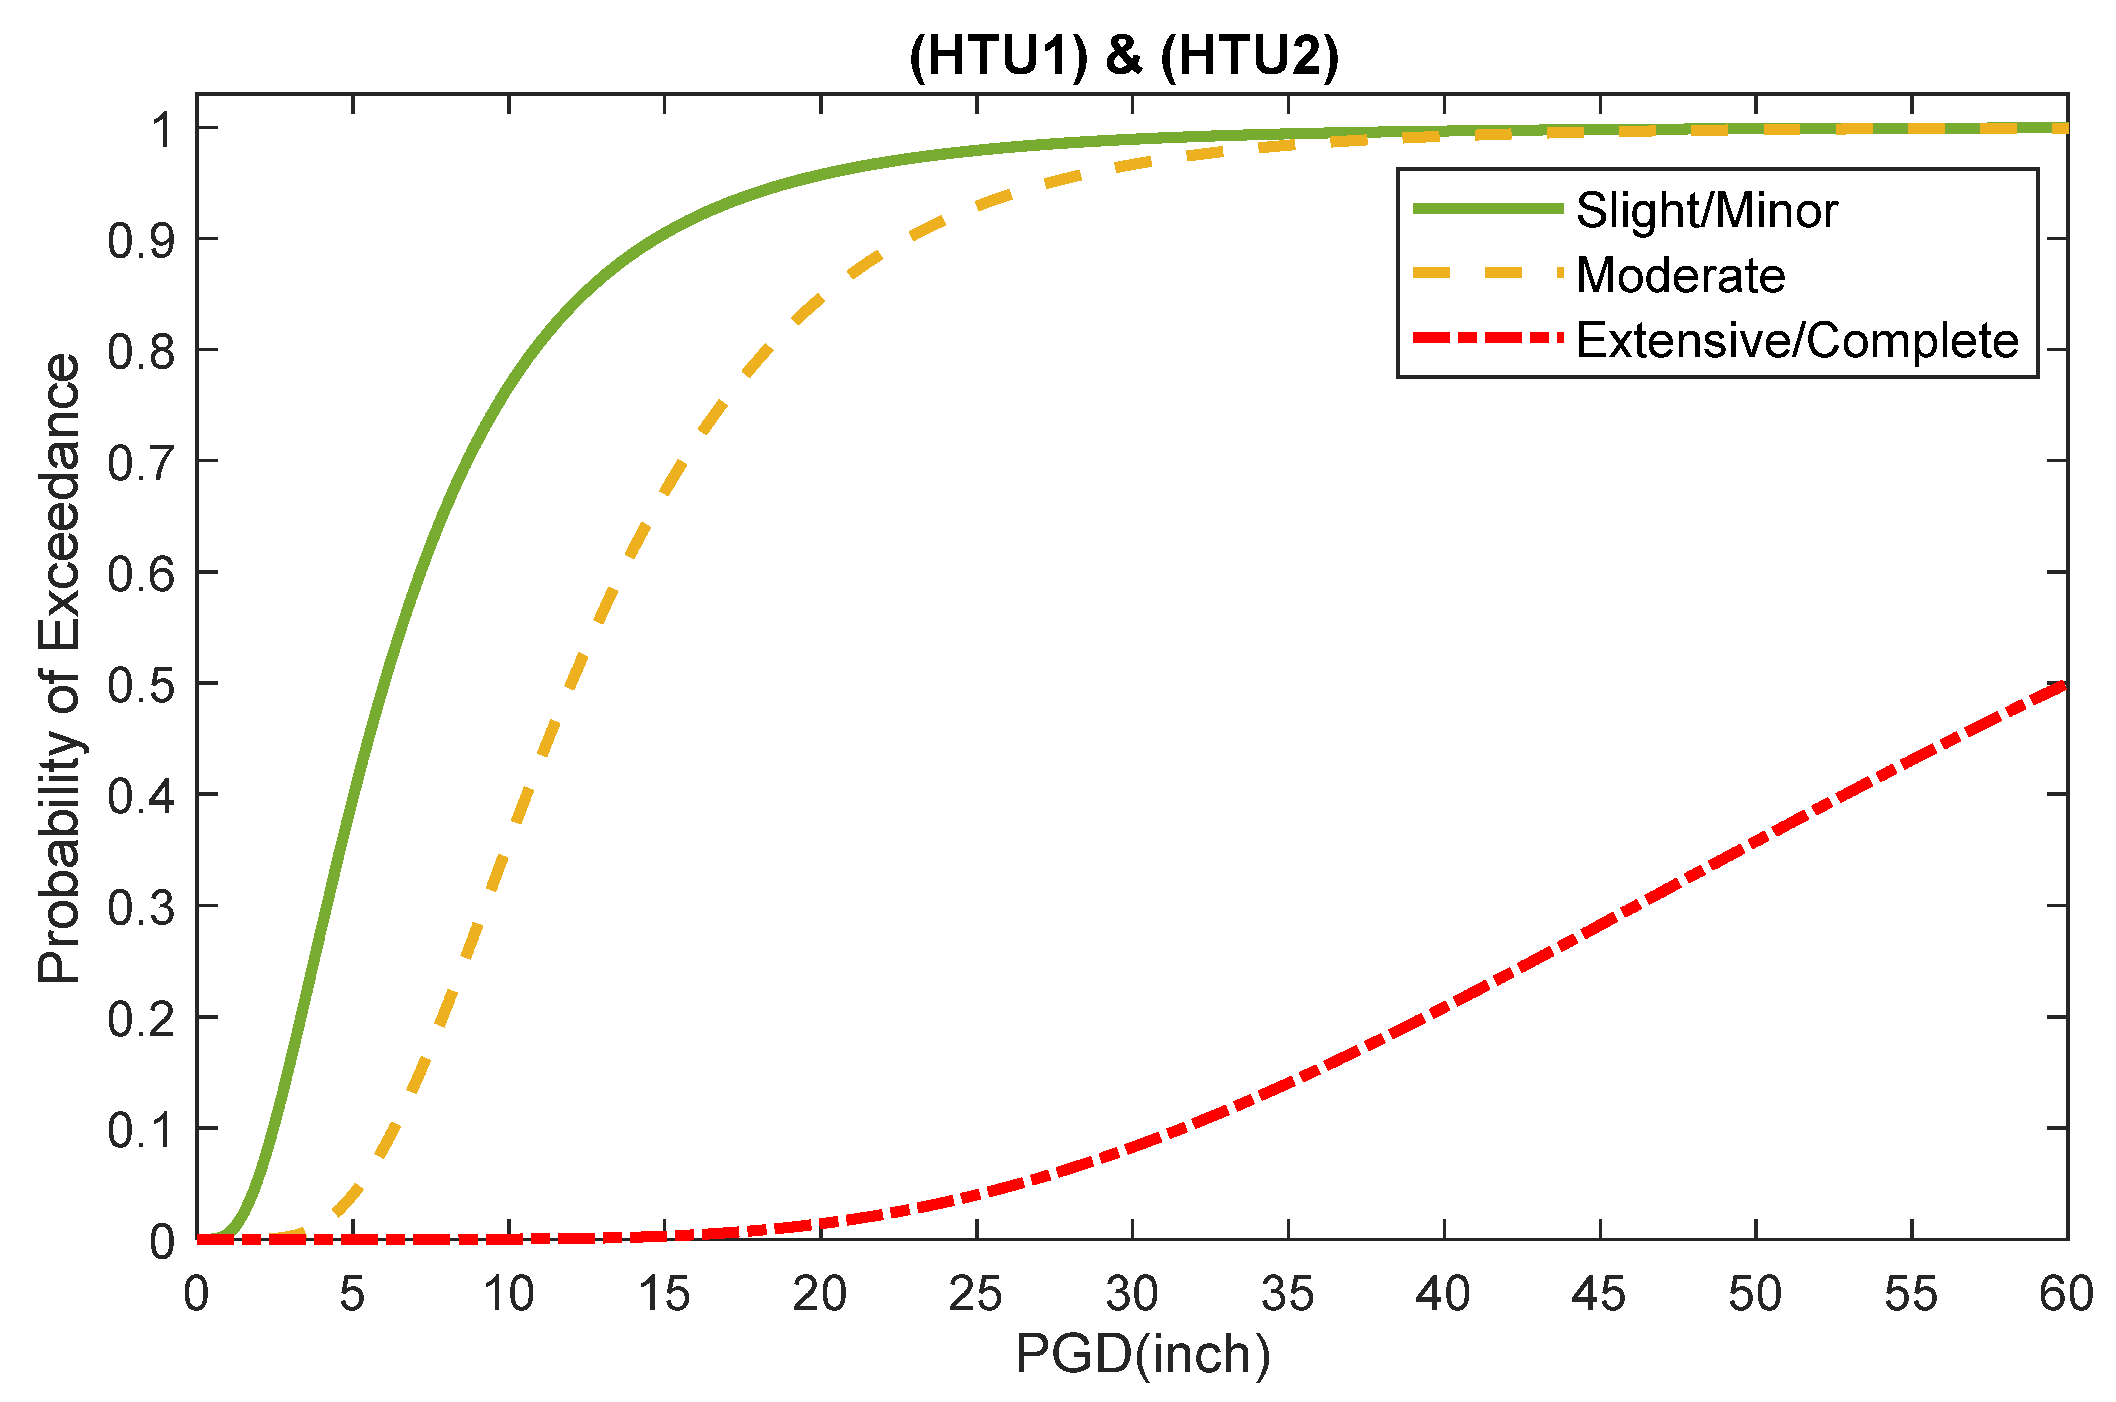
In the HAZUS technical guide, rock railway tunnels are divided into two general categories: Bored/Drilled for tunnels and Cut/Cover for galleries, which are indicated by the abbreviations HTU1 and HTU2, respectively. Table 3 shows the damage states defined in HAZUS for rock tunnels. Also, Table 4 shows the values of PGD fragility parameters, including median and standard deviation for rock railway tunnels, provided by HAZUS.
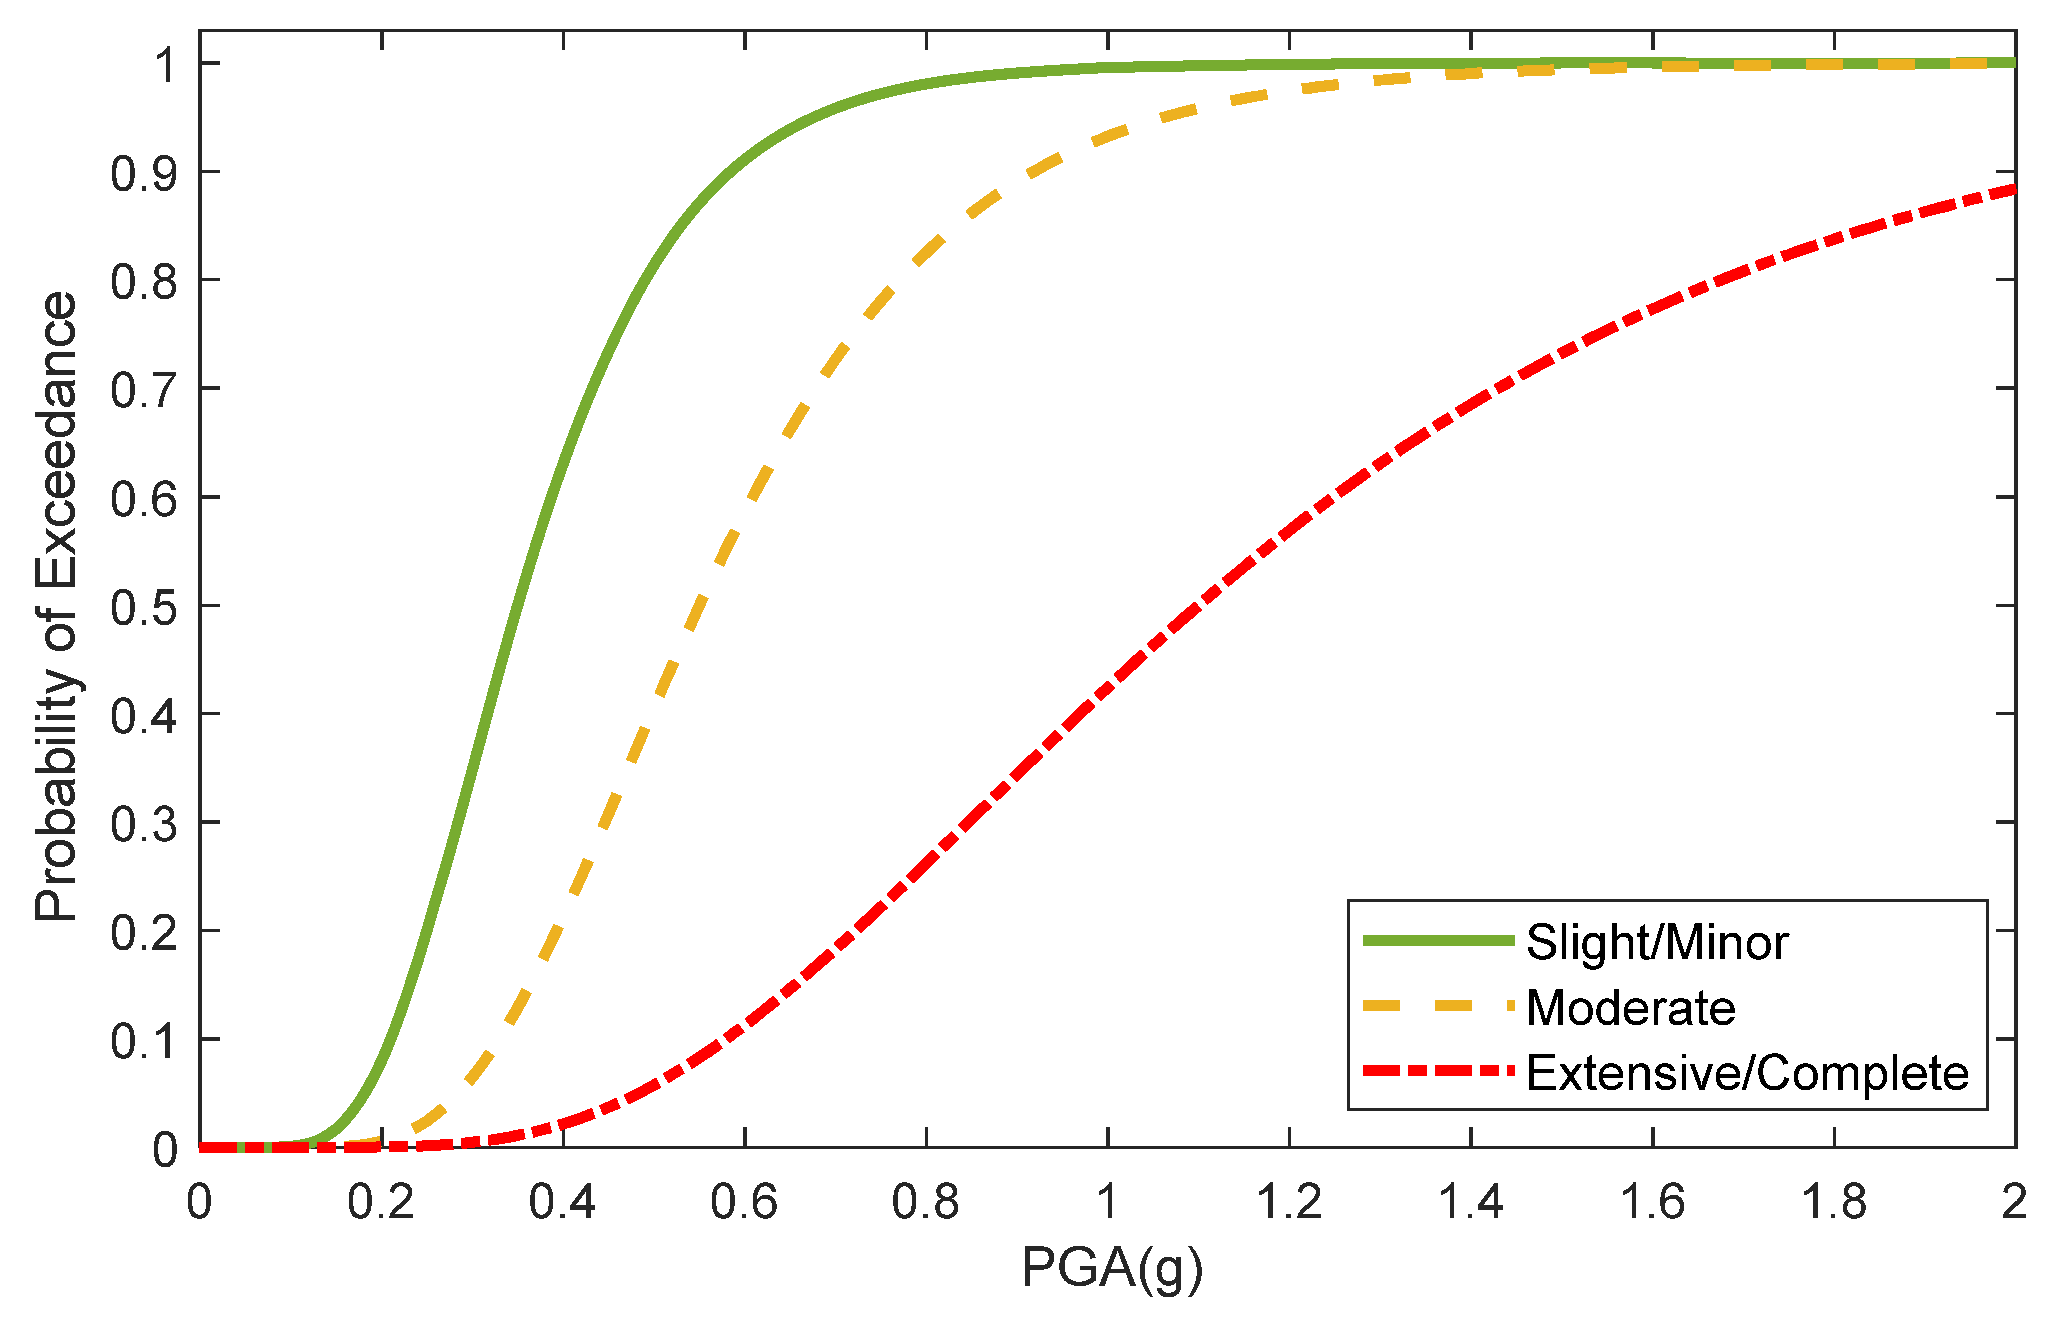
The European collaborative research project SYNER-G has provided PGA fragility parameters for rock railway tunnels. For PGA, SYNER-G is employed because it defines fragility for three damage states (slight, moderate, and extensive), whereas HAZUS provides only two (slight and moderate). This combined approach allows a more realistic evaluation of both displacement- and acceleration-induced vulnerabilities of rock tunnels. In addition, SYNER-G accounts for tunnel condition over its life cycle damage, considering both poor-to-average and good conditions. The damage states described in SYNER-G are similar to those presented in Table 3. Table 5 lists these parameters, including the standard deviation and median of the log-normal distribution, for rock railway tunnels. Given that the tunnels under study have a long lifespan (over 50 years), the SYNER-G fragility curves in poor condition have been used for the PGA parameter. Figure 12, Figure 13 and Figure 14 show two cases of fragility curves of tunnels and galleries for PGA and PGD parameters.

Damage Index and Vulnerability Curve

The probability that a tunnel will be in the k-th damage state ( P D S k ) is calculated based on the exceedance probability of the damage state obtained from Equation (7). Damage state probability is computed in accordance with Equation (8), and Figure 15 shows the concept of damage state probability for a specific seismic intensity.
  P D S 0 | I M = 1 P D S D S 1 | I M
P D S k | I M = P D S D S k | I M P D S D S k + 1 | I M   ,   k = 1 ,   2  
P D S 3 | I M = P D S D S 3 | I M
By mapping the damage states in the interval [0, 3], the expected values of the damage state are calculated as the damage index according to the following equation [25,57,58]:
  D I =   k = 0 3 k P D s k | I M
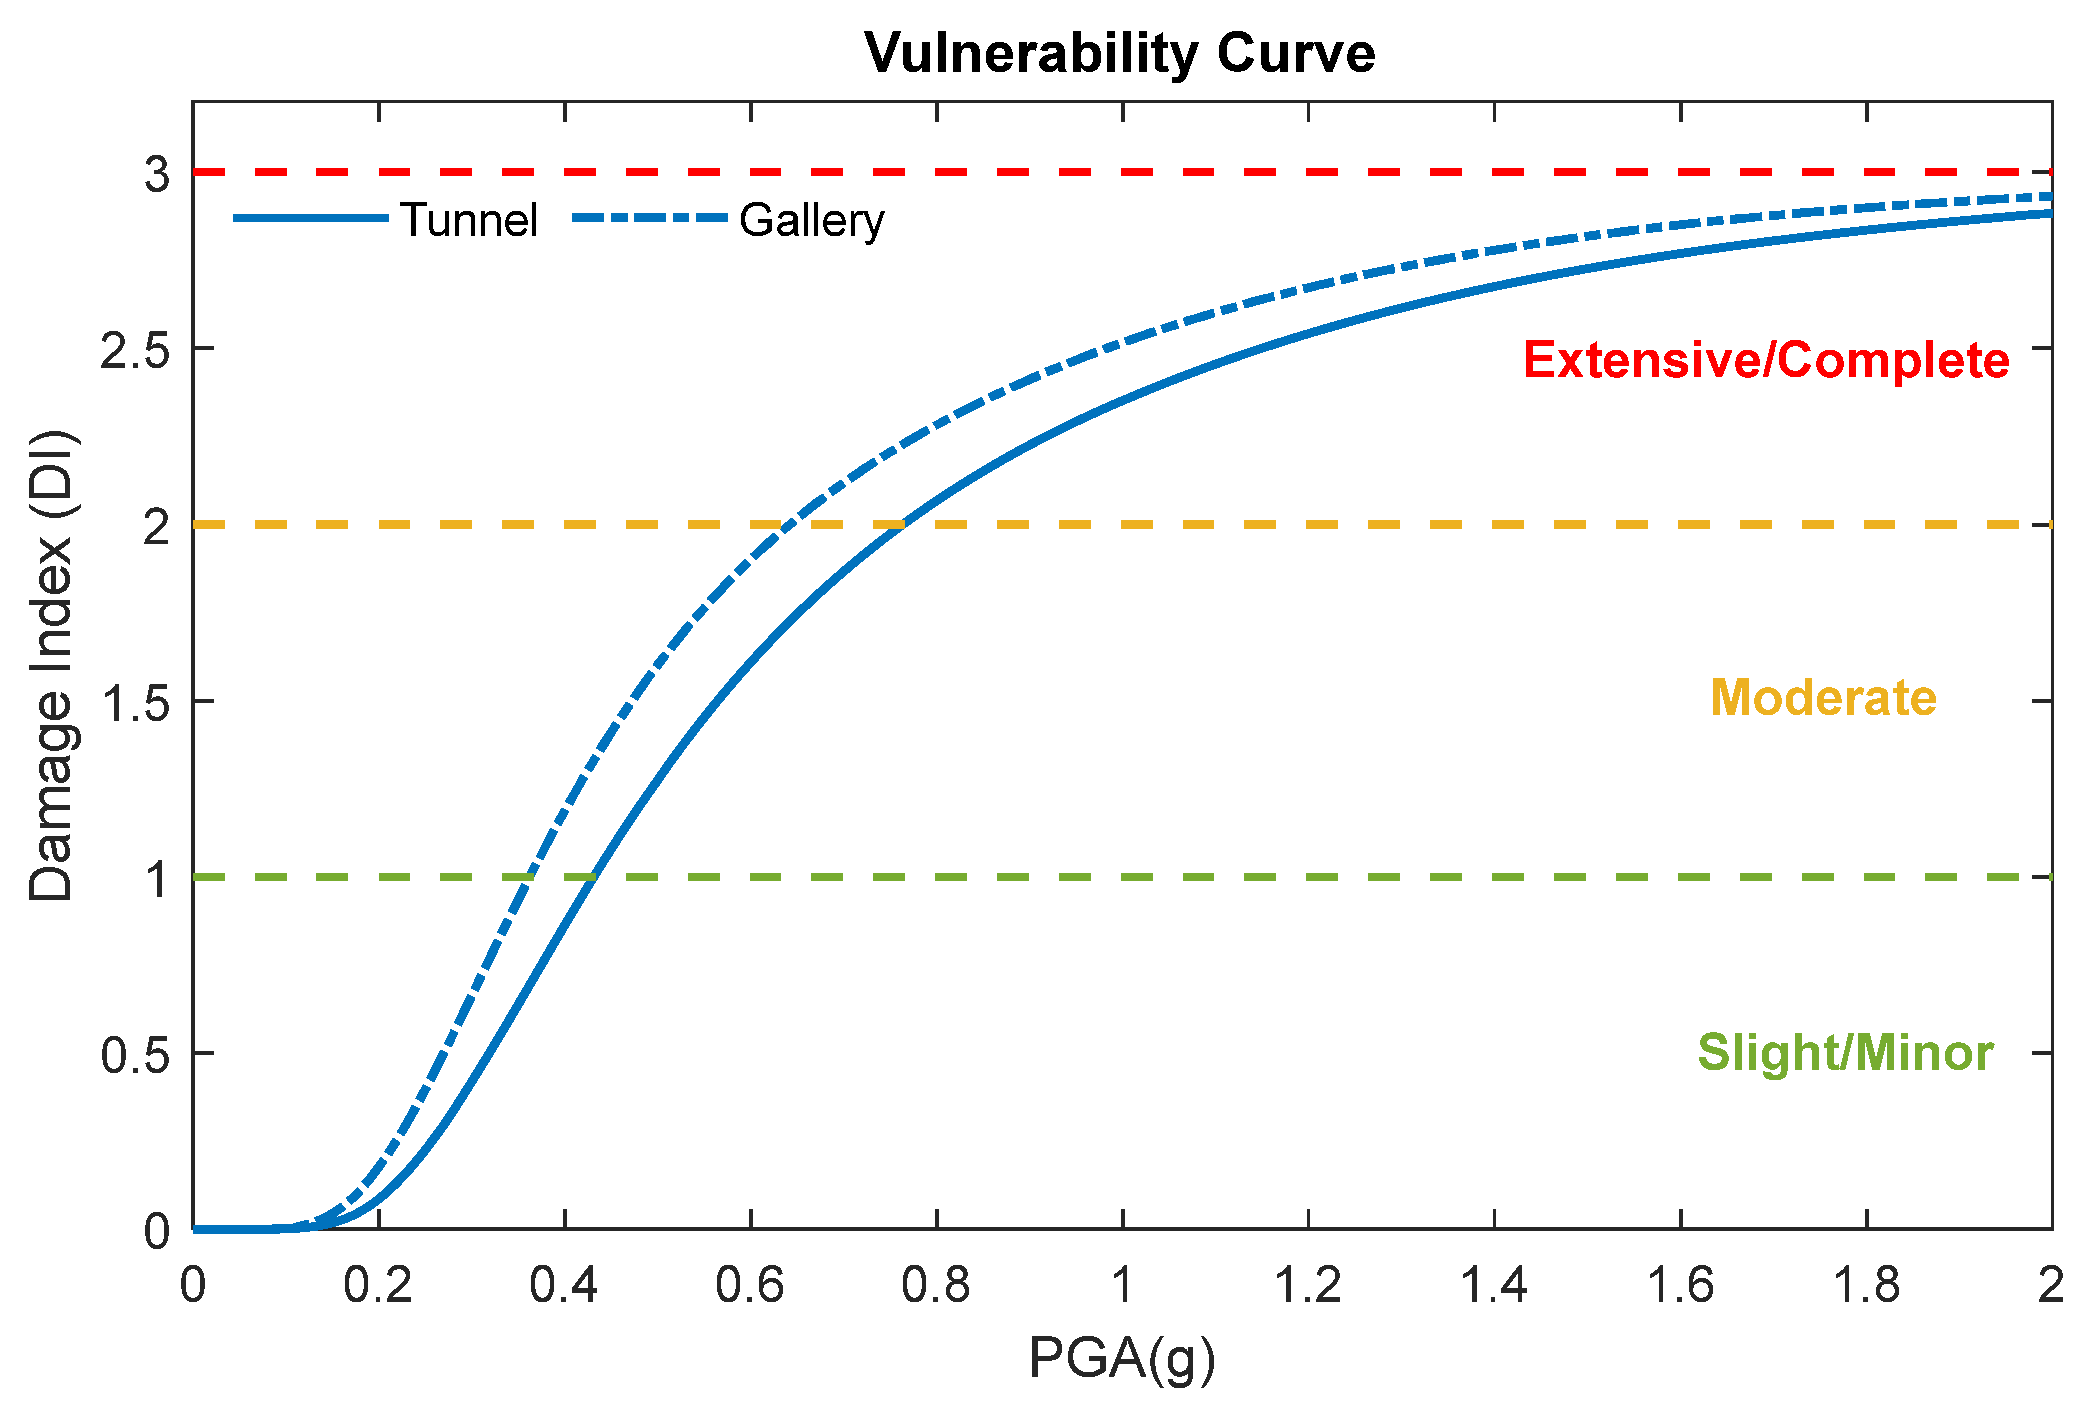
Table 6 shows the relation between the damage state (DS) and the damage index (DI). By calculating the DI for various values of seismic intensity, a diagram called the vulnerability curve is obtained, which is shown in Figure 16 and Figure 17.
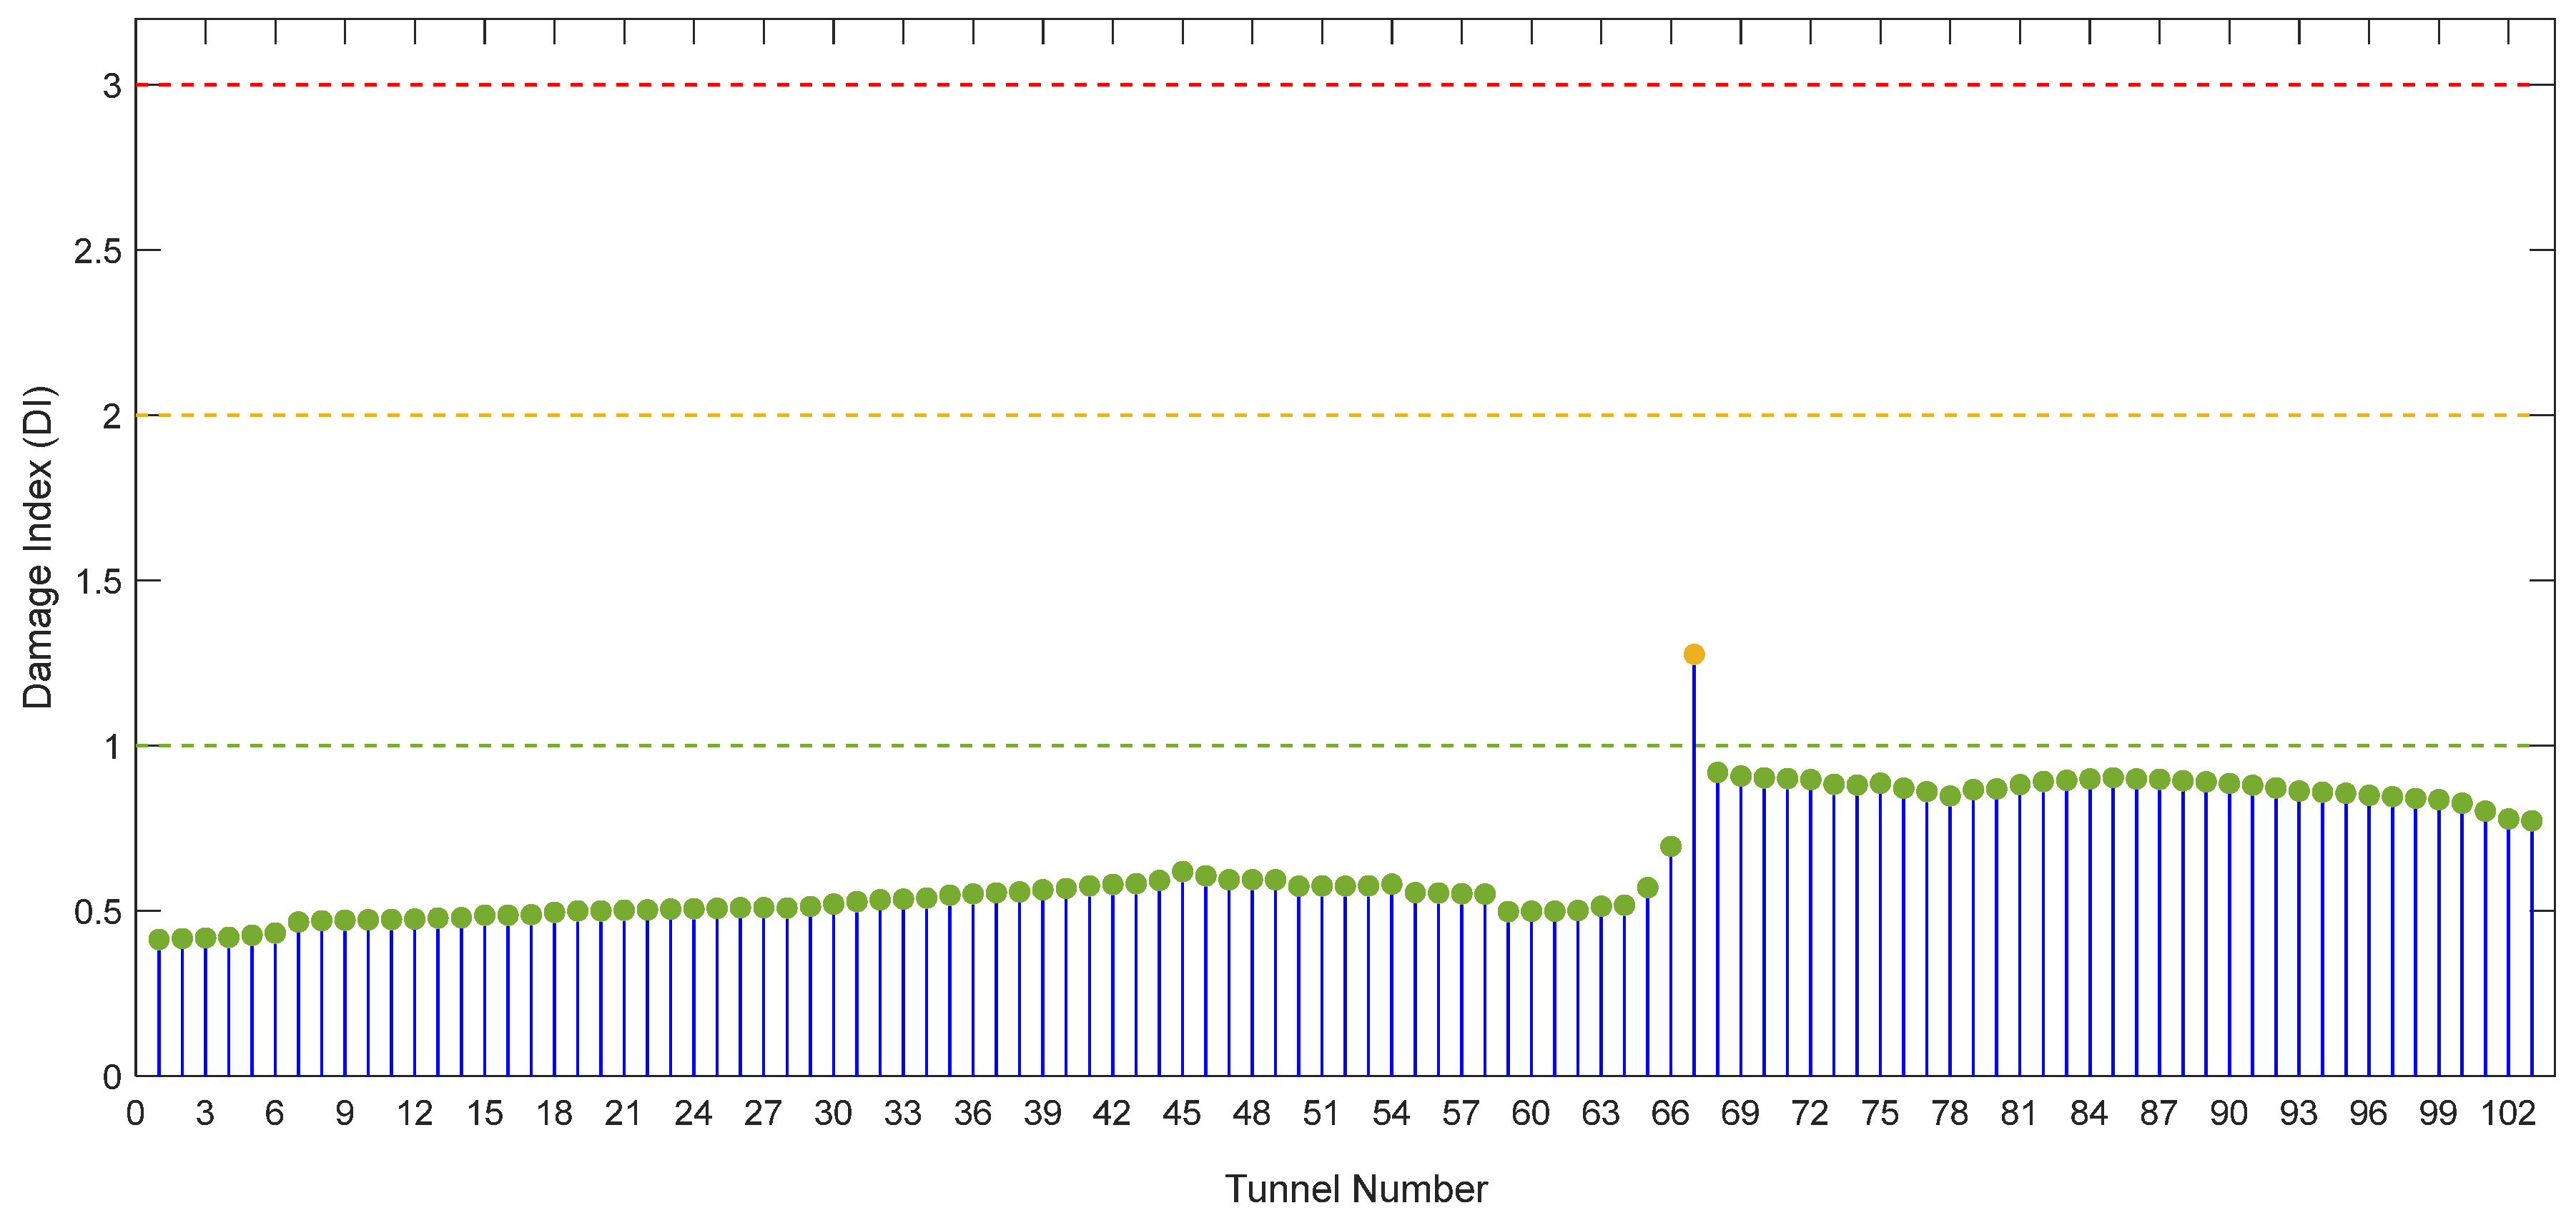
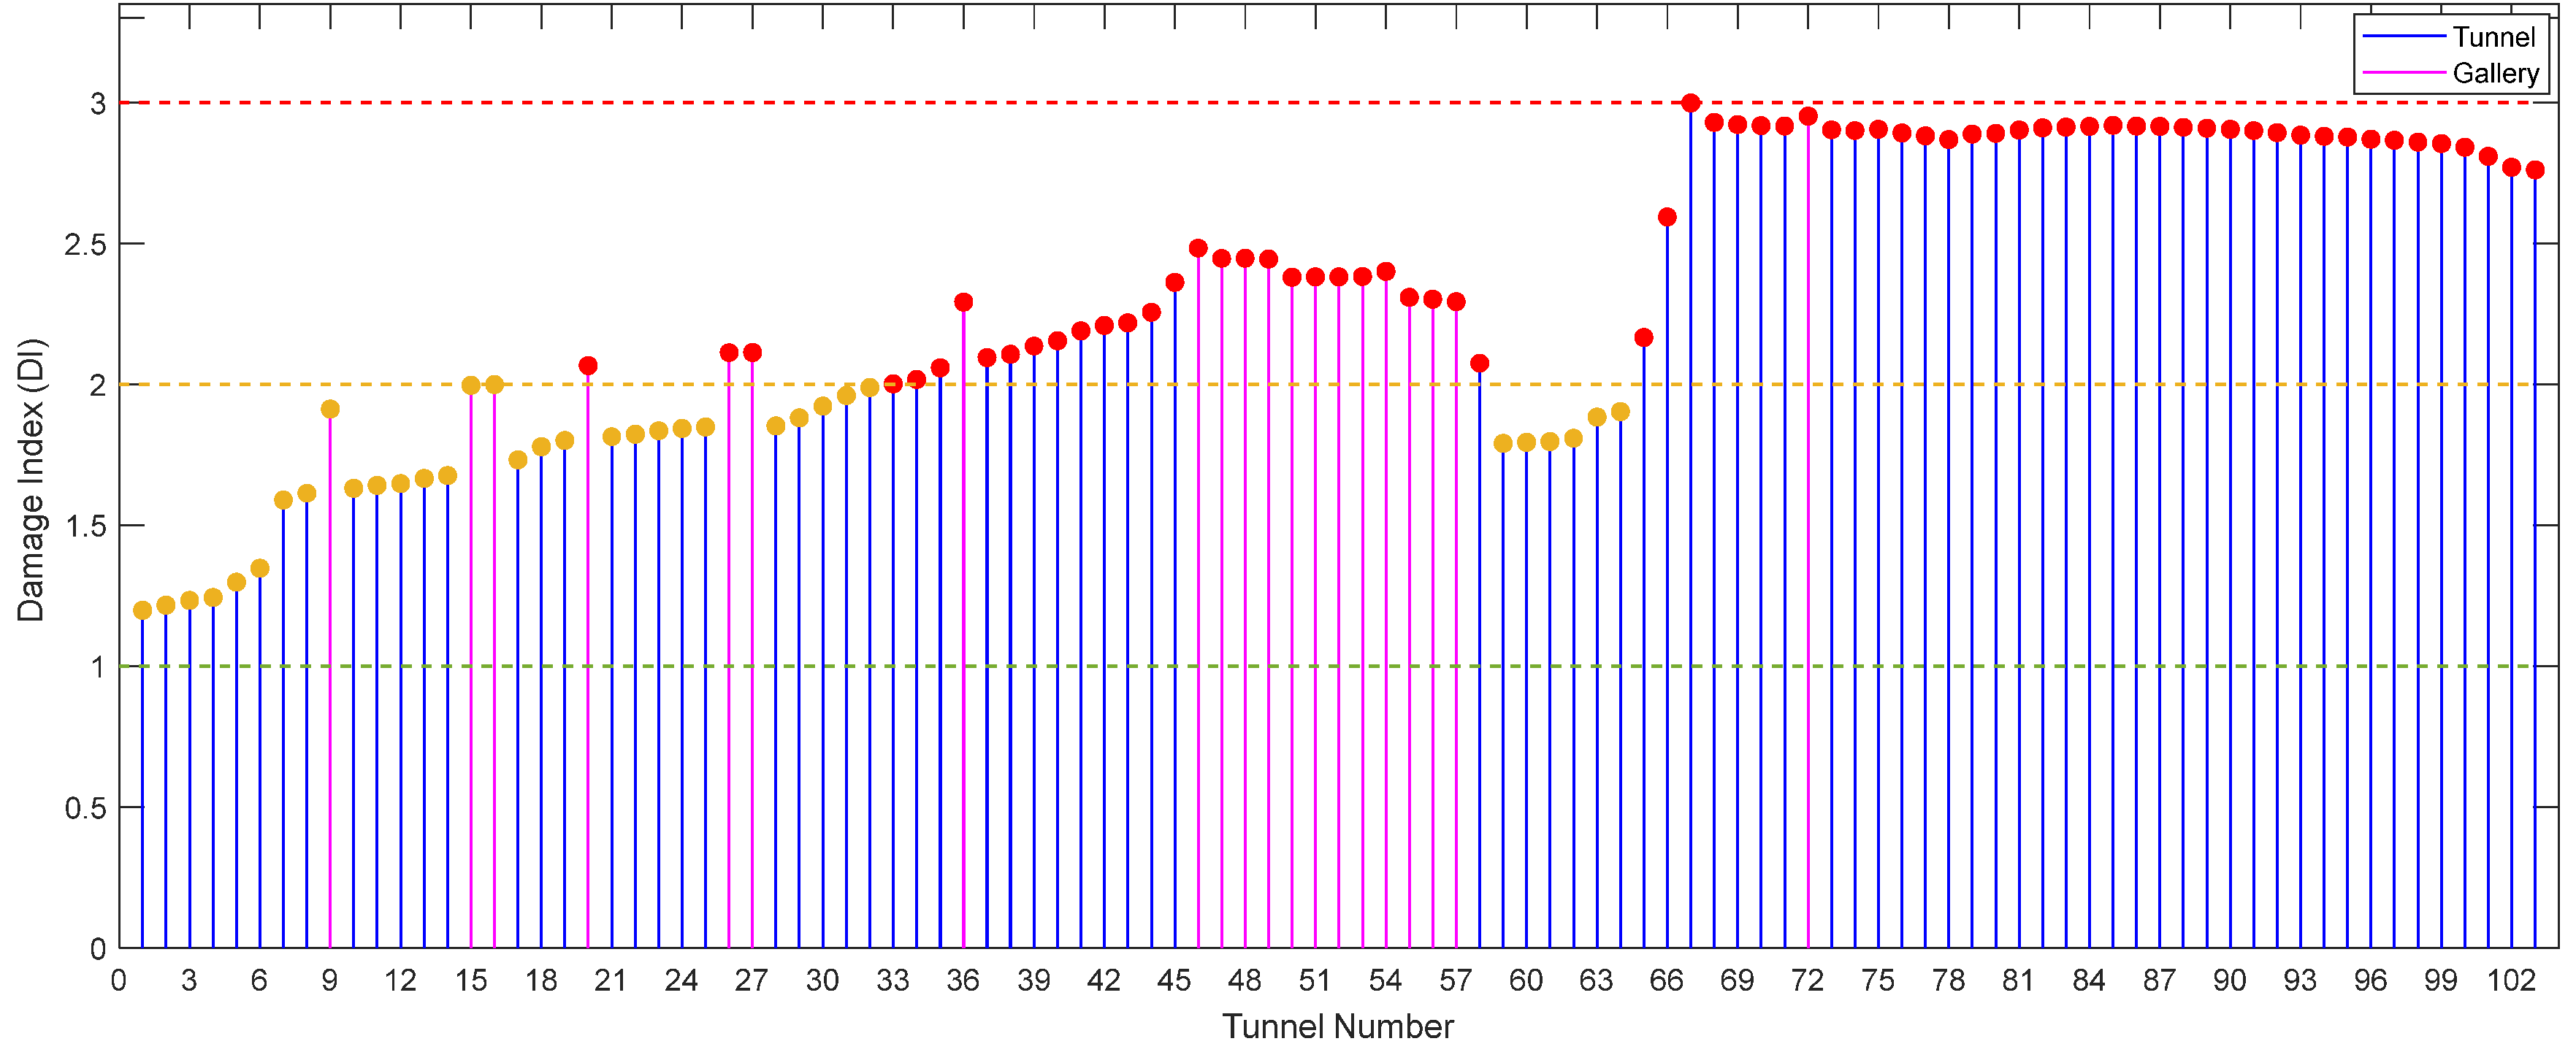
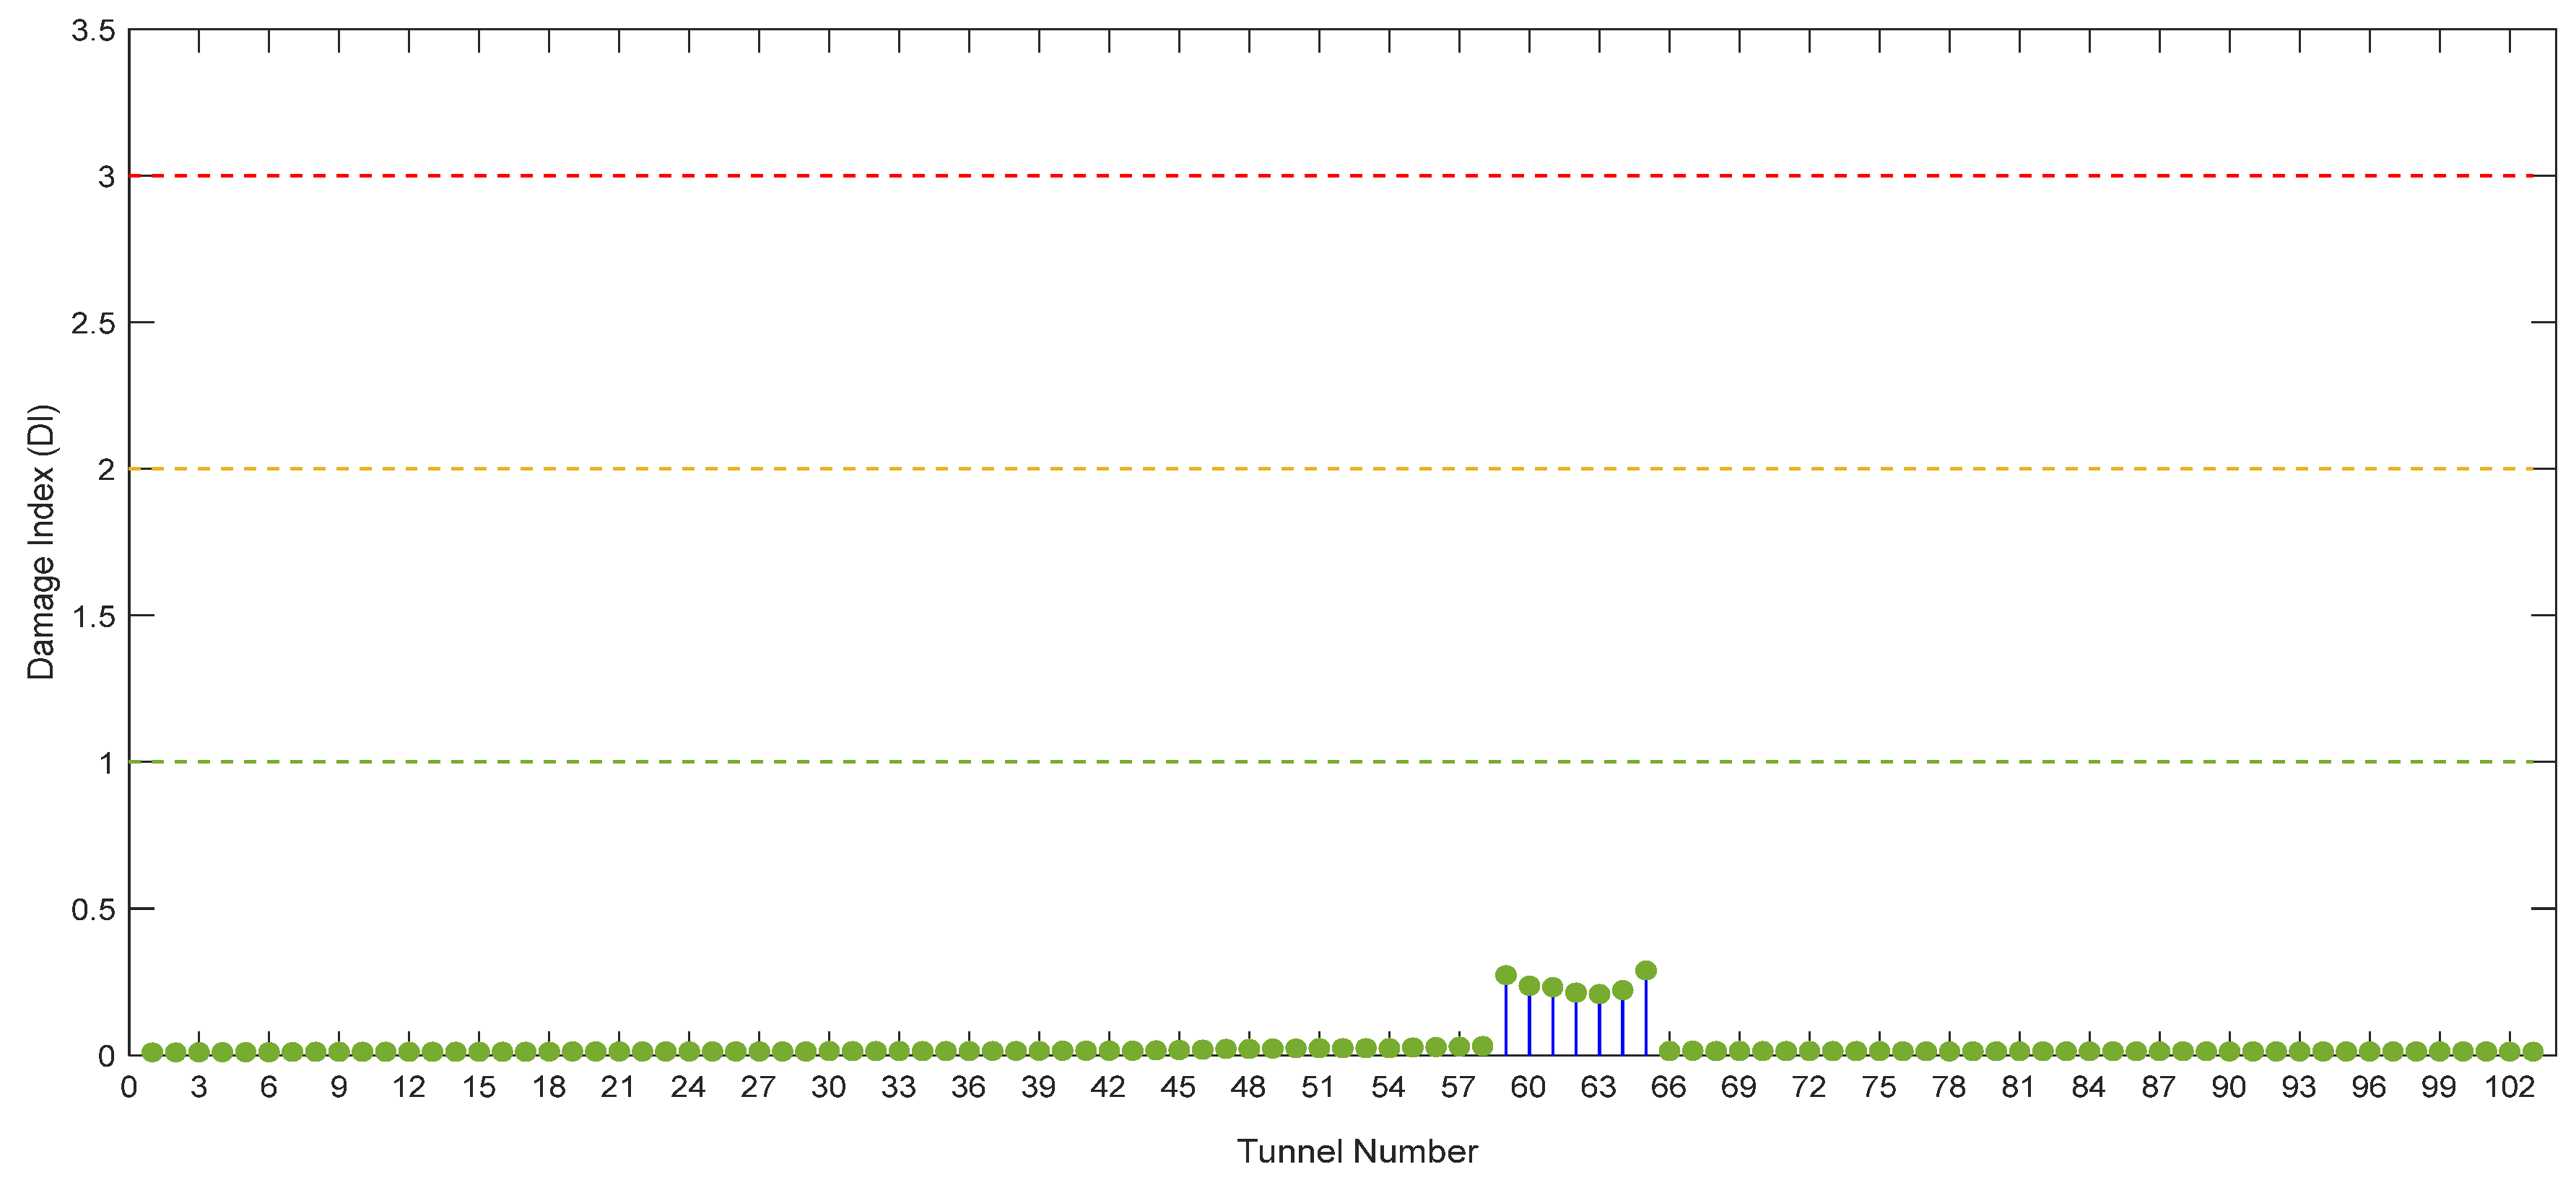
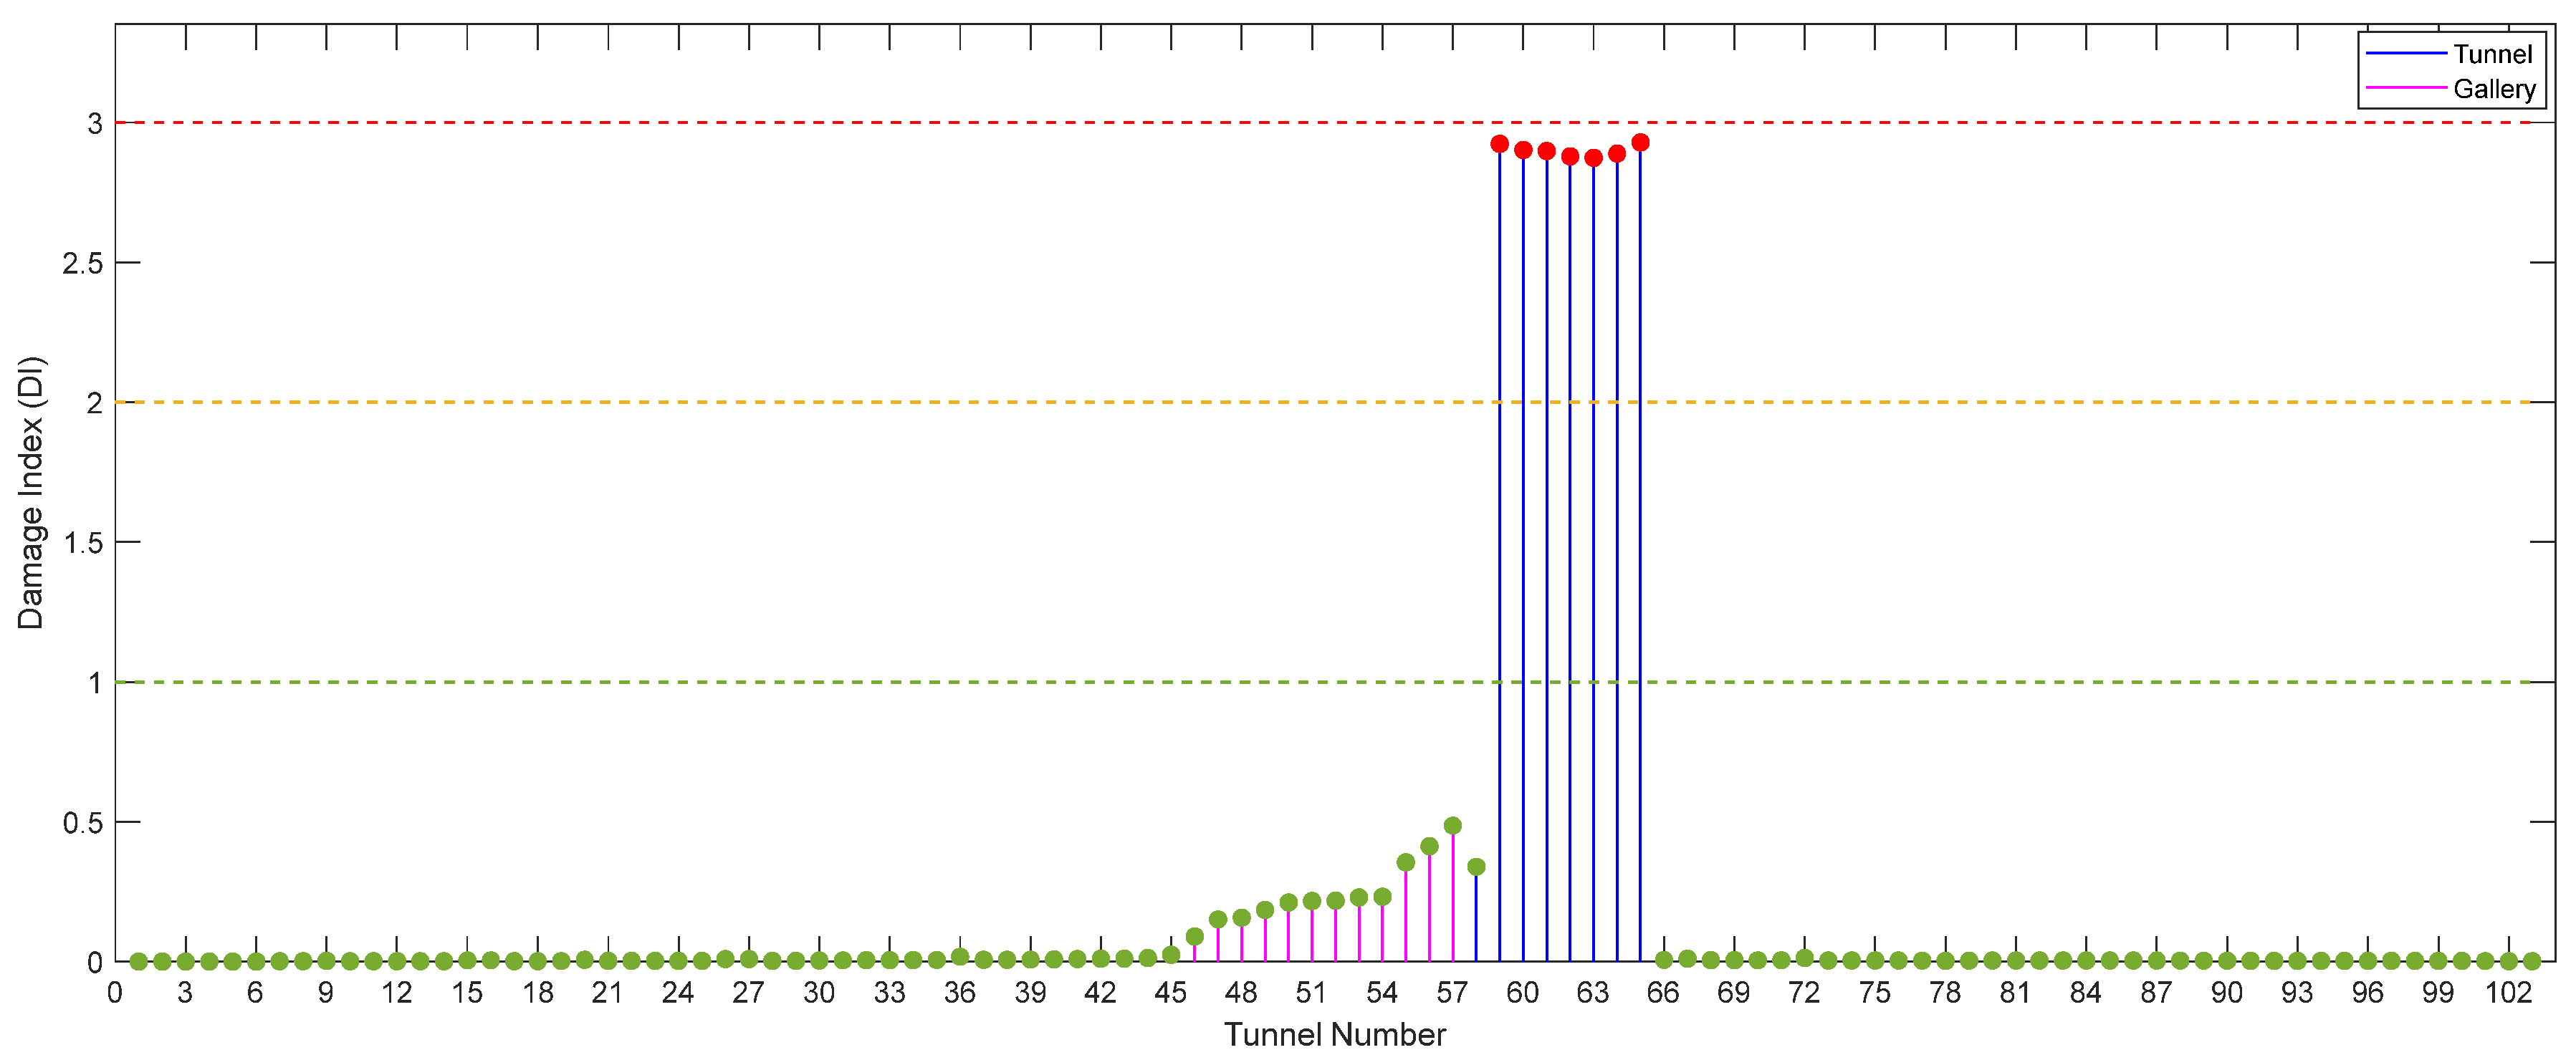
The damage index at the location of each tunnel caused by 12 faults is calculated separately for the seismic intensity measure parameters, i.e., PGD and PGA. As an example, Figure 18 and Figure 19 show the damage index of tunnels for the earthquake resulting from the Tabriz fault. Also, Figure 20 and Figure 21 illustrate the damage index of tunnels under the Shiramin fault earthquake. As shown in Figure 18, Figure 19, Figure 20 and Figure 21, the Tabriz fault is large and affects almost all the tunnels in the region, while the Shiramin fault is small and affects only seven tunnels near it. According to Figure 18 and Figure 20, the damage index of tunnels is generally less than one (i.e., 0 < DI < 1), indicating that with high probability they do not sustain severe damage under PGD and their performance will be preserved. However, due to the uncertainties associated with fragility parameters and seismic input, this result should be considered as an expected result rather than an absolute outcome. Figure 19 and Figure 21 show that PGA is the most important parameter in the vulnerability of tunnels, and the probability of severe damage under the PGA is very high in some tunnels. Therefore, the vulnerability of tunnels under PGA must be evaluated, and the tunnels with the higher probability of damage should be given higher priority for seismic rehabilitation.

5. Tunnels Prioritization

Due to budget limitations, it is not possible to rehabilitate all tunnels simultaneously. It is assumed that all tunnels have equal importance in terms of transportation, and prioritization is only based on their vulnerability, so that the tunnels with high vulnerability are given high priority for rehabilitation. An axis in the network may be more important in terms of transportation. Determining the network’s importance weighting requires transportation data, such as the number of travels, and expert opinions, which necessitate further research. To prioritize tunnels, Equation (10) is proposed, which considers life cycle damages in addition to seismic vulnerability.
  ( N P I ) i = 100 × ( S e i s m i c   V u l n e r a b i l i t y   I n d e x ) i + ( V i s u a l   I n s p e c t i o n   W e i g h t ) i ( S e i s m i c   V u l n e r a b i l i t y   I n d e x ) m a x + ( V i s u a l   I n s p e c t i o n   W e i g h t ) m a x
where ( N P I ) i is the normalized prioritization index for the i-th tunnel, and the seismic vulnerability index (SVI) is the sum of the tunnel damage index caused by all faults, according to Equation (11):
  ( S e i s m i c   V u l n e r a b i l i t y   I n d e x ) i = j = 1 N ( D I ) i j
where j denotes the fault counter and N represents the total number of faults (in this study, N = 12), and ( D I ) i j is determined according to Equation (9). Some tunnels have been damaged and cracked over time, so the impact of these damages is taken into account in terms of visual inspection weight (VIW) in Equation (10). Based on the visual inspection of the tunnels, the damages are categorized into three levels: high, medium, and low as defined in Table 7, according to engineering judgment. Figure 22 shows examples of tunnel lifetime damages in the study area. To quantify the damage, each damage level listed in Table 7 is given a corresponding weight as outlined in Table 8. In Equation (10), ( S e i s m i c   V u l n e r a b i l i t y   I n d e x ) m a x is the maximum value of the damage index summation, which is equal to 14.127 for the tunnel i = 16 and ( V i s u a l   I n s p e c t i o n   W e i g h t ) m a x is the maximum weight obtained from visual inspection, which is equal to 3 (i.e., Equation (10) is normalized to 17.127). The prioritization criteria for classifying tunnels are defined based on the opinions of transportation managers, as shown in Table 9.
Finally, the tunnels are prioritized into four classes, which are shown in Table 10. The results reveal that 10 tunnels are assigned the first priority, 34 tunnels the second priority, 41 tunnels the third priority, and 18 tunnels the fourth priority. Therefore, most tunnels are classified as second and third priority. In Table 10, each of the four main classes is divided into subclasses that provide more precise prioritization. As mentioned, tunnel 16 has the maximum vulnerability index among all tunnels, but it is ranked in priority 1–5, which indicates the effect of visual inspection weight impacts on prioritization. However, Table 10 offers a detailed prioritization for the tunnels in the study area, considering both seismic vulnerability and lifetime damage. This enables decision-making organizations to effectively plan rehabilitation efforts, which play a crucial role in seismic risk reduction.

6. Conclusions

This study aims to assist railway network managers in prioritizing the rehabilitation of tunnels under budget constraints. This research provided an integrated assessment of the seismic vulnerability of masonry railway tunnels in Northwest Iran, highlighting the critical need for prioritization in rehabilitation efforts. The vulnerability of 103 old masonry rock tunnels was examined under the impact of 12 active faults using fragility curves derived from the HAZUS and SYNER-G methodologies. This approach enabled a systematic estimation of the probability of various damage states under different seismic intensities. The expected values of damage states were utilized as a damage index (DI), providing a measure of the severity of potential damage. It was found that tunnels under PGA are more vulnerable than PGD; therefore, the damage caused by PGA was taken into account. A normalized prioritization index (NPI) was proposed, integrating seismic vulnerability and life cycle damages to effectively prioritize tunnels for rehabilitation. Four main classes were defined to prioritize. The results indicated that 10 tunnels were placed in the first class, 34 tunnels in the second class, 41 tunnels in the third class, and 18 tunnels in the last class. For each main class, a sub-classification was provided, which is essential for resource allocation in budget limitations.
It is hoped that this study will be useful in reducing seismic risk and helping railway transportation network managers. Future research can enhance the proposed framework by incorporating probabilistic seismic hazard models to account for the variability and uncertainties in seismic scenarios across different return periods and ground motion characteristics, such as magnitude. Moreover, developing tunnel-specific fragility curves using incremental dynamic analysis (IDA) can provide a more accurate representation of the seismic response of each tunnel, allowing for more precise damage estimation tailored to the structural and geotechnical characteristics of individual tunnels. Additionally, future studies could consider the effects of material degradation over time, inelastic behavior of lining shell elements, the influence of surrounding rock properties, and the presence of groundwater on the performance and vulnerability of each tunnel. Incorporating these parameters into the seismic assessment can improve the reliability of prioritization results. Expanding the framework to a multi-hazard context and integrating tunnel importance weighting in transportation networks or economic impact analysis would also make the rehabilitation strategy more comprehensive and practical for decision-makers. Furthermore, the methodology could be applied to other types of infrastructure, and the results could be validated using post-earthquake damage data to ensure robustness and generalizability.

Author Contributions

Conceptualization, Y.H. and T.Y.Y.; methodology, Y.H., T.Y.Y. and R.K.M.; software, Y.H.; validation, Y.H., T.Y.Y. and R.K.M.; formal analysis, Y.H.; investigation, Y.H.; resources, Y.H. and R.K.M.; data curation, Y.H.; writing—original draft preparation, Y.H. and R.K.M.; writing—review and editing, T.Y.Y. and R.K.M.; visualization, Y.H.; supervision, T.Y.Y. and R.K.M.; project administration, T.Y.Y.; funding acquisition, Y.H., T.Y.Y. and R.K.M. All authors have read and agreed to the published version of the manuscript.

Funding

This research received no external funding.

Data Availability Statement

Data will be provided upon request.

Acknowledgments

The authors wish to express sincere gratitude for the invaluable assistance and support received from the Islamic Republic of Iran’s Railway Company (RAI) during this research.

Conflicts of Interest

The authors declare no conflicts of interest.

Abbreviations

The following abbreviations are used in this manuscript:
IMIntensity measure
PGAPeak ground acceleration
PGDPeak ground displacement
DIDamage index
DSDamage state
HTUHAZUS tunnel
SVISeismic vulnerability index
VIWVisual inspection weight
NPINormalized prioritization index

References

  1. Huang, S.; Xin, C.; Song, D.; Feng, W.; Liu, X.; Wang, E.; Xu, T.; Xiong, X. Resilience assessment of the seismic damage mechanism of the Daliang high-speed railway tunnel in the 2022 Menyuan earthquake (Mw 6.7) in China. Transp. Geotech. 2024, 49, 101417. [Google Scholar] [CrossRef]
  2. Callisto, L.; Ricci, C. Interpretation and back-analysis of the damage observed in a deep tunnel after the 2016 Norcia earthquake in Italy. Tunn. Undergr. Space Technol. 2019, 89, 238–248. [Google Scholar] [CrossRef]
  3. Yu, H.; Chen, J.; Bobet, A.; Yuan, Y. Damage observation and assessment of the Longxi tunnel during the Wenchuan earthquake. Tunn. Undergr. Space Technol. 2016, 54, 102–116. [Google Scholar] [CrossRef]
  4. Wang, Z.Z.; Zhang, Z. Seismic damage classification and risk assessment of mountain tunnels with a validation for the 2008 Wenchuan earthquake. Soil Dyn. Earthq. Eng. 2013, 45, 45–55. [Google Scholar] [CrossRef]
  5. Asakura, T.; Sato, Y. Damage to mountain tunnels in hazard area. Soils Found. 1996, 36, 301–310. [Google Scholar] [CrossRef] [PubMed]
  6. Wang, W.; Wang, T.; Su, J.; Lin, C.; Seng, C.; Huang, T. Assessment of damage in mountain tunnels due to the Taiwan Chi-Chi Earthquake. Tunn. Undergr. Space Technol. 2001, 16, 133–150. [Google Scholar] [CrossRef]
  7. Shen, Y.; Gao, B.; Yang, X.; Tao, S. Seismic damage mechanism and dynamic deformation characteristic analysis of mountain tunnel after Wenchuan earthquake. Eng. Geol. 2014, 180, 85–98. [Google Scholar] [CrossRef]
  8. Zhang, X.; Jiang, Y.; Sugimoto, S. Seismic damage assessment of mountain tunnel: A case study on the Tawarayama tunnel due to the 2016 Kumamoto Earthquake. Tunn. Undergr. Space Technol. 2018, 71, 138–148. [Google Scholar] [CrossRef]
  9. Yao, C.; He, C.; Wang, T.; Chen, C.; Geng, P.; Dong, W.; Yuan, F.; Xu, G. Damages of highway tunnels during 2022 Luding earthquake (Mw = 6.6). Soil Dyn. Earthq. Eng. 2024, 177, 108357. [Google Scholar] [CrossRef]
  10. Chen, P.; Geng, P.; Chen, J.; Gu, W. The seismic damage mechanism of Daliang tunnel by fault dislocation during the 2022 Menyuan Ms6.9 earthquake based on unidirectional velocity pulse input. Eng. Fail. Anal. 2023, 145, 107047. [Google Scholar] [CrossRef]
  11. Zhang, X.; Jiang, Y.; Maegawa, K. Mountain tunnel under earthquake force: A review of possible causes of damages and restoration methods. J. Rock Mech. Geotech. Eng. 2020, 12, 414–426. [Google Scholar] [CrossRef]
  12. Roy, N.; Sarkar, R. A review of seismic damage of mountain tunnels and probable failure mechanisms. Geotech. Geol. Eng. 2017, 35, 1–28. [Google Scholar] [CrossRef]
  13. Chen, Z.; Shi, C.; Li, T.; Yuan, Y. Damage characteristics and influence factors of mountain tunnels under strong earthquakes. Nat. Hazards 2012, 61, 387–401. [Google Scholar] [CrossRef]
  14. Tsinidis, G.; de Silva, F.; Anastasopoulos, I.; Bilotta, E.; Bobet, A.; Hashash, Y.M.; He, C.; Kampas, G.; Knappett, J.; Madabhushi, G.; et al. Seismic behaviour of tunnels: From experiments to analysis. Tunn. Undergr. Space Technol. 2020, 99, 103334. [Google Scholar] [CrossRef]
  15. Wang, G.; Shi, L.; Wang, J. Experimental and numerical studies on the seismic response of adjacent horizontal parallel tunnels. Soil Dyn. Earthq. Eng. 2023, 172, 107992. [Google Scholar] [CrossRef]
  16. Zhao, H.; Ma, Y.; Yao, X. Dynamic Response of Curved Tunnels under Vertical Incidence of Transversal SV Waves. Shock Vib. 2023, 8561647. [Google Scholar] [CrossRef]
  17. Lei, H.; Wu, H.; Lai, T. Shaking Table Tests for Seismic Response of Oblique Overlapped Tunnel. Shock Vib. 2021, 8816755. [Google Scholar] [CrossRef]
  18. Daraei, A.; Ali, H.F.; Qader, D.N.; Zare, S. Seismic retrofitting of rubble masonry tunnel: Evaluation of steel fiber shotcrete or inner concrete lining alternatives. Arab. J. Geosci. 2022, 15, 1074. [Google Scholar] [CrossRef]
  19. Chen, H.M.; Yu, H.S.; Smith, M.J. Physical model tests and numerical simulation for assessing the stability of brick-lined tunnels. Tunn. Undergr. Space Technol. 2016, 53, 109–119. [Google Scholar] [CrossRef]
  20. Idris, J.; Al-Heib, M.; Verdel, T. Numerical modelling of masonry joints degradation in built tunnels. Tunn. Undergr. Space Technol. 2009, 24, 617–626. [Google Scholar] [CrossRef]
  21. Idris, J.; Verdel, T.; Al-Heib, M. Numerical modelling and mechanical behaviour analysis of ancient tunnel masonry structures. Tunn. Undergr. Space Technol. 2008, 23, 251–263. [Google Scholar] [CrossRef]
  22. Far, A.M.; Nejati, H.R.; Goshtasbi, K.; Khosrotash, M.; Moosavi, S.A. Seismic fragility analysis for probabilistic risk assessment of underground structures. J. Earthq. Eng. 2024, 29, 265–287. [Google Scholar] [CrossRef]
  23. Liu, X.; Xu, Q.; Zhou, X.; Wang, J.; Xu, B.; Liu, B. Research on structural defect characteristics and influencing factors for high-fill cut-and-cover tunnels in mountainous areas. Iran. J. Sci. Technol. Trans. Civ. Eng. 2024, 48, 4409–4422. [Google Scholar] [CrossRef]
  24. Antoniou, M.; Mantakas, A.; Nikitas, N.; Fuentes, R. A numerical case study on the long-term seismic assessment of reinforced concrete tunnels in corrosive environments. J. Rock Mech. Geotech. Eng. 2023, 15, 551–572. [Google Scholar] [CrossRef]
  25. Tsinidis, G.; Karatzetzou, A.; Stefanidou, S.; Markogiannaki, O. Developments in seismic vulnerability assessment of tunnels and underground structures. Geotechnics 2022, 2, 209–249. [Google Scholar] [CrossRef]
  26. Zou, Y.; Zhang, Y.; Liu, H.; Liu, H.; Miao, Y. Performance-based seismic assessment of shield tunnels by incorporating a nonlinear pseudostatic analysis approach for the soil-tunnel interaction. Tunn. Undergr. Space Technol. 2021, 114, 103981. [Google Scholar] [CrossRef]
  27. Hu, X.; Zhou, Z.; Chen, H.; Ren, Y. Seismic fragility analysis of tunnels with different buried depths in a soft soil. Sustainability 2020, 12, 892. [Google Scholar] [CrossRef]
  28. Andreotti, G.; Lai, C.G. Use of fragility curves to assess the seismic vulnerability in the risk analysis of mountain tunnels. Tunn. Undergr. Space Technol. 2019, 91, 103008. [Google Scholar] [CrossRef]
  29. HAZUS. Multi-Hazard Loss Estimation Methodology: Earthquake Model Hazus-MH 2.1 Technical Manual; Federal Emergency Management Agency: Washington, DC, USA, 2013. [Google Scholar]
  30. Argyroudis, S.A.; Pitilakis, K.D. Seismic fragility curves of shallow tunnels in alluvial deposits. Soil Dyn. Earthq. Eng. 2012, 35, 1–12. [Google Scholar] [CrossRef]
  31. Huang, G.; Qiu, W.; Zhang, J. Modelling seismic fragility of a rock mountain tunnel based on support vector machine. Soil Dyn. Earthq. Eng. 2017, 102, 160–171. [Google Scholar] [CrossRef]
  32. Avanaki, M.J.; Hoseini, A.; Vahdani, S.; de Santos, C.; de la Fuente, A. Seismic fragility curves for vulnerability assessment of steel fiber reinforced concrete segmental tunnel linings. Tunn. Undergr. Space Technol. 2018, 78, 259–274. [Google Scholar] [CrossRef]
  33. Zhao, G.; Gardoni, P.; Xu, L.; Xie, L. Seismic probabilistic capacity models and fragility estimates for the transversal lining section of circular tunnels. J. Earthq. Eng. 2023, 27, 1281–1301. [Google Scholar] [CrossRef]
  34. Ansari, A.; Rao, K.S.; Jain, A.K. Seismic vulnerability of tunnels in Jammu and Kashmir for post seismic functionality. Geotech. Geol. Eng. 2023, 41, 1371–1396. [Google Scholar] [CrossRef]
  35. Saleh, A.M.; Rahgozar, M.A. Finite element seismic analysis of soil–tunnel interactions in clay soils. Iran. J. Sci. Technol. Trans. Civ. Eng. 2019, 43, 835–849. [Google Scholar] [CrossRef]
  36. Luo, H.; Du, L.; Zheng, C.; Yang, X.; Wang, T.; Wang, Y. Study on the performance of mountain tunnel against mainshock–aftershock based on resilience evaluation framework. Iran. J. Sci. Technol. Trans. Civ. Eng. 2024, 48, 2215–2234. [Google Scholar] [CrossRef]
  37. Junwei, Z.; Wan, Y.; Chenling, Z.; Tuo, C. Seismic stability of a mountain tunnel portal section lining. Int. J. Geotech. Eng. 2020, 14, 376–394. [Google Scholar] [CrossRef]
  38. Ghadimi, C.A.; Tahghighi, H. Numerical finite element analysis of underground tunnel crossing an active reverse fault: A case study on the Sabzkouh segmental tunnel. Geomech. Geoengin. 2019, 14, 155–166. [Google Scholar] [CrossRef]
  39. Yu, H.; Yuan, Y.; Bobet, A. Seismic analysis of long tunnels: A review of simplified and unified methods. Undergr. Space 2017, 2, 73–87. [Google Scholar] [CrossRef]
  40. Reddy, A.D.; Singh, A. A simplistic method for assessing seismic damage in rock tunnels before earthquake: Part 1—Damage prediction and validation using seismic damage classification of tunnels. Rock Mech. Rock Eng. 2024, 57, 11001–11032. [Google Scholar] [CrossRef]
  41. Ansari, A.; Rao, K.S.; Jain, A.K.; Ansari, A. Deep learning model for predicting tunnel damages and track serviceability under seismic environment. Model. Earth Syst. Env. 2023, 9, 1349–1368. [Google Scholar] [CrossRef]
  42. Wang, L.; Geng, P.; Chen, J.; Wang, T. Machine learning-based fragility analysis of tunnel structure under different impulsive seismic actions. Tunn. Undergr. Space Technol. 2023, 133, 104953. [Google Scholar] [CrossRef]
  43. Huang, Z.; Argyroudis, S.A.; Pitilakis, K.; Zhang, D.; Tsinidis, G. Fragility assessment of tunnels in soft soils using artificial neural networks. Undergr. Space 2022, 7, 242–253. [Google Scholar] [CrossRef]
  44. Jafari, M. System identification of a soil tunnel based on a hybrid artificial neural network–numerical model approach. Iran. J. Sci. Technol. Trans. Civ. Eng. 2020, 44, 889–899. [Google Scholar] [CrossRef]
  45. Xu, M.; Cui, C.; Zhao, J.; Xu, C.; Zhang, P.; Su, J. Fuzzy seismic fragility analysis of underground structures considering multiple failure criteria. Tunn. Undergr. Space Technol. 2024, 145, 105614. [Google Scholar] [CrossRef]
  46. Jin, H.; Jin, X. Performance assessment framework and deterioration repairs design for highway tunnel using a combined weight-fuzzy theory: A case study. Iran. J. Sci. Technol. Trans. Civ. Eng. 2022, 46, 3259–3281. [Google Scholar] [CrossRef]
  47. Trifunac, M.D.; Todorovska, M.I. Note on the useable dynamic range of accelerographs recording translation. Soil Dyn. Earthq. Eng. 2001, 21, 275–286. [Google Scholar] [CrossRef]
  48. Talebian, M.; Jackson, J. A reappraisal of earthquake focal mechanisms and active shortening in the Zagros mountains of Iran. Geophys. J. Int. 2004, 156, 506–526. [Google Scholar] [CrossRef]
  49. Kowsari, M.; Ghazi, H.; Kijko, A.; Javadi, H.R.; Shabani, E. Estimating the maximum earthquake magnitude in the Iranian Plateau. J. Seismol. 2021, 25, 845–862. [Google Scholar] [CrossRef]
  50. Wells, D.L.; Coppersmith, K.J. New empirical relationships among magnitude, rupture length, rupture width, rupture area, and surface displacement. Bull. Seismol. Soc. Am. 1994, 84, 974–1002. [Google Scholar] [CrossRef]
  51. Nowroozi, A.A. Probability of peak ground horizontal and peak ground vertical accelerations at tehran and surrounding areas. Pure Appl. Geophys. 2010, 167, 1459–1474. [Google Scholar] [CrossRef]
  52. Ghassemi, M.R. Surface ruptures of the Iranian earthquakes 1900–2014: Insights for earthquake fault rupture hazards and empirical relationships. Earth-Sci. Rev. 2016, 156, 1–13. [Google Scholar] [CrossRef]
  53. Thingbaijam, K.S.; Martin, M.P.; Goda, K. New empirical earthquake source-scaling laws. Bull. Seismol. Soc. Am. 2017, 107, 2225–2246. [Google Scholar] [CrossRef]
  54. Darzi, A.; Zolfaghari, M.R.; Cauzzi, C.; Fäh, D. An empirical ground-motion model for horizontal PGV, PGA, and 5% damped elastic response spectra (0.01–10 s) in Iran. Bull. Seismol. Soc. Am. 2019, 109, 1041–1057. [Google Scholar] [CrossRef]
  55. Alavi, A.H.; Gandomi, A.H.; Modaresnezhad, M.; Mousavi, M. New ground-motion prediction equations using multi expression programing. J. Earthq. Eng. 2011, 15, 511–536. [Google Scholar] [CrossRef]
  56. SYNER-G. Guidelines for Deriving Seismic Fragility Functions of Elements at Risk: Buildings, Lifelines, Transportation Networks and Critical Facilities; Springer: Berlin/Heidelberg, Germany, 2013. [Google Scholar]
  57. Hosseini, Y.; Mohammadi, R.K.; Yang, T.Y. A comprehensive approach in post-earthquake blockage prediction of urban road network and emergency resilience optimization. Reliab. Eng. Syst. Saf. 2024, 244, 109887. [Google Scholar] [CrossRef]
  58. Hosseini, Y.; Mohammadi, R.K.; Yang, T.Y. Resource-based seismic resilience optimization of the blocked urban road network in emergency response phase considering uncertainties. Int. J. Disaster Risk Reduct. 2023, 85, 103496. [Google Scholar] [CrossRef]
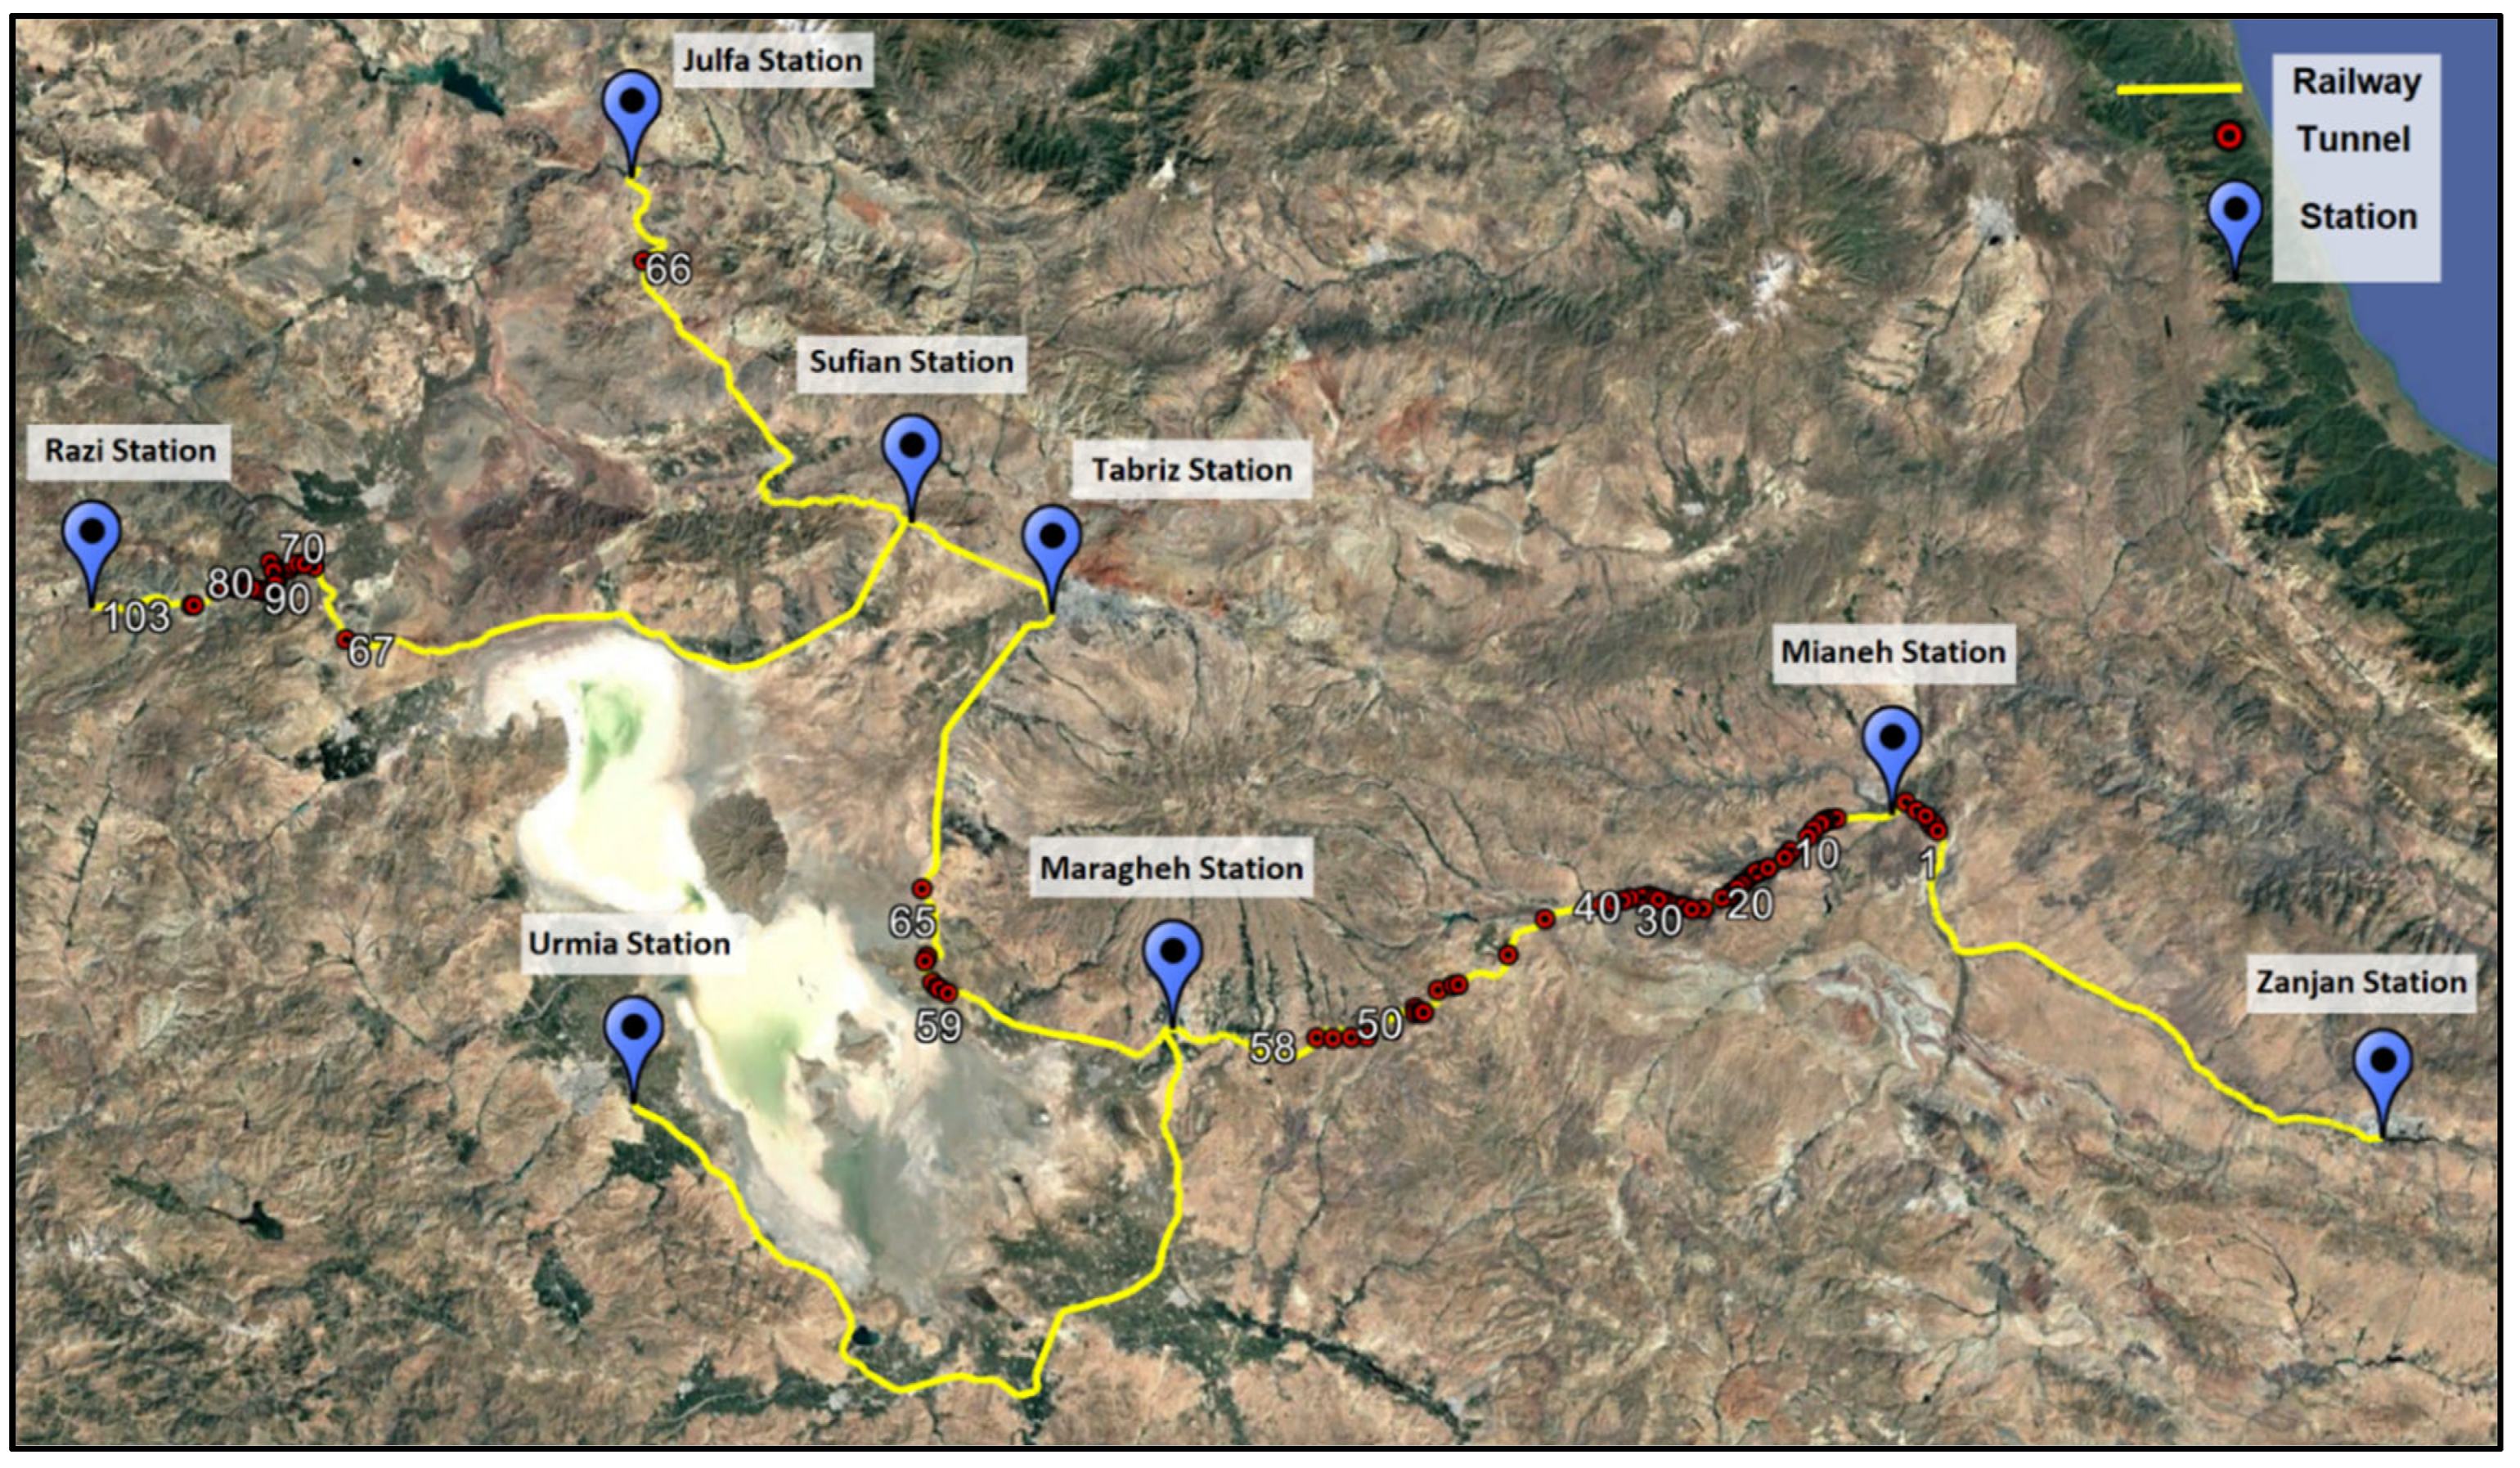
Figure 1. The railway network of the northwest of Iran (Study Area) ©2025 Google Earth.
Infrastructures 10 00254 g001
Figure 2. Tunnel locations between Babakan and Miladi stations in Razi axis (close-up view) ©2025 Google Earth.
Infrastructures 10 00254 g002
Figure 3. Examples of railway tunnels in the study area.
Infrastructures 10 00254 g003
Figure 4. Location of tunnels, main faults, and micro faults.
Infrastructures 10 00254 g004
Figure 5. Example of tunnel damage in the Wenchuan earthquake 2008 [3], (a) Cracking and spalling of the concrete liner near the portal, (b) Collapse of the tunnel.
Infrastructures 10 00254 g005
Figure 6. Locations of tunnels and the Tabriz fault.
Infrastructures 10 00254 g006
Figure 7. The PGD at the location of each tunnel was caused by the Tabriz fault Earthquake.
Infrastructures 10 00254 g007
Figure 8. The PGA at the location of each tunnel caused by the Tabriz fault Earthquake.
Infrastructures 10 00254 g008
Figure 9. Location of tunnels and the Shiramin fault.
Infrastructures 10 00254 g009
Figure 10. The PGD at the location of each tunnel caused by the Shiramin fault Earthquake.
Infrastructures 10 00254 g010
Figure 11. The PGA at the location of each tunnel caused by the Shiramin fault Earthquake.
Infrastructures 10 00254 g011
Figure 12. PGD fragility curves for rock tunnels and galleries [29].
Infrastructures 10 00254 g012
Figure 13. PGA fragility curves for rock tunnels, poor-to-average conditions [56].
Infrastructures 10 00254 g013
Figure 14. PGA fragility curves for galleries, poor-to-average conditions [56].
Infrastructures 10 00254 g014
Figure 15. Schematic representation of the damage state probability P D S k | I M .
Infrastructures 10 00254 g015
Figure 16. Vulnerability curve of railway rock tunnels under PGD.
Infrastructures 10 00254 g016
Figure 17. Vulnerability curve of railway rock tunnels under PGA.
Infrastructures 10 00254 g017
Figure 18. Damage index of tunnels under peak ground displacement (PGD)—earthquake caused by the Tabriz fault.
Infrastructures 10 00254 g018
Figure 19. Damage index of tunnels under peak ground acceleration (PGA)—earthquake caused by the Tabriz fault.
Infrastructures 10 00254 g019
Figure 20. Damage index of tunnels under peak ground displacement (PGD)—earthquake caused by the Shiramin fault.
Infrastructures 10 00254 g020
Figure 21. Damage index of tunnels under peak ground acceleration (PGA)—earthquake caused by the Shiramin fault.
Infrastructures 10 00254 g021
Figure 22. Examples of high damage levels: (a) severe water seepage, (b) a large gap in the expansion joint.
Infrastructures 10 00254 g022
Table 1. The length of the faults and their faulting mechanism.
NumberFault NameLength (km)Faulting Mechanism
1Tabriz240Strike-Slip (right-lateral)
2Bozqush102Reverse
3Maku100Strike-Slip (right-lateral)
4Takhte Solaiman (Tekab)70Strike-Slip (right-lateral) and Thrust
5Ahar65Strike-Slip (right-lateral)
6Chahar Sotun32Reverse (thrust)
7Buket25Reverse (thrust)
8Hessar Talkhuk23Reverse (thrust)
9Shiramin21Reverse (thrust)
10Talesh Kandi21Reverse (thrust)
11Khanyordi19Strike-Slip (left-lateral)
12Mahkuh17Reverse
Table 2. The maximum magnitude of each fault.
NumberFault Name Maximum   Magnitude   of   Faults   ( M m a x )
1Tabriz7.7
2Bozqush7.2
3Maku7.2
4Takhte Solaiman (Tekab)7
5Ahar7
6Chahar Sotun6.7
7Buket6.6
8Hessar Talkhuk6.6
9Shiramin6.5
10Talesh Kandi6.5
11Khanyordi6.5
12Mahkuh6.4
Table 3. Damage states of railway rock tunnels [29].
Damage StateDamage Description
None Damage
(k = 0)
---
Slight/Minor
(k = 1)
Minor cracking of the tunnel liner (damage requires no more than cosmetic repair) and some rock falling, or slight settlement of the ground at a tunnel portal
Moderate
(k = 2)
Moderate cracking of the tunnel liner and rock falling
Extensive/Complete
(k = 3)
Major ground settlement at a tunnel portal and extensive cracking of the tunnel liner/Major cracking of the tunnel liner, which may include possible collapse
Table 4. PGD fragility parameters for rock railway tunnels [29].
ClassificationDamage StateΘβ
Bored/Drilled
(HTU1)
&
Cut/Cover
(HTU2)
Slight/Minor6.00.7
Moderate12.00.5
Extensive/Complete60.00.5
Table 6. Relationship between DS and DI.
PGD and PGA
Damage StateDamage Index
Slight/Minor 0 < D I < 1
Moderate 1 < D I < 2
Extensive/Complete 2 < D I < 3
Table 5. Fragility parameters for damage caused by PGA in railway rock tunnels [56].
TypologyDamage StateΘ (g)β
Rock tunnels with poor-to-average conditionsSlight/Minor0.350.4
Moderate0.550.4
Extensive/Complete1.10.5
Rock tunnels with good conditionsSlight/Minor0.610.4
Moderate0.820.4
Extensive/CompleteNA *-
Alluvial (Soil) and Cut and Cover Tunnels with poor to average conditionsSlight/Minor0.30.4
Moderate0.450.4
Extensive/Complete0.950.5
Alluvial (Soil) and Cut and Cover Tunnels with good conditionsSlight/Minor0.50.4
Moderate0.70.4
Extensive/CompleteNA *-
* Not Available.
Table 7. Tunnel lifetime damages categorization.
Damage LevelDamage Description
HighForming large gaps in the expansion joints, Significant ground settlement in the tunnel portal, High instability of the trench at the entrance-exit of the tunnel, Major horizontal cracks in the roof and sidewall of the tunnel, severe breakage and detachment of the lining, and water seepage from the crack, Falling rock cover of the tunnel
MediumMinor vertical crack in the sidewall, Protrusion of the rock lining, defects of the drainage system, cracking of the tunnel portal and head-wall
LowSlight cracks in the lining, Slight water leakage from the cover and floor, laxity of the rock lining
Table 8. Damage level weighing.
Damage levelNonLowMediumHigh
Visual Inspection Weight (VIW)0123
Table 9. Tunnel prioritization criteria based on NPI.
NPI<6060–7070–8080–100
PrioritizationFourth PriorityThird PrioritySecond PriorityFirst Priority
Table 10. Prioritization of tunnels.
PrioritizationTunnel
ID
LocationSVIVIWNPI
Main
Class
Sub
Class
LongitudeLatitude
First Priority1-127G * 47.3888725 ° 37.33695 ° 14.008293.46
1-233 47.2862134 ° 37.3399329 ° 12.067387.97
1-379 44.7109415 ° 38.4767273 ° 11.448386.36
1-492 44.6659554 ° 38.4556661 ° 11.224383.05
1-516G 47.5229574 ° 37.3712808 ° 14.127 **082.48
1-615G 47.5284559 ° 37.3745134 ° 14.117082.42
1-720G 47.455641 ° 37.3580349 ° 14.110082.38
1-897 44.6428761 ° 38.4640936 ° 11.085382.23
1-926G 47.3909989 ° 37.3383236 ° 14.012081.81
1-109G 47.6177549 ° 37.4046646 ° 13.858080.91
Second Priority2-146G 46.925463 ° 37.3450689 ° 10.522378.95
2-236 47.2540745 ° 37.3573404 ° 13.519078.92
2-378 44.7087854 ° 38.4890092 ° 11.414278.32
2-4103 44.5288089 ° 38.4581489 ° 10.326377.80
2-572G 44.7760481 ° 38.4747849 ° 11.885175.23
2-63 47.8121811 ° 37.3500978 ° 10.731274.33
2-769 44.7934602 ° 38.4728638 ° 11.717174.25
2-870 44.7871955 ° 38.4743938 ° 11.702174.16
2-974 44.7502806 ° 38.4781241 ° 11.598173.57
2-1017 47.5125891 ° 37.3664136 ° 12.55073.30
2-111 47.8230224 ° 37.3349528 ° 10.547273.26
2-1218 47.4747827 ° 37.359906 ° 12.534073.18
2-1319 47.4575947 ° 37.3578464 ° 12.513073.06
2-1421 47.4489004 ° 37.3579147 ° 12.495072.95
2-1522 47.4385313 ° 37.3540995 ° 12.488072.91
2-1614 47.570567 ° 37.3882992 ° 12.473072.83
2-1723 47.4213621 ° 37.3474904 ° 12.469072.80
2-1881 44.7122991 ° 38.4669846 ° 11.466172.78
2-1924 47.4131818 ° 37.3454633 ° 12.453072.71
2-2025 47.3687134 ° 37.3334281 ° 12.436072.61
2-2113 47.5843369 ° 37.3962094 ° 12.409072.45
2-2228 47.3880809 ° 37.3324979 ° 12.406072.43
2-2329 47.3687134 ° 37.3334281 ° 12.343072.07
2-2412 47.5843369 ° 37.3962094 ° 12.336072.02
2-2511 47.6007783 ° 37.4020909 ° 12.311071.88
2-2610 47.6127676 ° 37.4045944 ° 12.284071.72
2-278 47.6231588 ° 37.404382 ° 12.251071.53
2-2867 44.8184487 ° 38.3393055 ° 11.228171.39
2-297 47.6354766 ° 37.4022436 ° 12.216071.32
2-3030 47.3259049 ° 37.3262241 ° 12.201071.24
2-3193 44.6576581 ° 38.4584875 ° 11.175171.09
2-3231 47.3038634 ° 37.3308712 ° 12.125070.79
2-3332 47.2932418 ° 37.3379031 ° 12.090070.59
2-3434 47.2777637 ° 37.3423696 ° 12.037070.28
Third Priority3-135 47.2627236 ° 37.3528734 ° 11.972069.90
3-237 47.2471531 ° 37.3607276 ° 11.894069.44
3-338 47.2440027 ° 37.3645507 ° 11.872069.32
3-439 47.230884 ° 37.3707979 ° 11.793068.86
3-568 44.7933504 ° 38.4663065 ° 11.732068.50
3-6101 44.5882652 ° 38.4707001 ° 10.731168.49
3-740 47.216297 ° 37.3715659 ° 11.710068.37
3-871 44.7839813 ° 38.4750096 ° 11.694068.28
3-973 44.7585971 ° 38.4787578 ° 11.622068.86
3-1075 44.742485 ° 38.4730574 ° 11.581067.62
3-1141 47.1929316 ° 37.3756389 ° 11.555067.46
3-1276 44.7218687 ° 38.4772168 ° 11.494067.11
Third Priority3-1382 44.7137614 ° 38.4615824 ° 11.477067.01
3-1483 44.7114959 ° 38.4584653 ° 11.467066.95
3-1580 44.712759 ° 38.4756436 ° 11.458066.90
3-1677 44.7145862 ° 38.4817574 ° 11.456066.88
3-1784 44.7074516 ° 38.454875 ° 11.447066.83
3-1842 47.1736966 ° 37.3749494 ° 11.422066.69
3-1985 44.6935974 ° 38.4470138 ° 11.373066.40
3-2043 47.1655401 ° 37.3752478 ° 11.362066.34
3-2186 44.6887589 ° 38.4472039 ° 11.346066.25
3-2287 44.6869354 ° 38.4473107 ° 11.337066.19
3-2350G 46.7311721 ° 37.2957757 ° 8.327366.13
3-2488 44.6833984 ° 38.4484213 ° 11.318066.08
3-2589 44.6809867 ° 38.4495845 ° 11.306066.01
3-2690 44.6773082 ° 38.4514458 ° 11.287065.90
3-2791 44.6727701 ° 38.4531041 ° 11.262065.76
3-286 47.7756459 ° 37.3953886 ° 11.166065.20
3-2994 44.6547987 ° 38.4598328 ° 11.159065.15
3-3095 44.6528074 ° 38.4608566 ° 11.146065.08
3-3144 47.1336416 ° 37.3776746 ° 11.101064.82
3-3296 44.6453734 ° 38.4626368 ° 11.085064.72
3-3398 44.6371453 ° 38.4653644 ° 11.048064.51
3-3499 44.6307438 ° 38.4652606 ° 11.006064.26
3-355 47.7925656 ° 37.3771549 ° 10.988064.20
3-36100 44.620597 ° 38.4688926 ° 10.937063.86
3-3765 45.8272093 ° 37.702687 ° 8.754262.74
3-384 47.8135096 ° 37.3601098 ° 10.736062.68
3-392 47.8198049 ° 37.3458431 ° 10.625062.04
3-4055G 46.6101971 ° 37.2829517 ° 7.368360.54
3-41102 44.5339999 ° 38.4564628 ° 10.358060.48
Fourth Priority4-154G 46.7162409 ° 37.3073254 ° 8.237259.77
4-264 45.8012469 ° 37.5968033 ° 8.168259.37
4-363 45.7943015 ° 37.5915815 ° 8.097258.96
4-457G 46.5419076 ° 37.2948915 ° 7.083358.87
4-559 45.8233305 ° 37.5333576 ° 7.945258.05
4-660 45.8090345 ° 37.5431999 ° 7.914257.89
4-761 45.8067872 ° 37.5453676 ° 7.891257.75
4-862 45.7969424 ° 37.5562349 ° 7.862257.58
4-945 47.0175084 ° 37.3825017 ° 9.823057.35
4-1049G 46.7708927 ° 37.3224207 ° 8.781157.11
4-1151G 46.7270463 ° 37.2969702 ° 8.295154.27
4-1252G 46.7255171 ° 37.2968576 ° 8.281154.19
4-1347G 46.8126698 ° 37.3218622 ° 9.200053.72
4-1448G 46.8041758   37.3222357 ° 9.113053.21
4-1556G 46.5778717 ° 37.2882203 ° 7.214147.96
4-1653G 46.7147613 ° 37.2988823 ° 8.195047.85
4-1758 46.5119735 ° 37.3028089 ° 5.184136.11
4-1866 45.6120502 ° 38.8015829 ° 4.781027.91
* G denotes gallery, ** Maximum Seismic Vulnerability Index (SVI).
Disclaimer/Publisher’s Note: The statements, opinions and data contained in all publications are solely those of the individual author(s) and contributor(s) and not of MDPI and/or the editor(s). MDPI and/or the editor(s) disclaim responsibility for any injury to people or property resulting from any ideas, methods, instructions or products referred to in the content.