Article

CFD Evaluation of Philippine Detached Structure with Different Roofing Designs

by
Napoleon A. Enteria
1,2,3
1
Department of Environmental Engineering, Building Research Institute, Tsukuba 305-0802, Japan
2
Graduate School of Engineering, Tohoku University, Sendai 980-8579, Japan
3
Enteria Grün Energietechnik, Davao 8000, The Philippines
Infrastructures 2016, 1(1), 3; https://doi.org/10.3390/infrastructures1010003
Submission received: 3 September 2016 / Revised: 1 October 2016 / Accepted: 6 October 2016 / Published: 10 October 2016

Abstract

:
The Philippines is located in the typhoon belt region in the western side of the Pacific Ocean. Every year, an average of twenty typhoons pass through the country, resulting in the loss of life and property. As the design of the roofing is an important factor in the structural integrity of the detached structures and the survival of the occupants, an evaluation of different roofing designs for the detached structure is needed. Different roofing designs, typical in Philippine detached structures were investigated using the computation fluid dynamics (CFD). The developed CFD model was validated based on the data from full scale and wind tunnel results. The different roofing designs were evaluated in the developed and validated model based on the flow field, pressure coefficients and streamlines at different wind angles. The results show that different roofing designs affect the flow field velocity, flow field pressure coefficient and the structure’s surface pressure coefficients. The pyramidal and domed roofing designs have a smoother flow field velocity, flow field pressure coefficient and house surface pressure coefficient. The eaves overhang, which is common in Philippine detached structures, has a large effect on the surface pressure coefficient and the velocity streamlines, as compared to structures with no eaves overhang. The results of this study show the importance of the roof design in Philippine detached structures.

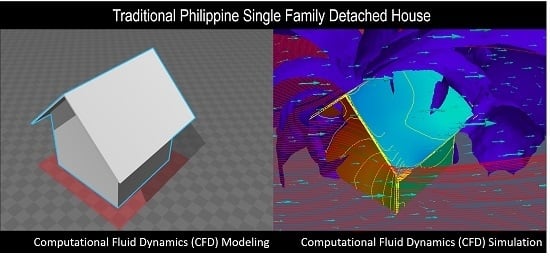
Graphical Abstract

1. Introduction

The Philippines is an island nation located in Southeast Asia, and is bounded by the Pacific Ocean to the east, the West Philippine Sea to the west, the Celebes Sea to the south and the Bashi Channel to the north. The country is composed of about 7500 islands on which the country’s population of more than 100 million lives. The Philippines is located in the typhoon belt region and the Pacific ring of fire. Due to the country’s location, a calamity can happen at any time which can result in casualties and the destruction of property. The northern part of the country has a large percentage of the typhoons each year as southern part is nearer the equator. Most of the areas in the Philippines experience typhoons and strong winds with heavy rains, with the exception of the southernmost areas. The strong typhoons cause great destruction to structures and houses, resulting in casualties.
As a rapidly economically developing country, there is an increasing gap in family income which results in different lifestyles and living conditions. Many of the people in the lower income bracket live in light material and wood houses, while many of the middle income bracket people live in ferro-concrete houses with corrugated galvanized iron roofing. Very few families live in big, well-designed houses that can withstand strong typhoons. With the different styles of houses based on the family income, many houses are damaged during a strong typhoon, along with public structures such as terminals, malls and other facilities. The people who suffer most are from those in the lower and middle income range, due to the designs, materials and types of houses they can afford [1]. Based on a physical evaluation and survey, most of the houses with roofing ripped off by strong winds also suffered a weakening of their structure. During Super Typhoon Haiyan, much of the roofing was ripped off by the strong winds, even from multi-storey or large buildings as shown in the pictures [2,3]. When the roofing of detached houses or buildings was ripped off by the strong wind during the typhoon, their structure weakened due to the rain and damage to the support structures below the roof.
Based on related studies on the effects of wind, the roof pitch affected the wind pressure coefficient distribution around the surface of the buildings [4]. Another study shows the effects of the house height and roof in the pressure and velocity around the house [5]. The study of Abohela et al. [6] shows the effects of the different roof designs on the wind flow pattern. As the roofing is part of the overall structure, it affects the whole structural integrity of the building during strong winds or typhoons. The roofing structure prevents the collapse of the structural wall, particularly in the case of houses, as it serves to brace the whole structure on the upper side while the house foundation supports the structure wall on the lower side. If the foundation is weak, the detached structure can be easily uprooted and overturned from its upright position. If the house roofing structure is weak and poorly designed, it can be easily blown away, thus weakening the house’s overall structural integrity, as now the wall has no support or brace on its upper portion. A detached structure foundation is a well-established part of the house while the importance of the house roofing design is not fully yet established due to the limited application of the concept of wind engineering in Philippine design of detached structures. An evaluation of Philippine detached structure roofing design is important for understanding the importance of the roof design.
This paper presents the application of the computational fluid dynamic in the analysis and evaluation of the typical roofing designs in Philippine detached structures. The objective of the study is to determine the flow field velocity, flow streamlines, flow field pressure coefficient and house surface pressure coefficient for the different roofing designs typical in the Philippines. With this study, it is expected that the design of the detached structures will take into consideration the roofing configuration to minimize damage during typhoons and avoid possible casualties. We also hope that with this study, the structural adjustment in the design of the detached structure will be known based on the effects of the roof to be used. Hence, this study is important for the Philippines which is located in the typhoon belt region and which has many detached structures, particularly single family houses, constructed from different local materials [1].

2. Methodology

2.1. Computational Fluid Dynamics

The compressible steady Reynolds-Averaged Navier Stokes (RANS) equations were solved using the finite volume method based OpenFoam solver [7], incorporated in simflow software [8]. The OpenFoam computational fluid dynamics solver has been used and validated by many researchers. Based on several studies, the solver can replicate the results from different major computational fluid dynamic software [9]. The solver was also validated from different experimental results [10]. Hence, in this study, the above solver is utilized in solving the problem of the detached structure with different roofing designs upon validation of the developed model as discussed in the succeeding sections.
Different turbulence models are used to determine the most appropriate turbulence model that can replicate the results of both the full scale and wind tunnel measurements of the wall-mounted cubic bluff body [11]. The different turbulence models implemented are the k-ε, RNG k-ε, Realizable k-ε, k-ω SST (Shear Stress Transport) and Spalart–Allmaras available in OpenFOAM [7].

2.2. Numerical Modelling

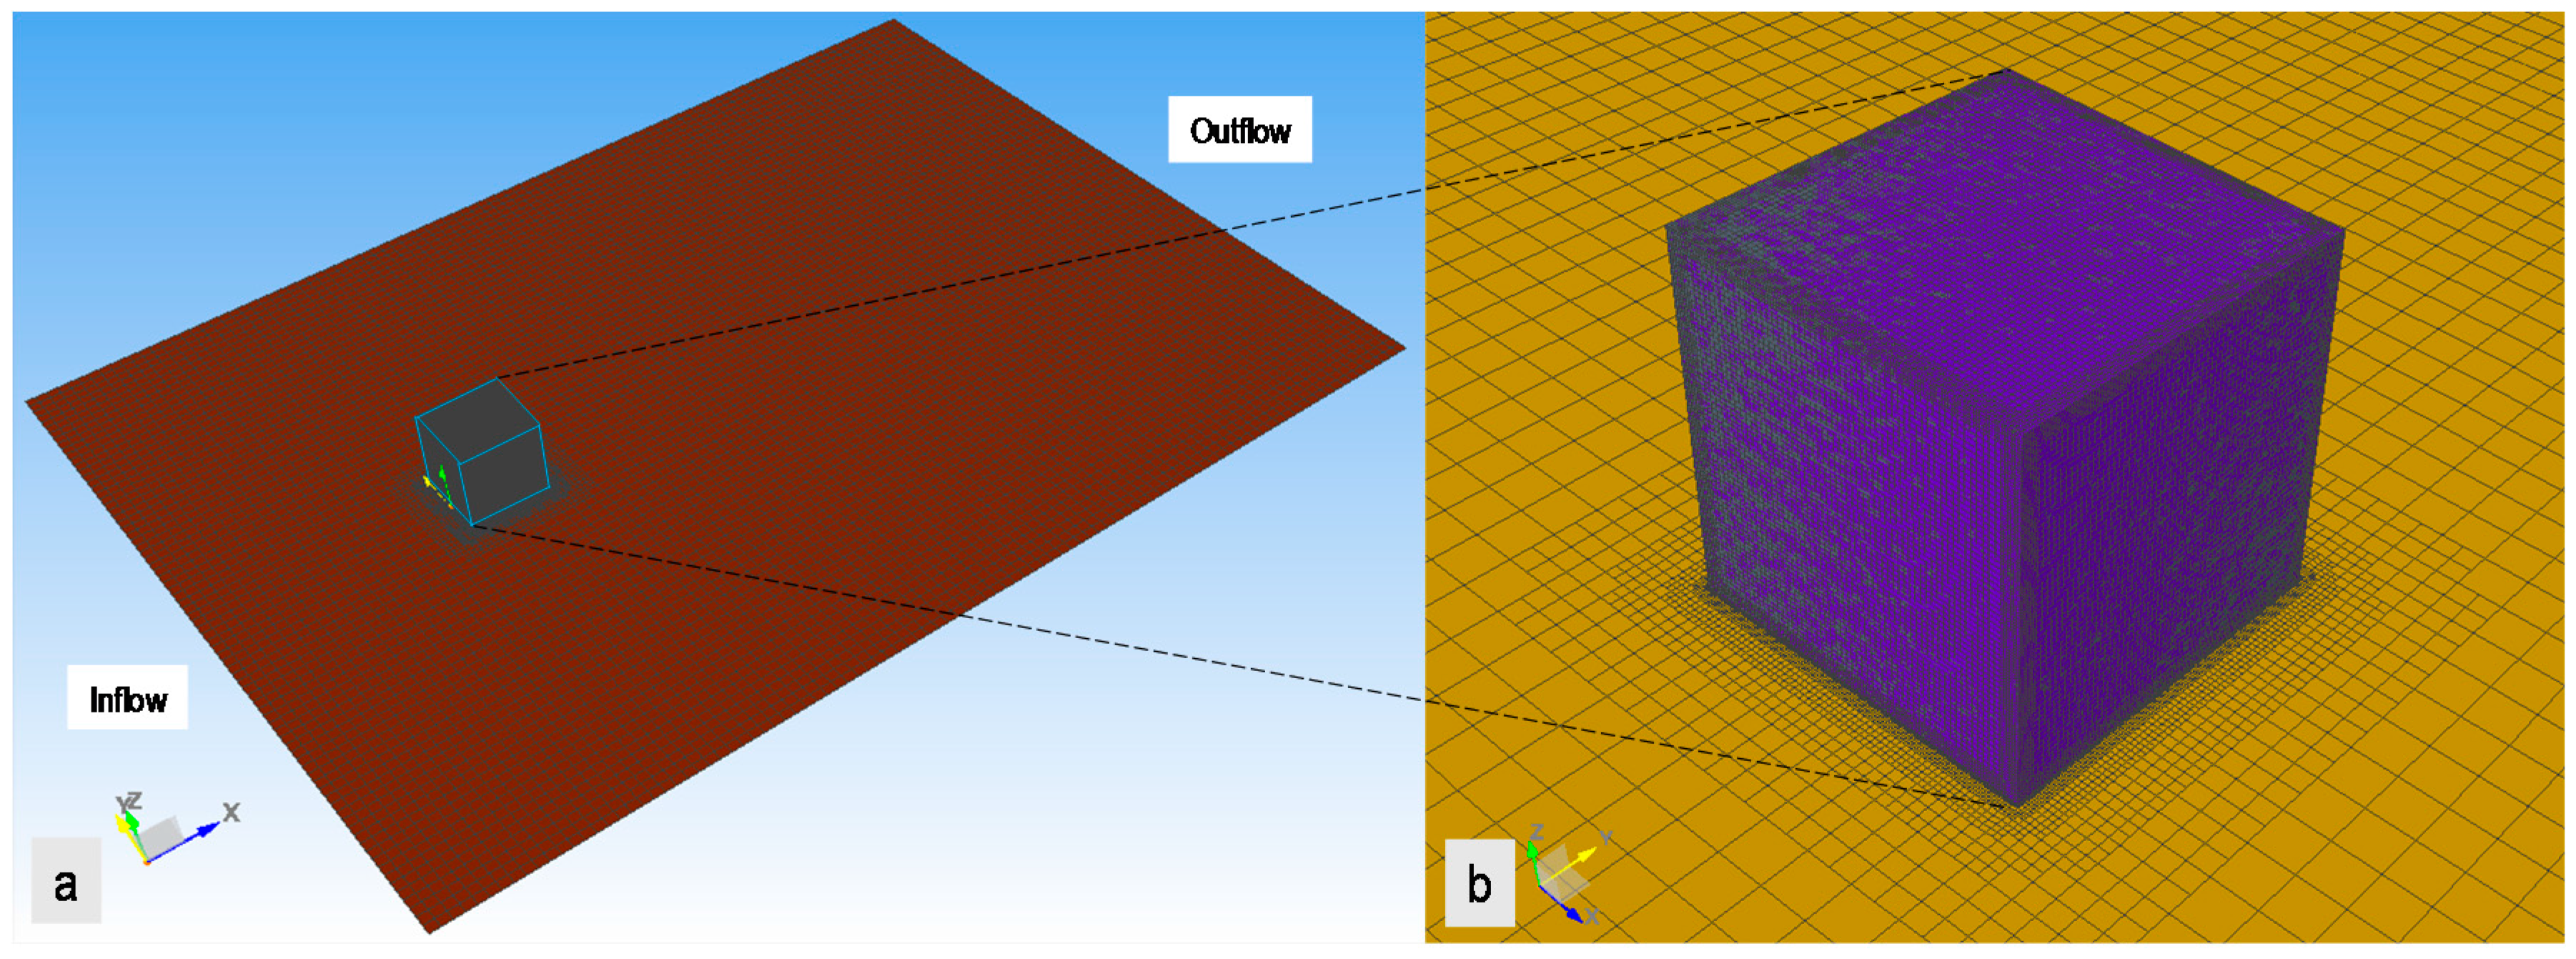
A configuration of a channel with a wall-mounted cube is shown in Figure 1. The computational domain is 9B × 4.5B × 4.5H in the streamwise (x), spanwise (y) and normal to the walls (z), respectively, where B = H is the cube’s height. The computational domain inlet and outlet are located at x = −3H and x = 10B, respectively and the cube is located between 0 ≤ x ≤ B, 0 ≤ z ≤ H, −0.5B ≤ y ≤ 0.5B.
Figure 1 shows that computational domain based on the recommended size of the whole domains. Based on other studies, the selection of the computational domain is important to avoid the effects of the computational domain in flow analysis around the bluff body [12,13,14]. Figure 2a shows the selected computational grid which is of 100 × 80 × 40 in the x, y and z directions, respectively, after conducting parametric studies on the effects of the grid on the results. Other studies show that it is very important to do parametric studies of the computational grid [4,15]. Hence, this study conducted several parametric studies before deciding the computational grid used in the different cases of the roof. The time step used in the simulation is 0.5 seconds after conducting parametric studies with regard to the effects of the time step. Decreasing the time step size does not mean that more accurate results are attained as round-off error increases. The 400 seconds simulation time is determined as enough in the converging of the simulation. A very fine and unstructured mesh around the cube is used in the study as presented in Figure 2b. The very fine and unstructured mesh with five layers around the cube was selected in this study. Versteeg and Malalasekera [16] show that the computational grid resolution, stretching factor, and mesh quality decide the accuracy of the solution.

2.3. Model Validation

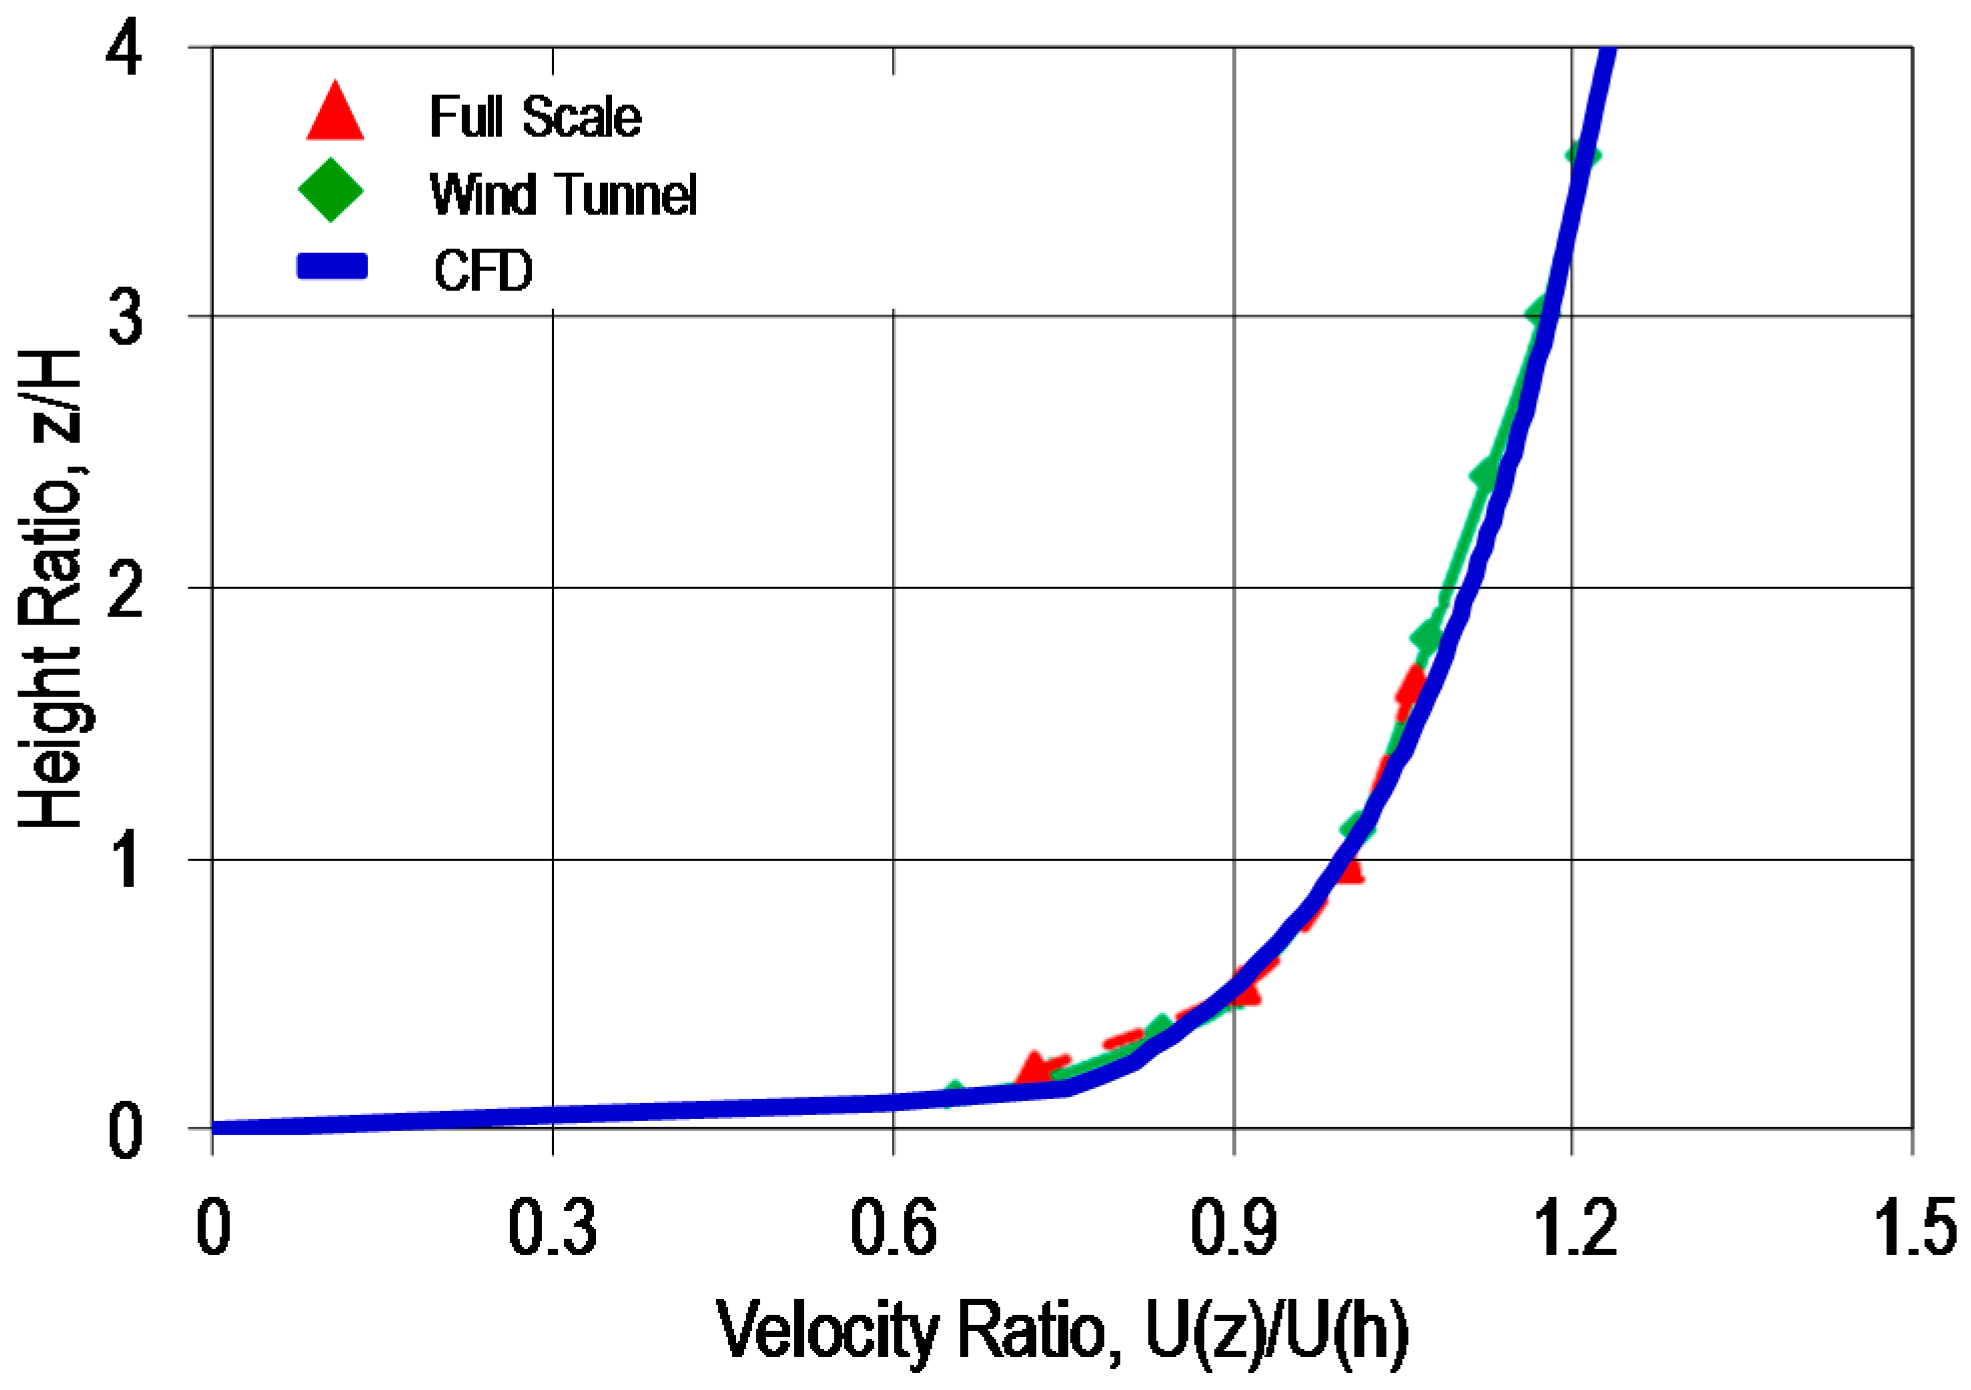
Equations (1)–(4) show the parameters used in the inflow conditions in the computational domain. Equation (1) is the inlet velocity gradient used in the model to replicate the inlet velocity gradient of the wind tunnel and full scale measurement conducted by Irtaza et al. [11]. Based on the result of the developed model, the result of the inlet gradient velocity replicated the full scale and wind tunnel results as shown in Figure 3. Hence, the developed model is used for the different turbulence models to compare the surface pressure coefficient in the cubic bluff-body. The developed model is used for the different turbulence models discussed above to compare the results of the pressure coefficient in the surface of the cubic bluff-body from the results of full scale and wind tunnel measurements. Equation (5) shows the formulation of the pressure coefficient.
In this modeling, validation and evaluation, the value of the velocity profile constant (ɑ) is 0.15. At the 0.15 value, the inlet velocity profile follows the velocity profile shown by Irtaza et al. [11] as presented using Equation (1). The value of the turbulence model constant (Cu) is 0.09. The von Karman constant (K) is 0.41. The presented turbulence model constant and von Karman constant are the typical values in modeling. The friction velocity ( u x ) is calculated based on Equation (2). The aerodynamic roughness length ( z o ) in Equation (2) is determined according to the relationship between roughness height ( k s ), constant ( C s ) and aerodynamic roughness length ( z o ) shown by Abohela et al. [17] based on the study of Blocken et al. [18]. In Equation (5), l is the characteristic length scale. The Cp is the dimensionless pressure coefficient at a localized pressure point. The value of the eave height (H) which is the same as the height of the cubic bluff-body is 4 m. The velocity at the eave height (V) is 4.81 m/s. The determination of the eave height velocity is when no cubic bluff-body is in the location. The Po is the static (ambient pressure which serves as the reference pressure). The U is the mean longitudinal wind speed at the eave height (reference height). The ρ is the air density at the localized point.
Inlet velocity profile (U(Z)):
U ( Z ) = U ( z H ) α
Friction velocity ( u x ):
u x = K U log ( H z o )
Turbulent kinetic energy (k):
k = u x 2 c u
Turbulent dissipation rate (ɛ):
ε = u x 3 K ( z + z o )
Specific rate of dissipation (ω):
ω = k 1 / 2 c u 1 / 4 l ;   l = 4 ( c u k ) 1 / 2
Pressure coefficient (Cp):
C p = p p o 1 2 ρ U 2
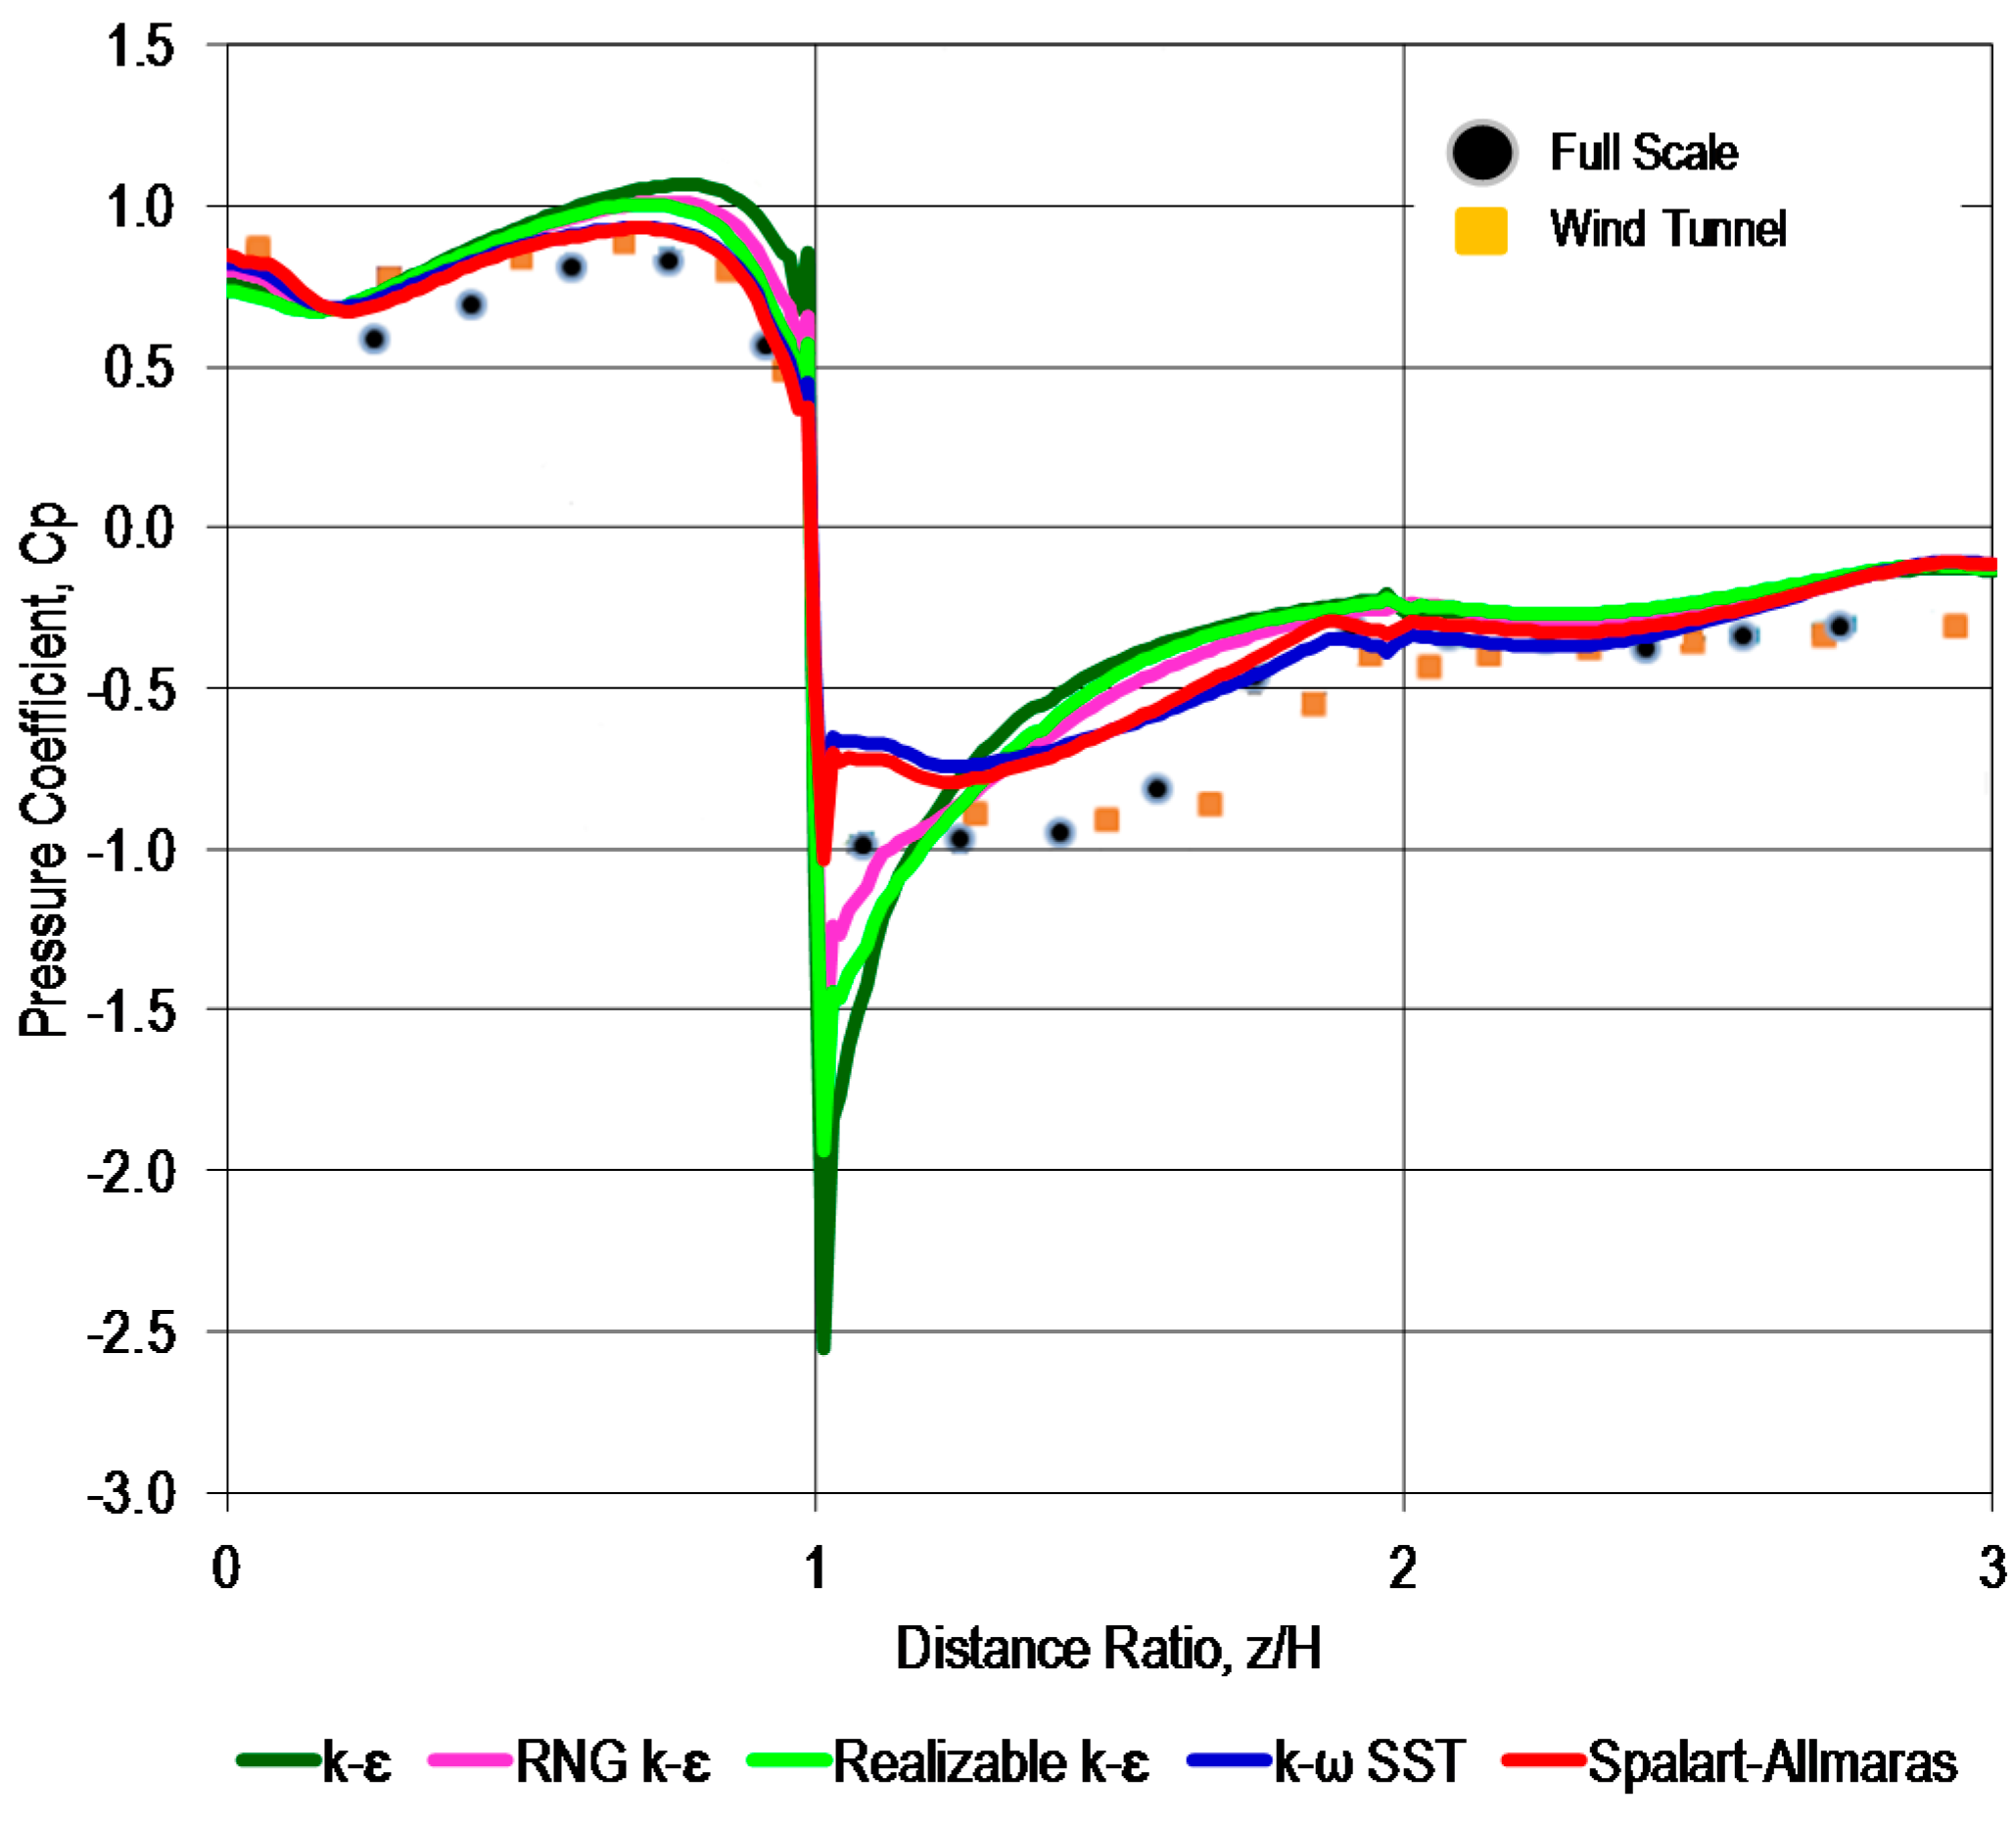
Figure 4 shows the comparison of the computational evaluation of the cubic bluff-body using the different turbulence models presented in the previous section to compare with the results of the full scale and wind tunnel measurements based on the centerline (y = 0) in the vertical axis (z-axis) [11]. Based on the results, it shows that the k-ω SST and the Spalart–Allmaras have good agreement from the results of both the full scale measurement and the wind tunnel measurement compared to the other turbulence models. This study used the k-ω SST as it has an almost negligible difference to the Spalart–Allmaras as shown in the results. Hence, the k-ω SST is used for the subsequent numerical calculations shown in this paper.

2.4. Simulation Cases

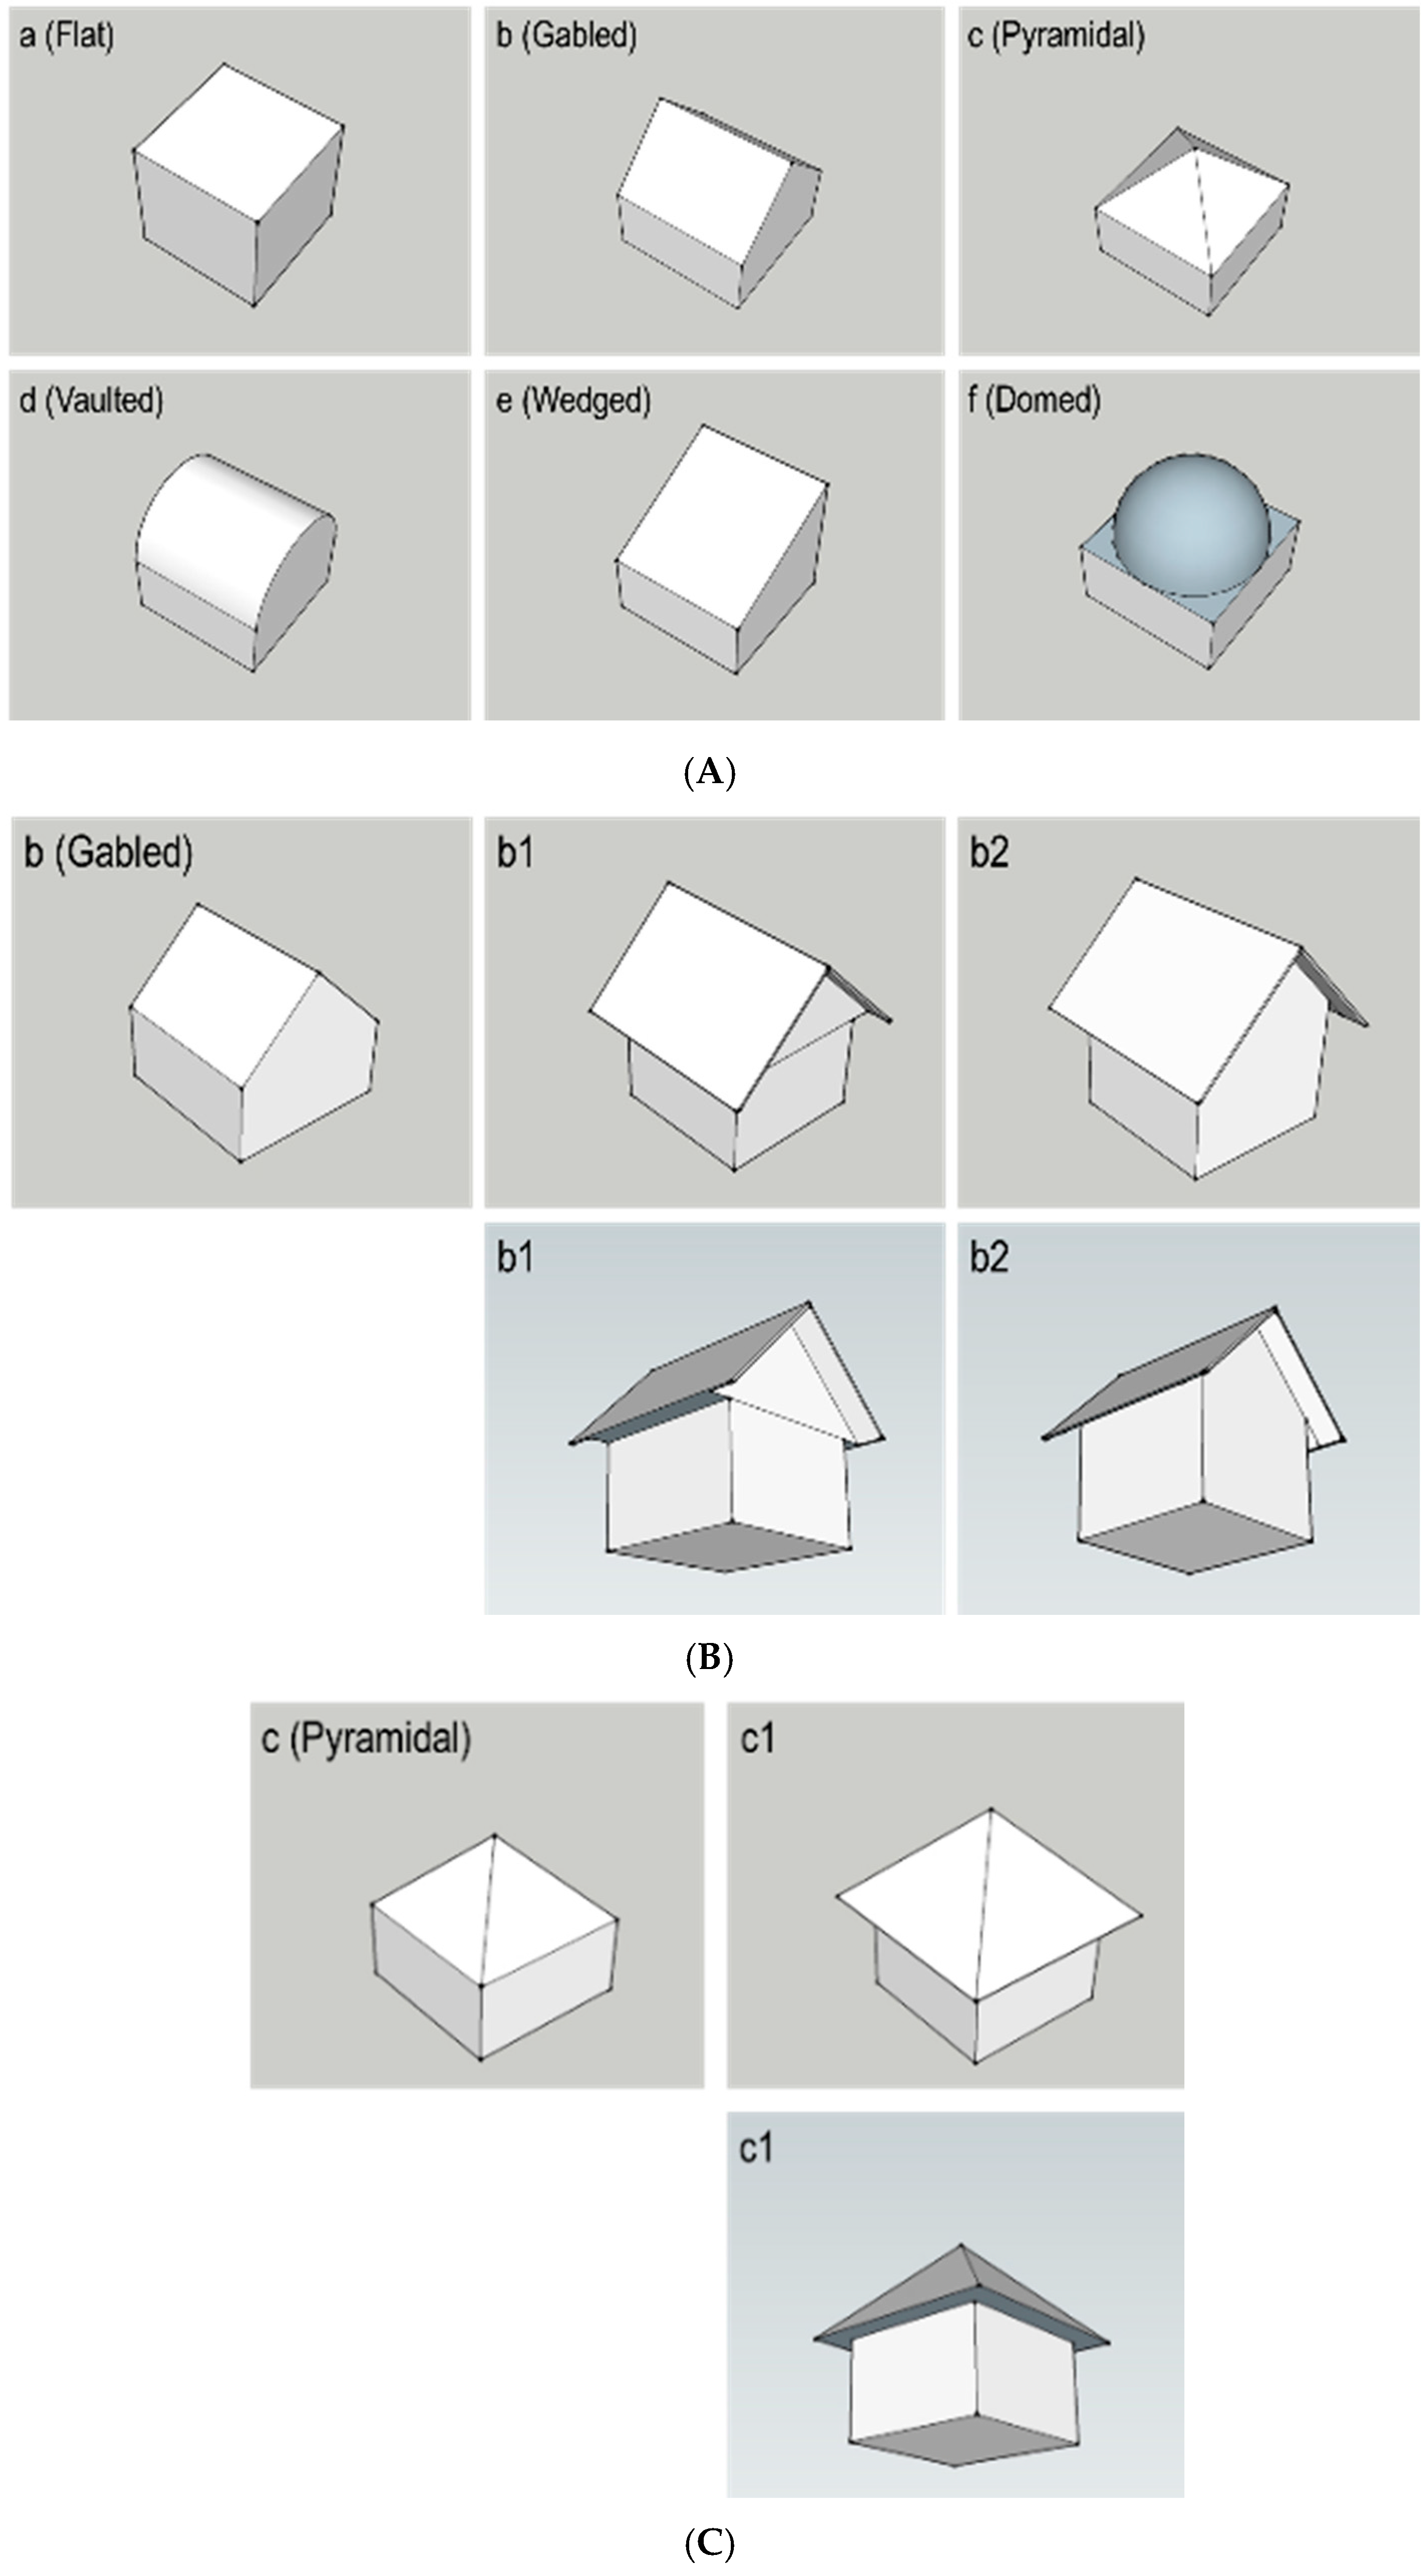
Figure 5A shows the typical design of the Philippine detached structure roofing. Figure 5A-a is the typical roofing design for ferro-concrete structures, particularly in buildings which are flat. Figure 5A-b is the typical design of a house for the low income to middle income families in the Philippines. Normally, most of the houses with this kind of roofing are made from light materials to ferro-concrete depending on the family income. The Figure 5A-c roofing design is typical in detached houses for other middle income families. It is normally constructed from corrugated steel sheet. Figure 5A-d is the typical roofing design for the big detached structures such as markets or transportation terminals. It is normally constructed from corrugated steel sheet. The Figure 5A-e roofing design is typical of small stores, detached houses and other structures. It is normally made either from corrugated steel sheet or ferro-concrete. Figure 5A-f is the typical roofing structure for big buildings such as domes, arenas or other structures such as for religious services.
Figure 5B shows the design of the roofing typical in lower to middle income family houses in the Philippines. Figure 5B is the generic roofing design. Figure 5B-b1 is one of the typical roofing designs with horizontal eaves overhang typical in some of the middle income family houses. Figure 5B-b2 is the most typical design of the lower income family with the gabled roof design. It is normally made from light materials, and is common in rural areas. Figure 5C shows the Pyramidal roof design, the typical design in some detached houses and other building structures in the Philippines. Figure 5C-c1 is the design normally implemented with an eaves overhang to protect from rain or sunshine.
The different roofing designs, both generic and the one implemented in the construction of houses and buildings, are presented and subjected to evaluation in this paper. The different roofing configurations are evaluated based on the angle of wind directions. Figure 5A-a has two angles of wind direction, Figure 5A-b has three angles of wind direction, Figure 5A-d has three angles of wind direction, Figure 5A-e has five angles of wind direction and Figure 5A-f has two angles of wind direction. In the case of Figure 5B-b1 and Figure 5B-b2, they have three angles of wind direction. In the case of Figure 5C-c1, there are two angles of wind direction.
The mean velocity contour, mean velocity vectors, mean velocity streamlines, mean pressure coefficient and surface pressure coefficient are determined for different roofing designs at different wind velocity angles as discussed above.

3. Results and Discussions

3.1. Flow Field Velocity

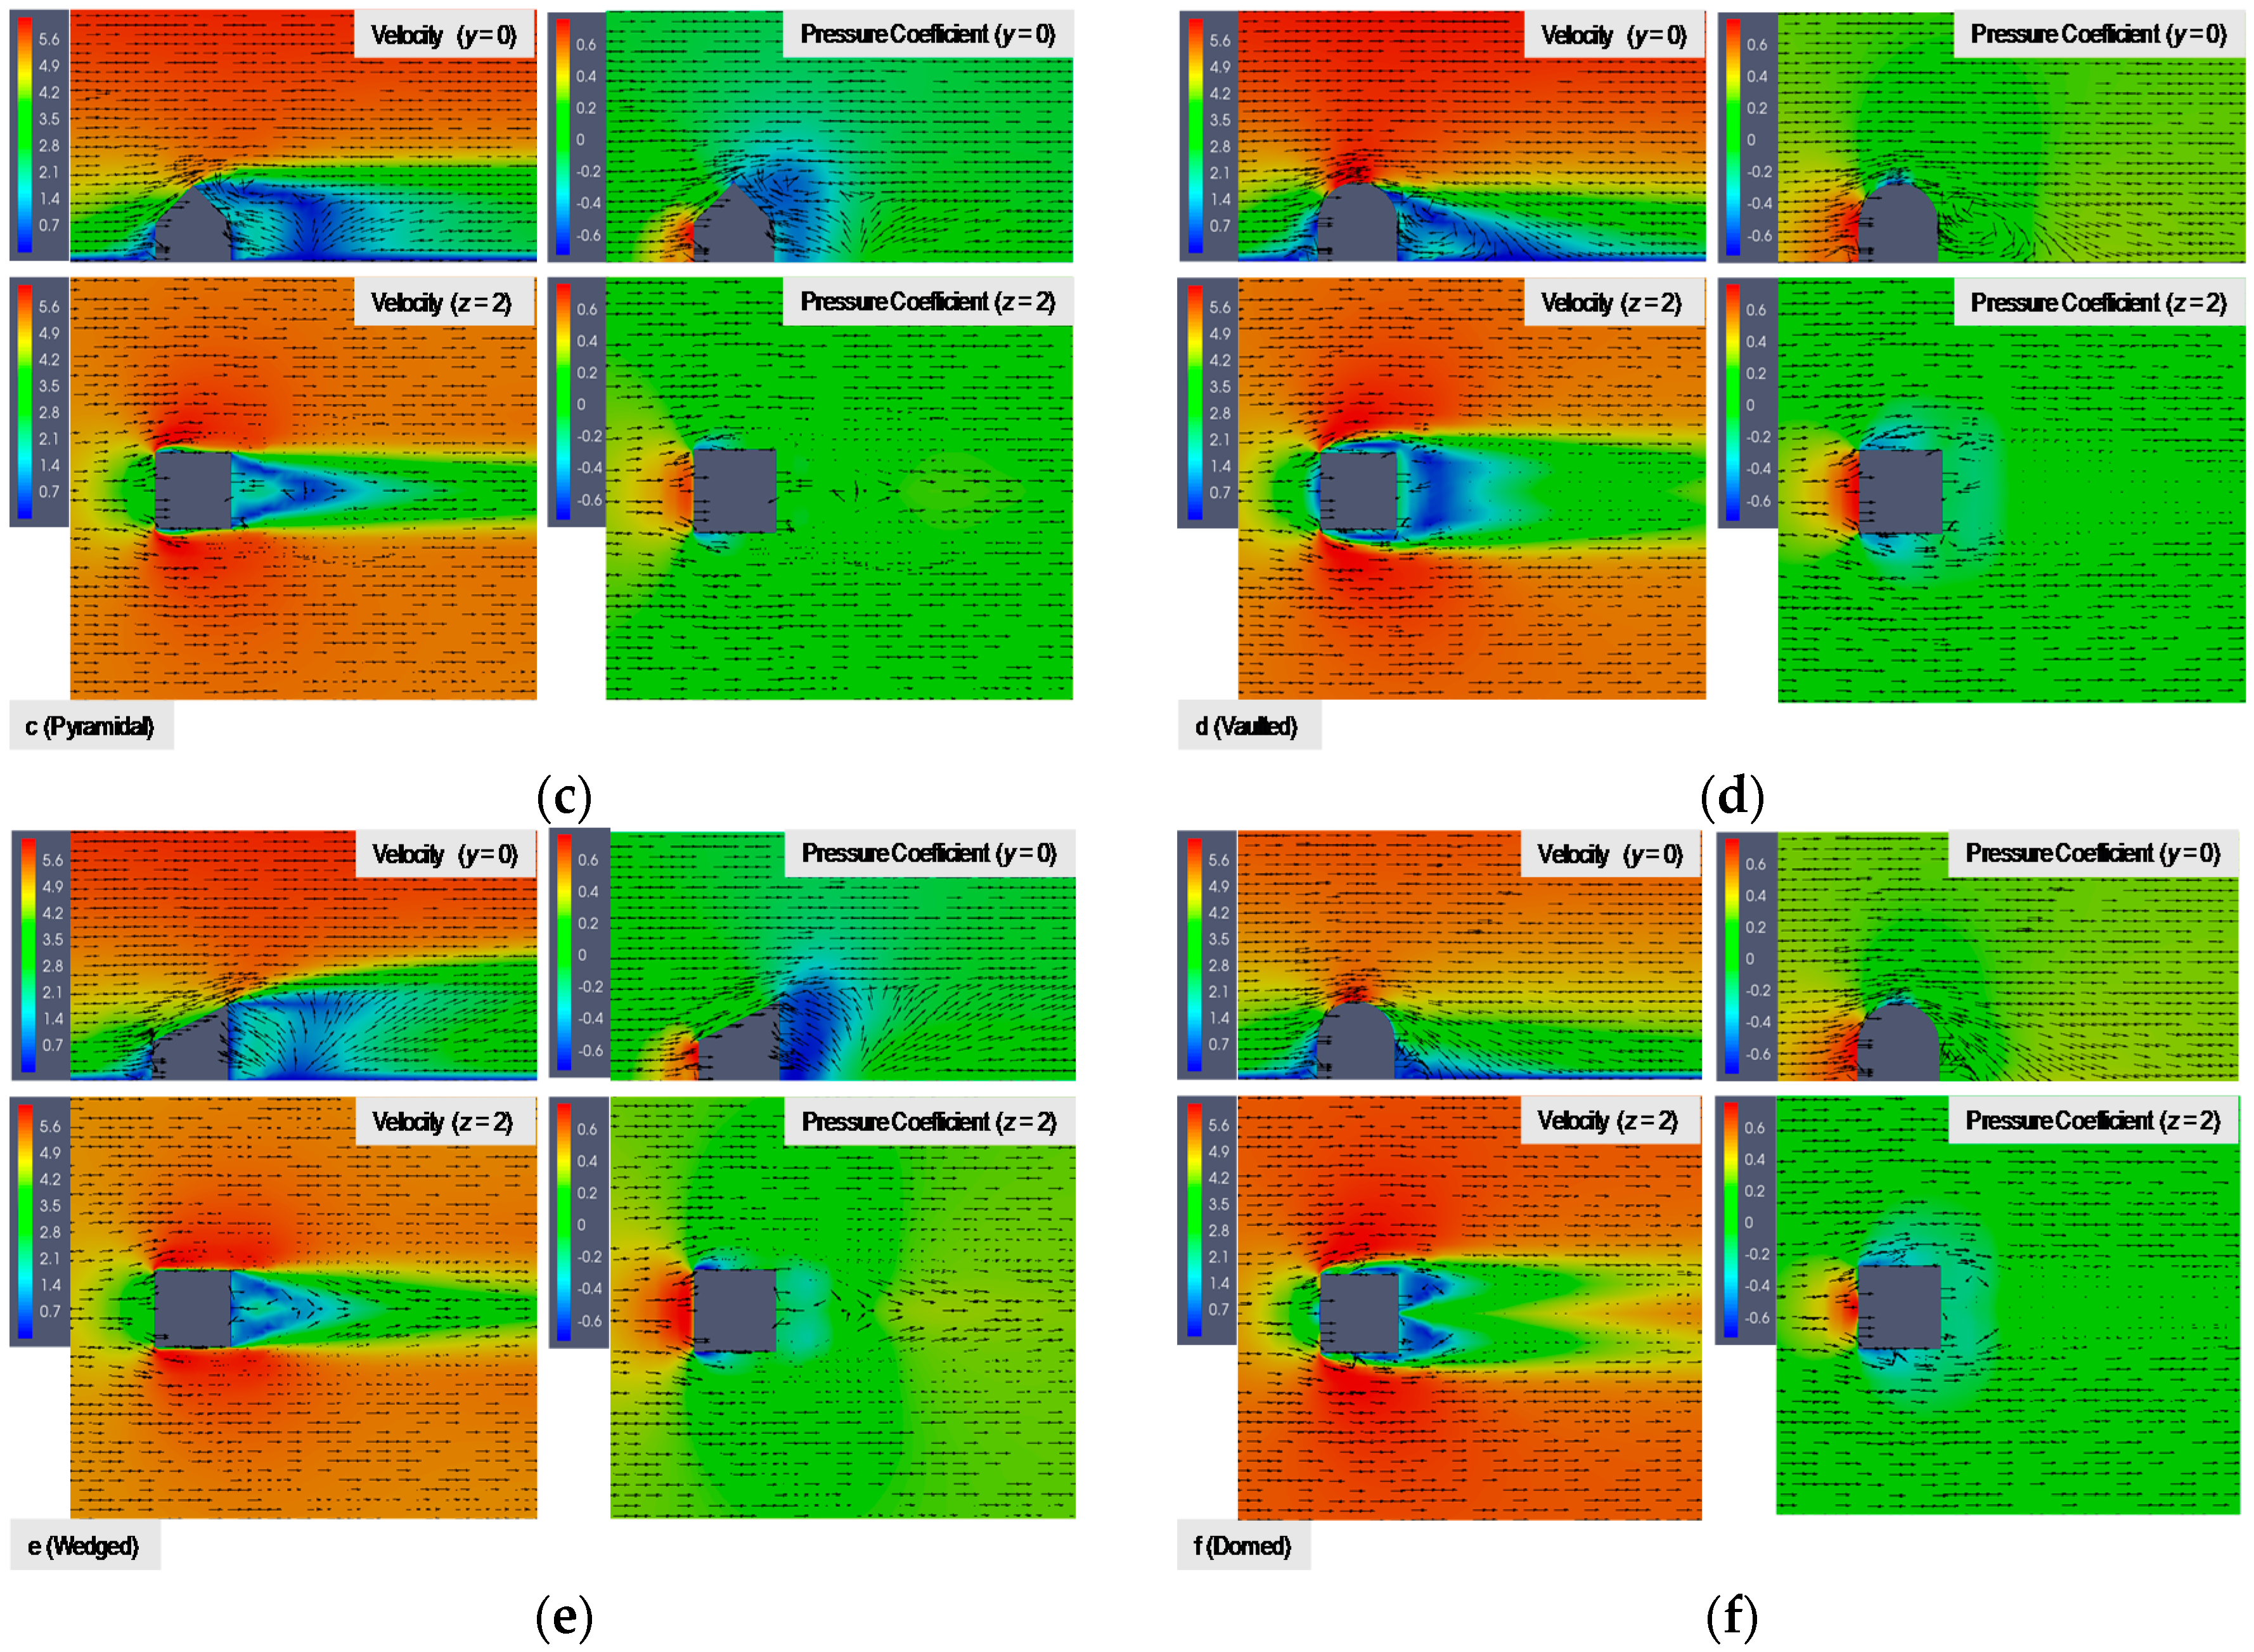
Figure 6 shows the centerline (y = 0) vertical (y-axis) mean velocity contour, mean velocity vectors and pressure coefficient contour around the detached structures with different roofing designs. It shows that the flat roof structure (Figure 6a) has flow separation above its leading edge. It shows that a flat roof house has a low pressure coefficient in leeward areas. Figure 6b shows that the results for the gabled roof, in which flow separation occurs at the top of the roof (ridge). It shows that the pressure coefficient is not so low when compared to the flat roof. Figure 6c shows a structure with the pyramidal roof design, in which the flow separation occurs at the top of the roof (ridge). Based on the results, it shows that the low pressure coefficient occurs in the areas with flow separation and areas with high velocity. For example, in the flat roof, the low pressure coefficient occurs due to the flow separation on the leading edge of the roof, resulting in some vortices at the top of the roof. In the case of the gabled roof, the low pressure coefficient occurs on the leeward area of the roof and flow separation occurs at the top of the roof. The same case is true for the pyramidal roof where the low pressure coefficient occurs in the leeward area of the roof. In the case of vaulted and domed roofs, there is not so much of a low pressure coefficient due to the fact that no recirculation occurs in the roof area. High streamwise velocity occurs at the very top of the roof, causing a low pressure coefficient in this area. In the case of the wedged roof, the flow separation occurs at the topmost portion of the roof and flow recirculation occurs in the leeward area, resulting in a low pressure coefficient here. The high pressure coefficient of the different roofing designs occurs in the windward area in which there is stagnation of the flow.

3.2. Surface Pressure Coefficient

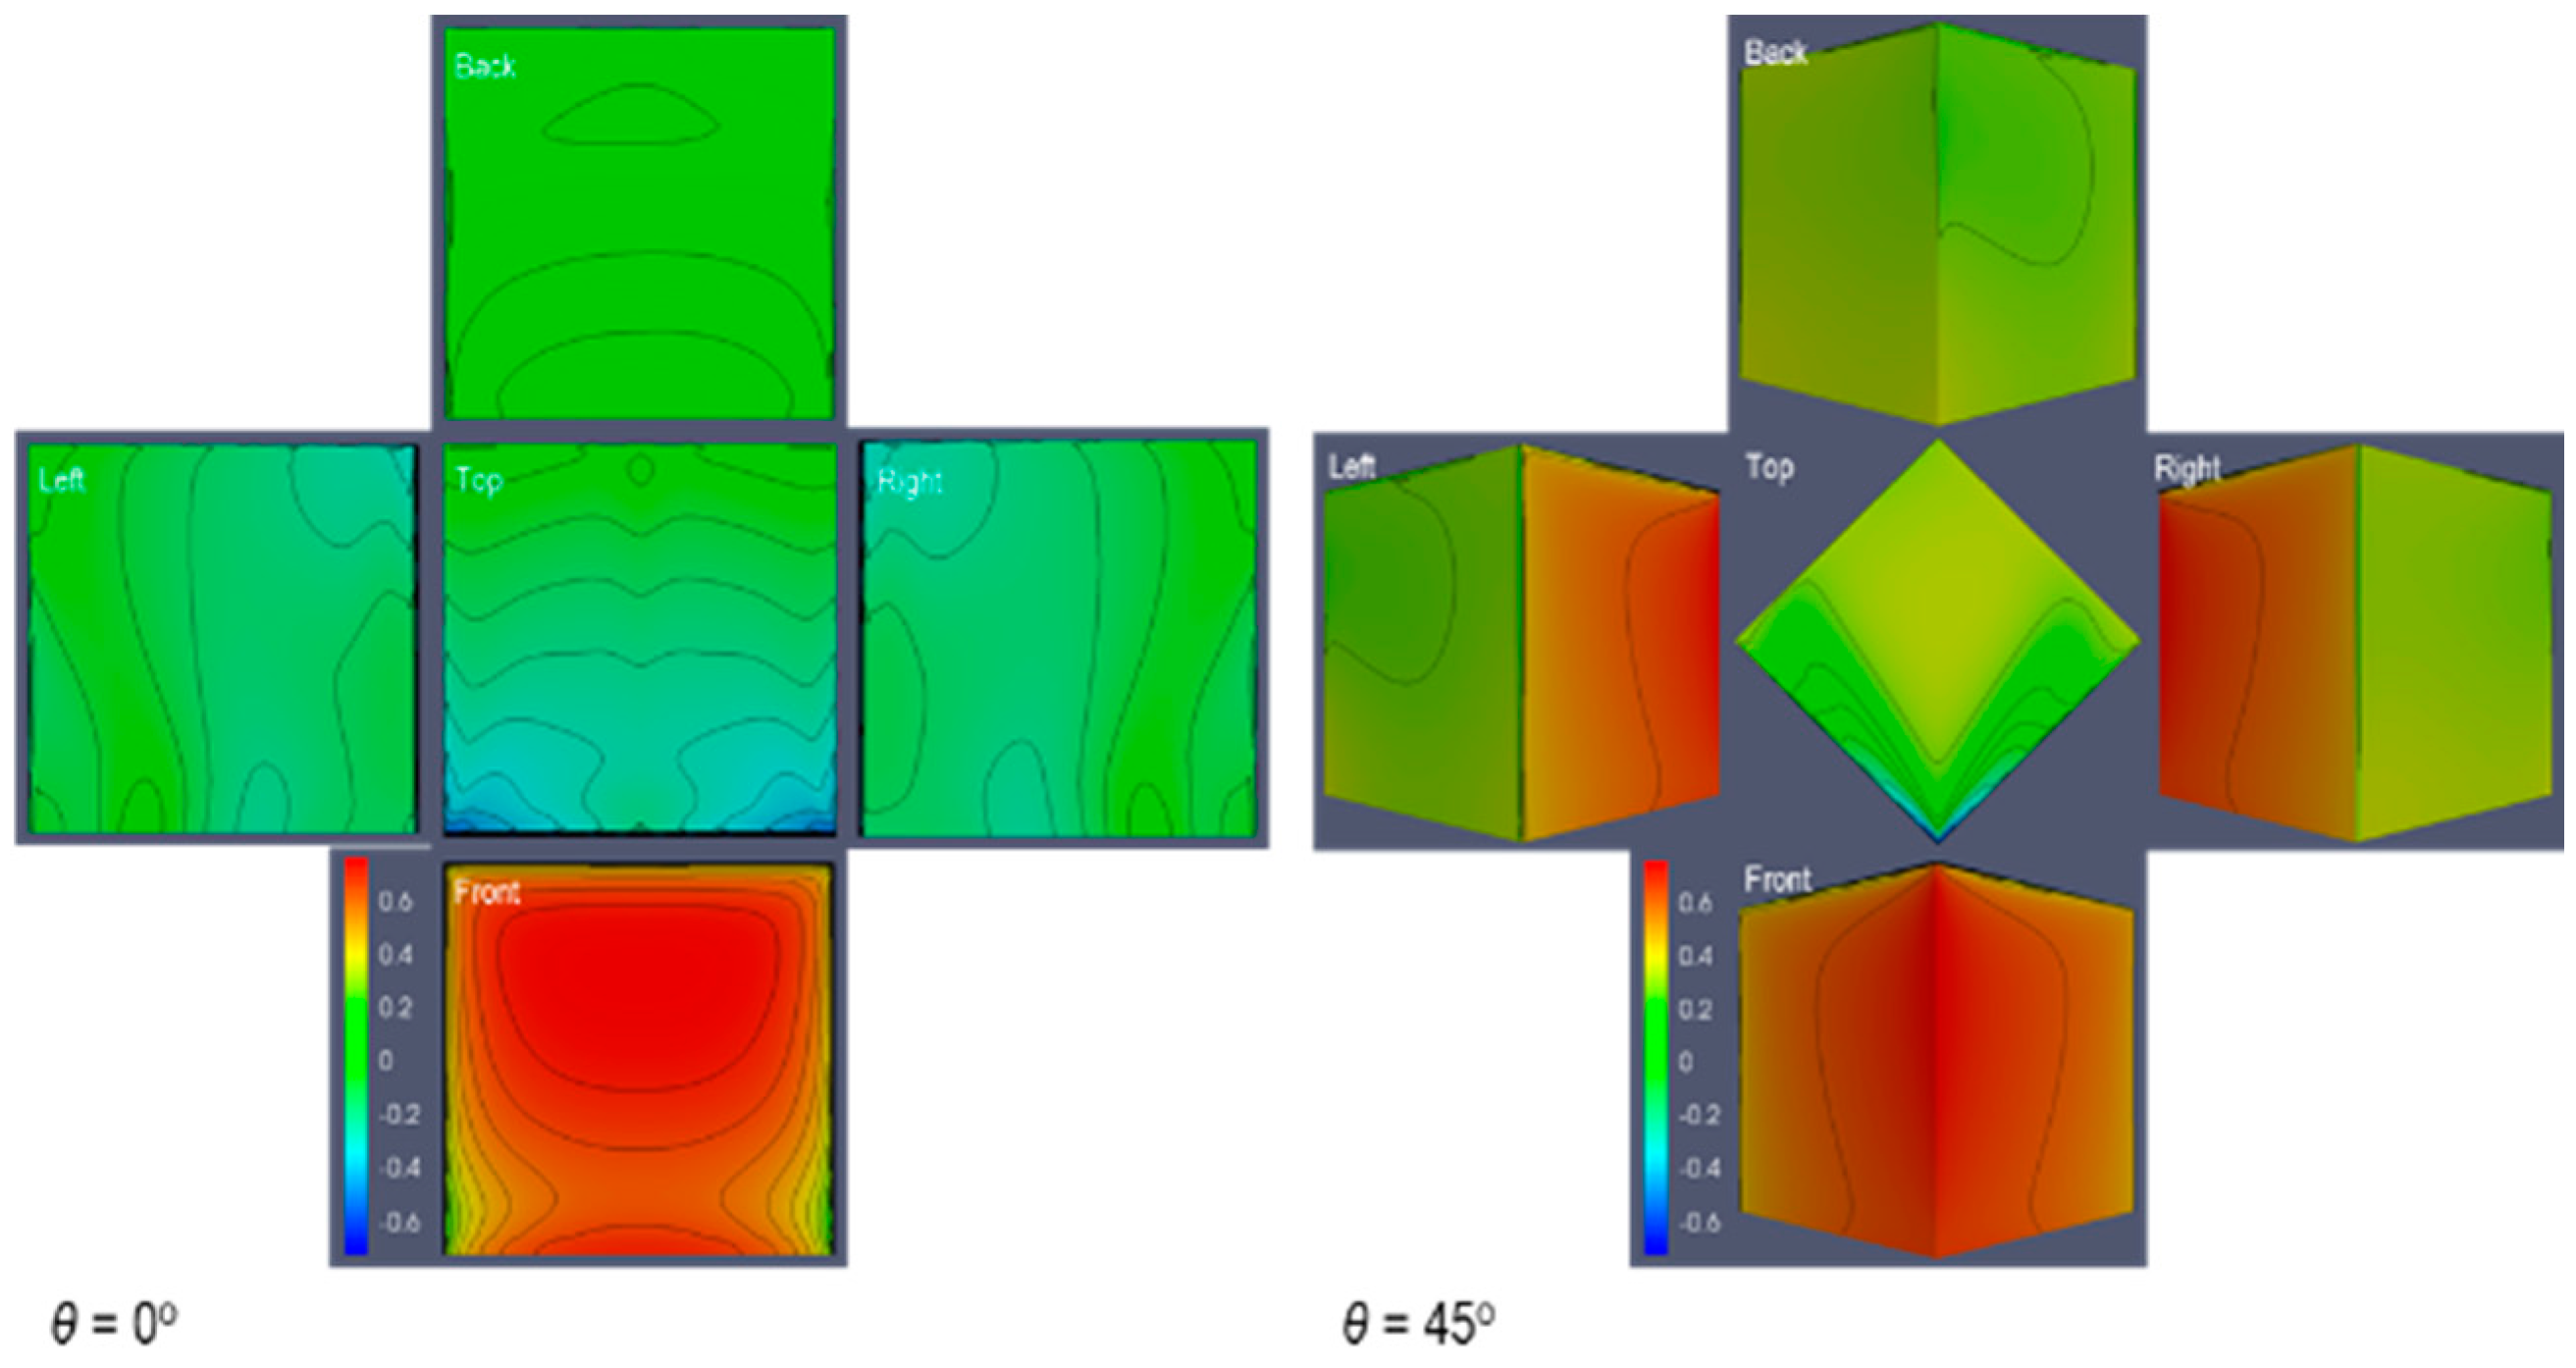
Figure 7 shows the surface pressure coefficient contour for the flat roof detached structure for 0° and 45° wind angles. It shows that for the 0° wind angle, the high pressure coefficient occurs in the upper portion of the windward area. The lowest pressure coefficient occurs at the leading edge of the roof section. The high pressure of the upper portion of the frontal surface is due to the stagnation of air as shown in Figure 6a. The lowest pressure coefficient happening at the leading edge is due to the flow separation. For the 45° angle of wind flow, the high pressure coefficient occurs on the frontal leading edge facing the flow. The lowest pressure coefficient occurs on the leading edge of the roof. The explanation is that it is due to the flow separation of the roof edge. Comparing the pressures between the two wind angles, the 0° wind angle created a high pressure coefficient in the windward area due to the air flow stagnation in the flat surface, as compared to the 45° wind angle at which the air flow easily passes to the side.
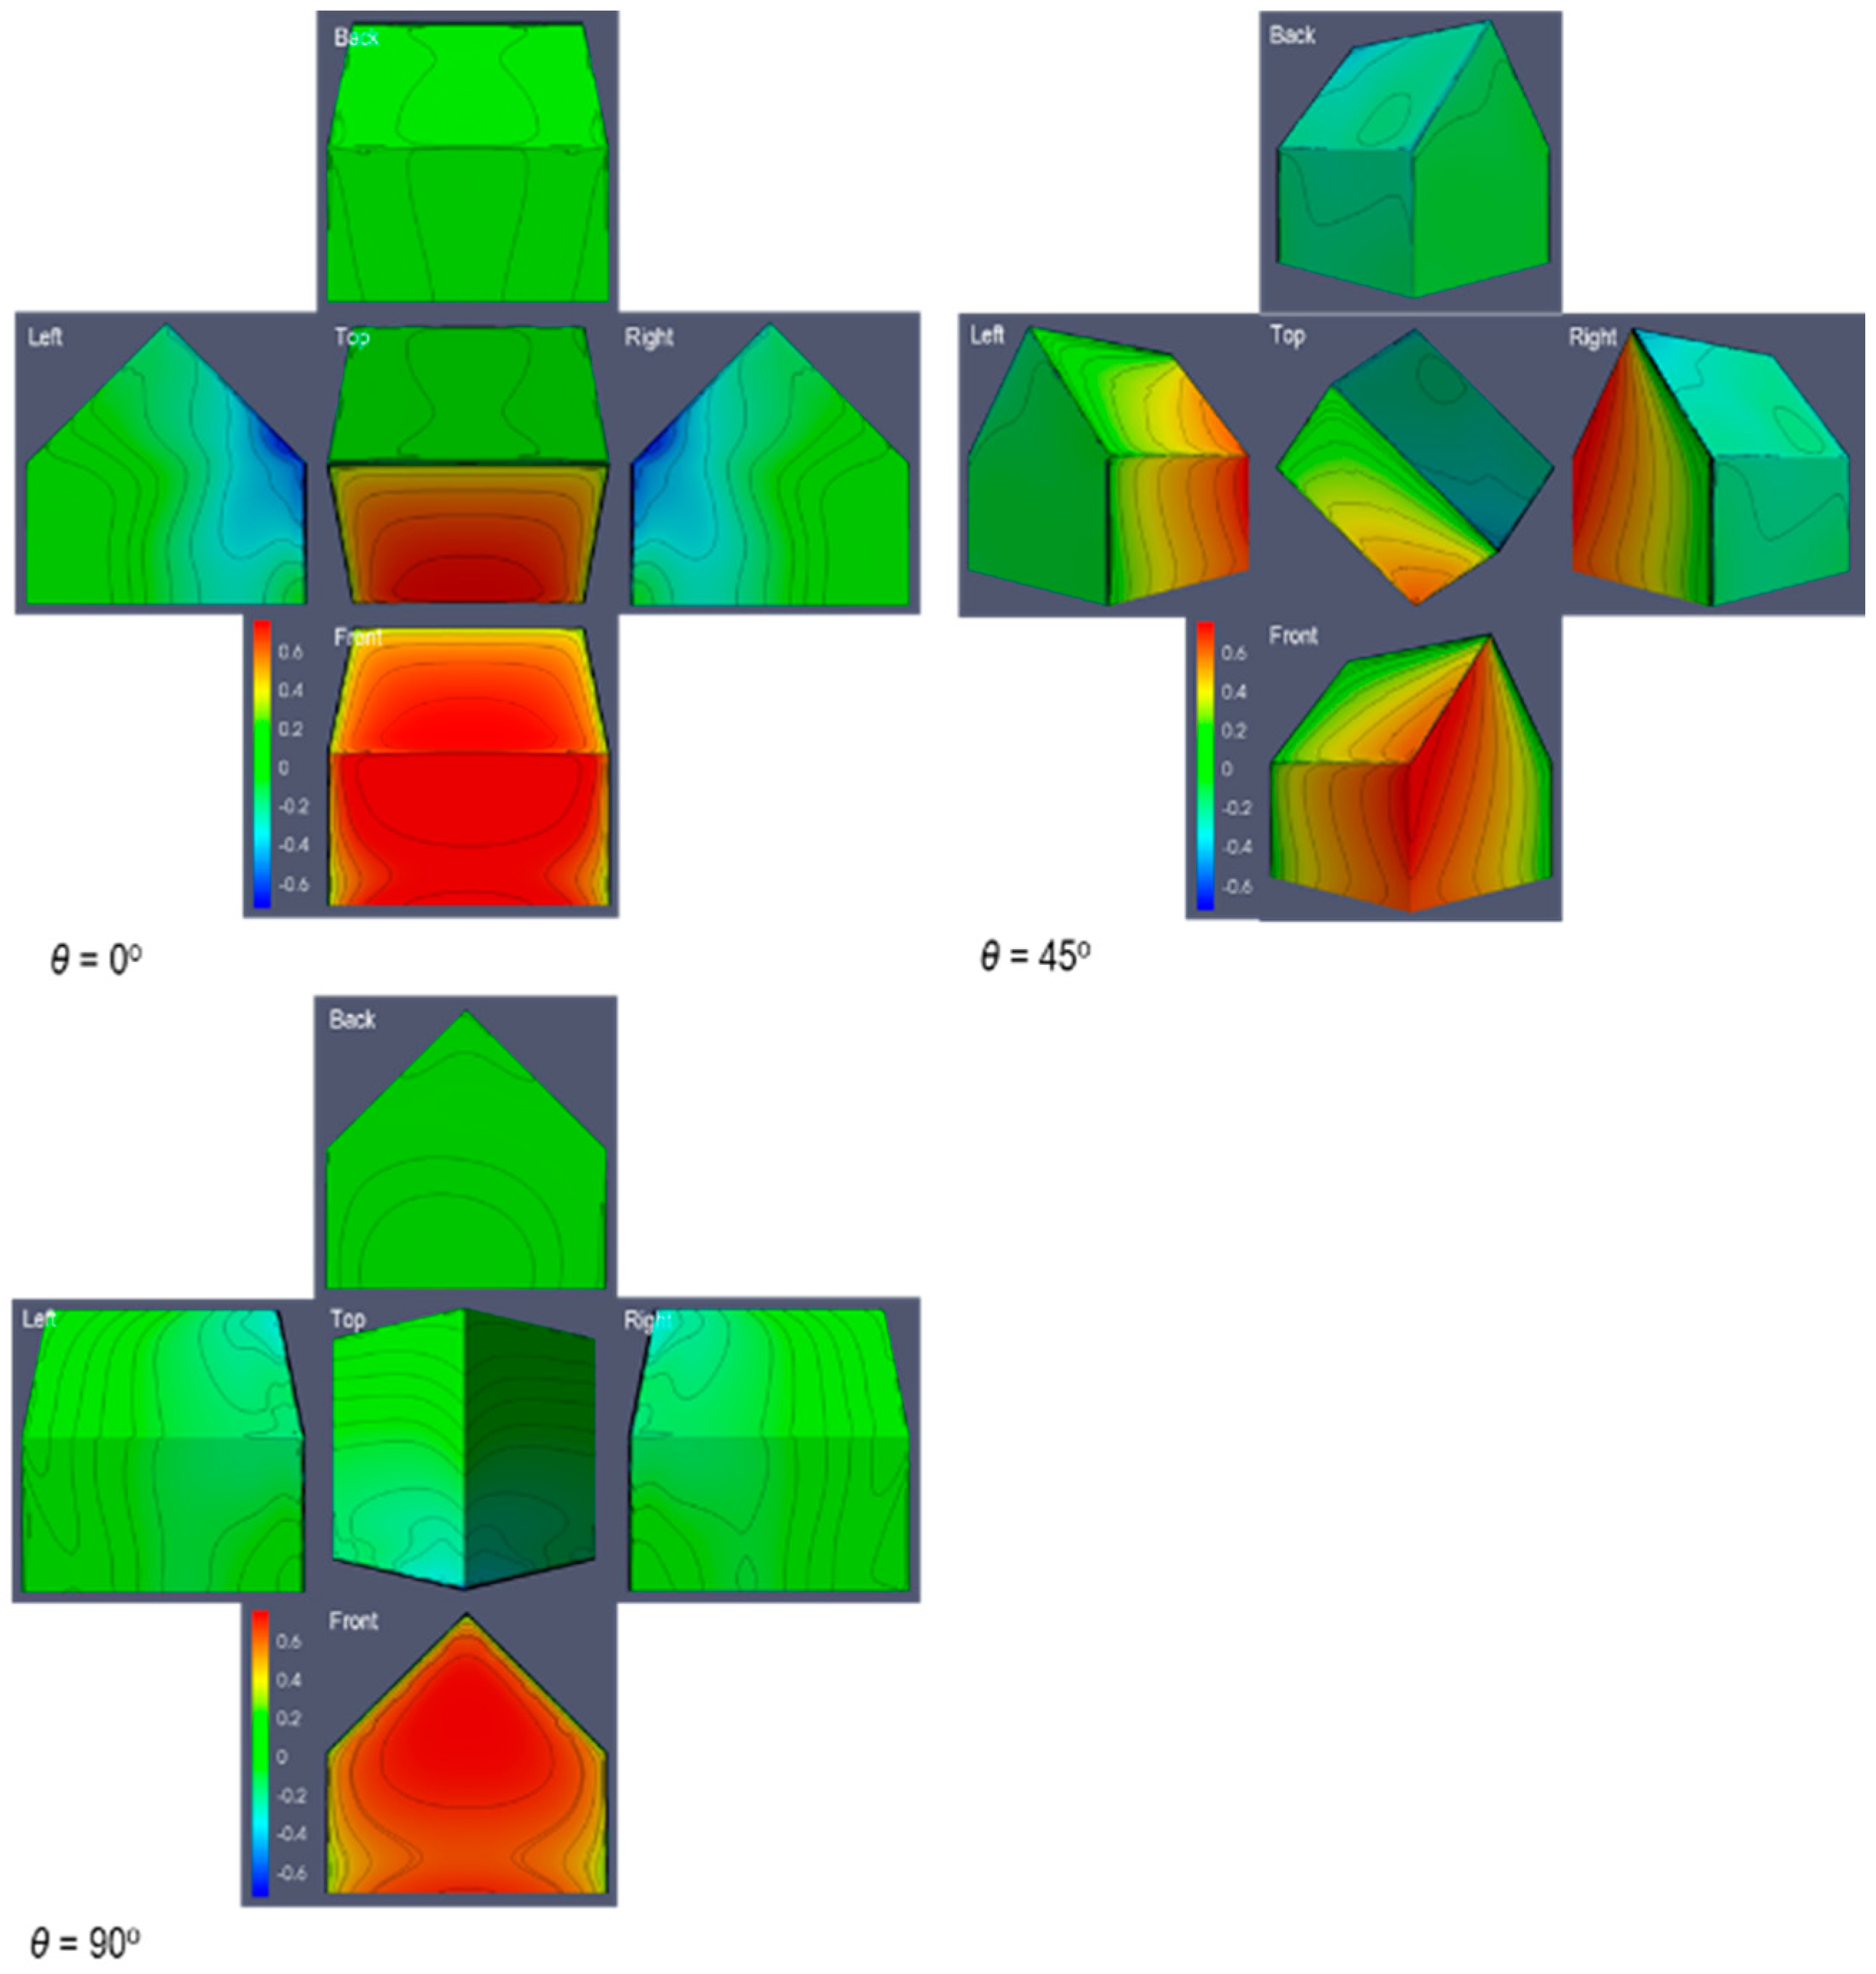
Figure 8 shows the surface pressure coefficient for the gabled roof of the detached structure. It shows the different pressure coefficients for different angles of wind direction. For the 0o angle of wind direction, it shows that the high pressure coefficient occurs in the upper frontal section and the lower front section of the roof. It shows that the lowest pressure coefficient occurs in the edge of the front section of the roof (rake). The high pressure coefficient that occurs in the frontal section is due to the air flow stagnation, and the cause of the lower pressure coefficient at the edge of the roof and the frontal section is the flow separation in this area. For the 45° angle of wind direction, the high pressure coefficient occurs in the surfaces connecting the point of intersection between the three surfaces (surrounding the eave-rake intersection). However, as presented, the gradient of the pressure coefficient is lower when compared to the 0° angle of wind direction due to the flow of wind going to the side and going up. The lowest pressure coefficient occurs at the roof peak point facing the wind direction due to the air flow separation (windward ridge-rake intersection). For the wind angle of 90°, the high pressure coefficient occurs in the upper portion of the frontal section, and the lowest pressure coefficient occurs on the leading edge of the roof. The high pressure coefficient that occurs in the frontal section is due to the air flow stagnation, and the cause of the lower pressure coefficient in the roof section edge is the air flow separation.
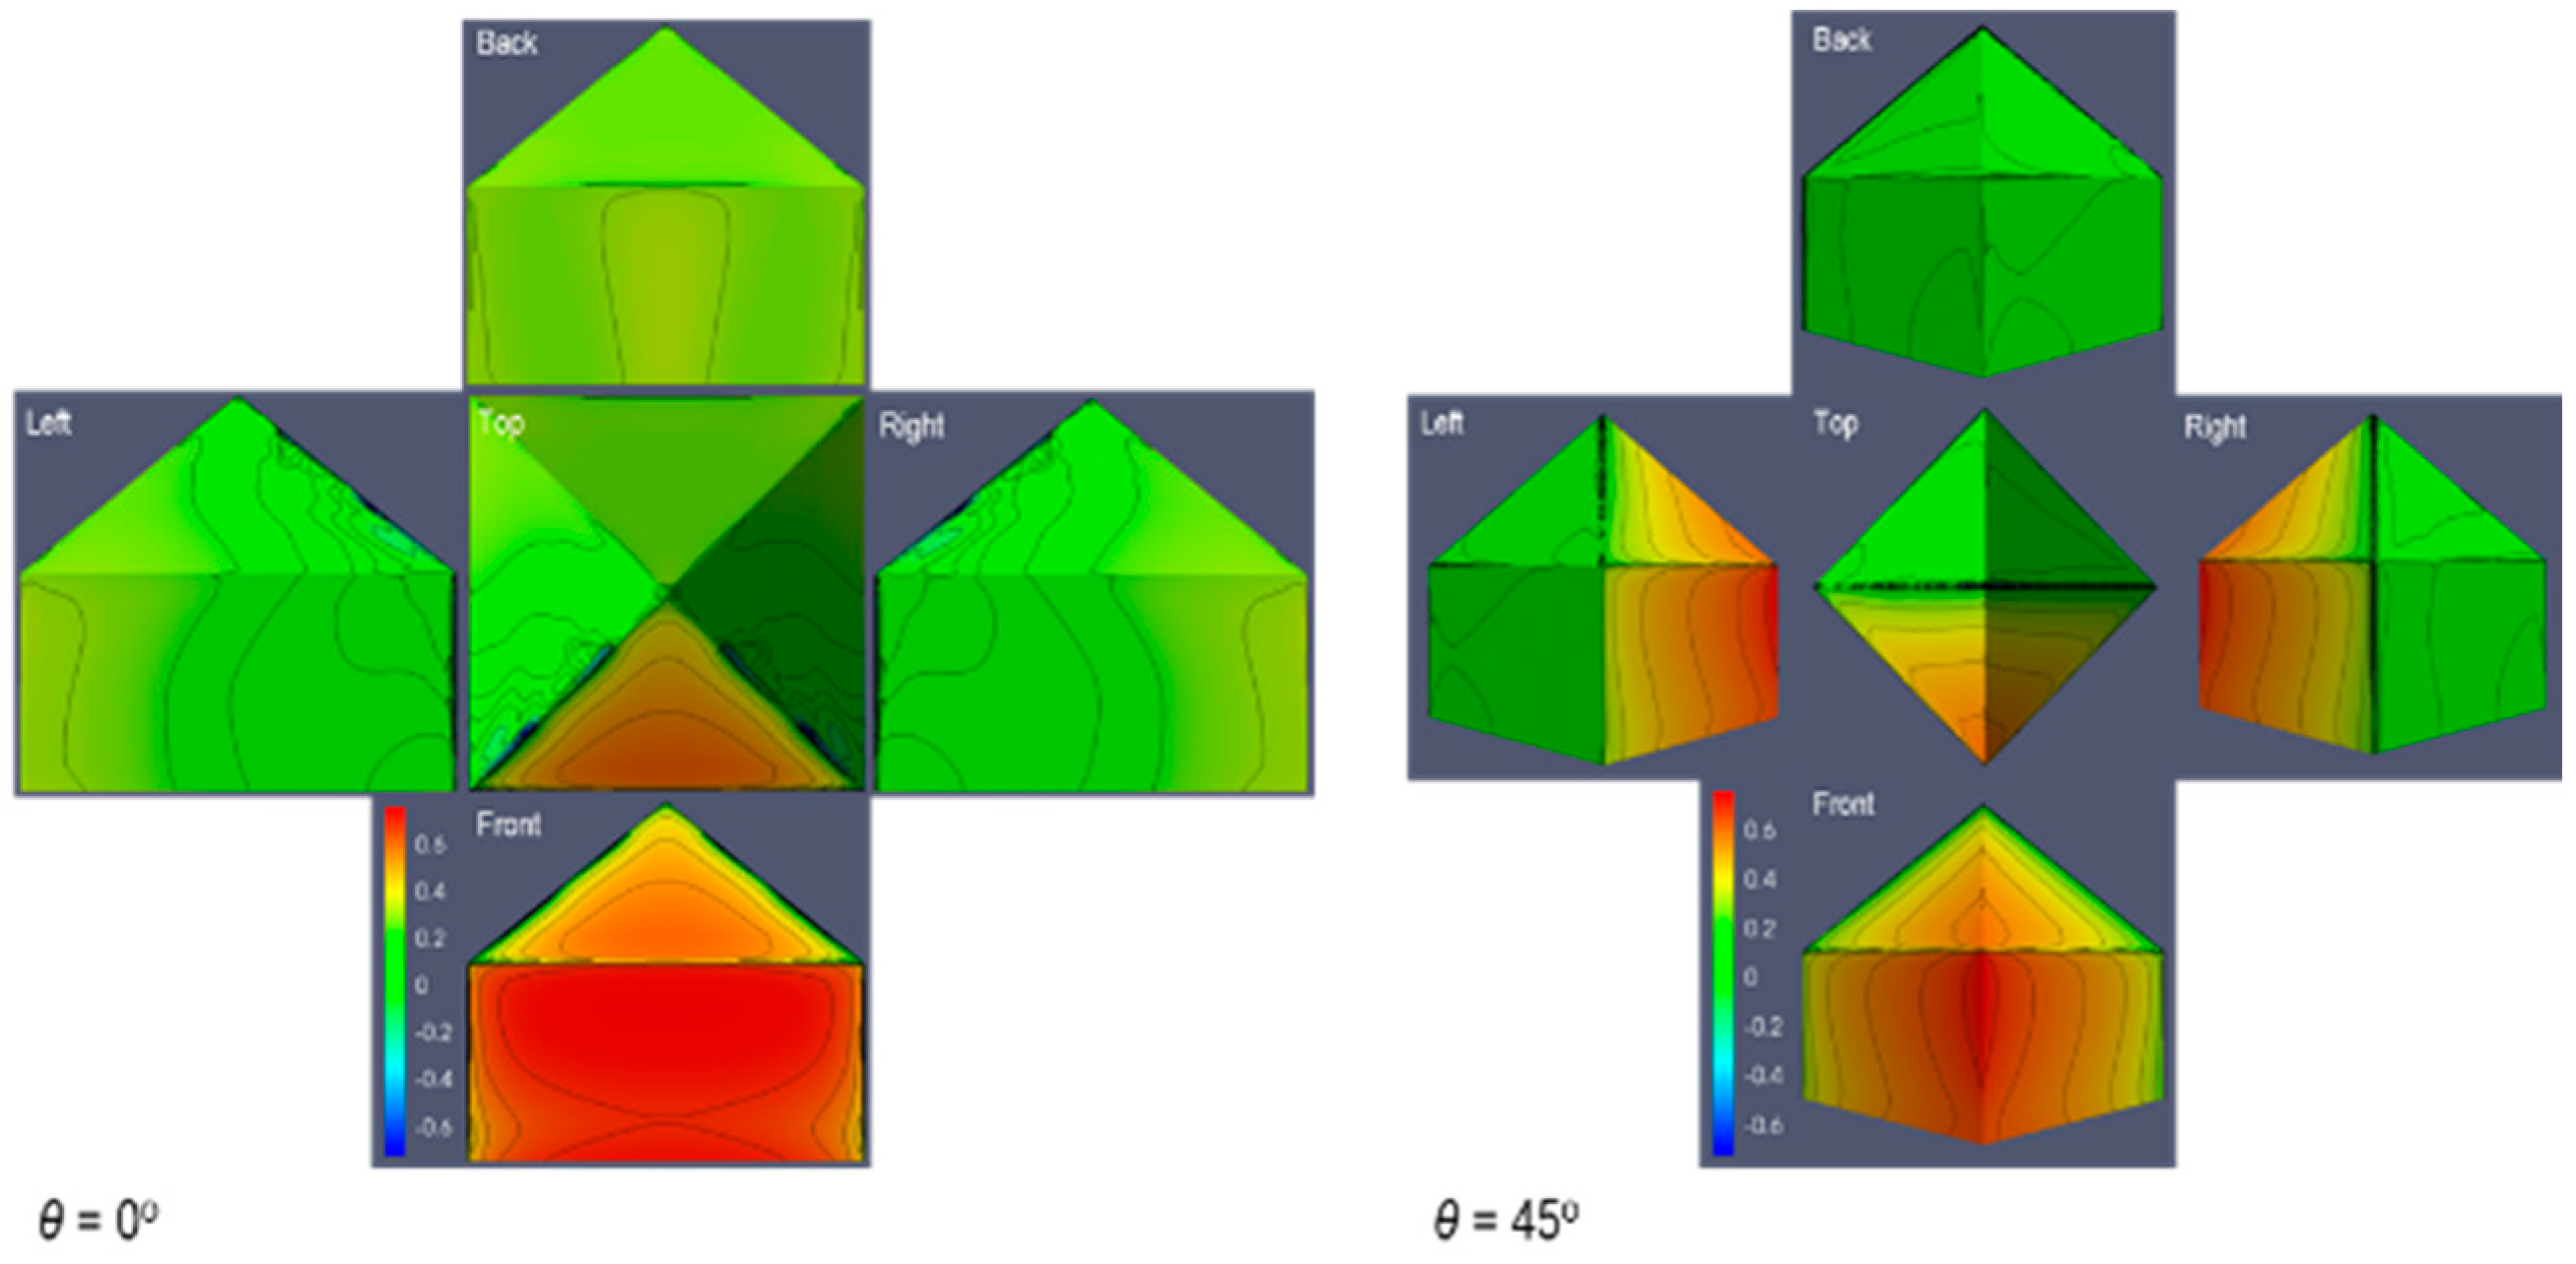
Figure 9 shows the surface pressure coefficient contour for the pyramidal roofed detached structure. It shows the pressure coefficient contour for the 0° and 45° wind angle directions. For the 0° angle of wind direction, the high pressure coefficient occurs at the frontal surface. The lowest pressure coefficient occurs on the leading edge of the roof between the frontal and side sections (rake). The high pressure coefficient in the frontal section is due to the air flow stagnation in this area, and the cause of the low pressure coefficient at the edge of the roof is the flow separation at the edge. For the 45° angle of wind direction, the high pressure coefficient occurs in the surfaces between the two frontal surfaces. The lowest pressure coefficient occurs on the edge of the roof facing the wind direction (rake). Comparing the pressure coefficient of the 0° angle and the 45° angle of wind directions, the pressure coefficient for the 45° angle of wind direction is lower as the flow passes sideward compared to the 0° angle at which there is a flow stagnation area.
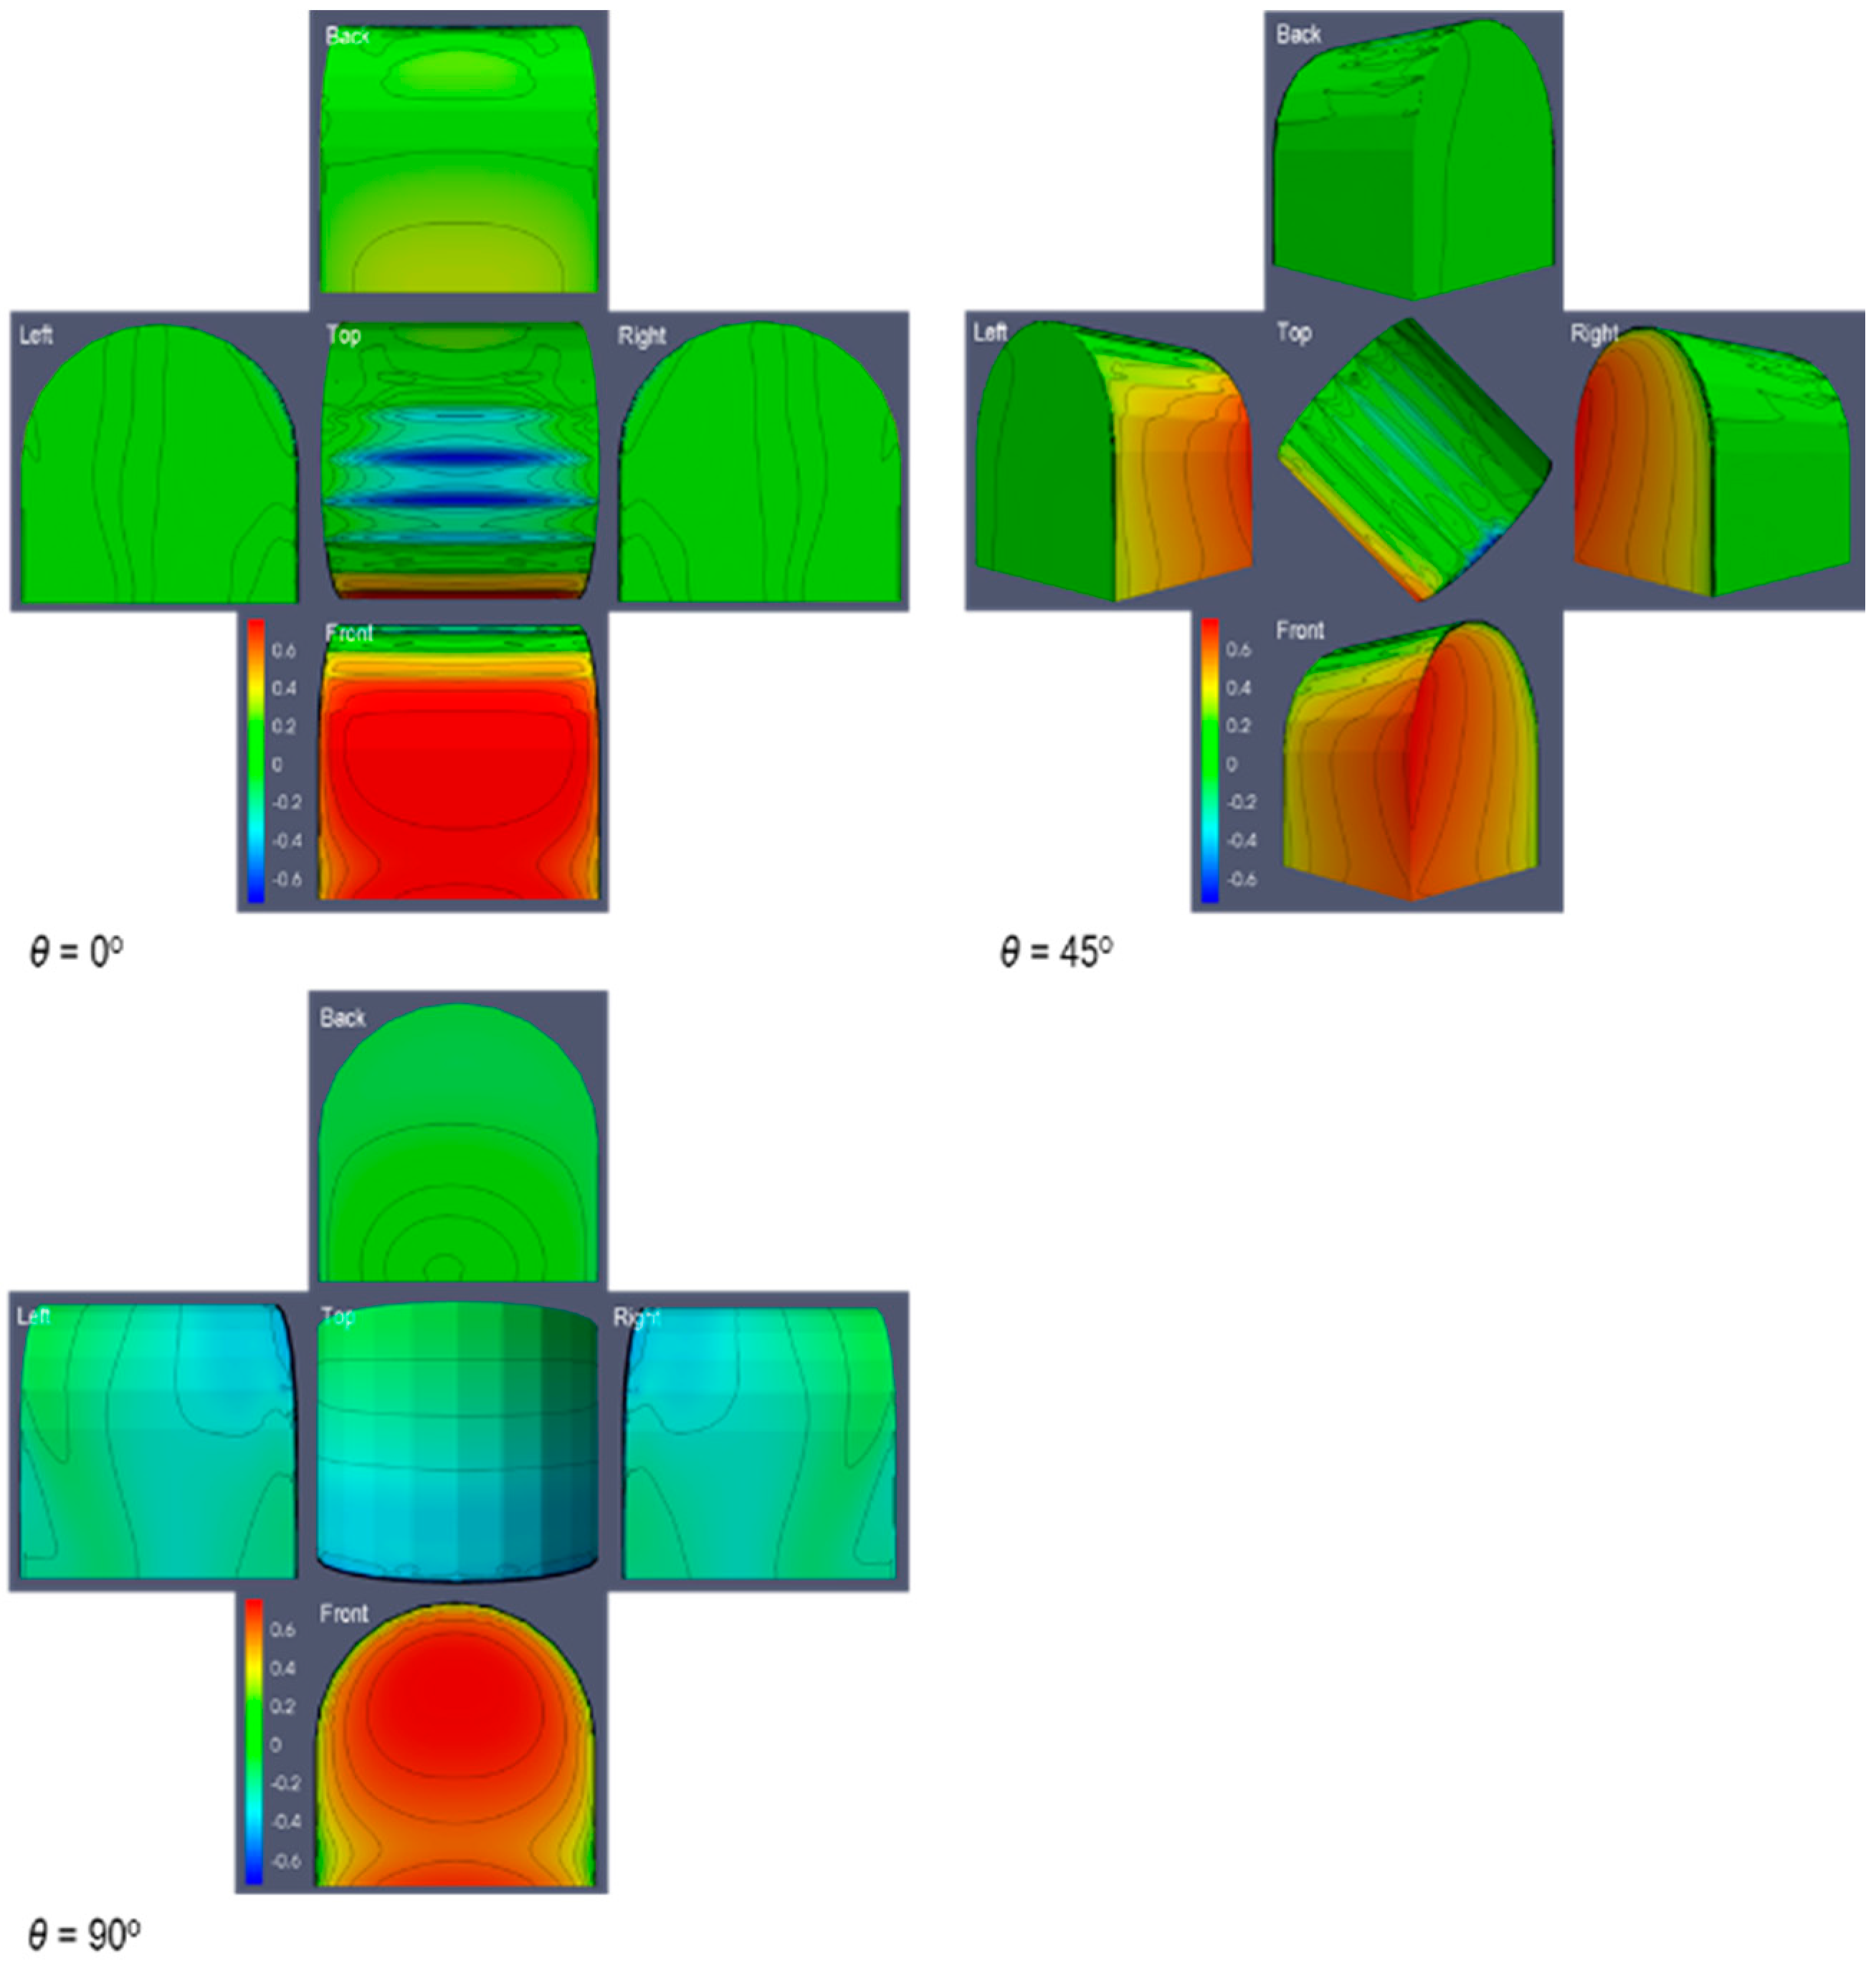
Figure 10 shows the contour of the pressure coefficient for the detached structure with a vaulted roof. The figure shows the results of the wind direction with angles of 0°, 45°, and 90°. For the 0° angle of wind direction, it shows that a higher pressure coefficient occurs in the frontal surface upper portion up to the lower section of the frontal facing roof. The lowest pressure coefficient occurs in the upper portion of the roof. The occurrence of the higher pressure coefficient in the frontal section is due to the flow stagnation in this area. The occurrence of the lowest pressure coefficient in the upper portion of the roof is due to the air flow separation in the section as shown in Figure 6d. For the 45° angle of wind direction, the highest pressure coefficient occurs in the upper portion of the surfaces of the flat right side surface, the left side surface, or the sides of the leading rake. As shown, the high pressure occurs on the right side surface as it is flat compared to the left surface, which is already part of the roof curvature, resulting in the smooth flow of air streamlines. The lowest pressure coefficient occurs in the topmost section of the roof’s leading edge, resulting from the air flow separation in this area. For the 90° angle of wind direction, the high pressure coefficient occurs on the upper portion of the frontal surface while the lowest pressure coefficient occurs on the edge between the frontal surface and the roof or in the upper section of the leading edge. The high pressure coefficient that occurs on the frontal surface is due to the air flow stagnation in this area while the cause of the lower pressure coefficient in the leading edge is the air flow separation in this area.
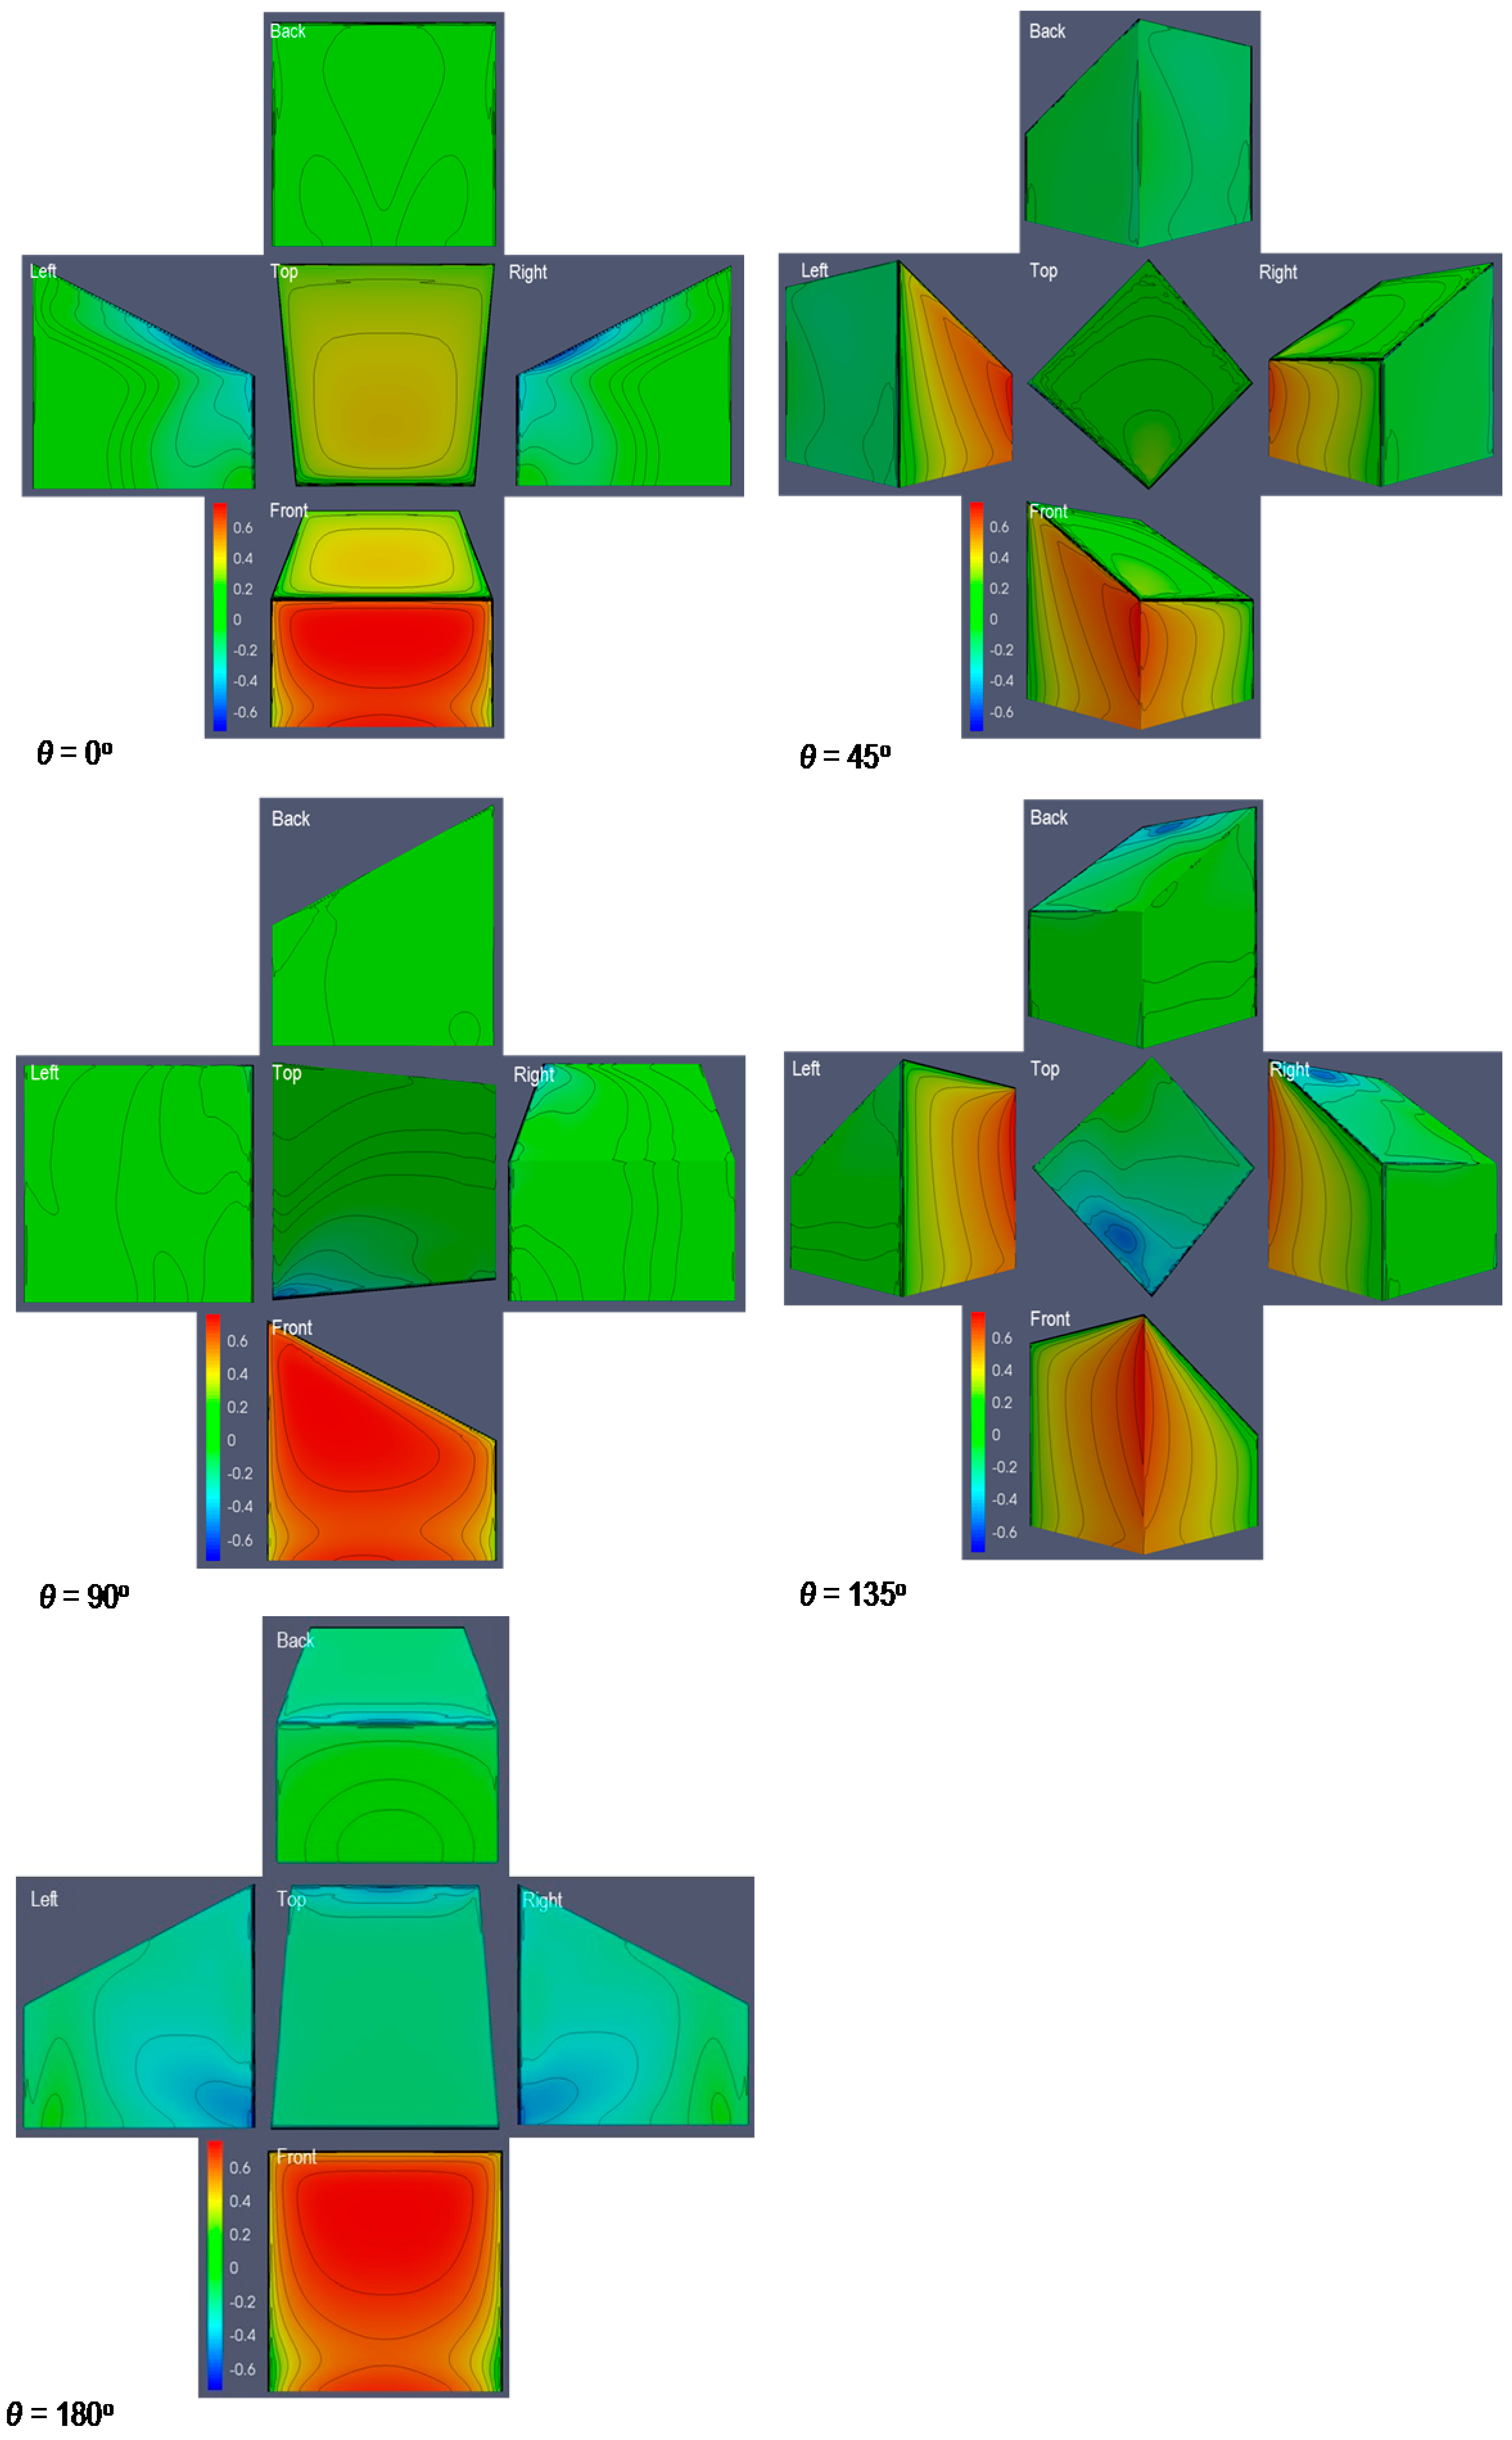
Figure 11 shows the contour of the pressure coefficient for the detached structure with a wedged roof. The figure shows the five angles of wind direction—0°, 45°, 90°, 135° and 180°. Unlike the other detached structures, the wedged roof has five angles of wind direction with five different results. For the 0° angle of wind direction, the highest pressure coefficient occurs on the upper frontal portion and the lowest occurs on the edges of the roof facing forward. The higher pressure coefficient on the frontal surface is due to the air flow stagnation, while for the edges it is due to the air flow separation in this area. For the 45° angle of wind direction, the highest pressure coefficient occurs on the two frontal surfaces while the lowest pressure coefficient occurs in the back surfaces. As presented, the gradient of the pressure coefficient is lower due to the more defined air flow going sideward and to the inclining roof. For the case of the 90° angle of wind direction, the highest pressure coefficient occurs on the upper portion of the frontal surface as the air flow stagnation occurs in this portion. The lowest pressure coefficient occurs on the edge of the frontal section of the roof as the air flow separation occurs in this location. For the case of the 135° angle of wind direction, the area of higher pressure coefficient occurs on the two surfaces of the front area. The gradient of the pressure coefficient in the areas is lower. The area with the lowest pressure coefficient is on the upper portion of the roof. In this area, the flow separation which occurs causes the lowering of the surface pressure coefficient. For the case of the 180° angle of wind direction, the highest pressure coefficient occurs in the upper portion of the frontal surface. The lowest pressure coefficient occurs in the lowest portion of the side surfaces near the ground. It also shows that the low pressure coefficient occurs in the lower portion of the roof. The cause of the high pressure coefficient in the upper portion of the frontal surface is the air flow stagnation in this area. The cause of the low pressure coefficient in the lower portion of the two sides is the high air flow velocity occurring in this area as the air flow stagnation occurs in the upper portion while the frontal ground surface causes the air flow to go upward, facing the air flow that is going downward in the lower portion of the stagnation surface. Hence, in this area, as shown in the lower portion of the frontal surface, the low pressure coefficient occurs until reaching the leading edge, which further lowers the pressure coefficient in those surfaces due to the air flow separation.
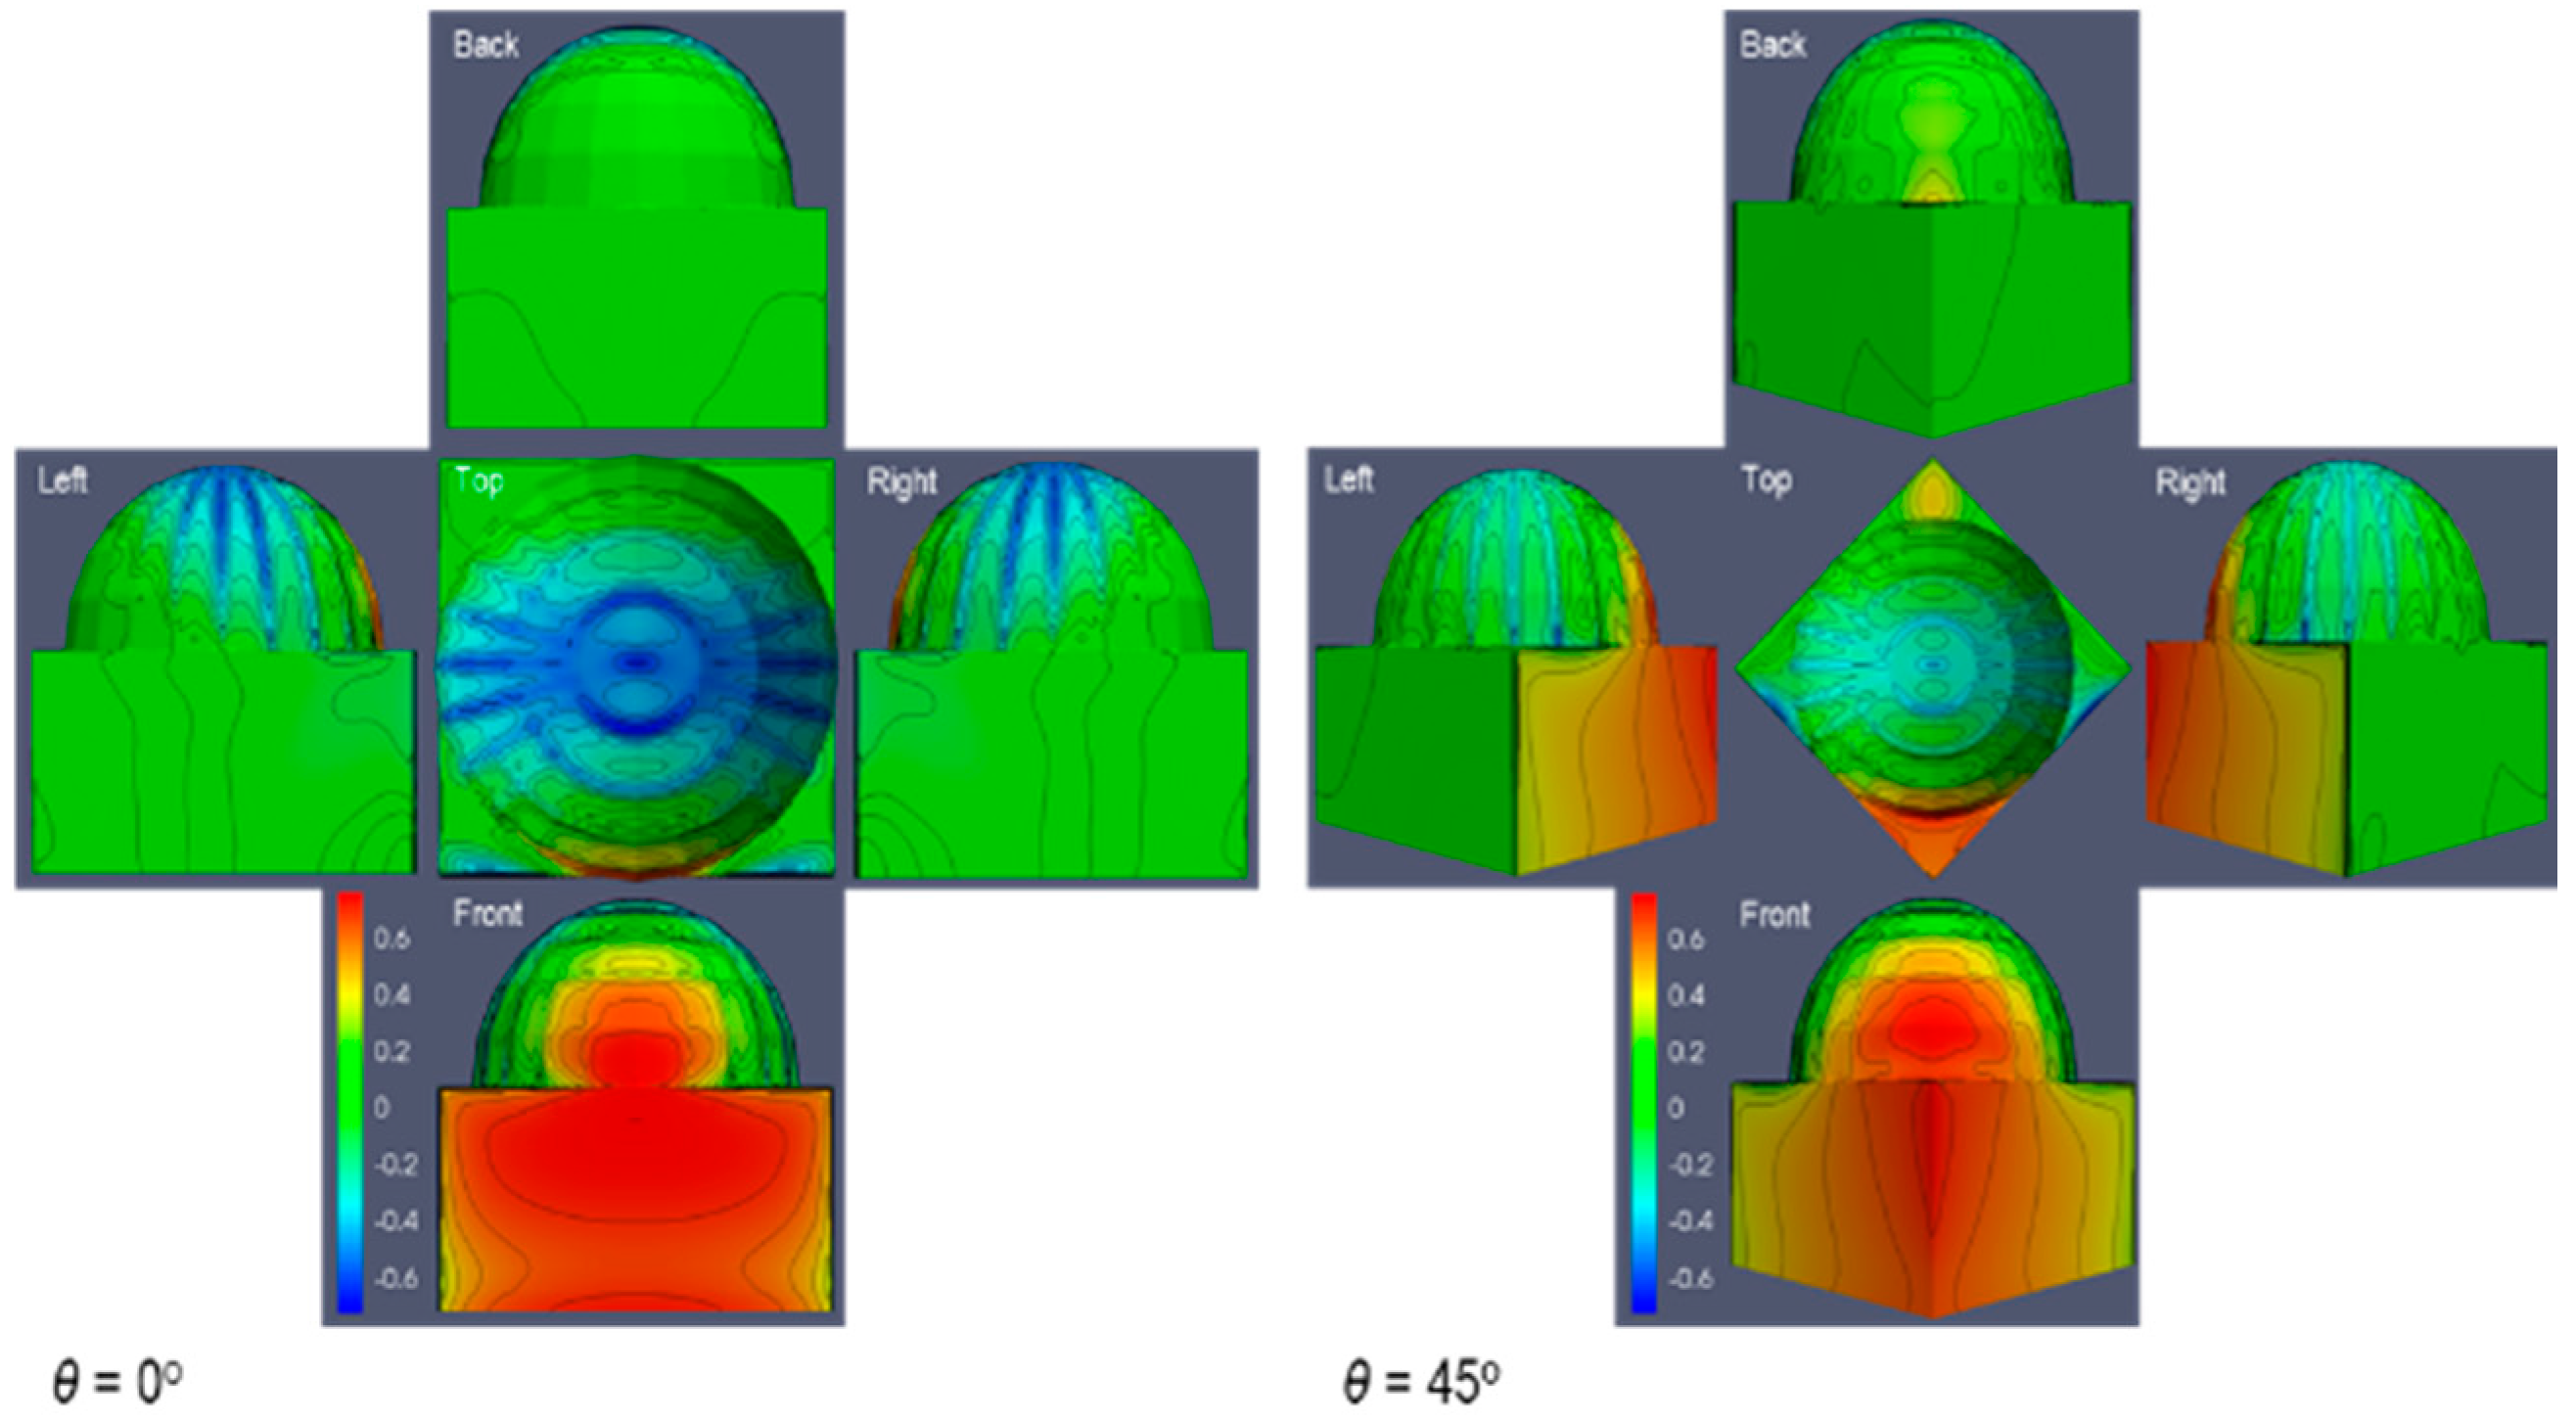
Figure 12 shows the contour of the pressure coefficient for the detached structure with the domed roof. It shows the two angles of wind direction—0° and 45°. For the 0° angle of wind direction, it shows that the high pressure coefficient occurs in the upper portion of the frontal surface. The lowest pressure coefficient occurs at the edge of the roof between the windward and the leeward. The cause of the higher pressure coefficient in the frontal surface is the air flow stagnation area in this portion while the cause of the low pressure coefficient on the roof is the increase of air flow velocity on this surface. In the case of the 45° angle of wind direction, the cause of the high pressure coefficient occurs on the frontal surface of the domed roof and on the surfaces between the frontal edges. The lower pressure coefficient occurs at the side edges of the roof. The cause of the higher pressure coefficient is the air flow stagnation in the small surface area while of the cause of the lower pressure coefficient at the edges of the roof is the increase of air flow as it increases.

3.3. Gabled and Pyramidal Roofs Evaluation

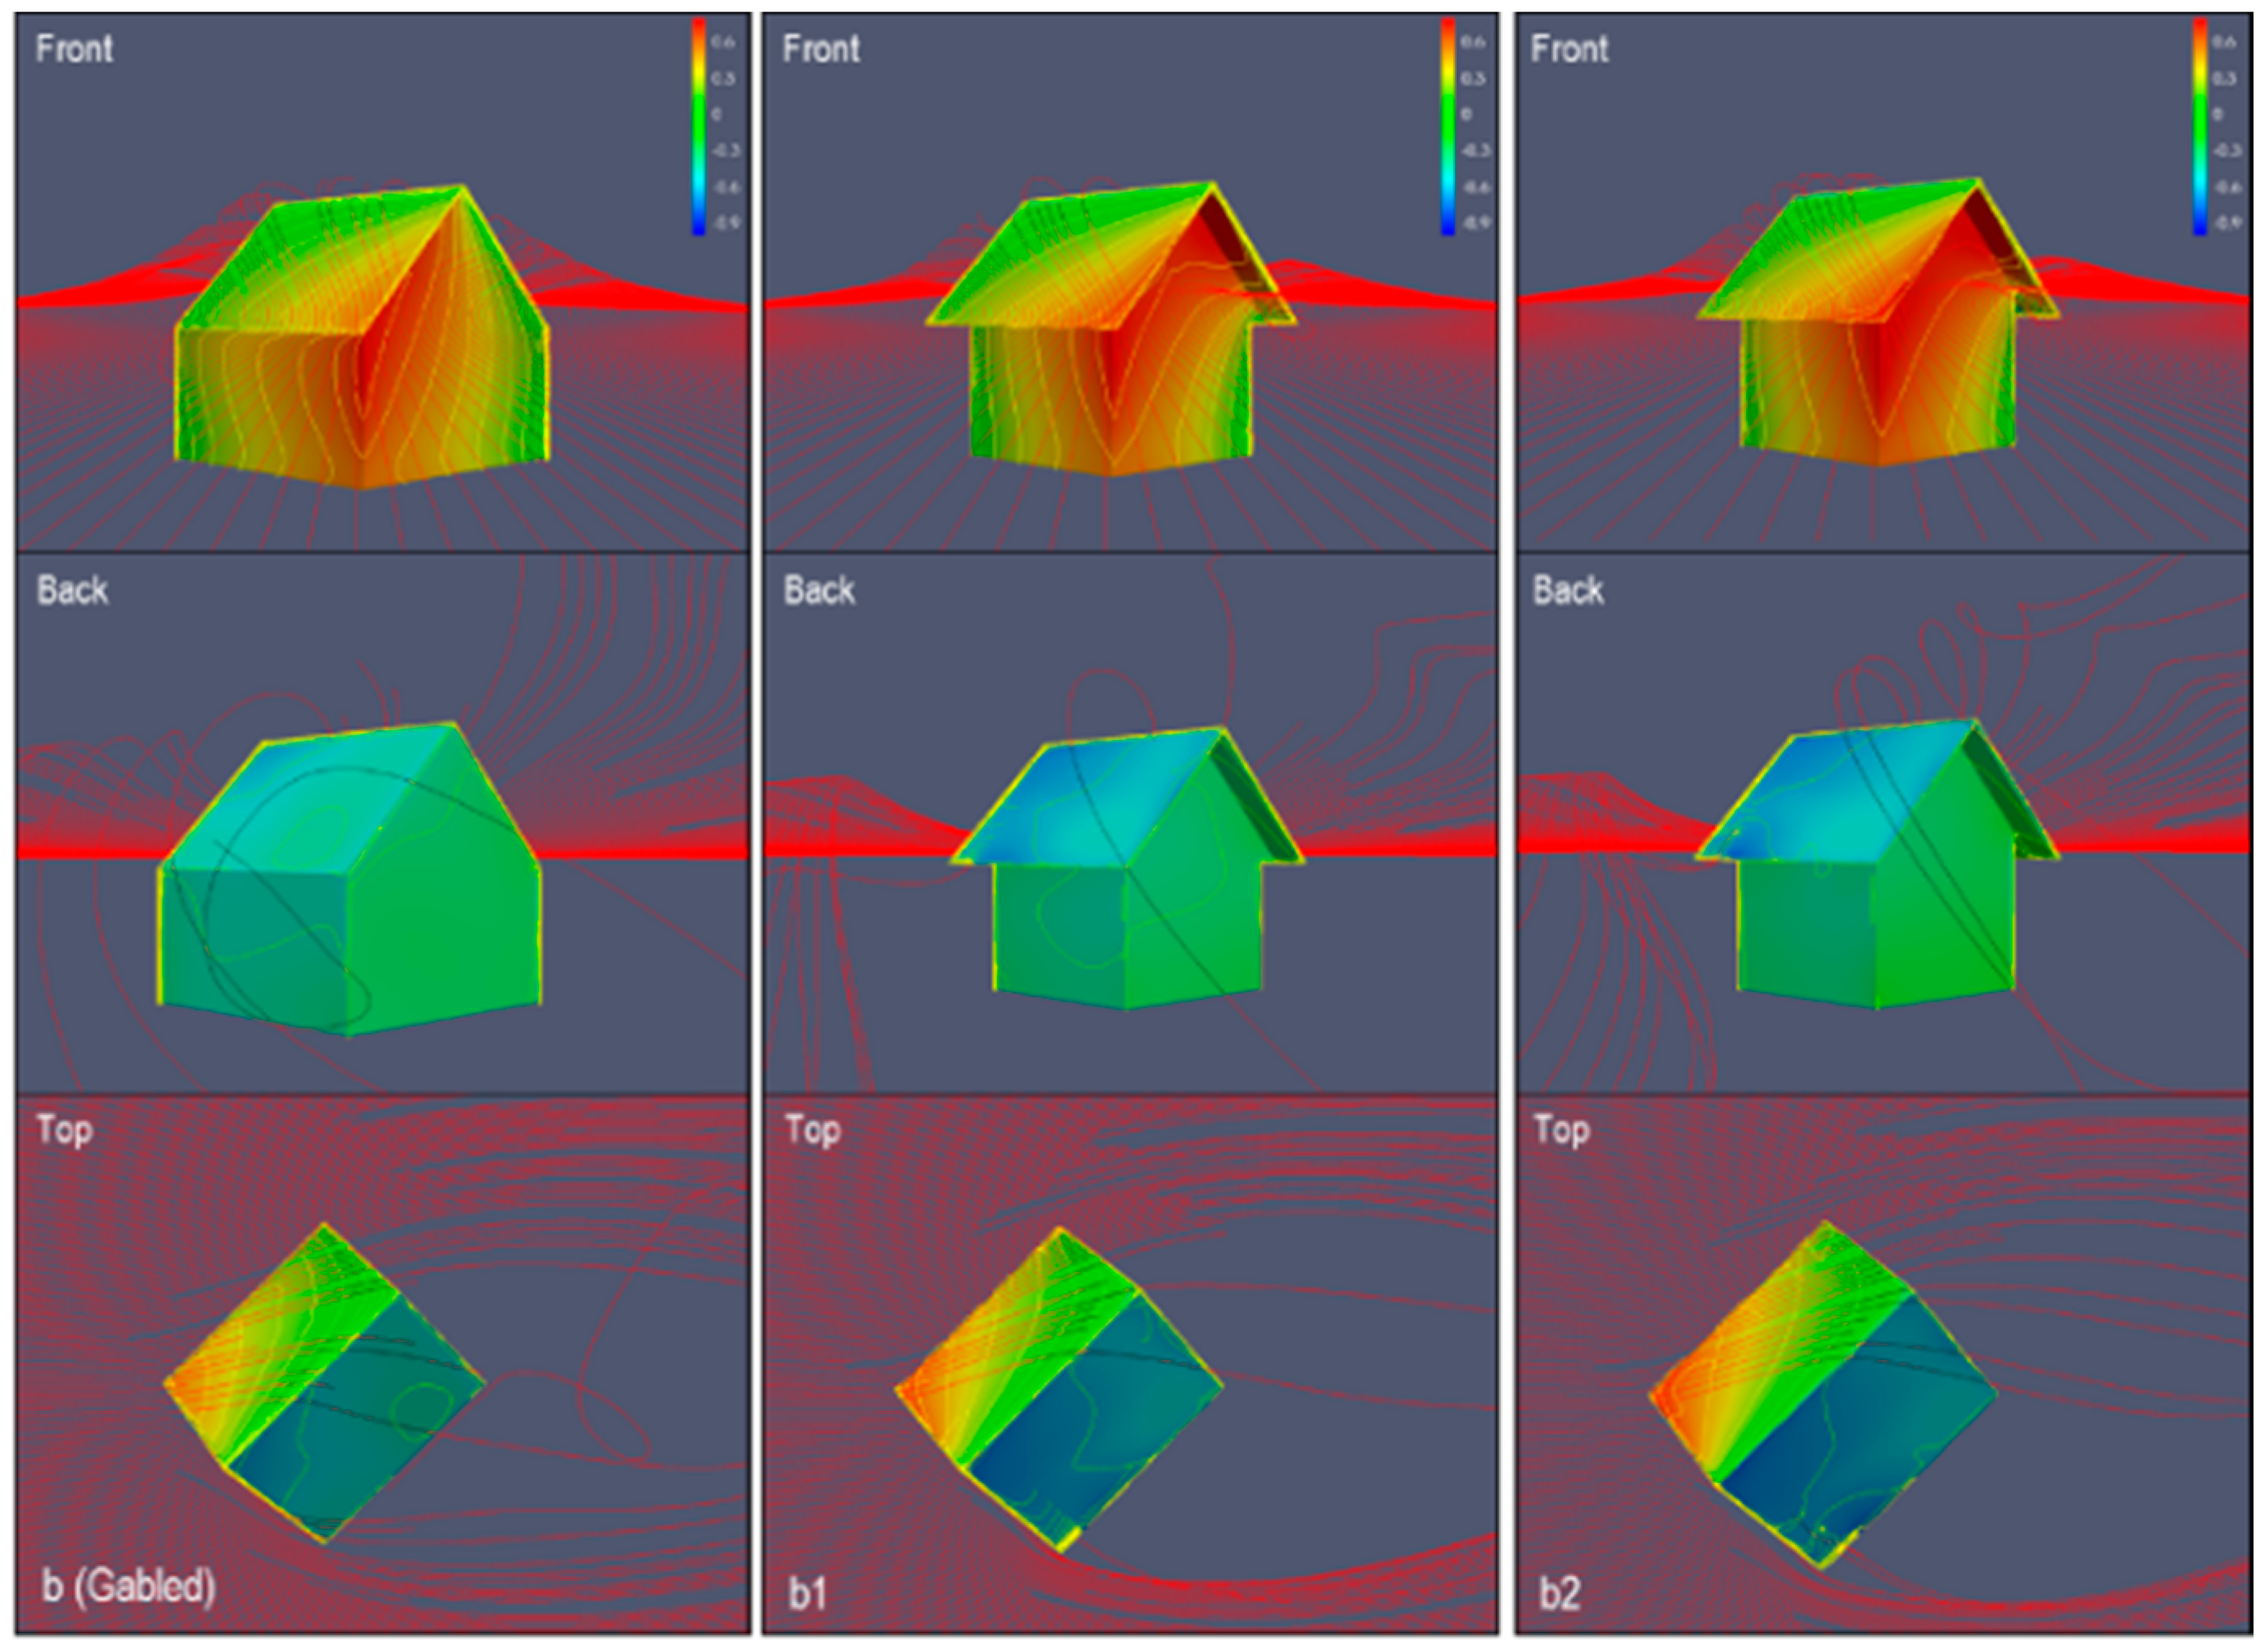
Figure 13 shows the results of the pressure coefficient distribution in the surface of the gable roofed detached house and the velocity streamlines around the detached house. It shows that the gable roofed house with no eaves overhang has a smoother pressure coefficient distribution compared to the gable roofed house with eaves overhang. The pressure coefficient is higher in the area between the eaves overhang and the wall. The eaves overhang causes a much lower pressure coefficient at the back side of the roof (leeward). The velocity streamlines for the detached house with gabled roof and no eaves overhang is smoother than with eaves overhang. This means that the eaves overhang affected the flow field as compared to the gabled roofing without eaves overhang.
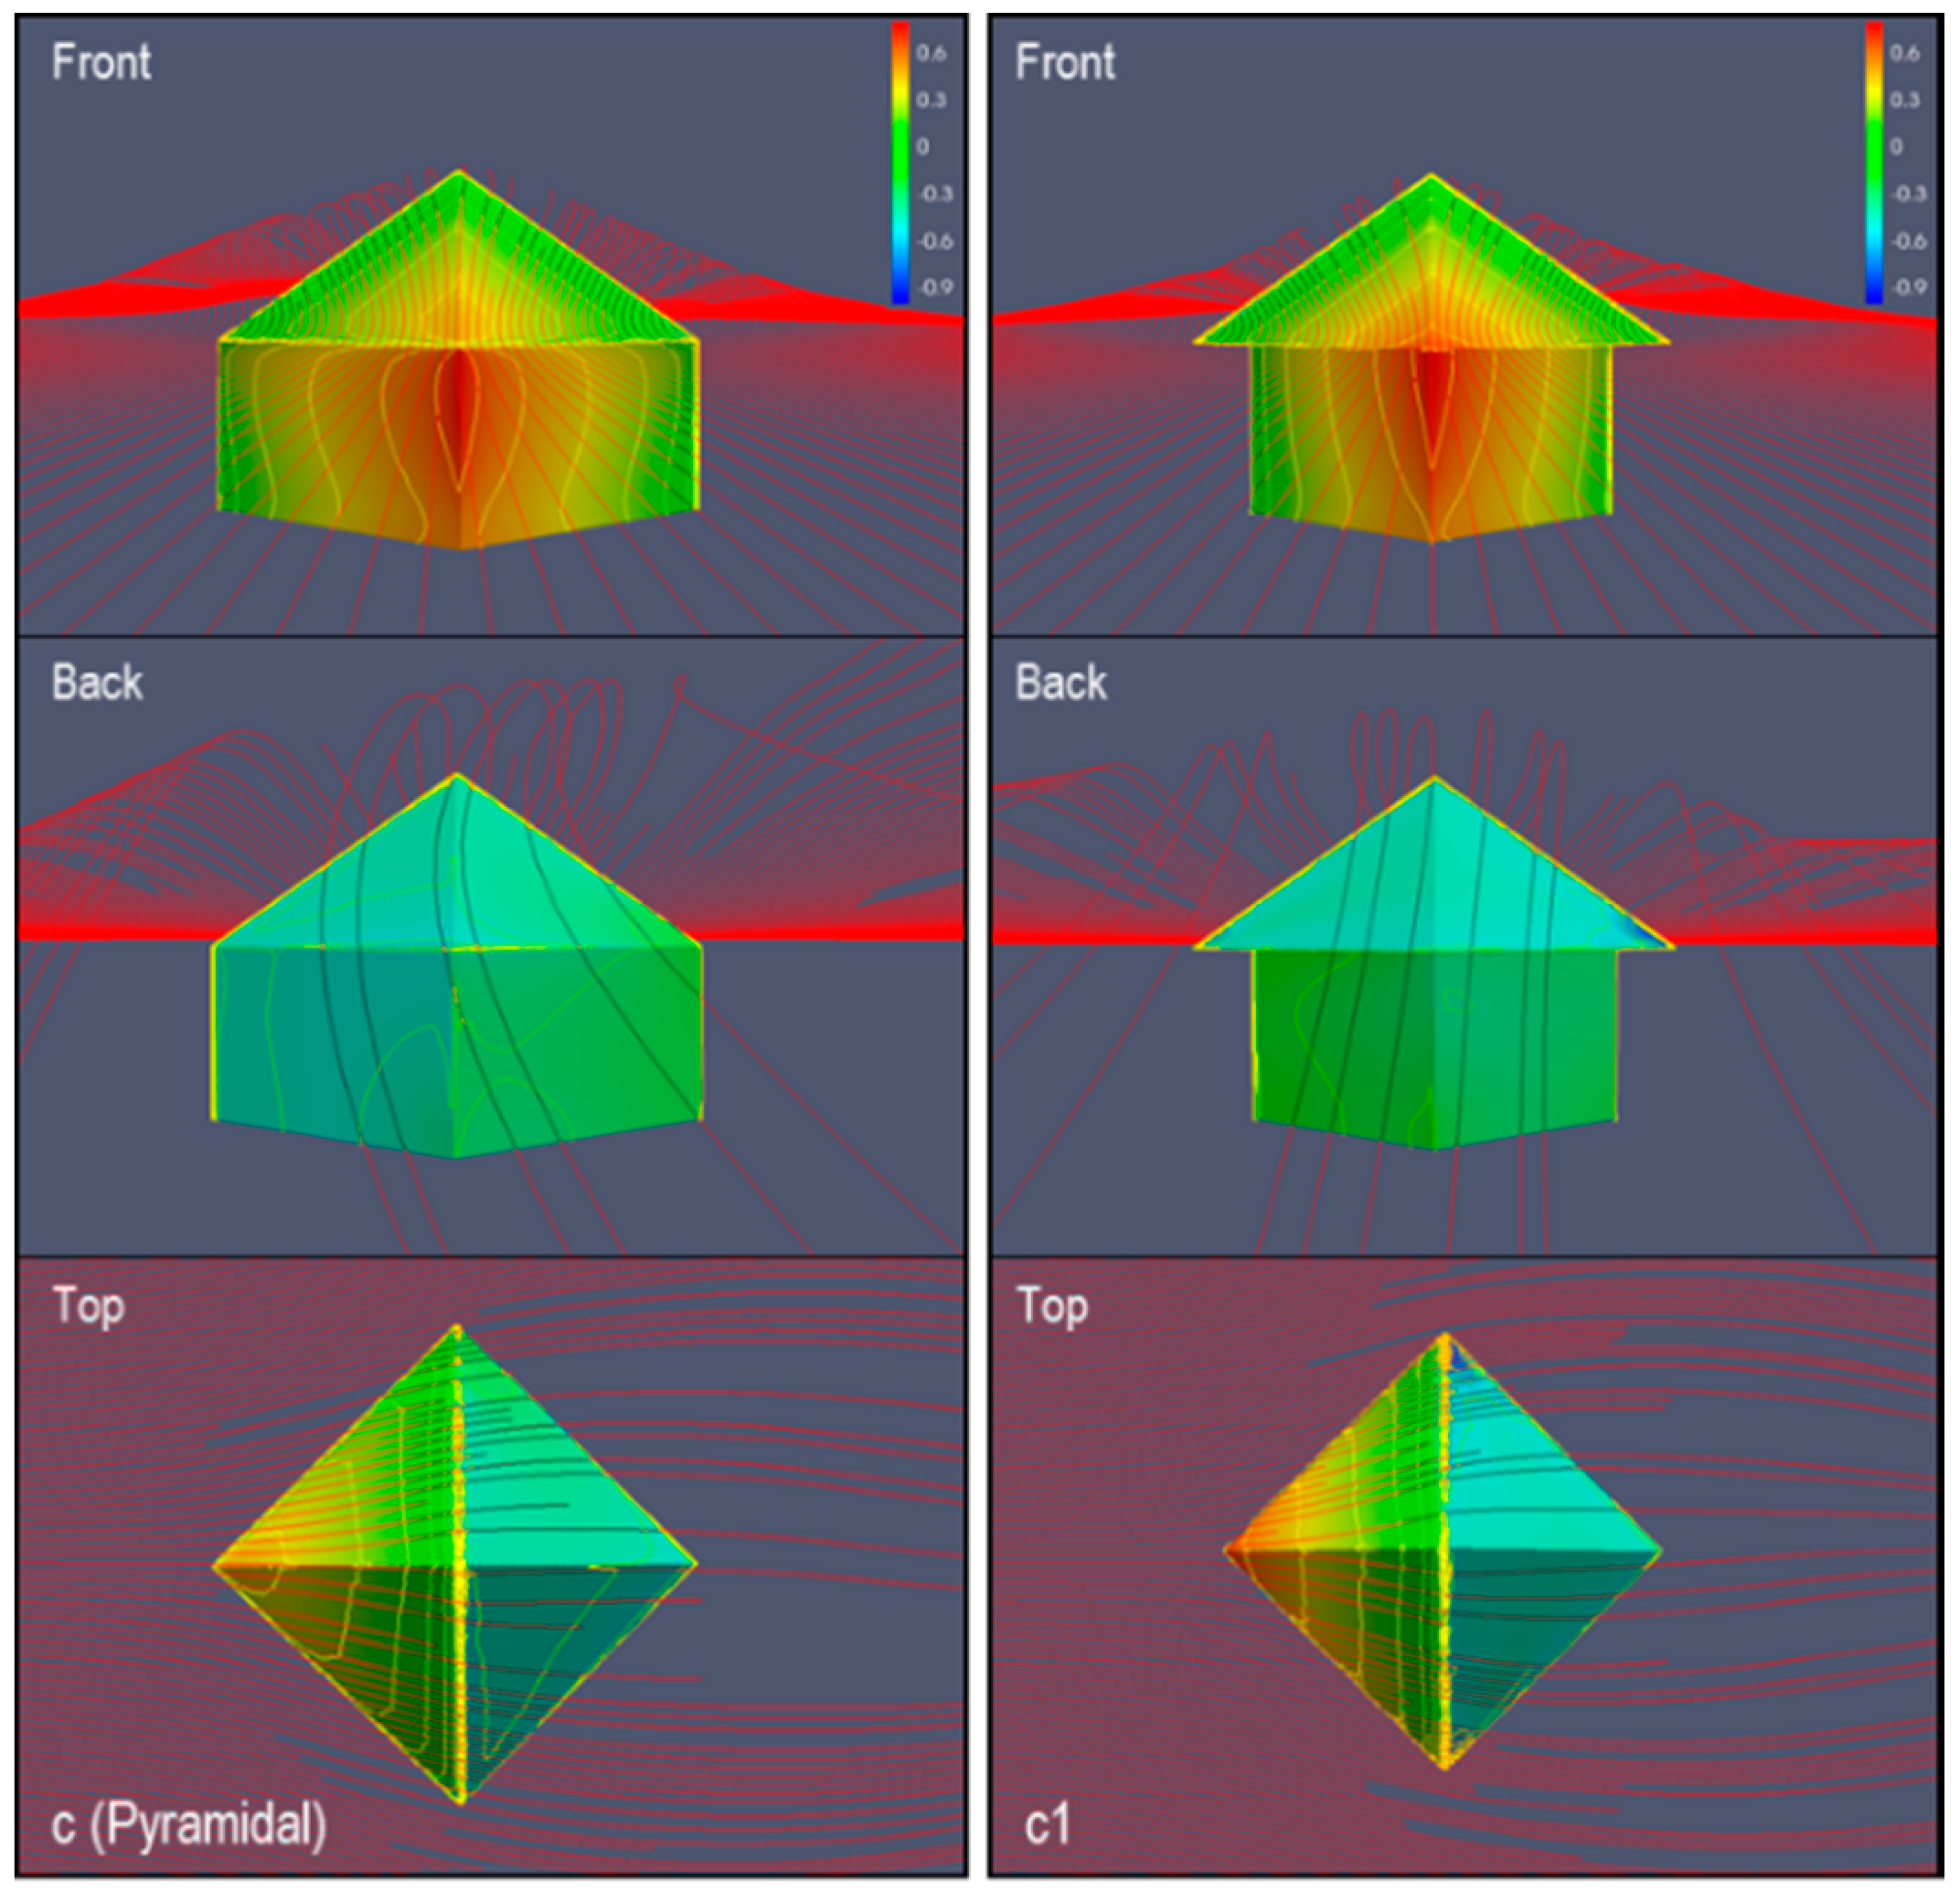
Figure 14 shows the pressure coefficient in the surface of the detached house with the pyramidal roof with and without the eaves overhang. The results show that the eaves overhang affected velocity streamlines (flow separation) as it was disturbed once it hit the eaves overhang, as compared to no eaves overhang, in which the velocity streamlines are smoother when it passes over the house’s surfaces (almost as a streamlined body). It also shows that the eaves overhang affects the pressure coefficient on the surface of the detached house. It shows that a high pressure coefficient is created on the surfaces between the wall and the eaves overhang due to stagnation in this area (air flow zero), as compared to the pyramidal roofing with no eaves overhang.

4. Conclusions

This paper shows the numerical evaluation of the typical roofing design in Philippine detached structures. Computational fluid dynamic was used to evaluate the distribution of the pressure coefficients in the flow field and the detached structure. It also shows the velocity field and streamlines for the different detached structure roofing configurations.
Based on the results, the paper shows that the roofing configuration affects the flow field around the structure. It shows that different roofing configurations affect the velocity vector, and that the pressure coefficient in the detached structure for different roofing configurations is also affected. Based on the most common roofing configurations (Gabled and Pyramidal), the eaves overhang has a large effect on the pressure coefficient and flow field velocity.
The edges of the roof such as the hip, ridge, rake and eave are significant reasons for the roof ripping due to the high pressure coefficient in the front side (windward) of the edge and lower pressure coefficient in the back side (leeward) of the edge, as presented in the results for different roofs shown in Figure 8, Figure 9, Figure 10, Figure 11 and Figure 12. Also, the eaves overhang is another significant reason for the roof ripping due to the high pressure coefficient at the front side (windward) and lower pressure coefficient at the back side (leeward) as shown in Figure 13(b1,b2).
For real application in Philippine houses, it is very important to select a roofing design that minimizes the pressure coefficient gradient around the surface of the structure and flow field. In case the roof design is final, due to some considerations, it is very important to consider the materials to be used and the method of installation, particularly the parts of the house with very high pressure coefficient gradient. For existing houses with the roofing design shown in this study, it is easy to know the parts of the house that need reinforcement or retrofitting to minimize the damage during the typhoon by knowing the parts of the house with very high pressure coefficient gradient. The results of this study are important for Philippine house designers, house owners and building construction regulators when designing a detached structure in the Philippines, so as to minimize the loss of life and property by means of studying the effects of roof design in wind load calculations and selecting the materials to be used.

Acknowledgments

The author gratefully acknowledge support from simFlow.

Conflicts of Interest

The author declares no conflict of interest.

References

  1. Enteria, N.; Awbi, H.; Yoshino, H. Application of renewable energy sources and new building technologies for the Philippine single family detached house. Int. J. Energy Environ. Eng. 2015, 6, 267–294. [Google Scholar] [CrossRef]
  2. Typhoon-Haiyan-Full-Horror-Destruction-Philippines-Revealed. Available online: http://www.dailymail.co.uk/news/article-2499851/Typhoon-Haiyan-Full-horror-destruction-Philippines-revealed.html (accessed on 8 October 2016).
  3. Typhoon Haiyan/Yolanda Destruction. Available online: http://o.canada.com/news/world/canadas-disaster-emergency-response-team-likely-to-be-in-philippines-on-friday (accessed on 8 October 2016).
  4. Li, J.Q.; Ward, I.C. Investigation of roof pitch and wind induced ventilation by computational fluid dynamics. In Proceedings of the 23rd Conference on Passive and Low Energy Architecture, Geneva, Switzerland, 6–8 September 2006.
  5. Ayata, T. Investigation of building height and roof effect on the air velocity and pressure distribution around the detached houses in Turkey. Appl. Therm. Eng. 2009, 29, 1752–1758. [Google Scholar] [CrossRef]
  6. Abohela, I.; Hamza, N.; Dehek, S. Effect of roof shape on energy yield and positioning of roof mounted turbines. In Proceedings of the 12th Conference of International Building Performance Simulation Association, Sydney, Australia, 14–16 November 2011.
  7. OpenFOAM. Available online: http://www.openfoam.com/ (accessed on 6 September 2015).
  8. simFlow. Available online: https://sim-flow.com/ (accessed on 15 November 2015).
  9. Dose, B.; Medjroubi, W.; Stoevesandt, B. CFD simulations of 2.5 MW turbine using ANSYS CFX and OpenFOAM. In Proceedings of the First Symposium on OpenFOAM in Wind Energy, Oldenburg, Germany, 21 March 2013; Available online: http://www.forwind.de/sowe/Site/Program_files/SOWE2013_Dose.pdf (accessed on 25 February 2016).
  10. Casella, L.; Langreder, W.; Fisher, A.; Ehlen, M.; Skoutelakos, D. Dynamic flow analysis using an OpenFOAM based CFD tool: Validation of turbulence Intensity in a testing site. ITM Web Conf. 2014, 2, 04002. [Google Scholar] [CrossRef]
  11. Irtaza, H.; Beale, R.G.; Godley, M.H.R.; Jameel, A. Comparison of wind pressure measurement on Silsoe experimental building from full-scale observation, wind-tunnel experiments and various CFD techniques. Int. J. Eng. Sci. Technol. 2013, 5, 28–41. [Google Scholar] [CrossRef]
  12. Franke, J.; Hellsten, A.; Schlunzen, H.; Carrissimo, B. Best Practice Guideline for the CFD Simulation of Flows in the Urban Environment; COST Office: Brussels, Belgium, 2007. [Google Scholar]
  13. Tamura, T.; Nozawa, K.; Kondo, K. AIJ guide for numerical prediction of wind loads on buildings. J. Wind Eng. Ind. Aerodyn. 2008, 96, 1974–1984. [Google Scholar] [CrossRef]
  14. Tominaga, Y.; Mochida, A.; Yoshie, R.; Kataoka, H.; Nozu, T.; Yoshikawa, M.; Shirasawa, T. AIJ guidelines for practical applications of CFD to pedestrian wind environment around buildings. J. Wind Eng. Ind. Aerodyn. 2008, 96, 1749–1761. [Google Scholar] [CrossRef]
  15. Krajnovic, S.; Davidson, L. Large-eddy simulation of the flow around a bluff body. AIAA J. 2002, 40, 927–936. [Google Scholar] [CrossRef]
  16. Versteeg, H.K.; Malalasekera, W. An Introduction to Computational Fluid Dynamics: The Finite Volume a Method Approach; Pearson Limited: London, UK, 1995. [Google Scholar]
  17. Abohela, I.; Hamza, N.; Dudek, S. Effect of roof shape, wind direction, building height and urban configuration on the energy yield and position of roof mounted wind turbines. Renew. Energy 2013, 50, 1106–1118. [Google Scholar] [CrossRef]
  18. Blocken, B.; Stathopoulos, T.; Carmeliet, J. CFD simulation of the atmospheric boundary layer: Wall function problems. Atmos. Environ. 2007, 41, 238–252. [Google Scholar] [CrossRef]
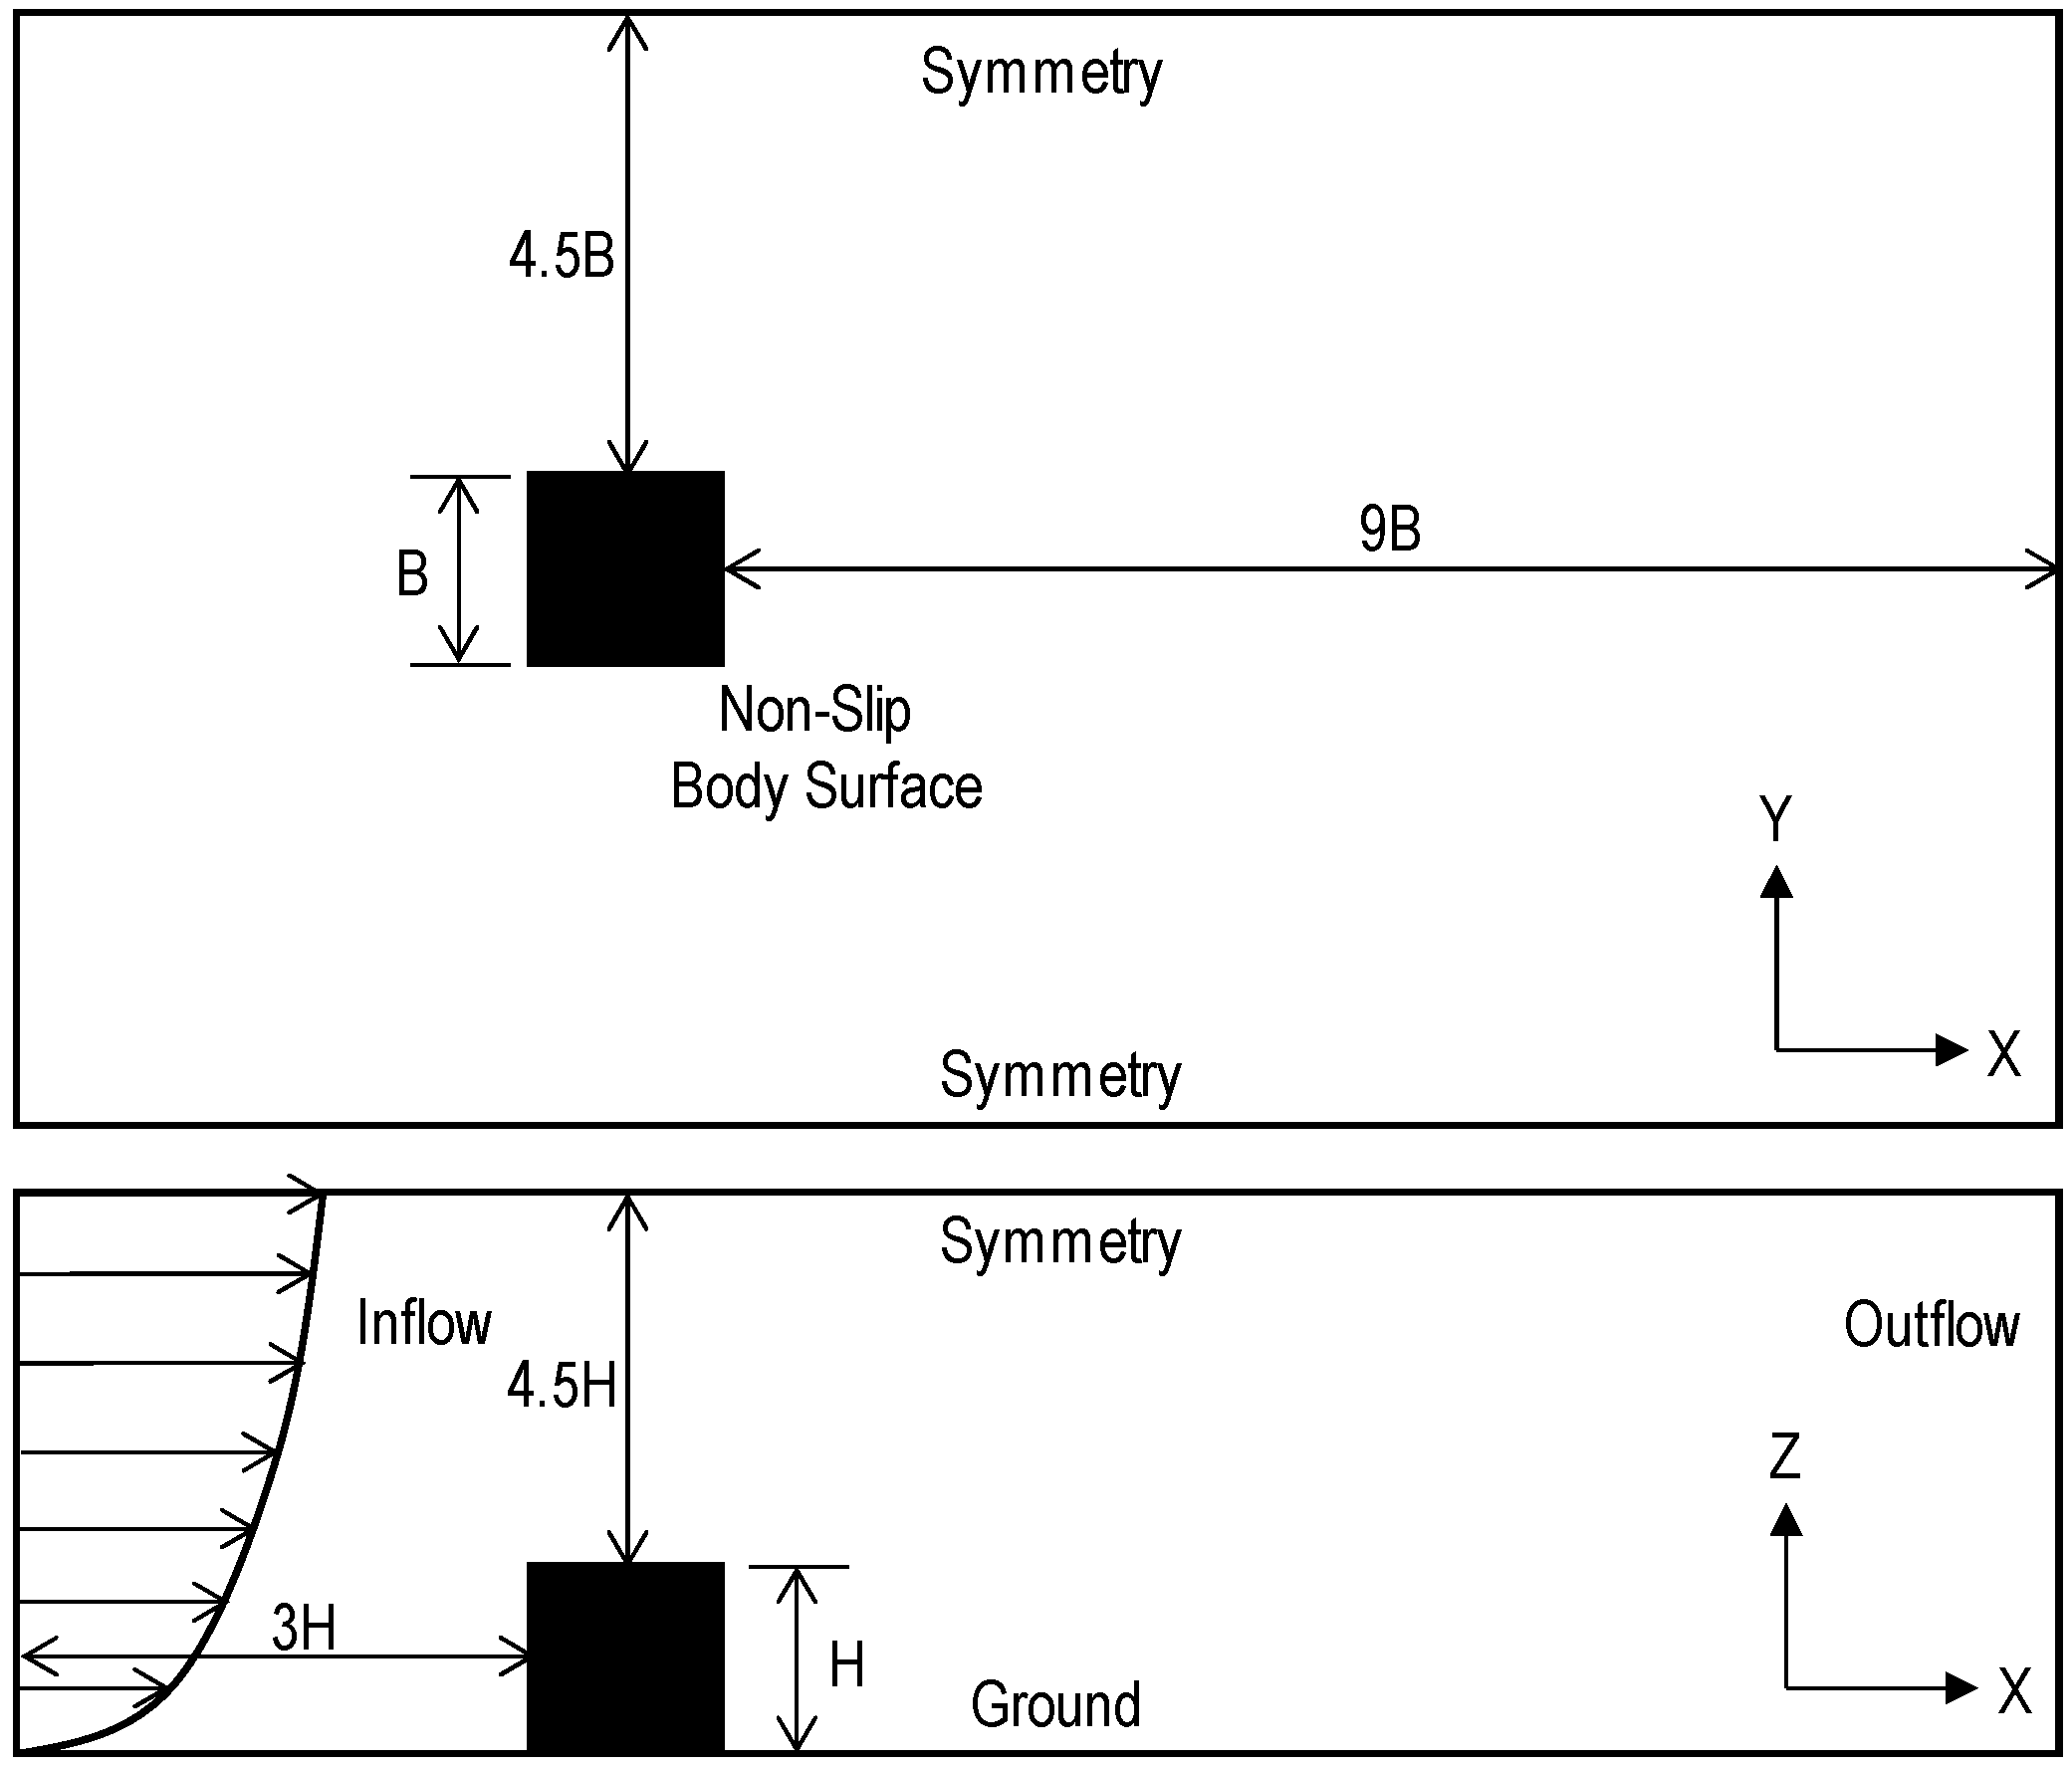
Figure 1. Computational domain and boundary conditions (B = H = 4 m).
Infrastructures 01 00003 g001
Figure 2. Computational grid: (a) whole domain; and, (b) cube.
Infrastructures 01 00003 g002
Figure 3. Simulated mean velocity profile compared to the full scale and wind tunnel velocity profiles.
Infrastructures 01 00003 g003
Figure 4. Comparison of the pressure coefficients in the centerline (y = 0) along the vertical axis (z-axis) derived from different turbulence models on the windward, roof and leeward areas of the cube compared to the full scale and wind tunnel results.
Infrastructures 01 00003 g004
Figure 5. Different roofing designs typical in Philippine detached houses: (A) generic roofing design; (B) gabled roof with roof and eaves overhang; and, (C) pyramidal roof with eaves overhang.
Infrastructures 01 00003 g005
Figure 6. Mean velocity and pressure coefficient contours with mean velocity vectors for different roofing designs of detached structures: (a) Flat roof; (b) Gabled roof; (c) Pyramidal roof; (d) Vaulted roof; (e) Wedged roof; and (f) Domed roof.
Infrastructures 01 00003 g006aInfrastructures 01 00003 g006b
Figure 7. Surface pressure coefficient for the flat roof.
Infrastructures 01 00003 g007
Figure 8. Surface pressure coefficient for the gabled roof.
Infrastructures 01 00003 g008
Figure 9. Surface pressure coefficient for the pyramidal roof.
Infrastructures 01 00003 g009
Figure 10. Surface pressure coefficient for the vaulted roof.
Infrastructures 01 00003 g010
Figure 11. Surface pressure coefficient for the wedged roof.
Infrastructures 01 00003 g011
Figure 12. Surface pressure coefficient for the domed roof.
Infrastructures 01 00003 g012
Figure 13. Pressure coefficient and streamlines comparison for the gabled roof with and without eaves overhang.
Infrastructures 01 00003 g013
Figure 14. Pressure coefficient and streamlines comparison for the pyramidal roof with and without eaves overhang.
Infrastructures 01 00003 g014