1. Introduction
Rural roads are an important component of economic and social activities in the Great Plains and Midwest of the United States. In a report on traffic accidents in the oil-producing counties of North Dakota, the Rural Transportation and Security Center [
1] states that two thirds of the counties recognized as oil counties are above the state average for crash risk. The estimated cost of traffic crashes in this region has increased 33% from 2006–2007 to 2009–2010. Paschang [
2] presents concerns about overweight trucks and their impacts on transportation infrastructure. He also notes that there are safety concerns related to speeding.
According to the Federal Highway Administration [
3], states with the highest percentage of rural roads are in the Great Plains. North Dakota has a high percentage (97.8%) of total rural road miles. These rural roads are a critical part of the infrastructure contributing to the state’s economy.
According to Boyd [
4], there is a vast need for infrastructure development in North Dakota because of the rise in oil exploration. He explains the various infrastructure needs with respect to growing populations in oil-producing counties. He projected needs for new housing projects, railroad terminals, pipelines, and roadways. Recent oil exploration in the Bakken region of North Dakota has created a sudden surge in traffic. Thus the number of vehicles travelling on the rural roads of North Dakota is also increasing. Tolliver and Dybing [
5] presented a comprehensive study of the investment needs for the roads in North Dakota because of the recent boom in oil exploration. They stated that oil production has more than doubled in North Dakota during the previous 10 years. In their report on oil transportation in western North Dakota and eastern Montana, Dybing
et al. [
6] provided a detailed analysis of the infrastructure investment needs in the state to support the increased traffic volume. Considering this increased traffic volume, it is important to consider different options to accommodate it.
One approach is to build new bridges wherever there is a need. The main goal of the bridge construction will be to reduce the number of miles traveled and increase mobility [
7]. The savings are assessed using the lifecycle benefit–cost model. The model considers the construction and maintenance costs of the bridge and the number of vehicles traveled in a 20-year period with vehicle miles saved over this period. Other important goals of building a new bridge are to improve safety and mitigate congestion. Increasing traffic volume makes the rural road system congested. Adding a bridge may help to reduce congestion and improve road safety.
This paper presents a case study of a lifecycle benefit–cost analysis (BCA) of a bridge constructed on the rural road system in North Dakota. The results may help the Department of Transportation (DOT) and construction companies determine the most suitable alternative for the bridge construction. The methodology presented in the paper may be useful to researchers in other states. This paper investigates the benefits of combining travel demand modeling and lifecycle benefit–cost analysis, and demonstrates how to integrate geographic information systems (GIS), operations research, and data analytics for evaluating alternative scenarios.
The paper is organized as follows.
Section 2 reviews past and current literature about the recent oil boom in North Dakota, benefit–cost analysis, lifecycle cost analysis, and bridge construction.
Section 3 describes the method demonstrated and the variables presented in this analysis.
Section 4 describes the alternate solutions of the bridge location problem using a case study regarding the construction of a bridge over the Little Missouri River in western North Dakota.
Section 5 presents the insights gained through the case study and potential practical applications.
2. Literature Review
There is a need for infrastructure development to facilitate social and economic activities [
8]. Therefore, it is important to perform economic feasibility studies using a benefit–cost analysis before any capital investment is made in transportation infrastructure. Benefit–cost analysis is a way to assess if the project is an efficient use of resources [
9] and is well-known to transportation planners. Prest and Turvey [
9] provide the basic guidelines for benefit-cost analysis. These guidelines are still used in modern benefit–cost analysis. Their guidelines include: (1) realize which costs and benefits are used in the analysis; (2) assign a valuation of costs; (3) determine the discount/interest rate; and (4) identify relevant constraints.
A lifecycle benefit–cost analysis of infrastructure investments includes the following basic steps: defining the project base case and alternatives, determining the level of detail in the analysis, developing a framework for calculating costs and benefits, and determining the current value of costs and benefits. In most transportation infrastructure projects, the primary benefits are measured in terms of travel time savings for selected user group or groups. The secondary benefits are reductions of various travel-related costs such as: accident costs, vehicle ownership and operating costs, travel time reliability costs, facility operating and maintenance costs, and environmental impact costs. The main cost components are initial construction or rehabilitation costs, maintenance and inspection costs, and salvage costs.
The major challenge in performing a lifecycle benefit–cost analysis is estimating the factors used in benefit and cost calculations such as: traffic forecast, cost estimation, discount rate, value of life, safety, value of time, regional impacts, local impacts, equity, environmental impacts, and residual use [
10]. Thoft-Christensen [
11] discusses the use of stochastic modelling techniques to model direct and indirect user benefits and costs. In Thoft-Christensen’s paper, expected benefit and cost estimation models are proposed in the context of single and multiple bridge infrastructure analysis.
Layard and Glaister [
12] describe the overall approach of a benefit–cost analysis. They describe two major components of a benefit–cost analysis as: (1) the value of the costs and benefits in each year; and (2) aggregate present value of the project by discounting the costs and benefits. They also describe other benefit–cost analysis components such as: shadow price, market price, consumers’ willingness to pay, and pricing a non-market item. While explaining pricing of a non-market item, they use the example of a bridge. If the bridge will save money and time benefits that exceed the costs, the bridge investment is advisable. Elvik [
13] discusses the applicability of the benefit–cost analysis of road safety measures. He also adds discussion of controversies involved in analysis.
Frangopol, Lin, and Estes [
14] provide a method for the lifecycle cost design of a deteriorating structure. They minimized the cost while ensuring the reliability of the structure. Their research is based on a reinforced concrete design. Asiedu and Gu [
15] present a comprehensive review of the literature on product lifecycle cost analysis. Although their approach is more suitable to manufactured products, they deliver important equations for the lifecycle cost analysis of construction projects. Val Dimitri and Stewart [
16] analyze the lifecycle cost of reinforced concrete structures in a marine environment. They provide the basic equation used in the lifecycle cost analysis. This equation is also presented in Hawk [
17], with a detailed explanation of the procedures used for bridge lifecycle cost analysis.
Tolliver
et al. [
18] discuss estimating road investment needs in their article about agricultural transportation in North Dakota. They calculate the average farm-to-market distance, resurfacing cost, and maintenance costs for paved and unpaved roads. While their work does not include the study of bridge needs, Bratlien
et al. updated the infrastructure needs study to include bridge condition [
19]. Babcock and Alakshendra [
20] evaluate county road investment by simulating the closure of county roads. They use TransCAD to find alternate routes when the roads are closed and to calculate the additional miles travelled. They compare the benefits of the road closure to the costs associated with it. They use the following formula for the calculation of costs:
They calculate the benefit-to-cost ratio for each scenario and estimate which links should be closed and which should not be closed.
3. Methodology
This research uses benefit–cost analysis to compute the ratio of benefit-to-cost involved in the project. The cost calculation follows the formula presented in Hawk [
17]. We modify the formula presented in NCHRP Report 483. The basic formula is given as Equation (1).
Because this study considers the construction of a new bridge, there is no cost for salvaging or removing an existing structure. The study period is 20 years, which is not long enough for any rehabilitation cost to be present. This modifies Equation (1) and presents the equation used for this study, Equation (2).
The maintenance costs are calculated based on guidelines from the Federal Highway Administration [
21], which provided guidelines for total project cost estimation for the bridge structure. It is stated that “In the absence of a procedure for estimating the total project cost, a guide of 150% of the bridge project cost is suggested”. This is expressed as Equation (3) for calculating the total bridge project cost.
The benefits of the project are calculated in different forms. This research focuses on the benefits of the bridge construction in terms of saving in the number of miles and hours travelled. These are calculated with the help of a 20-year study and forecasts of the traffic. The forecasting method used in this study is similar to that used by Dybing
et al. [
6] and Tolliver
et al. [
18]. The forecast is performed with the help of traffic modeling using CUBE Voyager
®, trip distribution using SAS Proc NETFLOW
®, and route assignment using CUBE Voyager
®. Two scenarios are considered—one with the bridge and another without the bridge. After forecasting the traffic, the total vehicle miles travelled (VMT) and total vehicle hours travelled (VHT) are generated for each scenario for further analysis.
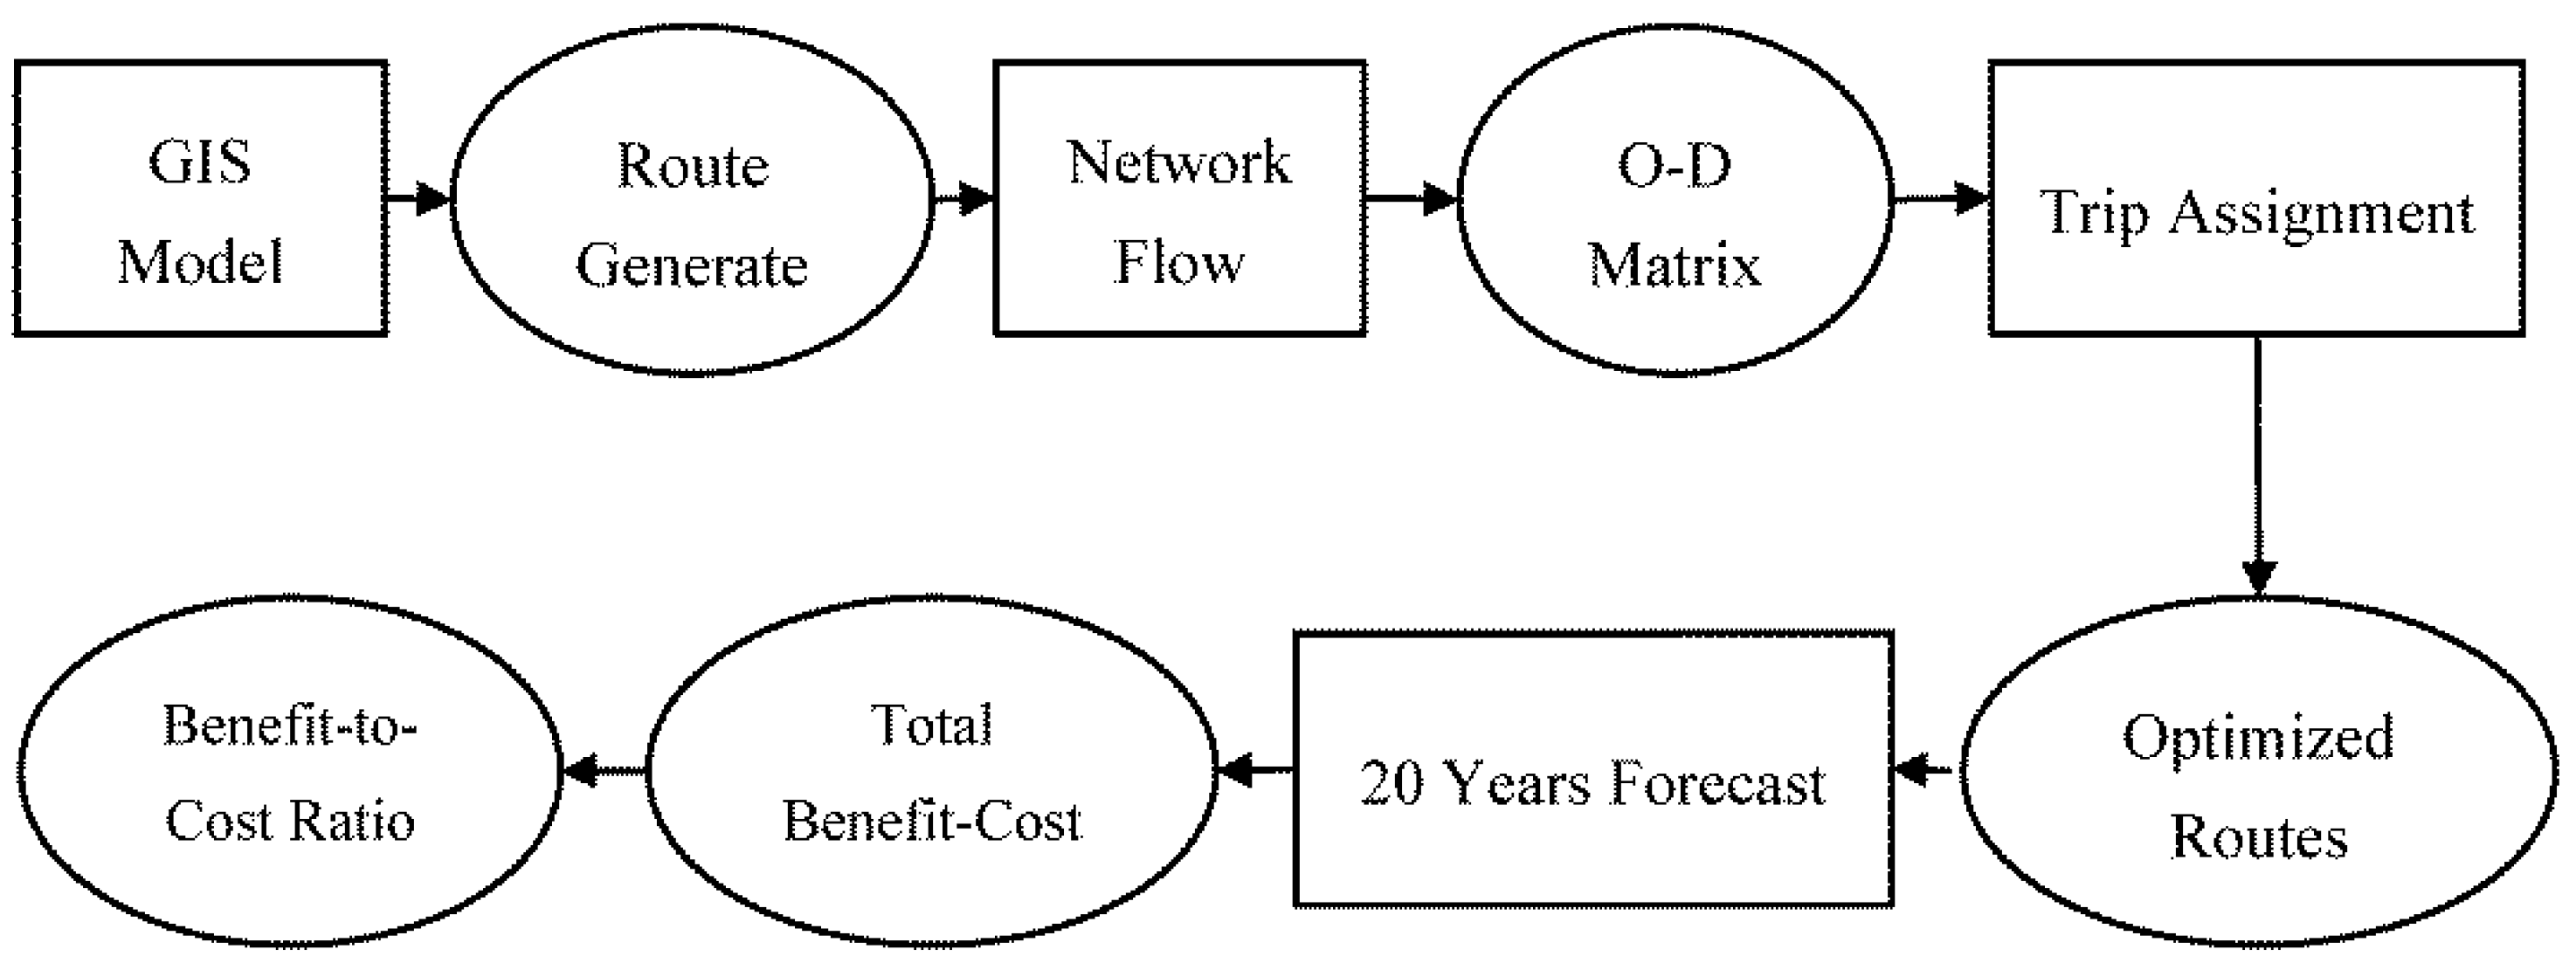
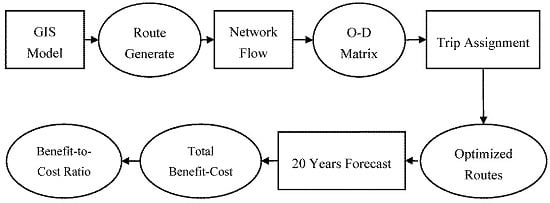
The methodology follows the workflow shown in
Figure 1. It begins with the generation of the Origin–Destination (O–D) matrix from the GIS traffic model. The traffic volumes from the O-D matrix (
i.e., output of trip distribution) are assigned onto the routes. These routes are optimized and used for the 20-year forecast. The forecast is used to calculate the total benefits and costs for the current scenario and alternate scenarios. The benefit-to-cost ratio is calculated using these monetized values. This benefit-to-cost ratio is used for the final selection of a scenario.
3.1. Traffic Modeling
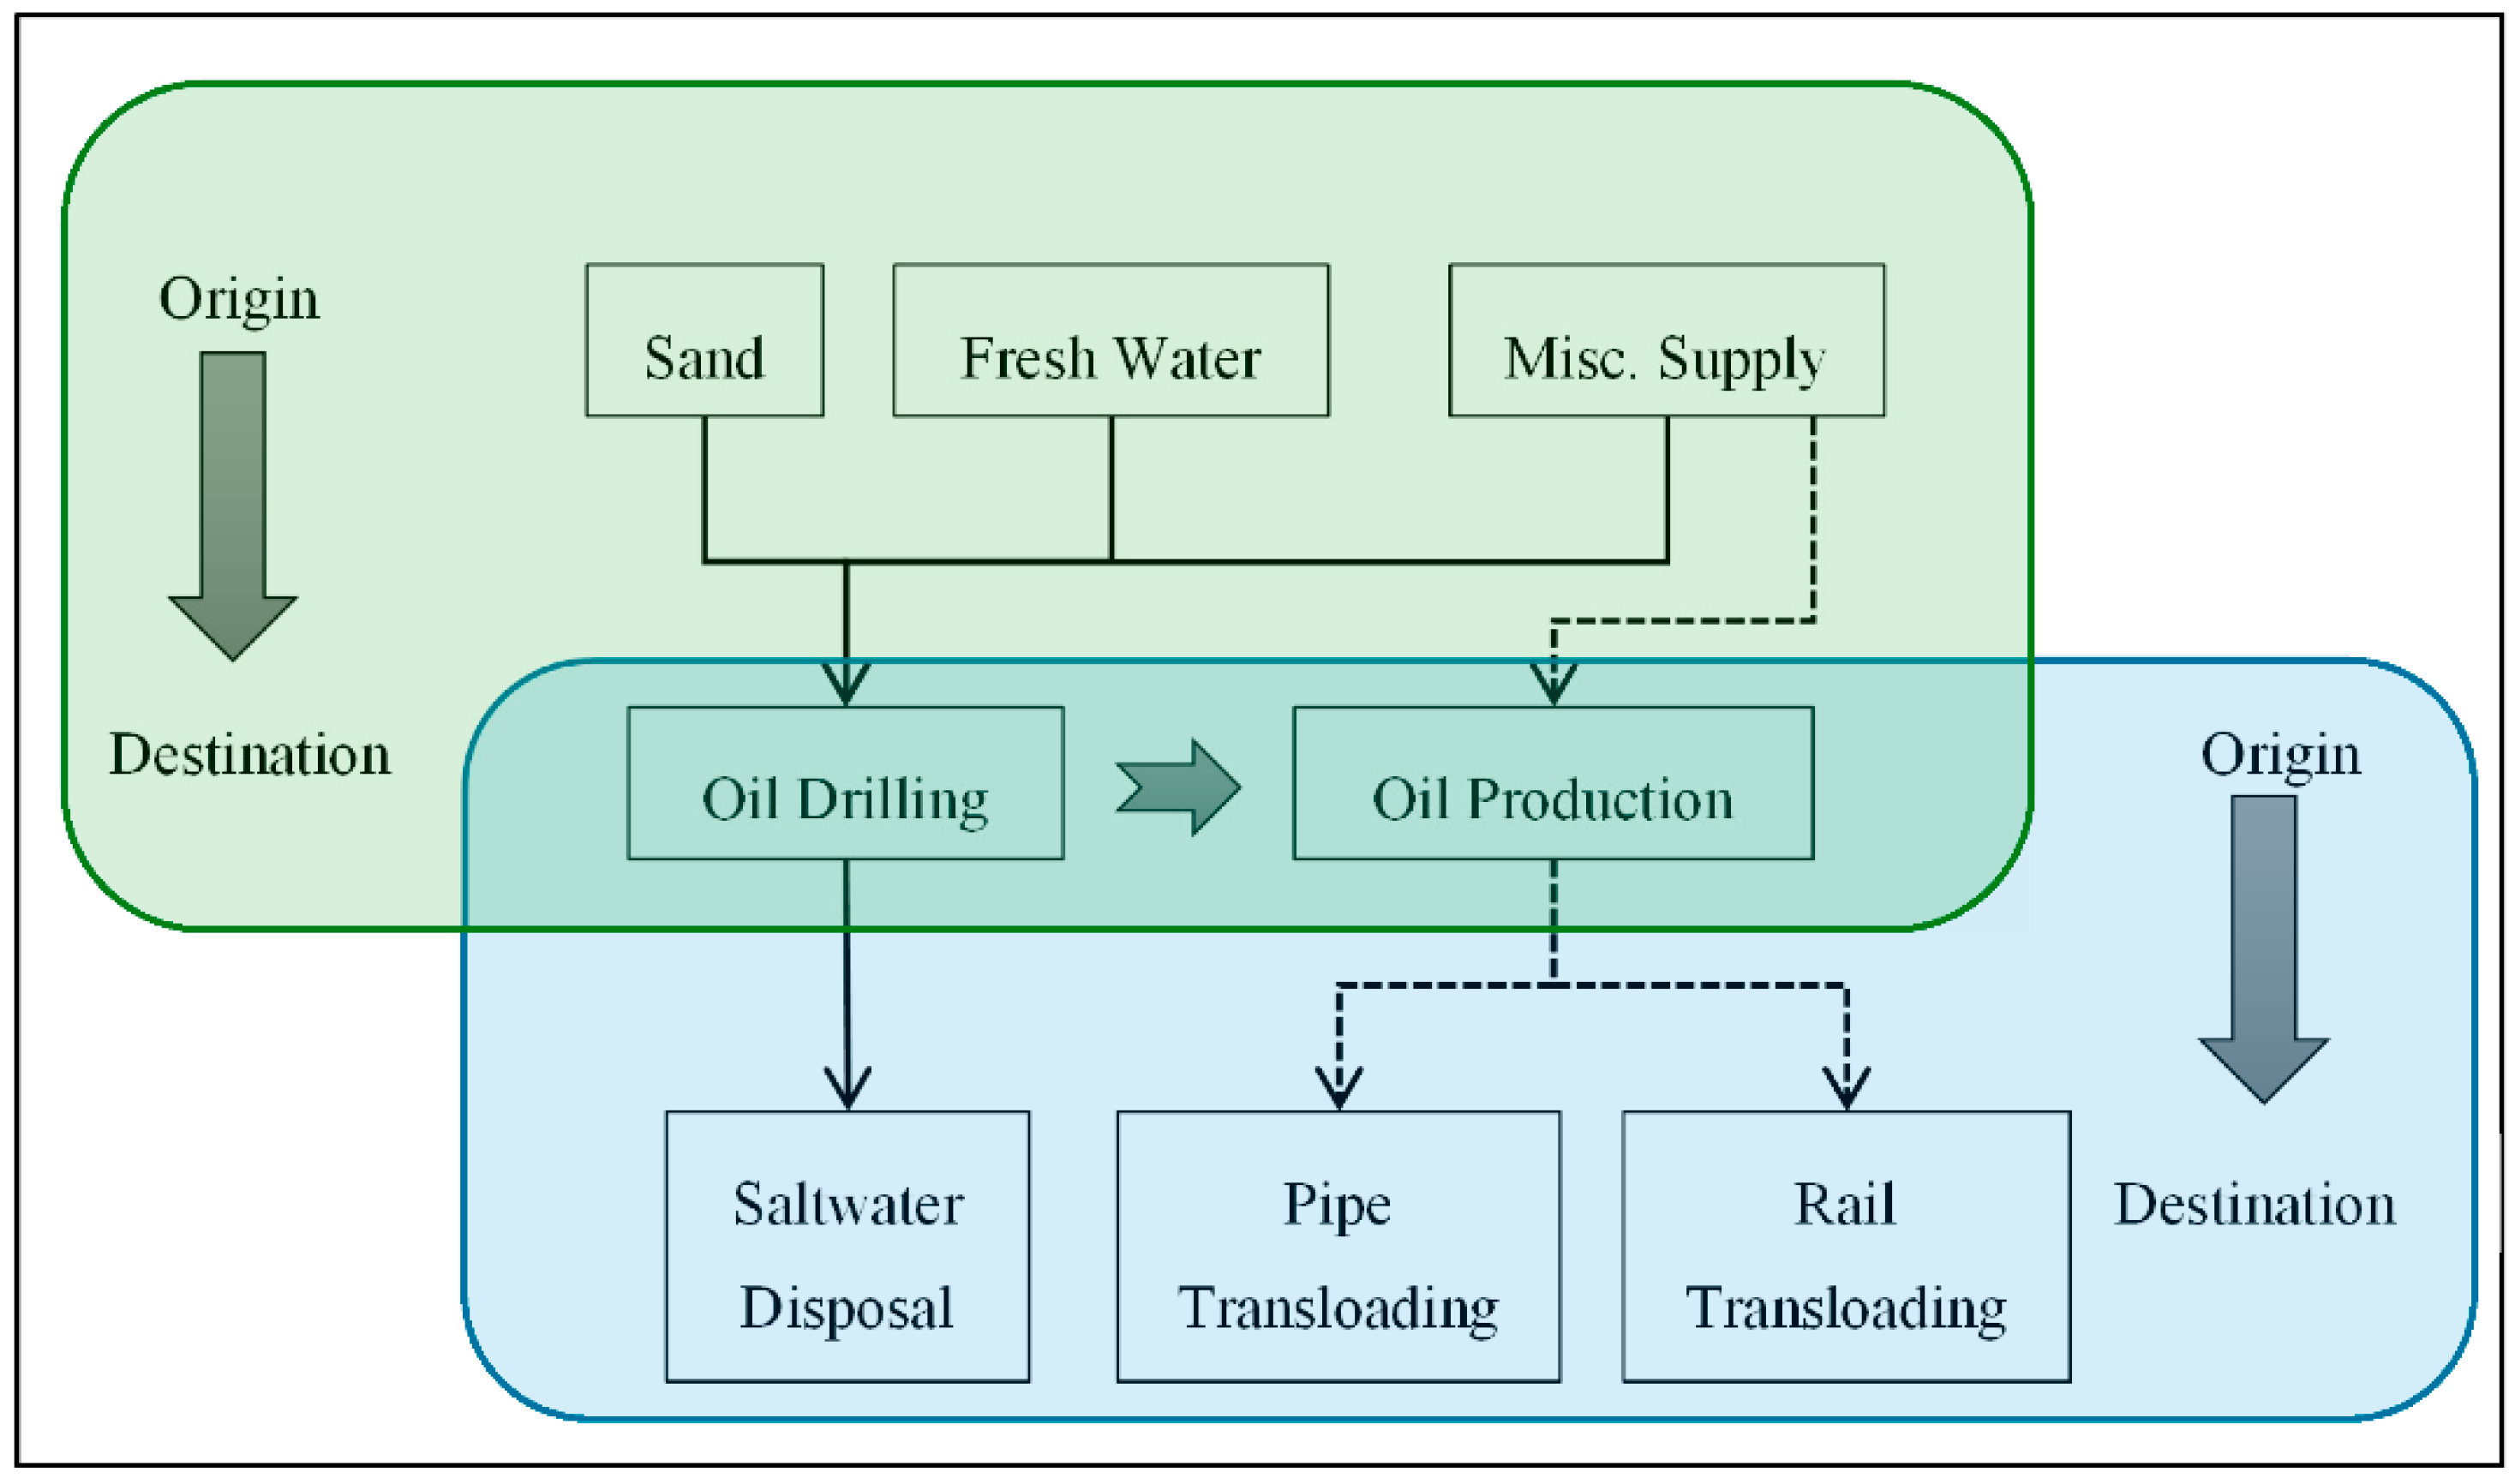
Figure 2 shows the procedure followed for the traffic modeling using origin-destination (O-D) pair matrix. The generation of the O–D matrix is a two-step process. In oil well drilling, the first step involves oil wells as the destinations, while for the second step, during oil production, the well sites are the origins. Drilling locations are closely related with the demand (
i.e., origins of traffic volume) [
22]. Sources of sand, fresh water, and miscellaneous supplies are treated as the origins for supporting drilling. A huge amount of saltwater is produced as a byproduct of the drilling process which is further transported to disposal sites. At the time of oil production, oil wells are origins and the pipe and rail transloading facilities are destinations.
A GIS model is created with the road network in the study area and includes important origins and destinations. These locations are then connected with the routes with the help of a traffic model. To generate the O–D matrix from locations and the road network, Dijkstra’s shortest path algorithm is used. This algorithm is embedded in ESRI
®’s ArcMAP module of Network Analyst. Dijkstra solved two problems of the graph theory based on the pairing of points (nodes) in his original research [
23]. He solved a problem of finding a path of minimum length between two given nodes. The Arc GIS software uses the algorithm of the second problem mentioned by Dijkstra for solving the closest facility method. As mentioned earlier, we find the cost-minimizing path between origins and destinations. In this research, total travel time is used as the impedance to solve this problem. The lowest impedance paths are called as the quickest paths. The process of traffic modeling generates the O–D matrix. This process does consider unconstrained capacities at the origins.
3.2. Route Assignment
The capacities at the origins are used for optimization. Routes are assigned based on this optimization to minimize cost. The road was considered to have unlimited capacity, and bottlenecks were not assumed in this study. This optimization model was adopted from Dybing
et al. [
6]. The objective of the optimization function is to minimize the total cost of moving freight from origins to destinations (Equation (4)). It is subject to the demands at the oil wells (Equation (5)), the supply capacities at origin locations (such as sand and fresh water facilities) (Equation (6)), the handling capacities at destination locations (Equation (7)), the minimum estimated throughput at the oil wells for saltwater or oil production (Equation (8)), and the number of trucks on a route must be greater than or equal to zero (Equation (9)). The data sources for the variables mentioned in the equations are explained in the Data Sources section.
Subject to:
where
i = Index for origin locations, i = 1 … n
j = Index for oil wells, j = 1 … m
k = Index for freight type, k = 1 … o
l = Index for destination locations, l = 1 … p
cijk = Cost of carrying freight of type k between i and j (i.e., travel time)
xijk = Truckloads of freight of type k between i and j
cjlk = Cost of carrying freight of type k between j and l (i.e., travel time)
xjlk = Truckloads of freight of type k between j and l
Djk = Demand at oil wells j for freight of type k
Sik = Supply at origin i for freight of type k
Ulk = Capacity at destinations (saltwater disposal or transloading facilities) for freight k
Tjk = Minimum estimated throughput of freight of type k shipped from oil wells j
The future optimized routes are estimated based on the above equations for the 20 years of demand and supply changes. As the major contributor for this derived traffic is oil production, other demands are also derived based on the oil production. The 20 year forecast for the oil production is given by the North Dakota state government. This forecast is used to estimate the demand and supply changes for all other sources. Routes and the vehicle traffic are further derived based on the demand and supply changes in oil and other sources. These 20 year routes give the total miles travelled for each arc, which are converted to VMT and VHT for 20 years, which are then used in the benefits calculations. These are then converted into the dollar amount. The dollar amount from the bridge scenario is subtracted from the dollar amount of the base scenario to get the total benefits. This is shown in Equation (10).
where
= Total benefits for the scenario based on a bridge
CM = Transportation cost per mile
CH = Transportation cost per hour
Calculations for the transportation cost per mile and the transportation cost per hour are explained in detail in the next section. The final step is calculating the benefit-to-cost (BTC) ratio given by Equation (11). The BTC ratio is the ratio of total benefits derived by the difference between the cost of the alternative scenario and the cost of the base scenario. This ratio will be used to conclude if the project is desirable to construct or not.
4. Case Study
The crossing of the Little Missouri River is an important issue in western North Dakota. According to The Dickinson Press [
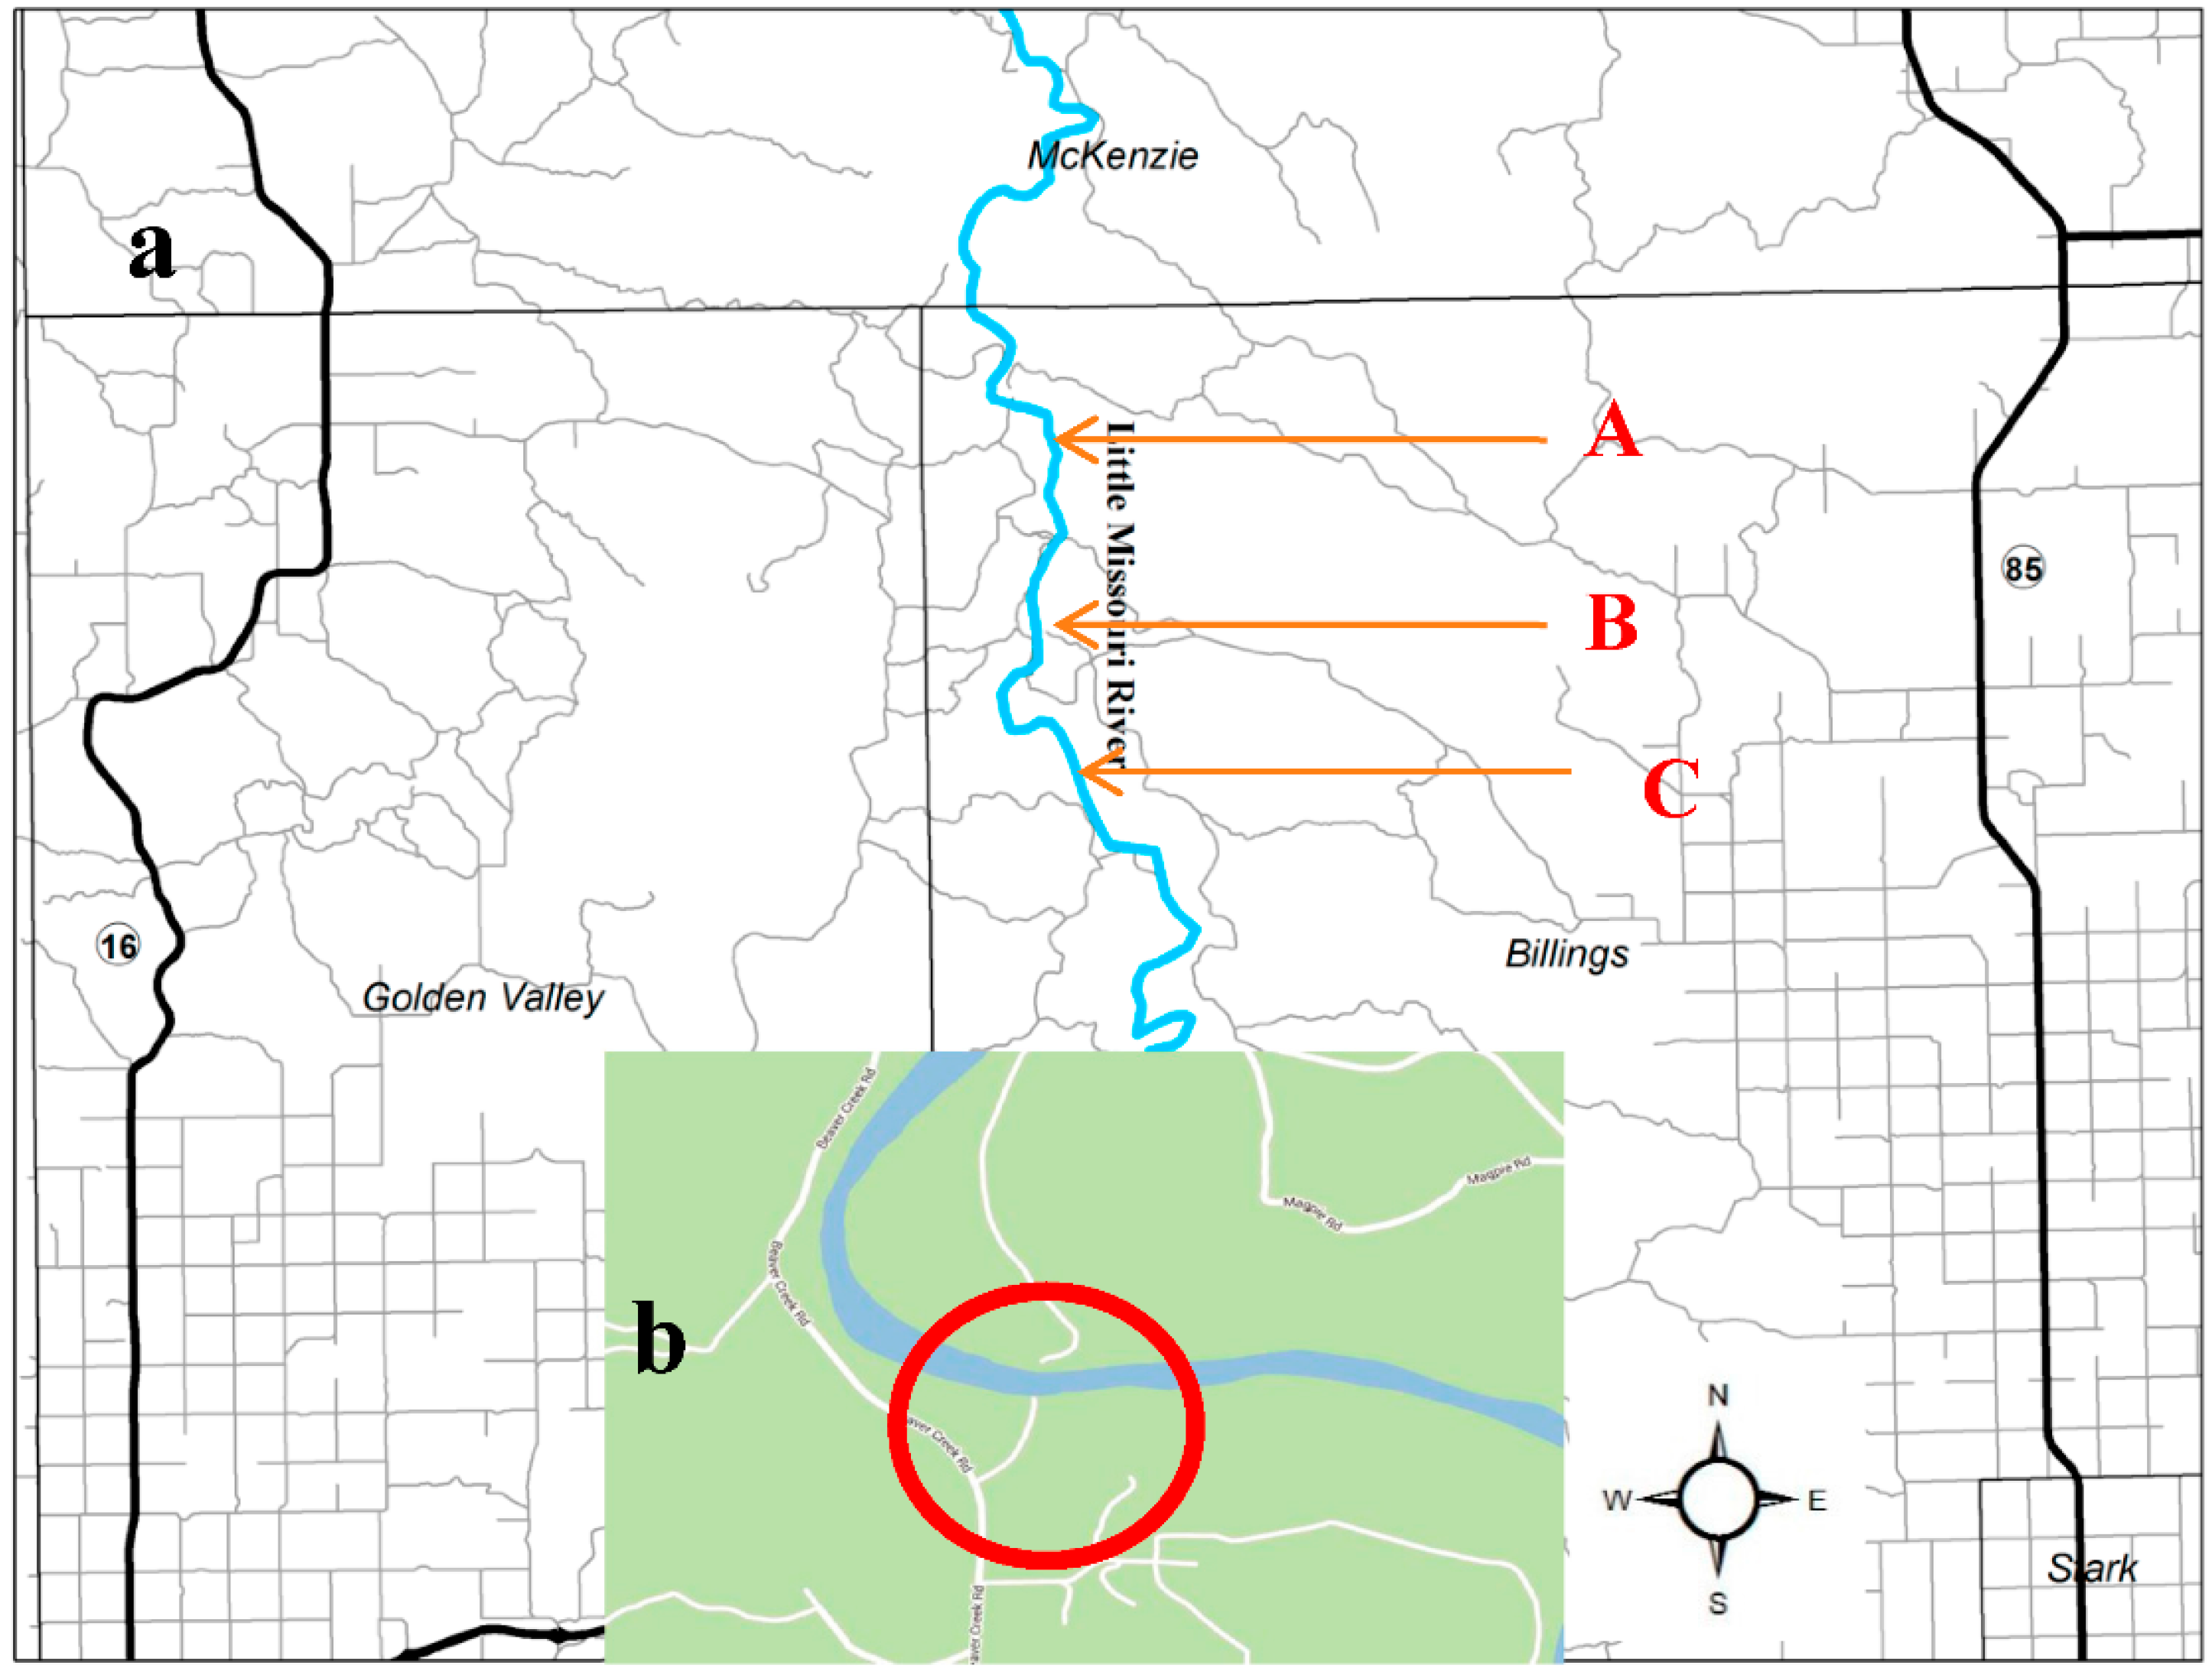
24], this project to connect Highway 85 and Highway 16 has been discussed for more than 20 years (see
Figure 3). There is no appropriate river crossing in Billings County. The only alternatives are the bridges on I-94 near Medora, or the Long X Bridge south of Watford City. The proposed bridge is to be placed in Billings County. This is crucial from the point of view of emergency first responders. An overview of the needs for the crossing was presented at the Little Missouri River Crossing EIS Alternatives Public Workshop by Billings County [
25]. The needs include fire management, agricultural transportation, oil transportation, and tourism. These needs have increased due to the recent boom in oil exploration and production. There is an intensified need for road and bridge infrastructure to support better emergency medical service, 9-1-1 service, and oil and agricultural transportation.
Figure 3 shows the area between Highway 16 and Highway 85. This area shows the Little Missouri River passing through Billings County. The total length of the river in Billings County is 41.5 miles [
26].
Figure 3a shows three places (A, B, and C) suitable for crossings, but there is no bridge present at any of these locations.
Figure 3b shows the Little Missouri River intersecting a county road without a bridge structure. This study area shows the importance of constructing a bridge in Billings County.
4.1. Data Sources
The data was collected from North Dakota GIS Hub Data Portal [
27]. The latest shape files for roads, rivers, and county boundaries are present on this website. Billings County provided the map of different alternatives for the bridge. The map in
Figure 3 was used to generate different scenarios for the bridge. Locations, production capacities, and travel demand from oil wells and water sources were taken from the North Dakota Oil and Gas Commission website [
28]. The locations and demands at the sand and pipe facilities were collected from the North Dakota Pipeline Authority [
29]. The cost of carrying freight and truckload of freight data was based on Tolliver and Dybing [
5].
4.2. Scenarios
For this case study, four scenarios are considered. These scenarios are Base, A, B, and C. The Base scenario is the scenario without any change, no new bridge construction. Scenario A represents the bridge construction in the northern part of Billings County. Scenarios B and C represent the bridge construction near the middle part of Billings County. An overview of these scenarios is shown in
Figure 3.
4.3. GIS Model
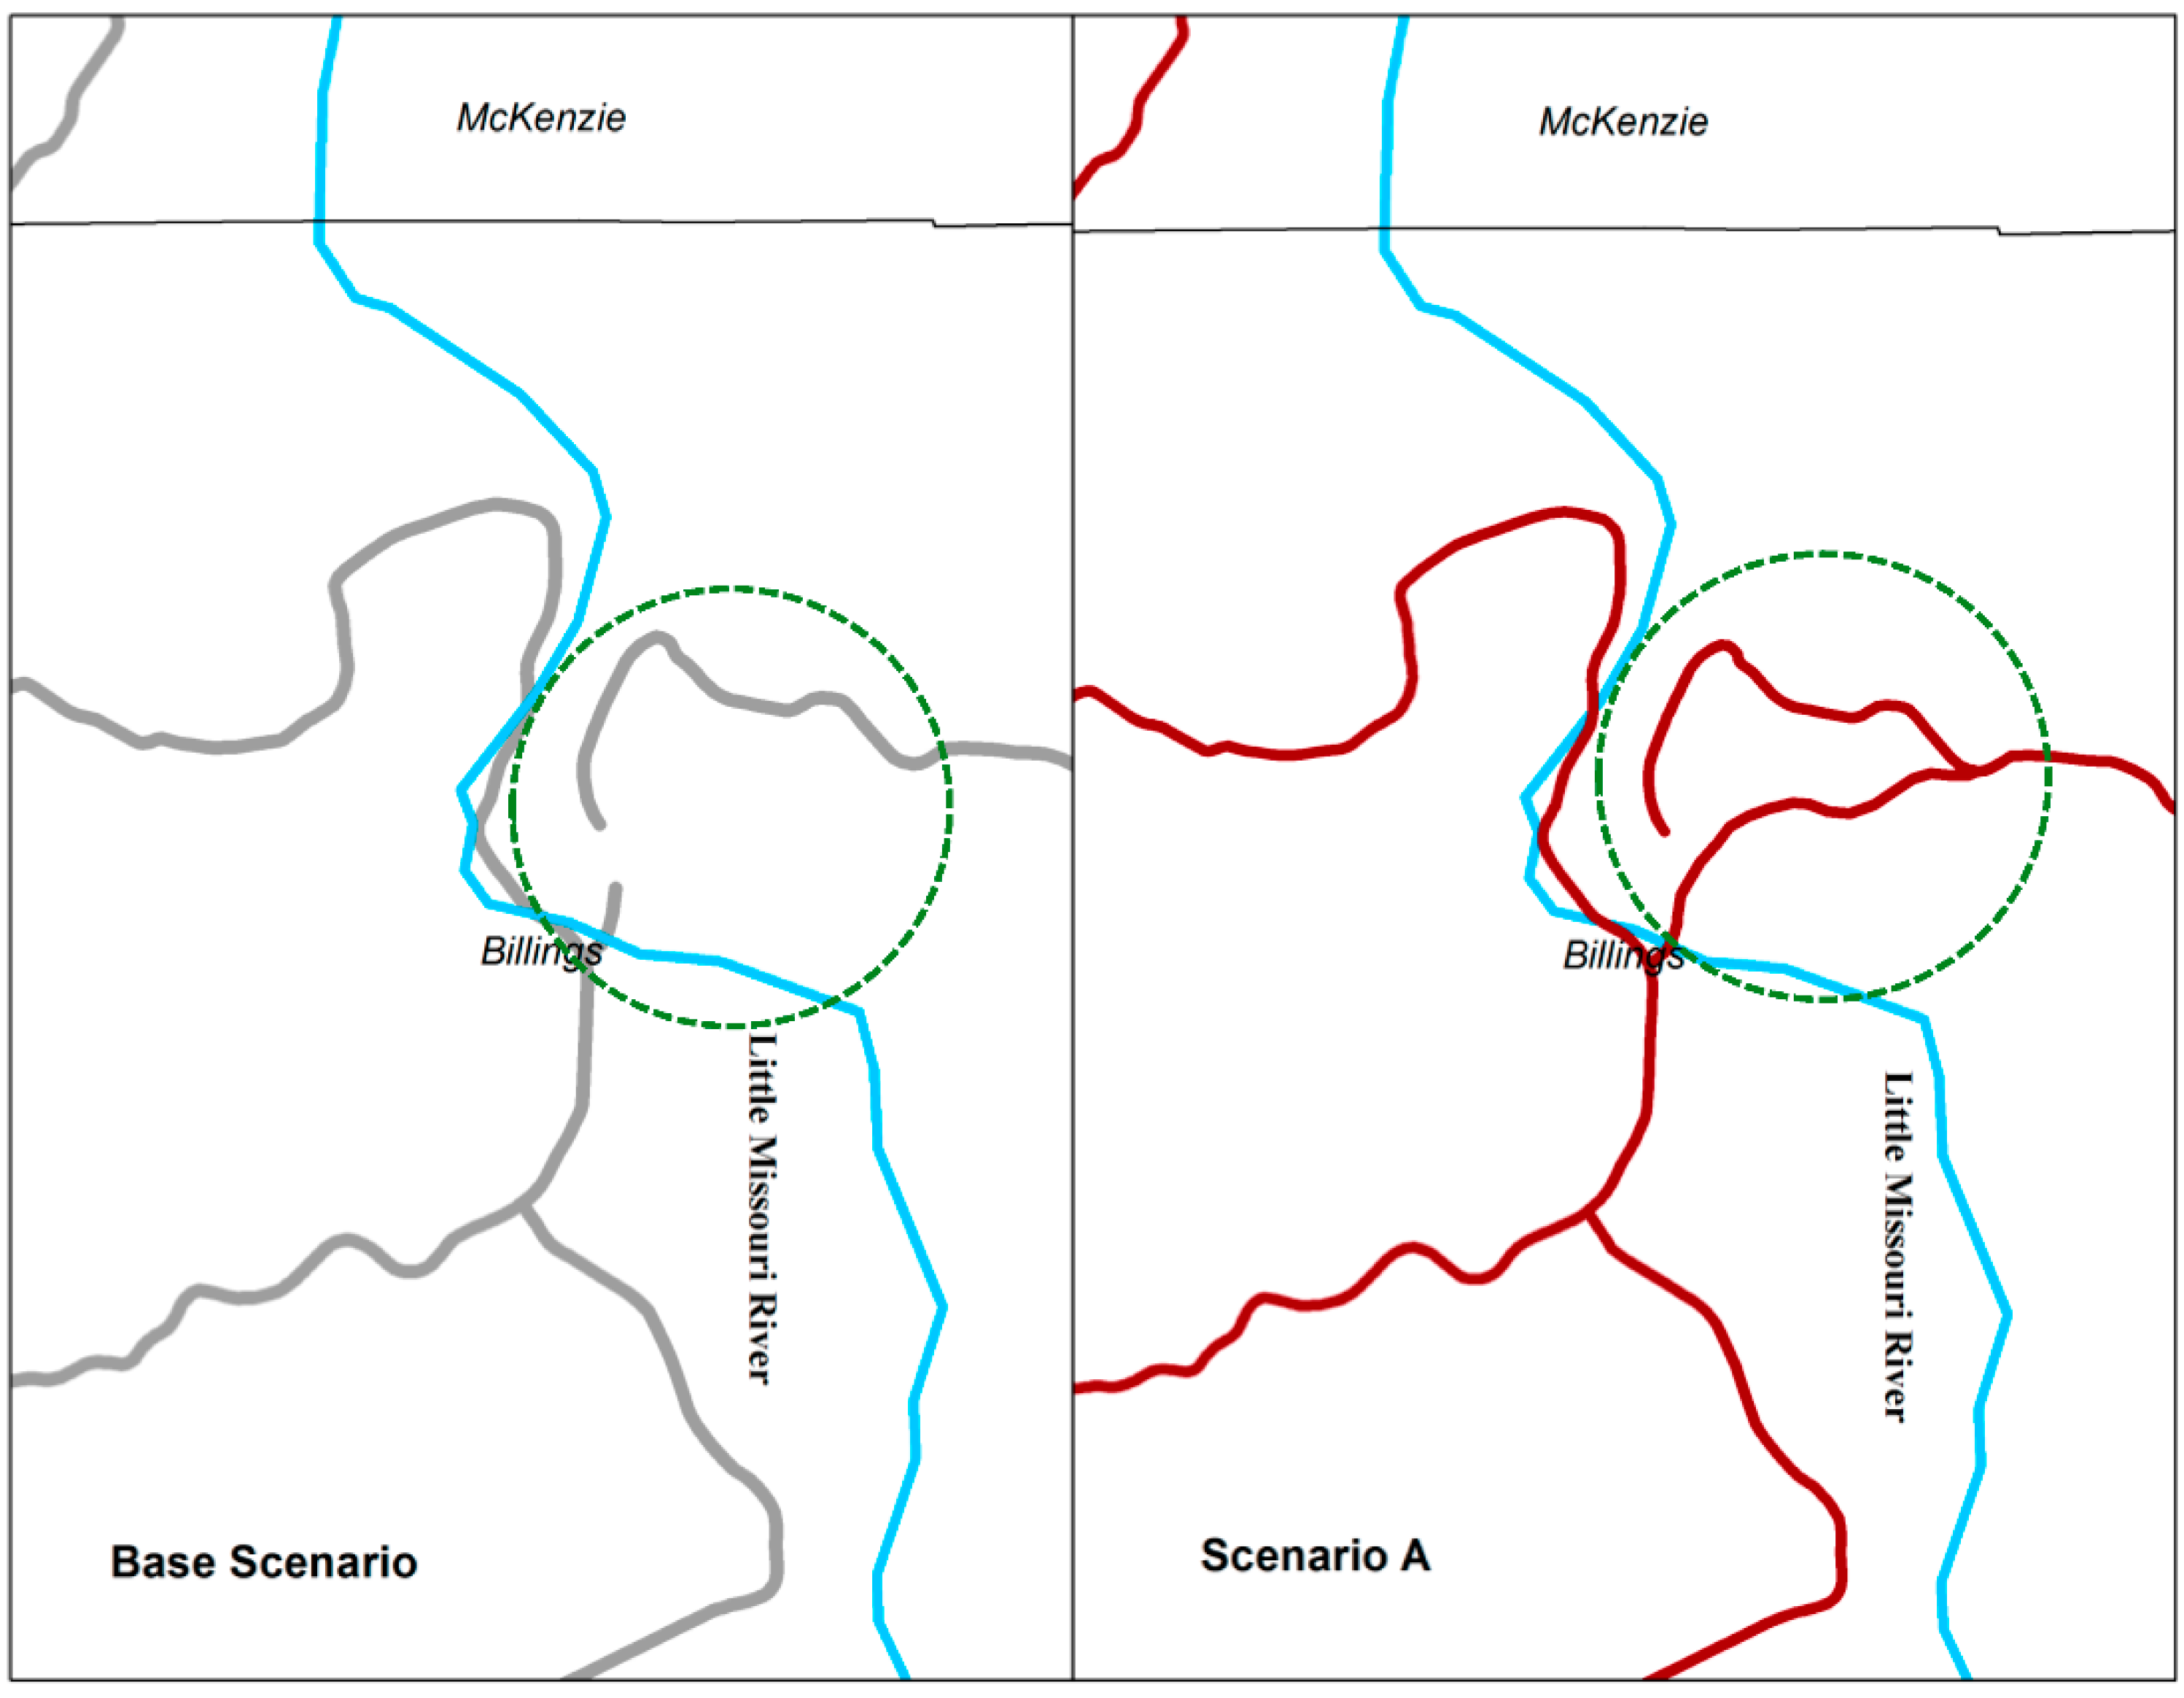
A GIS model was developed with all locations and routes as described in the traffic modeling section of the methodology. This model includes the network dataset for the county roads, and state and federal highways. Four different network datasets were created for the four scenarios. The base network dataset does not have a bridge in it. Network datasets for scenarios A, B, and C have an additional link representing the future bridge. This method is used to compare the traffic differences based on the various bridge scenarios and the base scenario with no bridge.
Figure 4 shows a detailed comparison between the different road networks. The base network in Billings County does not have a connected road network across the Little Missouri River while in scenario A, B, and C the road network is connected by the proposed bridges. As explained in the traffic modeling, different locations such as oil wells, saltwater disposal facilities, fresh water facilities, railroad transloading facilities, pipe transloading sites, and sand locations are added in the GIS map. These facilities are connected with each other, and the routes are generated. These routes are optimized as explained in the route assignment section of the methodology.
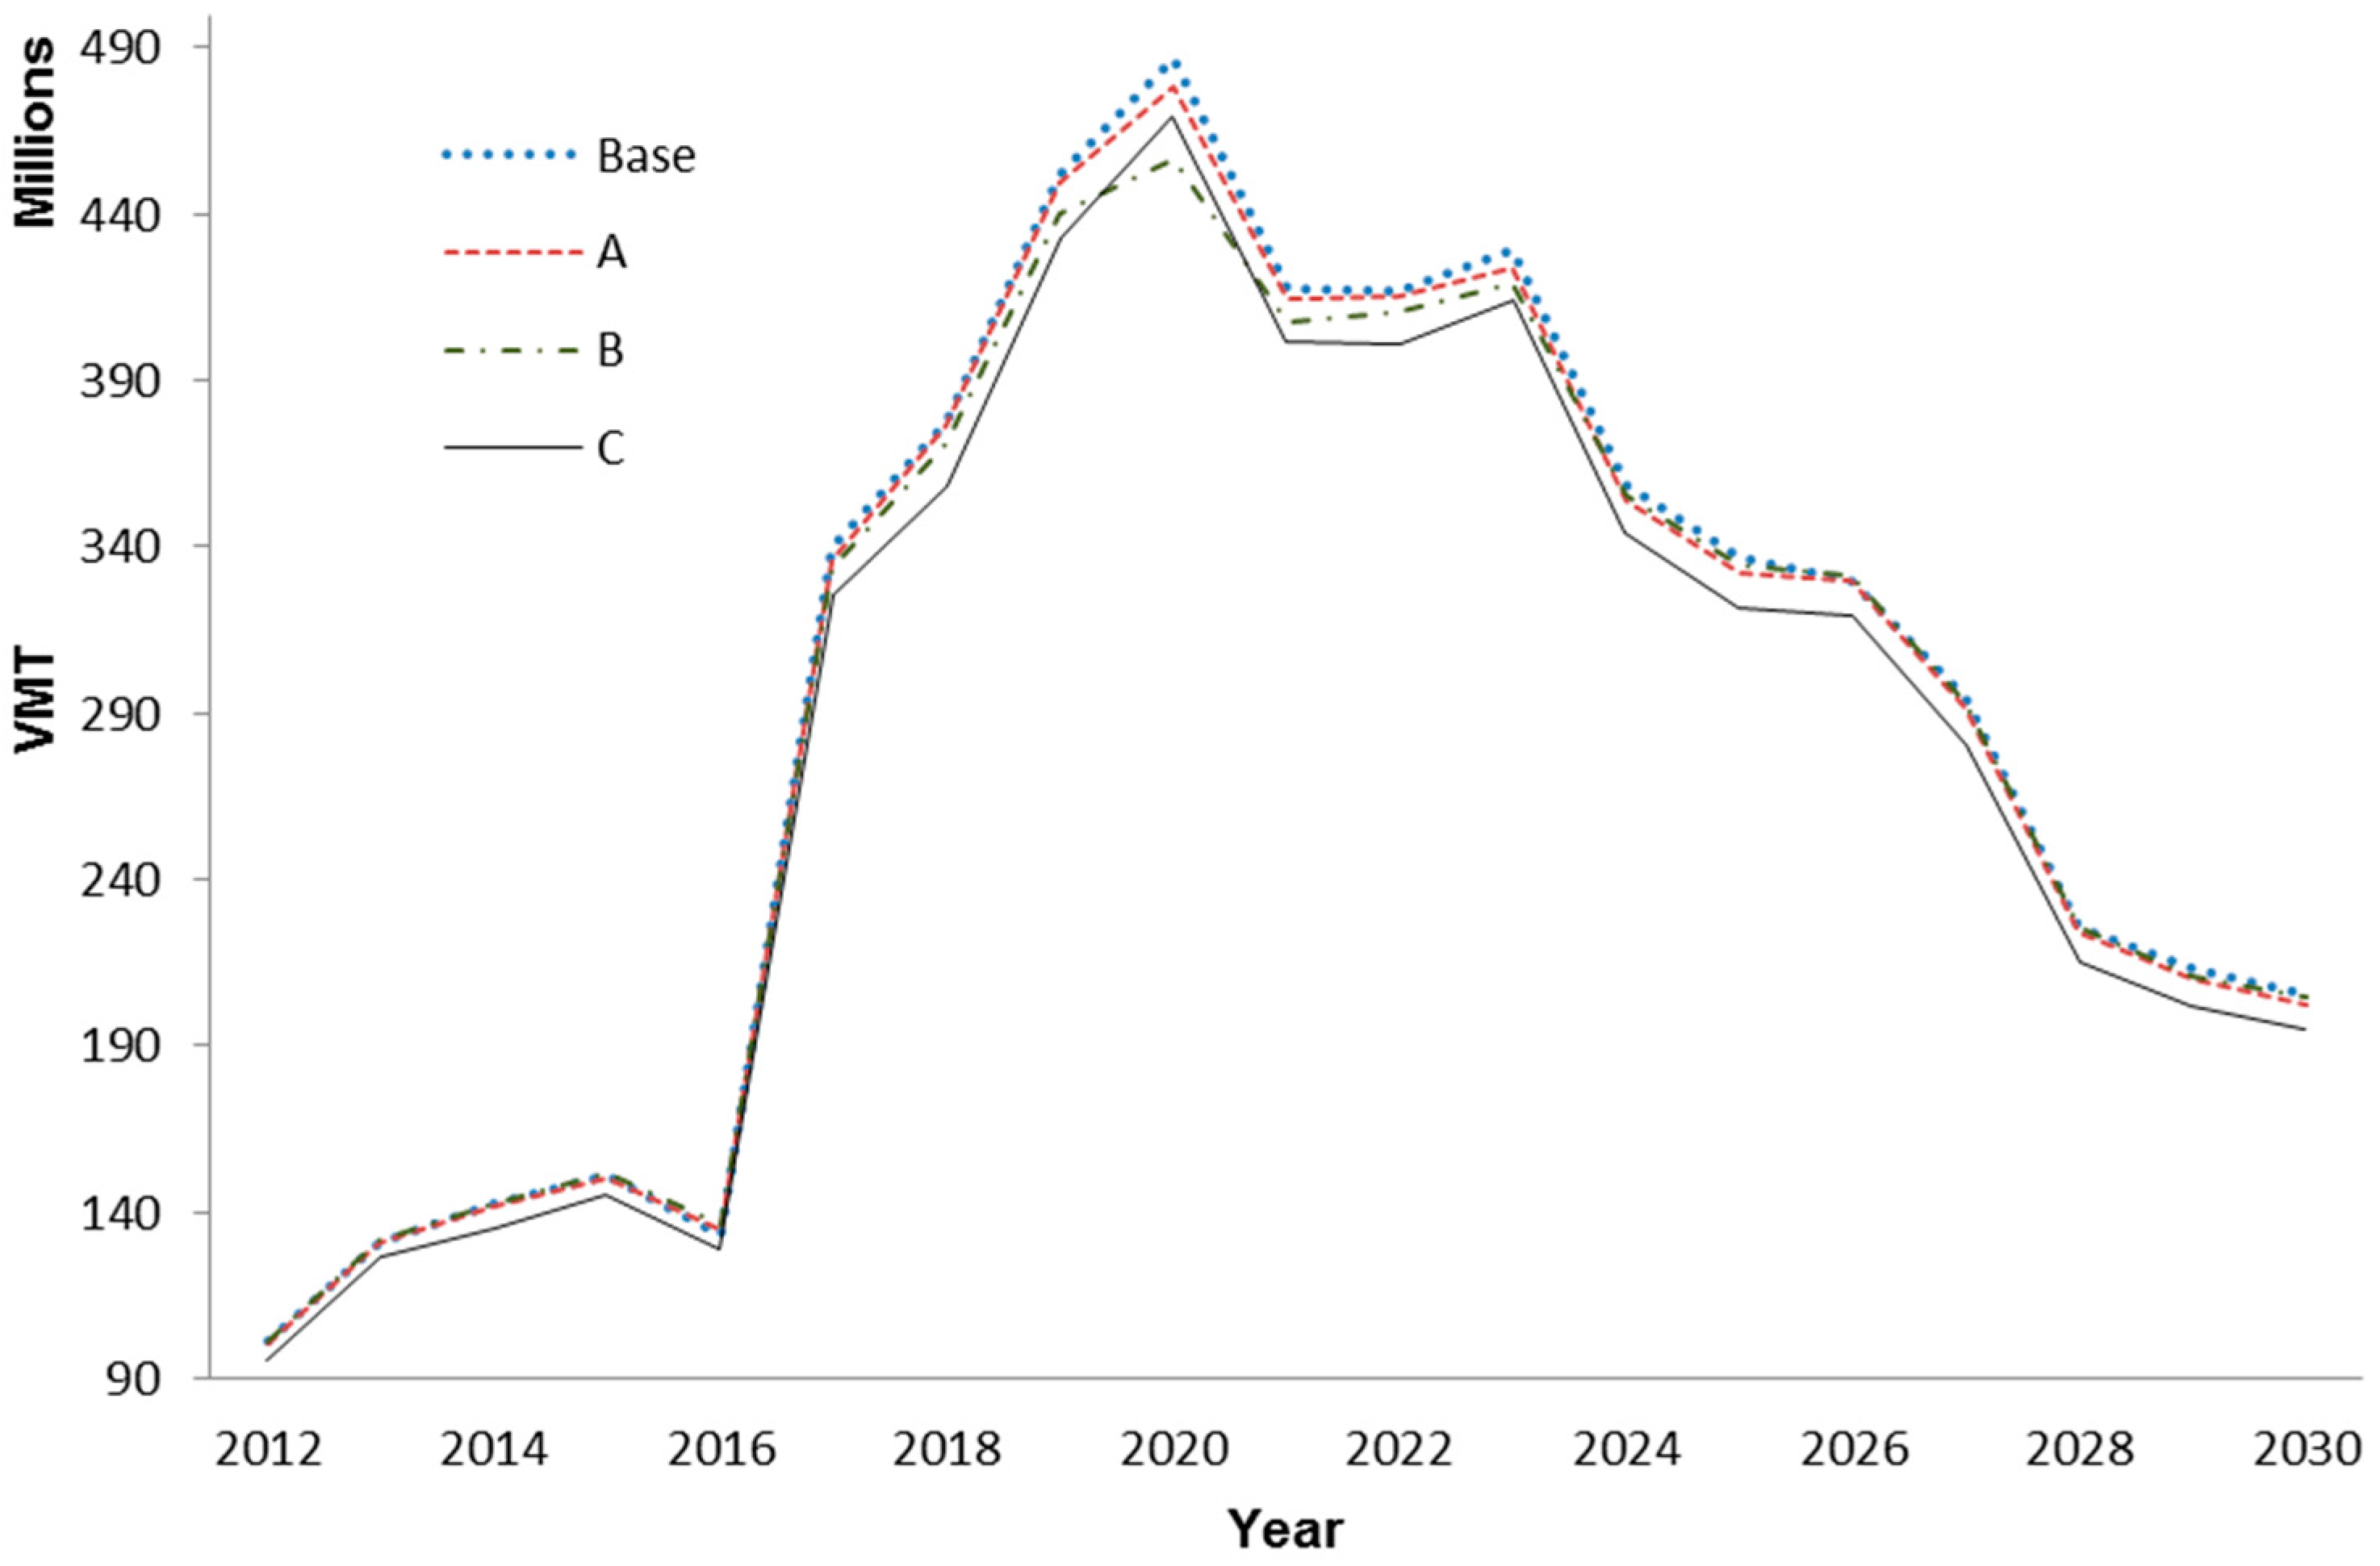
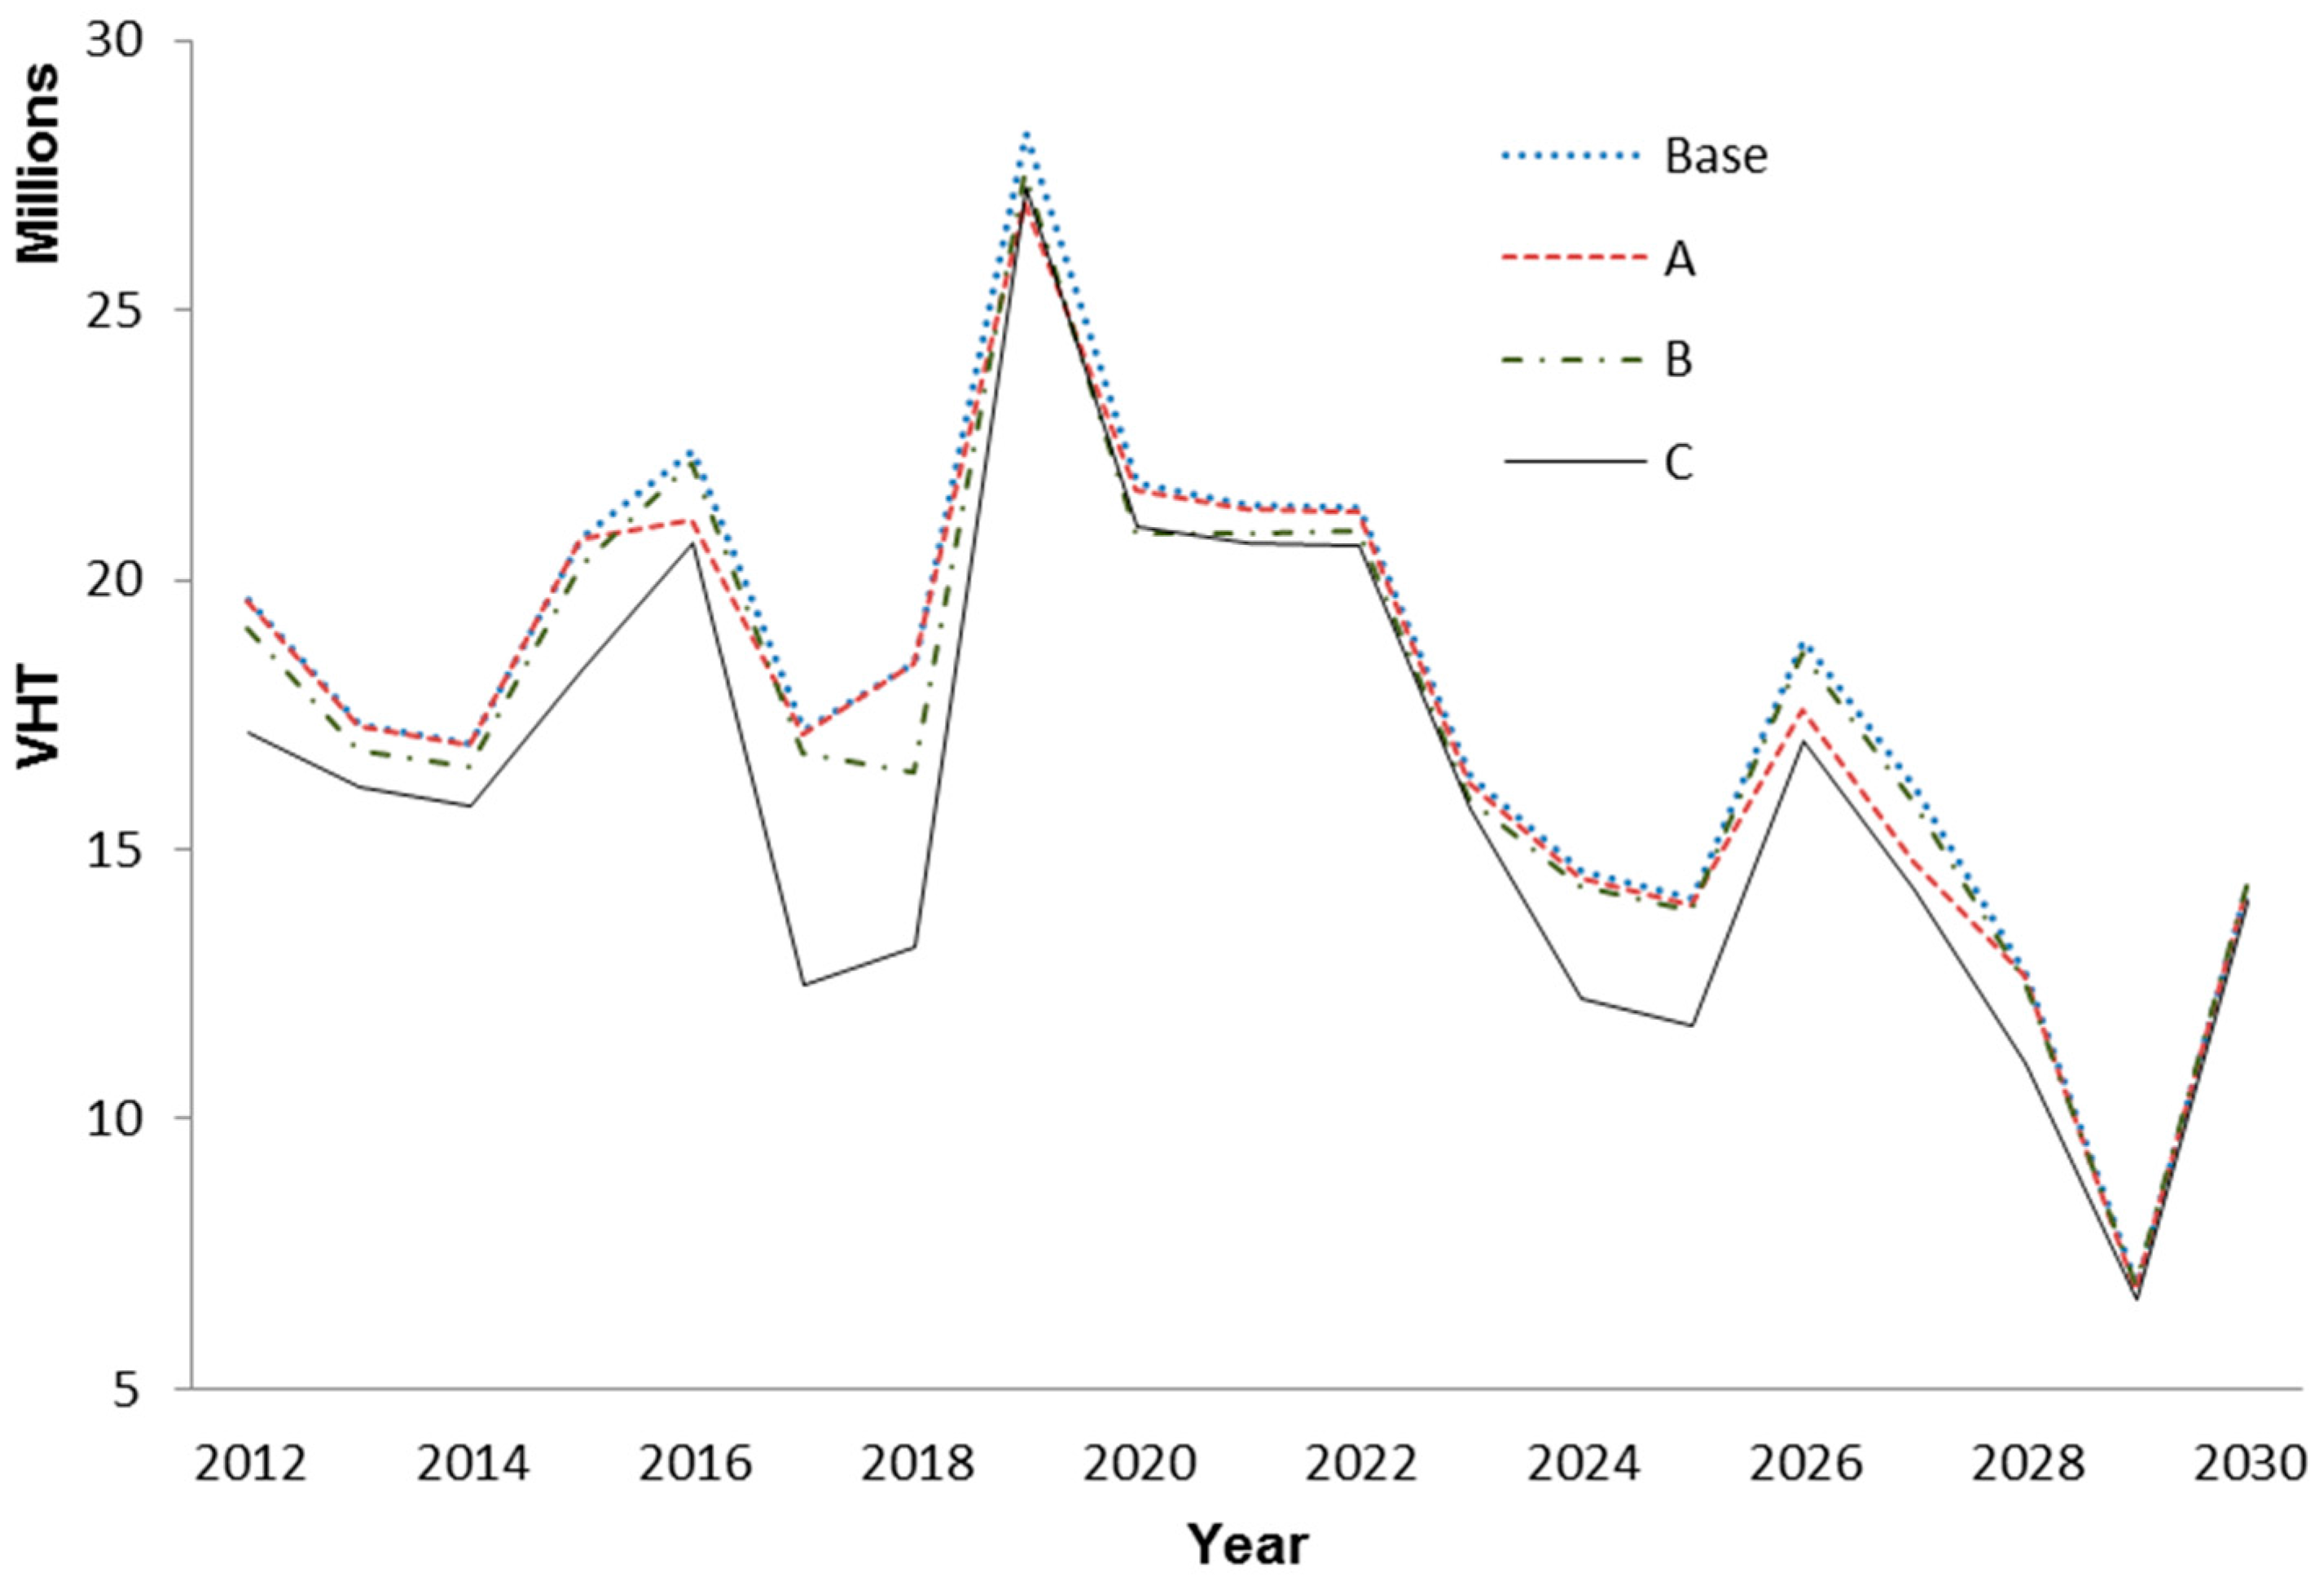
This analysis is performed for all four scenarios. The oil production forecast is used to generate the VMT and VHT values. Different values of VMT and VHT are generated based on the four different analyses. A distribution of VMT from 2012–2030 is shown in
Figure 5.
The forecast shows a gradual increase in oil exploration and production in North Dakota until the year 2020 and then decreases gradually. This trend is seen in
Figure 5 for the distribution of VMT. Similarly,
Figure 6 shows the VHT trend increases until the year 2020 and then gradually decreases. Note that the trends of VMT and VHT are not homogeneous because VMT heavily relies on drilling and production locations over the space, while VHT depends on VMT and road dynamics such as road classification, speed limit, and pavement types.
4.4. Benefit and Cost Calculation
The cost of the project for 20 years is calculated with the help of Equation 2, as explained in
Section 3 (Methodology). The first step in the cost calculation is to calculate the construction cost. The presentation published by Billings County [
25] presents the approximate lengths of the bridges for the three scenarios. An estimation of the deck area and the cost per square foot in North Dakota is used from documents published for Red River Diversion in Fargo, ND, USA [
30]. The cost calculation is shown in
Table 1.
Equation (3) is used to calculate the total project cost for the bridge. These costs are mentioned for different scenarios in
Table 2.
The benefit calculations are carried out with the help of VMT and VHT generated in the GIS modeling. These annual observations of VMT and VHT are summed to get total VMT and VHT in each year for the 20 years from 2012 to 2032. These VMT and VHT are then transferred into their dollar equivalents. VMT is converted to dollar equivalent by multiplying by the average cost of driving one mile, as shown by Equation (12).
The Energy Information Administration (EIA) website gives historical data for average fuel prices. From averaging the historical data for five years (2008 to 2012), the average fuel price used is $3.32 per gallon [
31]. Truck fuel mileage value is estimated at five miles/gal [
32]. Using Equation (12), the average cost of driving per mile is $ 0.664. The cost is multiplied by total VMT each year to get the total VMT dollar equivalent. It is assumed that the hourly labor and other cost is $20.00 based on the calculations of the cost of operating a truck for standard working hours. This is multiplied by VHT to get the total VHT dollar equivalent. This gives us the final dollar amount Equation (13) for each year. Thus, the total cost for each alternative scenario is the sum of the annual costs for the 20 years. This study uses a constant (
i.e., non-inflated) dollar with 0% based on the base year’s cost information over the 20 years [
33] since this study focuses on the comparison of scenarios to recommend the most suitable alternative. Even if the study applied a discount rate and inflation rate for public investment, it would equally increase the total benefits and costs for each scenario, resulting in no impact on the comparison
per se.
Total benefits are calculated by subtracting the dollar amount of the various bridge scenarios from the dollar amount of the base scenario using Equation 10. The total benefits over 20 years for the three scenarios are given in
Table 3.
4.5. Benefit-to-Cost (BTC) Ratio
The calculation of the benefit and cost are used to determine the final benefit-to-cost ratio (BTC ratio) generation. The BTC ratio is calculated using Equation (11). The BTC ratios for all three scenarios are given in
Table 4. All BTC ratios are more than 20 which, even in a conservative analysis, is a significant ratio for the investment.
4.6. Discussions
The benefit-to-cost ratios in all three scenarios are more than 20. This suggests that, from an investment point of view, all three scenarios are an efficient use of resources.
Table 4 suggests that Scenario C is the most desirable scenario. Scenario C will have the maximum savings in both miles travelled and hours travelled. Also, the construction cost of the Scenario C Bridge is comparable with the other scenario bridges. Though Scenario C is the best economic alternative, there is one important negative aspect to the scenario. Scenario C has an access road travelling through the Elkhorn Ranch, which is part of Theodore Roosevelt National Park. It is also a historically significant site. The potential impacts on this environmentally and historically sensitive area make Scenario C less attractive.
5. Conclusions and Future Research
As traffic volume in the oil-producing regions of the United States increases, it is critical to invest appropriately in transportation infrastructure to support freight logistics for this industry. This infrastructure development includes the construction of new roads, transformation of gravel roads to asphalt or concrete roads, and new bridge construction. The lifecycle benefit–cost analysis of bridge construction is an important part of new infrastructure development. Investment decisions should be supported with sound economic analysis, such as benefit–cost analysis. The methodology developed in this study can be applied to bridge construction projects in different oil producing regions. With a slight modification, this method can be applied in regions of agricultural importance too.
This method does not take into account the annual average daily traffic (AADT), but the number of annual truck trips. Consideration of AADT and the axle-load of wheeled vehicles will be a great source of information for the transportation planner. The current study only considers a 20-year forecast. Typically a bridge lifecycle analysis is carried out for more than 60 years. Traffic forecasting for more than 60 years can be added to get the additional values of VMT and VHT. This will also involve estimating rehabilitation and maintenance costs. Finally, this research does not include other costs such as: environmental costs, noise cost, costs reflecting affects to crop and livestock production, and direct and indirect benefits from the bridge. If those costs are available, they can be easily added to the equation to calculate the total cost.
The authors demonstrated a way of integrating geographic information systems, operations research, and data analytics to estimate the future traffic for evaluating infrastructure needs. Travel demand modeling is essential for the lifecycle benefit–cost analysis as a critical input source. The paper also shows that benefit–cost analysis explains the scenarios well for unique situations with conspicuous benefit-to-cost ratios.
This study would be helpful for government agencies and construction companies seeking a sound decision-making tool for new bridge construction projects. If they use the methodology outlined here, they should consider adding environmental costs and AADT to generate a detailed report of the bridge lifecycle benefit–cost analysis.
