A Novel Prairie Dog Optimization for Energy Management of Multi-Microgrid System Considering Uncertainty and Load Management
Abstract
1. Introduction
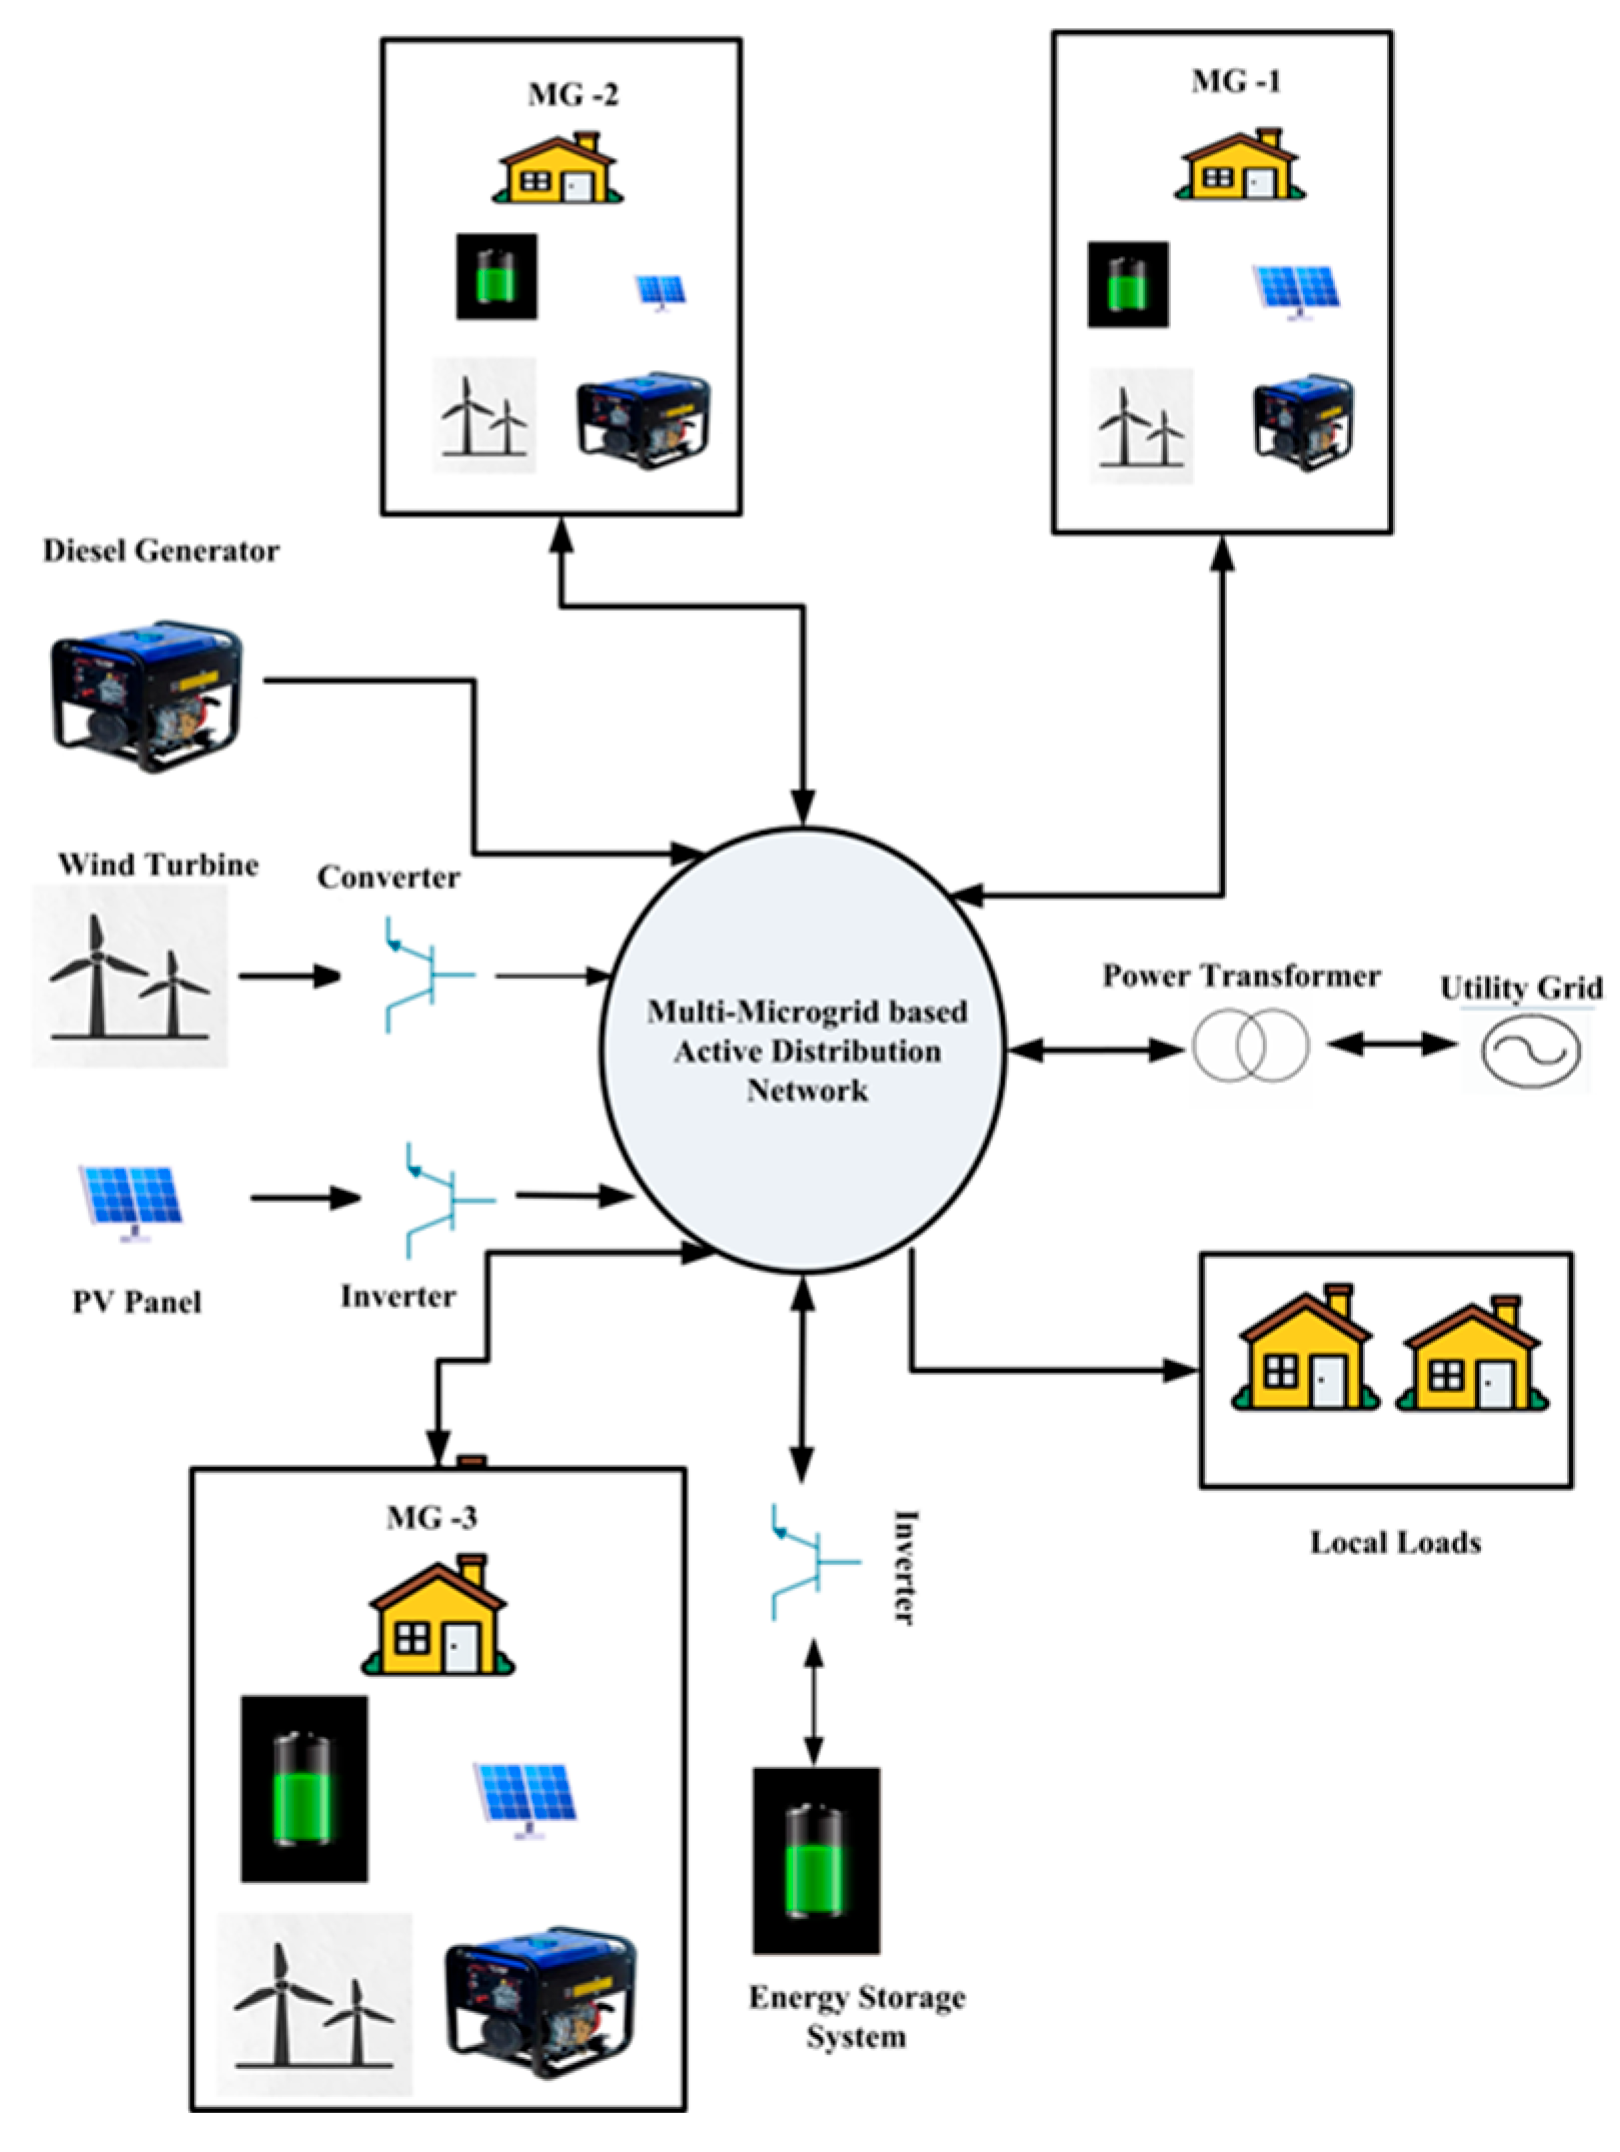
- To reduce energy costs and enhance system reliability while considering multiple operational constraints of the MMG system, a novel Prairie Dog Optimization (PDO) approach is implemented for a grid-connected multi-microgrid system.
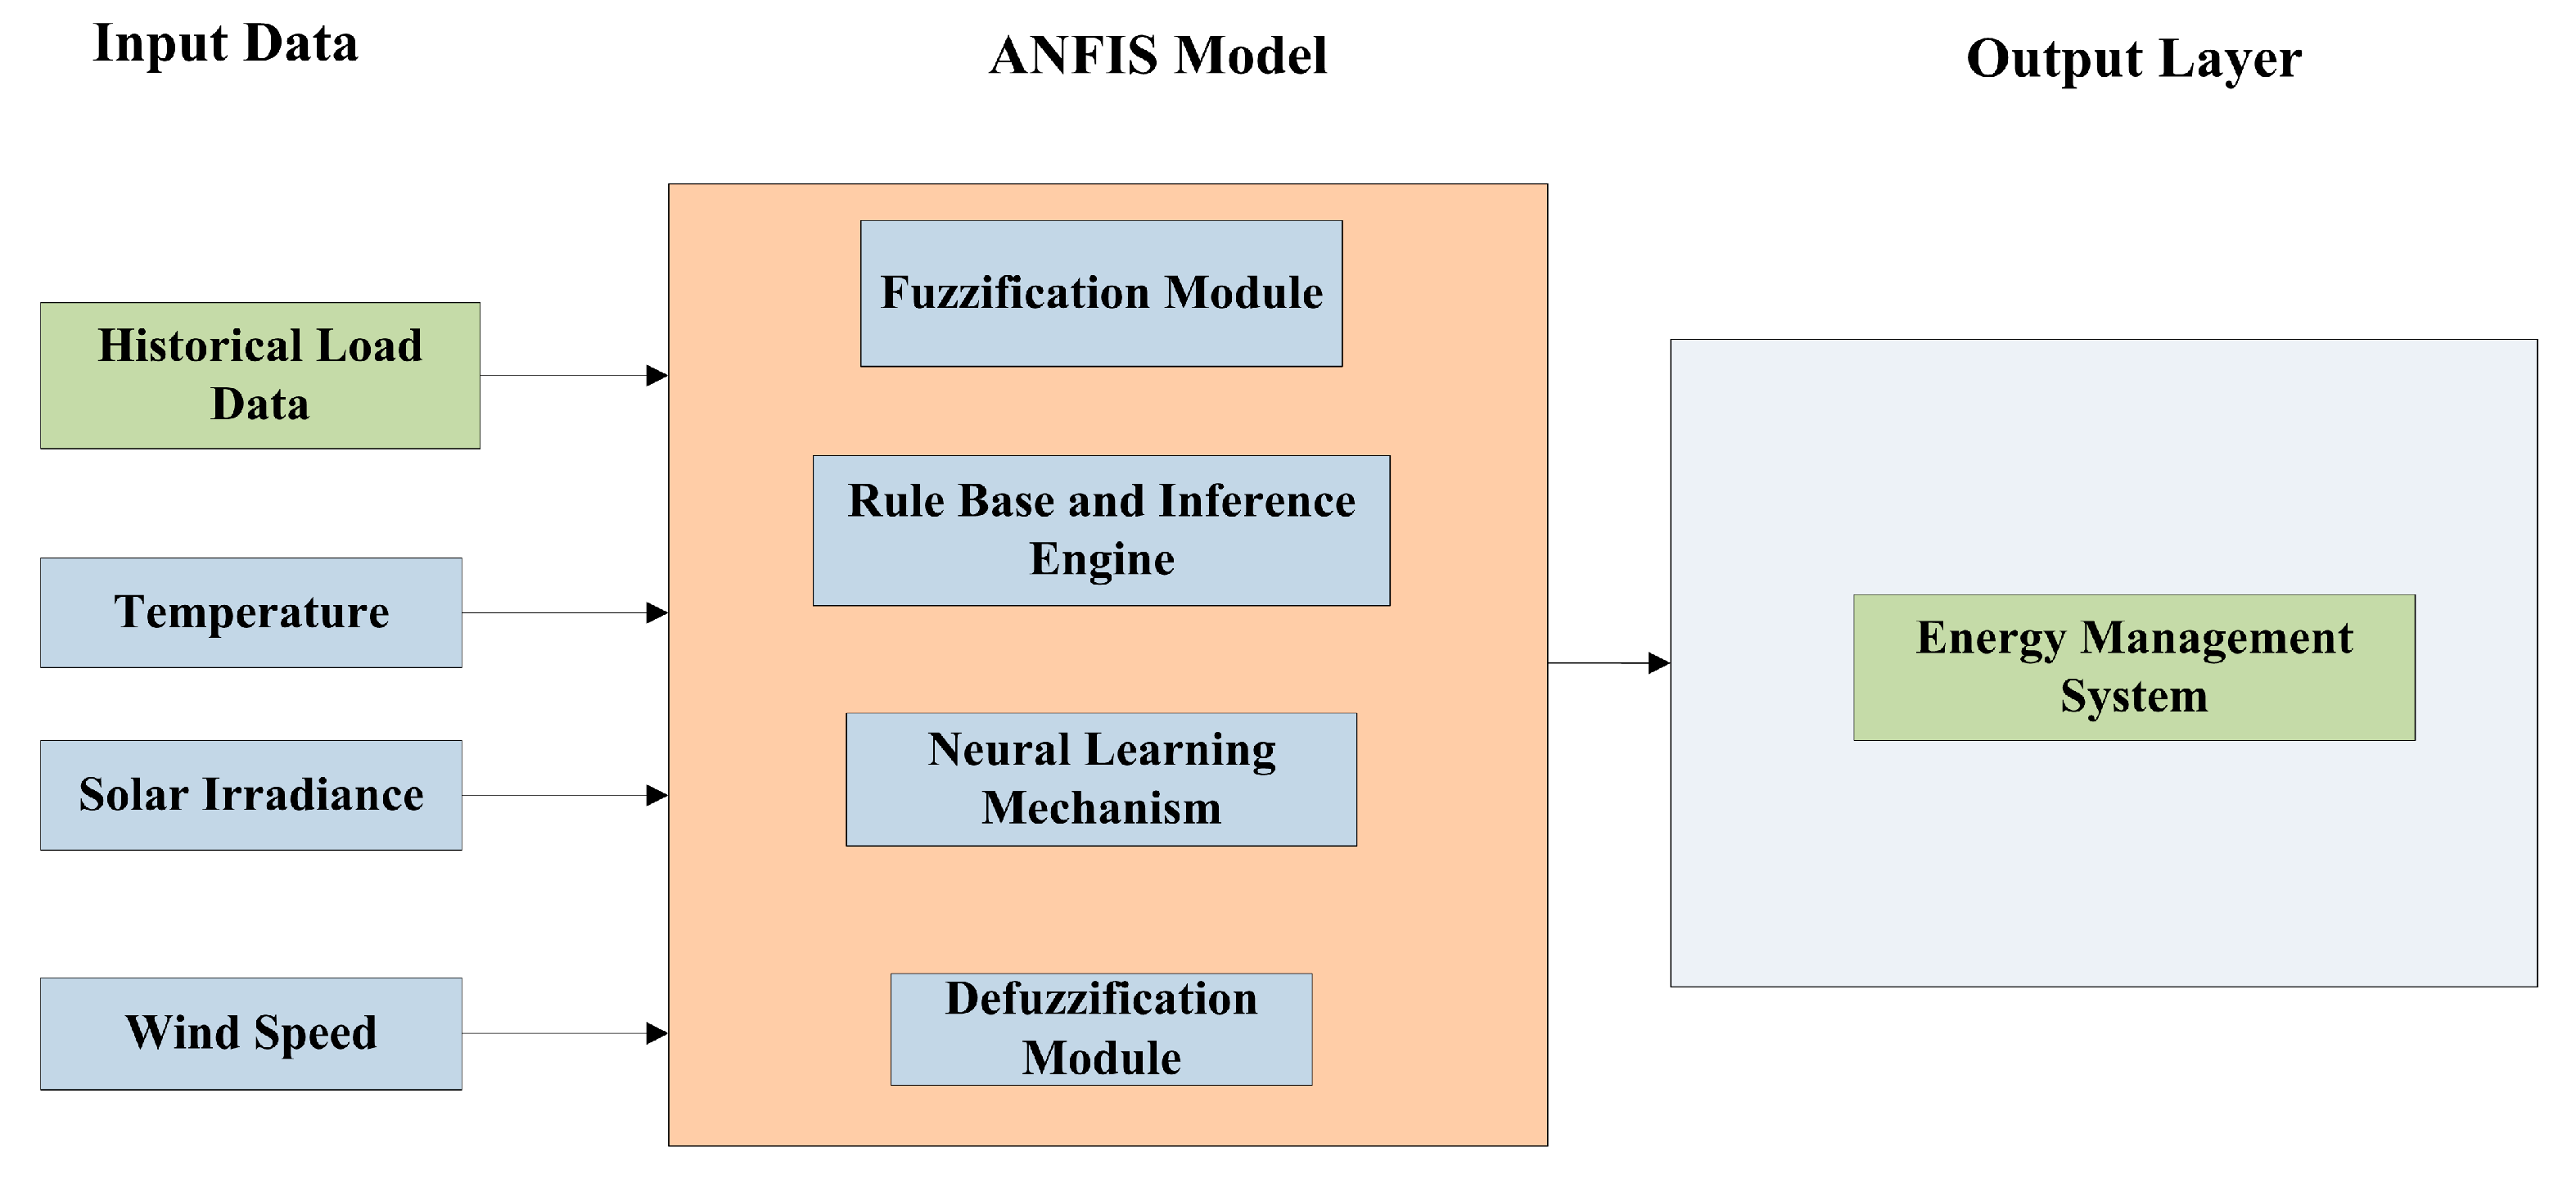
- To enhance MMG system reliability by considering uncertainties in wind speed, solar irradiation, load demand, energy prices, and BESS management, the ANFIS-based soft computing approach is implemented, which reduces the impact of scheduling discrepancies between generation and demand.
- A 24 h day-ahead scheduling approach was implemented to reduce operational costs, enhance generation reliability, and maximize resource utilization by considering factors like energy prices, load demand, and uncertainties in renewable energy sources (RES).
- A load management strategy was implemented based on load-shifting techniques to lower the operational costs of a multi-interconnected microgrid system during both grid-connected and islanded operating conditions.
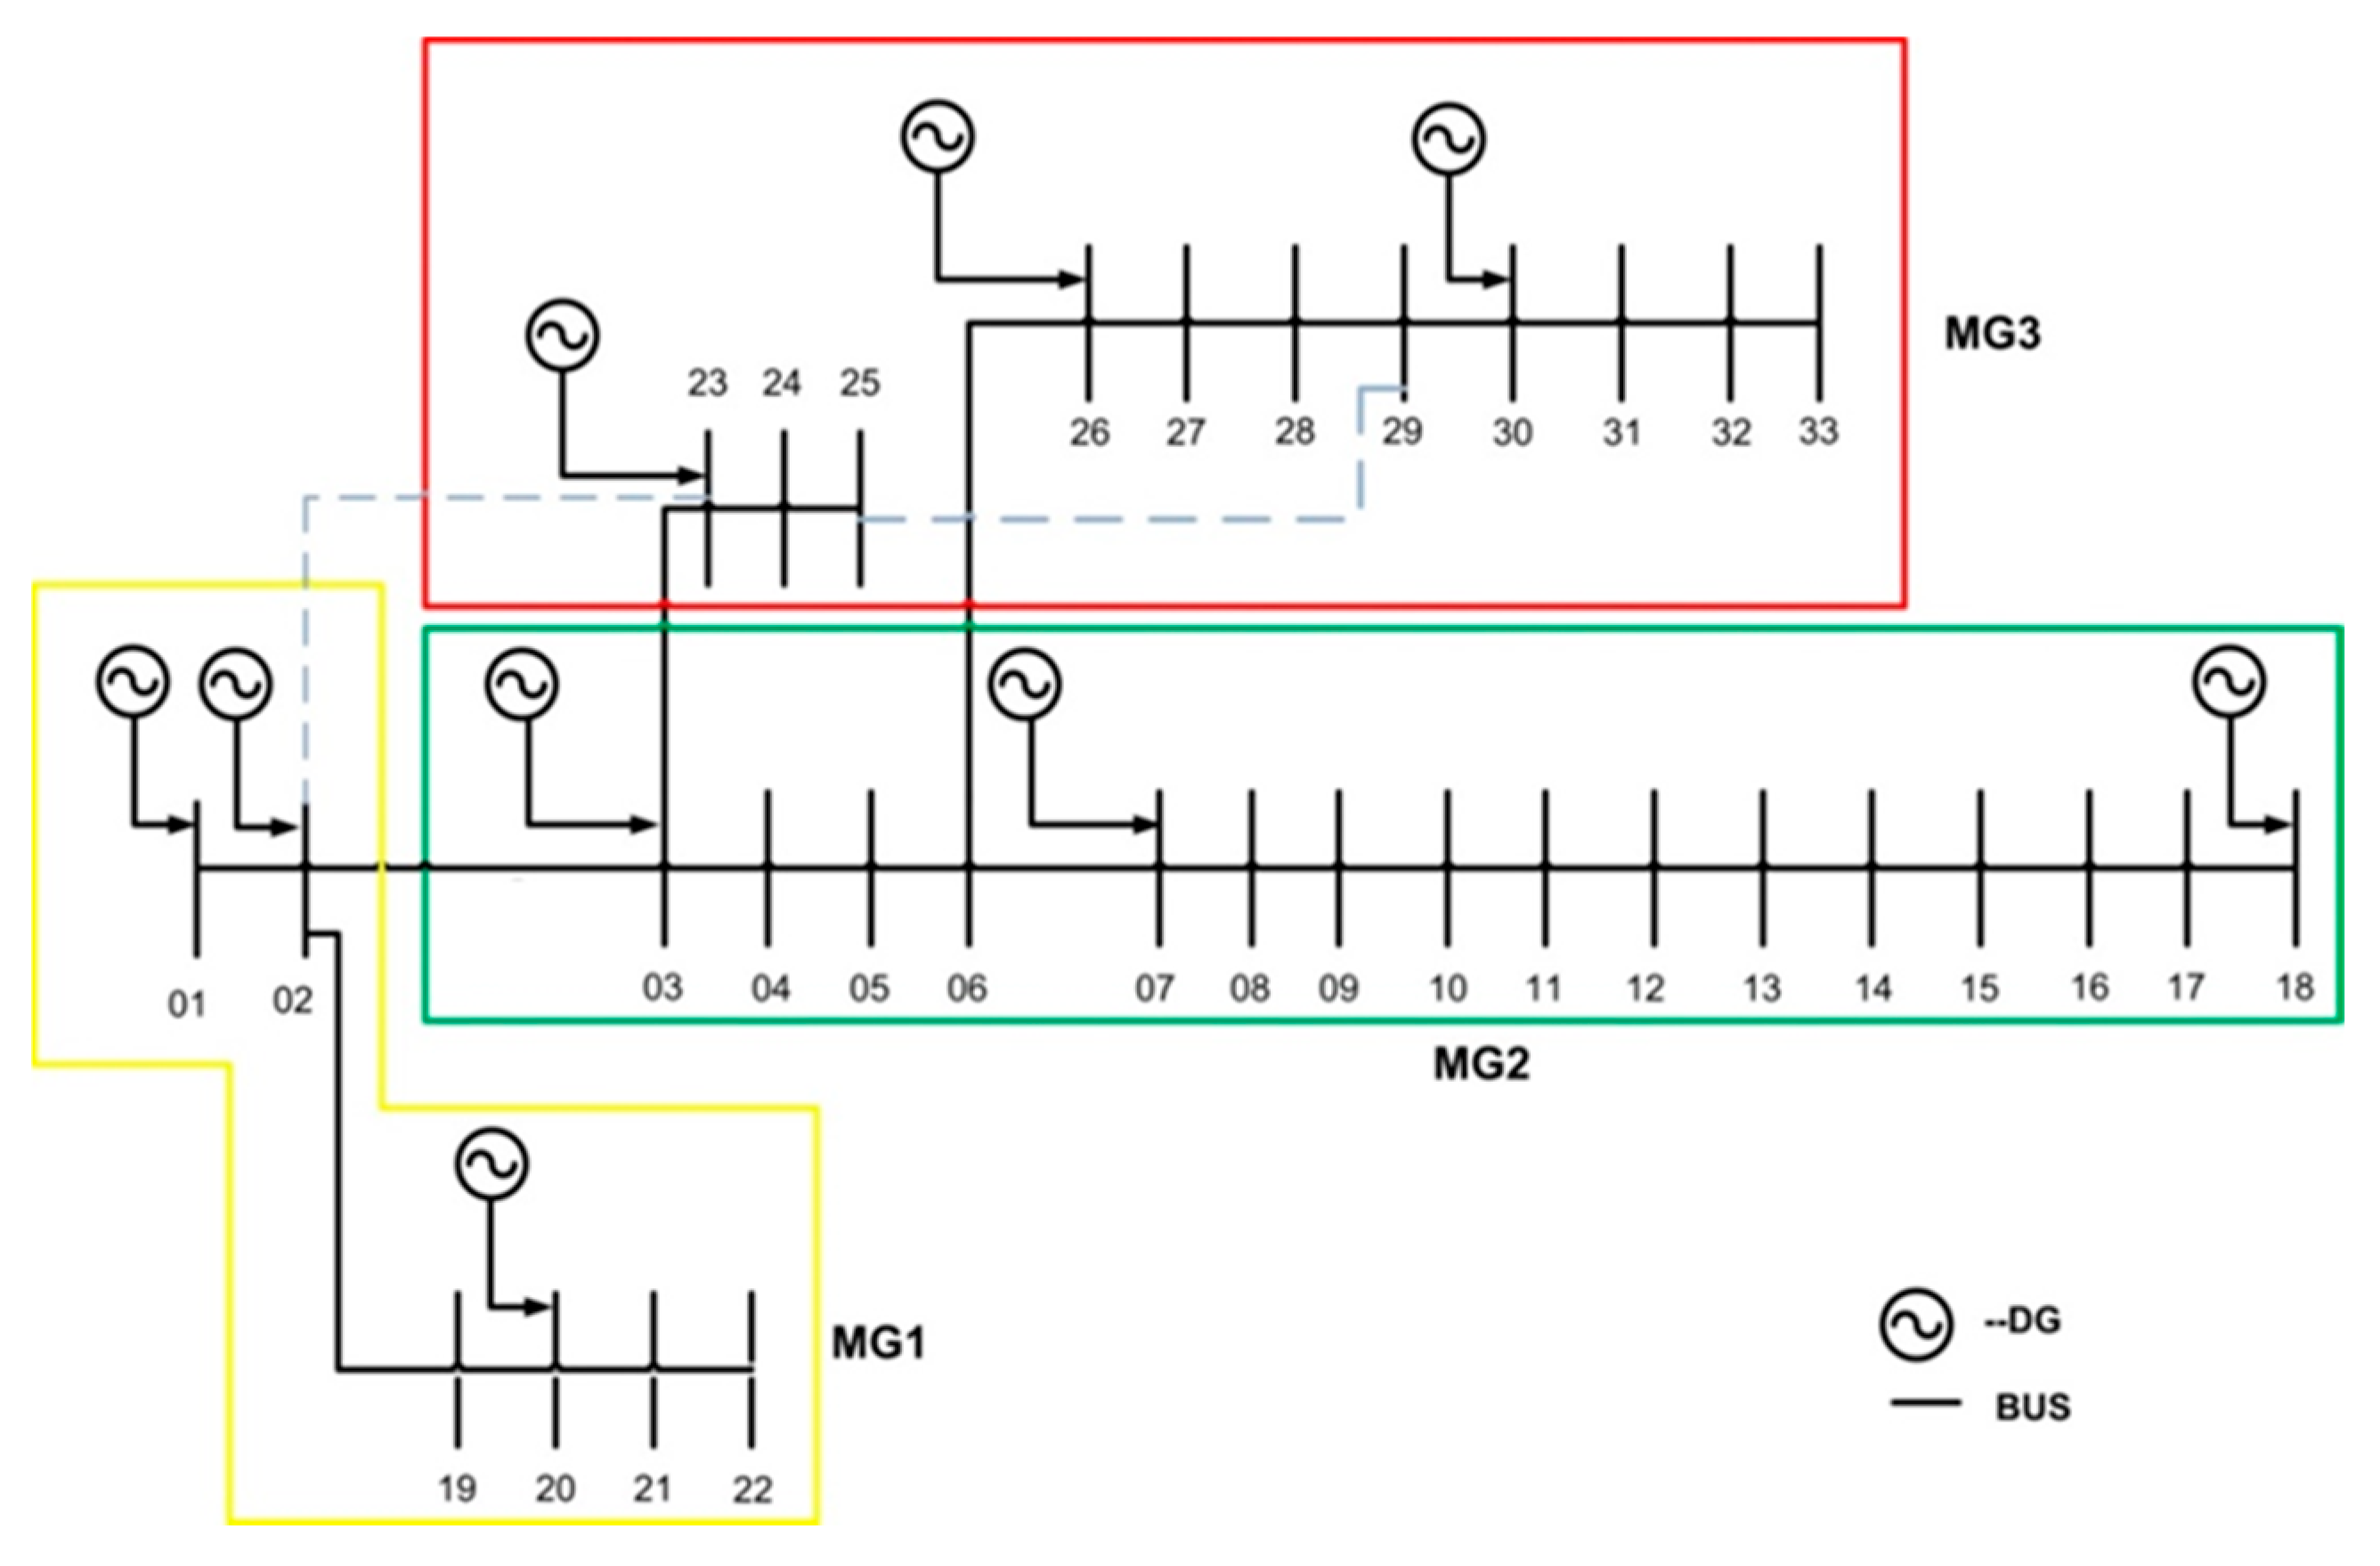
- Load growth and uncertainties in both DGs and loads were incorporated into the planning and operational strategies to ensure effective DG deployment.
2. Problem Formulation
2.1. Distributed Generation Modeling
2.1.1. Photovoltaic System Modeling
2.1.2. Modeling of Fuel Cell
2.1.3. Wind Turbine Modeling
2.2. Consideration of Load Growth
2.3. Uncertainty Modeling
2.4. Battery Energy Storage System
2.5. Loads
2.6. Problem Formulation of Energy Management and Objective Function
Objective Function (O.F)
3. Methodology
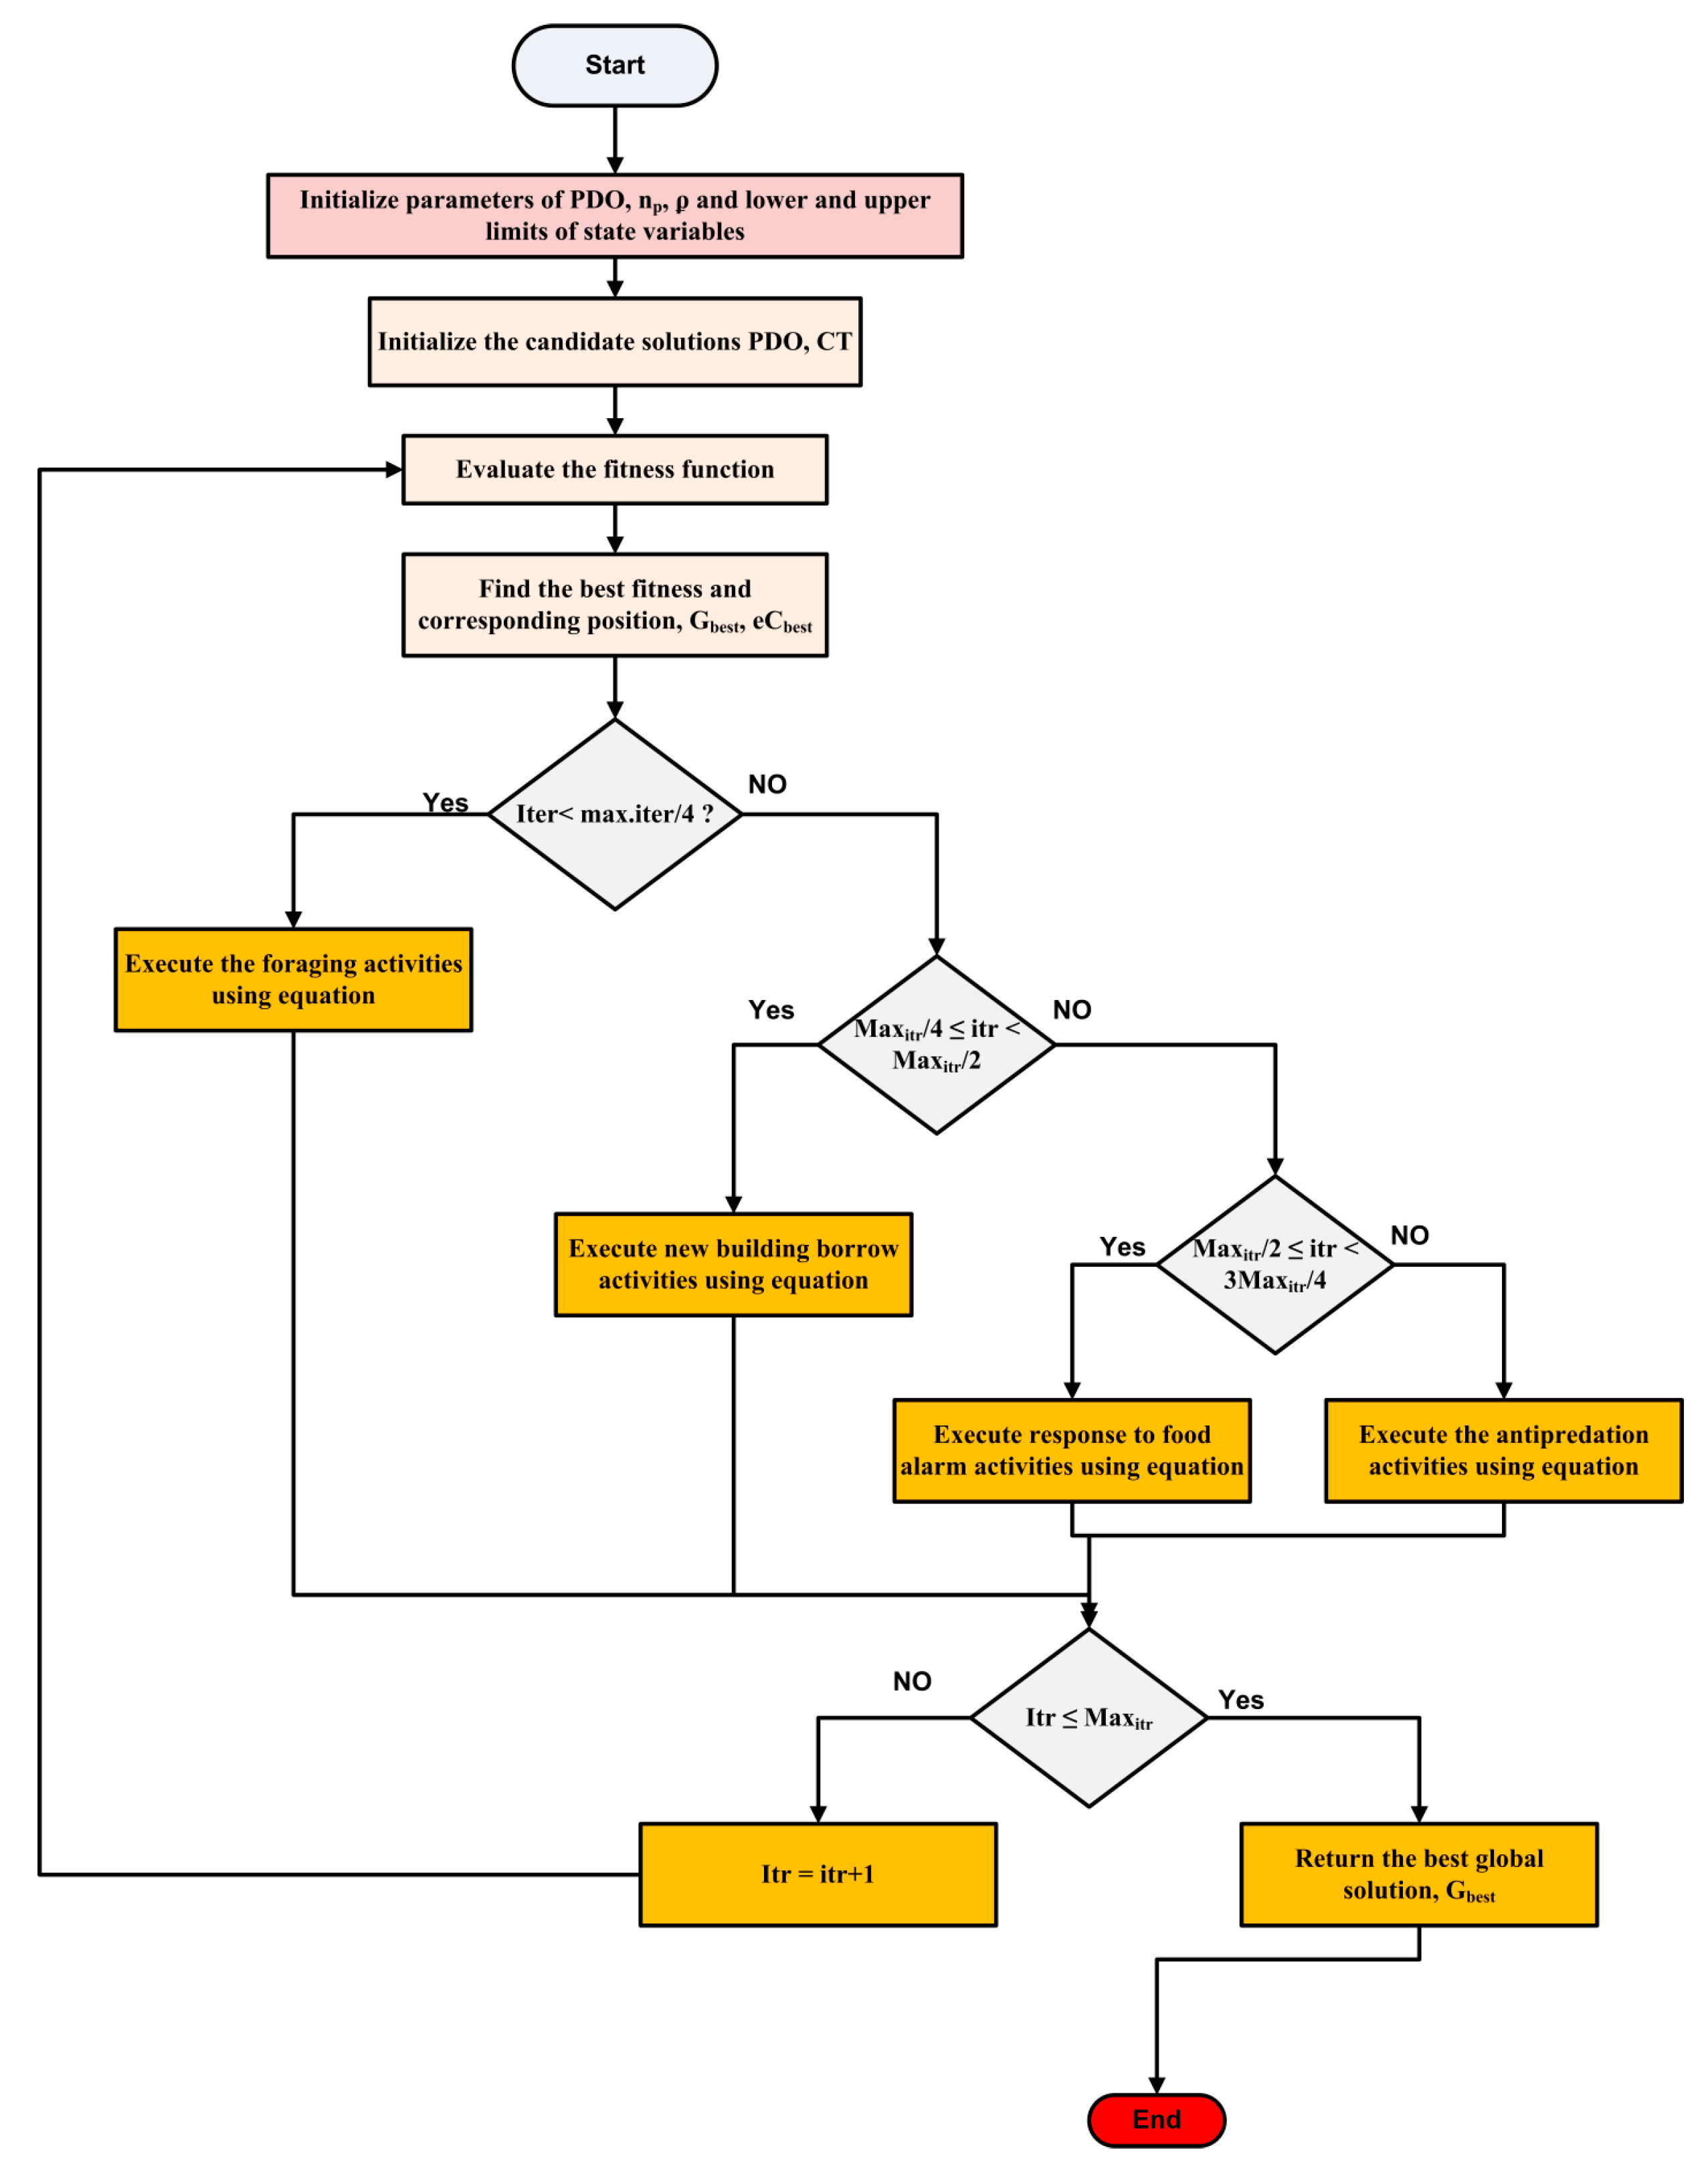
- The population comprises a specific number of prairie dogs, denoted by np, which are grouped into m cliques.
- The entire population is distributed across multiple precincts, with members of the same clique assigned within the same precinct.
- At the start, each precinct contains ten burrows, and this number progressively increases to 100 as iterations advance.
- Two distinct types of signals are considered: one for identifying new food sources and another for implementing anti-predator strategies.
- The optimization process is divided into two primary phases: the exploration phase, dedicated to searching for resources and creating burrows, and the exploitation phase, which concentrates on defensive actions against predators.
- Similar processes are conducted by other cliques within their respective precincts, and the search space is partitioned accordingly.
- These exploration and exploitation procedures are iteratively performed based on the number of existing cliques in the system.
3.1. Exploitation Phase
3.2. Flow Chart
3.3. ANFIS-Based Forecast of PV and Wind Uncertainty
3.4. Performance Parameters of the Proposed Prairie Dog Optimization Algorithm
3.4.1. Overall System Loss Index (OVSLI)
3.4.2. Energy Generation Cost Index of the Multi-Microgrid System (EGCI)
3.4.3. Greenhouse Gas Emission Factor (GGEF)
4. Simulation Results and Discussion
4.1. Validation of Proposed Prairie Dog Optimization
4.1.1. Statistical Results
4.1.2. Convergence Characteristics
4.1.3. Analysis Using the Wilcoxon Rank-Sum Test
4.2. Simulation Results of Proposed Prairie Dog Optimization for Energy Management Problem of Multi-Microgrid Systems
5. Conclusions
Limitations and Future Scope
Author Contributions
Funding
Data Availability Statement
Conflicts of Interest
Nomenclature
| EMS | Energy Management System |
| DG | Distributed Generation |
| MMG | Multi-Microgrid |
| DER | Distributed Energy Resources |
| PDO | Prairie Dog Optimization |
| EGC | Energy Generation Cost |
| PPSD | Probability of Power Supply Deficit |
| MOO | Multi-Objective Optimization |
| PV | Photovoltaic Modules |
| GWO | Grey Wolf Optimization |
| PSO | Particle Swarm Optimization |
| MINLP | Mixed Integer Non-Linear Programming |
| DR | Demand Response |
| BESS | Battery Energy Storage System |
| EA | Evolutionary Algorithm |
| TSA | Tabu Search Algorithm |
| WOA | Whale Optimization Algorithm |
References
- Voumik, L.C.; Islam, A.; Ray, S.; Yusop, N.Y.M.; Ridzuan, A.R. CO2 emissions from renewable and non-renewable electricity generation sources in the g7 countries: Static and dynamic panel assessment. Energies 2023, 16, 1044. [Google Scholar] [CrossRef]
- Ndeke, C.B.; Adonis, M.; Almaktoof, A. Energy management strategy for a hybrid micro-grid system using renewable energy. Discov. Energy 2024, 4, 1. [Google Scholar] [CrossRef]
- Mitra, J.; Vallem, M.R.; Singh, C. Optimal deployment of distributed generation using a reliability criterion. IEEE Trans. Ind. Appl. 2016, 52, 1989–1997. [Google Scholar] [CrossRef]
- Mavuri, S.S.; Nakka, J. Economic scheduling and dispatching of distributed generators considering uncertainties in modified 33-bus and modified 69-bus system under different microgrid regions. Trans. Energy Syst. Eng. Appl. 2024, 5, 1–22. [Google Scholar] [CrossRef]
- Srinivasarathnam, C.; Yammani, C.; Maheswarapu, S. Multi-Objective Jaya Algorithm for Optimal Scheduling of DGs in Distribution System Sectionalized into Multi-Microgrids. Smart Sci. 2019, 7, 59–78. [Google Scholar] [CrossRef]
- Kamal, T.; Karabacak, M.; Perić, V.S.; Hassan, S.Z.; Fernández-Ramírez, L.M. Novel Improved Adaptive Neuro-Fuzzy Control of Inverter and Supervisory Energy Management System of a Microgrid. Energies 2020, 13, 4721. [Google Scholar] [CrossRef]
- Hassan, S.; Li, H.; Kamal, T.; Arifoğlu, U.; Mumtaz, S.; Khan, L. Neuro-Fuzzy Wavelet Based Adaptive MPPT Algorithm for Photovoltaic Systems. Energies 2017, 10, 394. [Google Scholar] [CrossRef]
- Yi, J.; Lyons, P.F.; Davison, P.J.; Wang, P.; Taylor, P.C. Robust Scheduling Scheme for Energy Storage to Facilitate High Penetration of Renewables. IEEE Trans. Sustain. Energy 2016, 7, 797–807. [Google Scholar] [CrossRef]
- Marín, L.G.; Sumner, M.; Muñoz-Carpintero, D.; Köbrich, D.; Pholboon, S.; Sáez, D.; Núñez, A. Hierarchical Energy Management System for Microgrid Operation Based on Robust Model Predictive Control. Energies 2019, 12, 4453. [Google Scholar] [CrossRef]
- Mavuri, S.S.; Nakka, J.; Kotla, A. Interconnected Microgrids: A Review and Future perspectives. In Proceedings of the 2022 IEEE 2nd International Conference on Sustainable Energy and Future Electric Transportation (SeFeT), Hyderabad, India, 4–6 August 2022; pp. 1–7. [Google Scholar] [CrossRef]
- Guo, L.; Liu, W.; Li, X.; Liu, Y.; Jiao, B.; Wang, W.; Wang, C.; Li, F. Energy Management System for Stand-Alone Wind-Powered-Desalination Microgrid. IEEE Trans. Smart Grid 2016, 7, 1079–1087. [Google Scholar] [CrossRef]
- Sayed, K.; Abo-Khalil, A.G.; S Alghamdi, A. Optimum Resilient Operation and Control DC Microgrid Based Electric Vehicles Charging Station Powered by Renewable Energy Sources. Energies 2019, 12, 4240. [Google Scholar] [CrossRef]
- Eyimaya, S.E.; Altin, N. Review of Energy Management Systems in Microgrids. Appl. Sci. 2024, 14, 1249. [Google Scholar] [CrossRef]
- Bai, J.; Wei, W.; Guo, Z.; Chen, L.; Mei, S. Two-timescale coordinated operation of wind-advanced adiabatic compressed air energy storage system: A bilevel stochastic dynamic programming method. J. Energy Storage 2023, 67, 107502. [Google Scholar] [CrossRef]
- Zhang, Y.; Song, X.; Li, Y.; Zeng, Z.; Yong, C.; Sidorov, D.; Lv, X. Two-Stage Active and Reactive Power Coordinated Optimal Dispatch for Active Distribution Network Considering Load Flexibility. Energies 2020, 13, 5922. [Google Scholar] [CrossRef]
- Alshehri, M.A.H.; Guo, Y.; Lei, G. Energy Management Strategies of Grid-Connected Microgrids under Different Reliability Conditions. Energies 2023, 16, 3951. [Google Scholar] [CrossRef]
- Mutarraf, M.; Terriche, Y.; Niazi, K.A.K.; Khan, F.; Vasquez, J.; Guerrero, J. Control of hybrid diesel/PV/battery/ultra-capacitor systems for future shipboard microgrids. Energies 2019, 12, 3460. [Google Scholar] [CrossRef]
- Gilev, B.; Andreev, M.; Hinov, N.; Angelov, G. Modeling and Simulation of a Low-Cost Fast Charging Station Based on a Micro Gas Turbine and a Supercapacitor. Energies 2022, 15, 8020. [Google Scholar] [CrossRef]
- Kumar, R.P.; Karthikeyan, G. A multi-objective optimization solution for distributed generation energy management in microgrids with hybrid energy sources and battery storage system. Energies 2023, 16, 109702. [Google Scholar] [CrossRef]
- HassanzadehFard, H.; Jalilian, A. Optimal sizing and location of renewable energy based DG units in distribution systems considering load growth. Int. J. Electr. Power Energy Syst. 2018, 101, 356–370. [Google Scholar] [CrossRef]
- Thirunavukkarasu, G.S.; Seyedmahmoudian, M.; Jamei, E.; Horan, B.; Mekhilef, S.; Stojcevski, A. Role of optimization techniques in microgrid energy management systems—A review. Energy Strategy Rev. 2022, 43, 100899. [Google Scholar] [CrossRef]
- Kharrich, M.; Mohammed, O.H.; Alshammari, N.; Akherraz, M. Multi-Objective Optimization and the Effect of the Economic Factors on the Design of the Microgrid Hybrid System. Sustain. Cities Soc. 2021, 65, 102646. [Google Scholar] [CrossRef]
- Ennassiri, Y.; de-Simón-Martín, M.; Bracco, S.; Robba, M. Energy Management System for Polygeneration Microgrids, Including Battery Degradation and Curtailment Costs. Sensors 2024, 24, 7122. [Google Scholar] [CrossRef] [PubMed]
- Soshinskaya, M.; Crijns-Graus, W.; Guerrero, J.; Vasquez, J.C. Microgrids: Experiences, barriers and success factors. Renew. Sustain. Energy Rev. 2014, 40, 659–672. [Google Scholar] [CrossRef]
- Zahraoui, Y.; Alhamrouni, I.; Mekhilef, S.; Basir Khan, M.R.; Seyedmahmoudian, M.; Stojcevski, A.; Horan, B. Energy Management System in Microgrids: A Comprehensive Review. Sustainability 2021, 13, 10492. [Google Scholar] [CrossRef]
| Optimization Technique | Advantages | Limitations | Handling of Renewable Intermittency and Load Uncertainty | Convergence | Overall Suitability for Multi-Microgrid Optimization in Minimizing Cost |
|---|---|---|---|---|---|
| Particle Swarm Optimization (PSO) | Simple structure, easy to implement, and converges quickly in the early stages. | Becomes trapped in local optima and loses diversity as iterations progress. | Sensitive to stochastic renewable variations; poor adaptability. | Converges quickly but is often trapped in local optima. | Moderate |
| WOA (Whale Optimization Algorithm) | Provides a good exploration–exploitation balance and can handle complex landscapes. | Performance is sensitive to parameter tuning and can show oscillations near optimal points. | Handles intermittency moderately but lacks consistency. | Moderate convergence with oscillatory behavior. | Fair |
| BOA (Butterfly Optimization Algorithm) | Good global search ability and adaptability to various problems. | Excessive randomness sometimes causes unstable convergence and poor local refinement. | Inconsistent under stochastic uncertainty; prone to premature convergence. | Rapid initial convergence, but unstable. | Fair |
| GWO (Grey Wolf Optimizer) | Strong exploitation capability and stable convergence behavior. | Exploration ability is limited in high-dimensional or dynamic problems. | Performs moderately under uncertainty; diversity loss affects reliability. | Stable but slow convergence in a complex multi-objective system. | Good |
| PDO (Prairie Dog Optimization) | Offers strong adaptability, maintains population diversity, and achieves fast and stable convergence. | Slightly higher computational demand due to dynamic environmental updates. | Highly resilient to renewable intermittency and load variations; maintains search diversity. | Fast, smooth, and stable convergence with minimal stagnation. | Excellent |
| S. No. | Name of DG | Parameters of DG | Rating of DG |
|---|---|---|---|
| 1 | Photovoltaic Modules | Capacity | 60 kW |
| Efficiency | 15–20% | ||
| Open-circuit voltage (Voc) | 45 | ||
| Short-circuit current (Isc) | 9.5 A | ||
| Rated power per module (Pmax) | 330 W | ||
| Number of PV modules | 182 | ||
| 2 | Wind Turbine Generator | Capacity | 100 kW |
| Rated wind speed | 12 m/s | ||
| Cut-in wind speed | 3–4 m/s | ||
| Cut-out (survival) wind speed | 20–25 m/s | ||
| 3 | Energy Storage System | Li-ion battery | 500 kWh |
| Efficiency | 85% | ||
| Nominal voltage | 500 V | ||
| Nominal capacity | 1.67 × 10³ kWh, 1000 Ah | ||
| 4 | Fuel Cell | Rated power | 1 kW |
| Number of cells | 48 | ||
| Efficiency | 46% | ||
| 5 | Diesel Generator | Rated power | 100 kWh |
| Output voltage | 415 V, 3-phase | ||
| Efficiency | 35% |
| References | Findings | Optimal Techniques | Objective | Limitations |
|---|---|---|---|---|
| [11] | Considers planning and operation cost optimizations for RES penetrations | Sequential Quadratic Programming (SQP) | Planning of renewable energy sources | Cost of energy is ignored, system computational time complexity is higher |
| [12] | Network cost reduction and maximizing the availability of AC/DC | Multi-objective PSO, multi-objective genetic algorithm | Operating cost reduction and reliability improvement | MG uncertainty of generation and load profiles are not considered |
| [13] | DER optimum sizing was achieved using energy trading | Game theory, Nash equilibrium | Optimum DER sizing and energy management system | Reliability of the system is ignored |
| [14] | Demonstrated that a probabilistic approach yields superior outcomes compared to a predetermined method | Modified Jaya optimization | Cost and emission reduction | Real-time power distribution dynamics are excluded from the analysis |
| [15] | Total cost reduction and system performance improvement | Enhanced optimization | Cost reduction and voltage stability | Energy market uncertainty is ignored |
| [16] | Each MG gained maximum profit and their participation increased | Game theory | Maximize profit | No cooperation attained |
| [17] | Daily operating cost and power loss reduction | Artificial neural networks | Cost reduction and maximize RES utilization | The balance between MGs is not taken into account. |
| [18] | Improved peak demand and load efficiency | Hybrid lexicography | Operating cost reduction and DR coordination | The energy market framework is not taken into account |
| [19] | Validated objectives and accurately represented uncertainties | Multi-objective Evolutionary Algorithm | Operating cost and emission reduction | ESS is not considered for further efficacy |
| F | Criteria | PDO | GWO | PSO | WOA | TSA | SPO | HHO | SCA |
|---|---|---|---|---|---|---|---|---|---|
| F1 | Min | 1.85 × 10² | 2.14 × 10³ | 2.91 × 10³ | 3.08 × 10³ | 2.97 × 10³ | 2.91 × 10³ | 2.92 × 10³ | 3.12 × 10³ |
| Max | 1.19 × 10⁴ | 3.2 × 10⁴ | 3.19 × 10³ | 3.84 × 10³ | 3.52 × 10³ | 3.24 × 10³ | 3.11 × 10³ | 3.74 × 10³ | |
| Avg | 6.52 × 10³ | 2.64 × 10³ | 2.97 × 10³ | 3.46 × 10³ | 3.14 × 10³ | 2.94 × 10³ | 2.91 × 10³ | 3.21 × 10³ | |
| STD | 3.84 × 10³ | 4.37 × 10² | 1.72 × 10² | 1.43 × 10² | 1.12 × 10² | 9.82 × 101 | 7.21 × 101 | 1.53 × 10² | |
| Rank | 1 | 8 | 4 | 6 | 5 | 3 | 2 | 7 | |
| F2 | Min | 1.72 × 10³ | 2.94 × 10³ | 1.90 × 10³ | 2.76 × 10³ | 2.81 × 10³ | 1.88 × 10³ | 2.05 × 10³ | 3.12 × 10³ |
| Max | 3.36 × 10³ | 6.04 × 10³ | 3.75 × 10³ | 5.78 × 10³ | 5.61 × 10³ | 3.93 × 10³ | 3.84 × 10³ | 5.28 × 10³ | |
| Avg | 2.54 × 10³ | 4.98 × 10³ | 2.68 × 10³ | 4.22 × 10³ | 4.08 × 10³ | 3.21 × 10³ | 2.96 × 10³ | 4.86 × 10³ | |
| STD | 4.43 × 10² | 5.32 × 10² | 4.51 × 10² | 6.21 × 10² | 5.64 × 10² | 4.01 × 10² | 3.94 × 10² | 4.92 × 10² | |
| Rank | 1 | 8 | 2 | 7 | 6 | 4 | 3 | 5 | |
| F3 | Min | 7.32 × 10² | 9.41 × 10² | 7.51 × 10² | 8.66 × 10² | 8.48 × 10² | 7.44 × 10² | 8.02 × 10² | 8.91 × 10² |
| Max | 9.01 × 10² | 1.17 × 10³ | 7.83 × 10² | 1.02 × 10³ | 1.01 × 10³ | 9.11 × 10² | 9.74 × 10² | 9.86 × 10² | |
| Avg | 7.84 × 10² | 1.02 × 10³ | 7.61 × 10² | 9.41 × 10² | 9.32 × 10² | 7.82 × 10² | 8.64 × 10² | 9.24 × 10² | |
| STD | 4.69 × 101 | 5.61 × 101 | 2.64 × 101 | 3.02 × 101 | 3.88 × 101 | 2.74 × 101 | 3.51 × 101 | 4.02 × 101 | |
| Rank | 1 | 8 | 2 | 6 | 5 | 3 | 4 | 7 | |
| F4 | Min | 1.90 × 10³ | 1.94 × 10³ | 1.91 × 10³ | 1.93 × 10³ | 1.92 × 10³ | 1.90 × 10³ | 1.91 × 10³ | 1.98 × 10³ |
| Max | 1.90 × 10³ | 1.93 × 10⁵ | 1.91 × 10⁴ | 2.18 × 10⁴ | 3.94 × 10³ | 1.93 × 10³ | 1.91 × 10³ | 2.43 × 10³ | |
| Avg | 1.90 × 10³ | 4.36 × 10⁴ | 5.61 × 10³ | 8.22 × 10³ | 2.81 × 10³ | 1.92 × 10³ | 1.91 × 10³ | 2.21 × 10³ | |
| STD | 0.62 | 3.21 × 10⁴ | 1.08 × 10³ | 1.21 × 10³ | 6.42 × 10² | 4.02 × 101 | 5.11 × 10 | 3.51 × 10² | |
| Rank | 1 | 8 | 6 | 7 | 5 | 3 | 2 | 4 | |
| F5 | Min | 2.24 × 10⁴ | 8.12 × 10⁴ | 1.95 × 10⁴ | 7.23 × 10⁴ | 9.91 × 10⁴ | 6.31 × 10³ | 1.02 × 10⁴ | 1.44 × 10⁵ |
| Max | 4.44 × 10⁵ | 1.28 × 10⁶ | 2.59 × 10⁵ | 9.71 × 10⁵ | 2.42 × 10⁶ | 2.02 × 10⁶ | 6.03 × 10⁵ | 3.45 × 10⁶ | |
| Avg | 1.81 × 10⁵ | 4.72 × 10⁵ | 9.84 × 10⁴ | 3.11 × 10⁵ | 1.31 × 10⁶ | 7.91 × 10⁵ | 2.04 × 10⁵ | 1.92 × 10⁶ | |
| STD | 1.24 × 10⁵ | 2.62 × 10⁵ | 6.52 × 10⁴ | 1.94 × 10⁵ | 7.82 × 10⁵ | 3.91 × 10⁵ | 1.52 × 10⁵ | 8.63 × 10⁵ | |
| Rank | 1 | 6 | 2 | 5 | 8 | 7 | 3 | 4 | |
| F6 | Min | 1.61 × 10³ | 2.43 × 10³ | 1.72 × 10³ | 1.89 × 10³ | 2.16 × 10³ | 1.63 × 10³ | 1.78 × 10³ | 2.21 × 10³ |
| Max | 2.13 × 10³ | 3.74 × 10³ | 2.26 × 10³ | 2.72 × 10³ | 2.99 × 10³ | 2.69 × 10³ | 2.24 × 10³ | 2.91 × 10³ | |
| Avg | 1.76 × 10³ | 3.01 × 10³ | 1.93 × 10³ | 2.31 × 10³ | 2.52 × 10³ | 1.91 × 10³ | 1.96 × 10³ | 2.48 × 10³ | |
| STD | 1.25 × 10² | 3.45 × 10² | 1.31 × 10² | 2.02 × 10² | 2.41 × 10² | 1.72 × 10² | 1.42 × 10² | 1.83 × 10² | |
| Rank | 1 | 8 | 2 | 5 | 7 | 3 | 4 | 6 | |
| F7 | Min | 8.21 × 10³ | 1.21 × 10⁴ | 4.84 × 10³ | 9.42 × 10³ | 1.14 × 10⁴ | 4.02 × 10³ | 6.04 × 10³ | 1.01 × 10⁴ |
| Max | 5.64 × 10⁵ | 1.03 × 10⁶ | 3.14 × 10⁵ | 8.94 × 10⁵ | 1.32 × 10⁶ | 6.02 × 10⁵ | 5.32 × 10⁵ | 1.21 × 10⁶ | |
| Avg | 2.14 × 10⁵ | 3.71 × 10⁵ | 9.12 × 10⁴ | 2.83 × 10⁵ | 6.41 × 10⁵ | 1.23 × 10⁵ | 1.84 × 10⁵ | 5.31 × 10⁵ | |
| STD | 1.54 × 10⁵ | 2.12 × 10⁵ | 7.52 × 10⁴ | 1.91 × 10⁵ | 3.84 × 10⁵ | 1.61 × 10⁵ | 1.42 × 10⁵ | 2.71 × 10⁵ | |
| Rank | 1 | 8 | 2 | 5 | 7 | 3 | 4 | 6 | |
| F8 | Min | 2.28 × 10³ | 3.12 × 10³ | 2.31 × 10³ | 2.43 × 10³ | 2.61 × 10³ | 2.30 × 10³ | 2.31 × 10³ | 2.61 × 10³ |
| Max | 5.42 × 10³ | 7.02 × 10³ | 5.97 × 10³ | 6.83 × 10³ | 6.52 × 10³ | 7.11 × 10³ | 5.98 × 10³ | 7.11 × 10³ | |
| Avg | 3.04 × 10³ | 5.21 × 10³ | 3.21 × 10³ | 4.78 × 10³ | 4.63 × 10³ | 3.56 × 10³ | 3.29 × 10³ | 4.83 × 10³ | |
| STD | 1.25 × 10³ | 1.01 × 10³ | 8.74 × 10² | 1.42 × 10³ | 1.31 × 10³ | 1.32 × 10³ | 1.02 × 10³ | 1.54 × 10³ | |
| Rank | 1 | 8 | 3 | 6 | 5 | 4 | 2 | 7 | |
| F9 | Min | 2.79 × 10³ | 3.04 × 10³ | 2.83 × 10³ | 2.95 × 10³ | 3.01 × 10³ | 2.93 × 10³ | 2.91 × 10³ | 3.03 × 10³ |
| Max | 2.87 × 10³ | 3.17 × 10³ | 2.92 × 10³ | 3.22 × 10³ | 3.19 × 10³ | 3.01 × 10³ | 2.94 × 10³ | 3.04 × 10³ | |
| Avg | 2.82 × 10³ | 3.14 × 10³ | 2.87 × 10³ | 3.16 × 10³ | 3.12 × 10³ | 2.97 × 10³ | 2.93 × 10³ | 3.02 × 10³ | |
| STD | 1.46 × 101 | 3.52 × 101 | 2.61 × 101 | 3.12 × 101 | 2.84 × 101 | 2.41 × 101 | 2.02 × 101 | 2.81 × 101 | |
| Rank | 1 | 8 | 2 | 7 | 6 | 4 | 3 | 5 | |
| F10 | Min | 2.89 × 10³ | 3.52 × 10³ | 2.90 × 10³ | 2.97 × 10³ | 3.14 × 10³ | 2.92 × 10³ | 2.91 × 10³ | 3.12 × 10³ |
| Max | 2.97 × 10³ | 6.21 × 10³ | 3.00 × 10³ | 3.41 × 10³ | 3.53 × 10³ | 3.14 × 10³ | 3.01 × 10³ | 3.71 × 10³ | |
| Avg | 2.91 × 10³ | 4.72 × 10³ | 2.96 × 10³ | 3.12 × 10³ | 3.31 × 10³ | 2.98 × 10³ | 2.95 × 10³ | 3.27 × 10³ | |
| STD | 2.61 × 101 | 7.12 × 10² | 3.11 × 101 | 4.12 × 101 | 4.43 × 101 | 2.92 × 101 | 2.54 × 101 | 1.21 × 10² | |
| Rank | 1 | 8 | 2 | 6 | 5 | 3 | 4 | 7 |
| Function | PDO | GWO | PSO | WOA | TSA | SPO | HHO | SCA |
|---|---|---|---|---|---|---|---|---|
| F1 | 3.02 × 10⁻¹¹ | 5.68 × 10⁻⁴ | 1.21 × 10⁻³ | 7.53 × 10⁻⁴ | 2.65 × 10⁻³ | 1.14 × 10⁻³ | 8.95 × 10⁻⁴ | 2.01 × 10⁻³ |
| F2 | 3.02 × 10⁻¹¹ | 9.87 × 10⁻⁶ | 5.42 × 10⁻⁵ | 2.75 × 10⁻⁴ | 1.64 × 10⁻⁴ | 8.59 × 10⁻⁵ | 1.23 × 10⁻³ | 4.01 × 10⁻⁵ |
| F3 | 3.02 × 10⁻¹¹ | 4.28 × 10⁻⁵ | 2.57 × 10⁻⁵ | 7.94 × 10⁻⁵ | 5.64 × 10⁻⁵ | 1.38 × 10⁻⁴ | 9.21 × 10⁻⁵ | 6.72 × 10⁻⁵ |
| F4 | 3.02 × 10⁻¹¹ | 1.27 × 10⁻⁴ | 8.36 × 10⁻⁵ | 1.04 × 10⁻⁴ | 3.52 × 10⁻⁵ | 2.48 × 10⁻⁴ | 7.33 × 10⁻⁵ | 1.82 × 10⁻⁴ |
| F5 | 4.50 × 10⁻¹¹ | 3.21 × 10⁻⁴ | 4.97 × 10⁻⁴ | 5.83 × 10⁻⁴ | 6.11 × 10⁻⁴ | 1.02 × 10⁻³ | 8.92 × 10⁻⁴ | 1.34 × 10⁻³ |
| F6 | 3.02 × 10⁻¹¹ | 6.83 × 10⁻⁵ | 3.47 × 10⁻⁵ | 2.94 × 10⁻⁴ | 1.83 × 10⁻⁴ | 2.61 × 10⁻⁴ | 4.53 × 10⁻⁴ | 1.97 × 10⁻⁴ |
| F7 | 3.16 × 10⁻¹ | 8.74 × 10⁻⁴ | 4.23 × 10⁻⁴ | 6.31 × 10⁻⁴ | 1.21 × 10⁻³ | 1.56 × 10⁻³ | 2.45 × 10⁻³ | 1.84 × 10⁻³ |
| F8 | 3.26 × 10⁻⁷ | 5.42 × 10⁻⁶ | 7.19 × 10⁻⁶ | 1.02 × 10⁻⁵ | 9.75 × 10⁻⁵ | 4.32 × 10⁻⁵ | 2.11 × 10⁻⁴ | 1.67 × 10⁻⁵ |
| F9 | 3.02 × 10⁻¹¹ | 2.63 × 10⁻⁵ | 1.49 × 10⁻⁴ | 3.84 × 10⁻⁵ | 6.12 × 10⁻⁵ | 2.17 × 10⁻⁴ | 1.08 × 10⁻³ | 4.97 × 10⁻⁵ |
| F10 | 3.02 × 10⁻¹¹ | 1.84 × 10⁻⁵ | 6.22 × 10⁻⁵ | 7.94 × 10⁻⁵ | 1.93 × 10⁻⁴ | 4.31 × 10⁻⁴ | 5.89 × 10⁻⁴ | 2.17 × 10⁻⁴ |
| Parameter | Before Optimization | After Optimization | Improvement (%) | Remarks |
|---|---|---|---|---|
| Peak Demand (kW) | 1100 | 820 | 20.7% | Effective peak shaving through coordinated scheduling |
| Average Demand (kW) | 520 | 530 | 1.9% | More uniform load distribution |
| Peak-to-Average Ratio | 1.58 | 1.23 | 22.2% | Flatter load curve and improved stability |
| DG Utilization (%) | 72.5 | 91.4 | 26.1% | Increased renewable contribution and reduced curtailment |
| ESS Utilization (%) | 54.8 | 88.3 | 61.1% | Optimized charging/discharging cycles for peak management |
| Power Exchange Among MGs (kWh/day) | 115 | 248 | 115.6% | Enhanced energy sharing among interconnected MGs |
| Grid Import (kWh/day) | 965 | 712 | 26.2% | Reduced external grid dependency |
| Operational Cost($/day) | 1420 | 1085 | 23.6% | Cost reduction through optimal dispatch and coordination |
| System Voltage Deviation (p.u.) | ±0.045 | ±0.018 | 60.0% | Improved voltage stability across MMG |
| Overall Efficiency (%) | 82.4 | 94.1 | 14.2% | Higher system reliability and energy efficiency |
| Parameter | Before Optimization | After Optimization | Change (%) | Remarks |
|---|---|---|---|---|
| Peak Demand (kW) | 820 | 870 | 6.1% | Slight increase due to demand shifting and improved DG availability |
| Average Demand (kW) | 520 | 565 | 8.7% | Higher average utilization and load factor |
| Peak-to-Average Ratio | 1.58 | 1.54 | 2.5% | Load curve becomes smoother despite higher peaks |
| DG Utilization (%) | 72.5 | 93.6 | 29.1% | Increased renewable generation reduces grid dependency |
| ESS Utilization (%) | 54.8 | 89.2 | 62.8% | More dynamic ESS operation during load peaks |
| Power Exchange Among MGs (kWh/day) | 115 | 275 | 139.1% | Improved inter-microgrid coordination and energy sharing |
| Grid Import (kWh/day) | 965 | 705 | 27.0% | Greater reliance on local renewable sources |
| Operational Cost ($/day) | 1420 | 1110 | 21.8% | Cost savings despite slightly higher peak load |
| System Voltage Deviation (p.u.) | ±0.045 | ±0.020 | 55.6% | Enhanced voltage regulation and network control |
| Overall Efficiency (%) | 82.4 | 95.3 | 15.7% | Improved energy management and reduced losses |
| Parameter | Before Optimization | After Optimization | Change (%) | Remarks |
|---|---|---|---|---|
| Total Load Demand (kWh/day) | 9800 | 10,450 | 6.6% | Increased due to better load accommodation and reduced curtailment |
| Peak Demand (kW) | 820 | 910 | 11.0% | Higher served load during daytime hours |
| Average Demand (kW) | 520 | 575 | 10.6% | Reflects overall growth in active demand served |
| Peak-to-Average Ratio | 1.58 | 1.58 | — | Balanced load growth with uniform distribution |
| DG Utilization (%) | 72.5 | 94.2 | 29.9% | Maximum use of renewable DG sources |
| ESS Utilization (%) | 54.8 | 91.7 | 67.4% | Improved charging–discharging for supporting higher load |
| Power Exchange Among MGs (kWh/day) | 115 | 295 | 156.5% | Stronger energy cooperation among microgrids |
| Grid Import (kWh/day) | 965 | 745 | 22.8% | Reduced dependency despite higher total demand |
| Operational Cost ($/day) | 1420 | 1170 | 17.6% | Efficient dispatch offsets increased energy use |
| System Voltage Deviation (p.u.) | ±0.045 | ±0.022 | 51.1% | Maintained voltage stability under higher load |
| Overall Efficiency (%) | 82.4 | 93.8 | 3.8% | Enhanced reliability and network coordination |
| Optimization Technique | Case 1 | Case 2 | |
|---|---|---|---|
| Minimization of price | Price ($ /kWh) | ||
| PDO | 18,546.35 | 17,456.23 | |
| GWO | 19,451.36 | 19,365.27 | |
| PSO | 18,795.23 | 18,987.75 | |
| Power Loss (kW) | |||
| Power loss minimization | PDO | 25.32 | 24.12 |
| GWO | 32.15 | 29.15 | |
| PSO | 25.12 | 23.59 | |
| Voltage Deviations in (P.U) | |||
| Voltage deviation minimization | PDO | 4.7 × 10⁻⁶ | 3.8 × 10⁻⁶ |
| GWO | 4.8 × 10⁻⁶ | 4.6 × 10⁻⁶ | |
| PSO | 4.8 × 10⁻⁶ | 3.9 × 10⁻⁶ | |
| Day Hours | Prairie Dog Optimization (PDO) ($ /kWh) | Grey Wolf Optimization (GWO) ($ kWh) | Particle Swarm Optimization (PSO) ($ /kWh) |
|---|---|---|---|
| 1 | 527.654 | 553.62 | 578.96 |
| 2 | 637.258 | 658.78 | 689.25 |
| 3 | 556.24 | 586.98 | 612.32 |
| 4 | 651.23 | 687.98 | 698.25 |
| 5 | 541.25 | 567.23 | 587.45 |
| 6 | 612.36 | 636.54 | 668.32 |
| 7 | 715.94 | 762.35 | 784.63 |
| 8 | 312.56 | 339.42 | 354.65 |
| 9 | 725.14 | 768.94 | 789.56 |
| 10 | 612.65 | 635.68 | 679.87 |
| 11 | 714.25 | 735.65 | 759.59 |
| 12 | 735.65 | 759.68 | 784.21 |
| 13 | 812.65 | 826.97 | 845.65 |
| 14 | 445.25 | 469.98 | 498.36 |
| 15 | 724.56 | 745.63 | 763.56 |
| 16 | 735.14 | 752.63 | 774.65 |
| 17 | 769.25 | 782.14 | 795.56 |
| 18 | 804.32 | 824.65 | 846.95 |
| 19 | 912.56 | 935.64 | 965.45 |
| 20 | 704.36 | 721.32 | 746.98 |
| 21 | 514.65 | 535.69 | 558.78 |
| 22 | 524.65 | 549.89 | 568.98 |
| 23 | 514.63 | 534.25 | 568.12 |
| 24 | 504.32 | 526.35 | 539.63 |
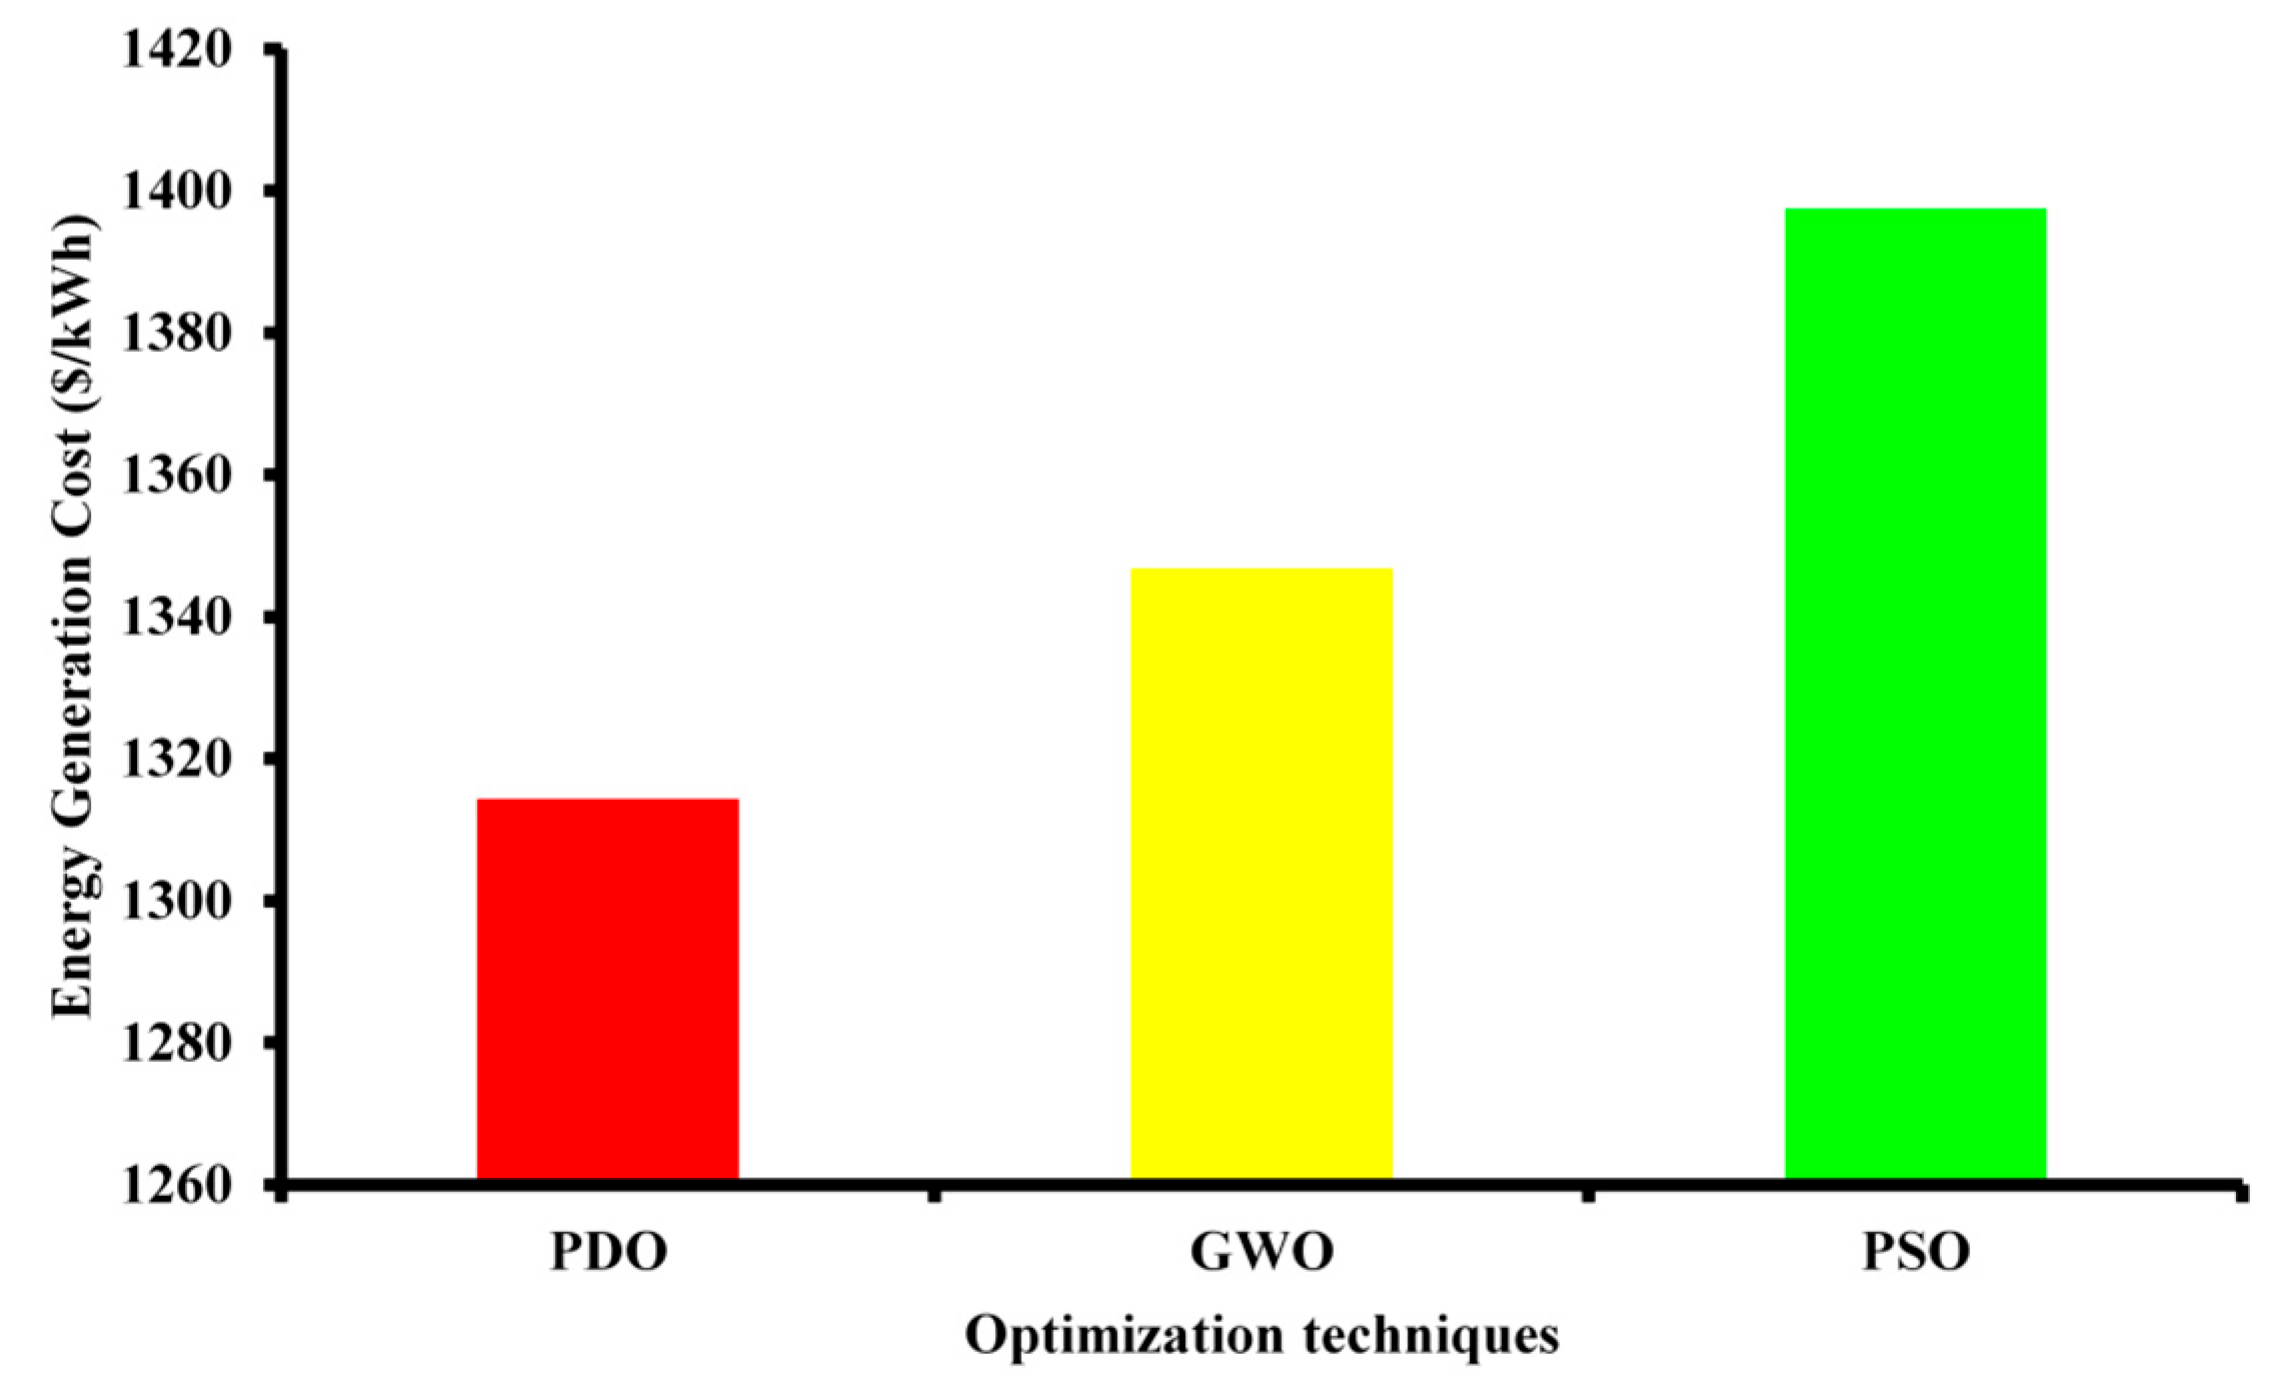
| Optimization Technique | Energy Generation Cost (USD/kWh) | % Probability of Power Supply Deficit (PPSP) |
|---|---|---|
| PDO | 0.123 | 0.16 |
| GWO | 0.89 | 1.5 |
| PSO | 1.2 | 1.8 |
Disclaimer/Publisher’s Note: The statements, opinions and data contained in all publications are solely those of the individual author(s) and contributor(s) and not of MDPI and/or the editor(s). MDPI and/or the editor(s) disclaim responsibility for any injury to people or property resulting from any ideas, methods, instructions or products referred to in the content. |
© 2025 by the authors. Licensee MDPI, Basel, Switzerland. This article is an open access article distributed under the terms and conditions of the Creative Commons Attribution (CC BY) license (https://creativecommons.org/licenses/by/4.0/).
Share and Cite
Mavuri, S.S.; Salkuti, S.R. A Novel Prairie Dog Optimization for Energy Management of Multi-Microgrid System Considering Uncertainty and Load Management. Designs 2025, 9, 130. https://doi.org/10.3390/designs9060130
Mavuri SS, Salkuti SR. A Novel Prairie Dog Optimization for Energy Management of Multi-Microgrid System Considering Uncertainty and Load Management. Designs. 2025; 9(6):130. https://doi.org/10.3390/designs9060130
Chicago/Turabian StyleMavuri, Sri Suresh, and Surender Reddy Salkuti. 2025. "A Novel Prairie Dog Optimization for Energy Management of Multi-Microgrid System Considering Uncertainty and Load Management" Designs 9, no. 6: 130. https://doi.org/10.3390/designs9060130
APA StyleMavuri, S. S., & Salkuti, S. R. (2025). A Novel Prairie Dog Optimization for Energy Management of Multi-Microgrid System Considering Uncertainty and Load Management. Designs, 9(6), 130. https://doi.org/10.3390/designs9060130


