Article

A Novel Prairie Dog Optimization for Energy Management of Multi-Microgrid System Considering Uncertainty and Load Management

by
Sri Suresh Mavuri
1 and
Surender Reddy Salkuti
2,*
1
Department of Electrical and Electronics Engineering, Chaitanya Bharathi Institute of Technology, Hyderabad 500075, India
2
Department of Global Railways, Woosong University, Daejeon 34606, Republic of Korea
*
Author to whom correspondence should be addressed.
Designs 2025, 9(6), 130; https://doi.org/10.3390/designs9060130
Submission received: 14 September 2025 / Revised: 15 November 2025 / Accepted: 18 November 2025 / Published: 21 November 2025

Abstract

This study introduces a design-oriented framework for an intelligent Energy Management System (EMS) in a Multi-Microgrid (MMG) environment to achieve efficient, reliable, and sustainable power operation. The proposed EMS is systematically designed to coordinate three interconnected microgrids with the main grid, optimizing Distributed Energy Resource (DER) utilization under uncertain weather, load, and market conditions. A novel Prairie Dog Optimization (PDO) algorithm is developed as a key algorithmic design innovation to enhance decision-making in day-ahead scheduling and load management. Through an optimization-based design approach, the EMS minimizes Energy Generation Cost (EGC) and Probability of Power Supply Deficit (PPSD). Simulation studies on a modified 33-bus system validate the design’s effectiveness, showing that PDO reduces operational cost by 5% and carbon emissions by 20% compared to Grey Wolf Optimization (GWO) and Particle Swarm Optimization (PSO). A better system performance is indicated by the optimal EGC of 0.1567 $/kWh and PPSD of 0.155%. Comprehensively, the PDO-based EMS is an important addition to the design engineering field by offering scalable, adaptive, and sustainable energy system design to the design of resilient and zero-emission MMG architectures to be used in the future in smart grids.

1. Introduction

Microgrids (MGs) are quickly becoming one of the foundations of the decentralized energy system. They can be operated autonomously as well as grid-connected through a mix of many different Distributed Energy Resources [1] (DERs), including solar photovoltaic (PV) panels, wind turbines, diesel generators, and energy storage systems such as batteries. This allows MGs to meet local demand efficiently even in the case of grid outages, improving energy resilience. However, the intermittency of renewable energy sources [2], such as solar and wind, regularly causes variability in production. This means that it is difficult to operate the without grid. Multi-Objective Optimization (MOO) methods have become popular for addressing such problems, which have conflicting objectives, including cost reduction, environmental gains, and reliability of the system [3]. Pareto-based optimization [4] is one of the most popular MOO techniques used to identify non-dominated solutions that provide a trade-off between multiple objectives. Scalarization is a technique used to transform multi-objective problems into single-objective problems where weights are assigned, thus facilitating simpler solution methodology. These models assist in reducing lifecycle costs, such as investment, operational, and maintenance costs, while taking into account the environmental constraints. However, real-world energy systems are nonlinear and large-scale. Therefore, in many cases, MINLP is computationally infeasible [5]. Consequently, there has been an area of extensive investigation on the application of heuristic and metaheuristic algorithms, such as Particle Swarm Optimization (PSO), Genetic Algorithms (GAs), and Evolutionary Algorithms (EAs) to ensure efficiency in solving complex optimization problems with reduced costs and reduced environmental impact [6]. Specialized versions of PSO, optimized to microgrid applications, have demonstrated considerable success in balancing between cost and environmental considerations. These algorithms are used to optimize multi-objective functions to minimize the use of fuel, emissions, and the general operational cost, and at the same time sustain the equilibrium between supply and demand in dynamic environments [7]. Moreover, the incorporation of Demand Response [8] (DR) programs within MGs has enhanced the performance of the system since it allows real-time changes in consumer demand. DR would enable increased integration of wind power, as it reduces the intermittency of wind energy, which would increase reliability and cost-effectiveness. According to recent research, layered energy management strategies have been proposed in order to make microgrids more efficient. In a two-tier model, local controllers (like Home Energy Management Controllers (HEMCs) are responsible for real-time load control based on price and generation forecasts, and central agents mediate market interactions and distributed coordination. This framework can be optimized with algorithms such as Multi-Objective Grey Wolf Optimization [9] (MOGWO), which is more successful in solving the problem than traditional PSO since it provides more accuracy and calculability. Because the behavior of microgrid components is nonlinear in nature, evolutionary algorithms are currently favored over the traditional linear programming methods. These algorithms are more adapted to stochastic generation patterns and complexities in the variations of load in real-time. As an example, MG operations based on multi-objective evolutionary algorithms are being utilized in the process of balancing economic performance with a reduction in emissions [10]. In the case of multi-microgrid systems, real-time communication, interoperability, and optimal scheduling become critical issues. Sharp communication structures and coordinated control strategies [11] provide the smooth coordination of operation and avoid cascading failures. These complex structures enable various interrelated microgrids to work collaboratively yet independently. Extensive reviews have pointed to an increasing trend in the use of optimization methods in different aspects of energy management. These consist of centralized, decentralized, and distributed EMS plans, which together enhance energy consumption, stabilization, and economic sustainability [12]. Moreover, the use of decentralized stochastic optimization techniques is increasing in multi-agent micro-grid systems, especially where the uncertainties of renewable output and demand patterns have to be taken into account [13]. Such mechanisms of microgrid protection [14] are in the process of evolving as well. Research has emphasized the importance of flexible and robust protection systems in order to identify and isolate faults within a short period of time, providing continuous services despite unfavorable circumstances. These models take into account real-life limitations, and therefore, they can be implemented in practice. MG’s flexibility is enhanced through DR-based scheduling, aligning consumer behavior and generation patterns with market price variations, thus enhancing stability in the grid even further [15]. Dynamic simulations are being developed and optimized using hybrid microgrids that combine solar PV, wind, diesel generators, and battery storage. These are especially appropriate in off-grid and remote systems, where reliability and costs are essential factors. The lifecycle operation of the system can be optimally guaranteed by optimal component sizing and configuration [16]. The continuous development of EMS has always been a priority of strategic reviews to achieve the objectives of energy transition and climate change mitigation. These reviews have categorized existing strategies and defined gaps and future trends in microgrid studies [17]. Also, in the electric vehicle (EV) market, improvements in power electronic converters, including the modified Ferdowsi converter, are being adopted to guarantee a high-quality, efficient, and stable charging infrastructure [18]. New modeling frameworks based on game theory are also being investigated to optimize sizing and cost reduction in complex multi-microgrid settings. These models consider the strategic behavior of single MGs and seek a system-wide equilibrium that is advantageous to the whole system [19]. The concept of load shifting policies is also emerging, where demand is redistributed over time to take advantage lower tariffs or increased availability of renewable energy generation [20]. The redistribution of demand over time is also being performed using machine learning (ML) and artificial intelligence (AI) techniques to predict renewable energy generation accurately. These models enhance the predictability of solar and wind releases, thereby supporting enhanced planning and dispatch. They enhance reliability, and curtailment is minimized [21]. To improve voltage stability and reduce energy losses in active distribution networks, optimal placement and sizing of DERs, including integrating soft open points, are being implemented [22]. Optimization using AI is especially useful when the system is in a faulty condition, providing rapid recovery solutions for hybrid microgrids. Such techniques include neural networks, reinforcement learning, and fuzzy systems, which are able to adjust to complex and real-time situations [23]. In the case of systems that are linked to distribution networks, effective algorithms are being developed to handle the uncertainties of renewable energies to guarantee that the systems are able to operate in a stable and secure manner [24]. Finally, improved control methods, including frequency stabilization in AC microgrid clusters, are being designed using fractional order supercapacitor controllers. These systems provide improved transient response [25] and damping properties, improving the overall system power quality and robustness.
Figure 1 shows the structural design of a Multi-Microgrid (MMG) system, which is a contemporary decentralized energy system that is driving the world towards sustainable, resilient, and low-carbon power systems. The growing incorporation of Distributed Energy Resources (DERs) in the form of solar photovoltaic systems, wind turbines, and battery energy storage systems (BESS) has been a necessity in combating the environmental, operational, and economic problems associated with traditional centralized grids. As illustrated in the figure, microgrids are small-scale power grids, highly localized, and can operate in both grid-connected and islanded modes to help increase the reliability and flexibility of the system when the grid undergoes some disturbance or peak demand is reached. These microgrids are built with a multi-faceted combination of renewable sources of generation with quality storage systems to adequately match real-time supply and demand, and at the same time decrease the reliance on fossil fuels and external grid back-up. The intermittent and unpredictable characteristics of the renewable energy sources necessitate the incorporation of smarter energy management tools that can streamline the production of power, the use of storage, and the allocation of loads across all interdependent microgrids in the network. In order to do this, a multi-objective optimization model should be developed, with the objective function taking into consideration different operation and economic attributes, such as fuel consumption cost, maintenance costs, energy storage degradation costs, environment-related emission costs, and system stability consideration. Also, the uncertainties related to variability in the generation of renewable sources, dynamic load profile, and changes in market prices will also have to be taken into account in order to ensure the efficiency of the operation and its economic sustainability. The MMG framework in Figure 1 is an example of the next generation of smart grids, as the coordination of the distribution assets can be effectively coordinated, grid resilience can be improved, and sustainable energy integration into the continually evolving and increasingly complicated power system environment can be supported. Table 1 Comparison of optimization techniques for the suitability of minimizing cost in a multi-microgrid system. It summarizes the literature review on optimal sizing and positioning of DGs. In accordance with this work, it proposes a bi-level optimal planning framework that optimizes MMG sizing while incorporating instantaneous price variations of energy. In [20], this issue was addressed by optimizing DER sizing while accounting for uncertainties and energy trading mechanisms, ultimately reducing the total cost of the MMG. It is necessary to validate the authors’ performance in achieving these objectives with the help of optimization techniques. This research introduces a novel optimization technique, Prairie Dog Optimization. Table 2 represents the specifications of DGs in MMG. Table 3 summarizes the review of existing studies on the optimal placement and capacity determination of distributed generation units.
A summary of the major contributions of this paper is presented below:
  • To reduce energy costs and enhance system reliability while considering multiple operational constraints of the MMG system, a novel Prairie Dog Optimization (PDO) approach is implemented for a grid-connected multi-microgrid system.
  • To enhance MMG system reliability by considering uncertainties in wind speed, solar irradiation, load demand, energy prices, and BESS management, the ANFIS-based soft computing approach is implemented, which reduces the impact of scheduling discrepancies between generation and demand.
  • A 24 h day-ahead scheduling approach was implemented to reduce operational costs, enhance generation reliability, and maximize resource utilization by considering factors like energy prices, load demand, and uncertainties in renewable energy sources (RES).
  • A load management strategy was implemented based on load-shifting techniques to lower the operational costs of a multi-interconnected microgrid system during both grid-connected and islanded operating conditions.
  • Load growth and uncertainties in both DGs and loads were incorporated into the planning and operational strategies to ensure effective DG deployment.

2. Problem Formulation

Microgrid systems comprise diesel generators (DGs), wind turbines (WTs), photovoltaic (PV) systems, and an energy storage system (ESS). DGs are dispatchable units with manageable output, which is controlled by the functions of fuel costs, ramp-up constraints, and startup costs. WTs are constructed through the generation of power based on stochastic wind speeds, which are simulated using a Weibull probability density (PDF) function. PV systems make use of solar irradiance, which is described by a log-normal PDF, to estimate the power output. The ESS controls charging and discharging and avoids deep discharge to prolong the battery life. The normal PDF is used to model the load uncertainties and risks are grounded on the variation in the consumer behavior and demand.
Both established and recently added distributed generations (DGs) are well managed to provide quality economic returns by offering behind-the-meter (BTM) or grid-related services, but those with emission limits. In [19], the researchers focused on two popular BTM services: employing DERs to lower energy consumption expenses and demand charges. Furthermore, the technique may be modified to provide grid services, such as energy arbitrage, frequency control, and deferring important asset improvements.
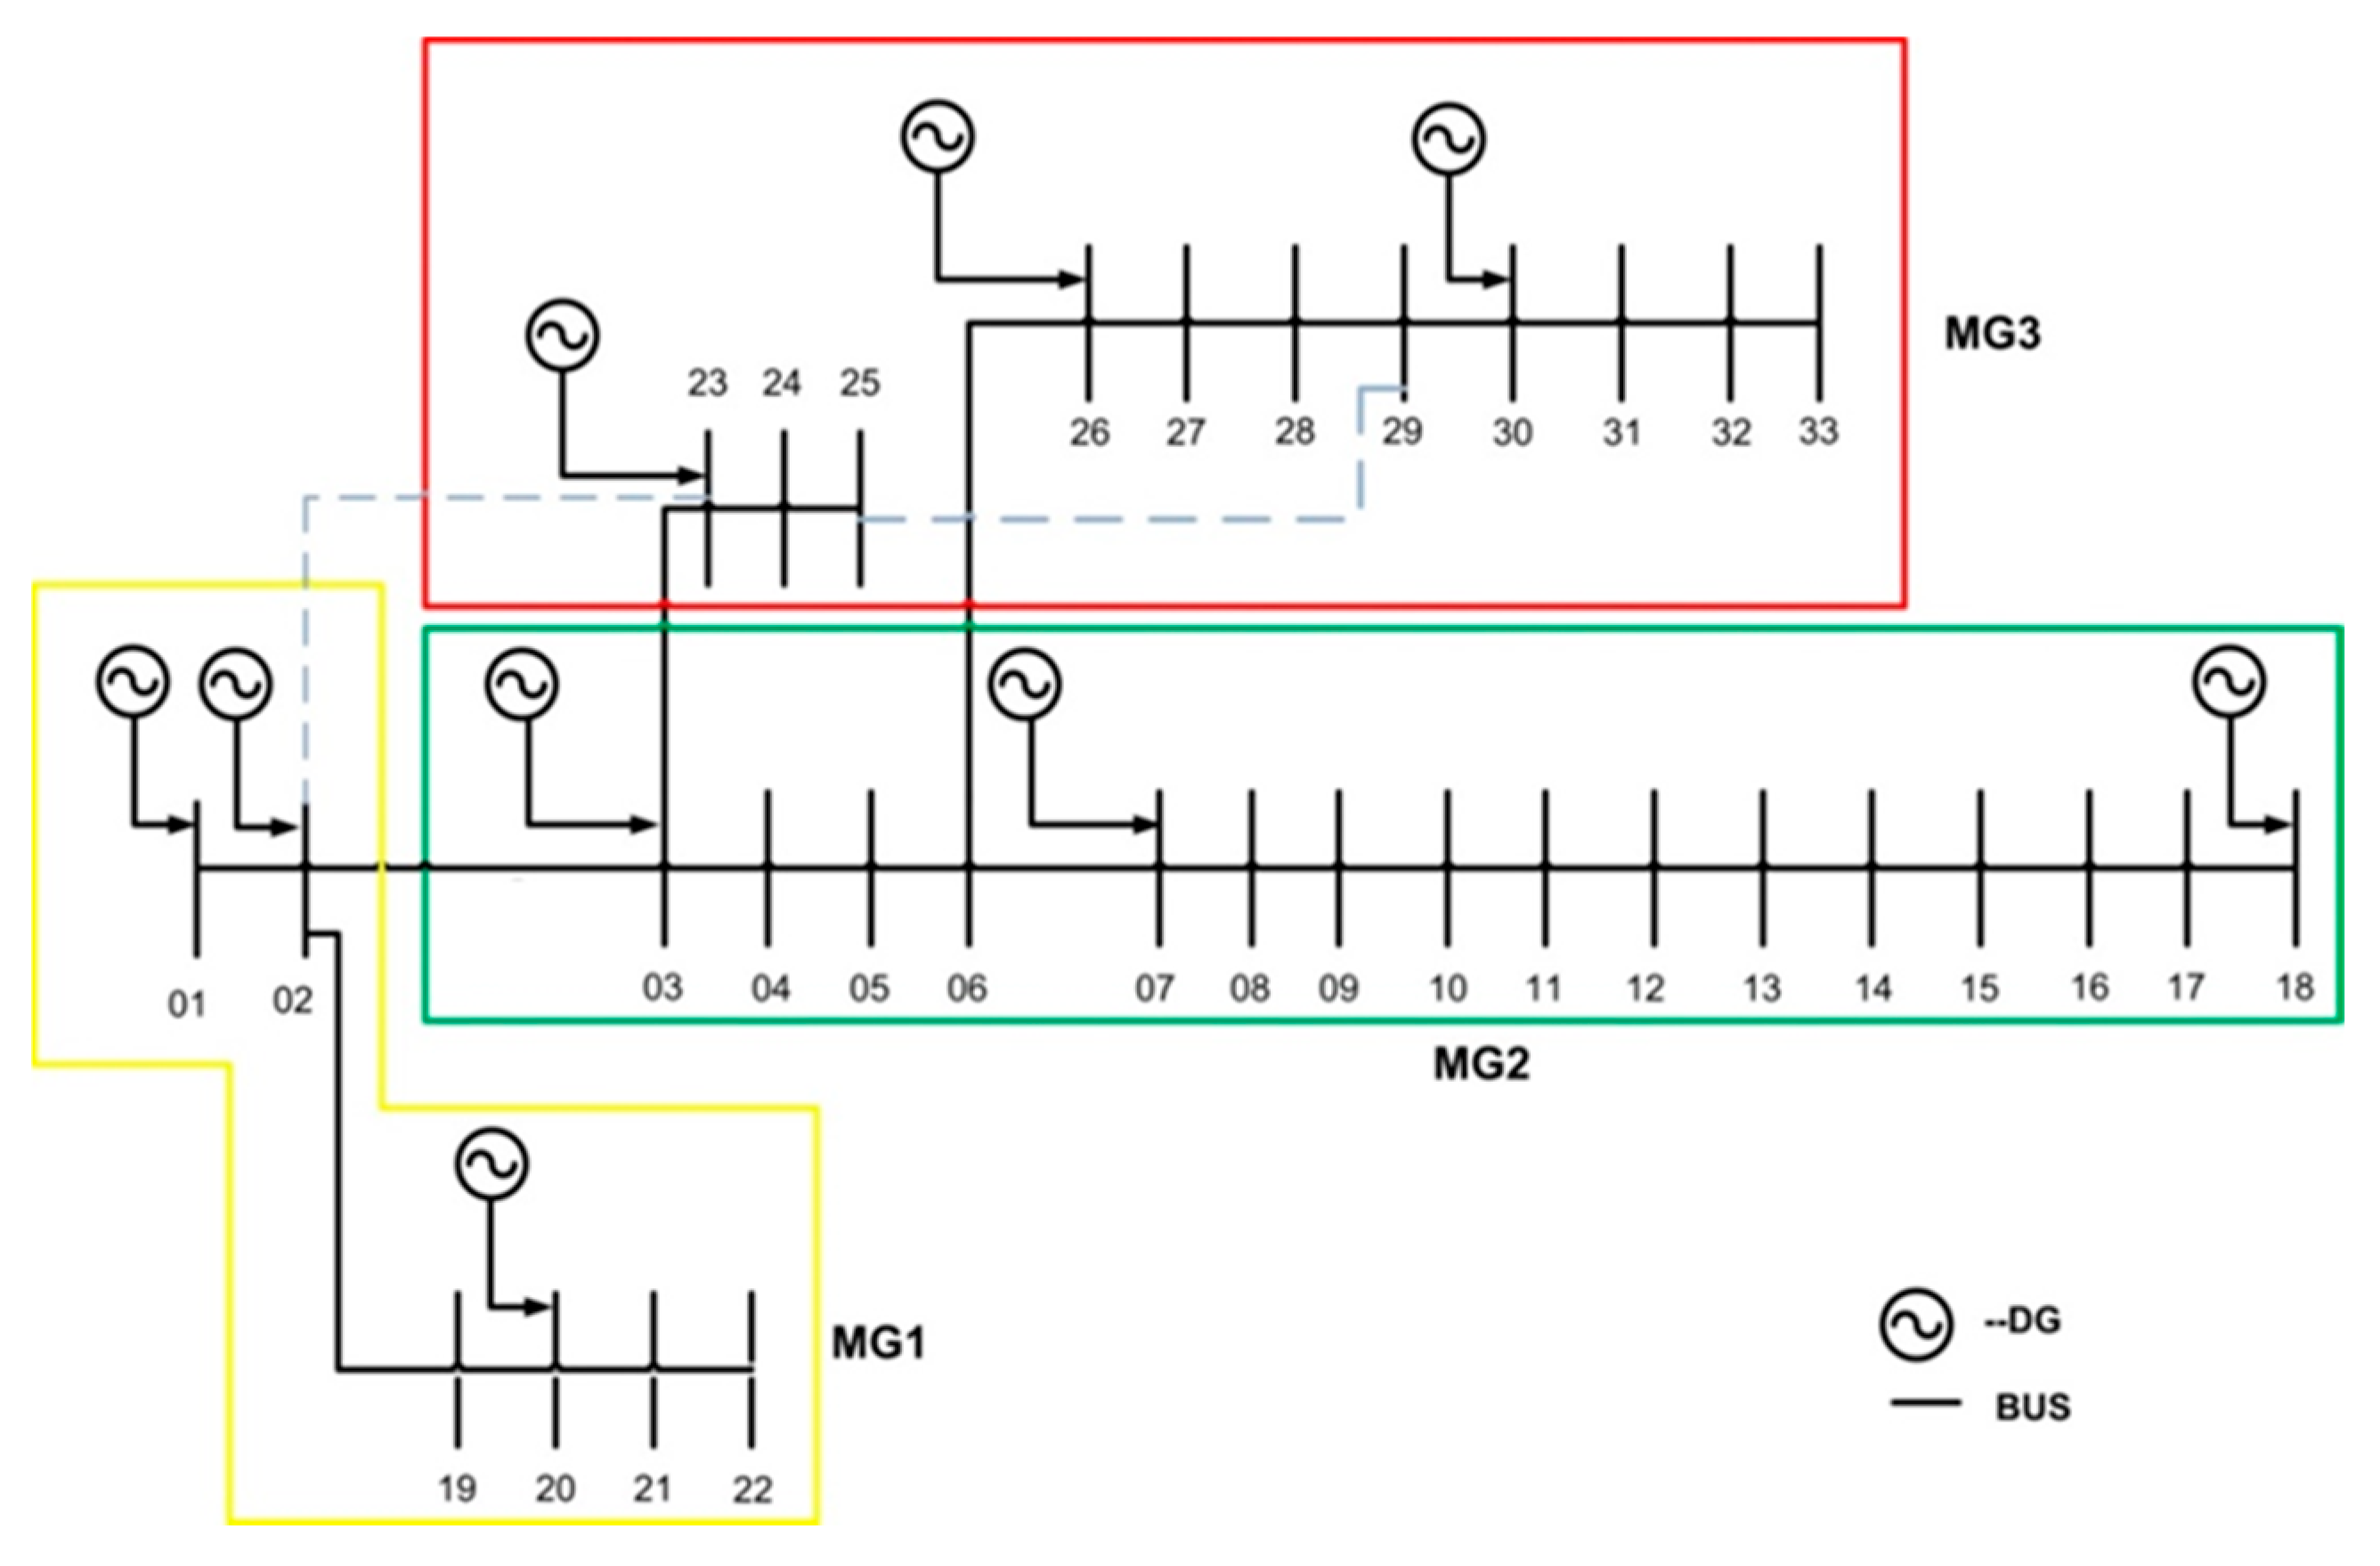
During an outage, microgrids function autonomously in island mode [20], drawing on all available DERs to fulfill local power needs. The goal, taking into account the technical and economic characteristics of various DER choices, is to reduce net costs while ensuring the microgrid’s survival in the event of an unforeseen outage, while also fulfilling system-wide and component-specific limits in both grid-connected and island modes. Reliability is described here as the microgrid’s ability to continue running during an outage. Figure 2 illustrates the configuration of a multi-microgrid system, comprising a distribution network integrated with multiple multi-microgrid systems.

2.1. Distributed Generation Modeling

Distributed Generation (DG) modeling involves representing small-scale power generation units located close to the demand they serve. DG modeling is essential for analyzing their impact on power systems, optimizing their performance, and integrating them effectively with the grid.

2.1.1. Photovoltaic System Modeling

Photoactive (PV) system modeling is an important part of the design, optimization, and performance evaluation of a solar energy system. Proper modeling guarantees that PV systems are capable of fulfilling energy requirements at the lowest possible cost and with the highest efficiency. The power output from these arrays is affected by sun irradiation and can potentially be calculated using the following equation [21]:
P S o l a r = K × P m S o l a r × S t / 1000
where PSolar is the generation of power from photovoltaic panels, PmSolar is the power output of each array at that instant of St = 1000, St is the solar irradiance incident on the panel, and K is the number of PV modules.

2.1.2. Modeling of Fuel Cell

Fuel cell modeling includes modeling and assessing the behavior, performance, and efficiency of fuel cells under different operating conditions. Accurate modeling is critical for improving their design, control techniques [22]:
P F u e l c e l l = i n p u t   p o w e r × η F C

2.1.3. Wind Turbine Modeling

Modeling of wind turbines assists in refining turbine design, evaluating the viability of wind energy projects, and integrating wind power into broader electrical grids. The efficiency of a wind turbine is influenced by variables such as wind speed, air density, and turbine structure. As a renewable energy source, wind power is a viable alternative due to its widespread availability. Wind turbine modeling equations are shown below [23]:
P W i n d = 0 V V c i n ,   V V c o f f P Wmax × ( ( V V c - in ) ( V rtd V c - in ) ) 3 V c i n V V r t d P r t d V r t d V V c o f f
where Vc-in is the wind turbine cut-in speed, Vc-off is the wind turbine cut-off speed, V is the speed of the wind turbine, Vrtd is the rated speed of the wind turbine, and Pwmax is the maximum power generation of the wind turbine.

2.2. Consideration of Load Growth

This involves forecasting the rise in electricity load over 24 h within a specific region or power system. Accurate enhancement of dynamic load models is essential for the effective design and expansion of electrical systems, guaranteeing the dependable fulfillment of future energy demands. Various factors, such as population growth and the establishment of new industrial plants, drive increasing power demand within networks. The demand growth coefficient for each load category in a given year is presented in [24] below:
P l m = C m × P l i n i t i a l
where P l m is the duration of the load cycle at mth year, Cm is the growth in the load coefficient, and P l initial is the duration of the load cycle in the initial year.

2.3. Uncertainty Modeling

Uncertainty in distributed generation refers to the study of the uncertainty and potential error in the performance and integration of distributed sources of energy. This is achieved by examining factors such as producing output, load requirements, and the effects of environmental factors. Knowledge of these uncertainties is essential to the best planning, operation, and integration of DG into the electricity system. Predicting the output power from PV and wind entails different uncertainties deriving from the unpredictable nature of DGs, like PV radiation and wind speed. Therefore, to guarantee efficient planning and maximum exploitation of renewable resources, it is vital to include these uncertainties in the forecasting process. To calculate the uncertainties, the PV radiation, wind, and demand of the load are predicted. Subsequently, the power generated through solar and wind can be determined using Equations (1) and (2). It is crucial to remember that there will always be deviations between the anticipated values and the true readings, as calculated by [25]
d P w = 0.8 × P w i n d
d P P V = 0.7 × P S o l a r
d P L = 0.6 × P L

2.4. Battery Energy Storage System

To determine the state of charge (SOC) of the battery in both charging and discharging modes, Equations (6) and (7) are applied as follows:
S o C ( t + 1 ) = S o C ( t ) + η c h arging P b W b Δ t
S o C ( t 1 ) = S o C ( t ) + P b η d i s c h arg e × w b Δ t
P B E S S = P S o l a r + P W i n d + P F C P L η i n v

2.5. Loads

Load, which results from consumers’ stochastic behavior, is one of the reasons for uncertainty in power networks. Typically, a normal PDF is used to model load uncertainty in terms of Equation (22):
f P l o a d P l o a d = 1 2 π σ l o a d 2 exp P l o a d η l o a d 2 2 σ l o a d 2 , P l o a d 0
where f P l o a d P l o a d denotes the normal probability density function used to model load uncertainty, η l o a d represents converter efficiency, σ l o a d represents the standard deviation value, and P l o a d represents the load.

2.6. Problem Formulation of Energy Management and Objective Function

This paper demonstrates the optimization of an Energy Management System (EMS) for a Multi-Microgrid (MMG) network that incorporates Distributed Energy Resources (DERs), where the overall aim is to reduce the operating costs and enhance the reliability of the system. To achieve such objectives, a multi-objective EMS model is applied, and a day-ahead scheduling policy is adopted. The suggested solution adequately addresses uncertainties associated with variable generation of Renewable Energy Resources (RERs), load variations, and unstable electricity costs, which improves the timeliness of MMG activities in a grid. The primary focus is on assessing the balance between the Energy Generation Cost (EGC) and the Loss of Power Supply Probability (LPSP) when considering DER operations constraints and the power balance in the system as a whole.
The Energy Management System (EMS) problem is designed to reduce the Energy Generation Cost (EGC) across a 24 h period by considering overall system costs, which include initial investment, operation and maintenance (O&M) expenses, and costs associated with equipment replacement, as outlined in the following respective equations:
S o l a r C o s t = N S o l a r cost C a p i t a l S o l a r + cost O & M S o l a r ( 1 + i ) n 1 i ( 1 + i ) n
W T C o s t = N W T C o s t C a p i t a l W T + C o s t O & M W T ( 1 + i ) n 1 i ( 1 + i ) n
F C C o s t = N F C C o s t C a p i t a l F C + C o s t O & M F C ( 1 + i ) n 1 i ( 1 + i ) n
B E S S C o s t = C o s t C a p i t a l B E S S + C o s t O & M B E S S ( 1 + i ) n 1 i ( 1 + i ) n +                                         C o s t Replacement B E S S k = 1 n n B E S S 1 ( 1 + i ) n 1 i ( 1 + i ) k n B E S S
The Total Present Worth (TPW) of the multi-microgrid was calculated using the following equation:
TPW = Solar C o s t + W T C o s t + F C C o s t + B E S S C o s t + P o w e r C o s t P u r c h a s e P o w e r C o s t S e l l
where NSolar, NWT, and NFC are the numbers of solar modules, wind turbines, and fuel cells, respectively. SolarCost, WTCost, FCCost, and BESSCost are the investment costs of solar, wind turbine, fuel cell, and the battery energy storage system, respectively.
Simultaneously, the Energy Generation Cost (EGC) can be determined, representing the actual cost of producing energy from Distributed Energy Resources (DERs) and the utility grid. This calculation can be performed over short timeframes, such as daily, monthly, or annually, for short-term planning purposes, as presented in Equation (17)
E n e r g y   G e n e r a t i o n   C o s t   ( E G C ) = T P W i = 1 8760 P L Capital   Recovery   Factor

Objective Function (O.F)

At each scheduling interval, the energy management system is evaluated by minimizing the operational expenses using a day-ahead planning strategy. This approach focuses on lowering both the energy generation cost and the Probability of Power Supply Deficit (PPSD), as outlined in the related equations.
O . F 1 = M i n i m i z e   ( E G C )
The index of Probability of Power Supply Deficit (PPSD) can be evaluated as follows:
P P S D = P L P S o l a r + P W T + P F C + P B E S S + P B u y P S e l l P L
The PPSD objective is defined as follows:
O . F 2 = M i n i m i z e ( P P S D )
O b j e c t i v e   F u n c t i o n = M i n i m i z e   ( O . F 1 ,   O . F 2 )
Constraints:
P S o l a r + P W T + P F C + P B E S S + P B u y P S e l l = P L + P D
P S o l a r min ( t ) P S o l a r ( t ) P S o l a r max ( t )
P W T min ( t ) P W T ( t ) P W T max ( t )
P F C min ( t ) P F C ( t ) P F C max ( t )
P B E S S min ( t ) P B E S S ( t ) P BESS max ( t )

3. Methodology

The Prairie Dog Optimization (PDO) algorithm is a meta-heuristic algorithm based on the social and survival behaviors of prairie dogs. This section describes the mathematical model of the algorithm and optimization processes. In the wild, prairie dogs have many activities that they engage in, such as foraging, avoiding predators, keeping their burrows, and looking out for new resources. They adopt sophisticated communication strategies, such as vocal and body communication, to communicate information about threats, food sources, and environmental changes. One of the most interesting facts about their behavior is that they learn to distinguish various kinds of predators and modify their reactions to specific hunting strategies.
In order to describe the mathematical behavior of prairie dogs, a number of assumptions are stipulated:
  • The population comprises a specific number of prairie dogs, denoted by np, which are grouped into m cliques.
  • The entire population is distributed across multiple precincts, with members of the same clique assigned within the same precinct.
  • At the start, each precinct contains ten burrows, and this number progressively increases to 100 as iterations advance.
  • Two distinct types of signals are considered: one for identifying new food sources and another for implementing anti-predator strategies.
  • The optimization process is divided into two primary phases: the exploration phase, dedicated to searching for resources and creating burrows, and the exploitation phase, which concentrates on defensive actions against predators.
  • Similar processes are conducted by other cliques within their respective precincts, and the search space is partitioned accordingly.
  • These exploration and exploitation procedures are iteratively performed based on the number of existing cliques in the system.
The PDO optimizer begins, as do most metaheuristic algorithms, by randomly generating its initial population. Each coterie consists of np individuals, where np is the total number of prairie dogs. The position of the mth individual within any of the total coteries (i) is then established using the expression below:
C o T = C o T 1 , 1   C o T 1 , 2           C o T 1 , n 1     C o T 1 , n C o T 2 , 1   C o T 2 , 2           C o T 2 , n 1   C o T 2 , n         :             :         C o T m , p                 :                 : C o T k , 1   C o T k , 2           C o T k , n 1   C o T k , n
where CTm,p represents the value of the pth dimension corresponding to the mth coterie in the colony.
P D O = PDO 1 , 1   PDO 1 , 2 PDO 1 , n 1   PDO 1 , n PDO 2 , 1   PDO 2 , 2 PDO 2 , n 1   PDO 2 , n         :               :               PDO m , p         :               :           PDO k , 1   PDO k , 2 PDO k , d 1   PDO k , m
where PDOm,p denotes the pth dimension of the mth prairie dog within a coterie, with ki. The positions of each coterie and their respective prairie dogs are initialized using a uniform distribution, as illustrated below.
C o T k , m = U 01 × ( U P B m L O B m ) + L O B m
P D O i , j = U ( 0 , 1 ) × ( UPB m L O B m ) + L O B m
where UPBm and LOBm denote the upper and lower boundary values for the mth dimension of the optimization search space.
For each prairie dog, its solution vector is input into the fitness function to evaluate the objective function at its location. The resulting fitness values are then stored in the corresponding array.
f ( P D O ) = f 1 ( [ P D O 1 , 1   P D O 1 , 2 PDO 1 , n 1   P D O 1 , n ] ) f 2 ( [ P D O 2 , 1   P D O 2 , 2 P D O 2 , n 1   P D O 2 , n ] ) f .   ( [ ] ) f n p ( [ PDO k p , 1 P D O k p , 2 P D O k p , n 1   P D O k p , n ] )
Any optimization algorithm depends on exploration. The Prairie Dog Optimization (PDO) algorithm considers these behaviors, such as foraging and building burrows, as a way to accomplish this. Prairie dogs, when they realize that their existing food supply is limited, instinctively proceed to another site and actively search the expanded search area to find improved resources or solutions that could best fit the problem. Likewise, burrowing holes play an important role in their survival, as they protect against attacks by predators and form a stable and safe habitat. This resembles how the algorithm ensures diversity in the search process.
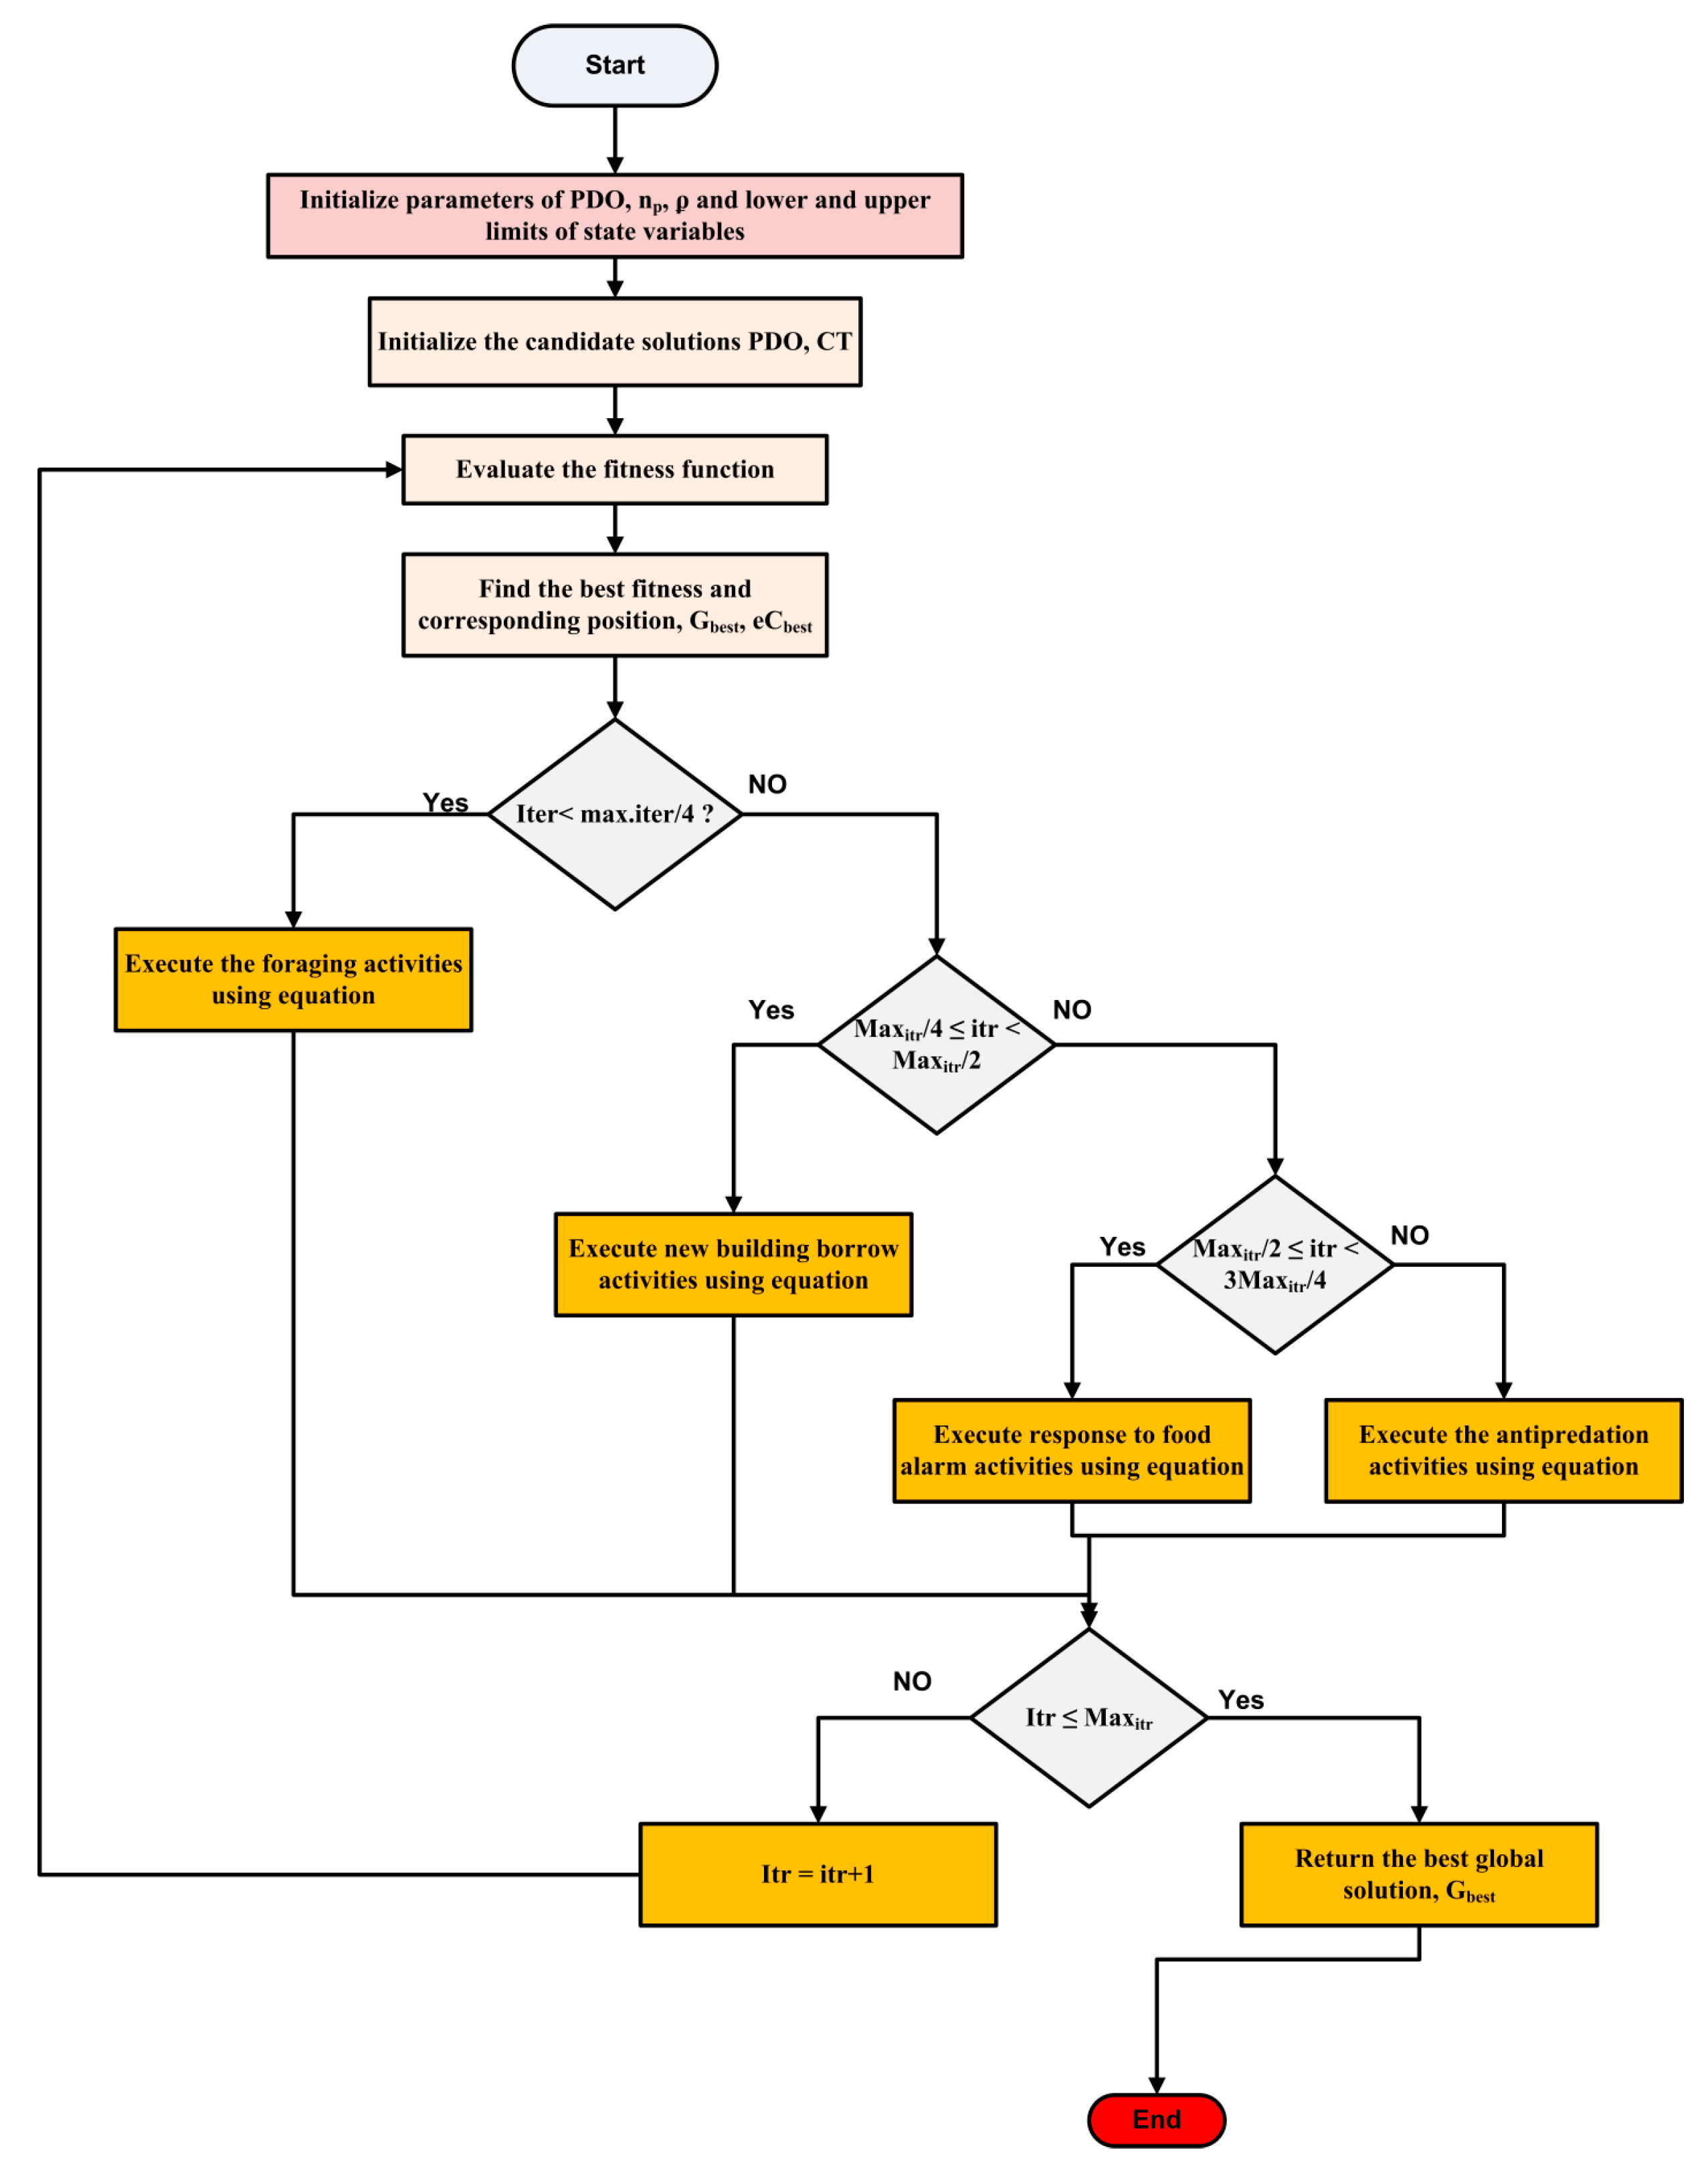
Prairie dogs normally live in colonies that are subdivided into particular regions or family groups. In these areas, the various groups engage in group exploration and excavation of burrows. They can only move to new regions as a result of predation. Equally, the Prairie Dog Optimization (PDO) algorithm works in two major stages—exploration and exploitation—in four scenarios. The overall number of iterations is divided into four parts. The former two are exploratory, and the latter two are exploitative. In particular, the first two parts, which are devoted to exploration, are implemented when the current iteration (iter) is less than Maxiter/4, or between Maxiter/4 and Maxiter/2.
P D O k + 1 , p + 1 = G best k , p e C b e s t k , p × ρ C P o D k , p × L e v y ( n )             i t e r < M a x i t r 4
P D O k + 1 , p + 1 = G b e s t i , j × r P o D × D S × L e v y ( n p )       M a x i t r 4 i t r < M a x i t r 2
where Gbestk,p represents the global best solution found so far, and eCbestk,p assesses the influence of the current best solution, as defined in the corresponding Equation (17).

3.1. Exploitation Phase

This section describes the exploitation action of the PDO algorithm. The optimization process in this stage is based on the response of prairie dogs to two kinds of signals. Prairie dogs have different calls that they use in various contexts, such as informing about food or the danger of predators. All these communication and social interaction abilities are very vital, as they help them fulfill their nutritional requirements and enhance their defense systems. These actions can be denoted in the following mathematical figures:
P D O k + 1 , p + 1 = G b e s t k , p e C b e s t k , p × τ C P o D k , p × r a n d   M a x i t r 2 i t r < 3 M a x i t r 4
P D k + 1 , p + 1 = G B e s t k , p × P E × r a n d                     3 M a x i t r 4 i t r < M a x i t r
where P denotes the influence of a predator as in the equation below, and τ is a small constant that represents the quality of the food supply available.
P E = 1.5 × 1 i t r M a x i t r 2 i t r M a x i t r

3.2. Flow Chart

Figure 3 presents a stepwise description of the Prairie Dog Optimization (PDO) algorithm, which is a nature-inspired metaheuristic algorithm based on the social and survival activities of prairie dogs. The algorithm starts with set parameters, including the population size, the decision variables’ boundaries, and the candidate solutions. Each candidate’s fitness is evaluated to determine the global best solution. The optimization process proceeds iteratively, and based on the current iteration, different prairie dog behaviors are simulated to guide the search. In the early stages (less than 25% of the max iterations), foraging activities are executed to explore the search space broadly. In the next phase (25% to 50%), new building borrow activities represent social cooperation and knowledge sharing to refine solutions. As iterations progress (50% to 75%), the response to food alarm activities simulates alert reactions to guide the population away from poor regions. In the final stage (75% to 100%), antipredation activities mimic defense behaviors, helping the population intensify the search around promising areas (exploitation). The loop continues until the maximum number of iterations is reached, after which the best global solution found by the prairie dog colony is returned.

3.3. ANFIS-Based Forecast of PV and Wind Uncertainty

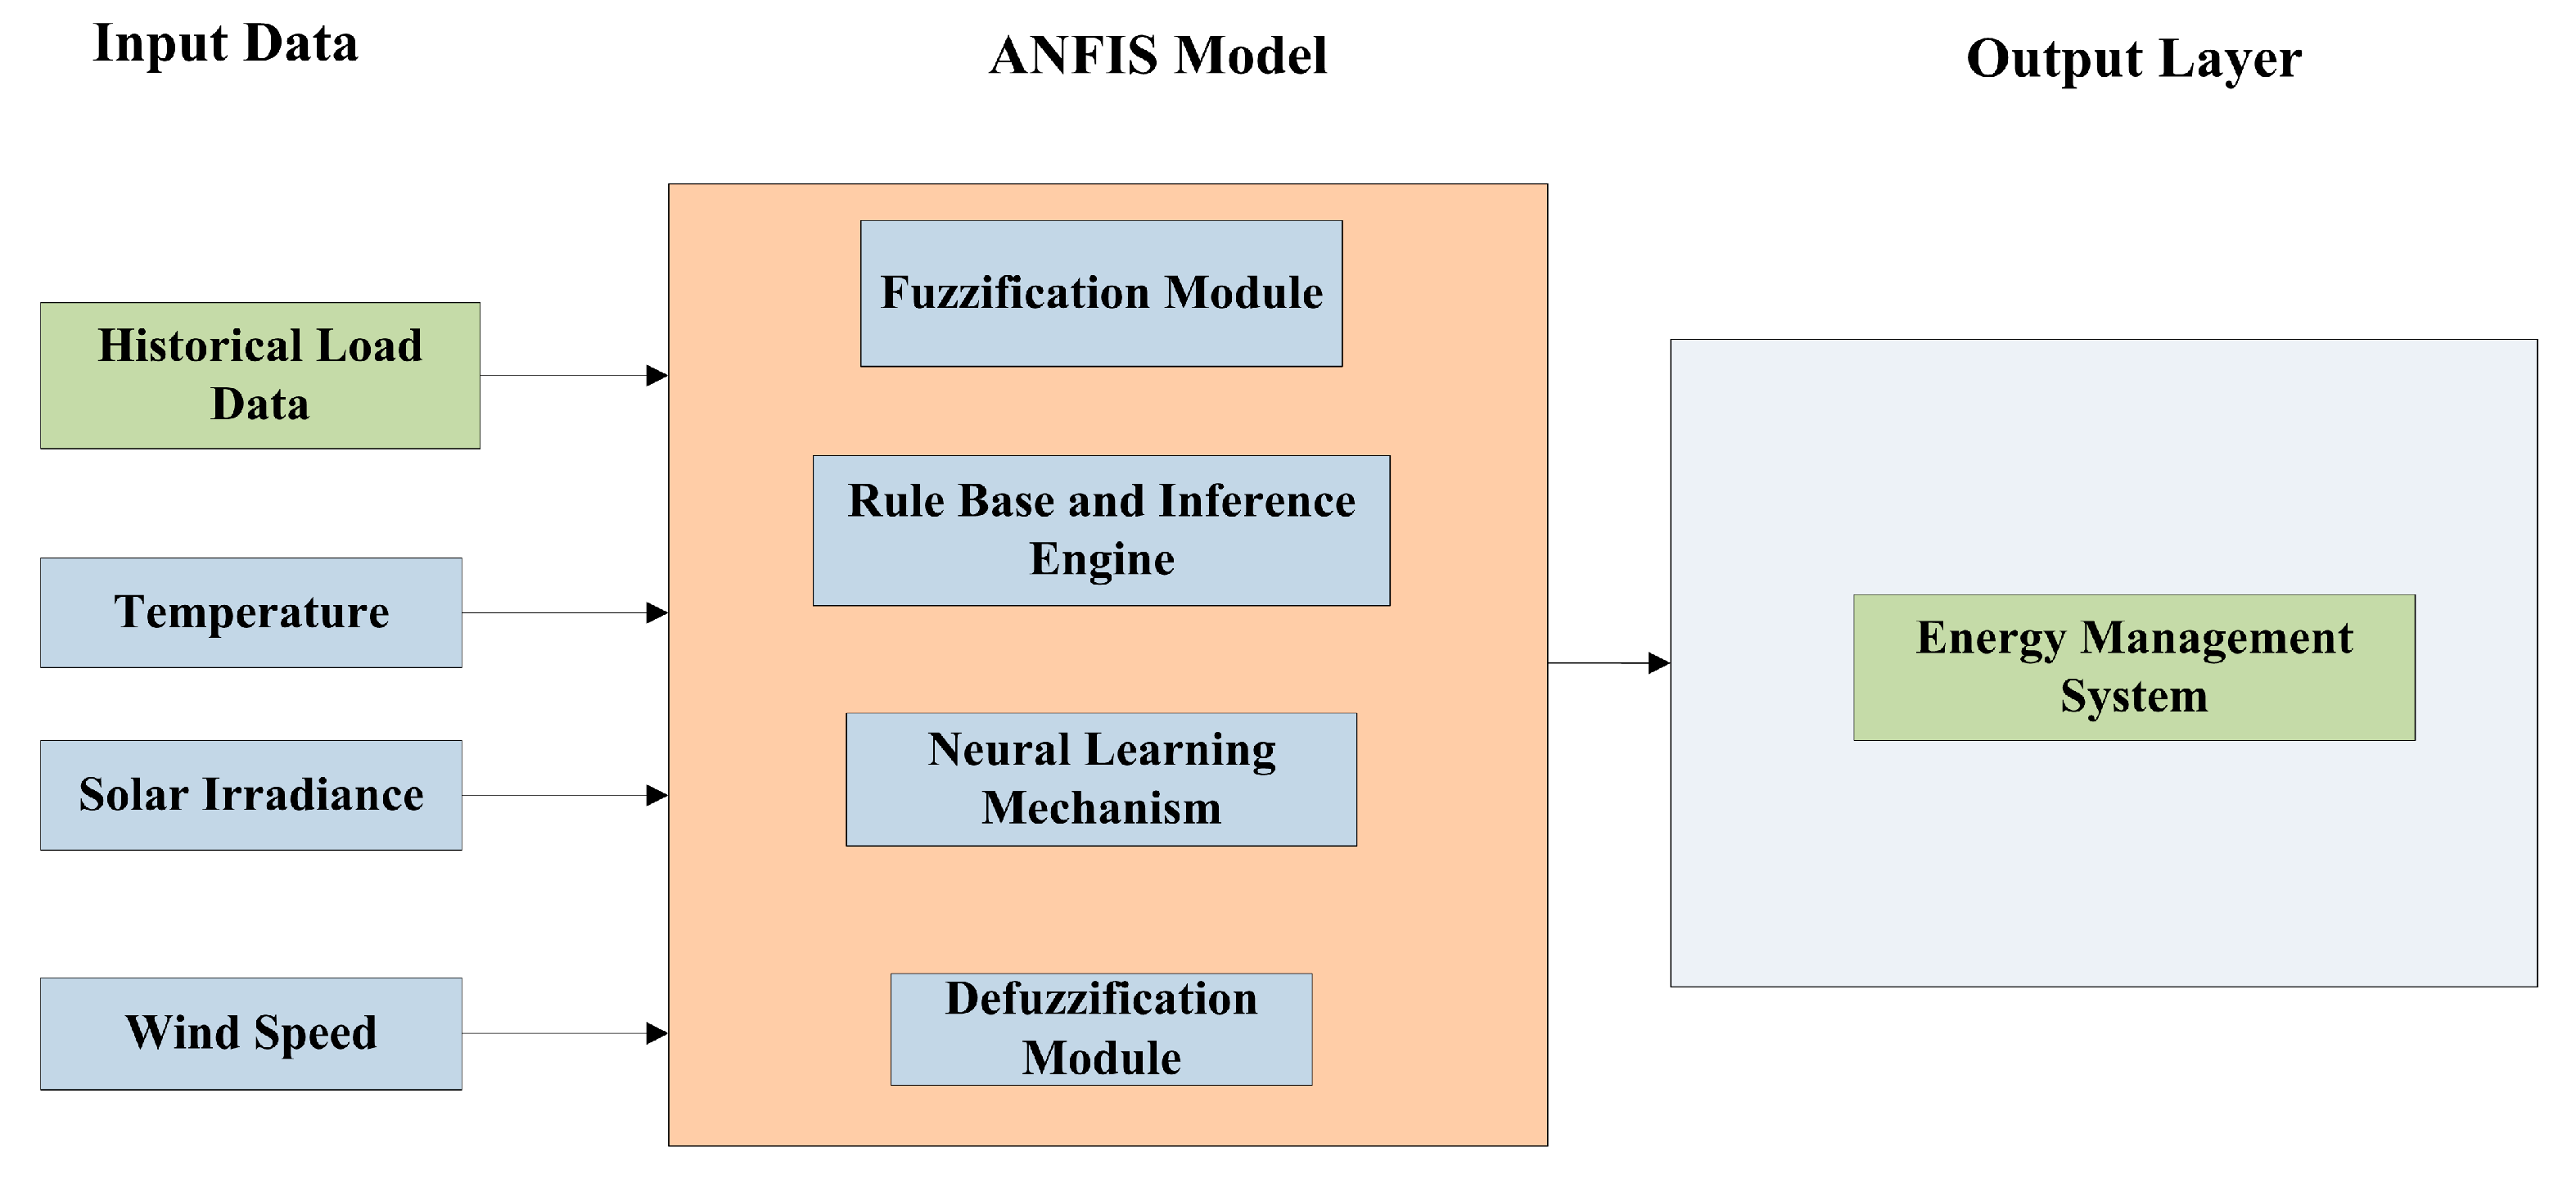
The Adaptive Neuro-Fuzzy Inference System (ANFIS) is a hybrid computational model that integrates the learning capabilities of neural networks with the reasoning principles of fuzzy logic. Specifically, the Sugeno-type ANFIS employs a hybrid learning mechanism that combines least squares estimation with the backpropagation gradient descent technique to optimize the parameters of the fuzzy inference system based on input–output training data. By applying neural learning strategies, ANFIS effectively tunes both the structure and parameters of a Fuzzy Inference System (FIS), thereby enhancing its accuracy and adaptability. This approach enables the model to automatically derive fuzzy rules from data, offering advantages such as fast convergence, high accuracy, strong generalization, and transparent interpretability through the fuzzy rules. Moreover, it facilitates the seamless integration of both numerical data and linguistic information, making it an efficient and versatile tool for various scientific and engineering applications. Essentially, the neuro-fuzzy framework allows the fuzzy system’s structure and rule parameters to be dynamically identified and optimized through the adaptive learning capability of a neural network. Figure 4 presents an ANFIS model for forecasting the uncertainty in PV and wind turbines.
To simplify the forecasting model, photovoltaic (PV) generation data were normalized to represent a 10 kW system. Figure 4 presents an ANFIS model for forecasting the uncertainty of PV and wind. A total of 1440 data samples, corresponding to hourly measurements collected over a 60-day period, were utilized to train the forecasting framework.

3.4. Performance Parameters of the Proposed Prairie Dog Optimization Algorithm

To assess the significance of the proposed Prairie Dog Optimization in addressing the energy management problem, the following indices are utilized:

3.4.1. Overall System Loss Index (OVSLI)

The Overall System Loss Index is evaluated using Equation (37).
O V S L I = O V S L W i t h   O p t i m i z a t i o n O V S L W i t h o u t   O p t i m i z a t i o n
where OVSLWith Optimization is the overall system loss with optimization, and OVSLWithout optimization is the overall system loss without optimization.

3.4.2. Energy Generation Cost Index of the Multi-Microgrid System (EGCI)

The Energy Generation Cost Index of the multi-microgrid is evaluated using Equation (38):
E G C I = E G C I W i t h   o p t i m i z a t i o n E G C I W i t h o u t   o p t i m i z a t i o n
where EGCI With Optimization is the energy generation cost of the multi-microgrid system ($ with optimization, EGCI Without optimization is the base case operating cost of the multi-microgrid system without optimization.

3.4.3. Greenhouse Gas Emission Factor (GGEF)

Reductions in greenhouse gas emissions of the multi-microgrid are evaluated using the following Equation (39):
G H G E F = G H G e m i s s i o n s   W i t h o u t   o p t i m i z a t i o n G H G e m i s s i o n s   W i t h   o p t i m i z a t i o n G H G e m i s s i o n s   W i t h o u t   o p t i m i z a t i o n

4. Simulation Results and Discussion

4.1. Validation of Proposed Prairie Dog Optimization

The mathematical validation of the proposed Prairie Dog Optimization is presented in this section by comparing it with other optimization techniques using the CEC2020 benchmark function, which incorporates various statistical performance metric parameters. In this section, the proposed PDO performance is assessed on 10 benchmark functions from the CEC2020 test suite to validate its effectiveness by comparing it with seven existing optimization techniques, including Grey Wolf Optimization (GWO), Particle Swarm Optimization (PSO), Tabu Search Algorithm (TSA), Whale Optimization Algorithm (WOA), Stochastic Paint Optimizer (SPO), Harris hawks optimizer (HHO), and the Sine Cosine Algorithm (SCA).
Each algorithm was executed independently 30 times, with a population size of 30 and a maximum of 1000 iterations, to ensure a fair and consistent comparison. The performance evaluation considered the minimum, maximum, mean, and standard deviation fitness values, along with the Wilcoxon rank-sum test p-values.

4.1.1. Statistical Results

This section presents the statistical results of PDO, which are compared to other optimization techniques as discussed in the previous section. Table 4 presents a comparison of the statistical results of PDO with existing optimizations. In the table, it can be observed that PDO attained the leading position in seven benchmark functions. These findings confirm the effectiveness and competitive strength of the proposed approach. Furthermore, the PDO algorithm demonstrates strong and consistent performance when compared to other competing methods, attaining optimal values for most of the CEC2020 benchmark functions.
As shown in Table 4, the PDO outperformed the other well-established optimization algorithms based on the Friedman rank test results. The PDO exhibited remarkable effectiveness across several benchmark problems. In particular, it took the first place (rank number 1) in functions F2, F4, F6, F8, and F9 with minimum values, meaning that it is better able to find optimal solutions or near-optimal solutions. This underscores the strength and the flexibility of the PDO in dealing with various optimization issues. PDO is always one of the most successful algorithms when it comes to average results. In example number 2 (function F2, F3, F6, F9, and F10), it obtained very competitive average values, highlighting its balanced search mechanism that effectively balances its exploration and exploitation processes.

4.1.2. Convergence Characteristics

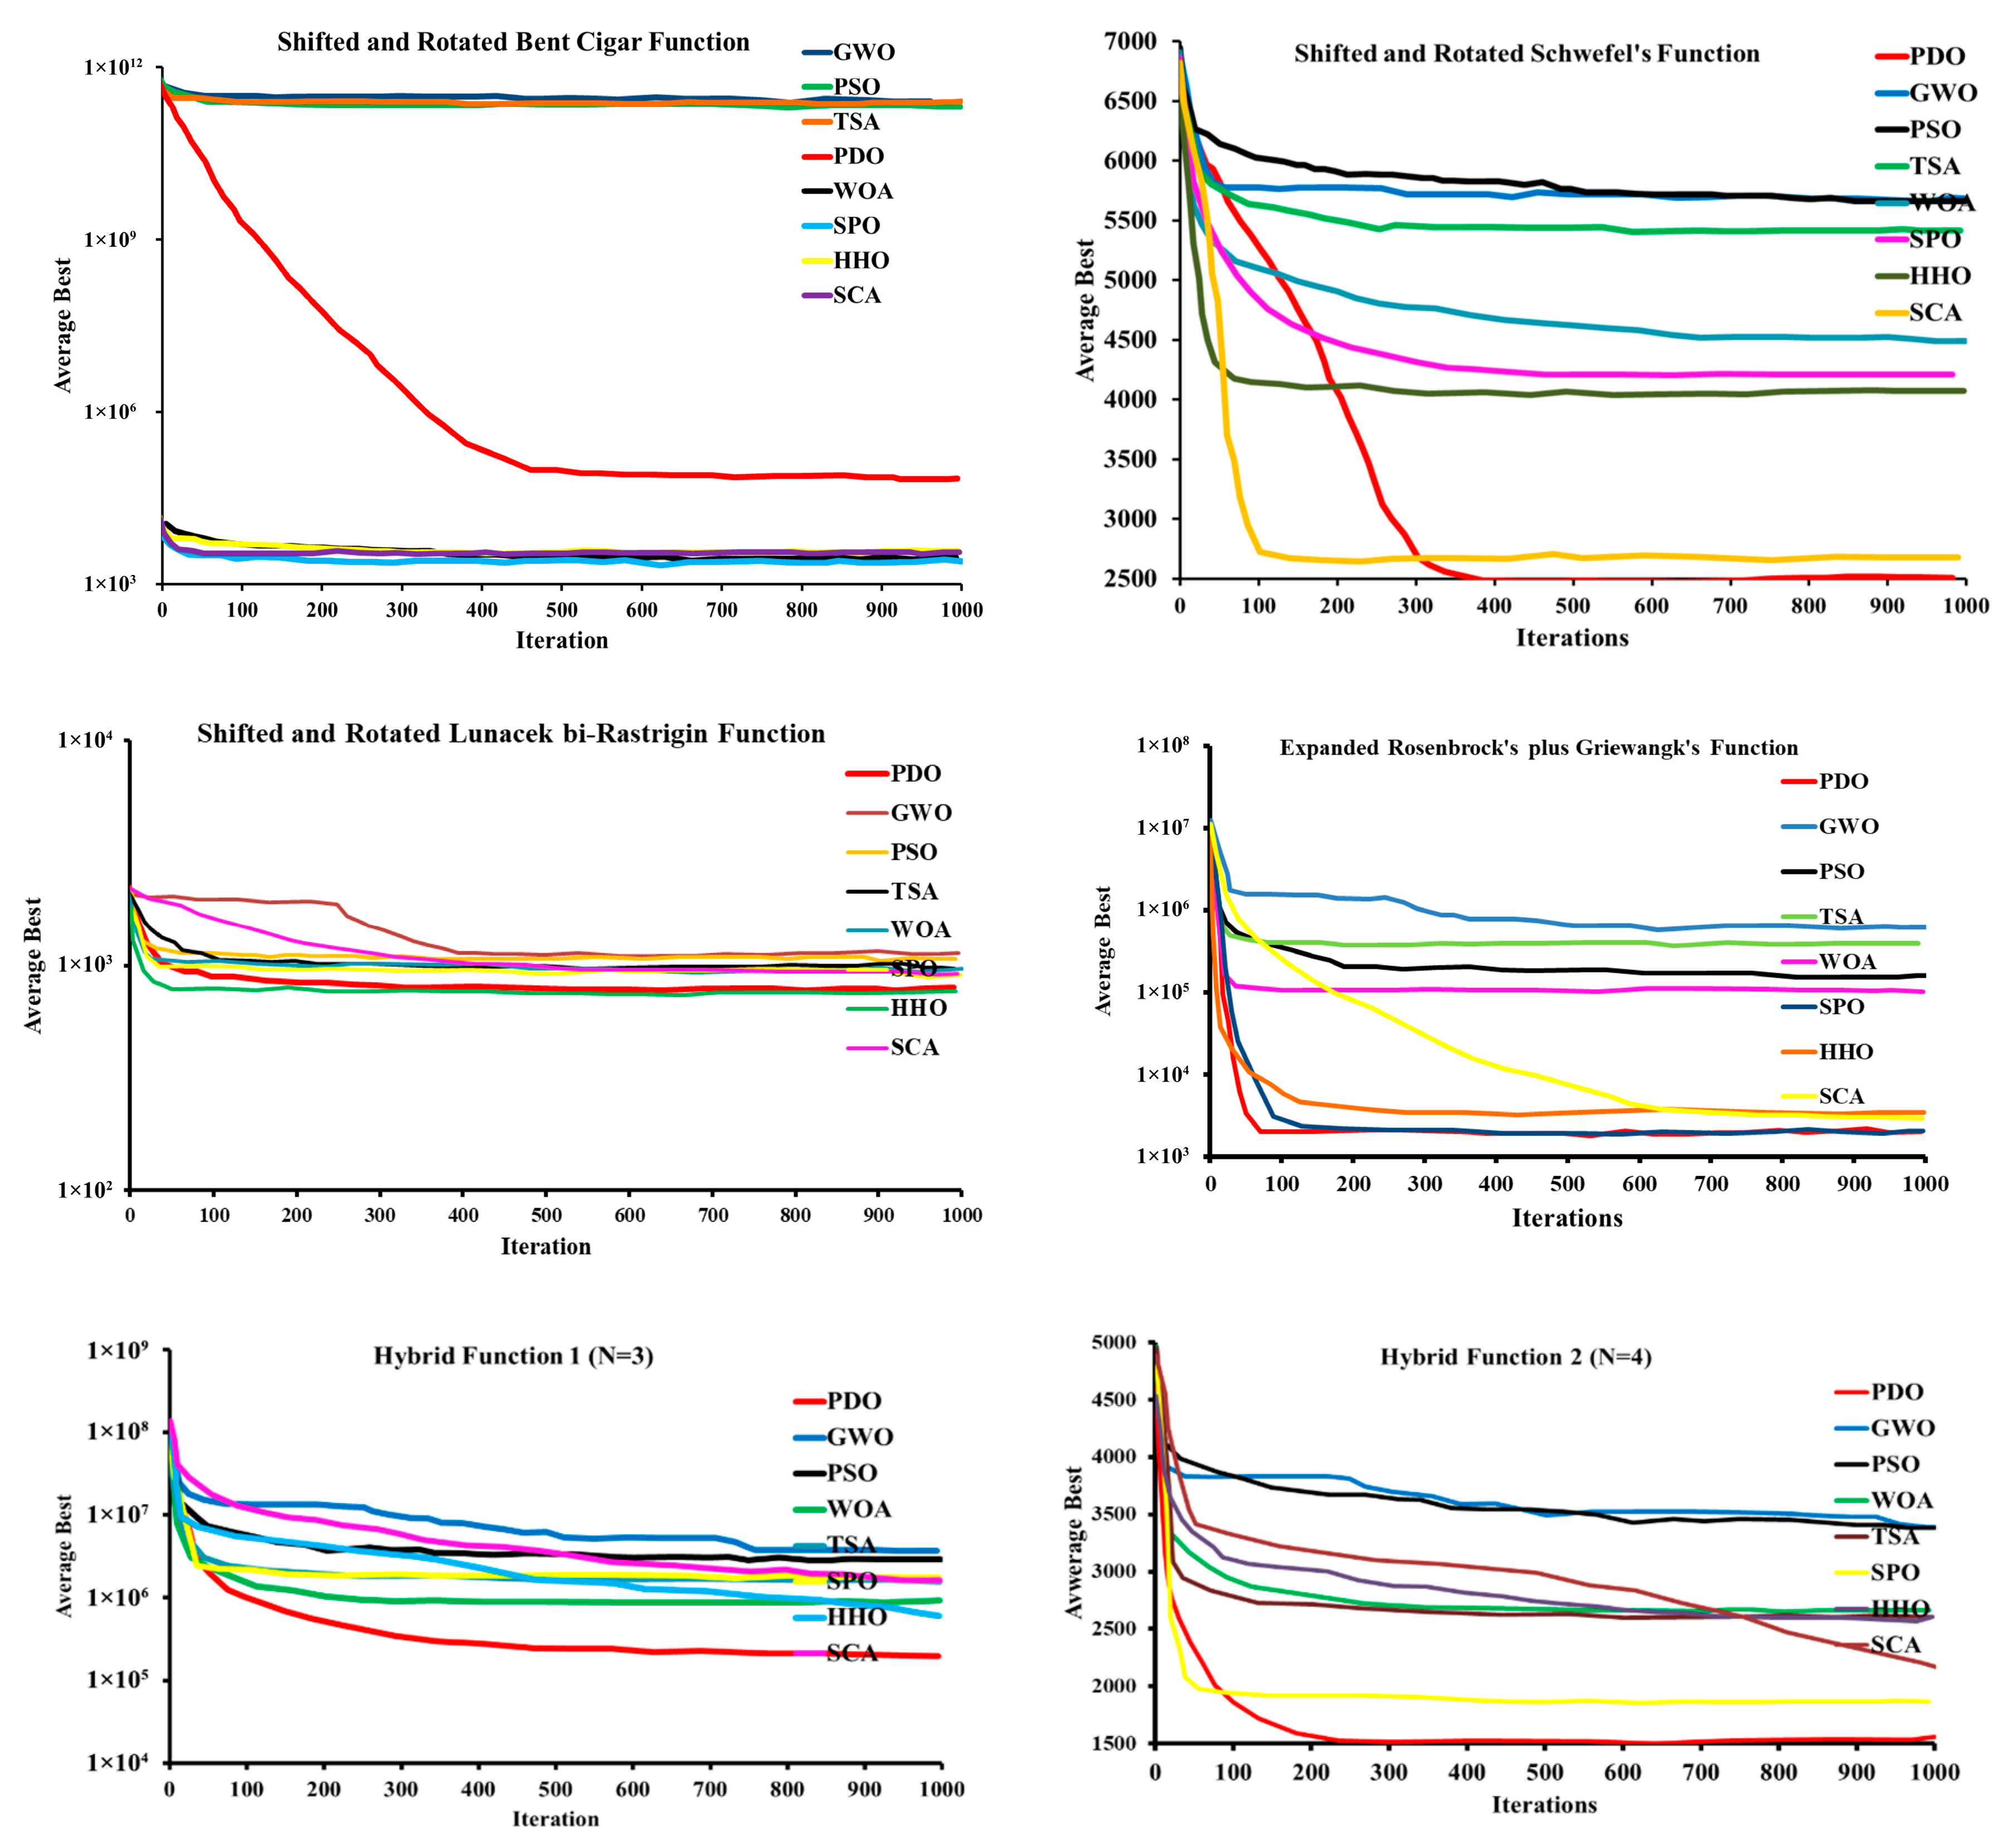
This section presents the convergence behavior of the PDO algorithm for ten benchmark functions from the CEC2020 suite, considering a dimension size of 10. Figure 5 presents the convergence characteristics of all compared optimizers. From Figure 5, it is clear that the proposed PDO converged significantly faster than the other algorithms, especially for functions F2, F3, F4, F6, F8, F9, and F10. In a few instances, such as F1, F5, and F7, the PDO tended to settle near a local optimum rather than reaching the absolute best solution. The fast convergence capability of PDO demonstrates its suitability for real-time or online optimization problems.

4.1.3. Analysis Using the Wilcoxon Rank-Sum Test

To confirm the reliability of the results obtained by PDO and the other compared algorithms, the Wilcoxon rank-sum test was applied. This non-parametric statistical test helps verify that the observed differences in performance are statistically significant rather than occurring by chance. The outcomes of this analysis, conducted at a 5% significance level for most benchmark functions, are presented in Table 5. The findings clearly indicate that PDO is a robust and well-formulated optimization approach capable of consistently achieving high-quality solutions.

4.2. Simulation Results of Proposed Prairie Dog Optimization for Energy Management Problem of Multi-Microgrid Systems

The proposed Prairie Dog Optimization method was applied to the energy management problem of MMG systems, as shown in Figure 2. The results are organized into three distinct categories: two corresponding to the grid-connected mode, with and without load management, aimed at minimizing the Energy Generation Cost (EGC) and %Probability of Power Supply Deficit (PPSD), which are discussed below. The simulations were performed in the MATLAB 2021a environment on a Windows 10 system equipped with a Core i7 CPU, 16 GB RAM. The results are shown for the following case studies:
Case-i: Day-ahead scheduling of a multi-microgrid system without load management.
Case-ii: Day-ahead scheduling of a multi-microgrid system with load management.
Case-i: Day-ahead scheduling of a multi-microgrid system without load management.
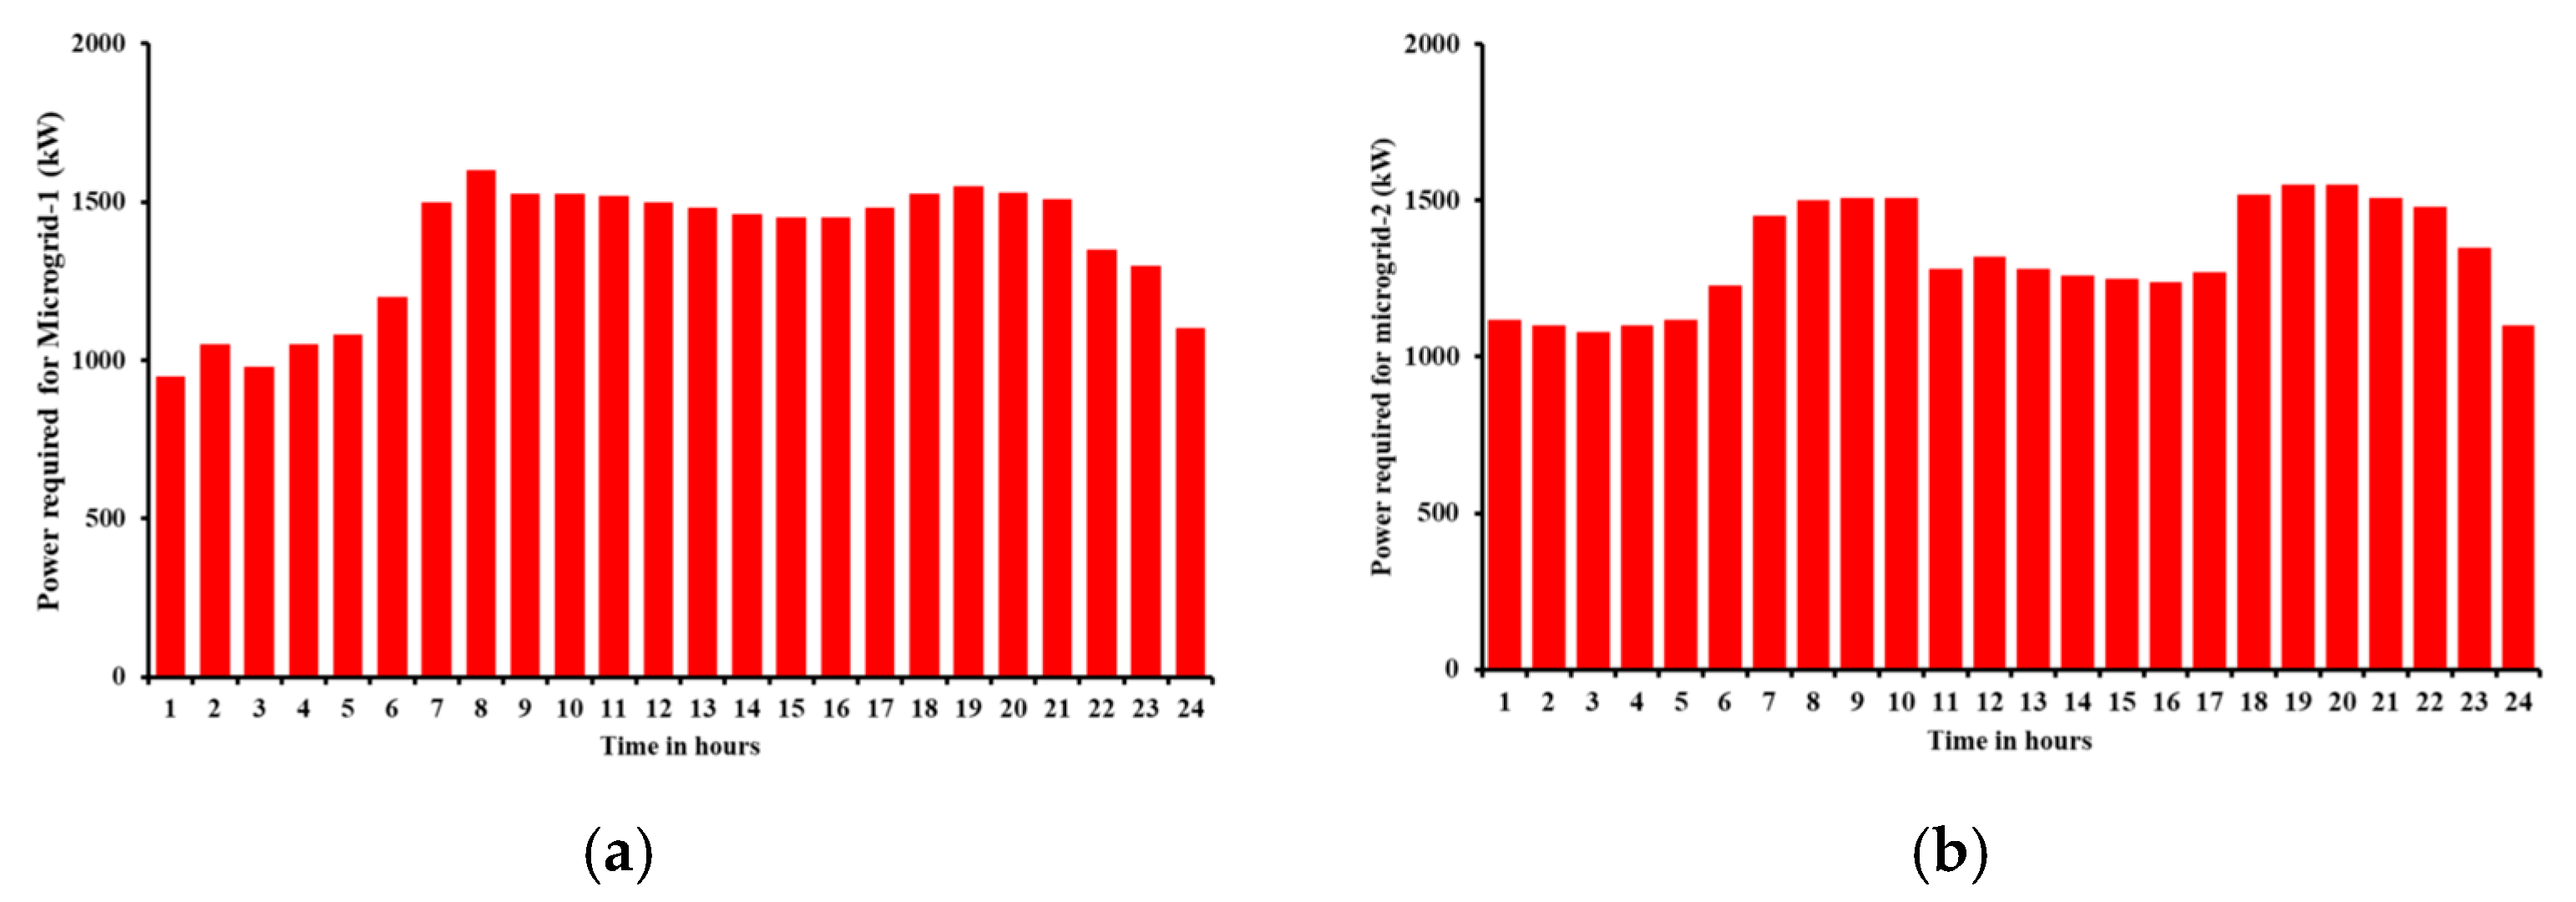
Before the implementation of load management strategies, Multi-Microgrid (MMG) systems operate in a decentralized manner, where each interconnected microgrid autonomously manage its local generation, demand, and power exchange with neighboring microgrids or the main utility grid. In this uncoordinated operational state, the power demand within individual microgrids fluctuates according to inherent consumption patterns, often leading to temporal mismatches between generation and demand. This has the effect of causing regular shortages in some microgrids, which require the importation of power, and excess power in others, leading to suboptimal power flow within the system. The simulation findings for the 24 h-ahead scheduling of the multi-microgrid in the absence of load management are shown in Figure 6.
Table 6 represents the performance gains in Microgrid-1, which were obtained following optimization against its pre-optimized condition. The reduction in peak demand, between 1100 kW and 820 kW, was very high, at 20.7 percent, which shows that there was very effective peak shaving due to timely scheduling. The average demand grew, albeit at a small rate of 1.9, but it demonstrates a more equal and balanced distribution of the load. The peak-to-average ratio decreased by 22.2 percent, leading to a flatter and more stable load curve. The use of distributed generation (DG) increased to 91.4 percent, with higher renewable energy input and reduced curtailment, whereas the use of energy storage systems (ESS) increased significantly to 61.1 percent. With a better mechanism for charging and discharging operations, the exchange of power between the interconnected microgrids increased by more than two times, which encouraged shared energy and coordination. This means that grid imports decreased by 26.2, which decreased reliance on the main utility grid. The reduction in operational costs by 23.6 percent was also a result of the best dispatch strategies. In addition, system voltage deviation was reduced by 60 percent, which enhanced voltage stability within the network. Overall, the efficiency of the MMG system improved to 94.1% compared to 82.4% with minimal error, proving it to be more reliable, better at energy management, and cost-effective.
The optimization framework was efficient in optimizing the load profile of the multi-microgrid system by coordinating the scheduling of distributed generation (DG) units, energy storage systems (ESS), and inter-microgrid power exchanges. The system experienced a steep demand spike at 9 AM before optimization due to uncoordinated load behavior and less utilization of local resources. Once optimized, the flexible loads were rescheduled, the ESS units were discharged in a strategic way, and excess energy was distributed throughout interconnected microgrids. This coordination leveled the peak demand and increased the load balance, thus leading to a smoother and more stable demand curve. The optimized profile therefore exhibits enhanced use of renewables, less grid reliance, and leaner operation of the MMG than in its pre-optimized state. According to the solar irradiance and ambient temperatures in the profiles, it is possible to note that the output of the PV was zero prior to 4 AM, increased slowly to a minimum of about 27.5 kW between 4 and 5 AM, and peaked at 500 kW between 10 and 11 AM. The PV system stopped generating power after 4 PM, which means that it will generate power for about 10 h a day. Figure 6a presents the power hourly demand of Microgrid-1 within a 24 h period. It is interesting to note that the demand was highest between 8 and 9, with high demand of about 1900 kW, possibly because of the high activities in the morning. On the other hand, it peaked within hour 1, with a very low requirement of approximately 1500 kW, indicating low utilization in the late-night hours. During the day, there was relative stability in power demand between 1500 and 1900 kW, with the daytime power demand ranging from 1700 to 1800 kW between 10 and 16 h, which indicates increased consumption between 10 and 16 h during the day because of commercial and residential activities. During the evenings, demand decreased at a slow pace, peaking at approximately 1600 kW at hour 21. Such a constant load pattern provides favorable input for the optimization of energy management strategies within the microgrid.
Table 7 shows the profile of the power of Microgrid-2 prior to and after optimization, highlighting considerable improvements in operational and energy management. Peak demand rose slightly (6.1% improvement) after optimization (820 kW to 870 kW) as demand shifted and better distributed generation (DG) became available. In spite of such an increase, the average demand increased by 8.7% and the both the load factor and system utilization increased. The ratio of the peak to average was reduced by only 2.5%, resulting in a smooth load curve despite high peaks. There was an increase in the DG utilization to 93.6% compared to 72.5%, which indicates an increase in the renewable energy generation and less dependence on the external grid. In the same manner, the use of energy storage systems (ESS) increased by 62.8 percent, with increased active usage of the storage during peak periods to achieve effective power balancing. The distribution of power among the microgrids was enhanced by 139.1 percent, indicating that there was enhanced inter-microgrid coordination and energy exchange. Consequently, grid importation fell by 27 percent, emphasizing increased self-reliance through local renewable production. The operational costs were also reduced by 21.8, indicating that the dispatch was cost-effective even though the peak load was slightly higher. Moreover, the voltage difference within the system was reduced by 55.6 percent, which guaranteed a better voltage stability and network reliability. In general, the efficiency of Microgrid-2 increased to 95.3% compared to 82.4%, which proves that optimization provided a higher level of energy consumption, minimized losses, and increased the overall level of system functioning.
The pre-optimization load profile of the Multi-Microgrid (MMG) indicates an unregulated consumption in the load profile, with sharp peaks during the day (particularly, between 8 and 11 A.M.) and low demand at night. In these peak times, the system was greatly reliant on grid power and diesel generators due to the lack of good management of renewable sources, like photovoltaic (PV) and wind energy, as well as battery storage. After applying optimization algorithms like PDO, PSO, and GWO, the scheduling and dispatch of distributed generation (DG) units, energy storage systems (ESS), and grid interactions were strategically adjusted to flatten the load curve by shifting portions of high demand to off-peak hours, maximizing renewable energy utilization, and minimizing grid imports and fuel-based generation. As a result, overall demand on the grid became smoother and more balanced, reducing peak magnitudes, filling demand valleys, lowering ramping requirements, minimizing power losses, and enhancing the overall stability and efficiency of the MMG system.
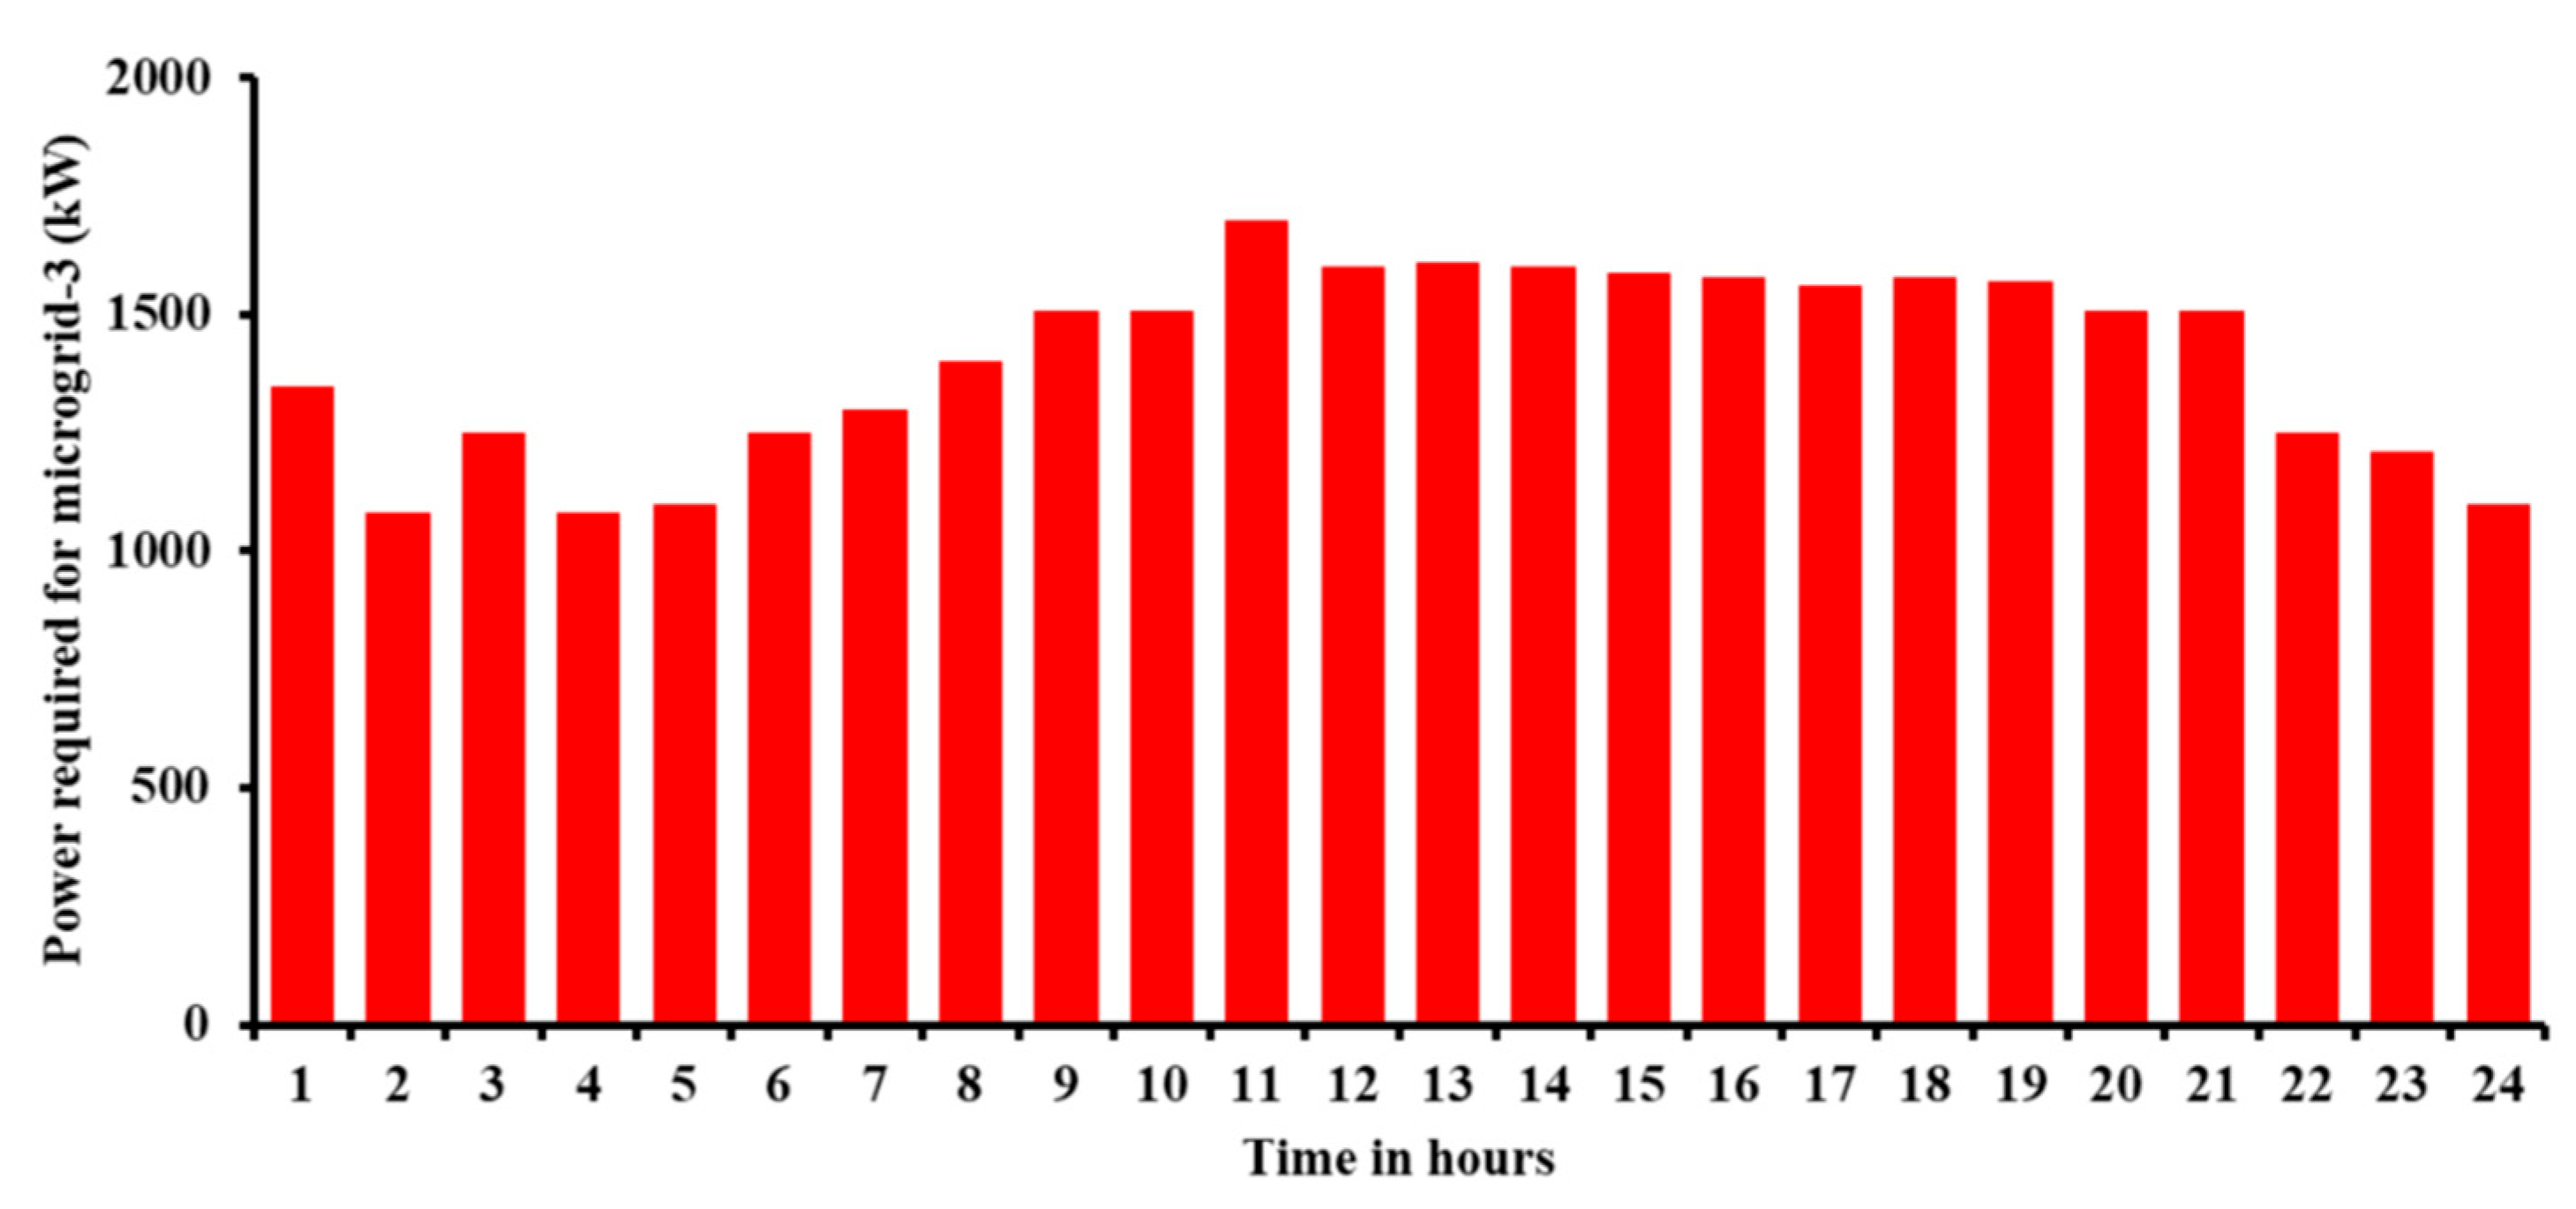
Figure 7 displays the hourly power requirements for Microgrid-2 over a 24 h period, measured in kilowatts (kW). Throughout the day, power requirements exhibited a relatively stable pattern, predominantly ranging between 1000 kW and 1300 kW. The peak demand occurred between 7 and 8 h and was about 1300 kW, probably because of morning activities, when residential energy consumption is usually high. Conversely, the poorest demand, about 1000 kW, occurred in the first hour of time, which can be attributed to less activity in the early morning. The graph indicates slight variations throughout the day, with the majority of hourly values around 1100 kW to 1200 kW, indicating a steady energy consumption trend. This predictable demand trend can enable effective energy management and resource distribution within the microgrid so that it can appropriately fulfill the diverse needs of its users throughout the day. The hourly power demands of Microgrid-3 are shown in Figure 7 in kilowatts (kW). Over the period under observation, power requirements varied, although most of the time they stayed in the range of around 1200 kW to 1600 kW. It is worth noting that the highest demand of about 1600 kW was registered at approximately hour 12. This value indicates increased energy needs noted in the middle of the day, and they are largely affected by normal home consumption and peak demand activities. In contrast, the lowest demand, about 1200 kW, occurred within hour 1, which is a result of reduced activity during late-night hours. The demand profile shows that there were slight fluctuations, with the largest figures being between 1300 kW and 1500 kW during daylight hours. This uniform trend in energy use offers useful ideas for effective utilization of energy and design planning for the microgrid, improving its ability to satisfy the various needs of users throughout the day.
Case-ii: Day-ahead scheduling of a multi-microgrid system and load control
The introduction of the Distributed Energy Resources (DERs) and Renewable Energy Sources (RESs) into the Multi-Microgrid (MMG) has brought major challenges in terms of operations because of the intermittent and stochastic capacity of renewable generation and the fluctuations in load demand. To cope with these complexities, an efficient Energy Management System (EMS) is necessary in order to streamline power production, storage, and delivery processes among interconnected microgrids. The inclusion of Load Management (LM) strategies into the EMS framework can also lead to the improvement of system reliability and flexibility of operations since they allow for dynamic control of consumer load profiles. Load management is a process that can change, defer, or reschedule non-critical loads in response to the state of the system, price indicators, or the availability of generation capacity, thus minimizing peak demand, alleviating network congestion, and enhancing the overall economic and operating efficiency of the MMG system.
Table 8 presents the Microgrid-3 power profile before and after optimization, demonstrating increased performance of the system and better coordination. The overall load demand rose after optimization by 6.6% (9800 kWh/day to 10,450 kWh/day), which means that the load can be better accommodated and curtailment is minimized. The peak demand increased by 11 percent to 910 kW, with a larger share being served in the daytime hours. The average demand increased by 10.6 percent, indicating increased utilization of the available generation capacity. Irrespective of this increase in load, there was no change in the peak-to-average ratio at 1.58, showing even distribution of demand. The use of distributed generation (DG) increased significantly from 72.5 to 94.2, guaranteeing the optimum use of renewable sources. Additionally, energy storage system (ESS) usage increased significantly to 67.4, demonstrating charging and discharging optimization to meet large loads efficiently. The number of power exchanges between microgrids increased by 156.5 percent, which demonstrates enhanced cooperation in energy and better support between microgrids. The increase in total demand indicates that grid imports were reduced by 22.8 percent, that is, there was less reliance on external power due to the improved internal coordination. The operational costs were reduced by 17.6, which indicates that efficient scheduling and dispatch compensated for the extra use of energy. The voltage deviation was reduced by 51.1 percent, guaranteeing a steady operation at higher loads. Altogether, system efficiency increased by 82.4 to 93.8, which proves that the optimization positively impacted the reliability, renewable integration, and performance of Microgrid-3 on a network scale.
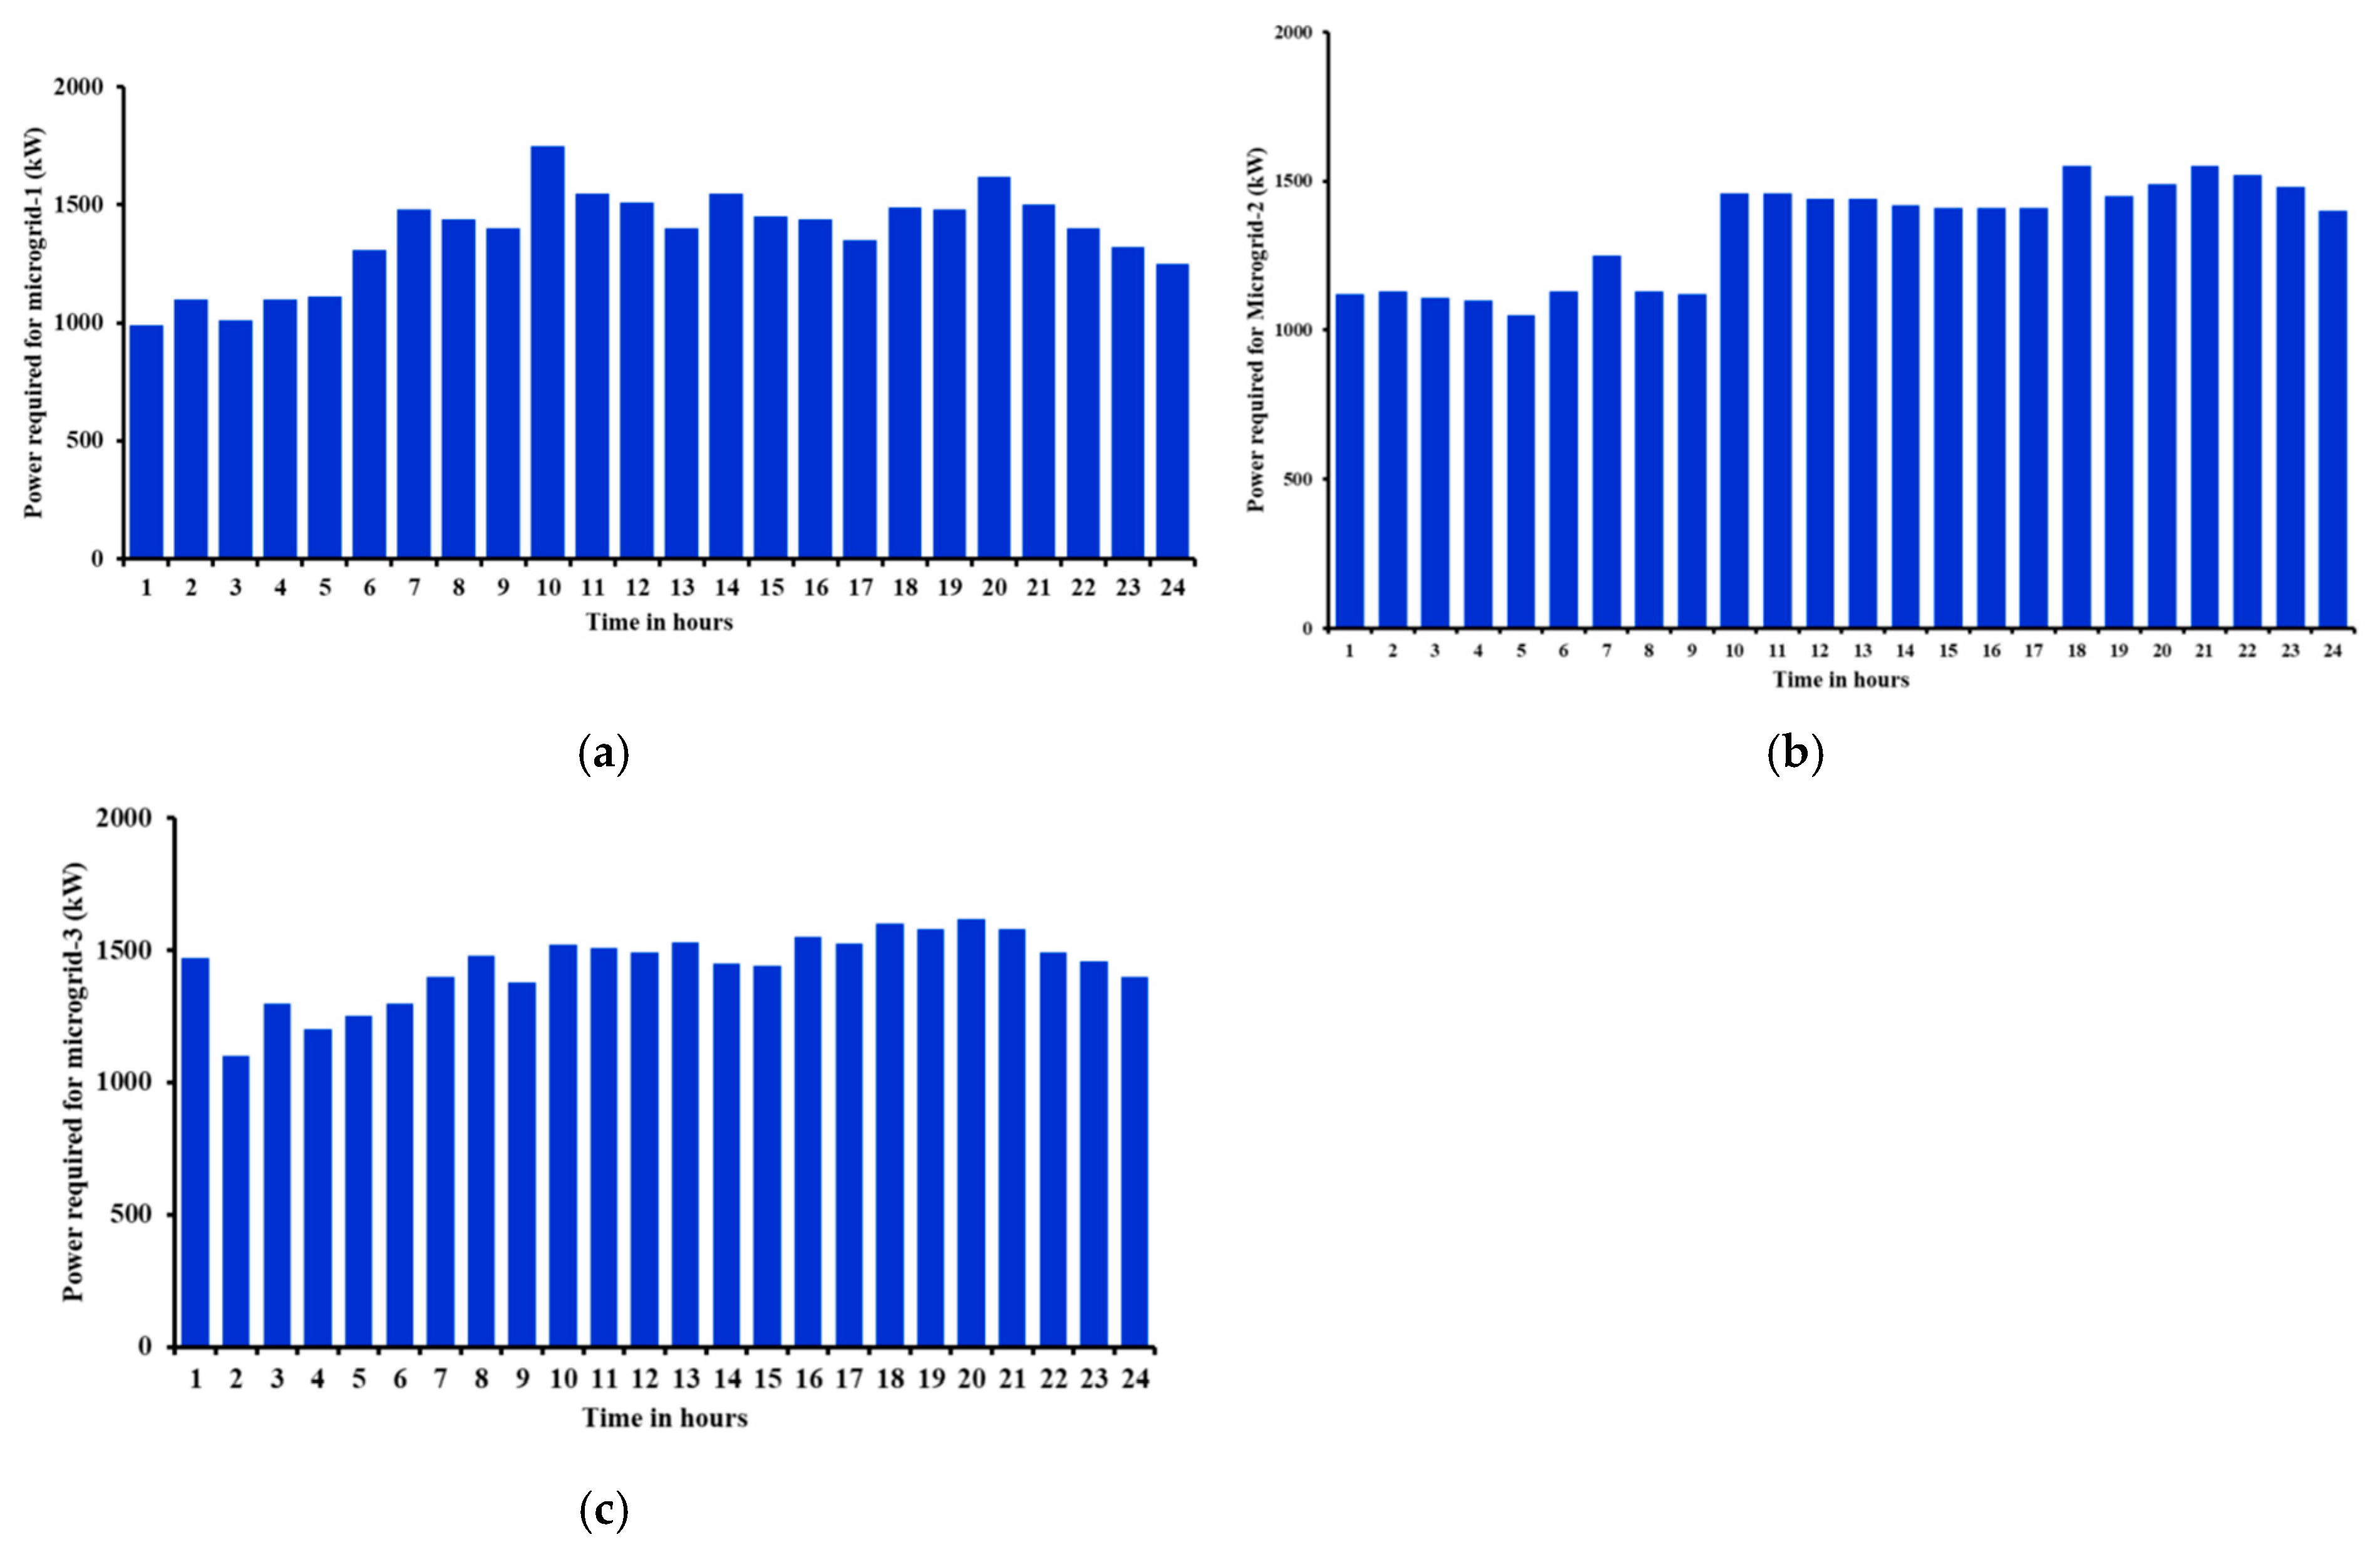
The optimization system significantly improved the Multi-Microgrid (MMG) system in terms of the load profile because it synchronized the scheduling of distributed generation (DG) units, energy storage systems (ESS), and energy exchanges between the interconnected microgrids. The peak of demand in the system before optimization was very high at 9 AM, which was primarily caused by uncoordinated demand curves and a lack of local renewable resources and storage. After optimization, flexible loads were rescheduled, ESS units were discharged appropriately, and excess energy was effectively shared amongst the microgrids. This synchronized activity effectively minimized peak demand, harmonized the load, and generated a smoother and more steady demand curve. Consequently, the optimized situation was characterized by increased use of renewable energy, reduced reliance on the main grid, and greater cost effectiveness than the pre-optimized condition. In addition, the photovoltaic (PV) system recorded zero output prior to 4 AM, commenced producing power at about 27.5 kW, and then increased to about 500 kW between 10 and 11 AM, depending on the solar irradiance and temperature conditions. PV production decreased to zero after 4 PM, meaning that solar power was provided to the system for approximately 10 h a day. Figure 8a presents a full analysis of the profile of the hourly power demand in Microgrid-1 over a steady 24 h period of operation, with all the measurements in kilowatts (kW). The data demonstrates that the load behavior was dynamic, with slow and sudden changes in demand during the day. First, the power demand started at about 980 kW during the first hour, and then slightly increased to about 1080 kW during the second hour. The demand was not very high during the early morning hours, but then it rose sharply starting at hour 6, reaching a peak of about 1480 kW at hour 7. The peak power load was 10 h, which was the highest, with a peak power load of almost 1750 kW, possibly due to increased residential, commercial, or industrial activity in the mid-morning hours. Later, the demand profile demonstrates moderate stability with fluctuations between 1350 kW and 1550 kW throughout the remaining hours. There was a secondary peak at hour 20 of about 1600 kW, which could be due to evening domestic or commercial load bursts. Demand decreased slowly thereafter and finished the 24 h period at about 1250 kW. Such a fine-grained timeline load profile provides useful operational information, requiring a high degree of resource scheduling and demand prediction in Microgrid-1 and careful management of power exchange to ensure grid stability and efficient operation.
The Multi-Microgrid (MMG) system had a disproportionate load profile, where there were considerable lead peaks during the day, especially between 8 and 11 AM, and low consumption at night. In these peak periods of demand, the grid supply and diesel generators played a significant role in the system because the coordination of renewable fuels (photovoltaic (PV) and wind power) and battery storage systems was inefficient. Following the application of optimization algorithms, such as PDO, PSO, and GWO, the functioning and dispatch of distributed generation (DG) units, energy storage systems (ESS), and grid interfaces were optimally structured to redistribute load, transfer part of the peak demand to off-peak periods, improve the use of renewable energy sources, and minimize grid imports and fuel-based generation. Consequently, the overall demand curve became smoother and more balanced, with reduced peak loads, shallower demand valleys, lower ramping efforts, and minimized transmission losses, ultimately improving the stability, efficiency, and operational reliability of the MMG system. Figure 8b presents the profile of the hourly power demand on Microgrid-2 during the 24 h operational period, where all the values are in kilowatts (kW). The demand started at around 1150 kW in the first hour and remained in a relatively constant state between 1100 and 1150 kW until the ninth hour. It was observed that the power demand increased significantly after hour 10, followed by a sharp rise in demand to about 1450 kW. This represents a high demand level throughout the day, which consistently stayed between 1400 kW and 1550 kW. The peak load on the system occurred at the 18th hour and 21st hour, with each point having a peak load of about 1550 kW. Although the demand decreased slightly after the first hour, it was relatively high at about 1400 kW, which means that consumption was high during late working hours. This also indicates a change in the pattern of higher and constant power demand during the second half of the day, which could be explained by longer periods of operational activities, ongoing industrial activities, or higher residential and commercial loads in the Microgrid-2 network. The temporal demand profile provides useful data on the nature of loads in Microgrid-2, highlighting the importance of energy management process and tactical dispatch planning to ensure the reliability and efficiency of the system. Figure 8c presents a 24 h operational cycle of the power demand of Microgrid-3, where all the values are expressed in kilowatts (kW). The power demand begin at about 1470 kW in the initial hour, then reduced significantly to about 1080 kW in the second hour. Subsequently, it started to rise gradually in the morning until it reached about 1480 kW in hour 9. Thereafter, the demand became stable between 1450 kW and 1550 kW in the mid-day and afternoon hours. Its peak demand was measured at hour 20 with the highest demand of about 1600 kW, which could have been due to increased evening operational loads or increased residential consumption. The power demand in the following hours slightly declined, and the 24 h period ended at around 1380 kW. This temporal load profile indicates that the base load was rather constant and the demand increase was quite considerable in the second half of the day. Such a pattern likely reflects the operational schedules, occupancy behaviors, and continuous industrial processes prevailing within Microgrid-3, emphasizing the importance of strategic demand forecasting and resource management to ensure optimal system performance and grid reliability.
In Table 9, it can be observed that prior to load management, the proposed PDO dominated in decreasing costs, losses, and voltage deviations compared with other optimization techniques, such as GWO and PSO. Similarly, by applying load management to a multi-microgrid system, the proposed PDO demonstrated superiority over the other optimizations in decreasing losses, voltage deviations, and costs. PDO clearly performed the best, achieving the lowest cost in both cases. The price dropped from 18,546.35 $ /kWh in Case-1 to 17,456.23 $ /kWh in Case-2, while GWO and PSO remained higher in both cases. For power loss, PDO again achieved better results, reducing losses slightly from 25.32 kW to 24.12 kW, whereas GWO and PSO showed higher losses overall. In terms of voltage deviation, which indicates how stable the system voltage is, PDO maintained the lowest values (4.7 × 10⁻⁶ and 3.8 × 10⁻⁶), meaning that the system was more stable and well-regulated compared to the other two methods. In total, these findings demonstrate that PDO is more effective and reliable in saving costs, reducing power loss, and increasing voltage stability in both situations, and it is the most efficient and stable optimization method.
Table 10 presents a comparative analysis of the cost of energy generation per hour for a Multi-Microgrid (MMG) system, analyzed using three metaheuristic optimization algorithms, namely, Prairie Dog Optimization (PDO), Grey Wolf Optimization (GWO), and Particle Swarm Optimization (PSO). The findings in monetary units per hour show that there were apparent fluctuations in the performance of cost minimization throughout the hours of operation. PDO resulted in a lower cost of generation throughout most periods of time, indicating that it is more effective in the optimization of operational costs in the MMG framework than the other two methods. As an example, at time hour 1, PDO achieved a cost of generation at 527.654, which is better than those of GWO (553.620) and PSO (578.960). This pattern of performance continued throughout the daily cycle, and the difference was very significant in the high-demand periods. PDO resulted in a cost of 725.140 at hour 9, compared to higher costs of 768.940 and 789.560 for GWO and PSO, respectively. All the algorithms exhibited their highest generation costs at hour 19, recording 912.560, 935.640, and 965.450 for PDO, GWO, and PSO, respectively. On the other hand, the minimum generation costs occurred at hour 8, where PDO was 312.560, performing better once again compared to GWO (339.420) and PSO (354.650). During the entire period of operation, GWO consistently produced intermediate generation costs in comparison with the costs of both PDO and PSO, while PSO exhibited comparatively low optimization efficiency in this application. These results clearly indicate that Prairie Dog Optimization (PDO) is the most cost-effective energy generation scheduling strategy for the given multi-microgrid system, with lower operational costs at all times compared to GWO and PSO throughout the 24 h scheduling horizon.
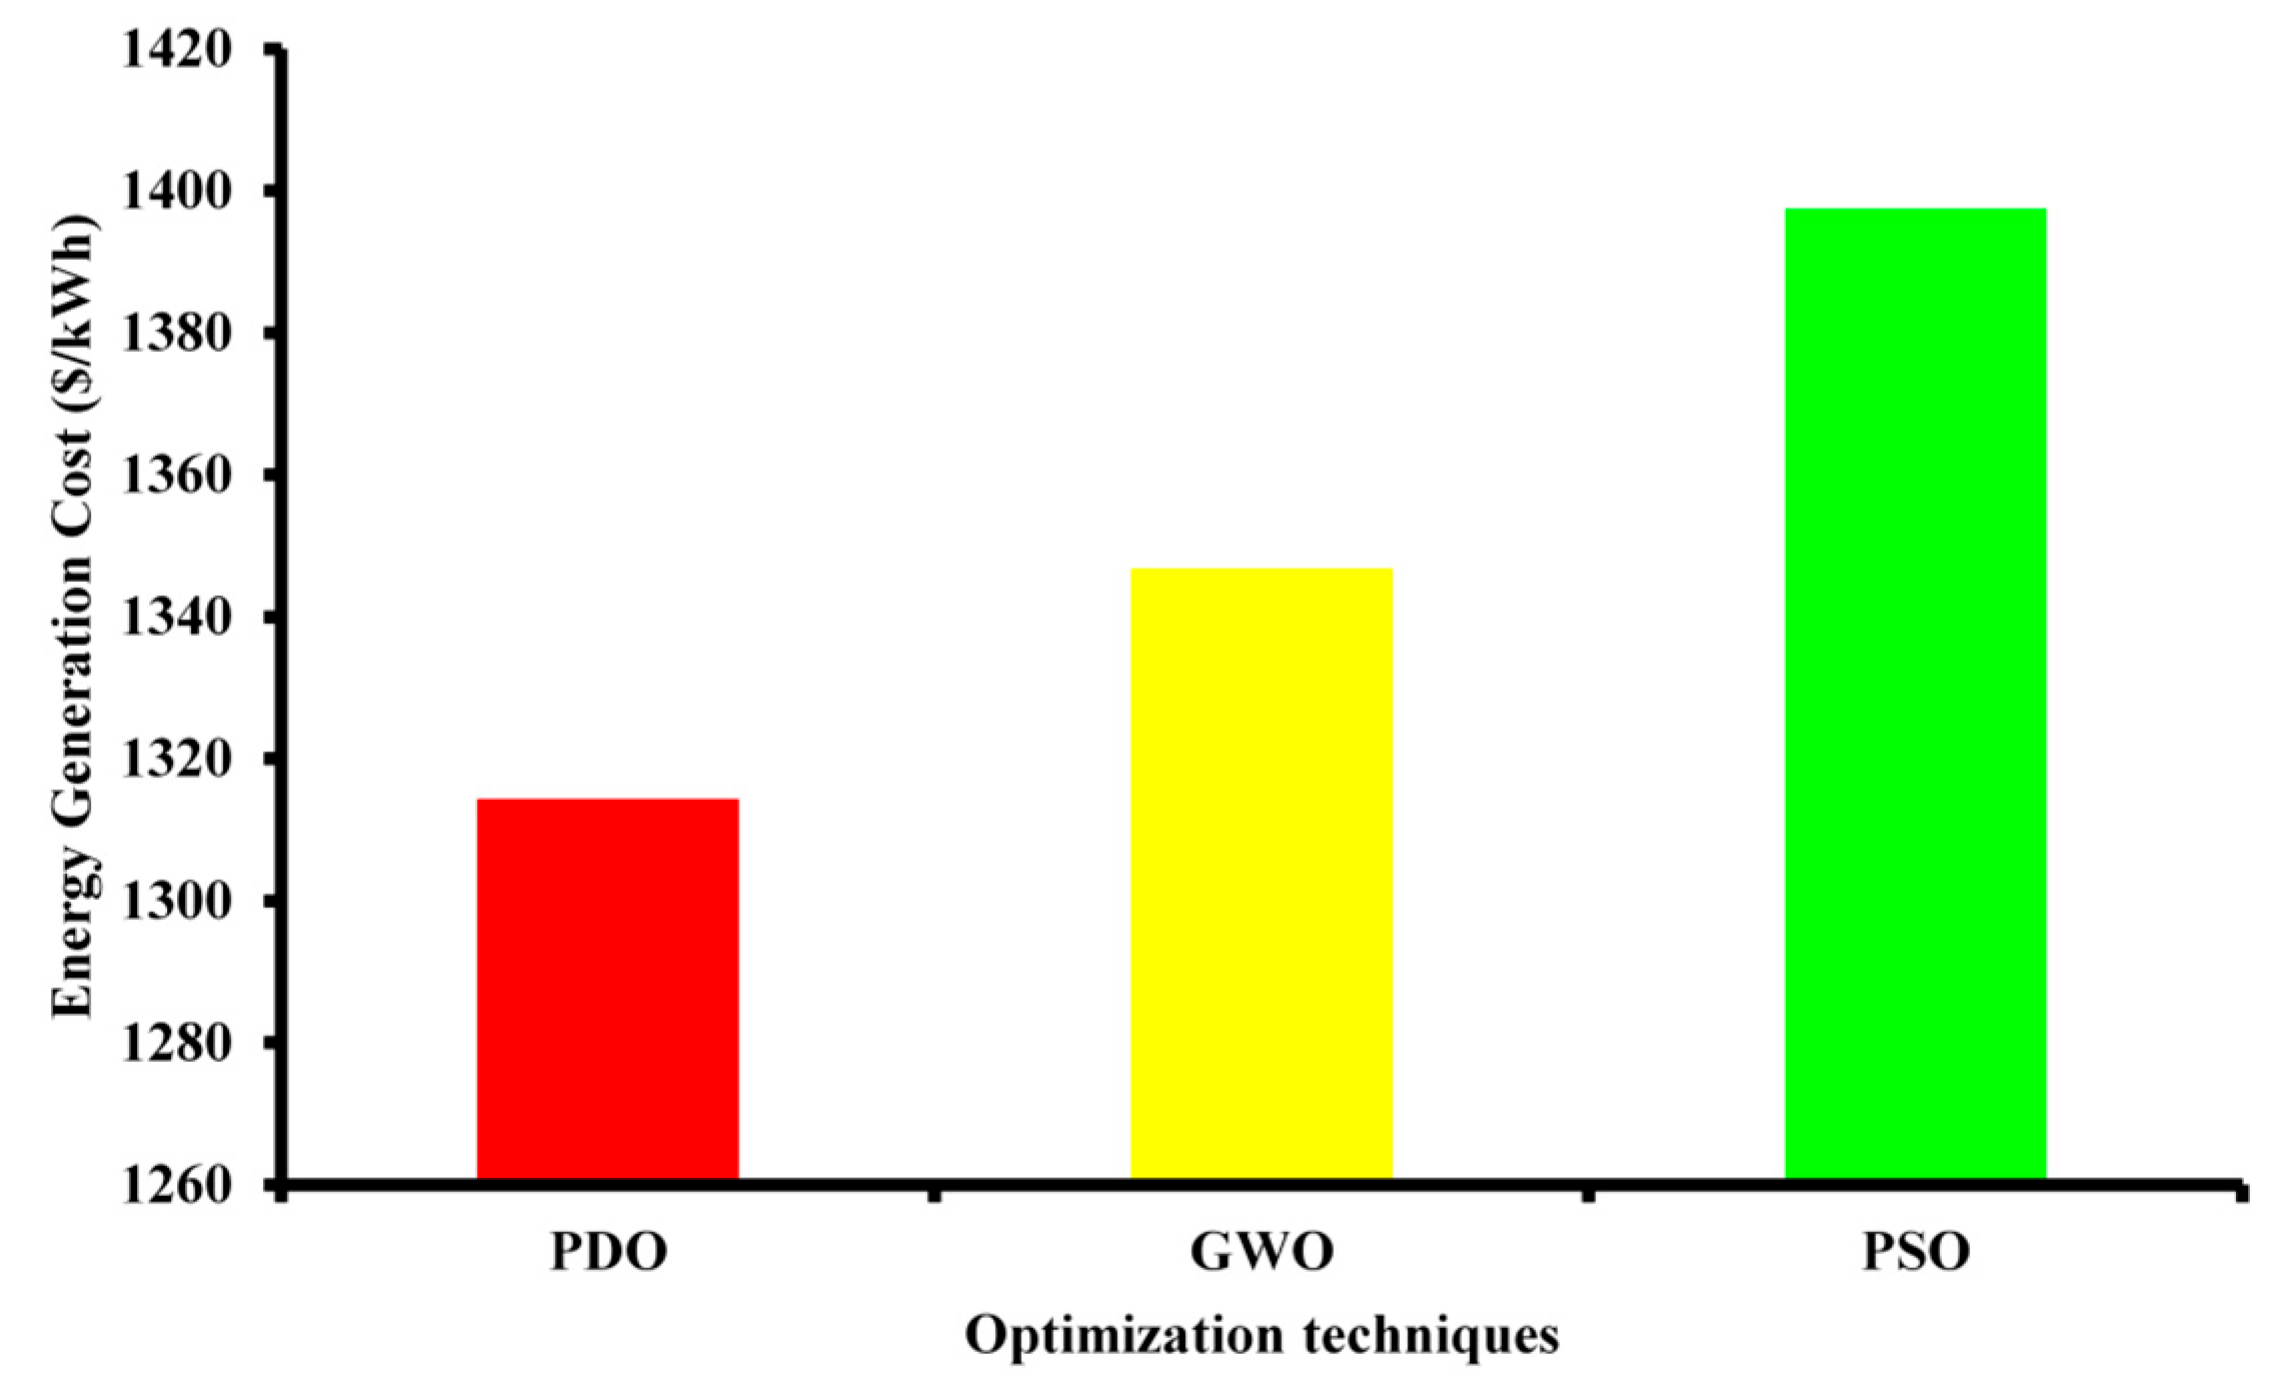
Figure 9 presents a comparative study of the total energy generation cost (in USD/kWh) of a multi-microgrid (MMG) system optimized by three different metaheuristic algorithms, namely Prairie Dog Optimization (PDO), Grey Wolf Optimization (GWO), and Particle Swarm Optimization (PSO). The cost-reducing efficiency of each algorithm is clearly shown by the results.
PDO resulted in the lowest total energy production cost of about 1315 USD/kWh, which means it is more optimal for decreasing operational costs. Comparatively, GWO resulted in greater generation costs, of about 1350 USD/kWh, whereas PSO resulted in the greatest costs at around 1400 USD/kWh. This trend was constant and indicates the relative efficiency of PDO compared to the other algorithms in providing cost-effective scheduling solutions to energy management in MMG systems. Differences in performance are visually apparent, where the bar representing PDO is clearly lower compared to those for GWO and PSO. Such results prove the previously made hourly cost comparisons and also prove that Prairie Dog Optimization is the most cost-efficient solution. Additionally, PSO, in this case, leads to a relatively high operational cost, even though it is widely used. Such comparative analyses are essential to select suitable optimization frameworks for energy management strategies for complex multi-microgrid systems that combine renewable and distributed energy resources.
Table 11 presents a comparison of optimization methods, including Prairie Dog Optimization (PDO), Grey Wolf Optimization (GWO), and Particle Swarm Optimization (PSO), based on cost in terms of energy generation and the likelihood of power supply deficit (PPSP). PDO resulted in the lowest cost of energy generation of 0.123 USD/kWh compared to GWO (0.89/kWh) and PSO (1.2/kWh), indicating that it is much better than the other two energy sources to ensure low operational costs. Also, the PPSP of PDO was lower (0.16) than that of GWO (1.5) and PSO (1.8), which proves that PDO is more efficient in the provision of stable power supply with a low risk of shortages. Overall, these findings indicate that the suggested PDO technique is the most cost-efficient and reliable of the compared optimization methods in terms of energy management performance.

5. Conclusions

This paper has shown that the Prairie Dog Optimization (PDO) algorithm is a useful tool in solving the multi-objective optimization problem of contemporary multi-microgrid systems. The proposed framework was able to optimize important operational parameters through the incorporation of different Distributed Energy Resources (DERs) like photovoltaic (PV) systems, wind turbines, diesel generators, and battery energy storage systems (BESS) under realistic constraints. The distinctive balance between exploration and exploitation achieved by PDO, based on the cooperative behavior of prairie dogs, allowed for faster convergence, more precise solutions, and higher robustness in comparison with conventional optimization algorithms, such as PSO and GWO. These findings remarkably demonstrate that there were some major achievements regarding system performance, where the proposed PDO recorded the lowest energy generation cost of 0.15 USD/kWh and the lowest probability of deficit in power supply at 0.12%, indicating its usefulness in improving cost performance and reliability. Moreover, the ability of the algorithm to address renewable intermittency and preserve voltage stability proves that it is feasible to use the algorithm in practice in the grid.

Limitations and Future Scope

PDO has some limitations, even though it has been performing well. It can be complicated in its computational ability, especially in large-scale systems or high-dimensional problems, which can result in a prolonged processing period. Also, similar to most algorithms in the metaheuristic category, PDO can fall prey to premature convergence when subjected to highly dynamic or uncertain operating conditions unless it is well tuned. Hybrid models can be developed in the future by using both PDO and machine learning or adaptive control, which may improve prediction accuracy and real-time adaptability. Grid resilience and sustainability can be enhanced further by integrating it with demand response systems, real-time prediction, and cyber–physical security systems. Moreover, validating the PDO framework through hardware-in-the-loop simulations and real-world implementation in smart grid testbeds would strengthen its practical applicability and scalability for future energy management systems.
Further studies on the suggested metaheuristic optimization algorithms will be aimed at their refinement in terms of their adaptive performance control mechanisms, as well as their hybridization with other more advanced methods to enable them to reach faster convergence and higher-quality solutions. The structure may also be applied to hybrid AC/DC multi-microgrids and hydrogen-based systems. Also, the incorporation of machine learning in predictive load and renewable forecasting may help improve real-time scheduling and dispatch performance, and multi-objective optimization based on cost, reliability, and emissions will make it more suitable for real-life applications in smart grids.

Author Contributions

Conceptualization, S.S.M. and S.R.S.; methodology, S.S.M.; validation, S.S.M. and S.R.S.; writing—original draft preparation, S.S.M.; writing—review and editing, S.R.S.; visualization, S.S.M.; supervision, S.R.S. All authors have read and agreed to the published version of the manuscript.

Funding

Woosong University’s Academic Research Funding—2025.

Data Availability Statement

The original contributions presented in this study are included in the article. Further inquiries can be directed to the corresponding author.

Conflicts of Interest

The authors declare no conflicts of interest.

Nomenclature

EMSEnergy Management System
DGDistributed Generation
MMGMulti-Microgrid
DERDistributed Energy Resources
PDOPrairie Dog Optimization
EGCEnergy Generation Cost
PPSDProbability of Power Supply Deficit
MOOMulti-Objective Optimization
PVPhotovoltaic Modules
GWOGrey Wolf Optimization
PSOParticle Swarm Optimization
MINLPMixed Integer Non-Linear Programming
DRDemand Response
BESSBattery Energy Storage System
EAEvolutionary Algorithm
TSATabu Search Algorithm
WOAWhale Optimization Algorithm

References

  1. Voumik, L.C.; Islam, A.; Ray, S.; Yusop, N.Y.M.; Ridzuan, A.R. CO2 emissions from renewable and non-renewable electricity generation sources in the g7 countries: Static and dynamic panel assessment. Energies 2023, 16, 1044. [Google Scholar] [CrossRef]
  2. Ndeke, C.B.; Adonis, M.; Almaktoof, A. Energy management strategy for a hybrid micro-grid system using renewable energy. Discov. Energy 2024, 4, 1. [Google Scholar] [CrossRef]
  3. Mitra, J.; Vallem, M.R.; Singh, C. Optimal deployment of distributed generation using a reliability criterion. IEEE Trans. Ind. Appl. 2016, 52, 1989–1997. [Google Scholar] [CrossRef]
  4. Mavuri, S.S.; Nakka, J. Economic scheduling and dispatching of distributed generators considering uncertainties in modified 33-bus and modified 69-bus system under different microgrid regions. Trans. Energy Syst. Eng. Appl. 2024, 5, 1–22. [Google Scholar] [CrossRef]
  5. Srinivasarathnam, C.; Yammani, C.; Maheswarapu, S. Multi-Objective Jaya Algorithm for Optimal Scheduling of DGs in Distribution System Sectionalized into Multi-Microgrids. Smart Sci. 2019, 7, 59–78. [Google Scholar] [CrossRef]
  6. Kamal, T.; Karabacak, M.; Perić, V.S.; Hassan, S.Z.; Fernández-Ramírez, L.M. Novel Improved Adaptive Neuro-Fuzzy Control of Inverter and Supervisory Energy Management System of a Microgrid. Energies 2020, 13, 4721. [Google Scholar] [CrossRef]
  7. Hassan, S.; Li, H.; Kamal, T.; Arifoğlu, U.; Mumtaz, S.; Khan, L. Neuro-Fuzzy Wavelet Based Adaptive MPPT Algorithm for Photovoltaic Systems. Energies 2017, 10, 394. [Google Scholar] [CrossRef]
  8. Yi, J.; Lyons, P.F.; Davison, P.J.; Wang, P.; Taylor, P.C. Robust Scheduling Scheme for Energy Storage to Facilitate High Penetration of Renewables. IEEE Trans. Sustain. Energy 2016, 7, 797–807. [Google Scholar] [CrossRef]
  9. Marín, L.G.; Sumner, M.; Muñoz-Carpintero, D.; Köbrich, D.; Pholboon, S.; Sáez, D.; Núñez, A. Hierarchical Energy Management System for Microgrid Operation Based on Robust Model Predictive Control. Energies 2019, 12, 4453. [Google Scholar] [CrossRef]
  10. Mavuri, S.S.; Nakka, J.; Kotla, A. Interconnected Microgrids: A Review and Future perspectives. In Proceedings of the 2022 IEEE 2nd International Conference on Sustainable Energy and Future Electric Transportation (SeFeT), Hyderabad, India, 4–6 August 2022; pp. 1–7. [Google Scholar] [CrossRef]
  11. Guo, L.; Liu, W.; Li, X.; Liu, Y.; Jiao, B.; Wang, W.; Wang, C.; Li, F. Energy Management System for Stand-Alone Wind-Powered-Desalination Microgrid. IEEE Trans. Smart Grid 2016, 7, 1079–1087. [Google Scholar] [CrossRef]
  12. Sayed, K.; Abo-Khalil, A.G.; S Alghamdi, A. Optimum Resilient Operation and Control DC Microgrid Based Electric Vehicles Charging Station Powered by Renewable Energy Sources. Energies 2019, 12, 4240. [Google Scholar] [CrossRef]
  13. Eyimaya, S.E.; Altin, N. Review of Energy Management Systems in Microgrids. Appl. Sci. 2024, 14, 1249. [Google Scholar] [CrossRef]
  14. Bai, J.; Wei, W.; Guo, Z.; Chen, L.; Mei, S. Two-timescale coordinated operation of wind-advanced adiabatic compressed air energy storage system: A bilevel stochastic dynamic programming method. J. Energy Storage 2023, 67, 107502. [Google Scholar] [CrossRef]
  15. Zhang, Y.; Song, X.; Li, Y.; Zeng, Z.; Yong, C.; Sidorov, D.; Lv, X. Two-Stage Active and Reactive Power Coordinated Optimal Dispatch for Active Distribution Network Considering Load Flexibility. Energies 2020, 13, 5922. [Google Scholar] [CrossRef]
  16. Alshehri, M.A.H.; Guo, Y.; Lei, G. Energy Management Strategies of Grid-Connected Microgrids under Different Reliability Conditions. Energies 2023, 16, 3951. [Google Scholar] [CrossRef]
  17. Mutarraf, M.; Terriche, Y.; Niazi, K.A.K.; Khan, F.; Vasquez, J.; Guerrero, J. Control of hybrid diesel/PV/battery/ultra-capacitor systems for future shipboard microgrids. Energies 2019, 12, 3460. [Google Scholar] [CrossRef]
  18. Gilev, B.; Andreev, M.; Hinov, N.; Angelov, G. Modeling and Simulation of a Low-Cost Fast Charging Station Based on a Micro Gas Turbine and a Supercapacitor. Energies 2022, 15, 8020. [Google Scholar] [CrossRef]
  19. Kumar, R.P.; Karthikeyan, G. A multi-objective optimization solution for distributed generation energy management in microgrids with hybrid energy sources and battery storage system. Energies 2023, 16, 109702. [Google Scholar] [CrossRef]
  20. HassanzadehFard, H.; Jalilian, A. Optimal sizing and location of renewable energy based DG units in distribution systems considering load growth. Int. J. Electr. Power Energy Syst. 2018, 101, 356–370. [Google Scholar] [CrossRef]
  21. Thirunavukkarasu, G.S.; Seyedmahmoudian, M.; Jamei, E.; Horan, B.; Mekhilef, S.; Stojcevski, A. Role of optimization techniques in microgrid energy management systems—A review. Energy Strategy Rev. 2022, 43, 100899. [Google Scholar] [CrossRef]
  22. Kharrich, M.; Mohammed, O.H.; Alshammari, N.; Akherraz, M. Multi-Objective Optimization and the Effect of the Economic Factors on the Design of the Microgrid Hybrid System. Sustain. Cities Soc. 2021, 65, 102646. [Google Scholar] [CrossRef]
  23. Ennassiri, Y.; de-Simón-Martín, M.; Bracco, S.; Robba, M. Energy Management System for Polygeneration Microgrids, Including Battery Degradation and Curtailment Costs. Sensors 2024, 24, 7122. [Google Scholar] [CrossRef] [PubMed]
  24. Soshinskaya, M.; Crijns-Graus, W.; Guerrero, J.; Vasquez, J.C. Microgrids: Experiences, barriers and success factors. Renew. Sustain. Energy Rev. 2014, 40, 659–672. [Google Scholar] [CrossRef]
  25. Zahraoui, Y.; Alhamrouni, I.; Mekhilef, S.; Basir Khan, M.R.; Seyedmahmoudian, M.; Stojcevski, A.; Horan, B. Energy Management System in Microgrids: A Comprehensive Review. Sustainability 2021, 13, 10492. [Google Scholar] [CrossRef]
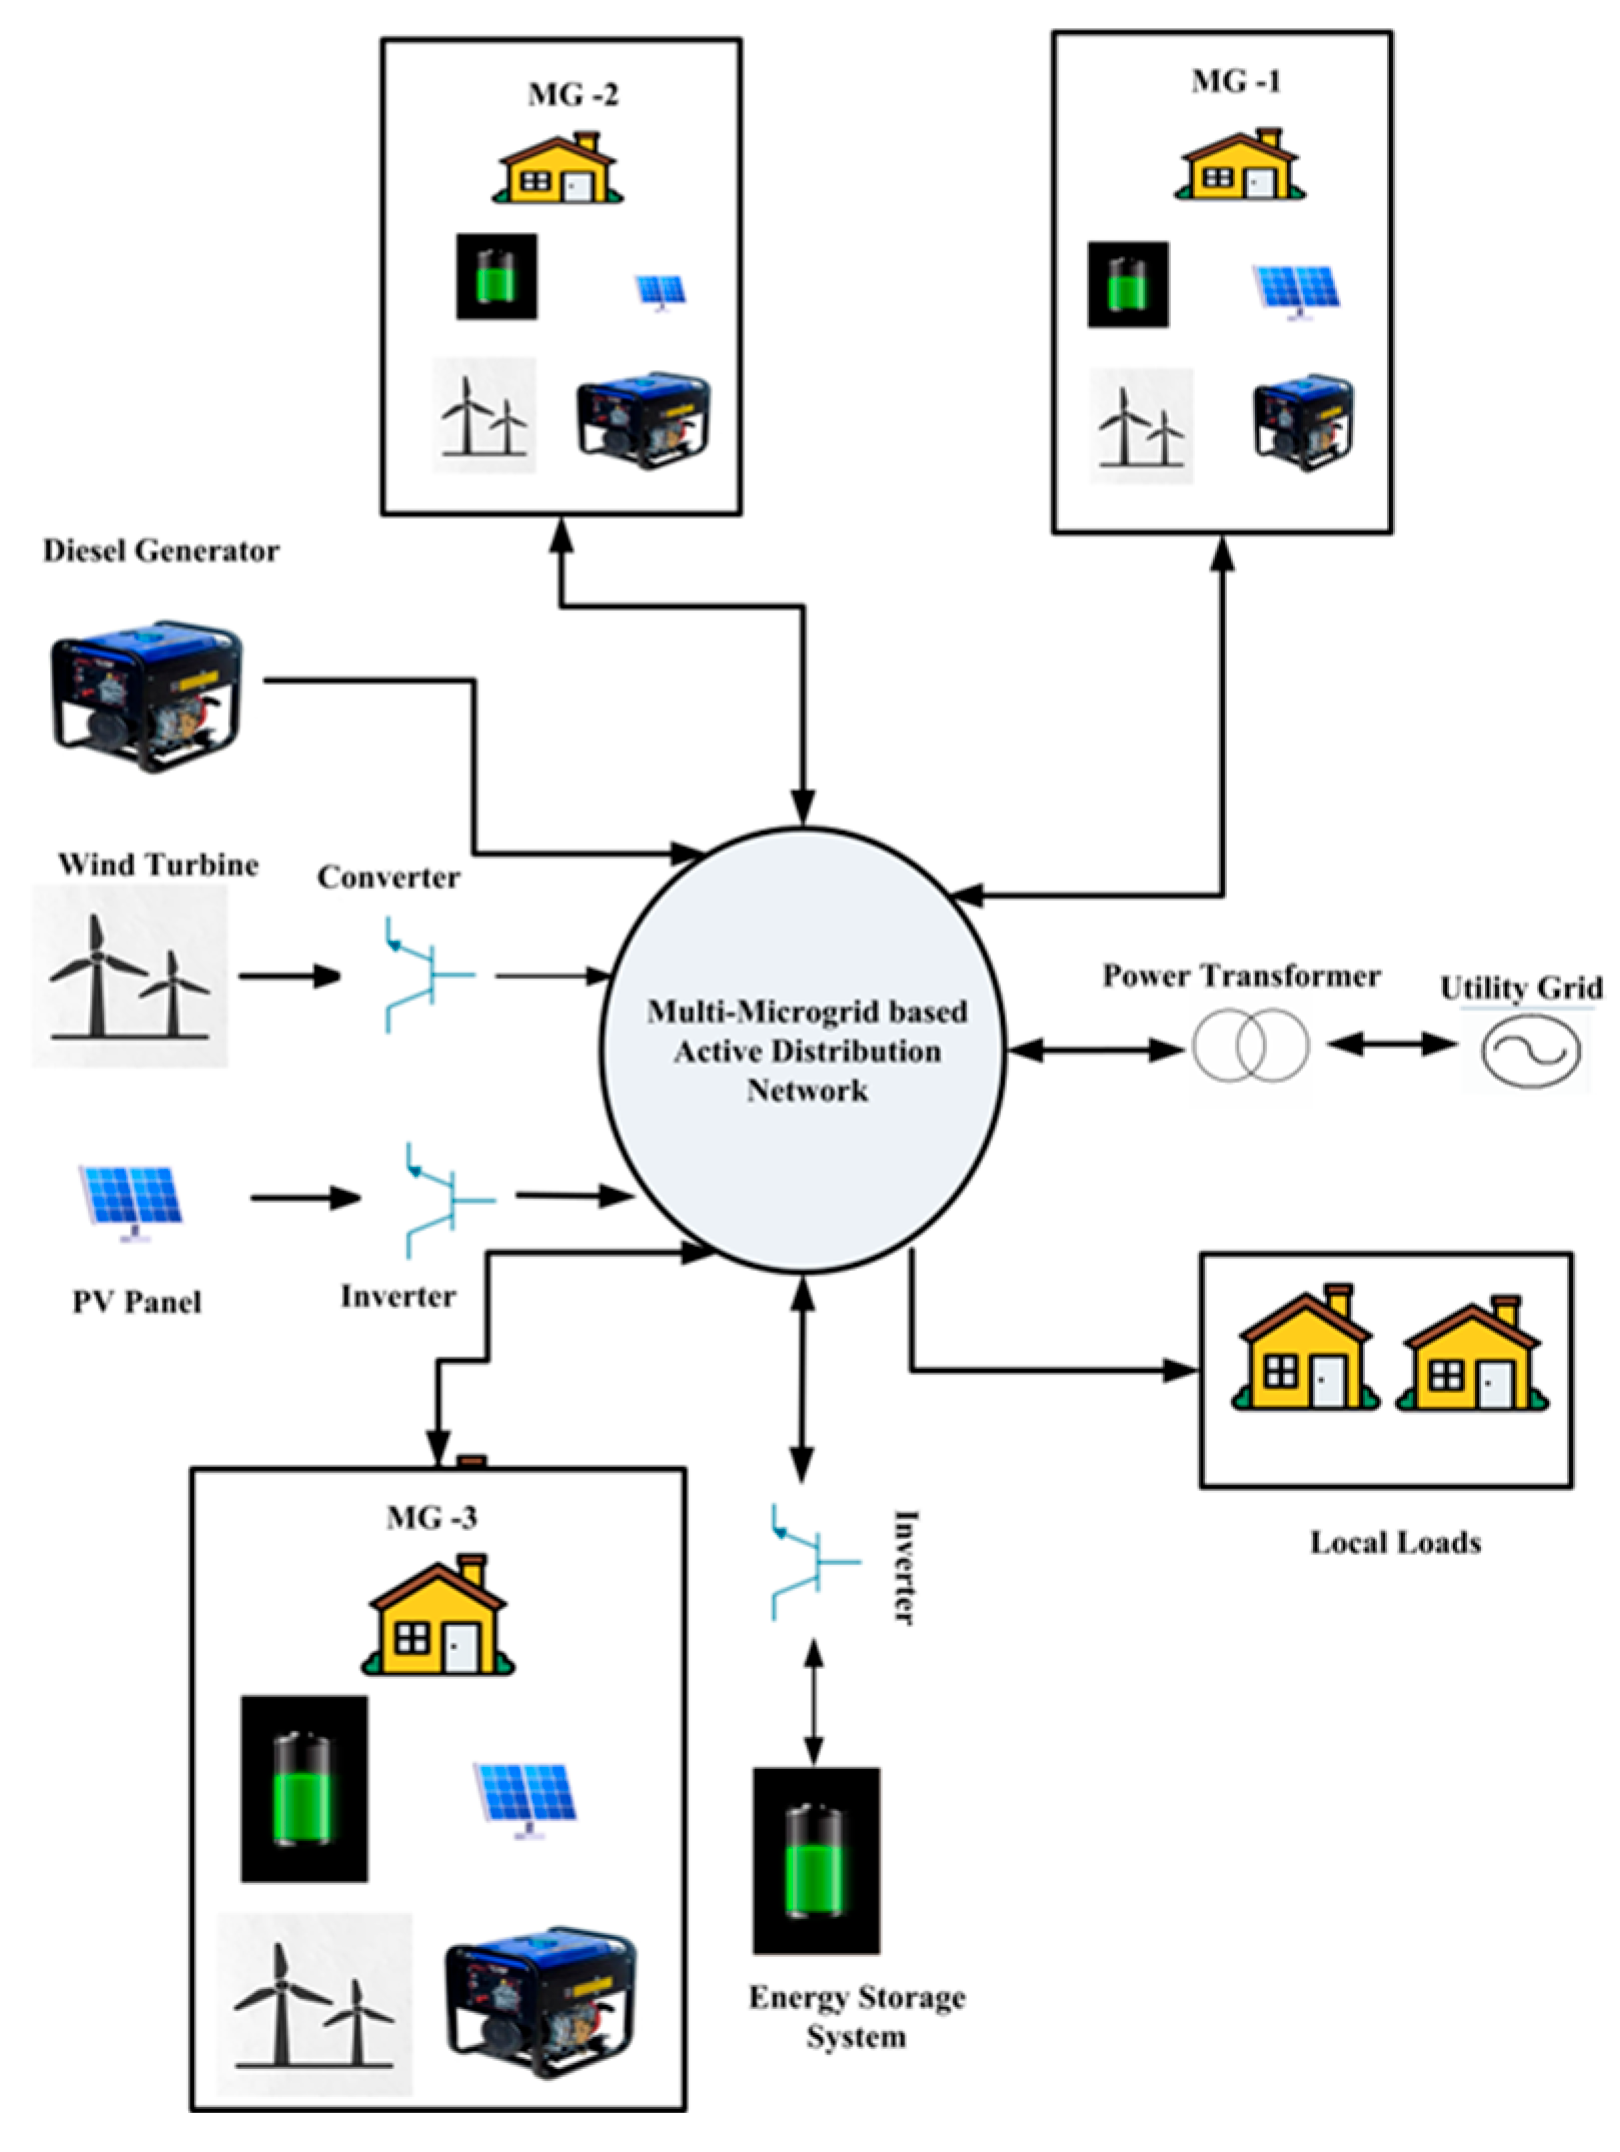
Figure 1. Multi-microgrid system with energy sources and storage integration.
Designs 09 00130 g001
Figure 2. Modified 33-bus system showing division of microgrid zones.
Designs 09 00130 g002
Figure 3. Flow chart of Prairie Dog Optimization for energy management of the MMG system.
Designs 09 00130 g003
Figure 4. ANFIS model for forecasting the uncertainty of PV and wind.
Designs 09 00130 g004
Figure 5. Convergence characteristics of PDO with other optimization techniques.
Designs 09 00130 g005
Figure 6. (a) Hourly power demand profile of Microgrid-2 under grid-connected conditions without load management. (b) Hourly power demand curve of Microgrid-2 in grid-connected mode without load control.
Designs 09 00130 g006
Figure 7. Hourly power demand profile of Microgrid-3 under grid-connected conditions without load management.
Designs 09 00130 g007
Figure 8. (a) Hourly power demand profile of Microgrid-1 in grid-connected mode with load management. (b) Hourly power demand profile of Microgrid-2 in grid-connected mode with load management. (c) Hourly power demand profile of Microgrid-3 in grid-connected mode with load management.
Designs 09 00130 g008
Figure 9. Comparison of optimization methods that can minimize the total energy generation cost (USD/kWh).
Designs 09 00130 g009
Table 1. Comparison of optimization techniques for the suitability of minimizing cost in a multi-microgrid system.
Optimization TechniqueAdvantagesLimitationsHandling of Renewable Intermittency and Load UncertaintyConvergenceOverall Suitability for Multi-Microgrid Optimization in Minimizing Cost
Particle Swarm Optimization (PSO)Simple structure, easy to implement, and converges quickly in the early stages.Becomes trapped in local optima and loses diversity as iterations progress.Sensitive to stochastic renewable variations; poor adaptability.Converges quickly but is often trapped in local optima.Moderate
WOA (Whale Optimization Algorithm)Provides a good exploration–exploitation balance and can handle complex landscapes.Performance is sensitive to parameter tuning and can show oscillations near optimal points.Handles intermittency moderately but lacks consistency.Moderate convergence with oscillatory behavior.Fair
BOA (Butterfly Optimization Algorithm)Good global search ability and adaptability to various problems.Excessive randomness sometimes causes unstable convergence and poor local refinement.Inconsistent under stochastic uncertainty; prone to premature convergence.Rapid initial convergence, but unstable.Fair
GWO (Grey Wolf Optimizer)Strong exploitation capability and stable convergence behavior.Exploration ability is limited in high-dimensional or dynamic problems.Performs moderately under uncertainty; diversity loss affects reliability.Stable but slow convergence in a complex multi-objective system.Good
PDO (Prairie Dog Optimization)Offers strong adaptability, maintains population diversity, and achieves fast and stable convergence.Slightly higher computational demand due to dynamic environmental updates.Highly resilient to renewable intermittency and load variations; maintains search diversity.Fast, smooth, and stable convergence with minimal stagnation.Excellent
Table 2. Specification ratings of DGs in the MMG system.
S. No.Name of DGParameters of DGRating of DG
1Photovoltaic ModulesCapacity60 kW
Efficiency15–20%
Open-circuit voltage (Voc)45
Short-circuit current (Isc)9.5 A
Rated power per module (Pmax)330 W
Number of PV modules182
2Wind Turbine GeneratorCapacity100 kW
Rated wind speed12 m/s
Cut-in wind speed3–4 m/s
Cut-out (survival) wind speed20–25 m/s
3Energy Storage SystemLi-ion battery500 kWh
Efficiency85%
Nominal voltage500 V
Nominal capacity1.67 × 103 kWh, 1000 Ah
4Fuel CellRated power1 kW
Number of cells48
Efficiency46%
5Diesel GeneratorRated power100 kWh
Output voltage415 V, 3-phase
Efficiency35%
Table 3. Review of existing studies on the optimal placement and capacity determination of distributed generation units.
ReferencesFindingsOptimal TechniquesObjectiveLimitations
[11]Considers planning and
operation cost optimizations
for RES penetrations
Sequential Quadratic Programming (SQP)Planning of renewable energy sourcesCost of energy is ignored, system
computational time
complexity is higher
[12]Network cost reduction and
maximizing the availability of AC/DC
Multi-objective PSO, multi-objective genetic algorithmOperating cost reduction
and reliability
improvement
MG uncertainty of generation
and load profiles are not considered
[13]DER optimum sizing was
achieved using energy
trading
Game theory, Nash
equilibrium
Optimum DER sizing and energy management systemReliability of the system is ignored
[14]Demonstrated that a probabilistic approach yields superior outcomes compared to a predetermined methodModified Jaya optimizationCost and emission reductionReal-time power distribution dynamics are excluded from the analysis
[15]Total cost reduction and system
performance improvement
Enhanced optimizationCost reduction and voltage stabilityEnergy market uncertainty is
ignored
[16]Each MG gained maximum profit
and their participation
increased
Game theoryMaximize profitNo cooperation attained
[17]Daily operating cost and power
loss reduction
Artificial neural networksCost reduction and
maximize RES utilization
The balance between MGs is not taken into account.
[18]Improved peak demand and load efficiencyHybrid lexicographyOperating cost reduction and
DR coordination
The energy market framework is not taken into account
[19]Validated objectives and accurately represented uncertaintiesMulti-objective Evolutionary AlgorithmOperating cost and
emission reduction
ESS is not considered for further
efficacy
Table 4. Statistical results for validation of the proposed PDO with other optimizations based on CEC2020 benchmark functions.
FCriteriaPDOGWOPSOWOATSASPOHHOSCA
F1Min1.85 × 1022.14 × 1032.91 × 1033.08 × 1032.97 × 1032.91 × 1032.92 × 1033.12 × 103
Max1.19 × 1043.2 × 1043.19 × 1033.84 × 1033.52 × 1033.24 × 1033.11 × 1033.74 × 103
Avg6.52 × 1032.64 × 1032.97 × 1033.46 × 1033.14 × 1032.94 × 1032.91 × 1033.21 × 103
STD3.84 × 1034.37 × 1021.72 × 1021.43 × 1021.12 × 1029.82 × 1017.21 × 1011.53 × 102
Rank18465327
F2Min1.72 × 1032.94 × 1031.90 × 1032.76 × 1032.81 × 1031.88 × 1032.05 × 1033.12 × 103
Max3.36 × 1036.04 × 1033.75 × 1035.78 × 1035.61 × 1033.93 × 1033.84 × 1035.28 × 103
Avg2.54 × 1034.98 × 1032.68 × 1034.22 × 1034.08 × 1033.21 × 1032.96 × 1034.86 × 103
STD4.43 × 1025.32 × 1024.51 × 1026.21 × 1025.64 × 1024.01 × 1023.94 × 1024.92 × 102
Rank18276435
F3Min7.32 × 1029.41 × 1027.51 × 1028.66 × 1028.48 × 1027.44 × 1028.02 × 1028.91 × 102
Max9.01 × 1021.17 × 1037.83 × 1021.02 × 1031.01 × 1039.11 × 1029.74 × 1029.86 × 102
Avg7.84 × 1021.02 × 1037.61 × 1029.41 × 1029.32 × 1027.82 × 1028.64 × 1029.24 × 102
STD4.69 × 1015.61 × 1012.64 × 1013.02 × 1013.88 × 1012.74 × 1013.51 × 1014.02 × 101
Rank18265347
F4Min1.90 × 1031.94 × 1031.91 × 1031.93 × 1031.92 × 1031.90 × 1031.91 × 1031.98 × 103
Max1.90 × 1031.93 × 1051.91 × 1042.18 × 1043.94 × 1031.93 × 1031.91 × 1032.43 × 103
Avg1.90 × 1034.36 × 1045.61 × 1038.22 × 1032.81 × 1031.92 × 1031.91 × 1032.21 × 103
STD0.623.21 × 1041.08 × 1031.21 × 1036.42 × 1024.02 × 1015.11 × 103.51 × 102
Rank18675324
F5Min2.24 × 1048.12 × 1041.95 × 1047.23 × 1049.91 × 1046.31 × 1031.02 × 1041.44 × 105
Max4.44 × 1051.28 × 1062.59 × 1059.71 × 1052.42 × 1062.02 × 1066.03 × 1053.45 × 106
Avg1.81 × 1054.72 × 1059.84 × 1043.11 × 1051.31 × 1067.91 × 1052.04 × 1051.92 × 106
STD1.24 × 1052.62 × 1056.52 × 1041.94 × 1057.82 × 1053.91 × 1051.52 × 1058.63 × 105
Rank16258734
F6Min1.61 × 1032.43 × 1031.72 × 1031.89 × 1032.16 × 1031.63 × 1031.78 × 1032.21 × 103
Max2.13 × 1033.74 × 1032.26 × 1032.72 × 1032.99 × 1032.69 × 1032.24 × 1032.91 × 103
Avg1.76 × 1033.01 × 1031.93 × 1032.31 × 1032.52 × 1031.91 × 1031.96 × 1032.48 × 103
STD1.25 × 1023.45 × 1021.31 × 1022.02 × 1022.41 × 1021.72 × 1021.42 × 1021.83 × 102
Rank18257346
F7Min8.21 × 1031.21 × 1044.84 × 1039.42 × 1031.14 × 1044.02 × 1036.04 × 1031.01 × 104
Max5.64 × 1051.03 × 1063.14 × 1058.94 × 1051.32 × 1066.02 × 1055.32 × 1051.21 × 106
Avg2.14 × 1053.71 × 1059.12 × 1042.83 × 1056.41 × 1051.23 × 1051.84 × 1055.31 × 105
STD1.54 × 1052.12 × 1057.52 × 1041.91 × 1053.84 × 1051.61 × 1051.42 × 1052.71 × 105
Rank18257346
F8Min2.28 × 1033.12 × 1032.31 × 1032.43 × 1032.61 × 1032.30 × 1032.31 × 1032.61 × 103
Max5.42 × 1037.02 × 1035.97 × 1036.83 × 1036.52 × 1037.11 × 1035.98 × 1037.11 × 103
Avg3.04 × 1035.21 × 1033.21 × 1034.78 × 1034.63 × 1033.56 × 1033.29 × 1034.83 × 103
STD1.25 × 1031.01 × 1038.74 × 1021.42 × 1031.31 × 1031.32 × 1031.02 × 1031.54 × 103
Rank18365427
F9Min2.79 × 1033.04 × 1032.83 × 1032.95 × 1033.01 × 1032.93 × 1032.91 × 1033.03 × 103
Max2.87 × 1033.17 × 1032.92 × 1033.22 × 1033.19 × 1033.01 × 1032.94 × 1033.04 × 103
Avg2.82 × 1033.14 × 1032.87 × 1033.16 × 1033.12 × 1032.97 × 1032.93 × 1033.02 × 103
STD1.46 × 1013.52 × 1012.61 × 1013.12 × 1012.84 × 1012.41 × 1012.02 × 1012.81 × 101
Rank18276435
F10Min2.89 × 1033.52 × 1032.90 × 1032.97 × 1033.14 × 1032.92 × 1032.91 × 1033.12 × 103
Max2.97 × 1036.21 × 1033.00 × 1033.41 × 1033.53 × 1033.14 × 1033.01 × 1033.71 × 103
Avg2.91 × 1034.72 × 1032.96 × 1033.12 × 1033.31 × 1032.98 × 1032.95 × 1033.27 × 103
STD2.61 × 1017.12 × 1023.11 × 1014.12 × 1014.43 × 1012.92 × 1012.54 × 1011.21 × 102
Rank18265347
Table 5. Validation of proposed PDO through comparison with other optimizations using various CEC2020 benchmark functions determined through the Wilcoxon test rank.
FunctionPDOGWOPSOWOATSASPOHHOSCA
F13.02 × 10−115.68 × 10−41.21 × 10−37.53 × 10−42.65 × 10−31.14 × 10−38.95 × 10−42.01 × 10⁻³
F23.02 × 10−119.87 × 10−65.42 × 10−52.75 × 10−41.64 × 10−48.59 × 10−51.23 × 10−34.01 × 10⁻⁵
F33.02 × 10−114.28 × 10−52.57 × 10−57.94 × 10−55.64 × 10−51.38 × 10−49.21 × 10−56.72 × 10⁻⁵
F43.02 × 10−111.27 × 10−48.36 × 10−51.04 × 10−43.52 × 10−52.48 × 10−47.33 × 10−51.82 × 10⁻⁴
F54.50 × 10−113.21 × 10−44.97 × 10−45.83 × 10−46.11 × 10−41.02 × 10−38.92 × 10−41.34 × 10⁻³
F63.02 × 10−116.83 × 10−53.47 × 10−52.94 × 10−41.83 × 10−42.61 × 10−44.53 × 10−41.97 × 10⁻⁴
F73.16 × 10−18.74 × 10−44.23 × 10−46.31 × 10−41.21 × 10−31.56 × 10−32.45 × 10−31.84 × 10⁻³
F83.26 × 10−75.42 × 10−67.19 × 10−61.02 × 10−59.75 × 10−54.32 × 10−52.11 × 10−41.67 × 10⁻⁵
F93.02 × 10−112.63 × 10−51.49 × 10−43.84 × 10−56.12 × 10−52.17 × 10−41.08 × 10−34.97 × 10⁻⁵
F103.02 × 10−111.84 × 10−56.22 × 10−57.94 × 10−51.93 × 10−44.31 × 10−45.89 × 10−42.17 × 10⁻⁴
Table 6. Comparison between the power profile of Microgrid-1 with and without optimization.
ParameterBefore OptimizationAfter OptimizationImprovement (%)Remarks
Peak Demand (kW)110082020.7%Effective peak shaving through coordinated scheduling
Average Demand (kW)5205301.9%More uniform load distribution
Peak-to-Average Ratio1.581.2322.2%Flatter load curve and improved stability
DG Utilization (%)72.591.426.1%Increased renewable contribution and reduced curtailment
ESS Utilization (%)54.888.361.1%Optimized charging/discharging cycles for peak management
Power Exchange Among MGs (kWh/day)115248115.6%Enhanced energy sharing among interconnected MGs
Grid Import (kWh/day)96571226.2%Reduced external grid dependency
Operational Cost($/day)1420108523.6%Cost reduction through optimal dispatch and coordination
System Voltage Deviation (p.u.)±0.045±0.01860.0%Improved voltage stability across MMG
Overall Efficiency (%)82.494.114.2%Higher system reliability and energy efficiency
Table 7. Comparison of the power profile of Microgrid-2 with and without optimization.
ParameterBefore OptimizationAfter OptimizationChange (%)Remarks
Peak Demand (kW)8208706.1%Slight increase due to demand shifting and improved DG availability
Average Demand (kW)5205658.7%Higher average utilization and load factor
Peak-to-Average Ratio1.581.542.5%Load curve becomes smoother despite higher peaks
DG Utilization (%)72.593.629.1%Increased renewable generation reduces grid dependency
ESS Utilization (%)54.889.262.8%More dynamic ESS operation during load peaks
Power Exchange Among MGs (kWh/day)115275139.1%Improved inter-microgrid coordination and energy sharing
Grid Import (kWh/day)96570527.0%Greater reliance on local renewable sources
Operational Cost ($/day)1420111021.8%Cost savings despite slightly higher peak load
System Voltage Deviation (p.u.)±0.045±0.02055.6%Enhanced voltage regulation and network control
Overall Efficiency (%)82.495.315.7%Improved energy management and reduced losses
Table 8. Comparison between the power profile of microgrid-3 with and without optimization.
ParameterBefore OptimizationAfter OptimizationChange (%)Remarks
Total Load Demand (kWh/day)980010,4506.6%Increased due to better load accommodation and reduced curtailment
Peak Demand (kW)82091011.0%Higher served load during daytime hours
Average Demand (kW)52057510.6%Reflects overall growth in active demand served
Peak-to-Average Ratio1.581.58Balanced load growth with uniform distribution
DG Utilization (%)72.594.229.9%Maximum use of renewable DG sources
ESS Utilization (%)54.891.767.4%Improved charging–discharging for supporting higher load
Power Exchange Among MGs (kWh/day)115295156.5%Stronger energy cooperation among microgrids
Grid Import (kWh/day)96574522.8%Reduced dependency despite higher total demand
Operational Cost ($/day)1420117017.6%Efficient dispatch offsets increased energy use
System Voltage Deviation (p.u.)±0.045±0.02251.1%Maintained voltage stability under higher load
Overall Efficiency (%)82.493.83.8%Enhanced reliability and network coordination
Table 9. Comparison of case studies with the objectives of minimizing cost, power losses, and voltage deviations with the proposed PDO and other optimization techniques.
Optimization TechniqueCase 1Case 2
Minimization of pricePrice ($ /kWh)
PDO18,546.3517,456.23
GWO19,451.3619,365.27
PSO18,795.2318,987.75
Power Loss (kW)
Power loss minimizationPDO25.3224.12
GWO32.1529.15
PSO25.1223.59
Voltage Deviations in (P.U)
Voltage deviation minimizationPDO4.7 × 10−63.8 × 10⁻⁶
GWO4.8 × 10−64.6 × 10⁻⁶
PSO4.8 × 10−63.9 × 10⁻⁶
Table 10. Comparison of multi-microgrid hourly energy generation cost using PDO, GWO, and PSO algorithms.
Day HoursPrairie Dog Optimization (PDO)
($ /kWh)
Grey Wolf Optimization (GWO) ($ kWh)Particle Swarm Optimization (PSO) ($ /kWh)
1527.654553.62578.96
2637.258658.78689.25
3556.24586.98612.32
4651.23687.98698.25
5541.25567.23587.45
6612.36636.54668.32
7715.94762.35784.63
8312.56339.42354.65
9725.14768.94789.56
10612.65635.68679.87
11714.25735.65759.59
12735.65759.68784.21
13812.65826.97845.65
14445.25469.98498.36
15724.56745.63763.56
16735.14752.63774.65
17769.25782.14795.56
18804.32824.65846.95
19912.56935.64965.45
20704.36721.32746.98
21514.65535.69558.78
22524.65549.89568.98
23514.63534.25568.12
24504.32526.35539.63
Table 11. Compared of optimization methods for Energy Generation Cost (EGC) and Probability of Power Supply Deficit (PPSD) of a multi-microgrid system.
Optimization TechniqueEnergy Generation Cost (USD/kWh)% Probability of Power Supply Deficit (PPSP)
PDO0.1230.16
GWO0.891.5
PSO1.21.8
Disclaimer/Publisher’s Note: The statements, opinions and data contained in all publications are solely those of the individual author(s) and contributor(s) and not of MDPI and/or the editor(s). MDPI and/or the editor(s) disclaim responsibility for any injury to people or property resulting from any ideas, methods, instructions or products referred to in the content.