Article

Assessment of Accuracy in Geometry Reconstruction, CAD Modeling, and MEX Additive Manufacturing for Models Characterized by Axisymmetry and Primitive Geometries

Faculty of Mechanical Engineering and Aeronautics, Rzeszów University of Technology, 35-959 Rzeszów, Poland
*
Author to whom correspondence should be addressed.
Designs 2025, 9(5), 101; https://doi.org/10.3390/designs9050101
Submission received: 3 August 2025 / Revised: 21 August 2025 / Accepted: 25 August 2025 / Published: 28 August 2025
(This article belongs to the Special Issue Design Process for Additive Manufacturing)

Abstract

Due to the rapid advancements in coordinate measuring systems, data processing software, and additive manufacturing (AM) techniques, it has become possible to create copies of existing models through the reverse engineering (RE) process. However, the lack of precise estimates regarding the accuracy of the RE process—particularly at the measurement, reconstruction, and computer-aided design (CAD) modeling stages—poses significant challenges. Additionally, the assessment of dimensional and geometrical errors during the manufacturing stage using AM techniques limits the practical implementation of product replicas in the industry. This paper provides an estimation of the errors encountered in the RE process and the AM stage of various models. It includes examples of an electrical box, a lampshade for a standing lamp, a cover for a vacuum unit, and a battery cover. The geometry of these models was measured using a GOM Scan 1 (Carl Zeiss AG, Jena, Germany). Following the measurement process, data processing was performed, along with CAD modeling, which involved primitive detection, profile extraction, and auto-surface methods using Siemens NX 2406 software (Siemens Digital Industries, Plano, TX, USA). The models were produced using a Fortus 360-mc 3D printer (Stratasys, Eden Prairie, MN, USA) with ABS-M30 material. After fabrication, the models were scanned using a GOM Scan 1 scanner to identify any manufacturing errors. The research findings indicated that overall, 95% of the points representing reconstruction errors are within the maximum deviation range of ±0.6 mm to ±1 mm. The highest errors in CAD modeling were attributed to the auto-surfacing method, overall, 95% of the points are within the average range of ±0.9 mm. In contrast, the lowest errors occurred with the detect primitives method, averaging ±0.6 mm. Overall, 95% of the points representing the surface of a model made using the additive manufacturing technology fall within the deviation range ±0.2 mm on average. The findings provide crucial insights for designers utilizing RE and AM techniques in creating functional model replicas.

1. Introduction

The traditional approach to modeling machine components relies on computer-aided design (CAD) systems widely used in industrial product design. A challenge arises when there is a physical model but no design documentation. Fortunately, advancements in coordinate measuring systems and data processing have led to the reverse engineering (RE) process [1,2], which reconstructs geometries from data gained through contact [3,4] or optical [5,6] measurement methods. The accuracy of the reconstructed model depends on factors such as the quality of measurement data [5,7], triangulation methods [8], and CAD modeling techniques [9,10]. The manufacturing stage is also crucial, with subtractive methods traditionally used [11], although additive manufacturing is gaining traction for cost reduction and efficiency [12].
The acquisition of data in the RE process involves various measuring instruments, from coordinate measuring machines [13] and measuring arms [14] to 2D [15] and 3D scanners [16], as well as tomographic systems [17]. Selecting the right measurement system is crucial, considering factors like resolution, repeatability, measurement range, non-invasiveness, and speed. Measurement data is usually expressed as coordinates in either a global or local coordinate system. After obtaining the point cloud data, it is edited by filtering, merging, and assembling into a model [9,18], typically saved in STL format, which approximates the geometry using a triangle mesh [19]. However, errors can arise during this conversion due to tessellation algorithms, making it essential to balance geometry accuracy with manufacturing machine resolution. Information on common errors when exporting to STL format is provided in ISO/ASTM standards [20,21,22,23]. Few studies have explored this topic in depth. With a complete 3D STL model, it can be converted into a parameterized 3D CAD model using methods like characteristic geometry detection [24], section profiles [25], and auto-surfaces [26], all of which rely on approximations from the point cloud [15]. The data processing workflow is complex due to factors such as the acquisition process [27], incomplete data collection, and inherent noise [28]. As a result, new methods are being explored to enhance the data reconstruction process. A review of the literature indicates that deep learning and hybrid analytical-neural approaches are currently in use, significantly improving the accuracy and automation of reconstruction. In particular, the article [29,30] is crucial because it identifies the shortcomings of existing solutions and proposes an innovative approach to address them. In the case of 3D printers, each model has specific characteristics and operating conditions requirements. These factors include the 3D printing parameters, the materials used, and environmental conditions [31]. Consequently, differences may arise between the nominal 3D-CAD model and the finished product. These differences can affect dimensional and geometrical accuracy [32,33]. Among the 3D printing parameters, layer thickness has the most significant impact on the accuracy of the geometry [34,35]. This influence is determined by several factors that depend on the specific 3D printing technique used. The effect of layer thickness on geometric accuracy is particularly pronounced when the model is built in different directions [36,37]. Additionally, the presence of a supporting structure during the model manufacturing process can also impact geometric representation accuracy [38]. Often, this involves post-processing treatments to remove the supporting material through mechanical or chemical methods. As a result, the surface of the model, after the support material has been cleaned off, may differ significantly from the designer’s original assumptions, particularly in terms of dimensional and geometrical accuracy. Research in this field focuses on optimizing processes and materials, particularly using machine learning to predict the quality and mechanical properties of parts [39,40].
Functional models are often made using reverse engineering (RE) and additive manufacturing (AM) technologies. To ensure quality, it is crucial to meet standards related to dimensional and geometric accuracy. Common standards used during design include ISO 8015 [41], ISO 1101 [42], ISO 286-2 [43], ISO 22081 [44], and ASME Y14.5 [45]. However, there are no clear design criteria to estimate accuracy during the RE process, especially at the measurement, reconstruction, and CAD modeling stages. Additionally, measuring dimensional and geometric errors during AM production is often unclear, which slows down the ability to bring products to market. It is essential to focus on axisymmetric models and models representing regular shapes, as these are often used in machine parts. Their simple designs make the manufacturing process more efficient and accurate. This publication aims to estimate the errors that occur during both the RE process and the AM stage of production. It will use test models, such as an electrical box, a lampshade for a standing lamp, a cover for a vacuum unit, and a battery cover, as examples.

2. Materials and Methods

The research process focused on three test models: an electrical box, a lampshade for a standing lamp, a cover for a vacuum unit, and a battery cover (Figure 1).
The research process incorporated axisymmetric models along with models featuring regular geometric shapes, both of which play a vital role in industrial applications. These models are essential due to their considerable influence on key factors such as precision, operational efficiency, and overall production costs. The inherent geometric simplicity of these models offers a range of specific advantages that enhance performance and streamline processes across the entire production chain, ultimately leading to improved outcomes in manufacturing and resource management. To measure these objects, a measurement system utilizing structured light from the GOM Scan 1 was used. After acquiring the measurement data, it was imported into the Siemens NX program. During this phase, a parametric modeling process was implemented using various CAD modeling techniques. By conducting accuracy analyses during the reconstruction and CAD modeling stages, the path that minimized geometry errors was identified. The resulting model, developed through this optimized path, was then used in the AM process. For the additive manufacturing process, a Fortus 360mc 3D printer was used. After 3D printing, the produced model underwent a geometry measurement process using the GOM Scan 1 system to evaluate any errors introduced during the AM production process.

2.1. The Process of Measuring and Reconstructing Geometries Using the GOM Scan 1 System

The complexity of 3D measurement affects the measurement uncertainty of optical coordinate measuring machines (CMMs), necessitating the establishment of a standardized procedure for defining the accuracy of these systems. Currently, the calibration of optical systems that utilize structured light is primarily conducted according to the German VDI/VDE 2634 standard [46]. This standard provides recommendations for the acceptance and re-verification of measuring systems. It also specifies the conditions necessary for properly calibrating optical systems, such as temperature, mechanical vibration, and lighting conditions. The guidelines set forth by the standard include the assessment of the following types of errors:
  • Probing error—test performed on a single ball;
  • Sphere—spacing error—test performed on a ‘ball bar’ standard;
  • Flatness measurement error—test performed on a flat rectangular plate.
Based on the calibration process carried out, the results are presented in Table 1.
A GOM Scan 1 (100) head was used during the calibration and measuring process, enabling the digitization of geometry with a resolution of 0.037 mm. In evaluating the number of rotations of the measuring table for selected models, four options were tested: 5, 10, 15, and 20 rotations. The first two options did not provide complete digitization of the models’ geometry, resulting in significant gaps in the three-dimensional point cloud. When using 20 rotations, there was a notable increase in the size of the measurement file, which was accompanied by the occurrence of overscans. However, with 15 rotations, a nearly complete representation of the scanned model surfaces was achieved, and no overscans were observed. Ultimately, 15 rotations of the measuring table were used in the research process. Detailed information regarding the measurement parameters can be found in Table 2.
During the process of measuring the electric box model, it was not necessary to coat the model with a matting substance but attach reference points. Measurements were taken for two configurations of the object: first, the internal geometry was measured (Figure 2a), and second, the external geometry was measured (Figure 2b). For each configuration, a fixed number of rotations of the measuring table, totaling 15, was used. The two scans were then combined using the best-fit option, resulting in a deviation of 0.010 mm during the merging process. This led to a complete reconstruction of the model’s geometry, which was then exported in STL format (Figure 2c).
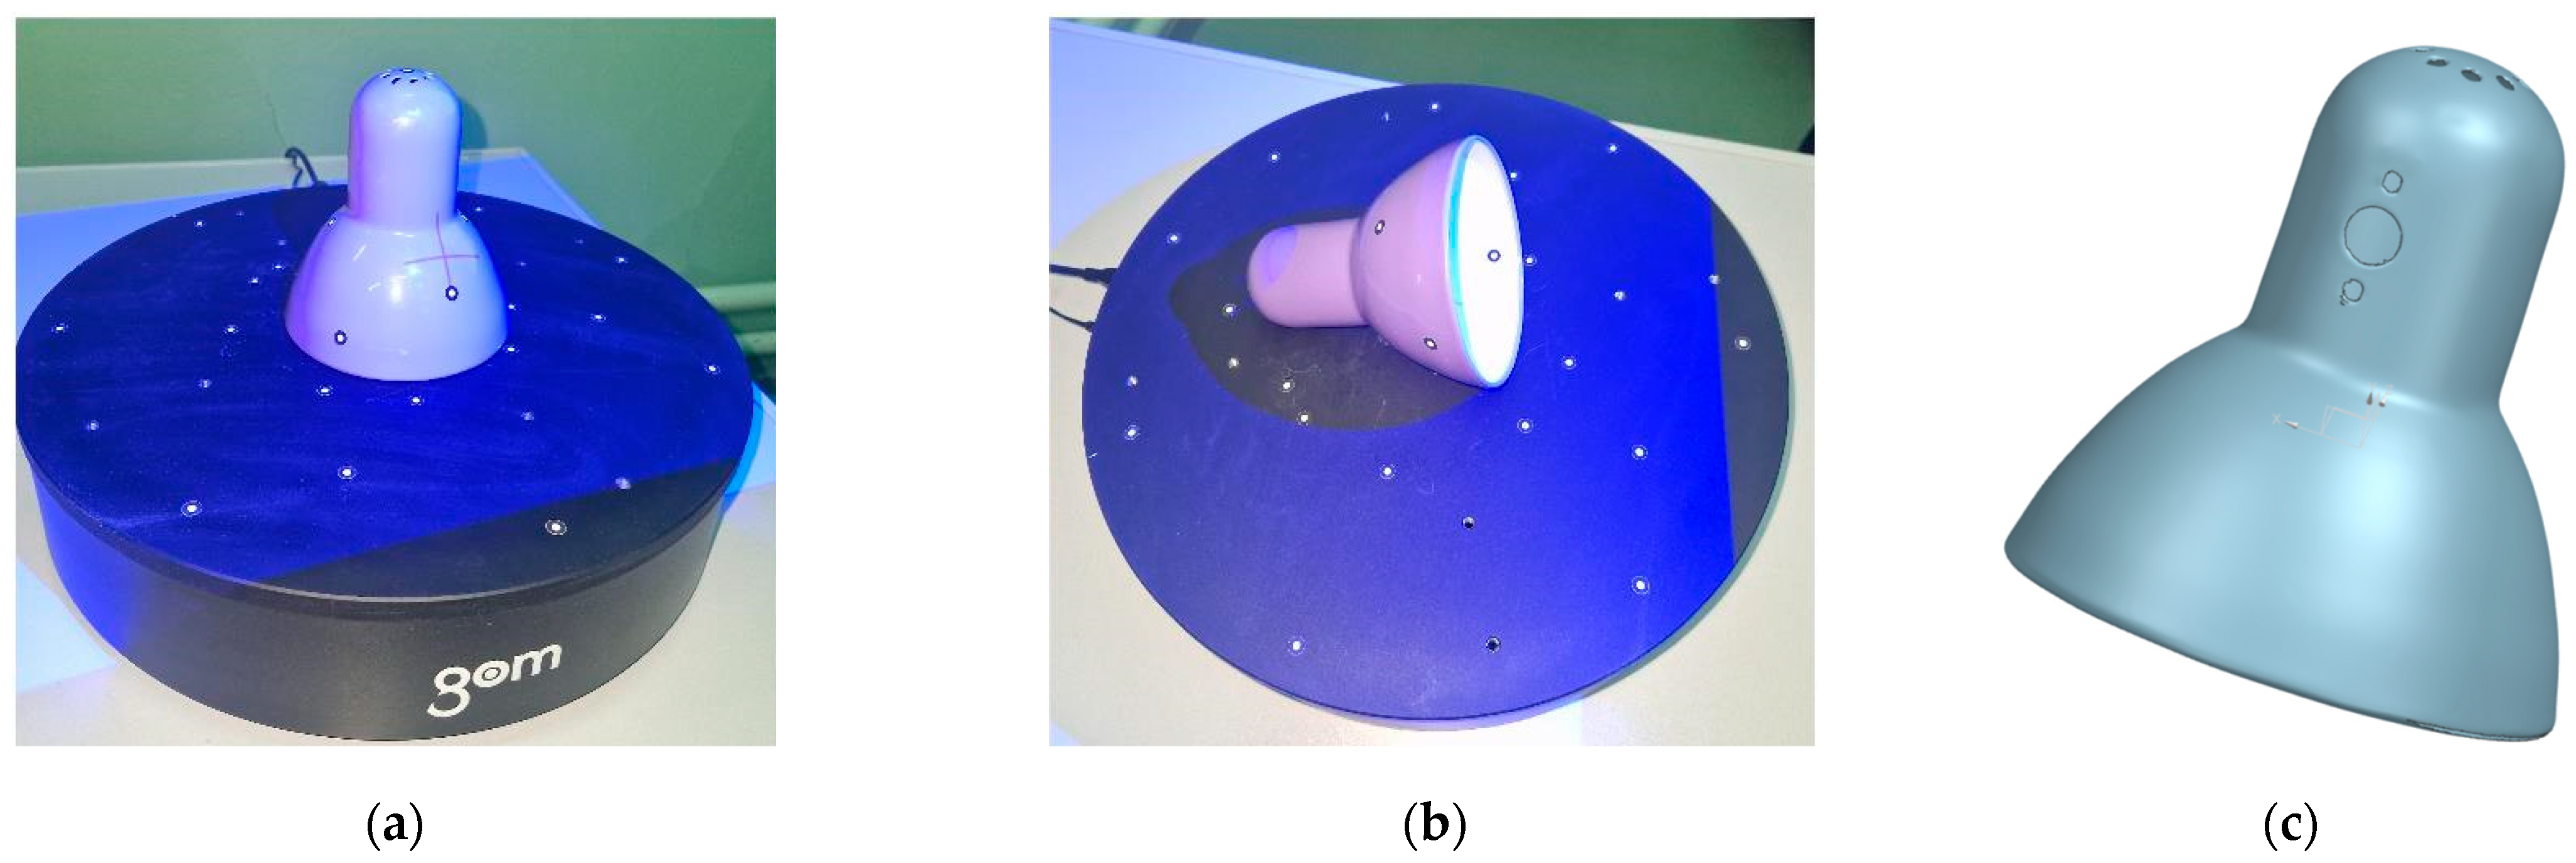
The lampshade for a standing lamp was scanned in two positions: external (Figure 3a) and internal (Figure 3b). Each position involved 15 rotations, resulting in two sets of measurement points that were later merged. During scanning, it is generally recommended that the surface of the object be as non-reflective as possible, as reflectivity can negatively affect the final measurement results. In such cases, the object is typically covered with a suitable material (e.g., chalk). However, during the scanning of the lampshade, this procedure was not necessary, even though the object was partly reflective. The attached reference points were sufficient to achieve a final scan with a fitting accuracy of 0.011 mm. The resulting model was then exported to an STL file format (Figure 3c).
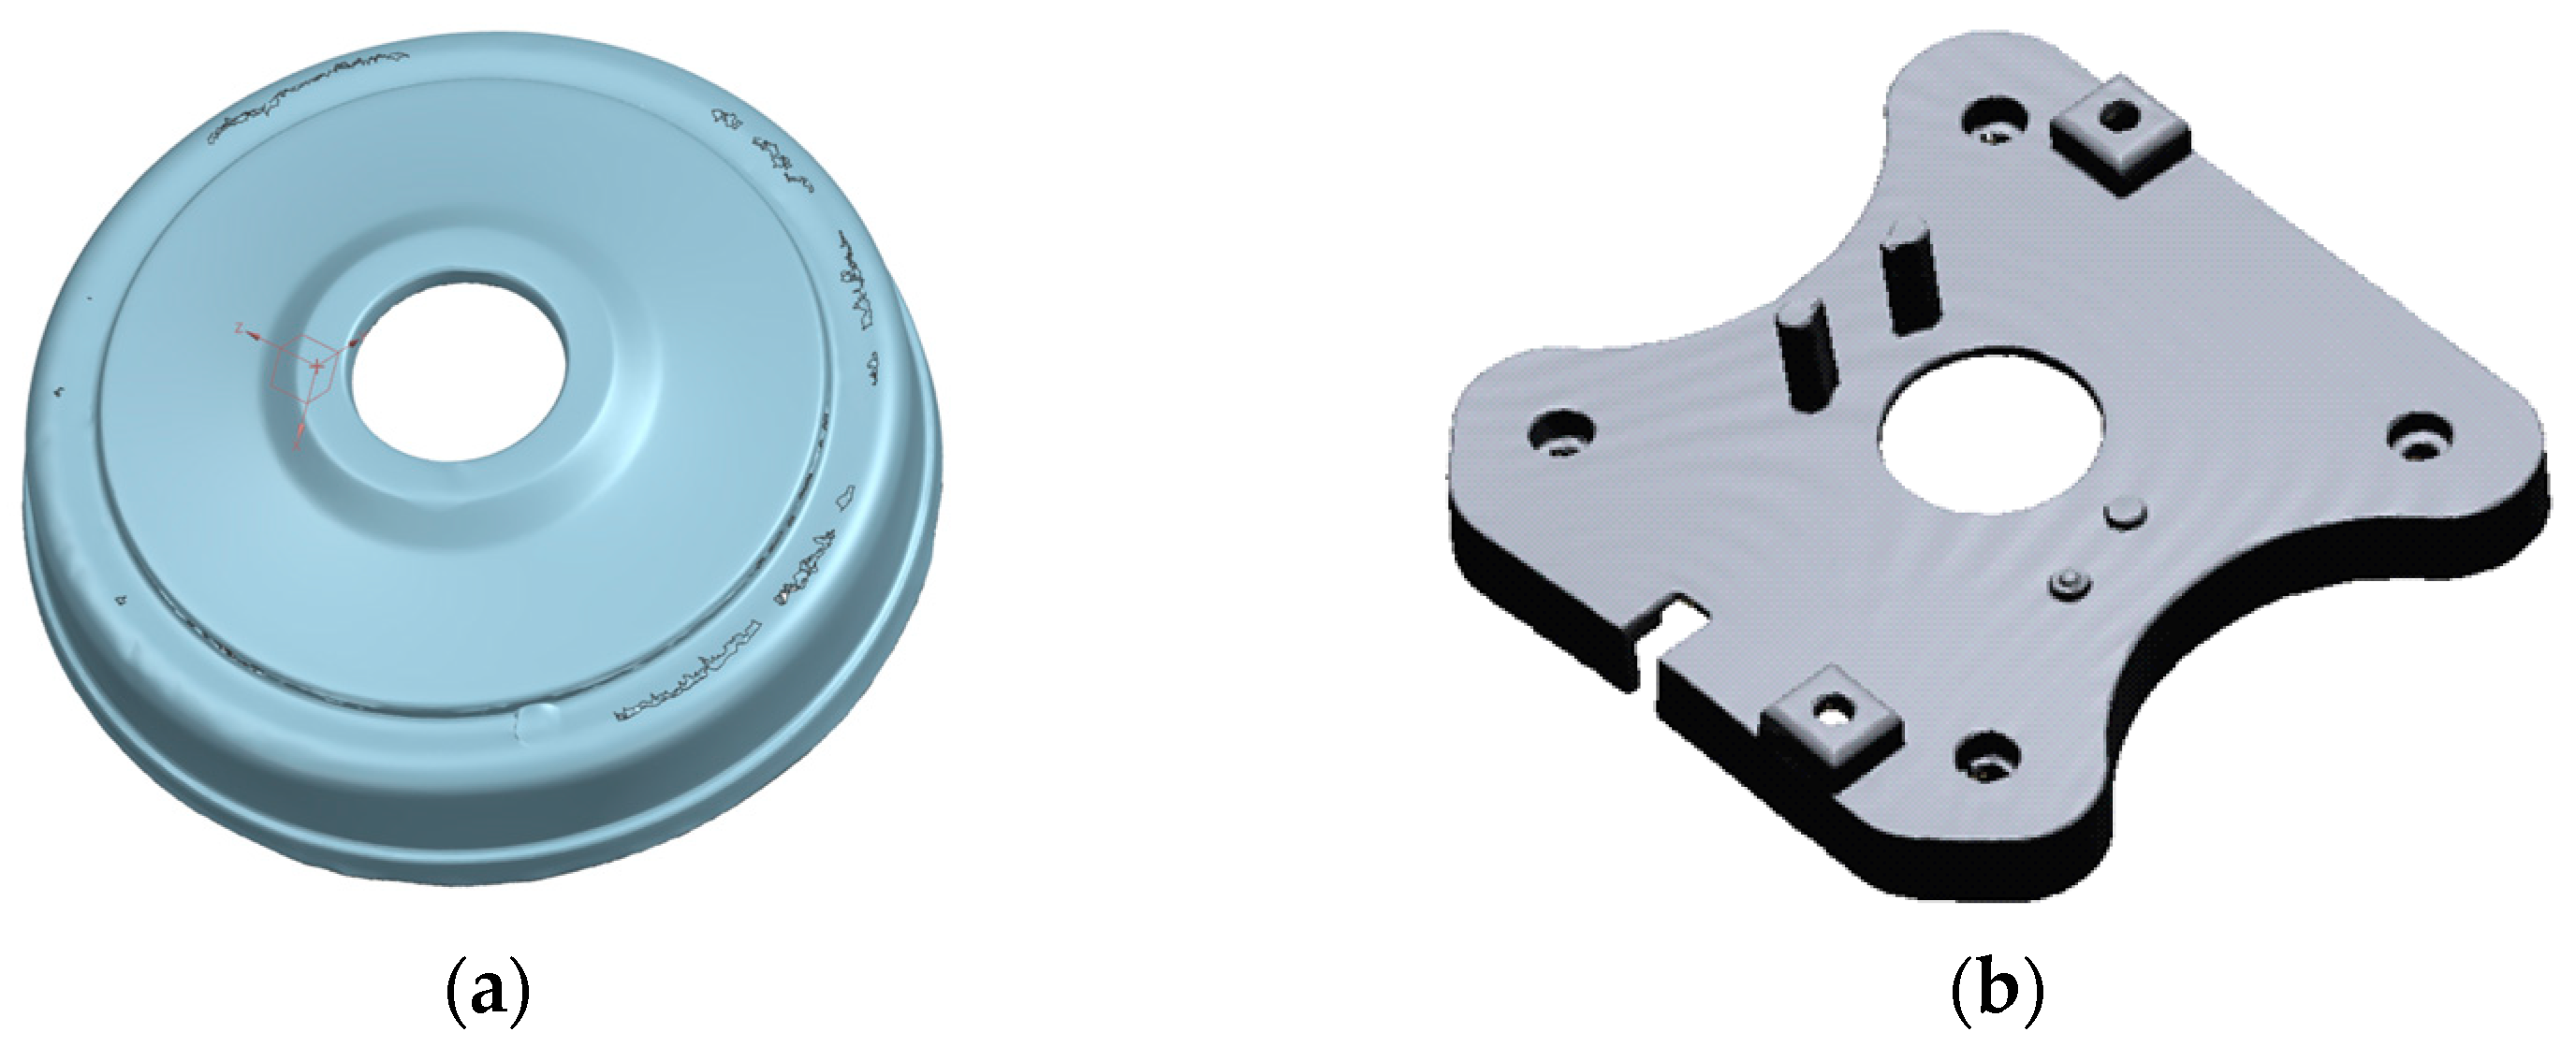
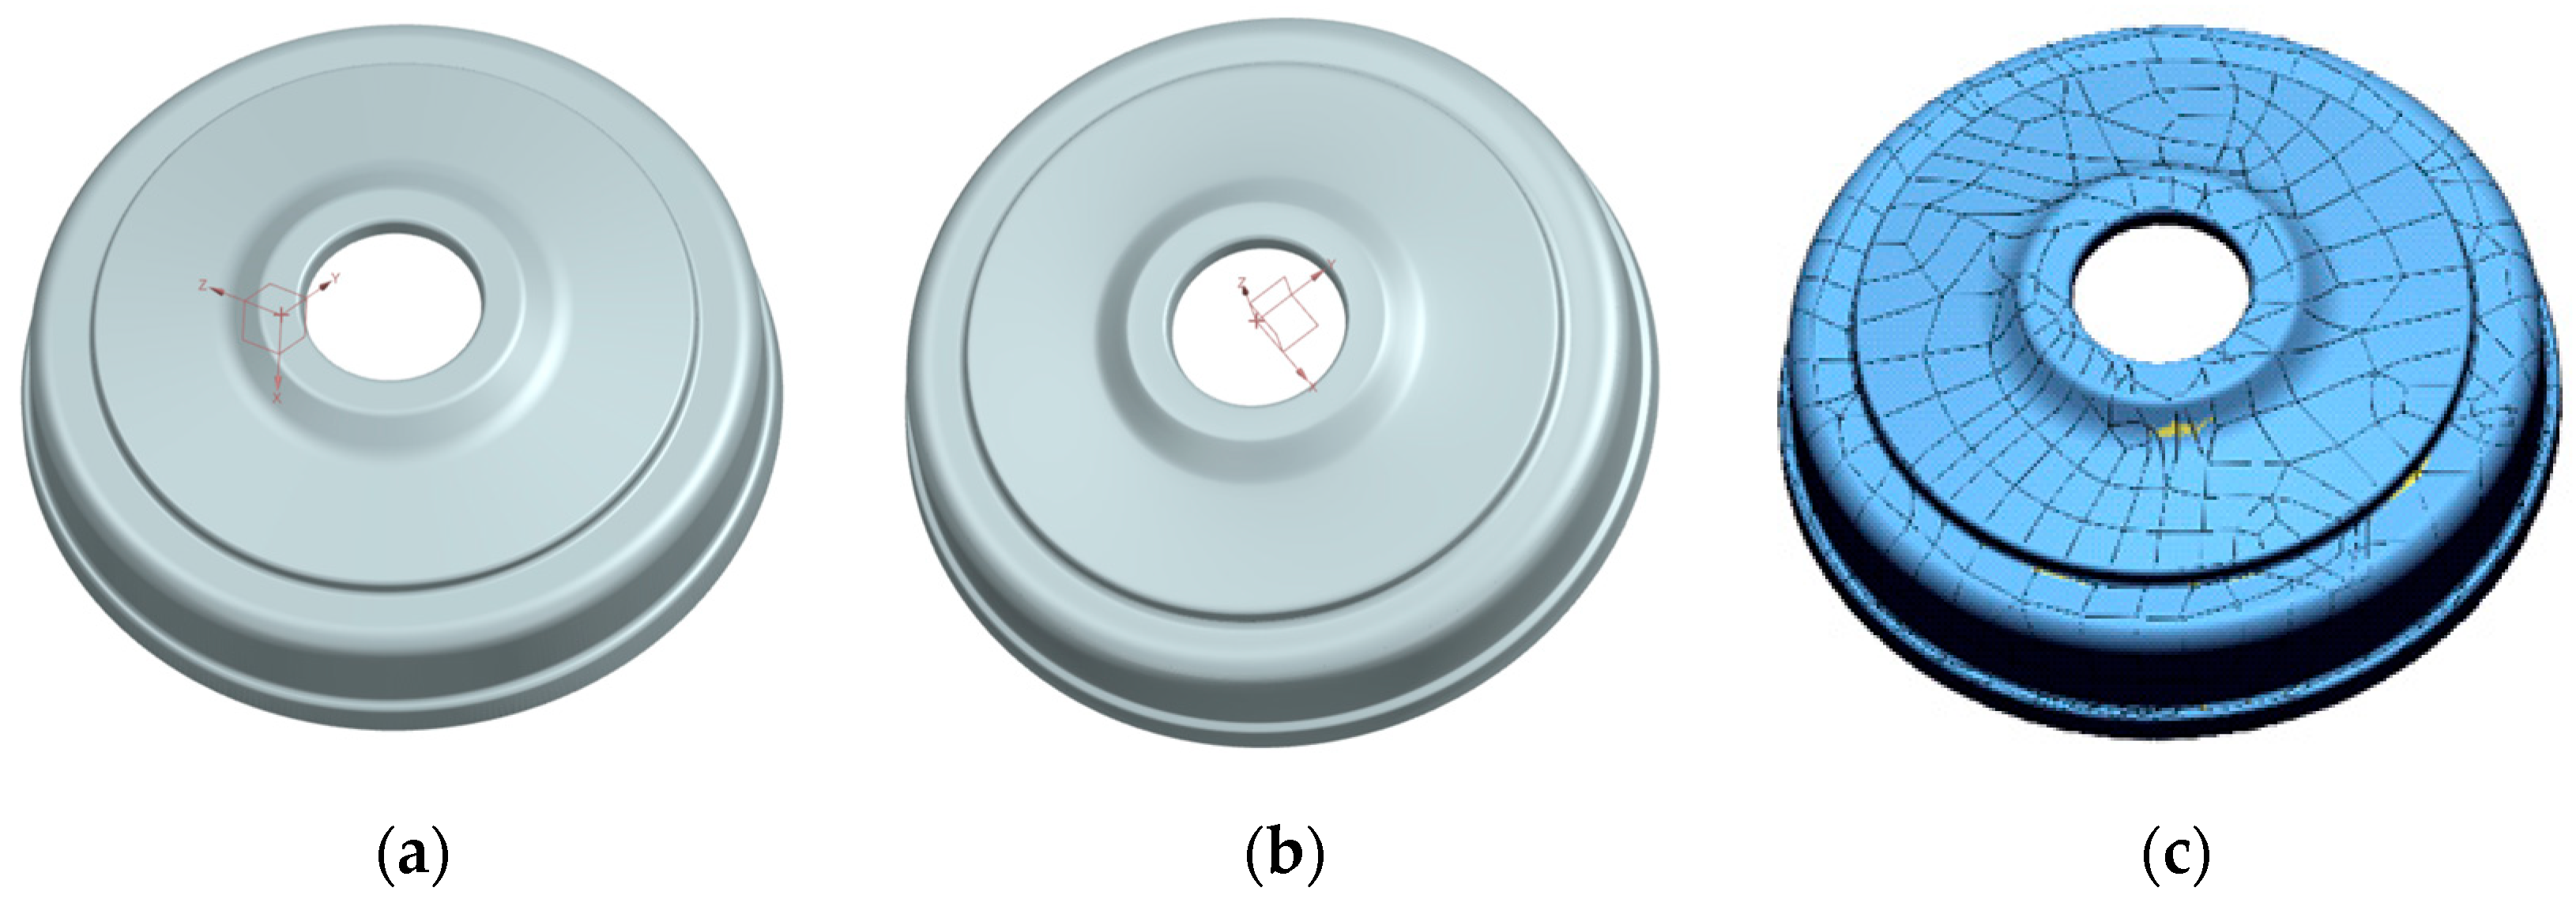
The process of reconstructing the cover for a vacuum unit began with applying reference points and matte spray to eliminate the reflective surface. According to the manufacturer, the thickness of the spray layer should not exceed 8–15 µm. After this preparation, the element was mounted on a rotary table. Measurements were conducted in two stages, focusing on both the external and internal geometry of the unit. The transformation method chosen to merge the two scans used reference points, with a deviation from these points measured at 0.05 mm. During both measurement processes, the measuring table made a total of 15 rotations. As a result of the measurements and subsequent point cloud conversion, an STL model was generated (Figure 4a).
The process of reconstructing the geometry of the battery covers began by applying reference points. The model was mounted on a rotary table, and a total of 15 complete rotations were performed during scanning. Measurements were taken in two stages, examining both the external and internal geometry. The transformation method selected to combine the two scans used the best-fit option, with a deviation of 0.025 mm. The resulting model was then exported to an STL file format (Figure 4b).

2.2. The Process of CAD Modeling

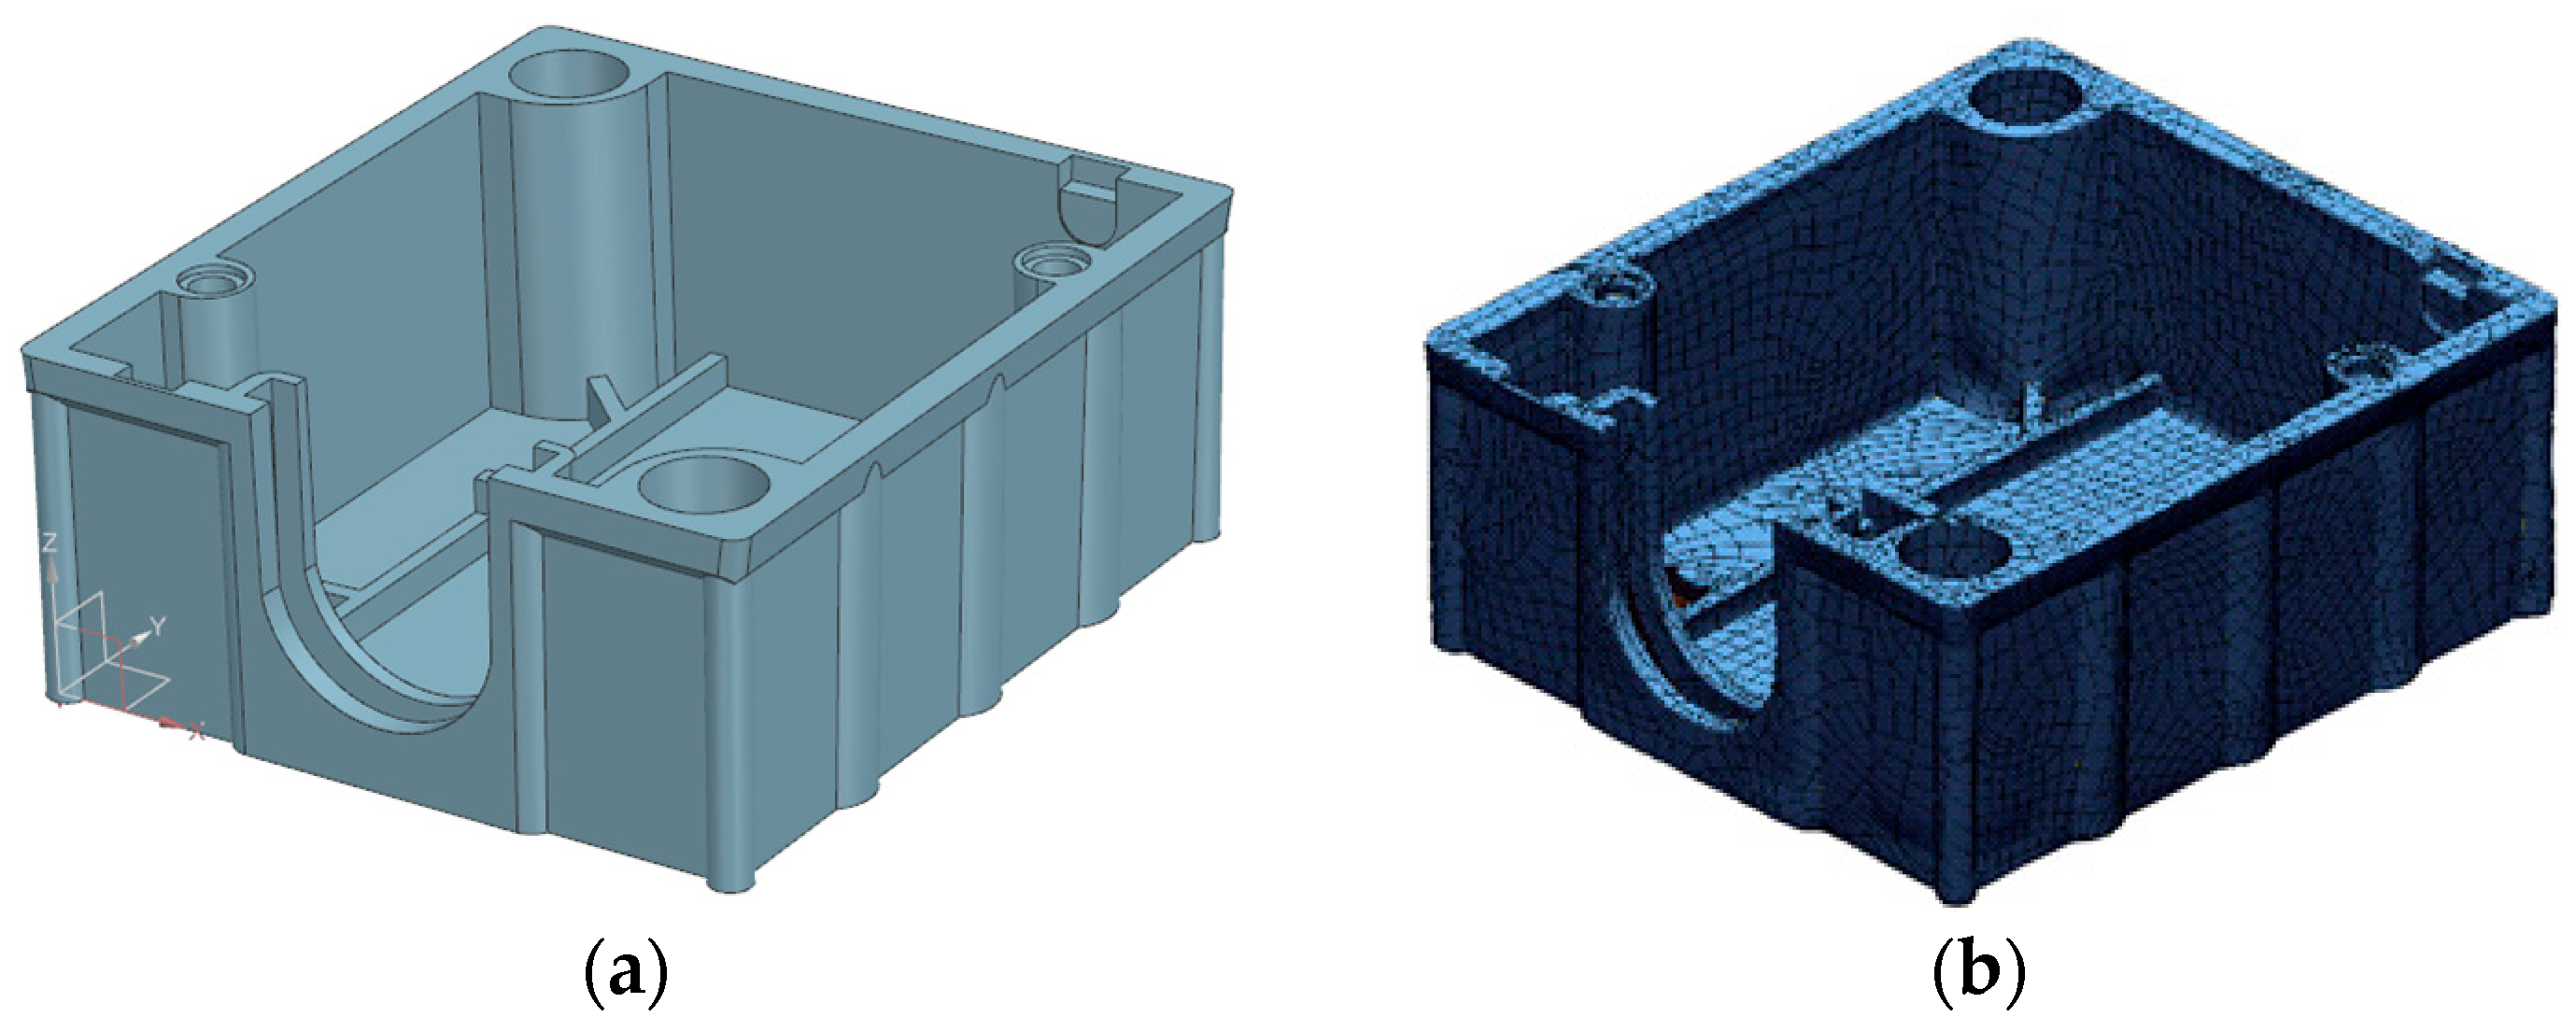
The 3D-STL model of the electrical box was reconstructed in Siemens NX using the reverse engineering module. The process began by importing a scan of the physical model and aligning it with the global coordinate system by creating three reference surfaces with the Fit Surface command. Surfaces for each face of the object were first reconstructed individually, using Fit Plane for planar surfaces and Fit Cylinder for cylindrical surfaces, while minimizing the Average Error for high accuracy. Once all faces were generated, they were extended with the Extend Sheet command, trimmed using the Trim Sheet function, and stitched with the Sew command to create a continuous, watertight surface model (Figure 5a). To utilize the auto-surface option, a curve mesh was created and projected onto the scanned model with the Project Curve option. The Rapid Surfacing command was then used to create a parameterized surface based on these projected curves (Figure 5b).
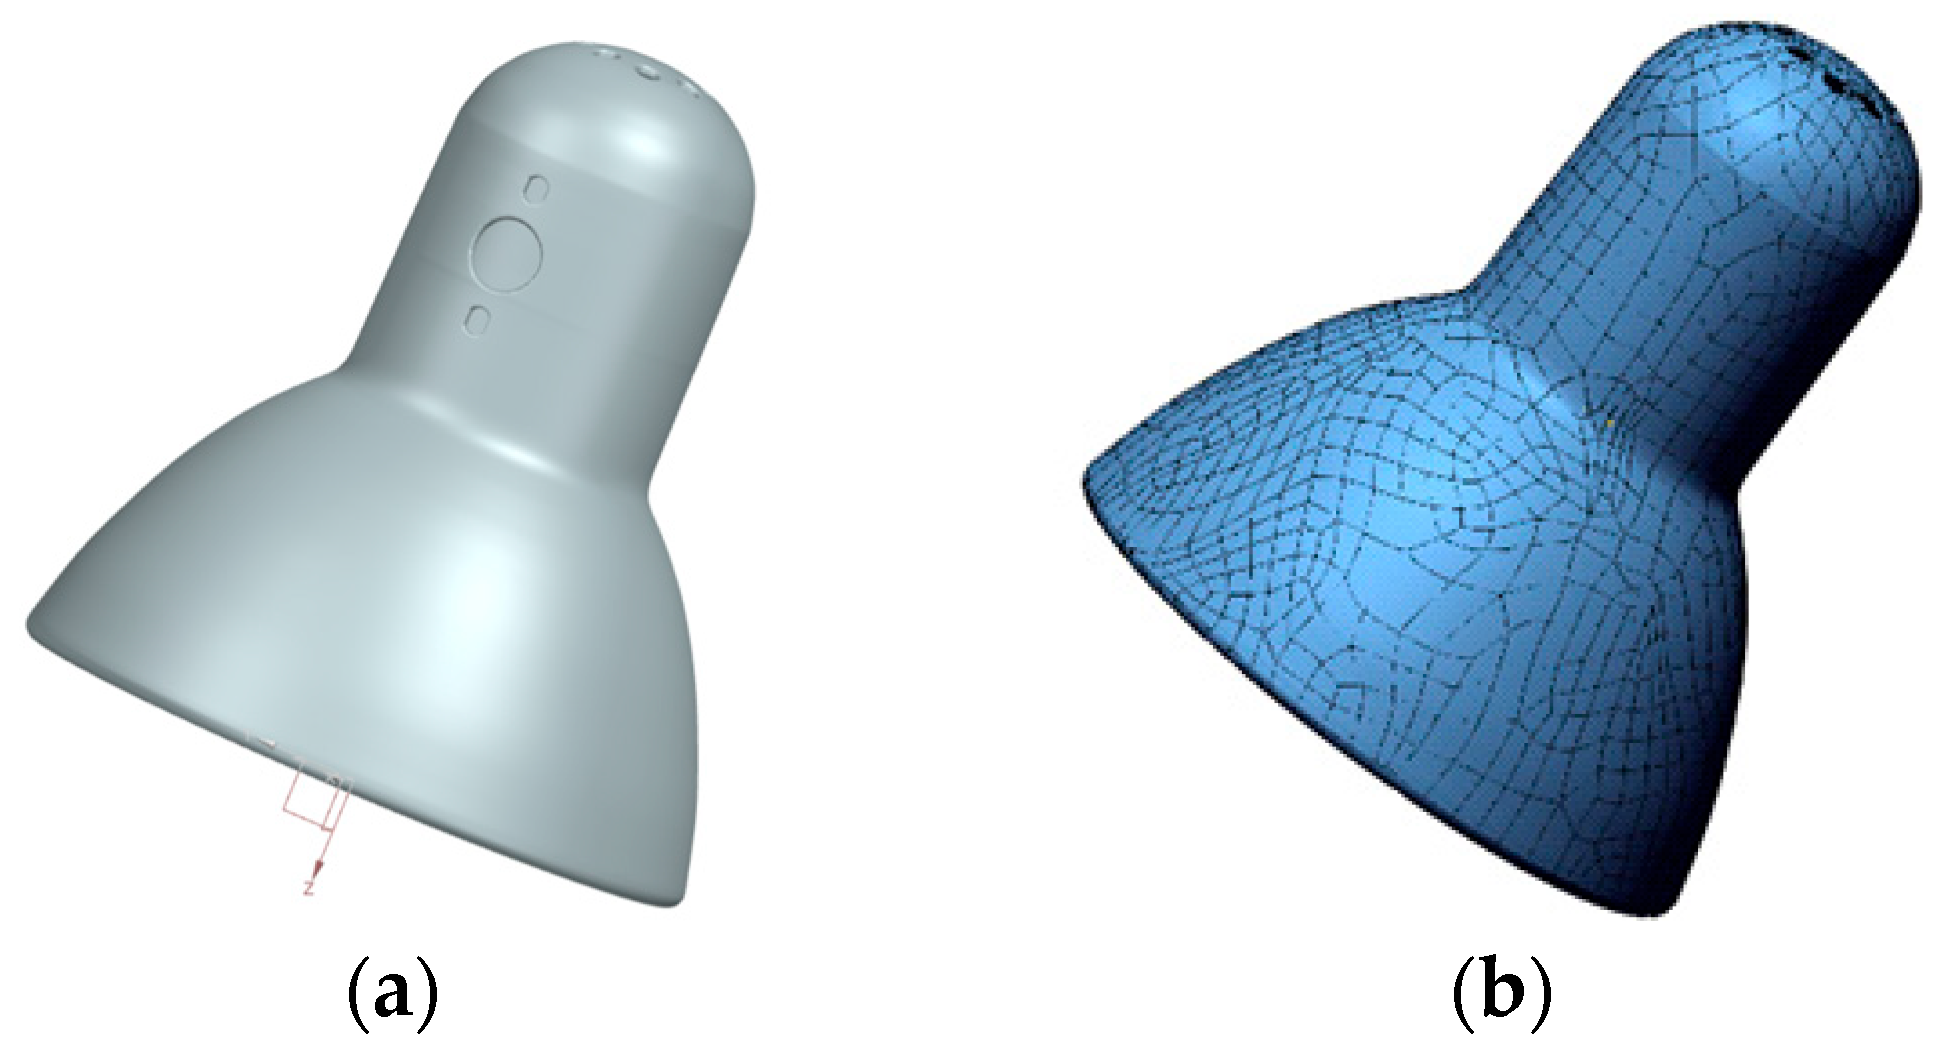
To reconstruct the 3D-STL model of the lampshade, a new coordinate system was created and aligned with the primary system, simplifying the process. A plane was positioned at the lampshade’s midpoint for contour projection using the Section Curve command. Corrections were made to the projected outer contour shape using a sketch, which was then rotated appropriately. Next, holes were created on the lampshade’s rear side. A new plane was set up parallel to the holes for projecting their outlines. The circular hole reconstruction involved creating points along its outline with variable density for accuracy. The process included sketching, projecting outlines, adding points, and using the Fit Curve function for precision. Finally, to generate a parameterized model (Figure 6a), a curve mesh was projected onto the lampshade. To use the auto-surface option in NX, a curve mesh was created and projected onto the lampshade’s scanned model using the Project Curve option. The Rapid Surfacing command was then used to create the surface, selecting the “Import Curves” operation to reconstruct it based on the projected curves. This process resulted in a parameterized surface model of the lampshade (Figure 6b).
During the measurement process, a 3D STL model of a vacuum unit cover was created, which led to a subsequent CAD modeling process. The initial method detected primitive geometries for quick approximations using simple shapes like cylinders and cones, with adjustments for structural continuity. Surfaces were modified with extended and trimmed functions for accuracy, resulting in a refined solid model with filets (Figure 7a). The second method involved rotating the STL object’s cross-section in the Z-Y plane for an outline projection. After cutting and correcting imperfections with a spline curve, the outline was rotated around the Z-axis to form the model. In NX, we used the Project Curve option to mesh curves onto the scanned model (Figure 7b) and applied the Rapid Surfacing command to create a parameterized surface model of the vacuum unit cover (Figure 7c).
The STL mesh from the battery cover scan was imported into Siemens NX’s reverse engineering module as the starting dataset. The raw model exhibited common scanning artifacts, so instead of extensive preprocessing, it was divided into basic geometric shapes like cylinders and flat surfaces for effective surface reconstruction. The Fit Surface functionality approximated these shapes with parametric surfaces, primarily using planar and cylindrical patches. A dedicated coordinate system was established for accurate alignment, resulting in a solid model with high fidelity to the original cover (Figure 8a). To utilize the auto-surface option, I created a detailed curve mesh representing the desired contours and projected it onto the scanned model using the Project Curve option for precise alignment. Then, I employed the Rapid Surfacing command, selecting Import Curves to incorporate the projected mesh into the surface definition. This process generated a highly parameterized surface model, improving accuracy and streamlining future design iterations (Figure 8b).
After completing the CAD modeling process, models with the smallest geometrical errors were selected. A tessellation process was then conducted on these models to convert from CAD into STL format. Given the resolution capabilities of modern 3D printers, specific parameters for exporting data from CAD to STL format have been selected in Siemens NX software:
  • Select the binary format to save the STL file, as the ASCII format (American Standard Code for Information Interchange) results in larger file sizes;
  • Set the chordal deviation to less than 0.01 mm;
Set the angle deviation to a value of less than 10°.
These settings will help ensure optimal performance and quality in 3D printing.

2.3. The Process of Additive Manufacturing and Measuring 3D Printed Models

The first preparatory step before beginning the 3D printing process of the electrical box, a lampshade for a standing lamp, a cover for a vacuum unit model, and a battery cover was importing its reconstructed geometry into the Insight V1980-6633 software (Stratasys, Eden Prairie, Minnesota, USA). The initial operation involved orienting the model using the Automatic Orientation command, with the additional option to minimize support structures. This approach positively affects both 3D printing time and material consumption. The selected infill type was Sparse, which results in denser material deposition near the model’s outer walls, while the inner volume remains more sparsely filled. This significantly reduces 3D printing time and conserves building material. For the surface finish quality of the external surfaces, the Enhanced option was selected, while for the support structures, the Basic option was used. The next stage involved slicing the model into layers and generating support structures, both of which were performed automatically by the software. Additionally, a machine control program was generated along with a corresponding Coordinate Machine Binary (CMB) file. The generated file was then imported into the Control Center 7.0 software (Stratasys, Eden Prairie, MN, USA), which serves as an interface between the PC and the 3D printer. In this program, the model was positioned within the printer’s workspace, and the Build Job command was executed. This action transferred the model along with its control program to the Fortus 360mc 3D printer. In the process of manufacturing the models, ABS-M30 material and a layer thickness of 0.127 mm were used. This is the highest resolution at which models can be produced on the Fortus 360-mc 3D printer. The manufactured models are presented in Figure 9.
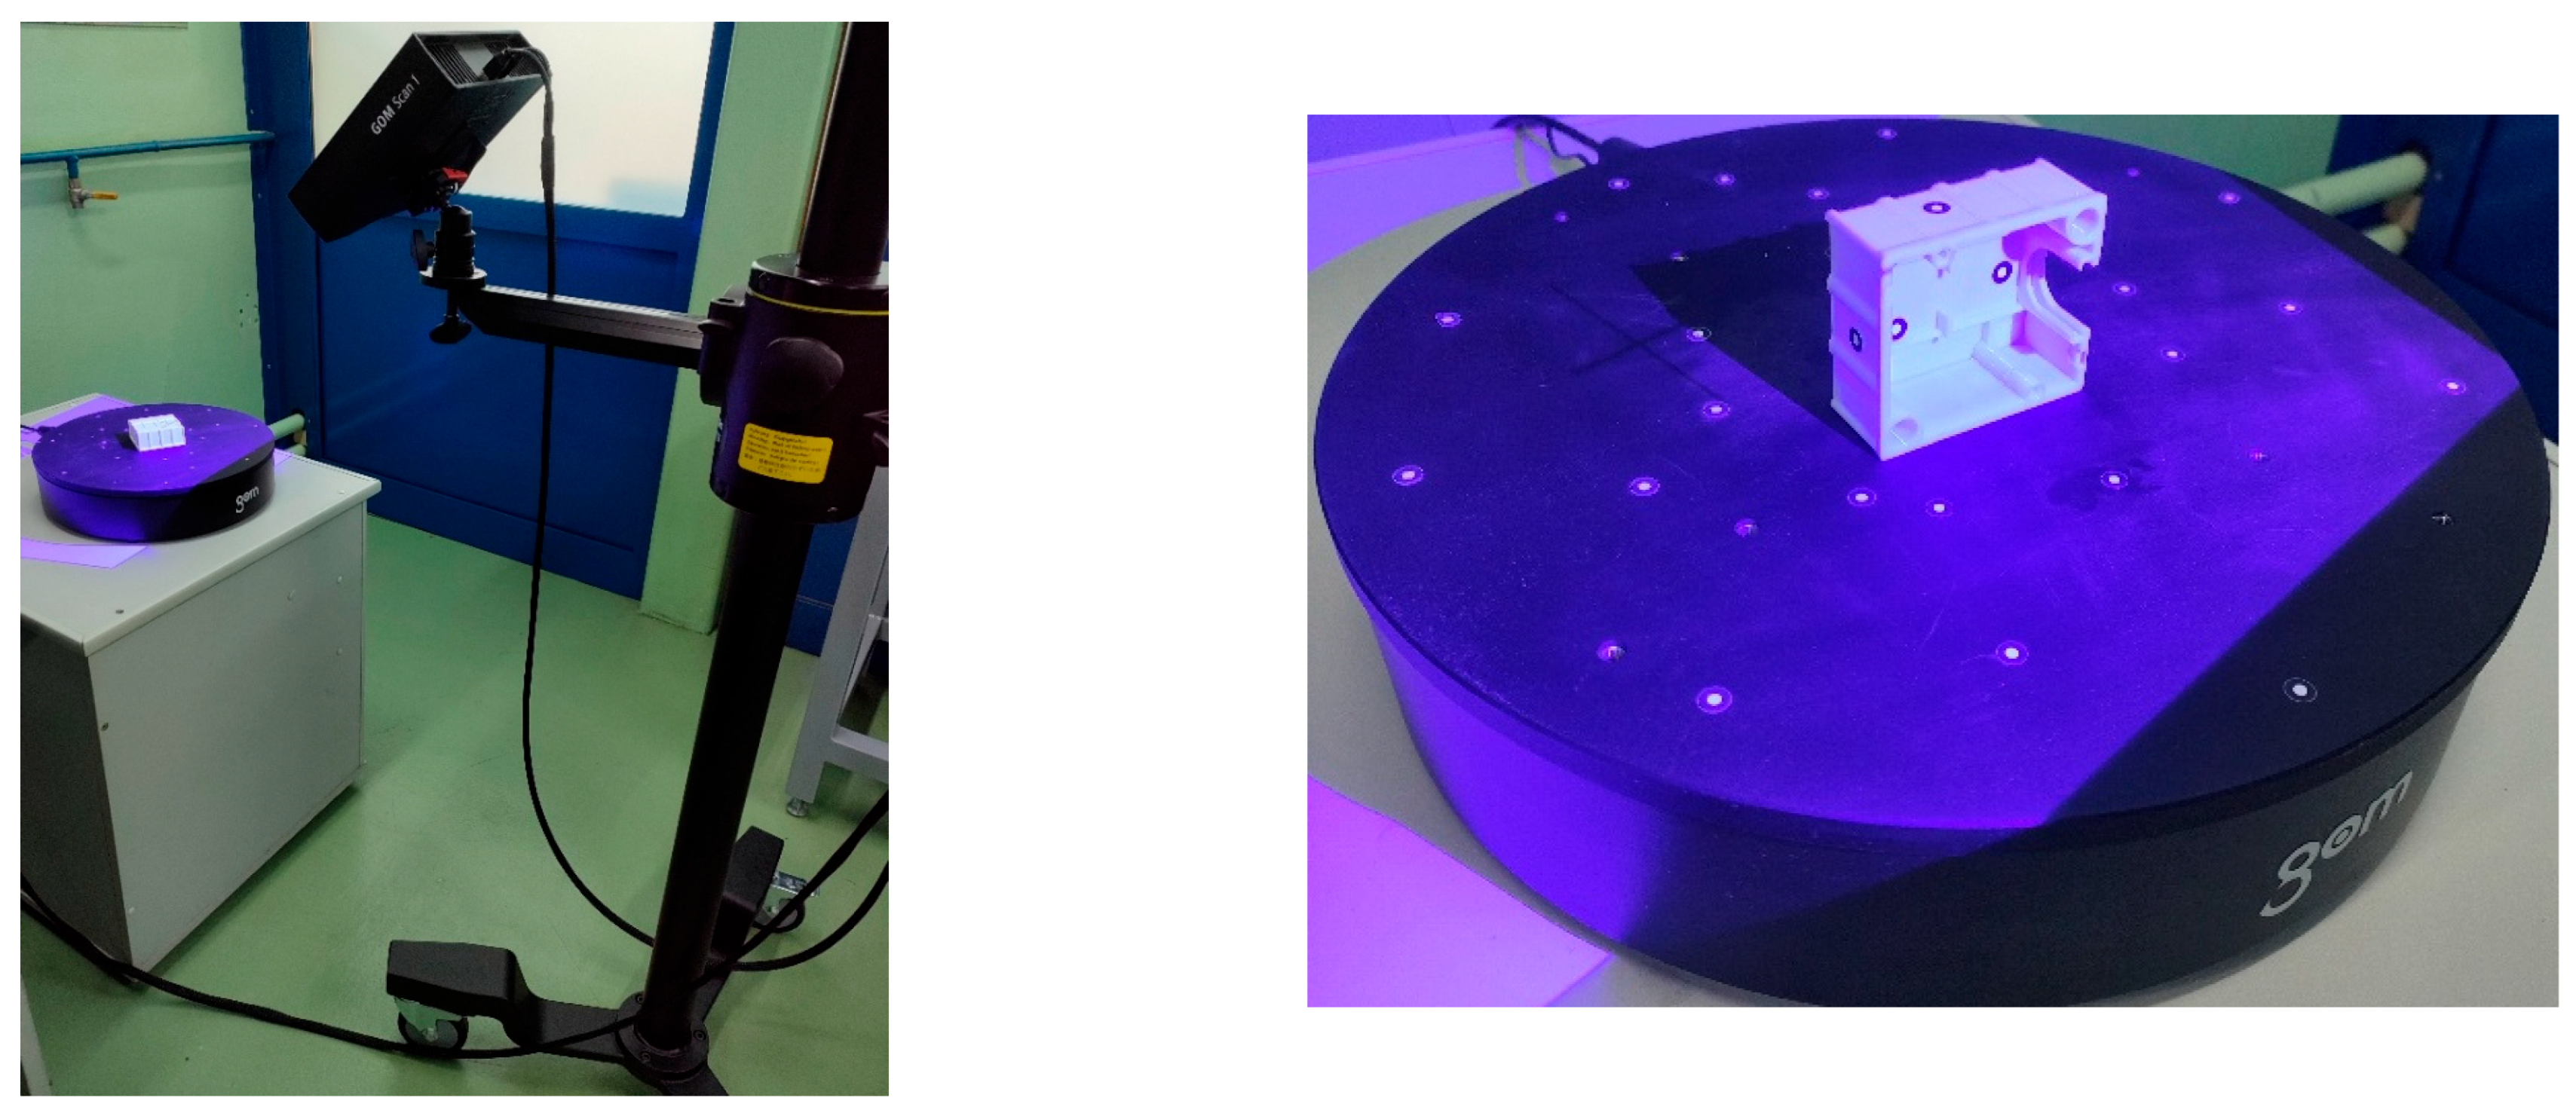
The final stage of the research involved measuring the geometry of the models after they were 3D printed (Figure 10). For this purpose, we used the GOM Scan 1 scanner, which had been used previously. We used the same measurement parameters as before.

3. Results

The accuracy of the model geometry was verified during the stages of reconstruction, CAD modeling, and additive manufacturing using Zeiss Inspect 2024 software (Carl Zeiss AG, Jena, Germany). The model fitting process used the best-fit method, achieving an accuracy of 0.001 mm. The results are presented at the following stages:
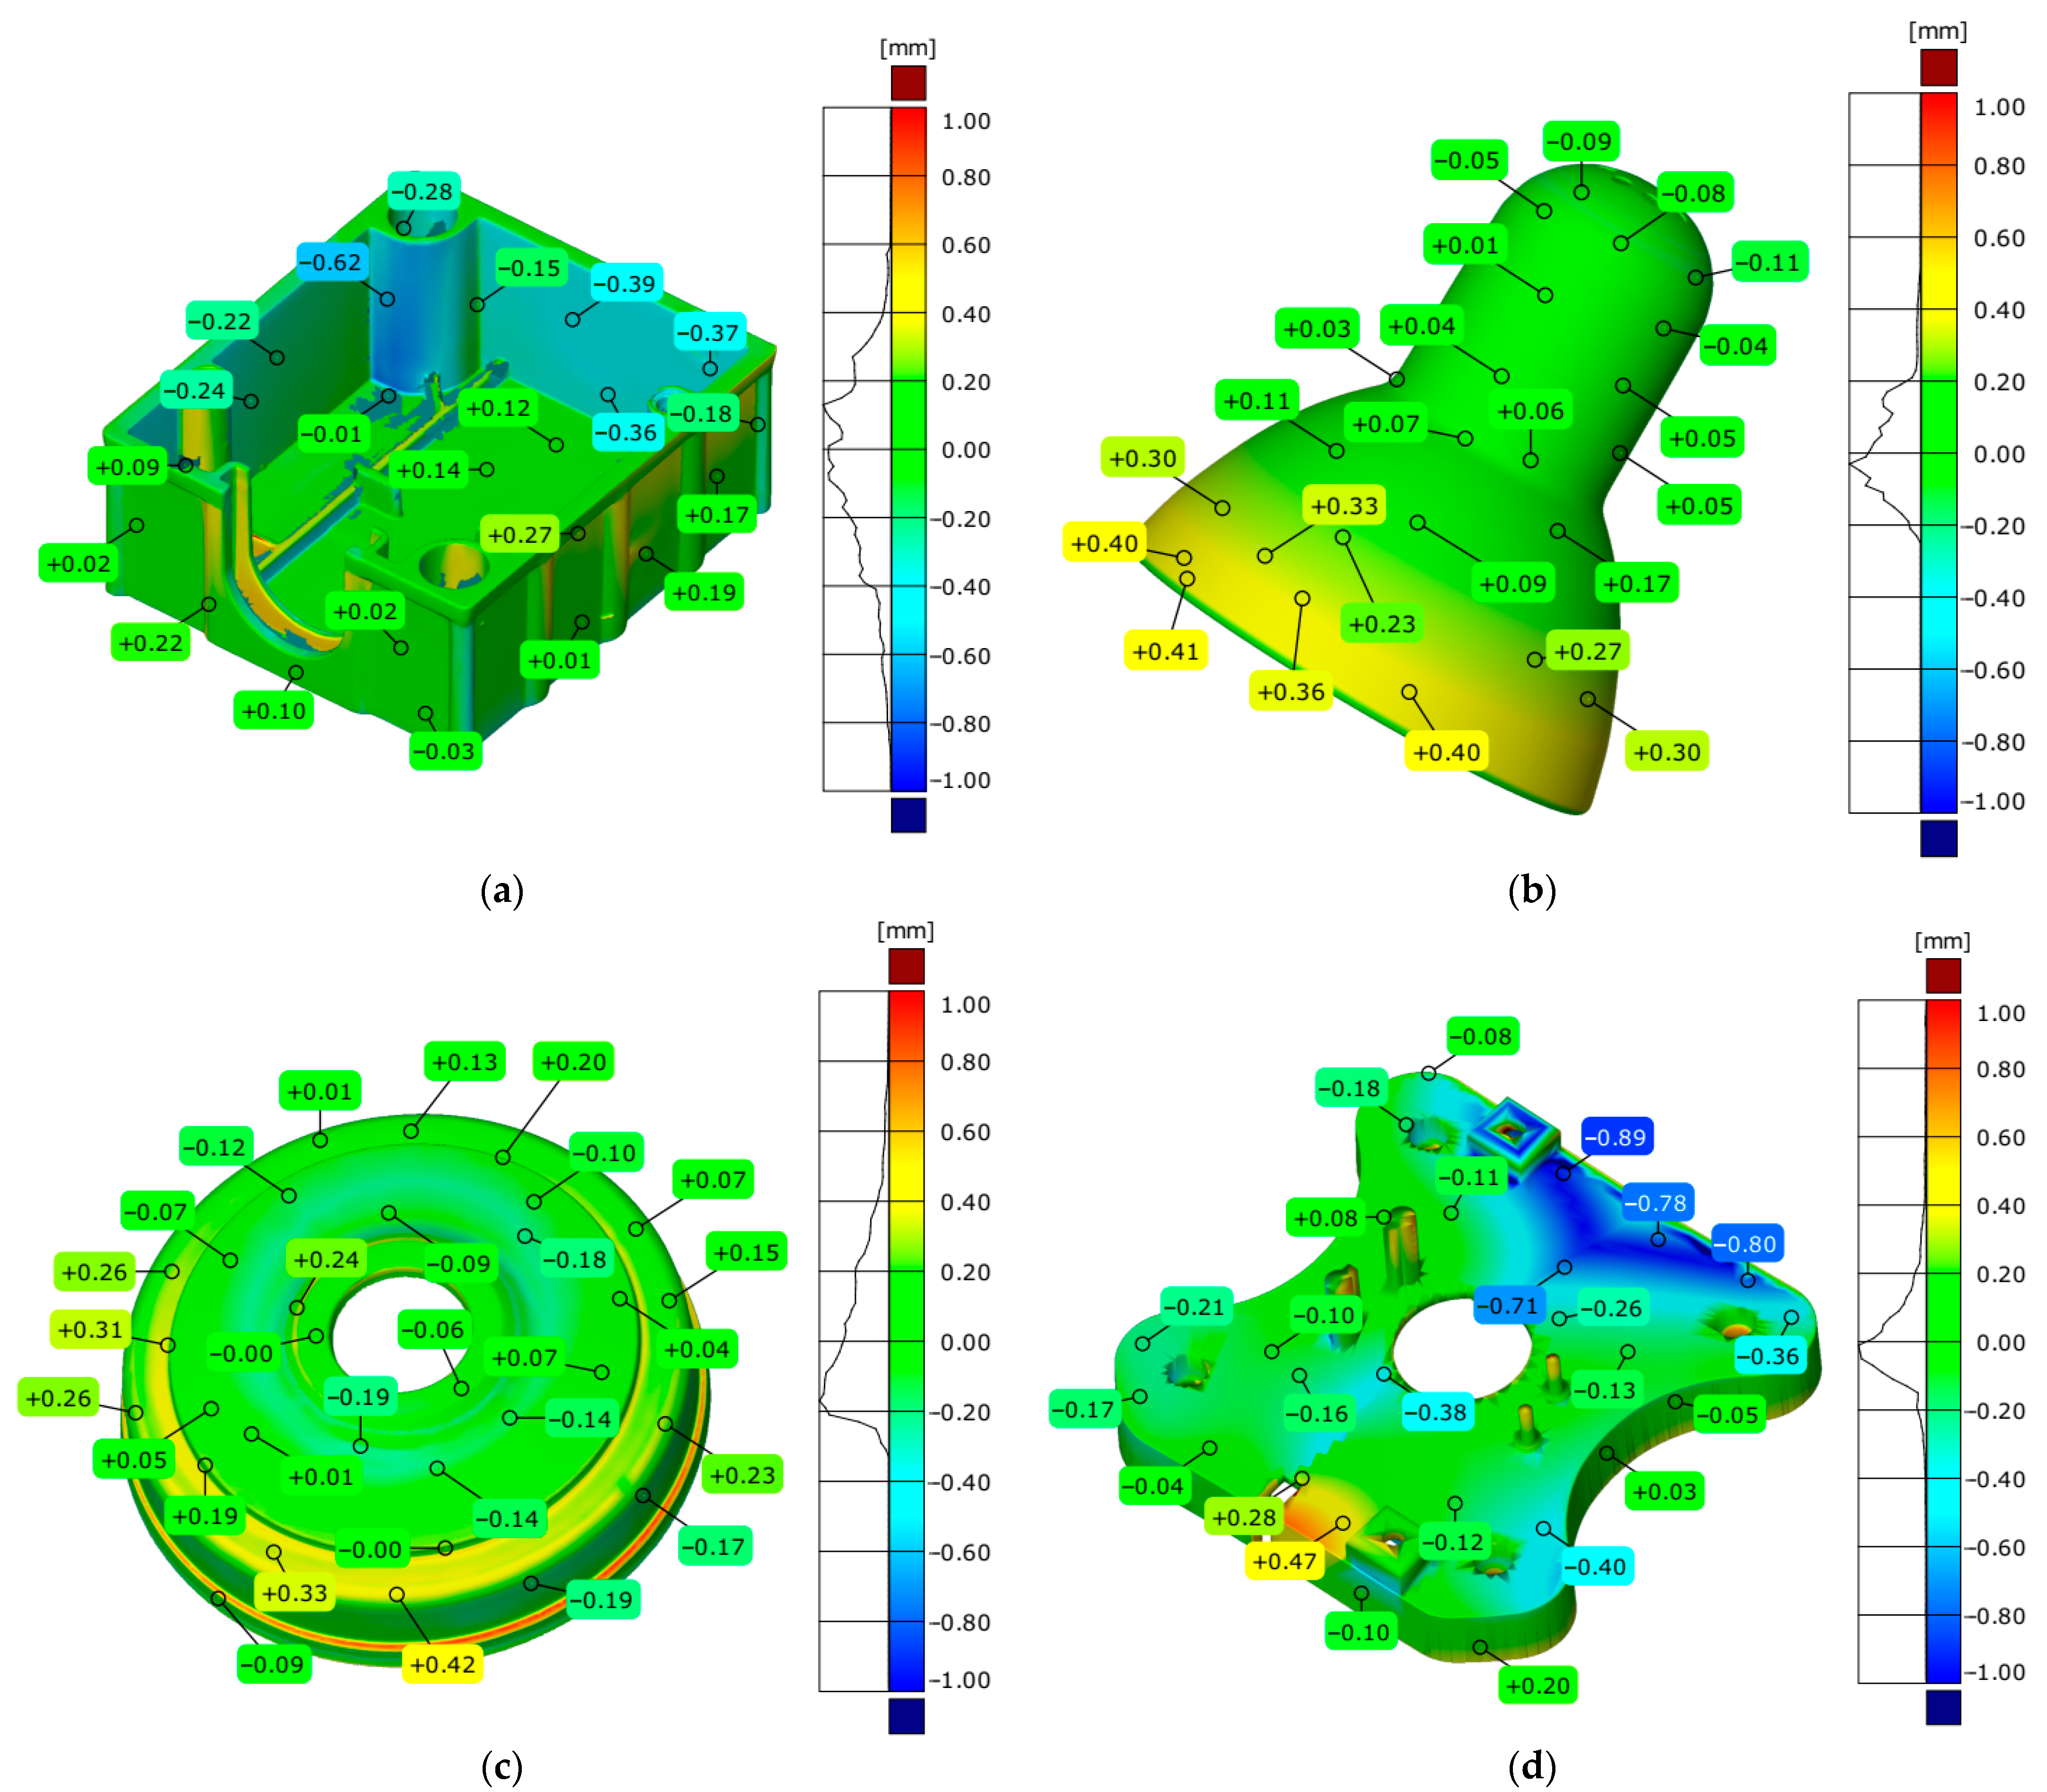
  • Geometry reconstruction in the form of three-dimensional deviation maps (Figure 11) and statistical parameters (Table 3);
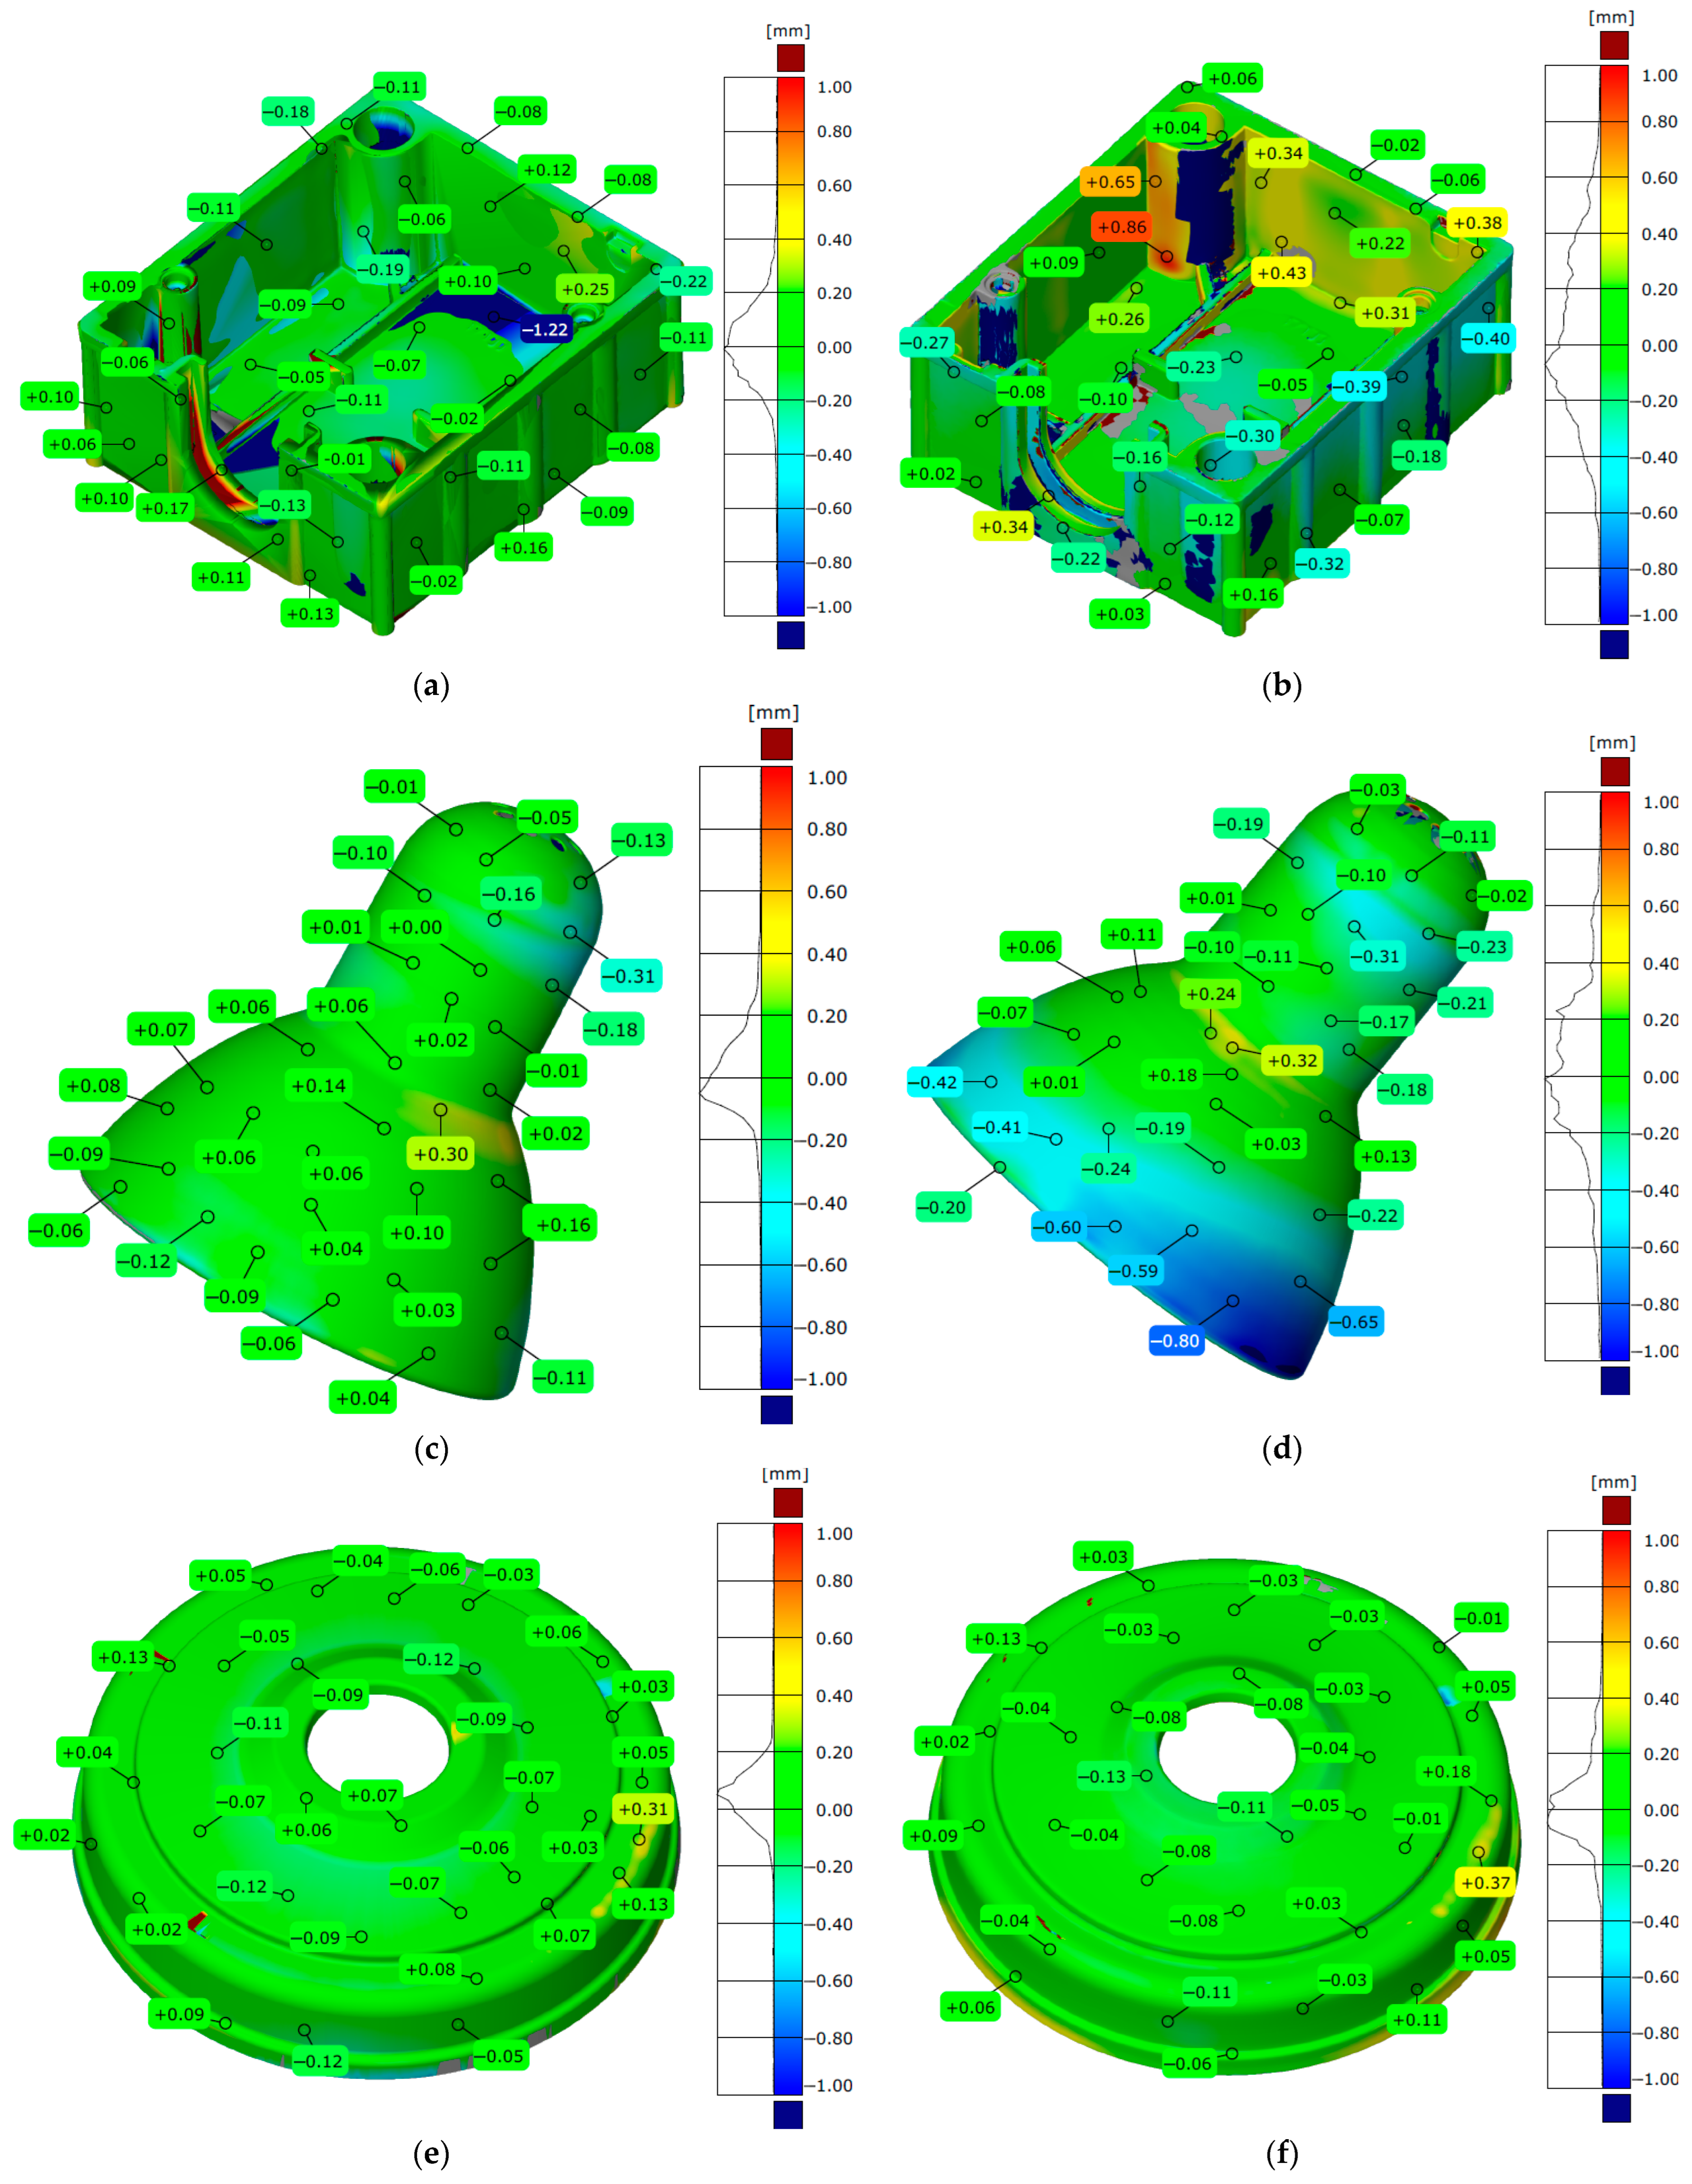
  • CAD modeling in the form of three-dimensional deviation maps (Figure 12) and statistical parameters (Table 4);
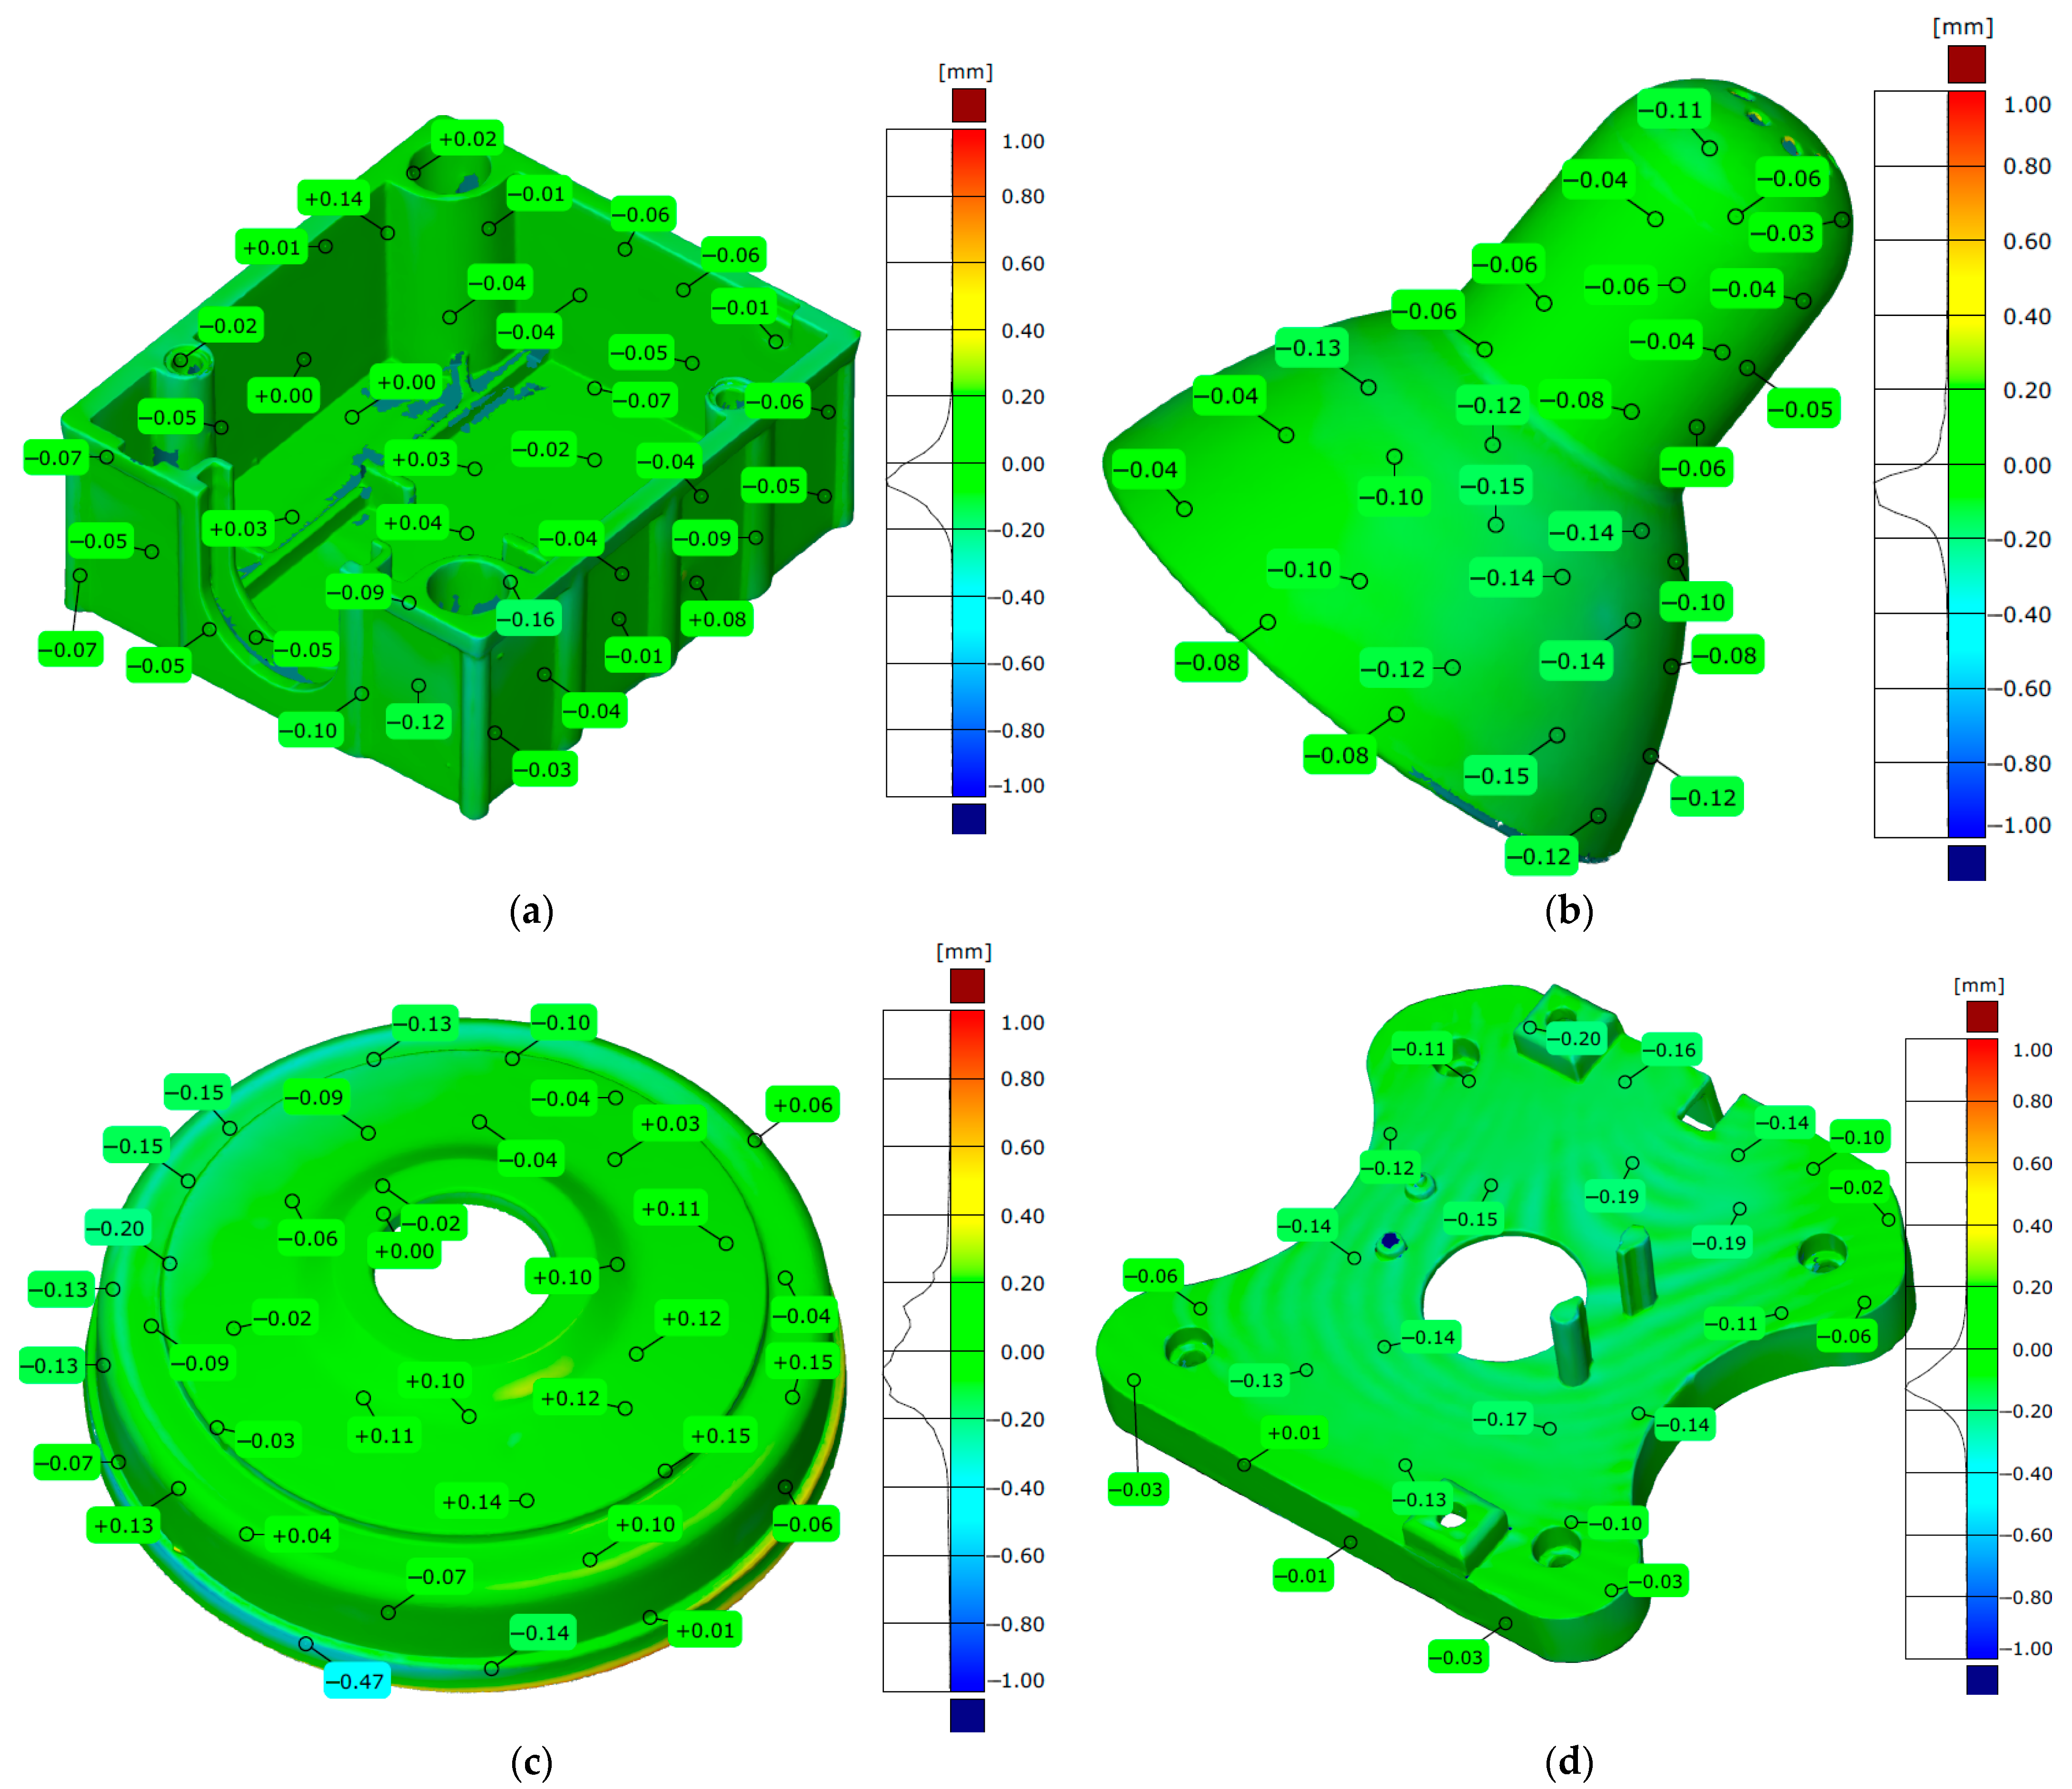
  • Additive manufacturing in the form of three-dimensional deviation maps (Figure 13) and statistical parameters (Table 5);
  • RE + CAD + AM (the nominal model with a scan of the 3D printed model)—total error in the form of three-dimensional deviation maps (Figure 14) and statistical parameters (Table 6);
Considering the research conducted and the three-dimensional maps of geometric deviations obtained, attention was drawn to the factors affecting the accuracy of the process presented:
Prepare the object for measurements.
  • Remove All Contaminants: The model’s surface must be free from any dust, dirt, oil, fingerprints, or residue from manufacturing. Even microscopic particles can affect the accuracy of high-precision scanners. Use compressed air, a soft brush, or a lint-free cloth with a suitable solvent (like isopropyl alcohol) that will not damage the part’s material. Handle the model with gloves to prevent transferring oils from your hands to the surface.
  • Applying Surface Coatings: If the object has highly reflective, transparent, or glossy surfaces, use a matte anti-reflective spray to make them detectable by optical scanners. The coating should be applied as thinly and uniformly as possible to avoid altering the object’s true geometry.
  • Applying Reference Points: Use high-quality, adhesive reference points that are compatible with your measurement system. Distribute the targets evenly across the model’s surface. Place them in non-critical areas to avoid interfering with key geometric features. Ensure there are enough targets to guarantee at least three are visible from any scanning angle.
  • Data Acquisition and Reconstruction.
  • Securing the Object: The object must be securely fixture to prevent any movement during the measurement process. Vibrations or accidental shifts can cause significant measurement errors. Let the object acclimate to the temperature of the measurement environment to prevent thermal expansion or contraction, which is especially important for polymer parts.
  • Scanning Technique: Use a high-precision 3D scanner to capture data. Optimize the scanning process by selecting the appropriate type of measuring head, which determines the size of the measuring area and thus the resolution of the point cloud. In addition, it is necessary to determine the optimal number of measuring steps for the table.
  • Alignment Point Clouds: To create a complete and accurate 3D model from multiple scans, it is essential to properly align or “fit” the individual point clouds together. The most reliable method for fitting point clouds together is to use reference points. When reference points are not available, or as a complementary method, a best-fit algorithm can be used. This method works by finding the optimal position and orientation for two overlapping point clouds to minimize the average distance between all corresponding points.
  • CAD Modeling
  • Clean the 3D Mesh: Before meshing, process the raw data to remove any noise, programming errors of the 3D Mesh, outliers, or duplicate points.
  • Parameterization CAD Model: Choose a reconstruction method that is appropriate for the object’s geometry.
  • Primitive Detection: For models with regular, geometric shapes (planes, cylinders, cones), this method converts the point cloud into a precise, parametric CAD model. Set the appropriate fitting tolerance. Tolerance defines the maximum deviation that points can have from the ideal surface of the primitive in order to be included in it. Too high a tolerance can lead to noisy data being combined into a single primitive, while too low a tolerance will prevent the primitive from being detected at all.
  • Profile Extraction: Always select cross-sections at key, representative locations of the object (e.g., at the beginning and end of segments, at locations where the geometry changes). Use a minimal but sufficient number of profiles to reproduce the shape accurately. Too many profiles can complicate the model, while too few will lead to errors in the final shape. Before extracting profiles, remove noise from the point cloud so that the cross-section lines are as smooth as possible. Ensure that the cross-section planes are perfectly perpendicular to the object’s axis so that the profiles are accurate.
  • Auto-Surfacing: For organic or complex, free-form shapes, this method automatically generates a surface mesh (NURBS) that is smooth and easy to manipulate in CAD software. Set the appropriate parameters for the algorithm, such as matching tolerance, surface density, and number of patches. Too low a tolerance may cause the model to be noisy, while too high a tolerance will smooth out essential details.
  • MEX Additive Manufacturing Process
  • Model Orientation: Orient the model to minimize the need for support structures, especially on critical surfaces. Selecting an appropriate orientation also equalizes the stresses along the print layers, which minimizes distortion (e.g., material shrinkage) and increases the strength of the finished part.
  • 3D Printing Parameters: Use the thinnest layers possible to increase dimensional accuracy and surface smoothness. You can also optimize the infill pattern to achieve adequate strength while saving material and reducing print time.
Based on the factors determining the accuracy of the reconstruction process, CAD modeling, and additive manufacturing of models using MEX technology, the main guidelines and recommendations were developed in the form of a diagram (Figure 15).
Based on the recommendations provided, paths have been developed to minimize errors in reconstruction, CAD modeling, and additive manufacturing using MEX technology. Table 7 summarizes the average deviations identified during the reconstruction, CAD modeling, and additive manufacturing processes using MEX technology for the analyzed models. Errors in the total process (RE + CAD + AM) were also presented. The obtained ranges of deviations were determined at a confidence level of 0.95.
Additionally, to ensure the quality of the reconstruction, CAD modeling, and additive manufacturing processes, it is crucial to adhere to the standards for geometric accuracy that define the characteristics of the reconstructed models. The geometric accuracy requirements vary significantly for each of the selected components, as each of these parts performs a different function. In the case of a lampshade, there is no single, standardized dimensional tolerance value.
Tolerances are not standardized because lampshades are not precision-engineered parts that require strict mechanical fits. Instead, the acceptable dimensional tolerance is determined by the manufacturer based on the specific material and manufacturing process.
Electrical boxes must comply with the PN-EN IEC 60670 standard [47]. They should accommodate standard switches, sockets, and cables. The main geometric requirements include the following:
  • Flatness: Deviations should ensure adhesion to the wall and fittings. The obtained deviation values should be within the range ±0.2 mm.
  • Mounting hole spacing: Must be within the range ±0.2 mm to fit the standard socket and switch spacing.
  • Depth: Must be uniform and within tolerance, typically ±0.3 mm, to ensure that the hardware fits in the box and does not protrude.
There are no specific standards for the accuracy of vacuum cleaner covers, but guidelines can be provided for critical components:
  • Flatness of the sealing surface: The flatness requirements for maintaining tightness should be within the range ±0.2 mm.
  • Geometric accuracy at the edges: This is important for the cover to fit the body. The recommended manufacturing tolerance should be within the range of ±0.2 mm.
Moderate geometric accuracy is required for the battery cover. The cover must fit the battery compartment to ensure a secure closure. Key requirements include the following:
  • Flatness of contact surfaces: To ensure that the cover does not fall out and protects the interior from dirt, the flatness of the contact surfaces is crucial. The required deviation values should be within the range of ±0.2 mm.
  • Dimensional accuracy of the fixing holes: These elements are critical for proper fastening. Tolerances must ensure that the latch will function reliably and that the threads will not loosen. These values should be within the range of ±0.2 mm.
Considering the deviation values observed in critical areas of the models, we examined these values and summarized them in Table 8. However, the tests for the lampshade of a floor lamp were not included due to the absence of specific guidelines. The obtained ranges of deviations were determined at a confidence level of 0.95.

4. Discussion

4.1. Evaluation of Geometrical Reconstruction Errors

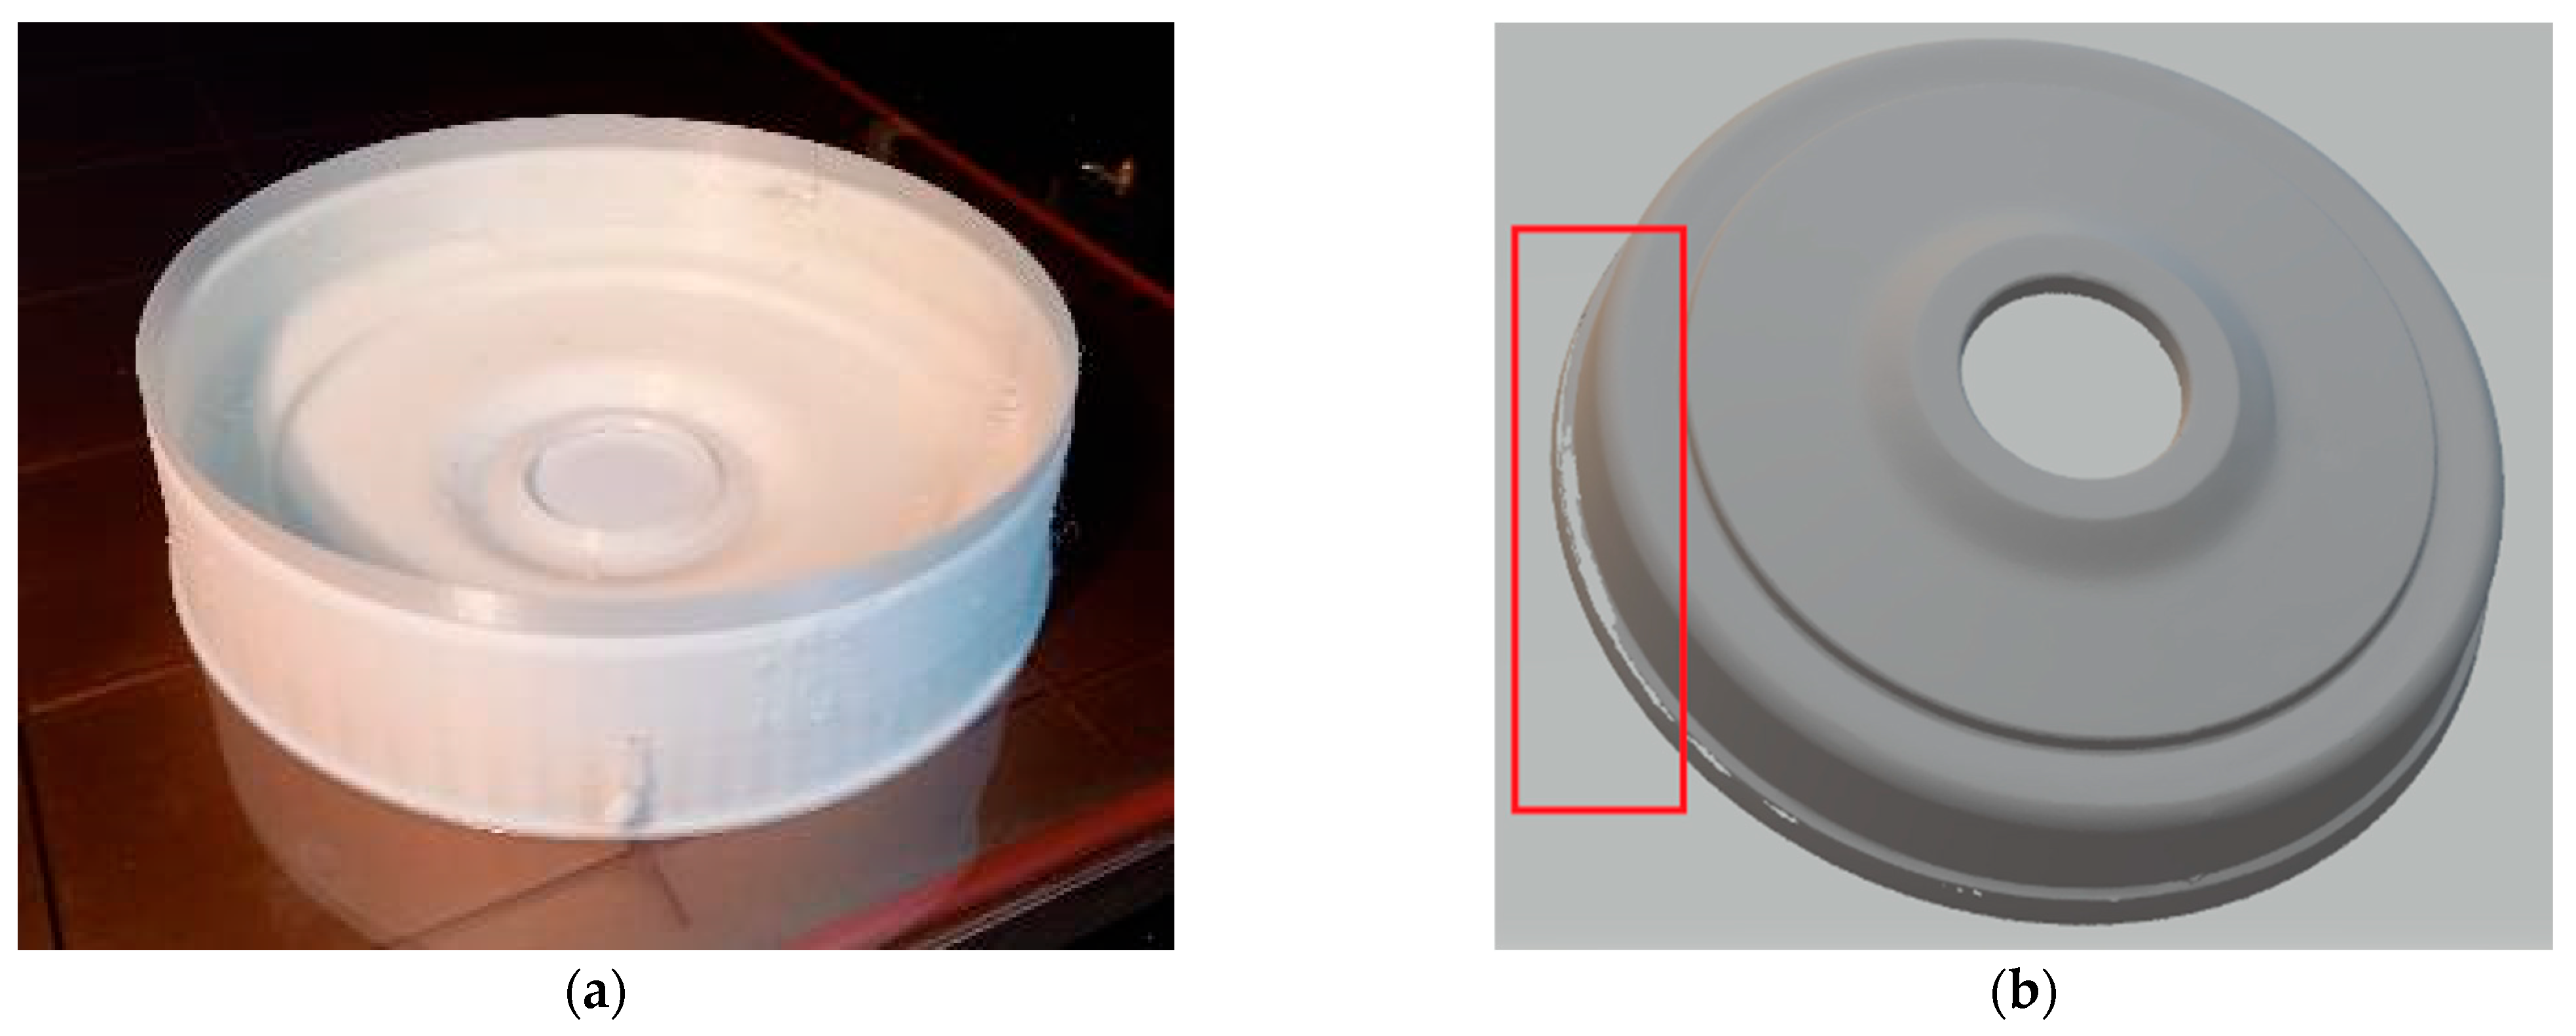
During the geometry reconstruction stage, it is essential to prepare the object for scanning effectively. The quality of the reconstruction heavily depends on the type of geometry being scanned [48]. A crucial aspect of preparing the scanning model involves applying markers to its surface, which helps streamline the measurement process by optimizing the assembly of point clouds obtained from various angular positions of the measurement table. In this research, markers were applied to each selected model. Additionally, special attention was given to the reflectivity of the models’ surfaces. Test measurements were conducted to evaluate this aspect. It was determined that only the vacuum cover required a matte layer, which should not exceed 0.015 mm. The measurement process utilized the smallest measurement area available with the GOM Scan 1 system, which is 100 mm × 65 mm × 400 mm. This set up allowed for a maximum point cloud resolution of 0.037 mm, enabling a highly detailed geometry scan in the form of a three-dimensional point cloud. To determine the optimal number of rotations for the measuring table, an empirical approach was used, testing various measurement configurations. It was observed that fewer revolutions of the measuring table made it more challenging to fully digitize the geometry, particularly for the models of the electrical box (Figure 16a) and battery cover. Conversely, with a higher number of scans, an increase in errors was noted during the scan merging and CAD modeling stages [49]. When combining scans to create the final 3D STL model, we observed that the type of geometry influenced the choice of scan combination method. For the electrical box and battery cover models, we used the best-fit method, achieving an accuracy of matching the scans to each other within 0.02 mm. However, due to the axisymmetric nature of the geometries, we encountered issues with the best-fit method, leading us to opt for the feature point-based fitting method instead. The fitting accuracy for the lampshade model reached 0.01 mm, while it was 0.05 mm for the vacuum cover. The higher value for the vacuum cover model may have been affected by the matting layer and wear, corrosion sustained during the operational process [50,51] (Figure 16b).
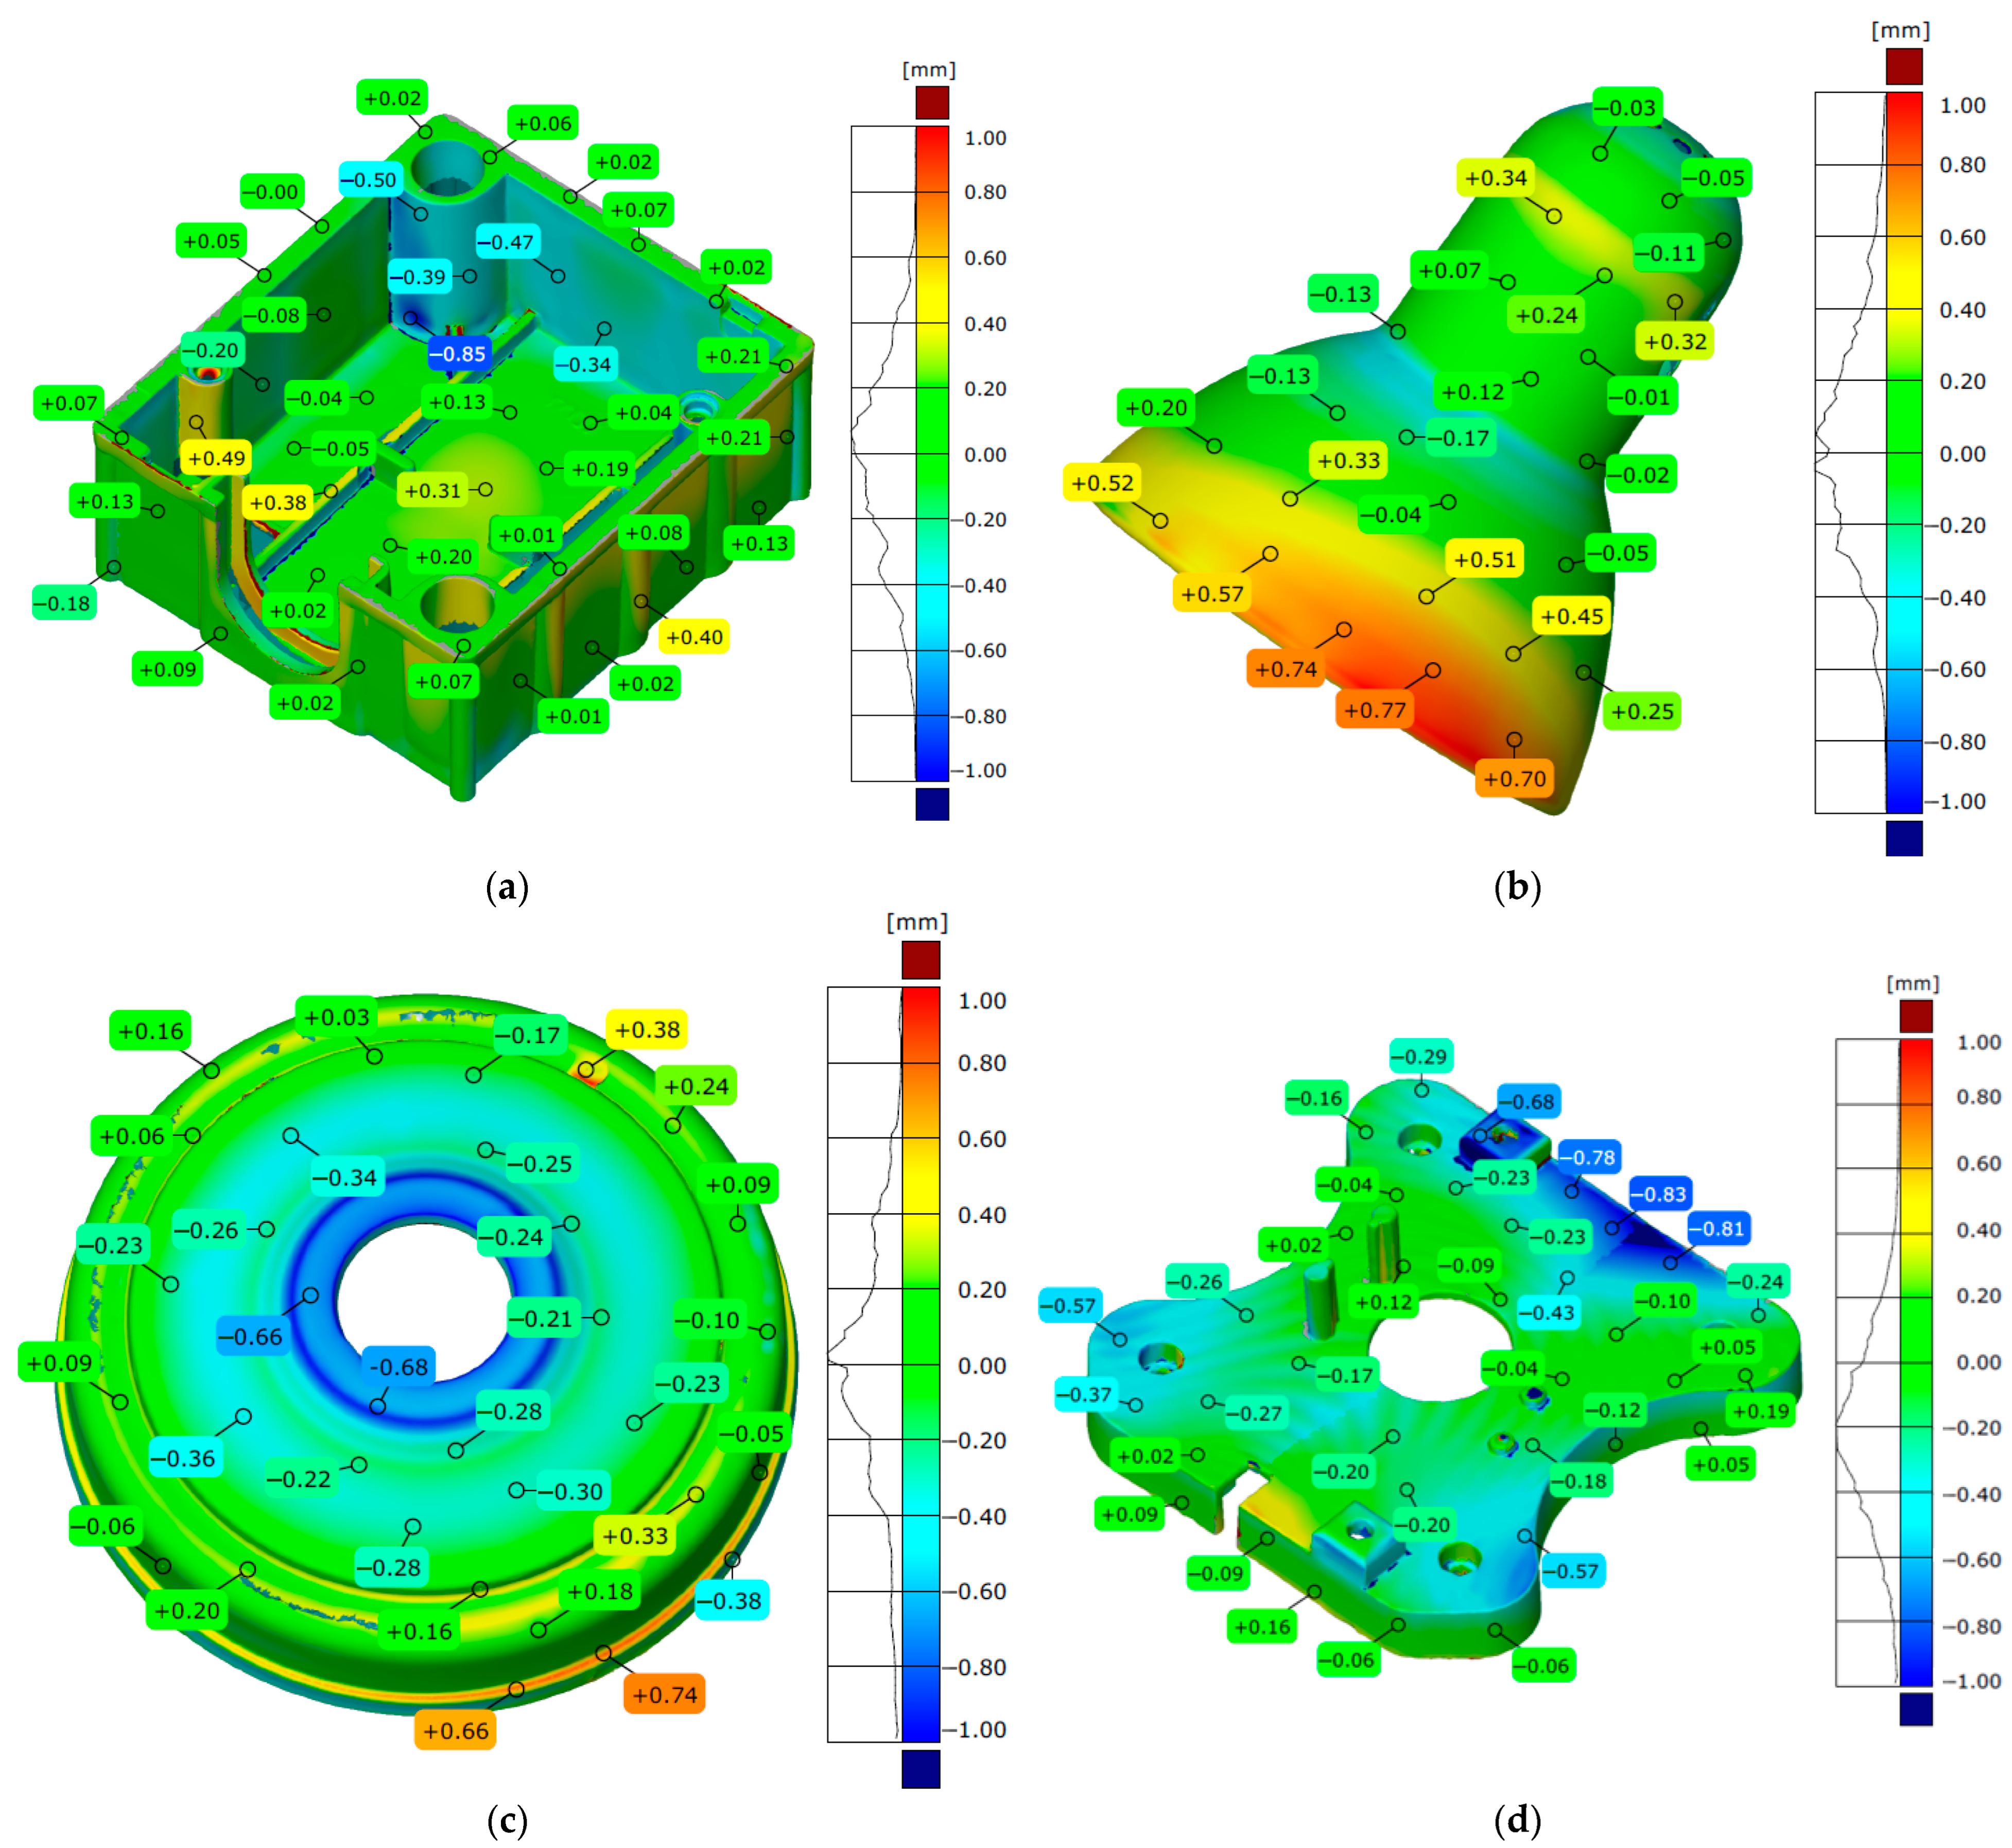
Figure 11 and Table 3 present the geometric deviations resulting from the reconstruction process. The results indicated that overall, considering the confidence level of 0.95, the deviation values were typically within the range of ±0.6 mm to ±1 mm. Several factors influence the obtained values:
  • The manufacturing process of the models is subject to specific tolerances, which the manufacturer states should remain within ±0.8 mm. This indicates that any discrepancies in the physical dimensions of the models due to production imperfections should not exceed this threshold.
  • The measurement system used has its limitations concerning accuracy. For calibration measurements taken on flat surfaces, the maximum allowable error is ±0.02 mm.
  • The scanning parameters used during data collection can lead to specific errors. In this case, data is collected at a point cloud resolution of 0.037 mm. This resolution affects the quality and fidelity of the scanned data, which can ultimately influence the overall accuracy of the measurements obtained.
  • Scanning reflective surfaces, a matte layer is often applied to mitigate issues caused by glare and reflections. However, the application of this matte finish is not without its limitations; the errors introduced by this process should not exceed 0.015 mm. Proper application is essential to ensure that the scanned data remains as accurate as possible.
  • Fitting scans—the process of aligning and merging multiple scan datasets—introduces its own set of potential inaccuracies. The errors associated with this fitting process can vary widely, typically falling within a range of 0.01 mm to 0.05 mm per individual scan. This variance emphasizes the importance of careful alignment and processing to minimize cumulative error in the final output.
It is essential to recognize that the wear and tear on the surface of the scanned model influences the quality of the reconstruction process [52]. The maximum positive and negative deviations, as illustrated in Figure 11, highlight the areas where the most significant surface deformations have occurred. These deviations have an absolute value of nearly 1 mm.

4.2. Evaluation of CAD Modeling Errors

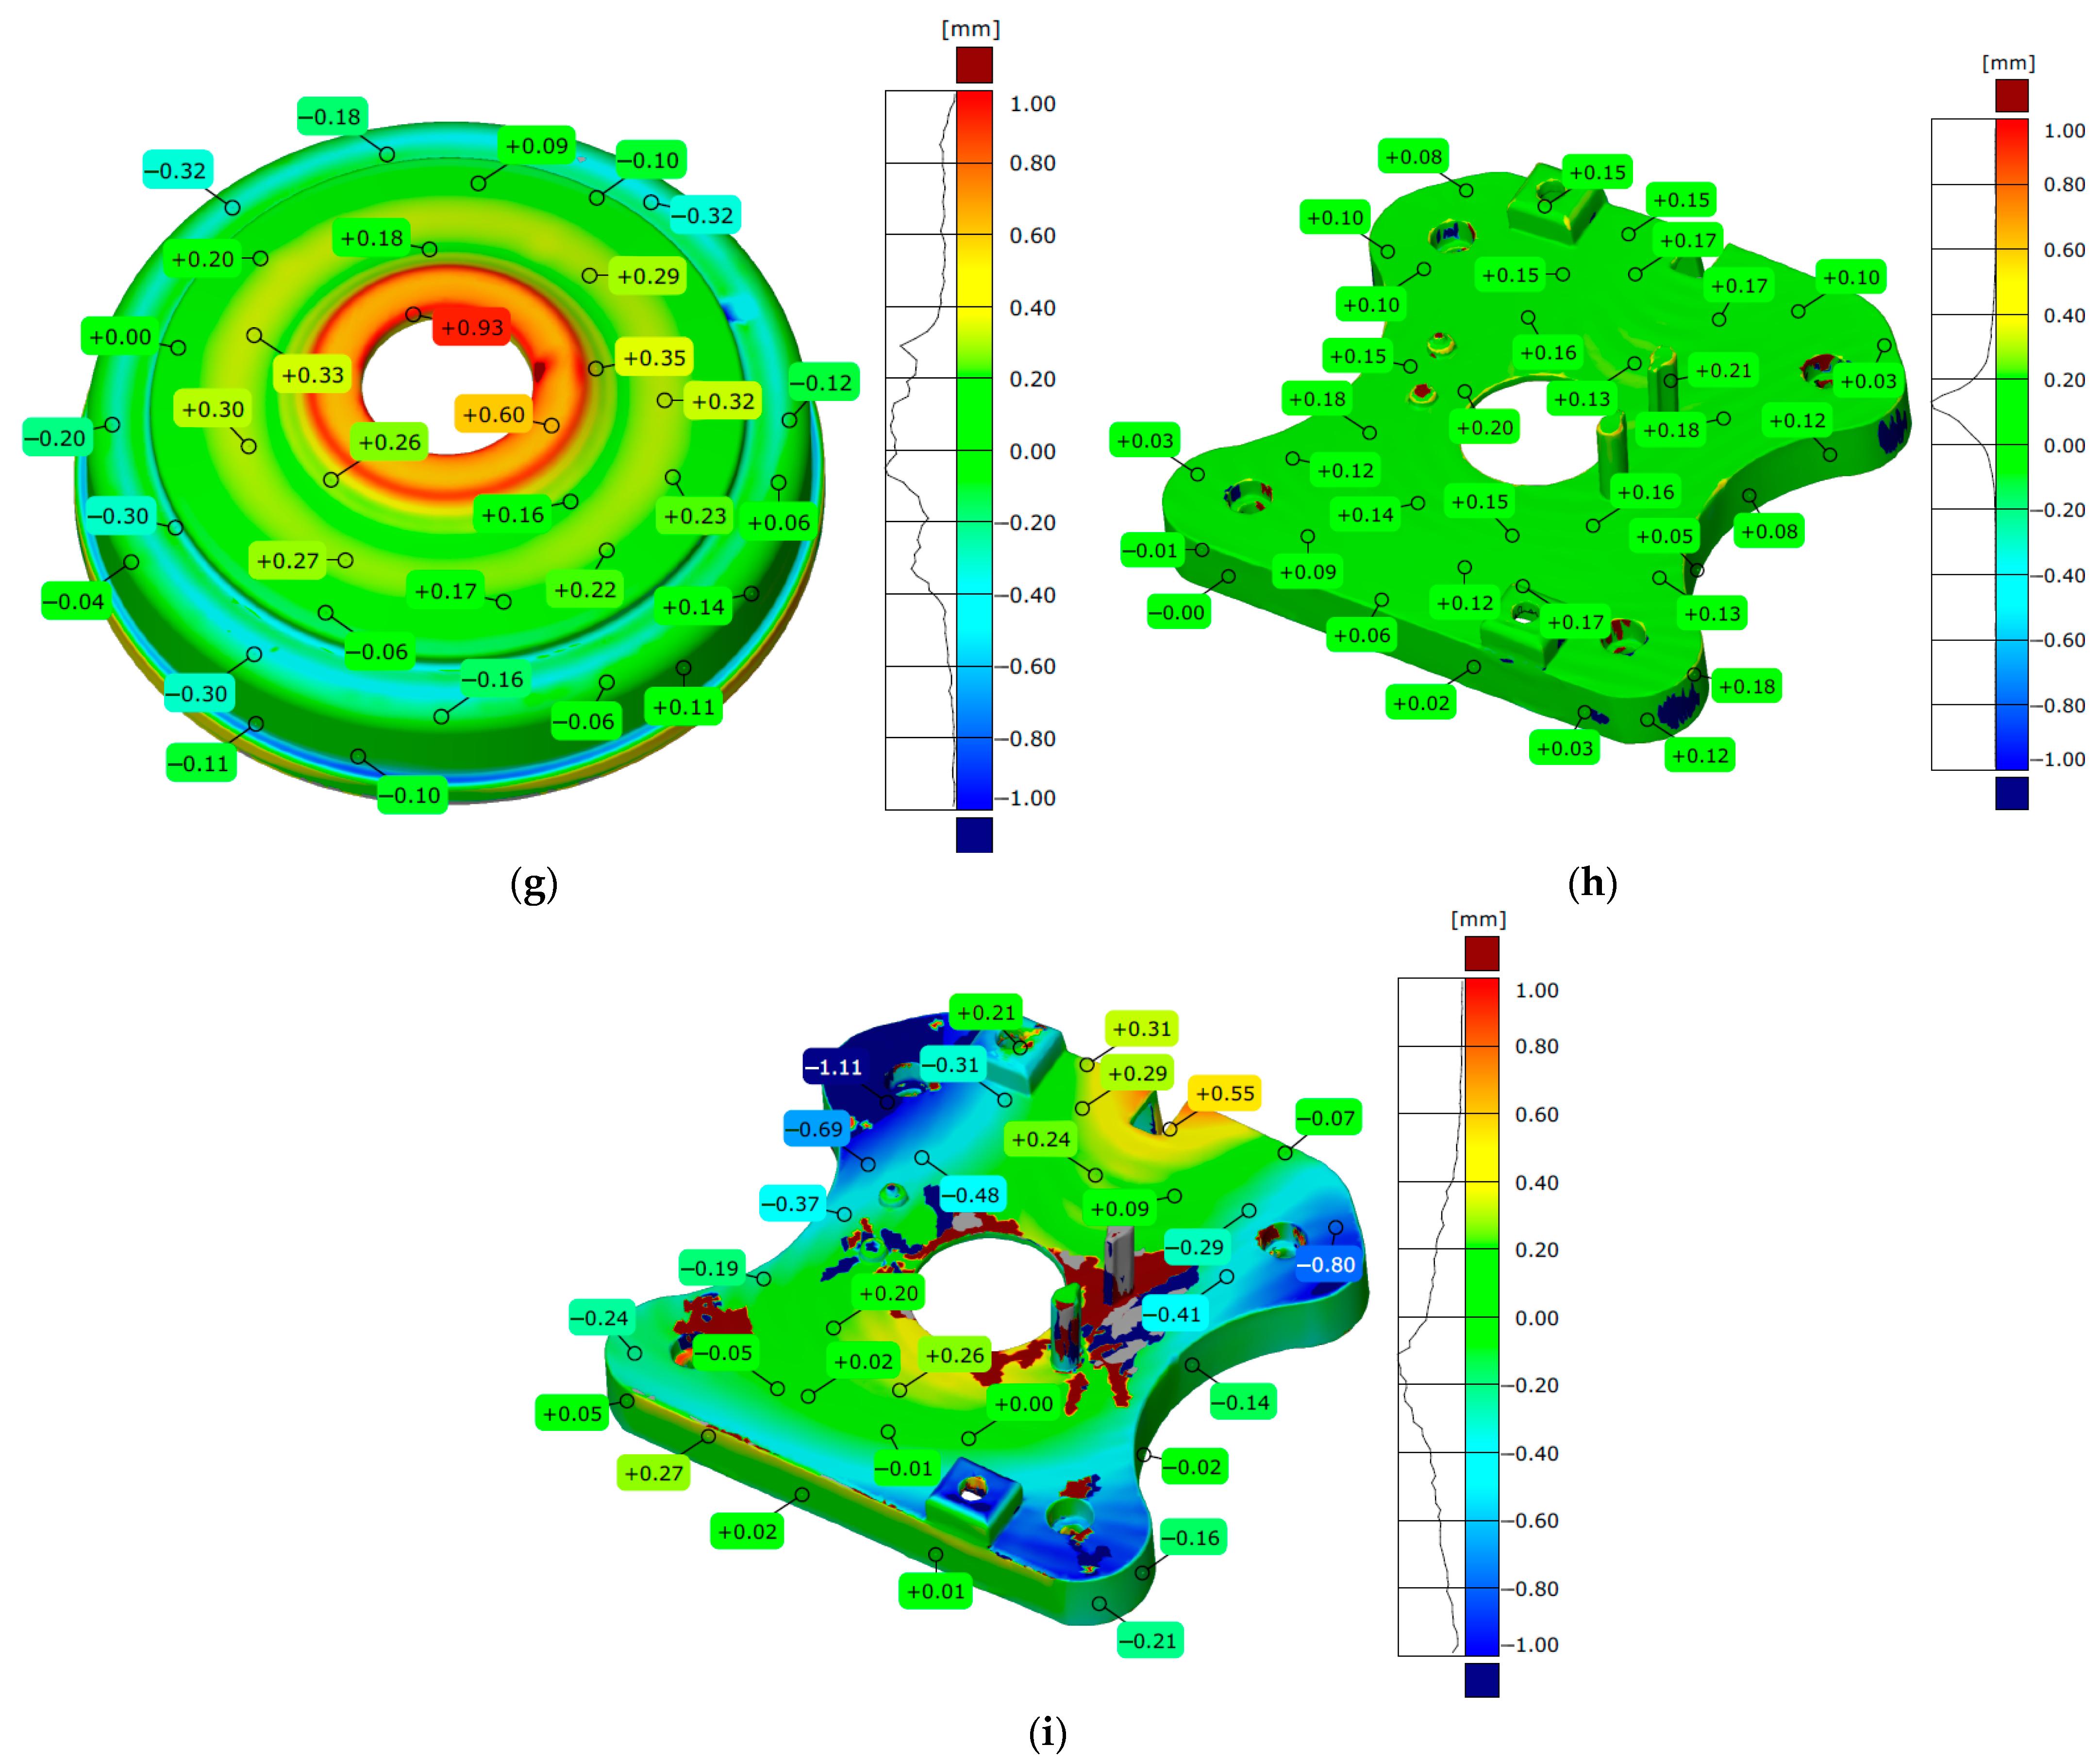
A minimal number of programming errors were encountered during the analysis of the triangle mesh for the scanned models in NX Siemens. These errors primarily involved branching edges and vertices. They were resolved promptly, allowing the parametric modeling process to begin. Various parametric modeling methods were used in the CAD modeling process, with their application depending on the type of geometry involved. For the electrical box model and the battery cover, two CAD modeling techniques were used: one based on the detection of characteristic geometries [18] and the other using the auto-surfacing method [53]. The average fit values for plane or cylindrical surfaces ranged from 0.01 mm to 0.02 mm for both models. However, when attempting global fitting of a parameterized surface to a triangular mesh using the auto-surfacing generation method, it was not possible to achieve such high accuracy. For the electrical box model, the average surface deviations ranged from 0.1 mm to 0.9 mm, while for the battery cover, deviations reached up to 1 mm. Additionally, an increase in the number of surface patches significantly extended the development time of the parametric model. Therefore, it was concluded that this method is not suitable for models with basic geometry types. For the models characterized by axisymmetric, the profile extraction method was utilized during the CAD modeling process. In the cases of the vacuum cover and lamp models, a spline curve was used for curve fitting to define the profile based on a set of points [54]. The average fitting deviations for both models ranged from 0.008 mm to 0.016 mm. However, since the entire geometry of the models was created based on a single profile, the overall deviation values increased significantly. For the lampshade and vacuum cover models, considering the confidence level of 0.95, the deviation values were typically within the range of ±0.4 mm. When the auto-surfacing method was applied to both models, smaller global deviation values were observed compared to the electrical box and battery cover models. For these models, considering the confidence level of 0.95, the deviation values were typically within the range of ±0.9 mm. For the vacuum cover model, we additionally used a CAD modeling method that involved fitting primitive geometries. This approach helped minimize errors in the developed CAD model. As a result, considering the confidence level of 0.95, the deviation values were typically within the range of ±0.2 mm, demonstrating the effectiveness of this method for CAD modeling. However, this method was not applicable for the lampshade model, as part of its surface featured a free surface rather than a basic surface. Consequently, it was not possible to create the complete CAD geometry using only the primitive surfaces. Considering this, the chosen method for parameterizing and fitting to the acquired measurement data significantly influenced the accuracy of the CAD modeling process. To achieve this, the following errors were identified:
  • According to the research findings, using the primitive detection technique allows for the creation of CAD models with an average accuracy tolerance of ±0.2 mm. The error values result from the incorrect matching of the parameterized surface to the obtained point cloud and from connections at the edges and between surfaces.
  • According to the research findings, using the profile extraction technique allows for the creation of CAD models with an average accuracy tolerance of ±0.4 mm. The error values obtained result from the incorrect selection of the cross-section against which the profile is extracted, as well as errors in interpolation, curve fitting, and connecting them.
  • According to the research findings, using the auto-surfacing technique allows for the creation of CAD models with an average accuracy tolerance of ±0.9 mm. The error values obtained stem from the automatic generation of NURBS surfaces over the entire triangular surface. As a result, to satisfy the fitting conditions, the parameterized surface is often smoothed. This smoothing can complicate the accurate mapping of object edges and the transitions between connected surfaces.

4.3. Evaluation of MEX Additive Manufacturing Errors

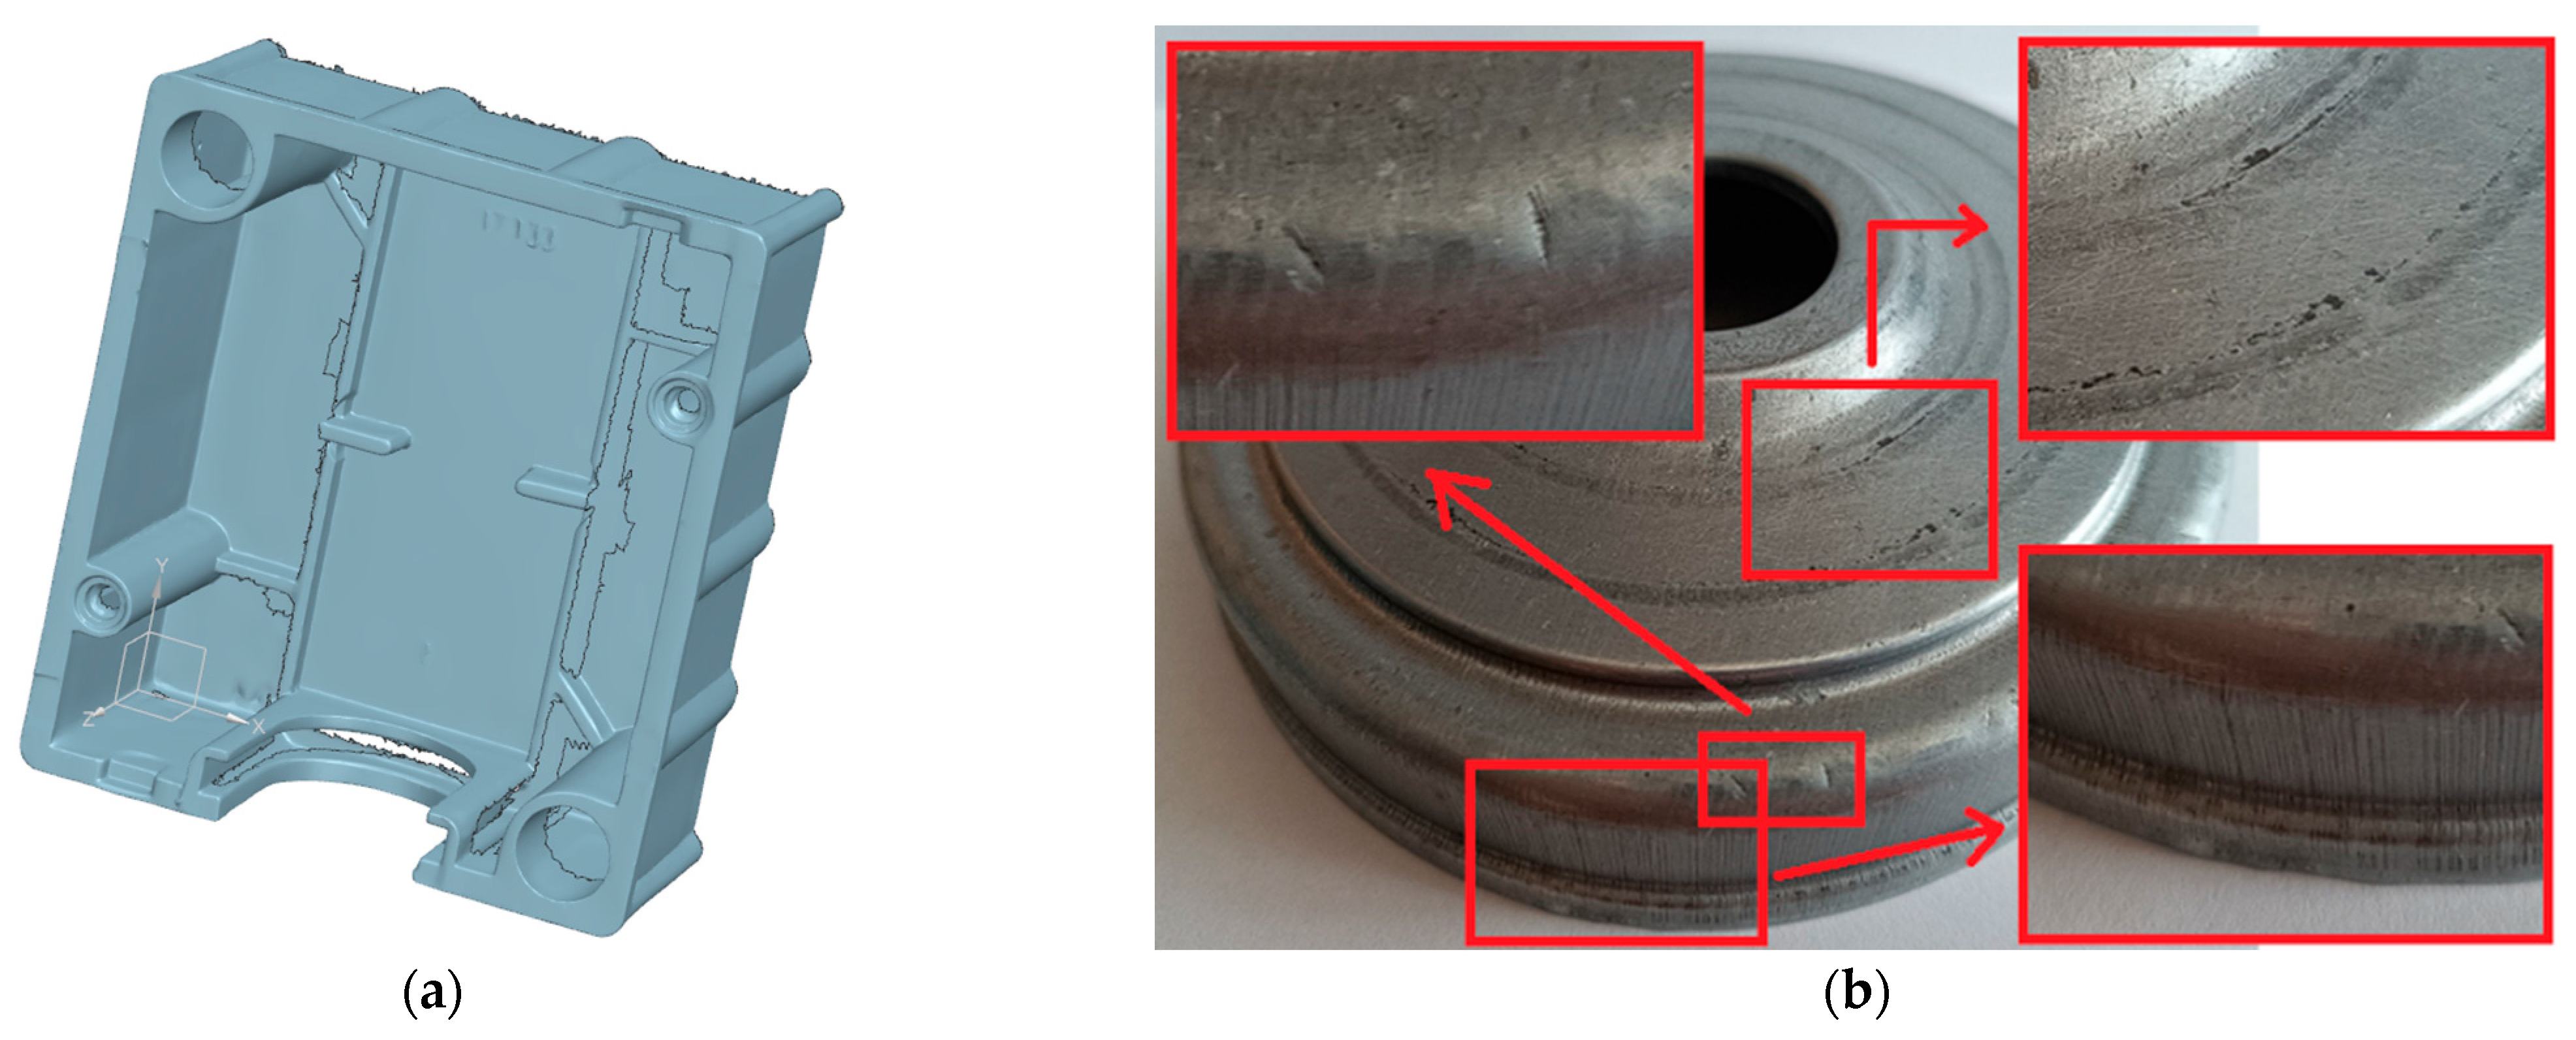
The impact of 3D printing parameters on the quality and accuracy of manufactured objects is a critical issue in AM technologies. When creating models using the MEX process, it is essential to consider the appropriate 3D print resolution and the orientation of the model within the 3D printer. Previous research indicates [54,55] that using the highest 3D printing resolution, along with an orientation that maximizes the use of the model’s surface along the Z-axis, results in minimized additive manufacturing errors. In examining the manufacturing process of the models created using the MEX additive method, it was observed that the maximum deviation values for most of the models analyzed fall within the range of ±0.2 mm at a confidence level of 0.95. The presented histograms of deviation distribution also confirm this. Only in the case of the vacuum cover model was an increase in deviation values observed, which meant that for a confidence level of 0.95, the maximum deviations were within the range of approximately. ±0.3 mm. This increase may be attributed to the influence of the support material (Figure 17a) and potential errors that occurred during the geometry measurement stage with the GOM Scan 1 scanner (Figure 17b). In addition, the thin-walled construction of the cover may also have contributed to the errors, which could have caused local deformations of the model during the chemical removal of the support material [56].
Despite the geometry errors that occurred, significant efforts were made to achieve the best possible reproduction of the model geometry. To accomplish this, the highest available 3D printing resolution was utilized on the Fortus 360 mc 3D printer. Furthermore, the model was strategically oriented within the 3D printer space to ensure that most surfaces were aligned along the Z-axis. The resulting deviation values are comparable to those reported by the 3D printer manufacturer [57] as well as findings from other scientific publications [58].

4.4. Evaluation of RE + CAD + AM—Total Errors

The article presents a significant conclusion regarding the discrepancies between the simple summation of deviations and the actual final error. As shown in Table 7 and Table 8, relying solely on the summation of tolerances can be overly simplistic and often misleading for quality assessment. The primary reason for this discrepancy lies in error compensation and the statistical nature of how errors accumulate. Notably, an increase in deviations occurs during the geometry reconstruction stage, mainly due to the duplication of model manufacturing errors and measurement inaccuracies. However, this is partially corrected during the CAD modeling and additive manufacturing stages when using MEX technology. A clear example of error compensation can be observed in the lampshade model. During the geometry reconstruction process, the three-dimensional map of deviations predominantly exhibits positive deviations. In contrast, the CAD modeling process reveals an opposite trend. Thus, the errors at these two stages canceled each other out. Ultimately, the deviations observed during the additive manufacturing process do not significantly alter the overall error distribution. A similar situation is observed in Table 8, where critical areas of the model were analyzed based on the deviation values obtained. It is important to note that these deviation values are significantly smaller than their global counterparts. This discrepancy may be attributed to the fact that assessing deviations in a localized area helps minimize various errors, particularly those related to the alignment of the surfaces.

5. Conclusions

This paper presents comprehensive research findings that outline several targeted strategies aimed at significantly reducing measurement errors in various stages of the design and manufacturing process.
  • First, it highlights the utilization of an advanced optical scanner, which employs structured light to illuminate the object being measured. This technique not only enhances the clarity of the captured data but also allows for the fine-tuning of scanner settings to improve measurement resolution. Additionally, the research emphasizes the importance of optimizing the number of rotations of the measurement table during the scanning process, as this can lead to more accurate and reliable data capture.
  • Furthermore, the paper discusses the selection of an efficient CAD modeling approach. By adopting methods that streamline the modeling process, designers can mitigate the complexities often associated with parametric modeling. This, in turn, reduces potential sources of error that can arise during the conversion from a concept to a digital model.
  • The investigation also addresses the challenge of AM errors. It underscores the necessity of carefully selecting the 3D printing layer thickness and determining the optimal model orientation within the 3D printer. These choices play a crucial role in the final output’s dimensional accuracy and surface quality, ultimately influencing the integrity of the manufactured part.
It is important to highlight that the research findings in this article demonstrate that evaluating the finished product through direct geometric assessment with three-dimensional deviation maps is a more reliable and realistic measure of quality. This method considers the actual cumulative effects of all errors, including those that are hard to predict, rather than relying solely on theoretical tolerance summation. By implementing these findings, designers can conduct a thorough assessment of accuracy at each stage of the reconstruction process, including scanning, CAD modeling, and additive manufacturing. This comprehensive evaluation allows for a better understanding of the capabilities and limitations of current reverse engineering (RE) methods when preparing model replicas. Such insights are vital for improving the overall quality and precision in manufacturing practices.

Author Contributions

Conceptualization, P.T.; methodology, P.T.; software, P.B., A.C., H.F., T.H. and J.M.; validation, P.T. and J.M.; formal analysis, P.T.; investigation, P.T., P.B., A.C., H.F. and T.H.; writing—original draft preparation, P.B., A.C., H.F. and T.H.; writing—review and editing, P.T.; visualization, P.T. All authors have read and agreed to the published version of the manuscript.

Funding

This research received no external funding.

Data Availability Statement

The raw data supporting the conclusions of this article will be made available by the authors on request.

Conflicts of Interest

The authors declare no conflicts of interest.

References

  1. Raja, V. Introduction to reverse engineering. In Reverse Engineering: An Industrial Perspective; Springer: London, UK, 2008; pp. 1–9. [Google Scholar] [CrossRef]
  2. She, S.; Lotufo, R.; Berger, T.; Wąsowski, A.; Czarnecki, K. Reverse engineering feature models. In Proceedings of the 33rd International Conference on Software Engineering, Honolulu, HI, USA, 21–28 May 2011; pp. 461–470. [Google Scholar] [CrossRef]
  3. Roithmeier, R. Measuring Strategies in Tactile Coordinate Metrology; Carl Zeiss AG: Oberkochen, Germany, 2014. [Google Scholar]
  4. Li, F.; Hiley, J.; Syed, T.M.; Hitchens, C.; Garcia Lopez-Astilleros, M. A region segmentation method to measure multiple features using a tactile scanning probe. Int. J. Comput. Integr. Manuf. 2019, 32, 569–579. [Google Scholar] [CrossRef]
  5. Wang, X.; Xian, J.; Yang, Y.; Zhang, Y.; Fu, X.; Kang, M. Use of coordinate measuring machine to measure circular aperture complex optical surface. Measurement 2017, 100, 1–6. [Google Scholar] [CrossRef]
  6. Gapinski, B.; Wieczorowski, M.; Marciniak-Podsadna, L.; Dybala, B.; Ziolkowski, G. Comparison of different method of measurement geometry using CMM, optical scanner and computed tomography 3D. Procedia Eng. 2014, 69, 255–262. [Google Scholar] [CrossRef]
  7. Li, F.; Longstaff, A.P.; Fletcher, S.; Myers, A. Integrated tactile and optical measuring systems in three dimensional metrology. In Proceedings of the Queen’s Diamond Jubilee Computing and Engineering Annual Researchers’ Conference 2012: CEARC’12, Huddersfield, UK, 29 February 2012; University of Huddersfield: Huddersfield, UK, 2012. [Google Scholar]
  8. Chen, S.; Chen, H. Research on Triangulation Method of Object Surface with Holes in Reverse Engineering. In Proceedings of the 2009 International Conference on Computational Intelligence and Software Engineering, Wuhan, China, 11–13 December 2009; IEEE: New York, NY, USA, 2012; pp. 1–4. [Google Scholar] [CrossRef]
  9. Liu, J. An adaptive process of reverse engineering from point clouds to CAD models. Int. J. Comput. Integr. Manuf. 2020, 33, 840–858. [Google Scholar] [CrossRef]
  10. Ali, S.; Durupt, A.; Adragna, P.A.; Bosch-Mauchand, M. A reverse engineering for manufacturing approach. Comput.-Aided Des. Appl. 2014, 11, 694–703. [Google Scholar] [CrossRef]
  11. Wojnarowska, W.; Kwolek, M.; Miechowicz, S. Selection of a workpiece clamping system for computer-aided subtractive manufacturing of geometrically complex medical models. Open Eng. 2021, 11, 239–248. [Google Scholar] [CrossRef]
  12. Kumar, A.; Kumar, P.; Singh, H.; Haleem, A.; Mittal, R.K. Integration of reverse engineering with additive manufacturing. In Advances in Additive Manufacturing; Elsevier: Amsterdam, The Netherlands, 2023; pp. 43–65. [Google Scholar] [CrossRef]
  13. Vukašinović, N.; Duhovnik, J. Introduction to reverse engineering. In Advanced CAD Modeling: Explicit, Parametric, Free-Form CAD and Re-Engineering; Springer International Publishing: Cham, Switzerland, 2018; pp. 165–177. [Google Scholar] [CrossRef]
  14. Mahmood, D.M.; Mahmood, A.Z. Improving Reverse Engineering Processes by using Articulated Arm Coordinate Measuring Machine. Al-Khwarizmi Eng. J. 2020, 16, 42–54. [Google Scholar] [CrossRef]
  15. Turek, P.; Bezłada, W.; Cierpisz, K.; Dubiel, K.; Frydrych, A.; Misiura, J. Analysis of the accuracy of CAD modeling in engineering and medical industries based on measurement data using reverse engineering methods. Designs 2024, 8, 50. [Google Scholar] [CrossRef]
  16. Jang, A.; Jeong, S.; Park, M.J.; Ju, Y.K. Structural evaluation by reverse engineering with 3D laser scanner. ce/papers 2023, 6, 308–314. [Google Scholar] [CrossRef]
  17. Vazzana, A.; Higgins, O.A.; Oxilia, G.; Lugli, F.; Silvestrini, S.; Nava, A.; Benazzi, S. High-accuracy methodology for the integrative restoration of archaeological teeth by using reverse engineering techniques and rapid prototyping. J. Archaeol. Sci. Rep. 2022, 44, 103511. [Google Scholar] [CrossRef]
  18. Saiga, K.; Ullah, A.S.; Kubo, A. A sustainable reverse engineering process. Procedia CIRP 2021, 98, 517–522. [Google Scholar] [CrossRef]
  19. Gerbino, S.; Martorelli, M. Reverse Engineering. In Springer Handbook of Additive Manufacturing; Springer: Cham, Switzerland, 2023; pp. 253–268. [Google Scholar] [CrossRef]
  20. ISO/ASTM 52910:2018; Additive Manufacturing—Design—Requirements, Guidelines and Recommendations. ISO: Geneva, Switzerland, 2018.
  21. ISO/ASTM 52902:2023; Additive Manufacturing—Test Artefacts—Geometric Capability Assessment of Additive Manufacturing Systems. ISO: Geneva, Switzerland, 2023.
  22. ISO/ASTM 52915:2020; Specification for Additive Manufacturing File Format (AMF) Version 1.2. ISO: Geneva, Switzerland, 2020.
  23. ISO/ASTM 52950:2021; Additive Manufacturing—General Principles—Overview of Data Processing. ISO: Geneva, Switzerland, 2021.
  24. Zhang, Z.; Zhao, M.; Shen, Z.; Wang, Y.; Jia, X.; Yan, D.M. Interactive reverse engineering of CAD models. Comput. Aided Geom. Des. 2024, 111, 102339. [Google Scholar] [CrossRef]
  25. Varitis, E. A Reverse Engineering method for 3d parametric modeling of geometries based on processing of laser scanning data and a sweep technique. IOP Conf. Ser. Mater. Sci. Eng. 2016, 161, 012047. [Google Scholar] [CrossRef]
  26. Turek, P. Evaluation of the auto surfacing methods to create a surface body of the mandible model. Rep. Mech. Eng. 2022, 3, 46–54. [Google Scholar] [CrossRef]
  27. Kreuz, S.; Zubiri, B.A.; Englisch, S.; Buwen, M.; Kang, S.G.; Ramachandramoorthy, R.; Rolfes, J. Improving reconstructions in nanotomography for homogeneous materials via mathematical optimization. Nanoscale Adv. 2024, 6, 3934–3947. [Google Scholar] [CrossRef]
  28. Ding, Z.; Lu, Y.; Shao, S.; Qin, Y.; Lu, M.; Song, Z.; Sun, D. Research on 3D Reconstruction Methods for Incomplete Building Point Clouds Using Deep Learning and Geometric Primitives. Remote Sens. 2025, 17, 399. [Google Scholar] [CrossRef]
  29. Liu, Y.; Obukhov, A.; Wegner, J.D.; Schindler, K. Point2cad: Reverse engineering cad models from 3d point clouds. In Proceedings of the IEEE/CVF Conference on Computer Vision and Pattern Recognition, Seattle, WA, USA, 16–22 June 2024; pp. 3763–3772. [Google Scholar] [CrossRef]
  30. Thengane, V.; Zhu, X.; Bouzerdoum, S.; Phung, S.L.; Li, Y. Foundational Models for 3D Point Clouds: A Survey and Outlook. arXiv 2025, arXiv:2501.18594. [Google Scholar]
  31. Gibson, I.; Rosen, D.; Stucker, B. Additive Manufacturing Technologies; Springer: Cham, Switzerland, 2021. [Google Scholar]
  32. Budzik, G.; Dziubek, T.; Kawalec, A.; Turek, P.; Bazan, A.; Dębski, M.; Kuric, I. Geometrical Accuracy of Threaded Elements Manufacture by 3D Printing Process. Adv. Sci. Technol. Res. J. 2023, 17, 35–45. [Google Scholar] [CrossRef] [PubMed]
  33. Turek, P.; Filip, D.; Przeszłowski, Ł.; Łazorko, A.; Budzik, G.; Snela, S.; Paszkiewicz, A. Manufacturing polymer model of anatomical structures with increased accuracy using cax and am systems for planning orthopedic procedures. Polymers 2022, 14, 2236. [Google Scholar] [CrossRef]
  34. García Plaza, E.; López, P.J.N.; Torija, M.Á.C.; Muñoz, J.M.C. Analysis of PLA geometric properties processed by FFF additive manufacturing: Effects of process parameters and plate-extruder precision motion. Polymers 2019, 11, 1581. [Google Scholar] [CrossRef] [PubMed]
  35. Pelzer, L.; Hopmann, C. Additive manufacturing of non-planar layers with variable layer height. Addit. Manuf. 2021, 37, 101697. [Google Scholar] [CrossRef]
  36. Shen, H.; Guo, S.; Fu, J.; Lin, Z. Building orientation determination based on multi-objective optimization for additive manufacturing. 3D Print. Addit. Manuf. 2020, 7, 186–197. [Google Scholar] [CrossRef]
  37. Matos, M.A.; Rocha, A.M.A.; Pereira, A.I. Improving additive manufacturing performance by build orientation optimization. Int. J. Adv. Manuf. Technol. 2020, 107, 1993–2005. [Google Scholar] [CrossRef]
  38. Allaire, G.; Bogosel, B. Optimizing supports for additive manufacturing. Struct. Multidiscip. Optim. 2018, 58, 2493–2515. [Google Scholar] [CrossRef]
  39. Alzyod, H.; Ficzere, P.; Borbas, L. Cost-efficient additive manufacturing: Unraveling the economic dynamics of material Extrusion (MEX) technology. Int. Rev. 2024, 3–4, 185. [Google Scholar] [CrossRef]
  40. Asami, K.; Kuehne, M.; Röver, T.; Emmelmann, C. Application of Machine Learning in Predicting Quality Parameters in Metal Material Extrusion (MEX/M). Metals 2025, 15, 505. [Google Scholar] [CrossRef]
  41. ISO 8015:2011; Geometrical Product Specifications (GPS)—Fundamentals—Concepts, Principles and Rules. ISO: Geneva, Switzerland, 2011.
  42. ISO 1101:2017; Geometrical Product Specifications (GPS)—Geometrical Tolerancing—Tolerances of Form, Orientation, Location and Run-Out. ISO: Geneva, Switzerland, 2017.
  43. ISO 286-2:2010; Geometrical Product Specifications (GPS)—ISO Code System for Tolerances on Linear Sizes—Part 2: Tables of Standard Tolerance Classes and Limit Deviations for Holes and Shafts. ISO: Geneva, Switzerland, 2010.
  44. ISO 22081:2021; Geometrical Product Specifications (GPS)—Geometrical Tolerancing—General Geometrical Specifications and General Size Specifications. ISO: Geneva, Switzerland, 2021.
  45. ASME Y14.5; Dimensioning and Tolerancing. ASME: New York, NY, USA, 2018.
  46. VDI/VDE 2634; Blatt 3 Optical 3D-Measuring Systems—Multiple View Systems Based on Area Scanning. VDI/VDE: Berlin, Germany, 2008.
  47. PN-EN IEC 60670; Boxes and Enclosures for Accessories for Household and Similar Fixed Electrical Installations. IEC: Geneva, Switzerland, 2021.
  48. Buonamici, F.; Carfagni, M.; Furferi, R.; Governi, L.; Lapini, A.; Volpe, Y. Reverse engineering of mechanical parts: A template-based approach. J. Comput. Des. Eng. 2018, 5, 145–159. [Google Scholar] [CrossRef]
  49. Armstrong, D. Automating Scan-Based Inspection for Repeatable Process Control. Quality 2022, 61, 17. [Google Scholar]
  50. Milde, J.; Dubnicka, M.; Buransky, I. Impact of powder coating types on dimensional accuracy in optical 3d scanning process. MM Sci. J. 2023, 6800–6806. [Google Scholar] [CrossRef]
  51. Guo, H.; Wang, Y.; Wang, M.; Yang, H.; Gu, B.; Xu, G.; Gao, X. Microstructure, wear, and corrosion resistance of HVOF WC24-Cr3C257-NiCr19 coating. Tribol. Int. 2025, 211, 110806. [Google Scholar] [CrossRef]
  52. Bagci, E. Reverse engineering applications for recovery of broken or worn parts and re-manufacturing: Three case studies. Adv. Eng. Softw. 2009, 40, 407–418. [Google Scholar] [CrossRef]
  53. Chang, K.H. A review on shape engineering and design parameterization in reverse engineering. In Reverse Engineering: Recent Advances and Applications; BoD–Books on Demand: Norderstedt, Germany, 2012; pp. 161–186. [Google Scholar] [CrossRef]
  54. Turek, P. The Influence of the Layer Thickness Change on the Accuracy of the Zygomatic Bone Geometry Manufactured Using the FDM Technology. Eng. Proc. 2022, 24, 26. [Google Scholar] [CrossRef]
  55. Turek, P.; Bazan, A.; Bulicz, M. Effect of 3D Printing Orientation on the Accuracy and Surface Roughness of Polycarbonate Samples. Machines 2024, 13, 9. [Google Scholar] [CrossRef]
  56. Pellizzon, N.; Šeta, B.; Kruse, C.S.; Salajeghe, R.; Spangenberg, J. Investigating thermal strains and chemical shrinkage in tomographic volumetric additive manufacturing. Addit. Manuf. 2025, 105, 104781. [Google Scholar] [CrossRef]
  57. Bonnie, M. The Accuracy Myth. Don’t Make the Mistake of Confusing High Resolution with Accuracy. Available online: https://www.stratasys.com/contentassets/08614c7bcd824cfb99fe37f6af0e0189/wp_fdm_accuracymyth_a4_0116a_web.pdf?v=48fd13 (accessed on 1 August 2025).
  58. Turek, P.; Budzik, G. Estimating the Accuracy of Mandible Anatomical Models Manufactured Using Material Extrusion Methods. Polymers 2021, 13, 2271. [Google Scholar] [CrossRef]
Figure 1. The flowchart of the adopted research procedure.
Designs 09 00101 g001
Figure 2. Process of measuring electrical box: (a) measurement of internal part; (b) measurement of external part; (c) Model 3D-STL.
Designs 09 00101 g002
Figure 3. Process of measuring lampshade for standing lamp: (a) measurement of external part; (b) measurement of internal part; (c) Model 3D-STL.
Designs 09 00101 g003
Figure 4. The 3D-STL models obtained: (a) the cover for a vacuum unit; (b) the battery cover.
Designs 09 00101 g004
Figure 5. The process of parametric modeling of the electric box: (a) Model 3D-CAD (detect primitives); (b) Model 3D-CAD (auto-surfacing).
Designs 09 00101 g005
Figure 6. The process of parametric modeling of the lampshade for a standing lamp model: (a) Model 3D-CAD (profile extraction); (b) Model 3D-CAD (auto-surfacing).
Designs 09 00101 g006
Figure 7. The process of parametric modeling of the cover for a vacuum unit: (a) Model 3D-CAD (detect primitives); (b) Model 3D-CAD (profile extraction); (c) Model 3D-CAD (auto-surfacing).
Designs 09 00101 g007
Figure 8. The process of parametric modeling of the battery cover model: (a) Model 3D-CAD (detect primitives); (b) Model 3D-CAD (auto-surfacing).
Designs 09 00101 g008
Figure 9. Additive manufacturing models: (a) electrical box; (b) lampshade; (c) cover for a vacuum unit; (d) battery cover.
Designs 09 00101 g009
Figure 10. Measurement of electrical box model made using MEX additive manufacturing technique.
Designs 09 00101 g010
Figure 11. Three-dimensional deviation maps illustrating reconstruction errors for the model: (a) electrical box; (b) lampshade; (c) cover for a vacuum unit; (d) battery cover.
Designs 09 00101 g011
Figure 12. Three-dimensional deviation maps illustrating CAD modeling errors for model: (a) electrical box (detect primitives); (b) electrical box (auto-surfacing); (c) lampshade (profile extraction); (d) lampshade (auto-surfacing); (e) cover for vacuum unit (detect primitives); (f) cover for vacuum unit (profile extraction); (g) cover for vacuum unit (auto-surface); (h) battery cover (detect primitives); (i) battery cover (auto-surface).
Designs 09 00101 g012aDesigns 09 00101 g012b
Figure 13. Three-dimensional deviation maps illustrating additive manufacturing errors for the model: (a) electrical box; (b) lampshade; (c) cover for a vacuum unit; (d) battery cover.
Designs 09 00101 g013
Figure 14. Three-dimensional deviation maps created by directly comparing the nominal model with a scan of the 3D printed model, illustrating total errors for the model: (a) electrical box; (b) lampshade; (c) cover for a vacuum unit; (d) battery cover.
Designs 09 00101 g014
Figure 15. Diagram illustrating strategies for reducing errors in model preparation, geometry reconstruction, CAD modeling, and MEX additive manufacturing for axisymmetric models and regular shape models.
Designs 09 00101 g015
Figure 16. Errors in the reconstruction process due to: (a) Lack of digitalization of the full geometry; (b) Damage to the model surface during exploitation.
Designs 09 00101 g016
Figure 17. Errors in the MEX additive manufacturing process due to (a) occurrence during the manufacture of support material; (b) the digitalization of the geometry.
Designs 09 00101 g017
Table 1. The results of verification of optical systems using the standard procedure.
Acceptance Test Measured Value/Maximum Permission Error (2σ)
Probing error±0.003 mm/±0.006 mm
Sphere—spacing error±0.007 mm/±0.020 mm
Flatness measurement error±0.020 mm
Table 2. Established measurement parameters for the GOM Scan 1 [15].
ParametersValue
Pixel resolution cameras5,000,000
Measuring area100 mm × 65 mm × 400 mm
Min. point resolution0.037 mm
Number of points per scan5,000,000
Number of rotations of the measuring table15
Table 3. Statistical parameters representing reconstruction geometry errors.
ParametersElectrical BoxLampshadeCover for a Vacuum UnitBattery Cover
Maximum deviation [mm]1.4140.6182.2101.325
Minimum deviation [mm]−1.025−0.713−1.069−1.403
Range [mm]2.4401.3323.2792.728
Mean deviation [mm]−0.0200.1050.119−0.231
Standard deviation [mm]0.3640.4670.5590.387
Table 4. Statistical parameters representing CAD modeling errors.
ParametersElectrical BoxLampshadeCover for a Vacuum UnitBattery Cover
Detect
Primitive
Auto
Surfacing
Profile
Extraction
Auto
Surfacing
Detect
Primitive
Profile
Extraction
Auto
Surfacing
Detect
Primitive
Auto
Surfacing
Maximum deviation [mm]1.0741.3812.1762.1470.8740.7491.4591.6692.788
Minimum deviation [mm]−1.762−1.463−1.421−1.602−0.774−0.721−0.828−1.698−2.274
Range [mm]2.8353.8443.5973.7491.6491.4702.2873.3675.062
Mean deviation [mm]−0.108−0.122−0.056−0.1960.010−0.0120.1220.1940.306
Standard deviation [mm]0.2910.4270.2730.4280.1230.2500.4610.2590.512
Table 5. Statistical parameters representing additive manufacturing errors.
ParametersElectrical BoxLampshadeCover for a Vacuum UnitBattery Cover
Maximum deviation [mm]0.9290.8921.3730.653
Minimum deviation [mm]−0.385−0.422−0.431−0.848
Range [mm]1.3141.3141.8041.501
Mean deviation [mm]−0.050−0.087−0.026−0.137
Standard deviation [mm]0.0910.1020.1630.109
Table 6. Statistical parameters representing RE + CAD + AM—total errors.
ParametersElectrical BoxLampshadeCover for a Vacuum UnitBattery Cover
Maximum deviation [mm]0.8340.7151.2860.754
Minimum deviation [mm]−0.973−0.713−0.937−0.947
Range [mm]1.8061.4282.2231.701
Mean deviation [mm]−0.0570.1250.014−0.102
Standard deviation [mm]0.3820.4520.4100.409
Table 7. The average deviations obtained in the process of reconstruction, CAD modeling, and additive manufacturing using MEX technology for the analyzed models.
StageElectrical BoxLampshadeCover for a Vacuum UnitBattery Cover
Reconstruction processs *±0.6 mm±0.8 mm±1 mm±0.6 mm
CAD modeling±0.6 mm±0.6 mm±0.2 mm±0.4 mm
Additive manufacturing±0.2 mm±0.2 mm±0.2 mm±0.2 mm
RE + CAD + AM±0.5 mm±0.4 mm±0.6 mm±0.4 mm
* Reconstruction errors include measurement and model manufacturing errors.
Table 8. The average deviation values in critical areas of the analyzed models.
Type of the ModelParametersStageAverage Deviation ValueRecommended
Deviation Values
Electrical boxFlatness Reconstruction process±0.1 mm±0.2 mm
CAD modeling±0.08 mm
Additive manufacturing±0.05 mm
RE + CAD + AM±0.1 mm
Mounting hole spacingReconstruction process±0.1 mm±0.2 mm
CAD modeling±0.1 mm
Additive manufacturing±0.03 mm
RE + CAD + AM±0.12 mm
DepthReconstruction process±0.13 mm±0.3 mm
CAD modeling±0.09 mm
Additive manufacturing±0.04 mm
RE + CAD + AM±0.15 mm
Vacuum coverFlatness of the sealing surfaceReconstruction process±0.2 mm±0.2 mm
CAD modeling±0.09 mm
Additive manufacturing±0.1 mm
RE + CAD + AM±0.15 mm
Geometric accuracy at the edgesReconstruction process±0.24 mm±0.2 mm
CAD modeling±0.1 mm
Additive manufacturing±0.2 mm
RE + CAD + AM±0.18 mm
Battery coverFlatness of contact surfacesReconstruction process±0.2 mm±0.2 mm
CAD modeling±0.15 mm
Additive manufacturing±0.15 mm
RE + CAD + AM±0.11 mm
Dimensional accuracy of the fixing holesReconstruction process±0.13 mm±0.2 mm
CAD modeling±0.12 mm
Additive manufacturing±0.1 mm
RE + CAD + AM±0.1 mm
Disclaimer/Publisher’s Note: The statements, opinions and data contained in all publications are solely those of the individual author(s) and contributor(s) and not of MDPI and/or the editor(s). MDPI and/or the editor(s) disclaim responsibility for any injury to people or property resulting from any ideas, methods, instructions or products referred to in the content.