Article

Design Evaluation of a Single Wheelset Roller Rig for Railroad Curving Dynamics and Creepage Studies

Center for Vehicle System and Safety (CVeSS), Virginia Tech, Blacksburg, VA 24060, USA
*
Author to whom correspondence should be addressed.
Designs 2025, 9(4), 99; https://doi.org/10.3390/designs9040099
Submission received: 25 July 2025 / Revised: 13 August 2025 / Accepted: 18 August 2025 / Published: 20 August 2025
(This article belongs to the Topic Vehicle Dynamics and Control, 2nd Edition)

Abstract

This study presents a novel design for emulating wheelset curving dynamics by implementing a laterally constrained wheelset and two independently powered rollers. The new configuration extends the test capability of the existing Virginia Tech-Federal Railroad Administration (VT-FRA) roller rig from a single wheel to a wheelset (i.e., two wheels). The redesigned rig is intended for evaluating both the tangent track and curving dynamics of a wheelset on a railcar. Test data from earlier experiments with a single wheelset is analyzed to assess the control system’s ability to maintain the commanded roller speed. This evaluation determines whether the new system can accurately emulate curves. The study develops correction factors to account for the dissimilar contact patch sizes and longitudinal creep forces resulting from the dissimilar roller diameters. A novel force measurement method is proposed to resolve the creep forces at each contact patch independently. An assessment of the existing VT-FRA roller rig data indicates a maximum roller speed deviation of 0.37% from actual values, which is deemed to be within the intended accuracy for future tests with the redesigned rig. An analysis of the force measurements by a load platform demonstrates the feasibility of accurately determining the wheel–rail contact forces for the new design rig, identical to the original design. Despite the numerous challenges in integrating a new wheel and roller into the existing VT-FRA roller rig, the study demonstrates that such a redesign can be achieved within the space and kinematic constraints, while maintaining the intended measurement accuracy.

1. Introduction

The interaction between wheel and rail is one of the most complex aspects of railroad engineering. In particular, the wheel–rail contact forces are critical to the vehicle’s stability, traction efficiency, and wheel wear. For decades, researchers have focused on better understanding this complex interplay, primarily using models and simulations due to their greater availability and lower barriers to use. Such models and the findings they suggest, however, must be verified using either laboratory or field tests. Field tests have proven to include variations influenced by environmental factors often beyond one’s control. Laboratory tests, mainly using roller rigs, have been more successful in controlled tests that can be used for verifying models and testing hypotheses. These rigs often adopt a wide range of layouts depending on their research objectives and design constraints imposed on them. Comparisons of multiple roller rig layouts are included in reference [1], as well as current and past roller rigs in reference [2].
Replicating field dynamics in the laboratory is often challenging, particularly in curves where the radius differential between the two rails causes the wheels to have dissimilar longitudinal tractions. In the field, the effective conicity of the wheels, the rigid axle, and the flanges help the railcar wheelset remain centered on the track while sinusoidally moving laterally with yaw [3]. This is known as the axle (wheelset) kinematics oscillation, an effect described in early kinematic models [4]. The wheel’s conicity provides self-centering behavior for small lateral displacements, while flange contact becomes significant in sharper curves. However, simplified kinematic models cannot fully explain the curving dynamics observed in the field. In curves, the centrifugal forces and complex creep forces arising from relative slip between the wheel and rail become significant. To fully or partially counteract the lateral acceleration generated during curving, tracks are “superelevated” in curves, raising the outer rail relative to the inner rail [5].
Additionally, the interaction between the wheelset and the railcar suspension system, which includes the longitudinal and lateral stiffness, contributes to relative motion at the contact [3]. This motion results in relative slip (creepage) and creep forces at the wheel–rail interface (WRI). Replicating these phenomena using roller rigs poses several challenges, mainly because the degrees of freedom differ significantly from those in the field [6].
Most often, roller rig configurations that attempt to emulate track conditions use a wheel (or wheelset) in contact with a rotating roller that serves as the rail [3]. In this setup, the wheel is either idle (i.e., it rotates due to friction at the contact with the roller) or is driven independently to control the percentage of creepage. The studies in references [7,8,9,10] include a few examples of rigs with idle wheels. The study in reference [11] describes a rig with one independently controlled wheel and roller. The latter research makes it clear that, beyond better controlling percentage creepage, precisely controlling the wheel’s rotational speed enables far more precise braking and traction evaluations.
The use of roller rigs has not been limited to tangent track or traction and breaking studies. Various full-size and scaled roller rig designs have been employed to emulate the curving dynamics of wheelsets and bogies. The full-scale roller rig described in reference [8] was used to study the effect of lubrication in curves with various radii. Employing the same rig, Liu et al. [12] compared field curving measurements with laboratory data under similar conditions. The authors propose methods for emulating centrifugal forces in the laboratory, within the kinematic constraints of a roller rig. They also control roller speeds to generate a creepage differential at the high- and low-rails in a curve, emulating curving dynamics for different curve radii. Although the study successfully emulates curving dynamics, the rig’s undriven wheels limit traction to the coefficient of friction between the rollers and wheels. Independently controlling the wheels would overcome this limitation. Bruni et al. [13] have also investigated a wheelset full-size roller rig. A mathematical model of the full-size roller rig is proposed, and data from the experiments are compared with the model’s predictions. The roller rig described in the study does not allow independent control of the roller speeds, as they are connected by the same shaft, which prevents emulating a curve. Furthermore, the wheelset’s motion is governed by contact friction with the rollers, similar to the setups described in other studies mentioned earlier.
Other studies, such as those in references [9,10], utilize a scaled roller rig to reduce data acquisition costs and facilitate testing. The study by Matsumoto et al. [9] uses a 1/5th scaled roller rig with an idle (undriven) axle and two independently driven rollers. A similar roller rig configuration is described by Kalousek et al. [10] for a 1/8th scaled roller rig [10]. Both rigs incorporate a yaw degree of freedom that allows axle rotation about the z-axis, caused by the traction differential at the wheels, which are rotated by the rollers. The undriven wheel configuration in these rigs limits the percentage creepage and degree curves that can be emulated, similarly to the mentioned full-scale rigs.
In addition to the design challenges of replicating wheelset curving dynamics in roller rigs, measuring the forces developed at WRI is also a complex task. In the field, creep force measurements are indirect and rely on sensors positioned far from the actual contact location. This creates several issues, including uncertainty about the contact patch location, potential force coupling, and the complexity of instrumenting rotating components [14]. Most often, field measurements use instrumented wheelsets—also known as dynamometric wheelsets—which estimate forces through arrays of strain gauges mounted on the wheel hub, axle, or both. The contact forces are then calculated from the forces measured by the strains [15]. There are, however, no standards for the methodology or accuracy required to instrument those wheelsets, as discussed in references [16,17]. This, combined with the challenges of testing in an uncontrolled environment, reduces the repeatability of the measured data [18].
On the other hand, roller rigs offer more controlled and repeatable conditions than instrumented wheelsets. Contact forces are commonly measured by load cells that are directly mounted on the actuators [13,19] or a rigid platform that houses the wheelset [10,20]. In some instances, measurements are made using strain gauges at the roller, similar to an instrumented wheelset arrangement used for field testing [9]. There are, however, limited details on the methods used to resolve creep forces from sensor data in roller rigs, as well as their accuracy and repeatability. Additionally, like field tests, there appears to be no standardization or best practices for making contact measurements in roller rigs.

Roller Rig Needs

Several gaps have been identified that limit the ability of roller rigs to fully emulate field conditions in controlled laboratory settings. No existing single-axle roller rig design incorporates independently driven rollers and an axle, allowing for precise adjustment of the percentage creepage and creepage differential at each wheel. Such control is essential for emulating various degree curves and the traction differential that occurs at the rail-wheel interface. Additionally, there is limited discussion on how roller speed control accuracy affects the equivalent curve radius replicated in roller rigs, particularly since the speed differences between the low and high rails are subtle, especially for large-radius curves.
Another area of great need is accurate measurement of the contact forces at WRI. Full-scale rigs often prioritize overall vehicle or bogie behavior, rather than the accuracy of force measurements during curve negotiation. Furthermore, the wheel and roller steel-to-steel contact presents extremely large stiffnesses, which result in significant variations in forces due to surface asperities or other naturally occurring conditions. These variations are even more pronounced in full-scale roller rigs that attempt to emulate curving dynamics. Achieving low variation and high repeatability in force measurements requires a scaled roller rig design that minimizes uncertainty in contact patch location and addresses the instrumentation challenges observed in earlier studies.
A need also exists to balance the requirements for precise control of wheel and rail (roller) lateral and yaw positions, as well as cant angle, in conditions that emulate axle kinematics on tangent tracks and curves. The constraints necessary for precise control of lateral position, yaw angle, and cant angle pose challenges in duplicating wheel kinematics on a track. One needs to account for the effects of the constraints required for precision control of wheel and rail kinematics.
This study investigates whether field-like curving dynamics can be accurately emulated on a roller rig using a laterally and longitudinally constrained wheelset with independently driven rollers and wheelset. The study evaluates a redesigned configuration of the Virginia Tech–Federal Railroad Administration (VT-FRA) roller rig, initially developed for single-wheel testing. The new configuration features two independently driven rollers and an independently driven constrained wheelset, enabling controlled creepages at each wheel’s contact and the control of multiple degrees of freedom. The discussions in the following sections address
  • Key challenges associated with emulating curving dynamics, using a constrained, independently powered wheelset;
  • The effect on the roller speed control accuracy (governed by the hardware capabilities) for emulating curves with various radii;
  • The impact of rollers’ diameters on contact patch distortion at WRI, relative to a wheel on a tangent track;
  • Designing a force measurement platform for determining creep forces at each wheel with high accuracy, without affecting the WRI dynamics;
  • Overcoming the design challenges associated with adding a new wheel and roller in a roller rig with a single wheel and roller (i.e., the VT-FRA roller rig), within the existing geometric and spatial constraints.

2. VT-FRA Roller Rig

2.1. Single Wheel Configuration

Several design configurations were evaluated to develop the current layout of the VT-FRA roller rig, as illustrated in the CAD model in Figure 1 [21]. Figure 1a presents an isometric view of the rig, while Figure 1b shows a cross-section of the wheel and roller about the A-A plane. This state-of-the-art system is designed to study single wheel–rail interaction with high accuracy and some of its testing capabilities are described in detail by Meymand et al. [11]. In recent years, the VT-FRA roller rig has been used in its single-wheel configuration to evaluate the effects of third-body layers on the wheel–rail interface (WRI), including traction reducers and traction enhancers [22,23], oil-based contaminants [24], and natural third body layers [25]. Additionally, data from the rig have supported the validation of regression models for predicting traction forces [26], and have been used to analyze contact patch geometry under different wheel and roller configurations [27] and wear studies [28].
The roller rig features a 1/4th scaled wheel and roller with a 1:5 diameter ratio [29]. Two 15.7 kW AC motors independently control wheel and roller rotation, enabling traction and braking studies with high repeatability and precision under various percentage creepage conditions.
The rig provides three degrees of freedom (DoFs) at the wheel–rail interface, controlled by four linear actuators. As shown in Figure 1a, these DoFs allow independent control of the wheel roll angle (cant), roller yaw (angle of attack), and relative lateral displacement between the wheel and roller. Additionally, two linear actuators manage the vertical wheel load relative position with a repeatability of 10 μm [29], allowing forces at the contact to be generated and kept limited to 10 kN, which is equivalent to 160 kN for a full-size wheel. The system supports lateral and longitudinal force measurements up to 5 kN, equivalent to 80 kN for a full-scale wheel [11].
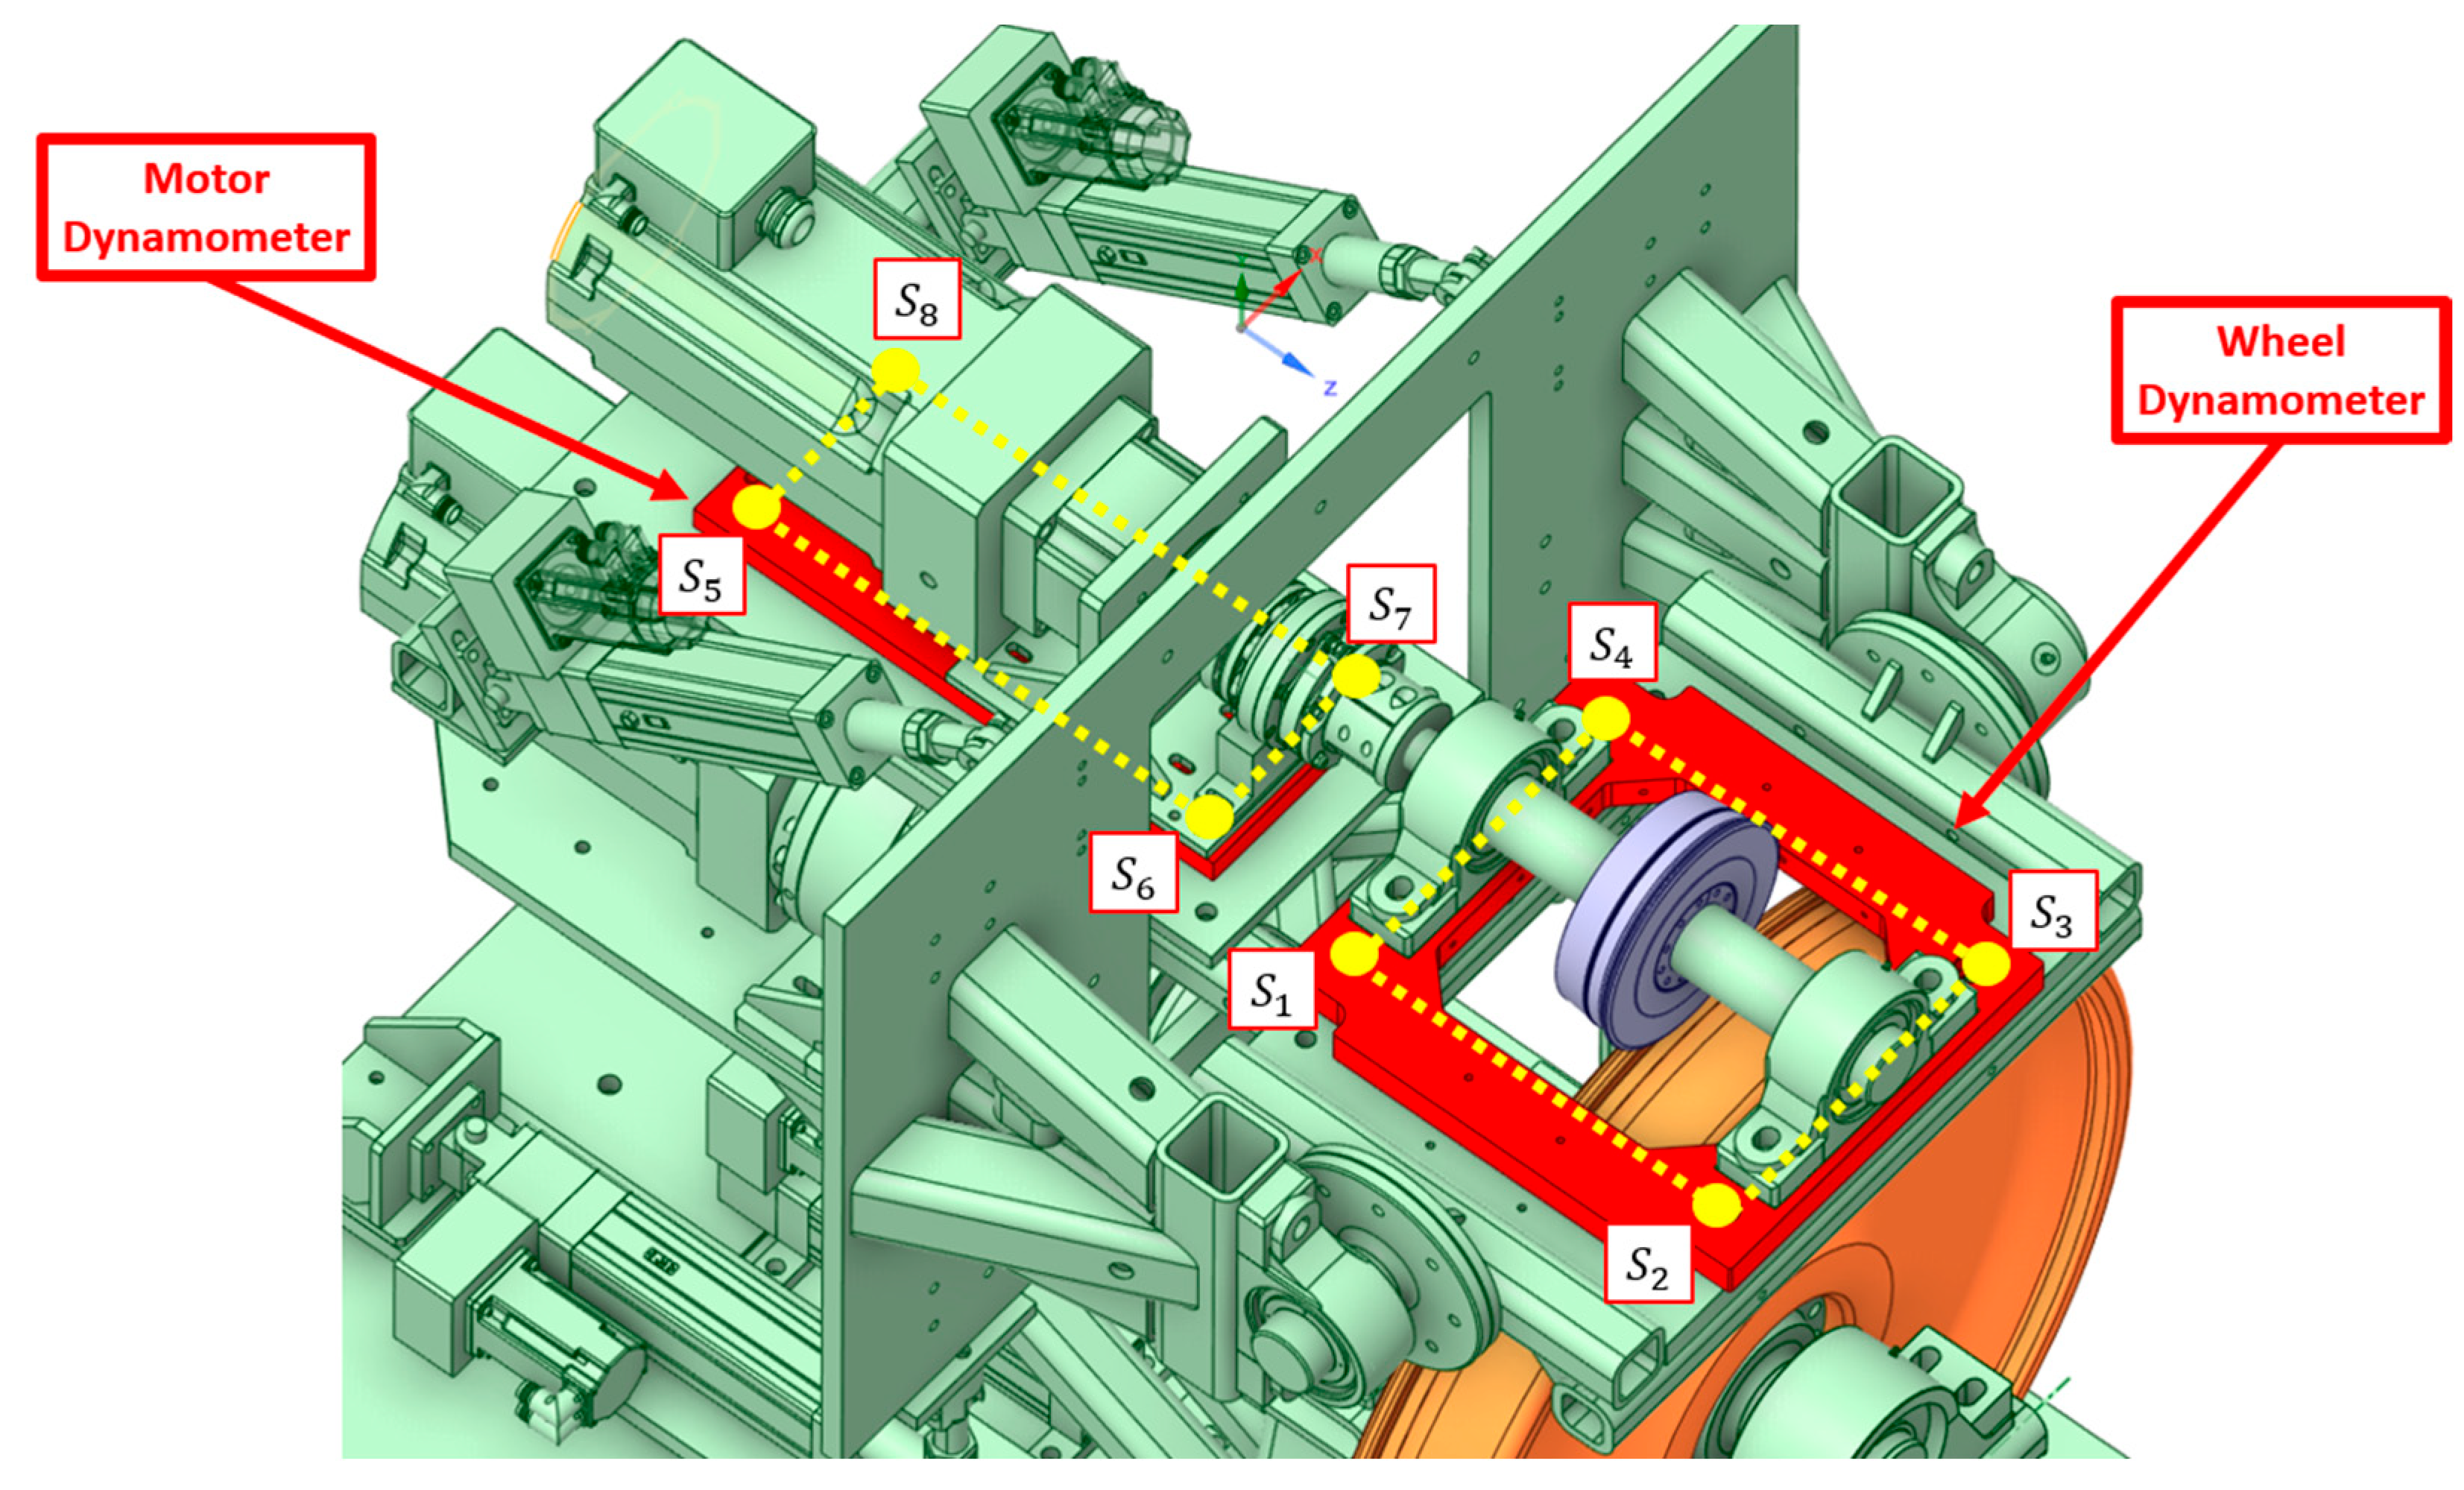
The VT-FRA roller rig also features a novel method for precisely measuring the creep forces and moments at the wheel–rail contact. The system comprises two platforms—a “wheel dynamometer” and a “motor dynamometer”—each equipped with four triaxial piezoelectric load cells [11]. Figure 2 illustrates these two dynamometers and the total of eight piezoelectric sensors. Each triaxial loadcell measures the dynamic and quasi-static loads in three orthogonal axes with an accuracy of ±2.5% full-scale output (FSO) [30]. The wheel dynamometer is arranged such that the contact patch occurs at the geometric center of the load cells at the corners. The loadcell measurements are used to determine the longitudinal and lateral creep forces at the wheel–rail contact, using the force and moment equations. The same equations are also used to determine spin creepage. The calculation details are included in reference [11] and are not further elaborated here for brevity.
The curved roller, which emulates a flat track, introduces slight contact patch distortion that is estimated to be proportional to the ratio of wheel to roller diameter, as detailed in a study by Keylin et al. [31]. Keylin’s analysis shows that if the ratio is equal to or larger than 1:5, the contact patch distortion would be less than 10%. Smaller ratios would yield less distortion, while larger ratios result in more distortion. The wheel and roller of the VT-FRA roller rig were selected to maintain the distortion to less than 10%.
To compare the rig’s results with field data, the VT-FRA roller rig applies INRET’s scaling approach, which ensures stress similarity between the scaled and full-scale systems [11]. In this strategy, physical quantities are scaled using defined factors that include the following:
  • Cross-sectional lengths by a linear factor equal to the rig’s scaling factor (i.e., four for the VT-FRA roller rig).
  • Force measurements by a quadratic factor of the rig’s scaling factor (i.e., 16 for the VT-FRA roller rig). This implies that the maximum roller rig wheel load of 10 kN corresponds to 160 kN (36 kips) for a full-scale wheel.
Another important concept for correlating the roller rig data and a tangent track of the same scale is the use of correction factors (CFs), introduced by Keylin et al. [31]. As described by the author, the CFs can be used in conjunction with the transformation factor (TF) to compare the scaled roller rig data with the field data. The CFs quantify deviations in physical quantities between a roller of finite diameter and a tangent track—modeled as a roller of infinite diameter at the same scale. The correction factors are crucial for assessing differences in contact patch distortion and creep forces between the rig and the tangent track. Although the diameter of the wheel used in the rig (250 mm) is smaller in absolute terms compared to a full-size revenue-service wheel (typically around 838 mm), the application of the INRET scaling strategy [11] and adherence to the recommended wheel-to-roller diameter ratio of 1:5, as proposed by Keylin et al. [31], ensure that the physical quantities and stress conditions at the wheel–rail interface (WRI) are representative of those observed in the field. These considerations validate the relevance of the experimental data obtained from the VT-FRA roller rig for studying real-world contact mechanics.

2.2. New Roller Rig Setup

Integrating a constrained wheelset into the VT-FRA roller rig presents several design challenges, as the original rig was developed for single-wheel roller testing. The current setup imposes spatial constraints for the new configuration—particularly in accommodating an additional roller. Additionally, the existing algorithm for calculating contact forces, described in reference [30], must be redesigned to enable the measurement of creep forces on each wheel–roller contact patch. The new setup is also expected to maintain equivalent control performance, particularly in roller velocity regulation; therefore, the hardware components must share similar technical specifications with those of the original rig. It is essential to note that the setup proposed in this study represents the nearly final design that is undergoing the necessary steps for hardware implementation.
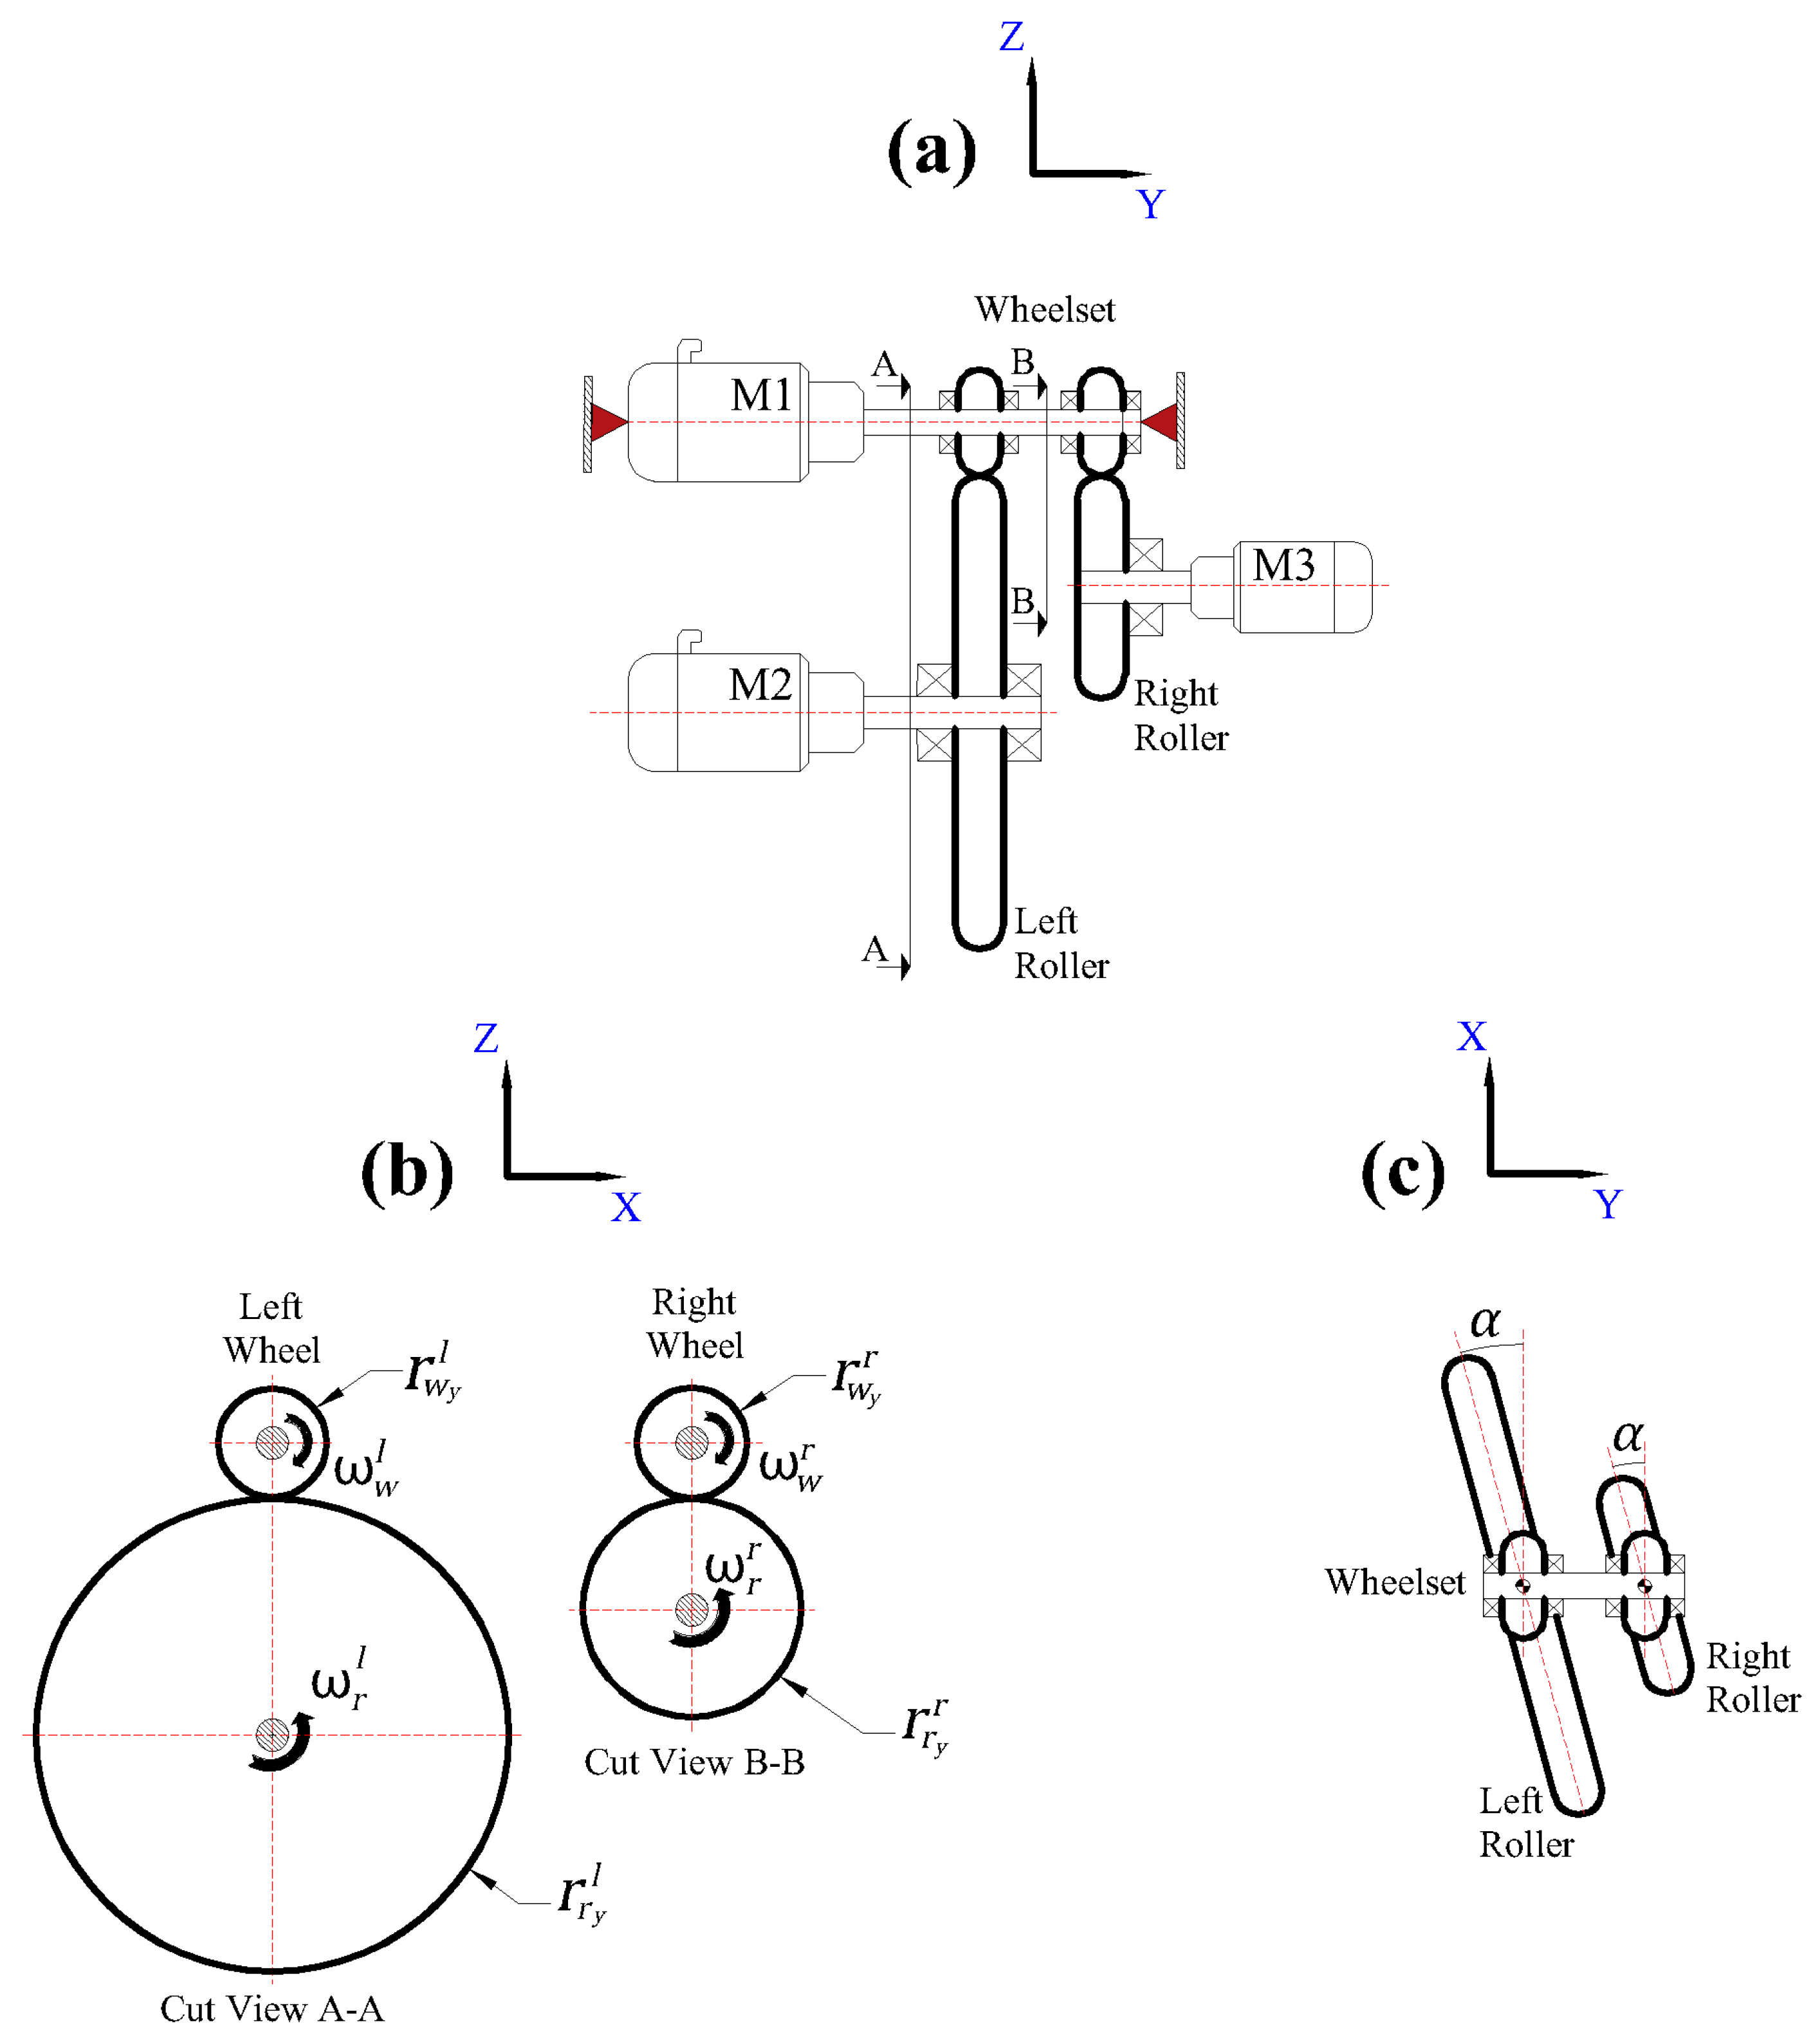
The redesigned roller rig can emulate curving dynamics using a constrained wheelset. Figure 3 presents the wheel and roller arrangement, as well as the kinematics configurations they can take in different view planes. Descriptions of the variables used in this study can be found in the nomenclature in Appendix A. The Y–Z plane (Figure 3a) shows the laterally constrained wheelset on top, driven by an independent motor, M1, along with the left and right rollers, powered by motors M2 and M3, respectively. The X–Z plane in Figure 3b shows a side view of the wheels and rollers in cross-sections A-A and B-B. In the figure, the wheels and rollers are in contact, where the left roller represents the low rail and the right roller represents the high rail in a curve. The X–Y plane view in Figure 3c shows the rollers’ ability to generate an angle of attack (α), which is kinematically equivalent to the wheelset yaw when negotiating a curve. Referring to Figure 3a, the redesign of the rig will add the right wheel and roller to enable wheelset testing, as opposed to single-wheel testing.
When the wheelset is in a neutral, symmetric position relative to the rollers, the left and right wheels have approximately equal rolling radii ( r w l r w r ). The wheelset is powered by motor M1, ensuring both left and right wheels rotate at the same angular velocity (i.e., ω w l = ω w r , as shown in Figure 3b). The rollers are independently driven by motors M2 and M3, which control their angular velocities, ω r l and ω r r , respectively.
The drivetrain M3 consists of an AC motor coupled to the low-speed side (LSS) of a gearhead, which amplifies torque to withstand the longitudinal creep forces generated at the correct contact patch. It is equipped with an optical sine encoder (resolver model DA), providing an angular position measurement accuracy of 0.0055 degrees per turn [32]. The high-resolution position data is fed back to the motor controller, enabling closed-loop control of the motor’s angular velocity. Drivetrain M1 from the existing rig shares the same hardware as the roller drivetrain and therefore offers the same accuracy in controlling the roller speed. The detailed electromechanical design of the single-wheel configuration of the VT-FRA roller rig, including the specific powertrain design of motors M1 and M2, is described in detail in [33] and is not included here for brevity.

3. Discussions

3.1. Independent Creepage Control

Separately driving the wheelset and the two rollers enables independent control of the creep forces at the wheels, which is lacking in most existing and past roller rigs. It is an essential aspect of the redesigned VT-FRA roller rig that has been meticulously integrated into the existing design.
Since the rollers have different diameters, creepage equations can be derived for each contact patch. Considering the angle of attack α of the rollers with respect to the wheelset, the longitudinal and lateral creepages can be calculated using the following [34]:
γ x l = V w l V r l c o s α 1 2 ( V w l + V r l c o s α )
γ x r = V w r V r r c o s α 1 2 ( V w r + V r r c o s α )
γ y l = V w l V r l s i n α 1 2 ( V w l + V r l s i n α )
γ y r = V w l V r l s i n α 1 2 ( V w l + V r l s i n α )
The spin creepage is neglected since the wheel conicity is small. The tangential velocity components ( V w l ,   V w r ,   V r l , and V r r ) are directly proportional to the angular velocity of the motors and the wheel and rollers’ instantaneous radii. In the case of wheels with the same rolling radius, i.e.,
r w l = r w r ,   then
V w l = V w r .
The rollers’ tangential velocities, V r l and V r r , are always controlled independently.
Beyond controlling the angular velocities of the wheelset and rollers, the design enables precise adjustment of the relative position between the wheelset and each roller to represent various dynamic conditions. Two electromagnetic linear actuators control the vertical load on the right wheel with 10 μm repeatability, the same as the existing linear actuators [29]. The system can simulate angles of attack between the wheel and roller of up to 3°. It can also generate a maximum cant angle of 3° at the wheel, representing the superelevation or cant angle that exists on tracks to reduce or mitigate centrifugal forces. Lateral displacement of the rollers relative to the wheelset allows creating asymmetric rolling radius conditions (i.e., r w l r w r ), to emulate the difference in wheel radii that exists in curves when a tapered wheel shifts laterally toward the flange of the high-rail wheel. An additional degree of freedom enables the right roller to move independently laterally, emulating track gauge variations. Furthermore, the independent adjustment of the rollers allows both rollers to be shifted laterally with respect to the wheelset, enabling the application of additional forces on each wheel if needed. When combined with the differential roller speeds used to simulate curving conditions, this setup can mimic the effects of unbalanced centrifugal forces encountered in scenarios such as cant-deficient curves.
As Figure 3b highlights, the setup features a difference in roller radii, with r r l > r r r . The wheel-to-roller diameter ratio on the right side is approximately 1:2, compared to the 1:5 ratio on the left side. The smaller roller diameter (40 cm) is necessary to accommodate the added components within the limited available space. The added roller will be machined to a 1/4th scaled RE136 railhead profile, the same as the existing roller. This maintains the same INRET scaling factors as the existing design, as detailed earlier.

3.2. Contact Patch Distortion Comparison

The ratio between the wheel and the roller diameter significantly affects the contact patch distortion [35]. For instance, if the roller, which represents the rail, has the same diameter as the wheel, Keylin’s study indicates that the contact patch area is distorted by 81% relative to a wheel of the same size on a flat rail. Hertzian theory indicates an elliptical contact patch between the wheel and rail. For the right and left contact patches, the product of the ellipse dimensions a and b , where a > b , is calculated by [36]
a b l = m n 3 2 N 1 υ 2 E 1 A l + B l 2 3 N 2 3
a b r = m n 3 2 N 1 υ 2 E 1 A r + B r 2 3 N 2 3
where the geometric parameters A and B are given by
A l = 1 2 1 r w y l + 1 r r y l   and   A r = 1 2 1 r w y r + 1 r r y r
B l = 1 2 1 r w x l + 1 r r x l and   B r = 1 2 1 r w x r + 1 r r x r
The variables above are described in the nomenclature in Appendix A.
Viewed in the X-Z plane (Figure 3b), the geometric parameter A is a function of the radius of the roller and wheel, as is B when viewed in the Y-Z plane (Figure 3a). For a tapered wheel and the roller, the radius r w x l or r w x r is large, implying that
1 r w x l 0
1 r w x r 0

3.3. Correction Factor

The correction factor (CF), as defined by Keylin [35], is used to correlate the quantities a b l   and a b r , in Equations (5) and (6), to a b t , defined as the multiplication of the contact ellipse dimensions “a” and “b” expected between a wheel and rail of the same scale. Both CFs are represented by
C F a b l = a b l a b t
C F a b r = a b r a b t
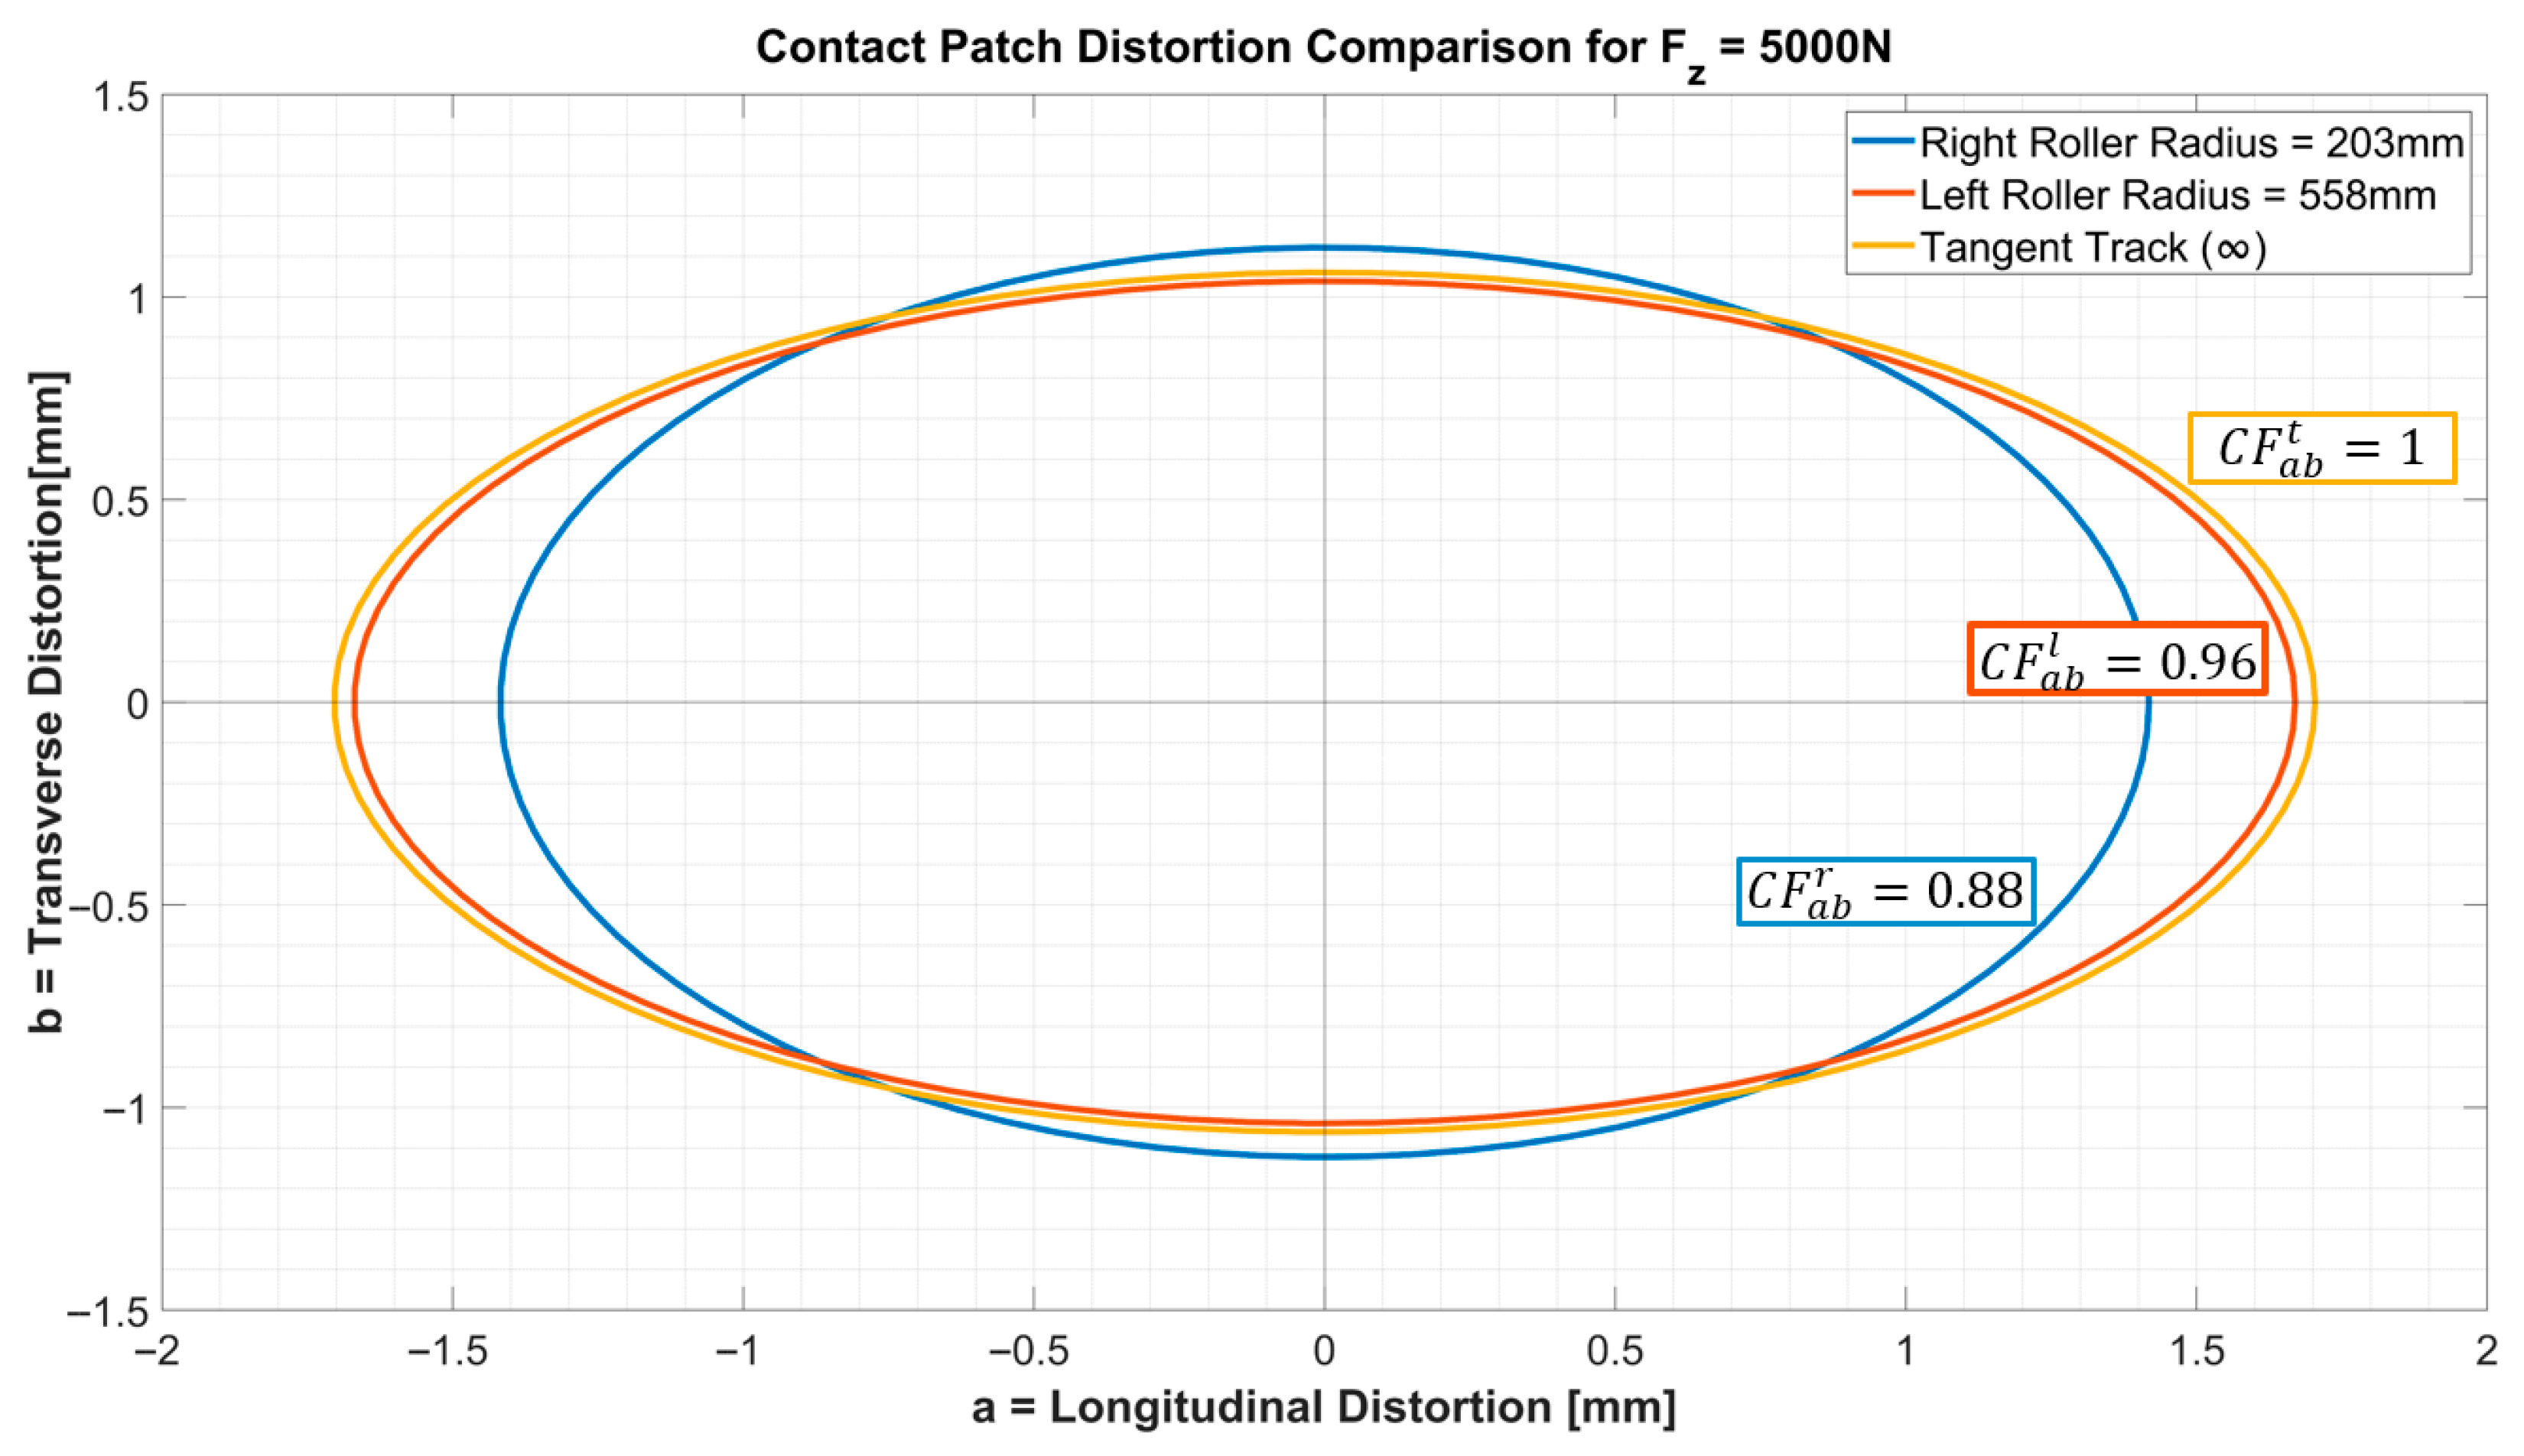
These CFs are used to compare the deviation in the contact patch area between the rollers and a tangent track for the normal contact problem. It is worth noting that the roller’s radii differ due to geometric constraints imposed by the current setup. Consequently, for a given normal load, N , on the wheels, the left and right contact patches, as well as the contact ellipse parameters, a b l and a b r , differ. Figure 4 shows the contact patch ellipse distortion for three scenarios:
  • Outer Ellipse: A 5 kN loaded steel wheel in contact with a flat rail for which the correction factor C F a b t is set to 1.
  • Intermediate Ellipse: The contact patch for the left roller, with a correction factor of 0.96 as calculated by Equation (9).
  • Inner Ellipse: The right wheel’s contact patch, with a correction factor of 0.88 as calculated by Equation (10).
The correction factors are calculated using geometric parameters for a flat rail and the two rollers. For the flat rail, it is assumed that the rail radii r r x t = 50.8   m m   and r r y t = .∞. For the left roller, the radii are   r r x l = 50.8   m m   and   r r y l = 558   m m , while the right roller has r r x r = 50.8   m m   and r r y r = 200   m m .
Note that correction factors (CFs) indicate how closely the roller replicates a given quantity compared to a wheel on a flat (tangent) track, where CF = 1 represents perfect replication. For example, a CF of 0.96 for the left roller implies that the calculated quantity “ab” is 96% of the value observed on a flat rail, while for the right roller, it is 88%. Although the right roller has a significantly smaller diameter (36% less than the left roller), its correction factor for “ab” remains reasonably high at 0.88. Furthermore, since the “ab” quantity is linearly proportional to the contact ellipse area, this indicates that the contact patch area on the right roller is approximately 88% of what would be expected on a tangent track. Additionally, as reflected in the earlier equations and shown in Figure 4, contact patch distortion does not vary linearly with roller diameter.
To achieve the same or similar correction factors for the two rollers, it is necessary to create conditions that equate them, such as either increasing the wheel load N on the right contact patch or modifying the material properties. However, neither option is viable due to the dissimilar test conditions they create. Therefore, the contact patch on each wheel of the wheelset will inevitably experience the same static load, N , but the contact patch ellipses and corresponding correction factors will differ due to differences in roller diameter. Dynamically, when emulating WRI on a tangent track, the difference between the contact ellipse parameters a b l and a b r plays a vital role in the creep forces generated on the wheelset, as will be discussed in the following section.

3.4. Equalization Factor C γ

The longitudinal creep forces at the two wheels for the roller with different sizes are given by [36]:
F x l = G a b l c 11 l γ x l
F x r = G a b r c 11 r γ x r
where G is the material shear modulus, a b l and a b r are the parameters defined by Equations (5) and (6), c 11 l and c 11 r are the creepage coefficients given in [34]. γ x l   and γ x r are the longitudinal creepages on the left and right wheels, defined by Equations (1) and (2), respectively.
To equate the above creep forces, one can adjust the percentage creepages γ x l and γ x r by controlling the rotational speed of the two rollers relative to the wheels’ rotation speed. Note that the other parameters in Equations (11) and (12) cannot be changed because they represent the physical dimensions or wheel load, which in practice is the same for the two wheels.
F x l = G a b l c 11 l γ x l = C γ F x r = C γ ( G a b r c 11 r γ x r )
where C γ is the “equalization factor,” which is the value that makes the forces at the two wheels equal. Solving for C γ yields the following:
C γ = a b l c 11 l a b r c 11 r
C γ represents the additional creepage required on the smaller roller to generate the same longitudinal creep force as the larger roller. This factor is a function of the wheel load (vertical load) and the properties of both the wheel and roller materials, and is highly influenced by the differences in roller diameters.
Assuming a wheel load of 5 kN, C γ is approximately 1.28, implying that the right wheel’s longitudinal creepage must be 28% higher than the left wheel. For the tests, this is achieved by using the motor M3 to rotate the right roller 28% faster than the left roller, which is driven by M2. Therefore, the equalization factor C γ is a crucial parameter for emulating tangent track and curve emulation, as it defines the specific velocities required for each motor to generate the correct proportional longitudinal creep forces on the wheels.

3.5. Curve Emulation Sensitivity

As mentioned previously, the independent drive motors M2 and M3 enable the rotation of the rollers at different rotational velocities. This feature, combined with the angle of attack (AoA) that can be set by rotating the rollers about the vertical axis (yaw axis), accommodates emulating curves of different degrees. As stated earlier, we use the percentage creepage differential to emulate the radius differential between the low-rail (inner) and high-rail (outer) rail in a curve.
In practice, when a wheelset negotiates a curved track of radius R 0 at speed V , the high-rail wheel on the outer track travels a longer distance than the low-rail wheel on the inner track. The rail velocities can be calculated as [12] shown below:
V h i g h = V 1 + l R 0
V l o w = V 1 l R 0
For the roller rig, these velocities are directly proportional to the tangential velocities of the independently driven rollers. The notation we adopt here implies the following:
V r r = V h i g h
V r l = V l o w
where V r r and V r l are the tangential velocities of the right and left rollers, respectively, calculated as the product of the rotational velocity and roller radius.
Assuming a left-hand curve, the tangential velocity of the left roller ( V r l ) will be smaller than the right roller ( V r r ); hence, V r l < V r r . The forward velocity V in Equations (15) and (16) cannot be measured directly because, in the roller rig, the wheelset is laterally and longitudinally constrained. Instead, it is estimated using an average of the tangential velocities of the wheels and rollers, using
V = 1 2 V r r + V w r 2 + V r l + V w l 2
Equations (15) and (16) are used to calculate the required forward velocities of the rollers (i.e., V r r and V r l ) corresponding to the differential between the low- and high-rails in a curve with a given radius, R 0 . The constant distance between the two contact patches, 2 l , is directly measured, while the curve radius R 0 is predefined. Further analysis of the curve radius is conducted to evaluate the setup’s sensitivity in emulating curves of various degrees. Specifically, Equation (15) is rearranged to solve for the curve radius R 0 , assuming V r r = V h i g h :
R 0 = l V r r V 1    
The above equation indicates that the equivalent curve radius R 0 is a function of the velocity ratio V r r / V only, since l is constant. Equation (18) further includes a singularity at V r r V = 1 . The singularity point is equivalent to the tangent track condition where R 0 is large. In practice, the velocity ratio is close to one even for sharp curves where 1 > V r r / V > 0.95 . Therefore, R 0 is nearly singular for most typical curve radii, which makes the experiments highly sensitive to any changes in V r r / V .
To better understand the sensitivity of R 0 to slight variations in velocity ratio ( V r r / V ), the change in R 0 to a minor perturbation ϵ in ( V r r / V ) can be examined, according to
δ R 0 = ± l V r r V 1 + ϵ 100 1 l V r r V 1
This equation suggests that if V r r / V ~ 1 but V r r / V 1 , a small perturbation ϵ can cause a significant variation in the curve radius R 0 being emulated in the roller rig. Therefore, the rotational speed of the drive motors M1, M2, and M3 in Figure 3 must be controlled accurately to enable precise emulation of a track with a desired degree curve in the roller rig.
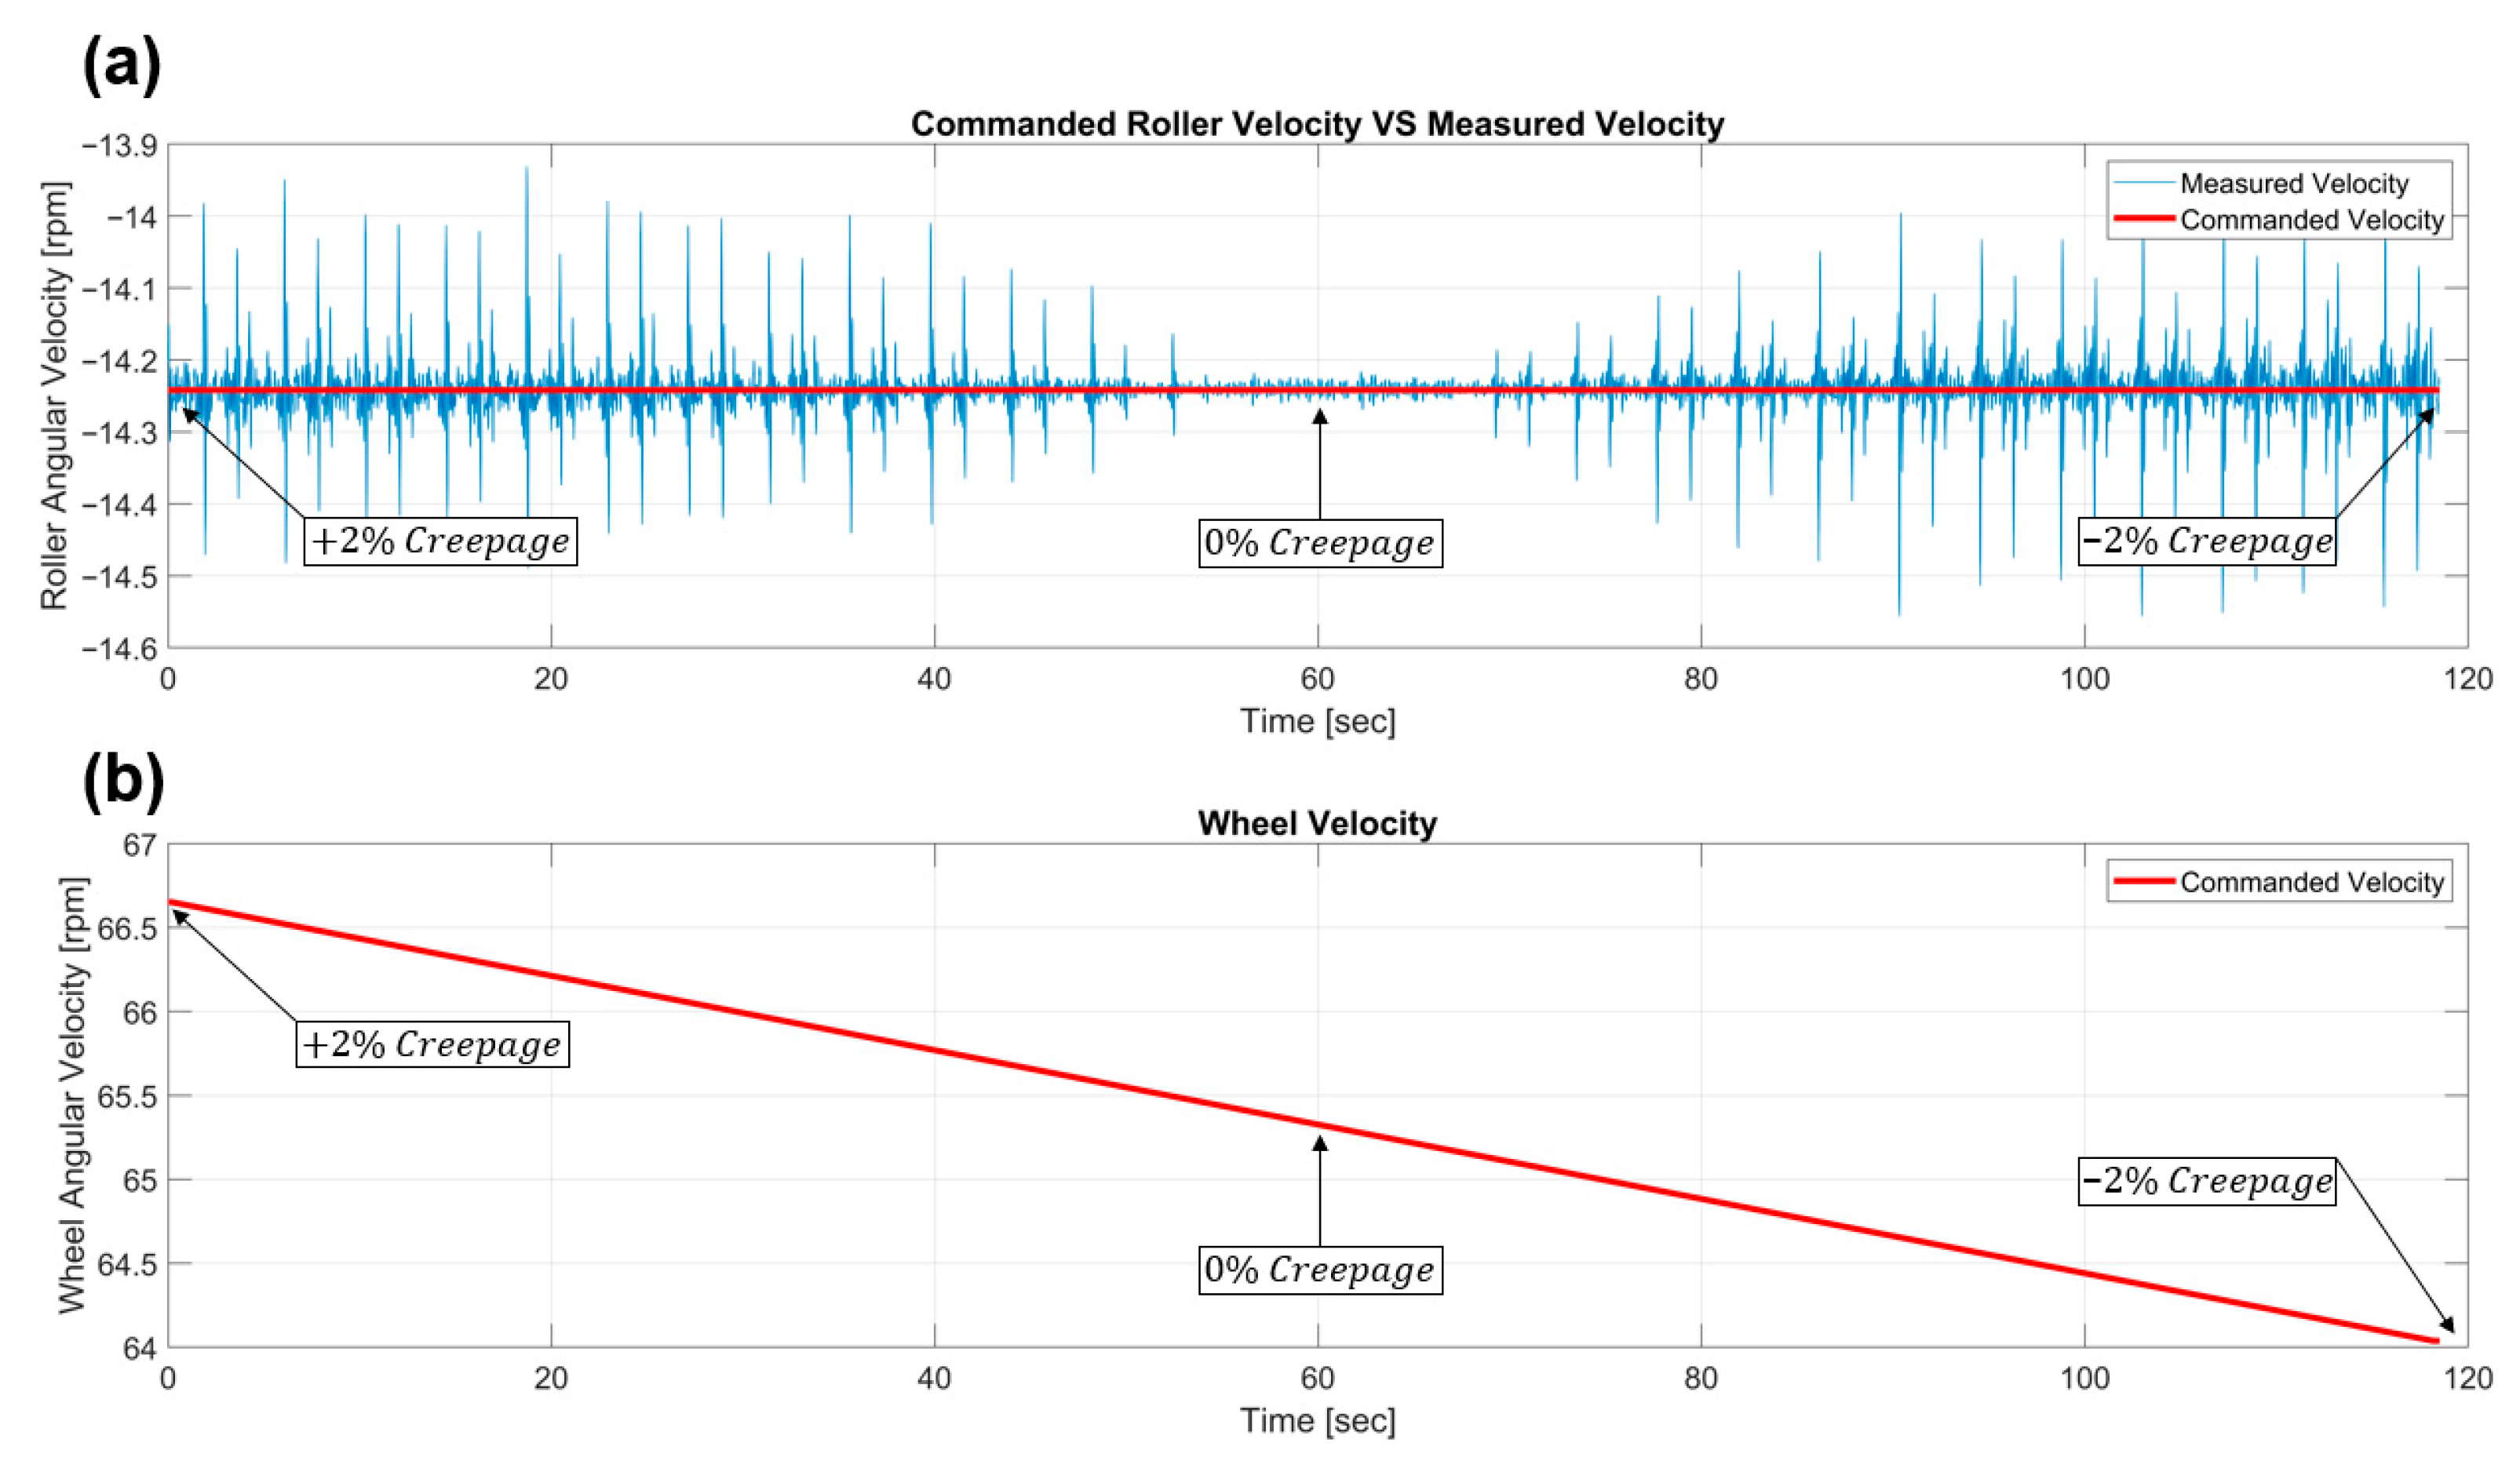
To assess how precisely curved tracks can be emulated, data from the VT-FRA roller rig in the single-wheel roller configuration are evaluated. The tests were performed with the simplest rail and wheel conditions to avoid effects other than the track curvature. The measurements, shown in Figure 5, were made with a cylindrical wheel profile, a zero cant angle, and zero angle of attack (AoA), resulting in negligible lateral creepage. Figure 5a shows the commanded roller velocity (red) and the measured roller velocity (blue) for the duration of the test, which is 120 s. Figure 5b plots wheel speed versus time. The roller is commanded to rotate at 14.242 rpm while the wheel speed decreases linearly from 66.640 rpm to 64.030 rpm.
The difference in tangential velocities between the roller and the wheel induces longitudinal creepage, which can be calculated using Equation (1). Figure 5a highlight the time instances when the computed creepage reaches +2% (traction, at 0 s), 0% (pure rolling, at approximately 60 s), and −2% (braking, at 120 s), as annotated on the plot.
In Figure 5a, the measured roller velocity is compared with the commanded velocity to evaluate the accuracy of the roller’s drivetrain. This comparison is quantified by calculating the root mean square (RMS) error across multiple data segments, where the commanded angular velocity (in rpm) is compared to the actual value. The results, summarized in Table 1, show that RMS error increases under high creepage conditions (traction or braking), with fluctuations reaching up to 0.0525 rpm. The lowest RMS error observed is 0.0096 rpm for low creepages within ±0.33%. Additionally, the mean value of the roller velocity is 14.242 rpm, indicating approximately 0% bias from the commanded velocity.
Table 1 indicates that the actual roller velocity closely follows the commanded value, with an RMS error ranging from a maximum of 0.37% (high creepage) to a minimum of 0.07% (low creepage). These values serve as the benchmark to determine the radius variation required to emulate a curved track on the new roller rig with a wheelset and rollers, as per Equation (19). The expected maximum perturbation ϵ on the velocity ratio V r r / V is, therefore, 0.37%. The following is assumed:
l = 70 m m
V r r / V = 0.999  (right side roller velocity close to the wheelset forward velocity)
ϵ = 0.37 % .
The maximum curve radius variability would be 2.78% from the actual value. For instance, if an equivalent curve radius of 1300 ft (4.4-degree curve) is desired, the expected radius variation would be between 1339 and 1261 ft solely due to drive motor capabilities.
As stated earlier, emulating curving dynamics involves creating a small creepage differential between the low- and high-rail wheels, which requires precise control of the roller RPM. The evaluation of the roller rig data indicates that this level of precision is feasible since the drivetrain M3 shares the same motor, encoder specifications, and control architecture as the existing rig, which has demonstrated reliable performance. The current analysis, therefore, provides a method to evaluate how drivetrain accuracy in roller speed control affects the curve radius emulated in the roller rig setup. Although this analysis assumes independent motors to control each roller’s angular speed, the findings also apply to designs with mechanically coupled drivetrains powered by a single motor. The key parameter is the precise control of the rollers’ tangential velocity for emulating a curve, irrespective of how the rollers are driven.

3.6. Force Measurement Decoupling

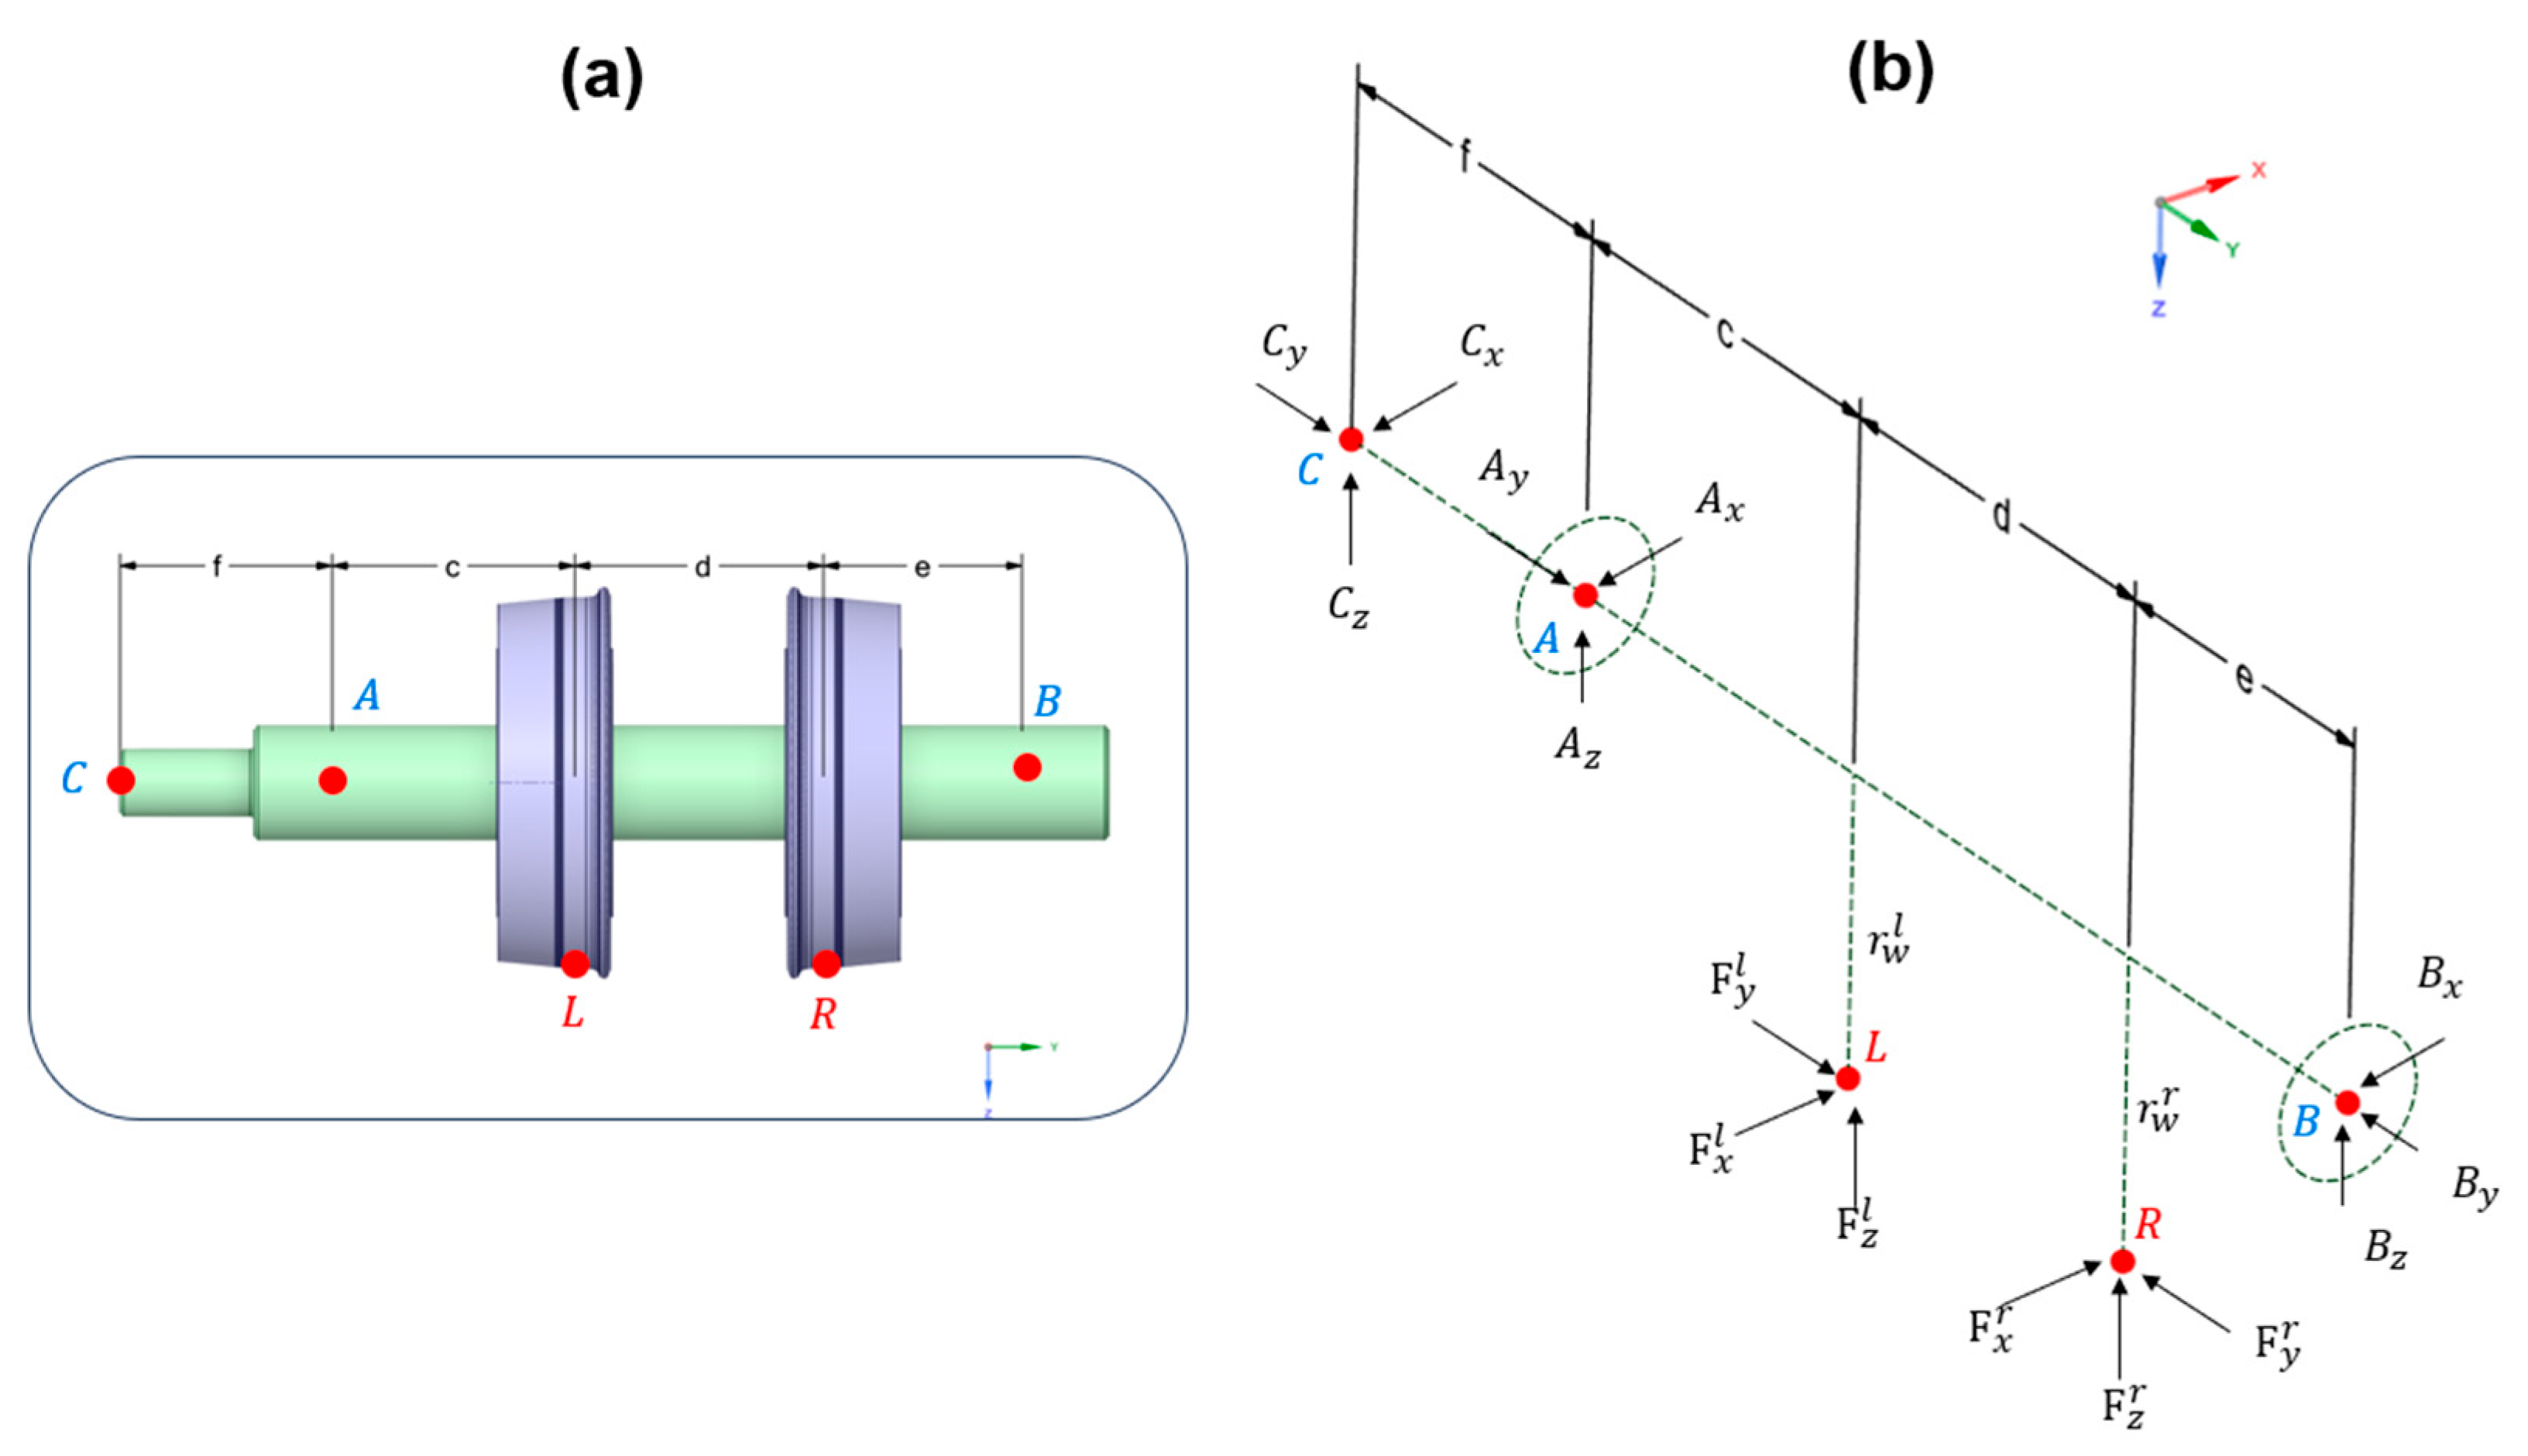
Among the challenges of emulating a wheelset’s curving dynamics is precisely measuring the creep forces developed at each contact patch. To enable force measurements in the modified roller rig, a force measurement algorithm is developed. Figure 6 illustrates the wheelset’s free body diagram in two different views: the CAD model of the laterally constrained wheelset in Figure 6a and the free body diagram with forces and reactions in Figure 6b. The line that connects points C, A, and B represents the axis of the shaft, and L and R are the left and right wheel contact with the rollers. The longitudinal, lateral, and vertical contact forces are shown at the contact patches L and R. The moments developed at the contact patches are considered negligible. Figure 6b further shows the reaction forces at the bearing supports (A and B) and the connection C to the drive motor M1. The variables r w l and r w r represent the left and right rolling radii. The geometric variables c , d , e , and f are the distances between the points of interest as illustrated in Figure 6. The definitions of the variables shown are provided in Appendix A.
The longitudinal, lateral, and vertical forces at the points along the shaft ( A , B , and C ) are known. These forces are calculated indirectly using measurements from the existing load platform, which incorporates four triaxial piezoelectric load cells. The geometric variables c ,   d , e , f , and the wheels’ rolling radii ( r w l and r w r ) are also known and controllable. Since the wheelset is laterally constrained, the geometric parameters and the rolling radius of the wheels are fixed. Hence, the forces at the contact locations L and R can be calculated directly. For the free body diagram in Figure 6b, five independent equations can be written using the equilibrium of forces and moments:
  A x + B x + C x + F x l + F x r = 0
A y + B y + C y + F y l + F y r = 0
A z + B z + C z + F z l + F z r = 0
B x l + C x f + F x l c + F x r c + d = 0
B z l + C z f + F y l r L + F y r r R + F z l c + F z r c + d = 0
Since there are six variables and five equilibrium equations, the presented system is statically indeterminate, with a degree of static indeterminacy of one. Hence, one compatibility equation is required to solve this linear system for the contact forces. Since point B is constrained to move axially and the shaft is linearly elastic (isotropic material), we obtain
Δ L B = 0 L N x E A s d x = 0
where N ( x ) is the internal axial load distribution along the shaft and A s is the shaft cross-sectional area. It is calculated using the methods outlined in sections, with point B as the datum [37]. Solving Equation (25), the additional constraint equation can be expressed as follows:
B y e + B y + F y , R d + B y + F y , R + F y , L c + B y + F y , R + F y , L + A y f = 0
Combining Equation (26) with Equations (20)–(24) and expressing them in a matrix form yields
1 1 0 0 0 0 0 0 1 1 0 0 0 0 0 0 1 1 0 0 r w l r w r c c + d c c + d 0 0 0 0 0 0 c + f c + d + f 0 0 F x l F x r F y l F y r F z l F z r = A x B x C x A y B y C y A z B z C z B z l C z f B x l C x f B y e B y d B y c ( B y + A y ) f
or
A f = b
The above equation can be solved for the force vector, f , as follows:
f = A 1 b
The coefficient matrix A contains the properties of the linear system. This matrix depends solely on the geometric parameters, i.e., the distances between the contact patches (L and R) and A, B, and C in Figure 6b. Table 2 presents the possible values of the geometric parameters in accordance with the capabilities of the new wheelset arrangement. The second column includes the nominal values, and the third column contains the maximum variations from the nominal values. Since the relative position between the wheelset and the rollers can be adjusted, variations as large as ± 10 can be expected. The variable “f” is independent of the relative position of the wheelset/rollers.
The input vector b in Equation (28) depends on the sensor readings and the geometric parameters (distances), excluding the rolling radii r w l and r w r . Since the piezoelectric sensors introduce measurement errors in the order of 2.5% of the true force values [38], as is typical for strain gauge-based systems, deviations in the force readings are expected. Hence, variations in the input vector b will directly affect the force vector f .
To solve for the force vector geometric parameters f , the inverse matrix A 1 must exist, implying that the matrix A must be positive definite. Additionally, the variations in the calculated forces in vector f are directly influenced by the “condition” of A , or c o n d ( A ) . The larger the condition number is, the larger the sensitivity of f to the parametric changes in f and b would be. A well-conditioned matrix has a small condition number, such as the identity matrix, whereas an ill-conditioned matrix has a large condition number, i.e., c o n d A 1 [39].
For the nominal values in Table 2, the matrix A condition number is as follows:
c o n d A = 14
This indicates moderate sensitivity to slight parametric variation in A and b .
Using the variations in Table 2, the above condition number ranges from 13 to 15. The c o n d A does not indicate conditions that would cause an unstable system response. Such instability is expected if c o n d A were orders of magnitude larger than 1. The large condition number, however, indicates that the contact forces at L and R are reasonably insensitive to changes in parameters. In other words, slight deviations in the input vector b , such as those caused by the sensor measurement variations, will not cause significant deviations in the calculated contact forces at L and R.
Therefore, the forces at each contact patch of the laterally constrained wheelset can be independently resolved using a linear system derived from the equilibrium of forces and moments, along with a compatibility equation. This approach is valid if the reaction forces along the wheelset shaft can be determined, either indirectly via load cells—as intended for the VT-FRA roller rig—or through alternative methods, such as strain gauges mounted directly on the wheelset. The latter approach is adopted for measuring contact force in the field during motion, using an instrumented wheelset that employs strain gauges. Additionally, the constrained wheelset configuration offers a key advantage in accurately determining contact patch locations, which will directly affect the geometric variables in the coefficient matrix A . Unlike the field or roller rigs with unconstrained wheelsets, where the contact patch position is often uncertain, the constrained setup allows for precise identification of contact points. Since the linear system used to calculate contact forces depends directly on the contact locations (i.e., the geometric parameters in Table 2), their known values and low variations during the tests improve the accuracy and repeatability of the calculated forces.

4. Conclusions

A novel design for a roller rig with a laterally constrained and independently driven wheelset is provided. The described design extends the existing Virginia Tech–Federal Railroad Administration (VT-FRA) roller rig, which includes a single wheel and a roller. The new design employs two wheels (an axle set) and two rollers.
The redesigned rig is motivated by the need for test platforms that can replicate the curving dynamics of railcar axles in revenue service under highly controllable and repeatable conditions. The novel design described here enables precise control of creepage and creep forces at each wheel–rail contact, which is crucial for evaluating wheelset dynamics. The multiple degrees of freedom also enable testing with various angles of attack, lateral displacements, and cant angles between the wheelset and the rollers. The constrained wheelset configuration provides a balance between the actual field dynamics and the precision required for measuring the contact forces with high accuracy.
Additionally, due to the size difference between the two rollers, a contact patch distortion analysis was conducted, and an equalization factor was introduced to ensure symmetric longitudinal creep forces at the wheel–rail interfaces. Furthermore, a linear force calculation method incorporating equilibrium and compatibility equations was developed to independently solve the contact forces at each patch using existing sensor readings.
Overall, the setup is designed to deliver accurate and repeatable measurements while overcoming the geometric and mechanical constraints inherent in the original setup.
The key findings of the study are as follows:
  • A novel roller rig design is proposed to emulate wheelset dynamics using rollers with different diameters. Although contact patches on each wheel will inevitably differ due to contact mechanics, the proposed correction factors (CF) quantify these differences in contact patch distortion relative to a flat rail.
  • Similarly, for dynamic loading, a longitudinal creepage equalization factor, C γ , is derived to equalize the creep forces, accounting for the dissimilar contact patches between the wheel and roller at the two wheel–roller interfaces. The factor C γ quantifies the additional longitudinal creepage required on the smaller roller to match the larger roller.
  • Controlling the percentage creepage at each wheel is used to emulate the radius differential that exists in a high- and low-rail wheel in a curve. The analysis proved that the accuracy of emulating a curve with a given radius (or degree) is significantly influenced by minor deviations in changes in the percentage creepages. This implies that the drive motors must be controlled with extremely high precision to yield the required roller rotational velocity. The analysis further indicates that variations as small as 0.0525 RPM can cause errors as large as 2.78% in the emulated curve radius. The precise control of roller velocities, however, is deemed achievable in the proposed design due to the selection of state-of-the-art hardware and controllers that can meet the challenge.
  • The equivalent curve radius replicated by the roller rig is highly sensitive to the ratio between the rollers’ tangential velocity and the wheelset’s theoretical forward velocity.
  • Unlike unconstrained wheelsets in some earlier roller rig designs, the proposed constrained configuration improves the accuracy of the calculated contact forces by enabling precise determination of contact patch locations, which are critical inputs in solving for the contact forces.
  • Sensor measurement errors were found to have a minor effect on the calculated contact forces in a constrained wheelset, as confirmed by the condition number analysis of the linear system used to solve the force and moment equations.
This study contributes to experimental railway research by demonstrating how a laterally constrained wheelset can emulate the curving behavior of a conventional wheelset. The proposed design enables the precise control of the creepage on each wheel and independent measurement of contact forces with high accuracy, addressing key engineering challenges in replicating curving dynamics in the laboratory. Although the constrained configuration does not fully replicate the natural dynamics observed in the field, limiting its use for studying hunting behavior or studying railcar components, it provides a reliable laboratory platform for investigating curving behavior under controlled and repeatable conditions. Future efforts will focus on validating the design under dynamic curving scenarios by fabricating the rig and conducting tests. The efforts will also include analyzing how the angle of attack and lateral displacement affect creep forces generated at each wheel as they negotiate rails with dissimilar radii in a curve.

Author Contributions

Conceptualization, G.M., N.K., and M.A.; methodology, G.M.; software, G.M.; validation, G.M., N.K., and M.A.; formal analysis, G.M.; investigation, G.M. and N.K.; resources, M.A.; data curation, G.M. and N.K.; writing—original draft preparation, G.M.; writing—review and editing, N.K. and M.A.; supervision, M.A.; project administration, M.A.; funding acquisition, M.A. All authors have read and agreed to the published version of the manuscript.

Funding

This research was funded by the U.S. Department of Transportation (USDOT) and the Federal Railroad Administration’s Research, Development, and Technology (FRA RD&T) grant number 693JJ624C000045.

Data Availability Statement

The datasets presented in this article are not readily available because the data are part of an ongoing study. Requests to access the datasets should be directed to the authors.

Conflicts of Interest

The authors declare no conflicts of interest. The funders had no role in the design of the study; in the collection, analyses, or interpretation of data; in the writing of the manuscript; or in the decision to publish the results.

Abbreviations

The following abbreviations are used in this manuscript:
CFCorrection Factor
DoADegrees of Freedom
VT-FRAVirginia Tech—Federal Railroad Administration
WRIWheel–Rail Interface

Appendix A

Table A1. Description and units of variables used in this article.
VariableDescriptionUnits
A l , r Effective lateral curvature parameter, combining the curvatures of the wheel and roller in the X–Z plane for contact analysis[1/mm]
A x , y , z Reaction forces at the bearing ‘A’ (see Figure 6)[N]
a b l , r , t Contact   ellipse   parameter   a b   for   the   left   ( l ) ,   right   ( r )   roller ,   and   flat   rail   ( t ’)[mm2]
a Longitudinal ellipse dimension[mm]
B l , r Effective lateral curvature parameter, combining the curvatures of the wheel and roller in the Y–Z plane for contact analysis[1/mm]
B x , y , z Reaction forces at the bearing ‘B’ (see Figure 6)[N]
b Transversal ellipse dimension[mm]
C x , y , z Reaction forces at the shaft coupling ‘C’ (see Figure 6)[N]
C F a b   l , r , t Correction   factor   for   the   parameter   a b   for   the   left   ( l ) ,   right   ( r )   roller ,   and   flat   rail   ( t ’)[dimensionless]
c , d , e , f Geometric variables defined as illustrated in Figure 6[mm]
c 11 l , r   Creepage coefficient given in [34] for longitudinal creep force[dimensionless]
C γ Equalization factor defined by Equation (14)[dimensionless]
E Young modulus[Pa]
F x l , r Longitudinal   creep   forces   on   the   left   ( l )   and   right   ( r ’) contact patches [N]
F y l , r Lateral   creep   forces   on   the   left   ( l )   and   right   ( r ’) contact patches [N]
F z l , r Wheel   load   on   the   left   ( l )   and   right   ( r ’) contact patches [N]
G Shear Modulus[Pa]
l Half the distance between the contact patches on each wheel[mm]
m Tabulated correction factor used in Hertzian contact mechanics. See [36][dimensionless]
n Tabulated correction factor used in Hertzian contact mechanics. See [36] [dimensionless]
N Vertical load for calculating contact patch distortion[N]
R 0 Curve radius[m]
r w l , r Rolling   radius   of   the   left   ( l )   and   right   ( r ’) wheels[mm]
r r l , r Rolling   radius   of   the   left   ( l )   and   right   ( r ’) rollers[mm]
V Wheelset forward velocity[m/s]
V w l , r Tan gential   velocities   at   the   left   ( l )   and   right   ( r ’) wheels[m/s]
V r l , r Tan gential   velocities   at   the   left   ( l )   and   right   ( r ’) rollers[m/s]
α Angle of attack
γ x l , r Longitudinal creepage at the left (‘l’) and right (‘r’)
contact patches
[dimensionless]
γ y l , r Lateral creepage at the left (‘l’) and right (‘r’) contact patches[dimensionless]
ϵ Perturbation   on   the   V r r / V ratio[%]
υ Poisson’s ratio[dimensionless]

References

  1. Meymand, S.Z.; Craft, M.J.; Ahmadian, M. On the Application of Roller Rigs for Studying Rail Vehicle Systems. In Proceedings of the American Society of Mechanical Engineers, Rail Transportation Division (Publication) RTD, Altoona, PA, USA, 15–17 October 2013; American Society of Mechanical Engineers (ASME): New York, NY, USA, 2013. [Google Scholar]
  2. Myamlin, S.; Kalivoda, J.; Neduzha, L. Testing of Railway Vehicles Using Roller Rigs. Procedia Eng. 2017, 187, 688–695. [Google Scholar] [CrossRef]
  3. Wickens, A.H. Fundamentals of Rail Vehicle Dynamics: Guidance and Stability; Swets & Zeitlinger Publishers: Lisse, The Netherlands, 2005; ISBN 90-265-1946-X. [Google Scholar]
  4. Antali, M.; Stepan, G.; Hogan, S.J. Kinematic Oscillations of Railway Wheelsets. Multibody Syst. Dyn. 2015, 34, 259–274. [Google Scholar] [CrossRef]
  5. Powell, A.F.; Gräbe, P.J. Exploring the Relationship between Vertical and Lateral Forces, Speed and Superelevation in Railway Curves. J. S. Afr. Inst. Civ. Eng. 2017, 59, 25–35. [Google Scholar] [CrossRef]
  6. Meijaard, J.P. The Motion of a Railway Wheelset on a Track or on a Roller Rig. Procedia IUTAM 2016, 19, 274–281. [Google Scholar] [CrossRef]
  7. Hsu, S.S.; Huang, Z.; Iwnicki, S.D.; Thompson, D.J.; Jones, C.J.C.; Xie, G.; Allen, P.D. Experimental and Theoretical Investigation of Railway Wheel Squeal. Proc. Inst. Mech. Eng. F J. Rail Rapid Transit. 2007, 221, 59–73. [Google Scholar] [CrossRef]
  8. Ichiyanagi, Y.; Michitsuji, Y.; Matsumoto, A.; Sato, Y.; Ohno, H.; Ogata, S.; Tanimoto, M.; Fukushima, T.; Matsuda, T.; Shinagawa, D. Simulation-Based Estimation of Wheel/Rail Friction Coefficient and Wear Number Considering Results of Full-Scale Roller-Rig Test. Mech. Eng. J. 2023, 10, 22–00299. [Google Scholar] [CrossRef]
  9. Matsumoto, A.; Sato, Y.; Ono, H.; Wang, Y.; Yamamoto, M.; Tanimoto, M.; Oka, Y. Creep Force Characteristics between Rail and Wheel on Scaled Model. Wear 2002, 253, 199–203. [Google Scholar] [CrossRef]
  10. Kalousek, J. Development of a 1/8 Scale Dual Disc-an-Disc Railjwheel Wear Testing Facility. Can. Metall. Q. 1982, 21, 67–72. [Google Scholar] [CrossRef]
  11. Meymand, S.Z. State of the Art Roller Rig for Precise Evaluation of Wheel-Rail Contact Mechanics and Dynamics; Virginia Polytechnic Institute and State University: Blacksburg, VA, USA, 2015. [Google Scholar]
  12. Liu, W.; Jiang, R.; Liu, F.; Zhang, L.; Li, Y. Method of Curve Simulation of Railway Vehicle on Roller Rig. Jixie Gongcheng Xuebao/J. Mech. Eng. 2018, 54, 127–133. [Google Scholar] [CrossRef]
  13. Bruni, S.; Cheli, F.; Resta, F. A Model of an Actively Controlled Roller Rig for Tests on Full-Size Railway Wheelsets. Proc. Inst. Mech. Eng. F J. Rail Rapid Transit. 2001, 215, 277–288. [Google Scholar] [CrossRef]
  14. Gómez, E.; Alonso, A.; Giménez, J.G.; Vinolas, J. Railway Dynamometric Wheelsets: A Comparison of Existing Solutions and a Proposal for the Reduction of Measurement Errors. In Proceedings of the 1st International Workshop on High-Speed Railways (IWHIR), Berlin, Germany, 8–10 May 2012; Springer: Berlin/Heidelberg, Germany; Volume 2, pp. 261–284. [Google Scholar]
  15. Bracciali, A.; Cavaliere, F.; Macherelly, M. Review of Instrumented Wheelset Technology and Applications. In Proceedings of the Second International Conference on Railway Technology: Research, Development and Maintenance, Ajaccio, Corsica, France, 8–11 April 2014; Pombo, J., Ed.; Civil-Comp Press: Stirlingshire, UK, 2014. [Google Scholar] [CrossRef]
  16. AAR. Manual of Standards and Recommended Practices, Section C, Part II: Safety and Operations, Chapter 11; Association of American Railroads: Washington, DC, USA, 2007; Available online: https://aar.com/standards/ (accessed on 19 August 2025).
  17. EN 14363; Railway Applications–Testing for the Acceptance of Running Characteristics of Railway Vehicles–Testing of Running Behaviour and Stationary Tests. European Committee for Standardization: Brussels, Belgium, 2006. Available online: https://standards.iteh.ai/catalog/standards/cen/b3c41e35-9f1b-4f5c-9e0d-c1e91ad1915b/en-14363-2005 (accessed on 19 August 2025).
  18. Jin, X. A Measurement and Evaluation Method for Wheel-Rail Contact Forces and Axle Stresses of High-Speed Train. Measurement 2020, 149, 106983. [Google Scholar] [CrossRef]
  19. Eadie, D.T.; Elvidge, D.; Oldknow, K.; Stock, R.; Pointner, P.; Kalousek, J.; Klauser, P. The Effects of Top of Rail Friction Modifier on Wear and Rolling Contact Fatigue: Full-Scale Rail-Wheel Test Rig Evaluation, Analysis and Modelling. Wear 2008, 265, 1222–1230. [Google Scholar] [CrossRef]
  20. Tournay, H.; Shu, X.; Keylin, A.; Cakdi, S. Investigation of Wheel and Rail Rolling Contact Fatigue Using a Full-Scale Simulator; Technical Report DOT/FRA/ORD-22/13; Transportation Technology Center, Inc.: Pueblo, CO, USA, March 2022. Available online: https://railroads.dot.gov/elibrary/investigation-wheel-and-rail-rolling-contact-fatigue-using-full-scale-simulator (accessed on 19 August 2025).
  21. Ahmadian, M.; Craft, M. Evaluation of Wheel/Rail Contact Mechanics: Concepts Report; Technical Report DOT/FRA/ORD-14/28; Center for Vehicle Systems and Safety, Virginia Tech: Blacksburg, VA, USA, July 2014. Available online: https://railroads.dot.gov/elibrary/evaluation-wheelrail-contact-mechanics-concepts-report (accessed on 19 August 2025).
  22. Kumar, N.; Radmehr, A.; Ahmadian, M. Experimental Evaluation of Effect of Leaves on Railroad Tracks in Loss of Braking. Machines 2024, 12, 301. [Google Scholar] [CrossRef]
  23. Kumar, N.; Radmehr, A.; Ahmadian, M. Traction Enhancement Evaluation of Magnetite and Alumina. Int. J. Rail Transp. 2025, 13, 1–19. [Google Scholar] [CrossRef]
  24. Radmehr, A.; Pan, Y.; Tajaddini, A.; Vollebregt, E.; Ahmadian, M. Wheel-Rail Contact Force and Traction Analysis Under Wet and Oil-Contaminated Conditions. In Proceedings of the 2022 ASME Joint Rail Conference (JRC2022), Baltimore, MD, USA, 19–21 April 2022; ASME: New York, NY, USA, 2022. Paper No. JRC2022-78233. Available online: https://doi.org/10.1115/JRC2022-78233 (accessed on 19 August 2025).
  25. Radmehr, A.; Kothari, K.; Ahmadian, M. Evaluating the Effect of Natural Third Body Layers on Friction Using the Virginia Tech Roller Rig. In Proceedings of the 2019 ASME Joint Rail Conference (JRC2019), Snowbird, UT, USA, 10–12 April 2019; ASME: New York, NY, USA, 2019. Paper No. JRC2019-1292. Available online: https://doi.org/10.1115/JRC2019-1292 (accessed on 19 August 2025).
  26. Hosseini, S.M.; Radmehr, A.; Hosseinian Ahangarnejad, A.; Gramacy, R.B.; Ahmadian, M. A Statistical Evaluation of Multiple Regression Models for Contact Dynamics in Rail Vehicles Using Roller Rig Data. Int. J. Rail Transp. 2022, 10, 717–729. [Google Scholar] [CrossRef]
  27. Kumar, N.; Tech, V.; Mantovani, G.; Radmehr, A.; Ahmadian, M. Estimation of Wheel-Rail Contact Patch Geometry Under Curving Conditions. In Proceedings of the AREMA 2024 Annual Conference & Expo, Louisville, KY, USA, 30 September 2024. [Google Scholar] [CrossRef]
  28. Radmehr, A.; Ahmadian, M. Real-Time Wheel Wear Estimation Using Non-Contact Measurements. In Proceedings of the 20th International Wheelset Congress (IWC), Chicago, IL, USA, 8–11 May 2023; Available online: https://doi.org/10.1115/JRC2022-78233 (accessed on 19 August 2025).
  29. Thomson Industries. PC Series, Precision Linear Actuators; Thomson Industries: Radford, VA, USA, 2021; Available online: https://www.thomsonlinear.com/en/products/precision-linear-actuators/pc-series (accessed on 19 August 2025).
  30. Meymand, S.Z.; Hosseinipour, M.; Ahmadian, M. The Development of a Roller Rig for Experimental Evaluation of Contact Mechanics for Railway Vehicles. In Proceedings of the 2015 Joint Rail Conference, San Jose, CA, USA, 23 March 2015. [Google Scholar]
  31. Keylin, A.; Ahmadian, M.; Taheri, M.; Tajaddini, A. Wheel-Rail Contact Characteristics on a Tangent Track vs. a Roller Rig. In Proceedings of the ASME 2012 Rail Transportation Division Fall Technical Conference, Omaha, NA, USA, 16–18 October 2012. [Google Scholar]
  32. Kollmorgen Corporation. AKM2G Series Servo Motors; Kollmorgen Corporation: Radford, VA, USA, 2022; Available online: https://www.kollmorgen.com/en-us/products/motors/servo/akm-series/akm2g/akm2g-servo-motor (accessed on 19 August 2025).
  33. Hosseinipour, M.; Vick, B.; Taheri, S.; Mirzaeifar, R. Electromechanical Design and Development of the Virginia Tech Roller Rig Testing Facility for Performing Various Studies on Wheel-Rail Contact Mechanics and Dynamics. Ph.D. Dissertation, Virginia Polytechnic Institute and State University, Blacksburg, VA, USA, 2016. Available online: http://hdl.handle.net/10919/82542 (accessed on 19 August 2025).
  34. Kalker, J.J. Wheel-Rail Rolling Contact Theory. Wear 1991, 144, 243–261. [Google Scholar] [CrossRef]
  35. Keylin, A. Analytical Evaluation of the Accuracy of Roller Rig Data for Studying Creepage in Rail Vehicles; Virginia Polytechnic Institute and State University: Blacksburg, VA, USA, 2012. [Google Scholar]
  36. Iwnicki, S. Handbook of Railway Vehicle Dynamics, 1st ed.; CRC Press: Boca Raton, FL, USA, 2006; ISBN 9780429129803. [Google Scholar]
  37. Hibbeler, R.C. Mechanics of Materials; Trimer, R., Ed.; Pearson: London, UK, 2010; pp. 85–116. ISBN 978-85-7605-373-6. [Google Scholar]
  38. Kistler Group. Technical Data Sheet: 3-Component Quartz Force Sensor Type 9027C, 9028C, Type 9027C, 9028C, 9026C4; Kistler Group: Winterthur, Switzerland, 2020. [Google Scholar]
  39. Deif, A. Sensitivity Analysis in Linear Systems; Springer: Berlin/Heidelberg, Germany, 1986. [Google Scholar]
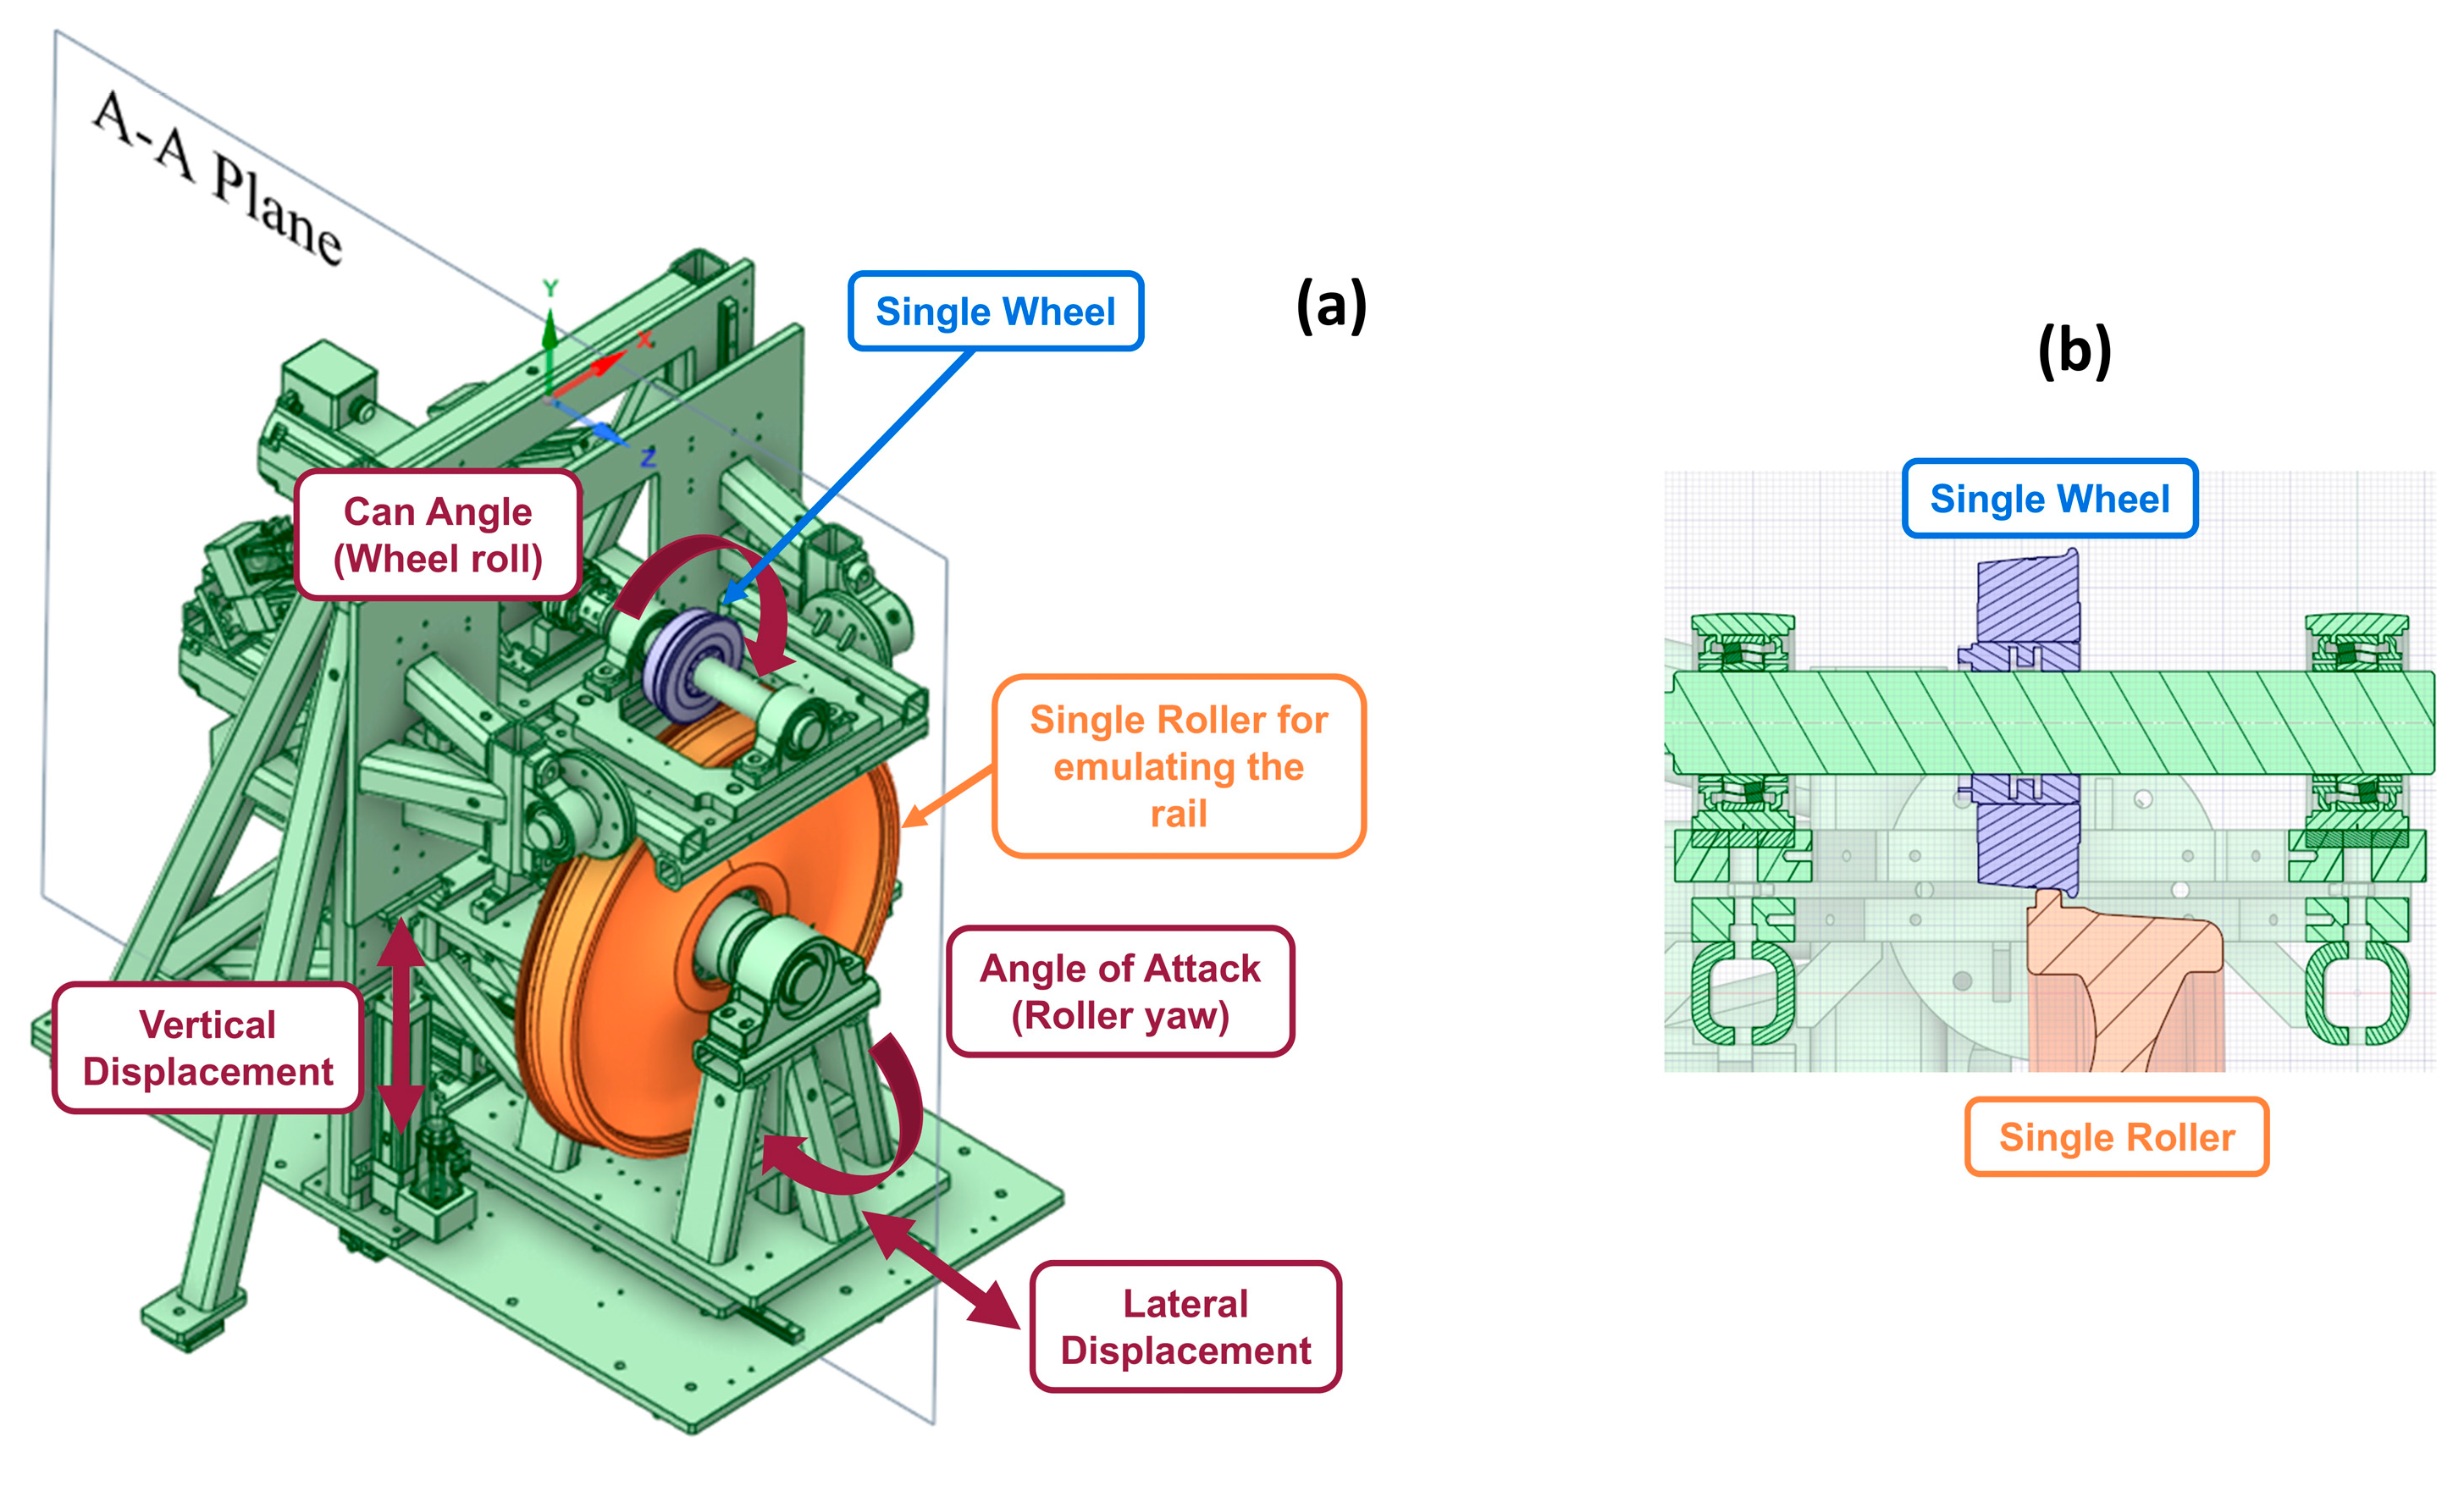
Figure 1. (a) CAD model of the VT-FRA roller rig with its degrees of freedom, with the frame in green, the roller in orange, and the wheel in blue, and (b) cross-sectional view of “A-A plane” highlighting the single wheel (blue) and roller (orange).
Designs 09 00099 g001
Figure 2. CAD model highlighting the motor dynamometer on the left, the wheel dynamometer on the right in red. Eight piezoelectric sensors are mounted on the platforms: S 1 through S 4   on the wheel dynamometer and S 5 through S 8   on the motor dynamometer.
Designs 09 00099 g002
Figure 3. Setup to enable wheelset curving emulation; (a) Y-Z plane view of constrained wheelset and three independent drive motors; (b) X-Z plane view of left and right wheel–roller contact pairs as viewed in cross-sections A-A and B-B; (c) X-Y plane view of angle of attack (AoA) between the wheel and roller (rail) as it occurs in a curve.
Designs 09 00099 g003
Figure 4. Contact patch ellipse distortion comparison between the left roller (blue), right roller (orange), and the tangent track (yellow), and the respective correction factors.
Designs 09 00099 g004
Figure 5. Curved track emulation precision on the VT-FRA roller rig using a cylindrical wheel with zero angle of attack and cant angle: (a) comparison between the commanded and measured roller velocity; (b) linear change in the wheel commanded velocity.
Designs 09 00099 g005
Figure 6. Wheelset free body diagram illustration: (a) CAD model of the wheelset showing the reaction points at the supports (A, B and C in red) and roller contact (L and R in red); (b) corresponding wheelset free body diagram.
Designs 09 00099 g006
Table 1. Calculated root mean square (RMS) error for multiple sections of the roller rig data.
Section NumberTime Range [sec]Creepage Range [%] R M S e r r o r
[rpm][%] of Actual Value
10 to 30 s+2% to +1%0.04860.34%
230 s to 60 s+1% to 0%0.02900.20%
360 s to 90 s0% to −1%0.02620.18%
490 s to 120 s−1% to −2%0.05250.37%
50 to 120 s+2% to −2%0.04070.29%
645 s to 75 s+0.5% to −0.5%0.01500.11%
750 s to 70 s+0.33% to −0.33%0.00960.07%
Table 2. Geometric parameters, nominal values, and maximum variations.
VariablesNominal Value [mm]Maximum Variation [mm]
c 166 ± 10
d 158 ± 10
e133 ± 10
f 1400
r w l 122 ± 5
r w r 122 ± 5
Disclaimer/Publisher’s Note: The statements, opinions and data contained in all publications are solely those of the individual author(s) and contributor(s) and not of MDPI and/or the editor(s). MDPI and/or the editor(s) disclaim responsibility for any injury to people or property resulting from any ideas, methods, instructions or products referred to in the content.