1. Introduction
Water is essential for human progress and its sustainability, with rivers and lakes being the primary source of fresh water. Water quality variations are caused by informal industrial activities, domestic drainage systems, precipitation, and other wild and geological phenomena [
1,
2,
3], affecting the entire ecosystems where fish and bacterial diversity play a major role [
4,
5]. This evidence warns society and farming about public health risks; when monitoring is carried out sporadically, it can miss problems, but frequent monitoring helps catch issues early and store the data safely instead of in easily lost files [
6].
There are different instruments to measure water quality, although the majority are used for discontinuous monitoring; a viable option is IoT devices developed in the previous decade. In this context, the authors of [
7] proposed a collaborative network of mobile devices and portable sensors distributed in a river, utilizing an algorithm that manages information to provide a more precise diagnosis of the river quality. Multiple measurement sites make it easier to diagnose freshwater issues and target affected areas. Likewise, the authors of [
8,
9] propose a sensor network with Wi-Fi access through the ESP8266 and Arduino modules, very popular and cheap components for IoT applications. Researchers [
10] present iDroneboat, an Unmanned Surface Vessel (USV) equipped with LTE and GPS connections. It features remote control and geolocation capabilities, designed for navigation in still waters at a competitive price. Such systems often encounter challenges in energy; however, in [
11], a sample module using LTE and GPS was designed at a low cost and powered by solar panels that can operate for up to 18 months without intervention. However, some designs contain LTE internet access, which may be limited in areas with poor coverage, as observed in some parts of Peru. In [
12], a monitoring system is described that is based on LoRa with a range of up to 20 km; hence, enhancing coverage for adaptation to challenging terrains. Additionally, these systems monitor surface water, ignoring possible contaminating agents at the bottom of water bodies. On the other hand, not much is known about fully submersible prototypes. For instance, it was designed as a prototype that can be submerged up to 40 m and could add IoT-compatible connectivity [
13], while another device uses solar panels to power itself and can detect pathogenic bacteria [
14] but does not have a system to measure the position in case water currents displace it from its original location. In spite of there being devices for submersion for other purposes, like sediment collection [
15,
16,
17], these cannot monitor water quality while sailing.
With the information mentioned, LoRa was used to optimize range and avoid dependence on LTE connectivity. The goal of LoRa network designs is energy optimization. LoRa has key parameters for efficient transmission; in [
18], it gives key points for parameter selection from the 6720 possible configurations. A form of static optimization is presented in [
19] using a stochastic analysis that adjusts transmission power based on device density. The authors in [
20] make a comparable contribution. They demonstrate energy conservation in tree topologies by sequentially selecting repeater nodes and configuring them according to their RSSI levels. However, it takes a long time to set everything up.
This article presents a fully submersible sensor module (SSM) that can measure key water quality parameters such as pH, turbidity, total dissolved solids (TDSs), temperature, and battery life. The SSM will also have a gyroscope and accelerometer to determine its inclination and angular velocity, useful data in more turbulent rivers if the module is affected by the current, or it can also be used for positional analysis on sediment collectors that lack this feature.
In addition, the network is composed of a repeater and a gateway, allowing for better coverage in harder-to-reach areas. The present work will concentrate on enhancing transmission power with an asynchronous algorithm, enabling the gateway and repeater to simultaneously transmit and receive RSSI packets. This method, although aligned with the previously stated works, has the benefit of concurrent configuration, potentially enhancing adaptability and efficiency in dynamic settings.
The structure of the article is as follows:
Section 1 reviews work related to water quality sensors and wireless monitoring networks.
Section 2 describes the hardware and architecture used.
Section 3 details the embedded system and communication management, followed by an experimental evaluation in
Section 4.
2. Related Works
Water quality monitoring using real-time sensors has been widely studied in the last decade. Many designs share the same hardware but with different microcontrollers (MCUs), most notably the ESP32 and Arduino (the latter being the most widely used). Multiple connectivity protocols have been explored, including Bluetooth for lake sampling [
10] and LTE with GPS for broad coverage [
11]. Other technologies such as WiFi, MQTT, Zigbee, and WiMAX are limited to short-range areas and, with higher speeds, are typically used for data transfer to end users. A notable example is the work of [
21], which used a 100-node mesh, a complex and expensive network. In contrast, LoRa is emerging as a versatile solution for private networks, with a range of up to 45 km in rural areas and less expensive to implement than alternatives such as NB-IoT or SigFox [
22].
Structural designs vary depending on the application, being divided into mobile and stationary. Among the former, prototypes such as the low-cost USV controlled by Bluetooth and GPS tracking [
10] stand out. This device is used to monitor Lake Tuti (Peru), with the information stored in a mobile application. This design can be used for locations that do not require real-time monitoring. USVs are typically used for specific studies or for more complex control that combines multiple technologies [
6]. An ESP32-LoRa-based solution was tested in Sungai Pantai (Malaysia), which integrates ThingSpeak for data analysis and includes solar panels for autonomy [
23].
Regarding stationary designs, there are systems such as [
11] that utilize Arduino. This integrates a 3G module for connectivity, which requires the area to be monitored to have internet access. While alternatives such as LoRa, due to its long range and energy efficiency, provide the same purpose, making it an attractive option for monitoring projects. This is the case of the authors of [
12], who monitored the waters of the Jamor River in Portugal at various sites throughout the city and obtained positive results.
The aforementioned works have the peculiarity of operating in low-turbulence or practically static environments, ideal for USVs. However, for more dynamic water flow environments, it is preferable to employ stationary submersible designs with movement or position variables for monitoring, since the most critical turbulence occurs near the surface.
3. Materials and System Design
Three main elements comprise the system: the SSM, the LoRa repeater (LRR), and the gateway. A tree topology was chosen for connectivity to increase its range in more rugged areas commonly seen in Peru.
Figure 1 shows the planned topology and its scalability for larger projects. The article will detail each of these elements. In addition,
Table 1 specifies the components used in the project along with their respective prices, making it a viable alternative for implementation and scalability in terms of the number of nodes. The manage of data from the sensors node and the repeater are handled by a Raspberry Pi Pico (RPP), while the gateway is handled by a Raspberry Pi 4 (RP4).
Both devices offer high performance at a low price and low power consumption. On the one hand, the RPP has multiple serial communication ports and also a built-in 12-bit analog-to-digital converter. On the other hand, the RP4 integrates GPIO ports and has a large computing capacity, making it ideal for managing multiple tasks simultaneously. Furthermore, both can be developed using a very versatile and powerful language.
On the other hand, Django 5.1.1v, a widely utilized framework for backend web development, was employed. As a Python 3.11.6 framework, it seamlessly integrates the MQTT protocol, enabling the management and analysis of transmitted data. This article will not elaborate on this issue due to the abundance of material available regarding web development.
3.1. Sensor Module Design
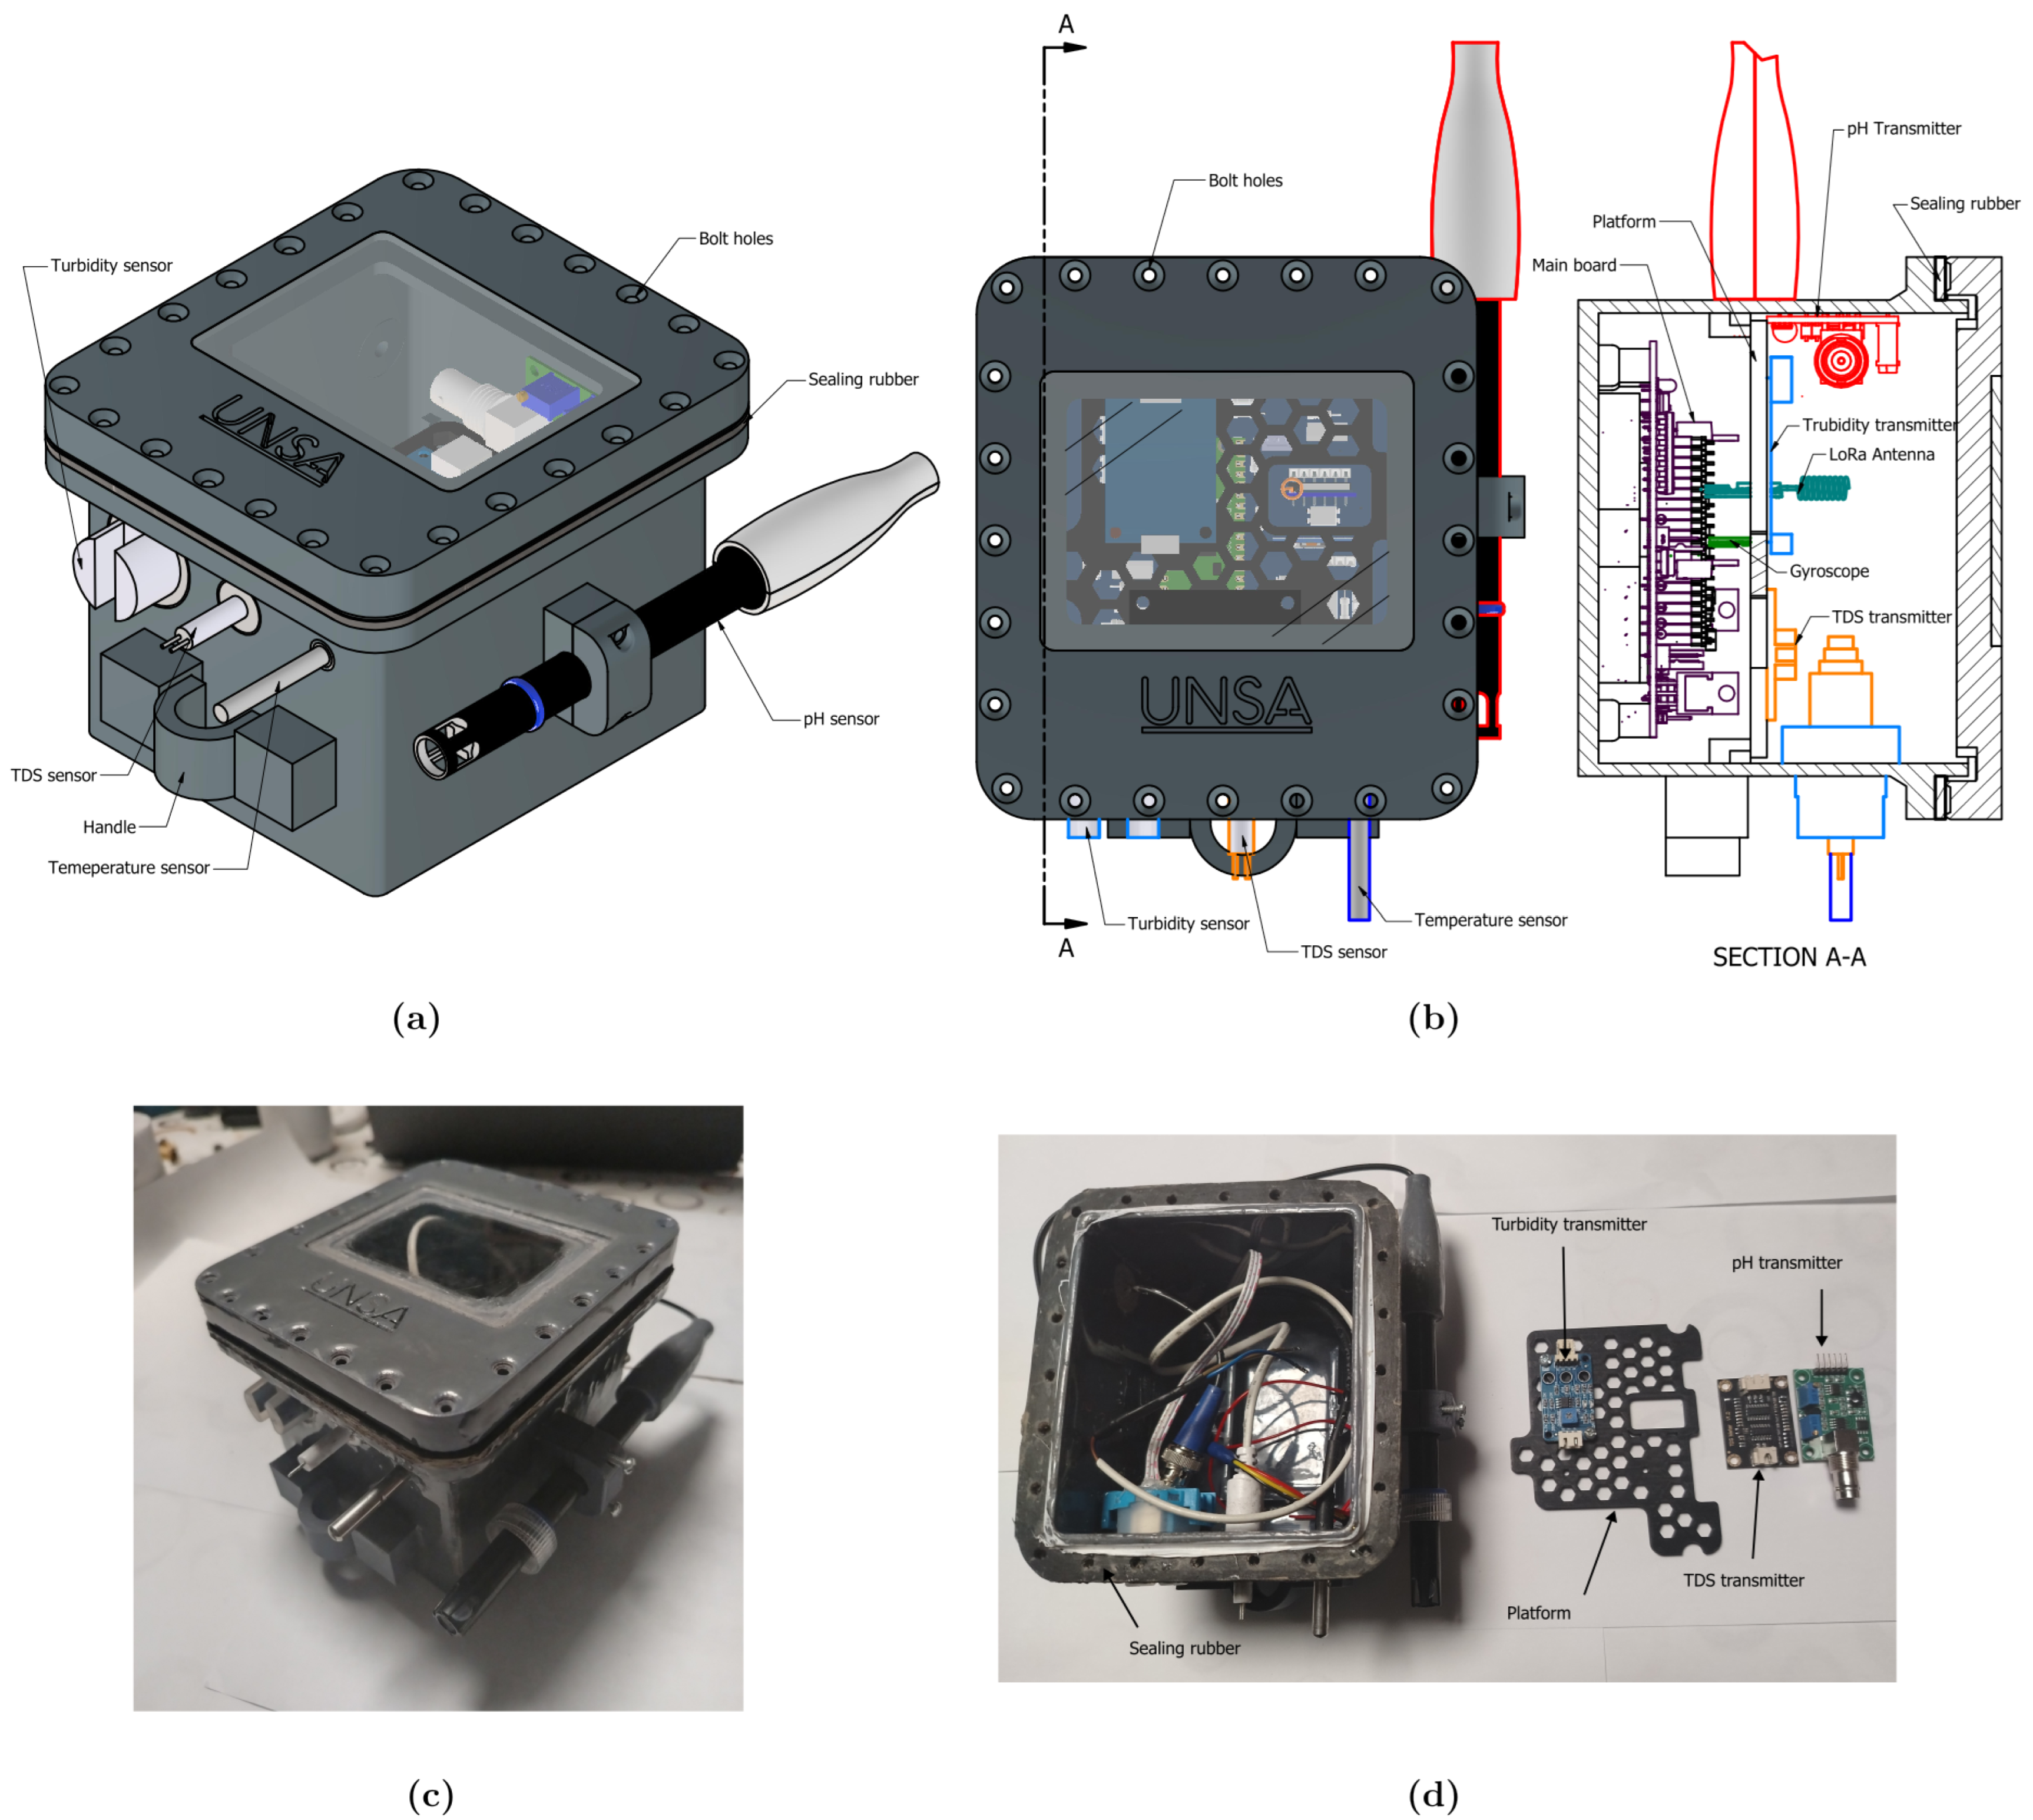
The module was fabricated by 3D printing, employing PLA+ for its superior strength and printing convenience. The sensors (pH, TDS, turbidity, and temperature listed in
Table 1) extend from the module, oriented downwards. It also has a cover with holes for bolting and a small window to view the operating indicators of the circuits inside. A second level was incorporated to accommodate the sensor transmitters, as illustrated in
Figure 2, which depicts the design drawing with its components. Additionally, the SSM is energized by a solar panel during daylight hours and is equipped with two 3.7 V 1400 mAh batteries arranged in parallel for nocturnal functionality.
The RPP has a 3.3 V regulator that will be used to power the main modules, such as the LoRa antenna and the gyroscope, because these modules use a communication protocol (UART and I2C, respectively). To ensure that the entire circuit is energized, the remaining modules will obtain power directly from the battery with a voltage reduction to provide a 3.3 V supply. Therefore, the modules will have an analog output ranging from 0 to 3.3 V, corresponding to the operating range of the RPP analog channels. On the other hand, the RPP’s problem is its limited analog channels. Two of them will be used to read the TDS and turbidity sensors, leaving one available for two analog signals (pH and battery level). To solve this problem, the CD4051BD integrated circuit will be used, which allows one analog channel to be multiplexed into four channels, making it easy to add more sensors. Moreover, dip switches on the board enable the selection of various operating modes for data transmission.
3.2. Repeater Desing
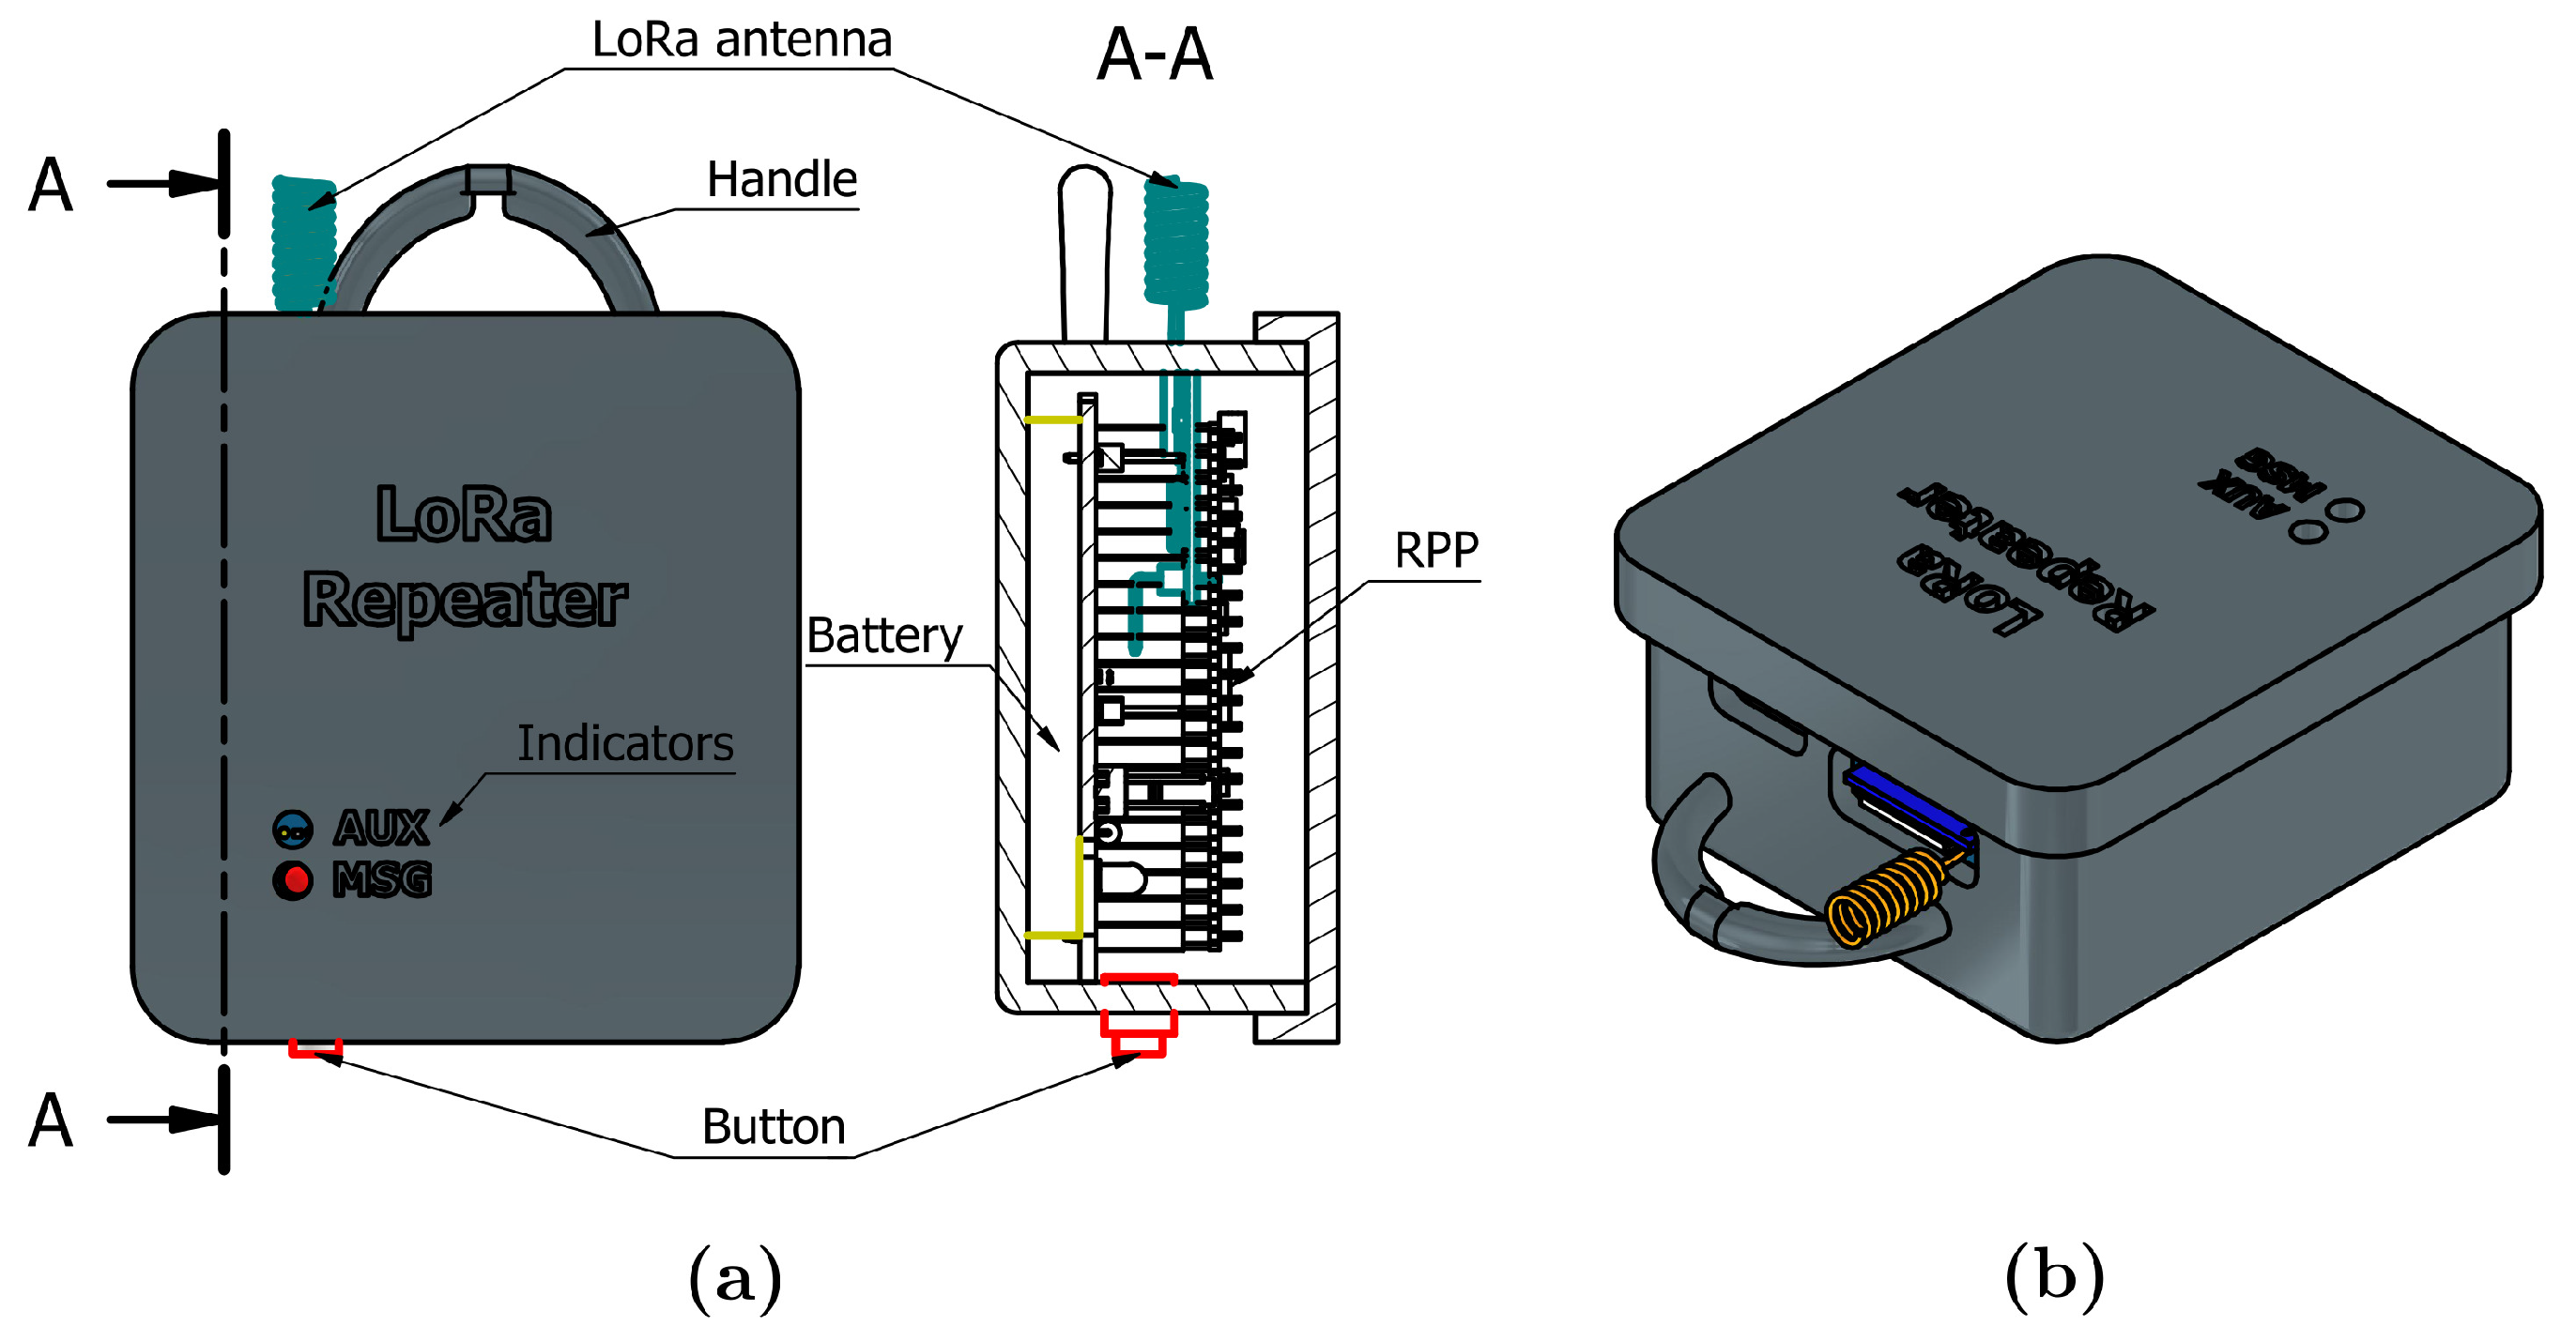
The repeater design is simpler than the previous node; it is smaller due to the number of components inside, as shown in
Figure 3. It includes a button for dynamic power configuration with the gateway, indicator LEDs for message reception and transmission, and a 3.7 V battery.
3.3. Gateway Design
The gateway also has a simple design, featuring only the LoRa antenna, a button for dynamic configuration with the repeater, and LED indicators for reception data via LoRa and publication data via MQTT.
4. Embedded Systems and Communication Management
This section will discuss the firmware of each node in the system and the dynamic configuration of transmission power between the repeater and the gateway based on RSSI values. Furthermore, data encryption was not used in the LoRa network, but rather a generic format based on tags and values was chosen to facilitate debugging. This decision does not represent a limitation in terms of payload size, since the antenna used supports up to 240 bytes per packet. However, it is well known that the lower the transmission data, the lower the energy load. For this reason, encryption is recommended for larger-scale networks because the repeaters will have greater energy consumption.
4.1. Data Acquisition and Processing
The selection of sensors was based on their availability, cost, and compatibility with open platforms, identical or equivalent models that have reported satisfactory performance in projects similar to this one [
8,
10,
23].
To acquire data from each sensor, a processing algorithm based on the reordering and filtering technique was implemented, 10 consecutive ADC readings were taken, which were then ordered to obtain the median, which allows eliminating outliers and noise in the measurements. Each sensor has an operating curve, in the case of the TDS sensor used, the authors of said sensor [
24] designed it with the possibility of operating at 3.3 V, so an adjustment in its behavior was not necessary as is also the case with the pH sensor [
25], contrary to the turbidity sensor [
26] since it is designed to be powered exclusively by 5 V (planned by Arduino), as well as not having a linear response, a program written in Python was made to perform a quadratic regression, shown in
Figure 4 for the new operating voltage of 3.3 V, obtaining a corrected Equation (
1) that allows an accurate conversion of the measured values, in the
Table 2 the voltages measured by the RPP and the turbidity value measured by the Arduino were placed.
Table 2.
Taking turbidity samples to generate a reaction curve.
Table 2.
Taking turbidity samples to generate a reaction curve.
| | Sample 1 | Sample 2 | Sample 3 | Sample 4 | Sample 5 |
|---|
| Voltage (RPP) | 1.95 | 1.932 | 1.9 | 1.879 | 1.627 |
| Turbidity (Arduino) | 0.3 | 2.1 | 213 | 739.95 | 2275.08 |
where
Figure 4.
The values were previously taken with a controller that supports 5 V power supply and then quadratic regression was performed with the RPP values.
Figure 4.
The values were previously taken with a controller that supports 5 V power supply and then quadratic regression was performed with the RPP values.
The battery used is 3.7 V, with a maximum voltage of 4 V and a voltage divider was used, with commercial resistances, to reduce the voltage to values readable by the RPP, and the equation of the straight line was found to convert the voltage to battery percentage, which is presented in Equation (
2).
where
is the voltage of the lithium battery.
The chosen resistances are kΩ and kΩ.
is the percentage of the battery.
The RPP sends angular velocity and tilt angle data from the SSM. The tilt angle was determined using the X and Y axes, as the SSM must be positioned downwards according to the electronic board design. Furthermore, the SSM is subject to a structure that restricts its rotation with respect to the Z axis, which allows any tilt on that axis to be ruled out. On the other hand, the equations used for the tilt angle transformation are based on trigonometric ratios applied to the acceleration values obtained from the accelerometer.
where
is the angle of inclination on the X axis;
is the angle of inclination on the Y axis;
is the acceleration measured on the X axis;
is the acceleration measured on the Y axis;
is the acceleration measured on the Z axis.
As initially mentioned, the SSM consists of 3 operating modes that are interchangeable with each other; a program flow diagram is presented in
Figure 5. The first mode emphasizes continuous data transmission to the LRR at brief intervals to obtain real-time information; however, this mode is subject to governmental regulations in the region of the prototype’s implementation, as the interval between messages is predetermined. In the second mode, position and angular velocity data are sent constantly at 1 s intervals, while sensor data is sent every 5 s. This value was chosen for practical purposes; however, it can be changed as needed. In the third mode, messages are routed directly to the gateway without going through the LRR.
4.2. Dynamic Communication and Power Adjustment
For the LRR, power consumption is vital since this node is continuously receiving and retransmitting data to the gateway, since transmission power plays a fundamental role in system efficiency. To optimize energy consumption, an algorithm was designed that can dynamically configure this power (both for the repeater and the gateway). The gateway configuration is also important since a high level increases unnecessary energy consumption. For this reason, adjusting the power of both nodes allows maintaining a balance between range and energy efficiency.
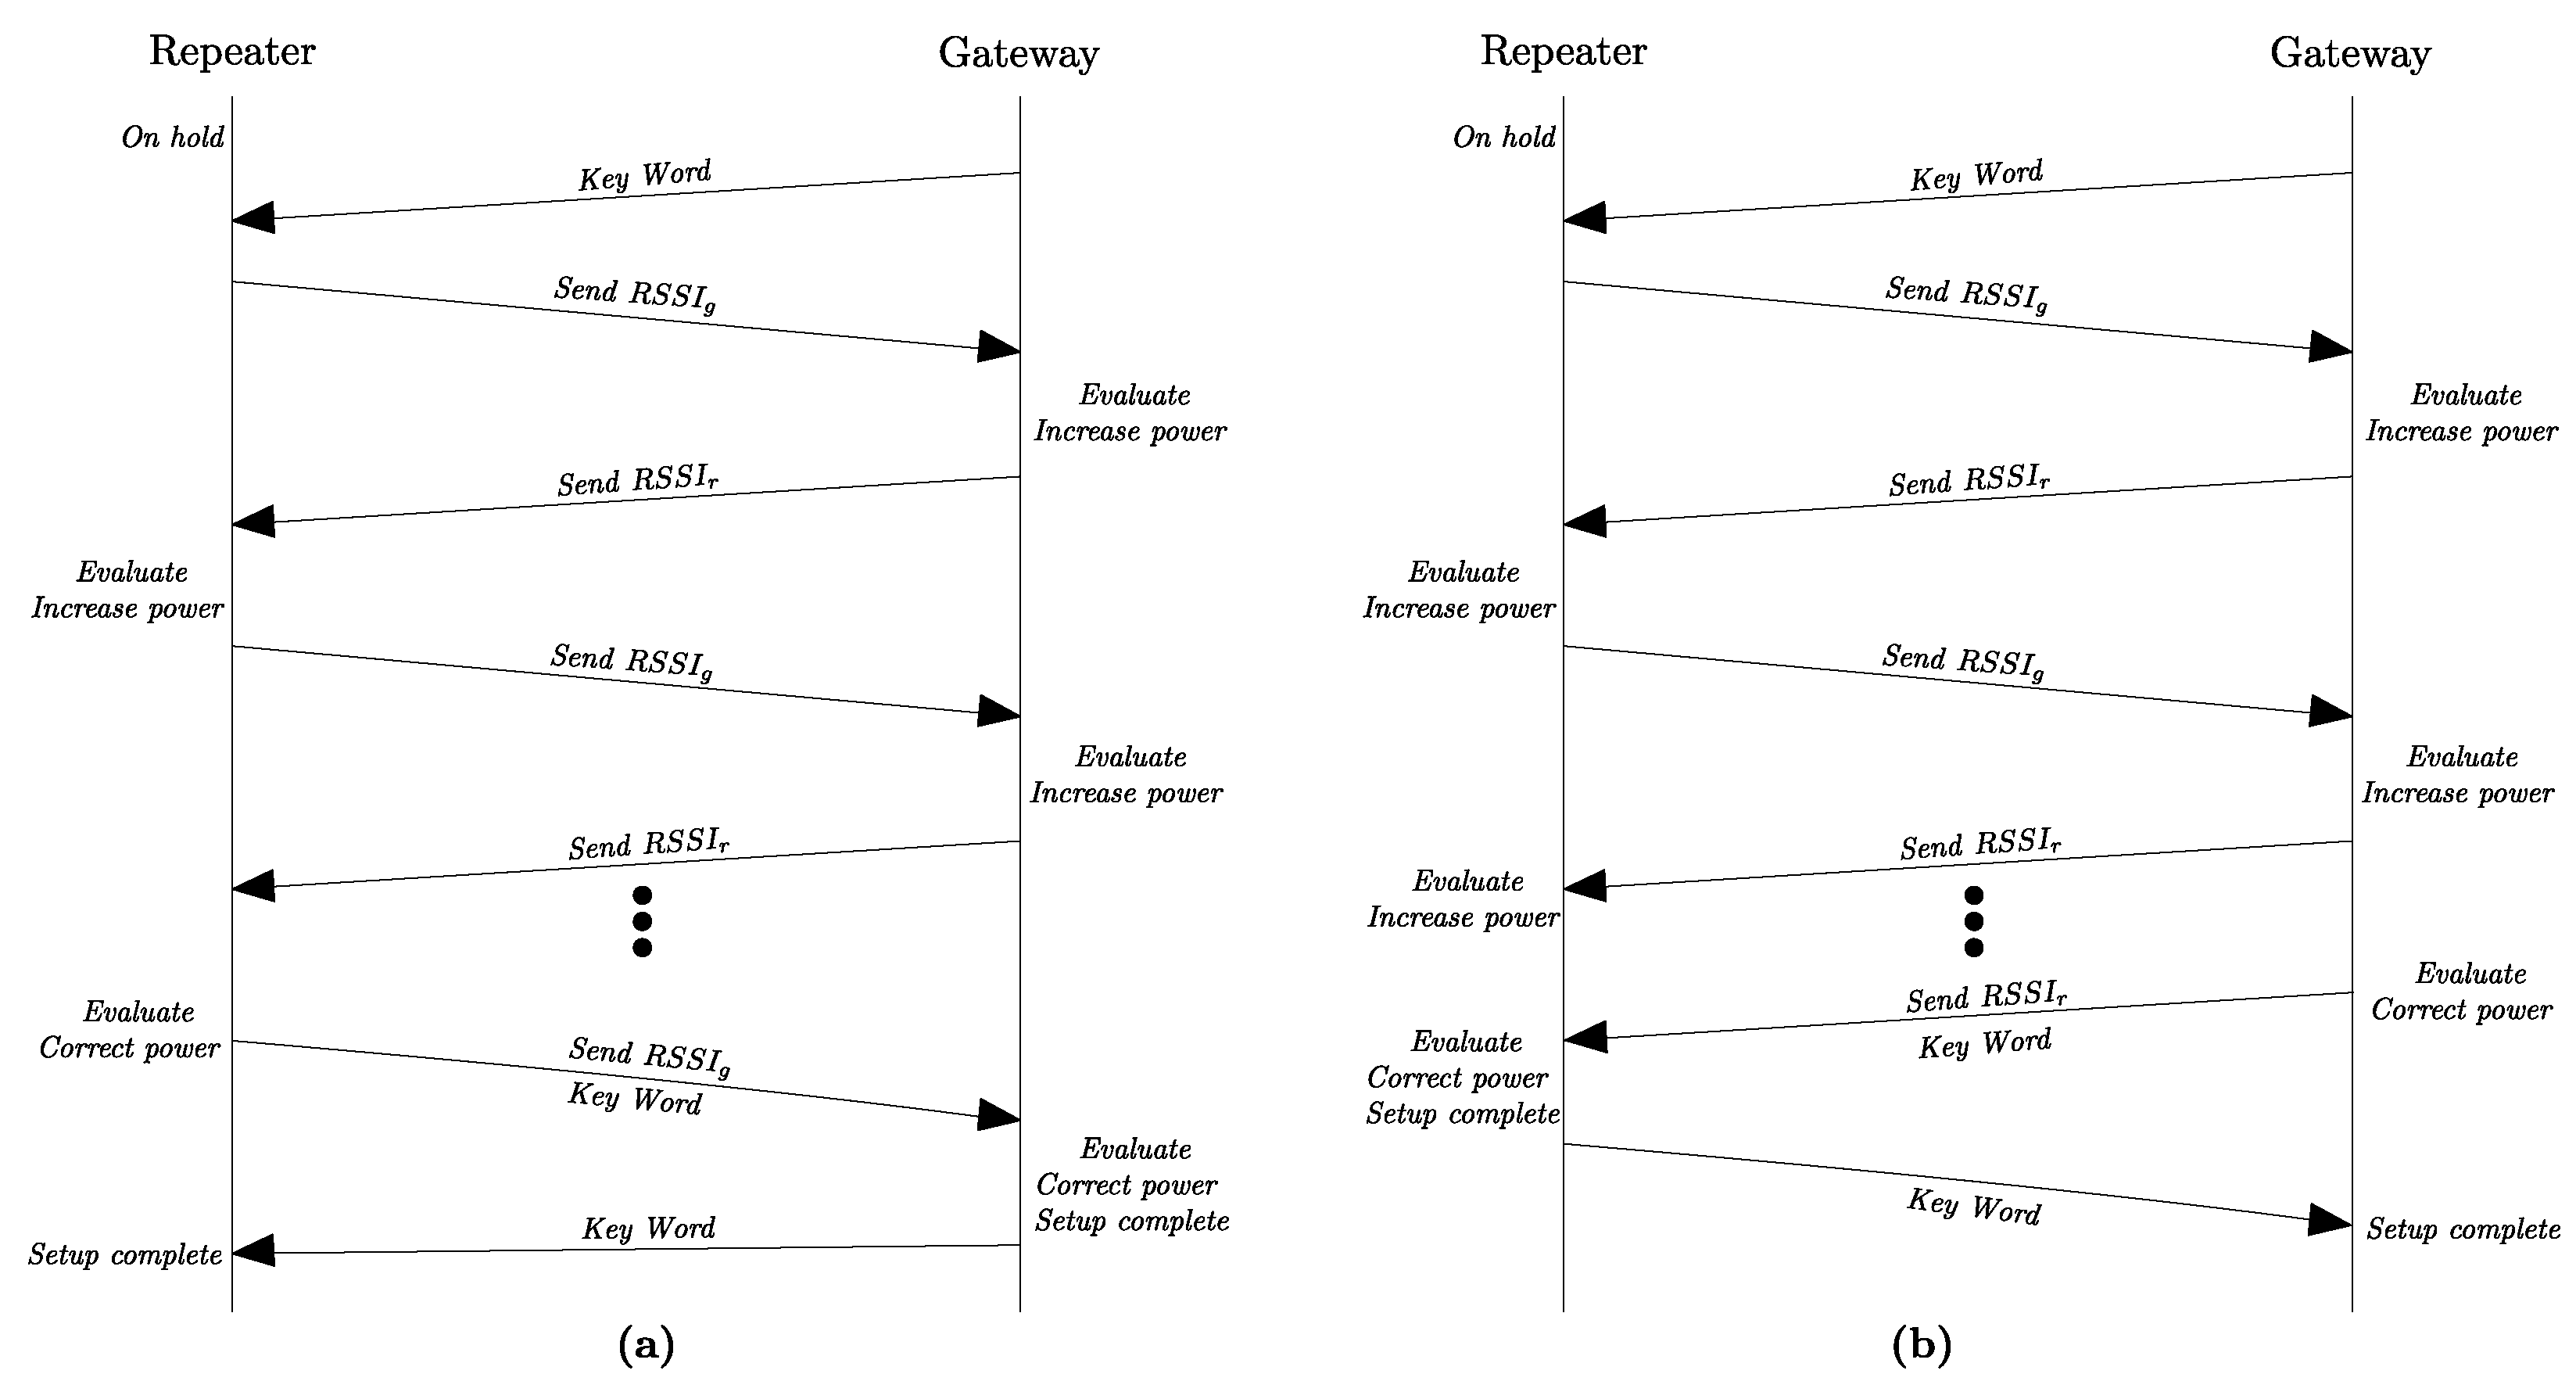
Figure 6 shows the algorithm flow with its two possible configuration cases. On the repeater side, the program starts when the button is pressed, waiting for a keyword from the gateway. Likewise, the gateway sends said word when its corresponding button is pressed. Based on these values, both evaluate the signal quality and adjust their transmission power until reaching an optimal level. If the power reaches a maximum value, the algorithm stops and sends an alert message indicating that it was not configured. In this way, the LRR location can be modified. On the other hand, for greater robustness in this process, 5 consecutive messages are sent in case there is a loss, with the aim of mitigating possible losses caused by external factors, such as obstacles in urban environments that interfere with signal propagation or irregular topography in rural areas, where rugged geography can affect the quality of communication.
It is important to know that there is a timeout between RSSI exchanges. If the power isn’t sufficient, the message won’t be received due to obstacles such as buildings, trees, or hills, leaving it in a permanent standby state. In these cases, the power will increase until the messages are received or until the maximum power is reached, and an alarm will be returned.
In [
27], it warns us about the sensitivity of LoRa to environmental conditions in dense urban areas, where a spreading factor (SF) of 12 was used; however, in the town of Arequipa, it was decided to use an SF of 10 considering the rainy season.
In order to have an efficient timeout, the Time on Air must be calculated. First, the symbol time is calculated with Equation (
5):
where
Then the preamble time is calculated with Equation (
6):
where
In Equation (
7) the total number of symbols in the payload is calculated (which may or may not be followed by the CRC), in the configuration the maximum number of bytes is 21 for the keyword.
where
is the number of payload bytes;
is the spreading factor between 7 and 12;
when the header is enabled, and when no header is present;
when low data rate optimization is enable, and when disabled;
is the coding rate between 1 and 4.
The total packet transmission time (Time on Air) is given by Equation (
8), this time can also be meant as the minimum time that has to be waited between messages:
where
is the Time on Air;
is the preamble period;
is the symbol period;
is the number of symbols;
The parameters assigned to the antenna are given in
Table 3, where a Time on Air (
) is obtained of 362.5 ms between each configuration message; 150 ms has been added to ensure proper functioning. On the other hand, if the duty cycle imposed by the radio spectrum regulations of some regions is considered, this time must be taken into account.
4.3. Data Transmission and Server Integration
In IoT applications, data transmission to the server is commonly achieved through the MQTT protocol, using a broker as an intermediary to manage communication between devices. There are several broker alternatives, but for limited environments, a highly efficient one is needed, which is why Mosquitto is the best option [
28]. However, if you plan to use a larger number of subscriptions and publications, the EMQX broker is an excellent option, as it offers advantages in terms of high concurrency and low latency [
29]. Mosquitto is efficiency led to its use as a broker.
In other words, this task entails the gateway acquiring data (including sensor measurements or positional and velocity information), breaking it down, and publishing it into specific topics. This approach enables the server to process each type of data autonomously and efficiently.
5. Results and Discussion
This section presents the results of the tests performed on each node and the system as a whole. First, the performance of the SSM was evaluated separately in the field, followed by the dynamic configuration of the antennas. Subsequently, integrated tests were conducted on the Chili River in the city of Arequipa, Peru, where the overall performance of the system was analyzed under real-world conditions. The exact location of the field tests is shown in
Figure 7.
5.1. Sensor Data Analysis
Initially, testing was performed just on the hermeticity of the SSM, resulting in unfavorable outcomes due to the print resolution and the material’s adhesion to its different layers. For this reason, an epoxy paint coating was added to cover the small gaps where water leaked in. It was tested under controlled conditions at a depth of around 1 m, a distance sufficient for field evaluation, with promising results without any leaks.
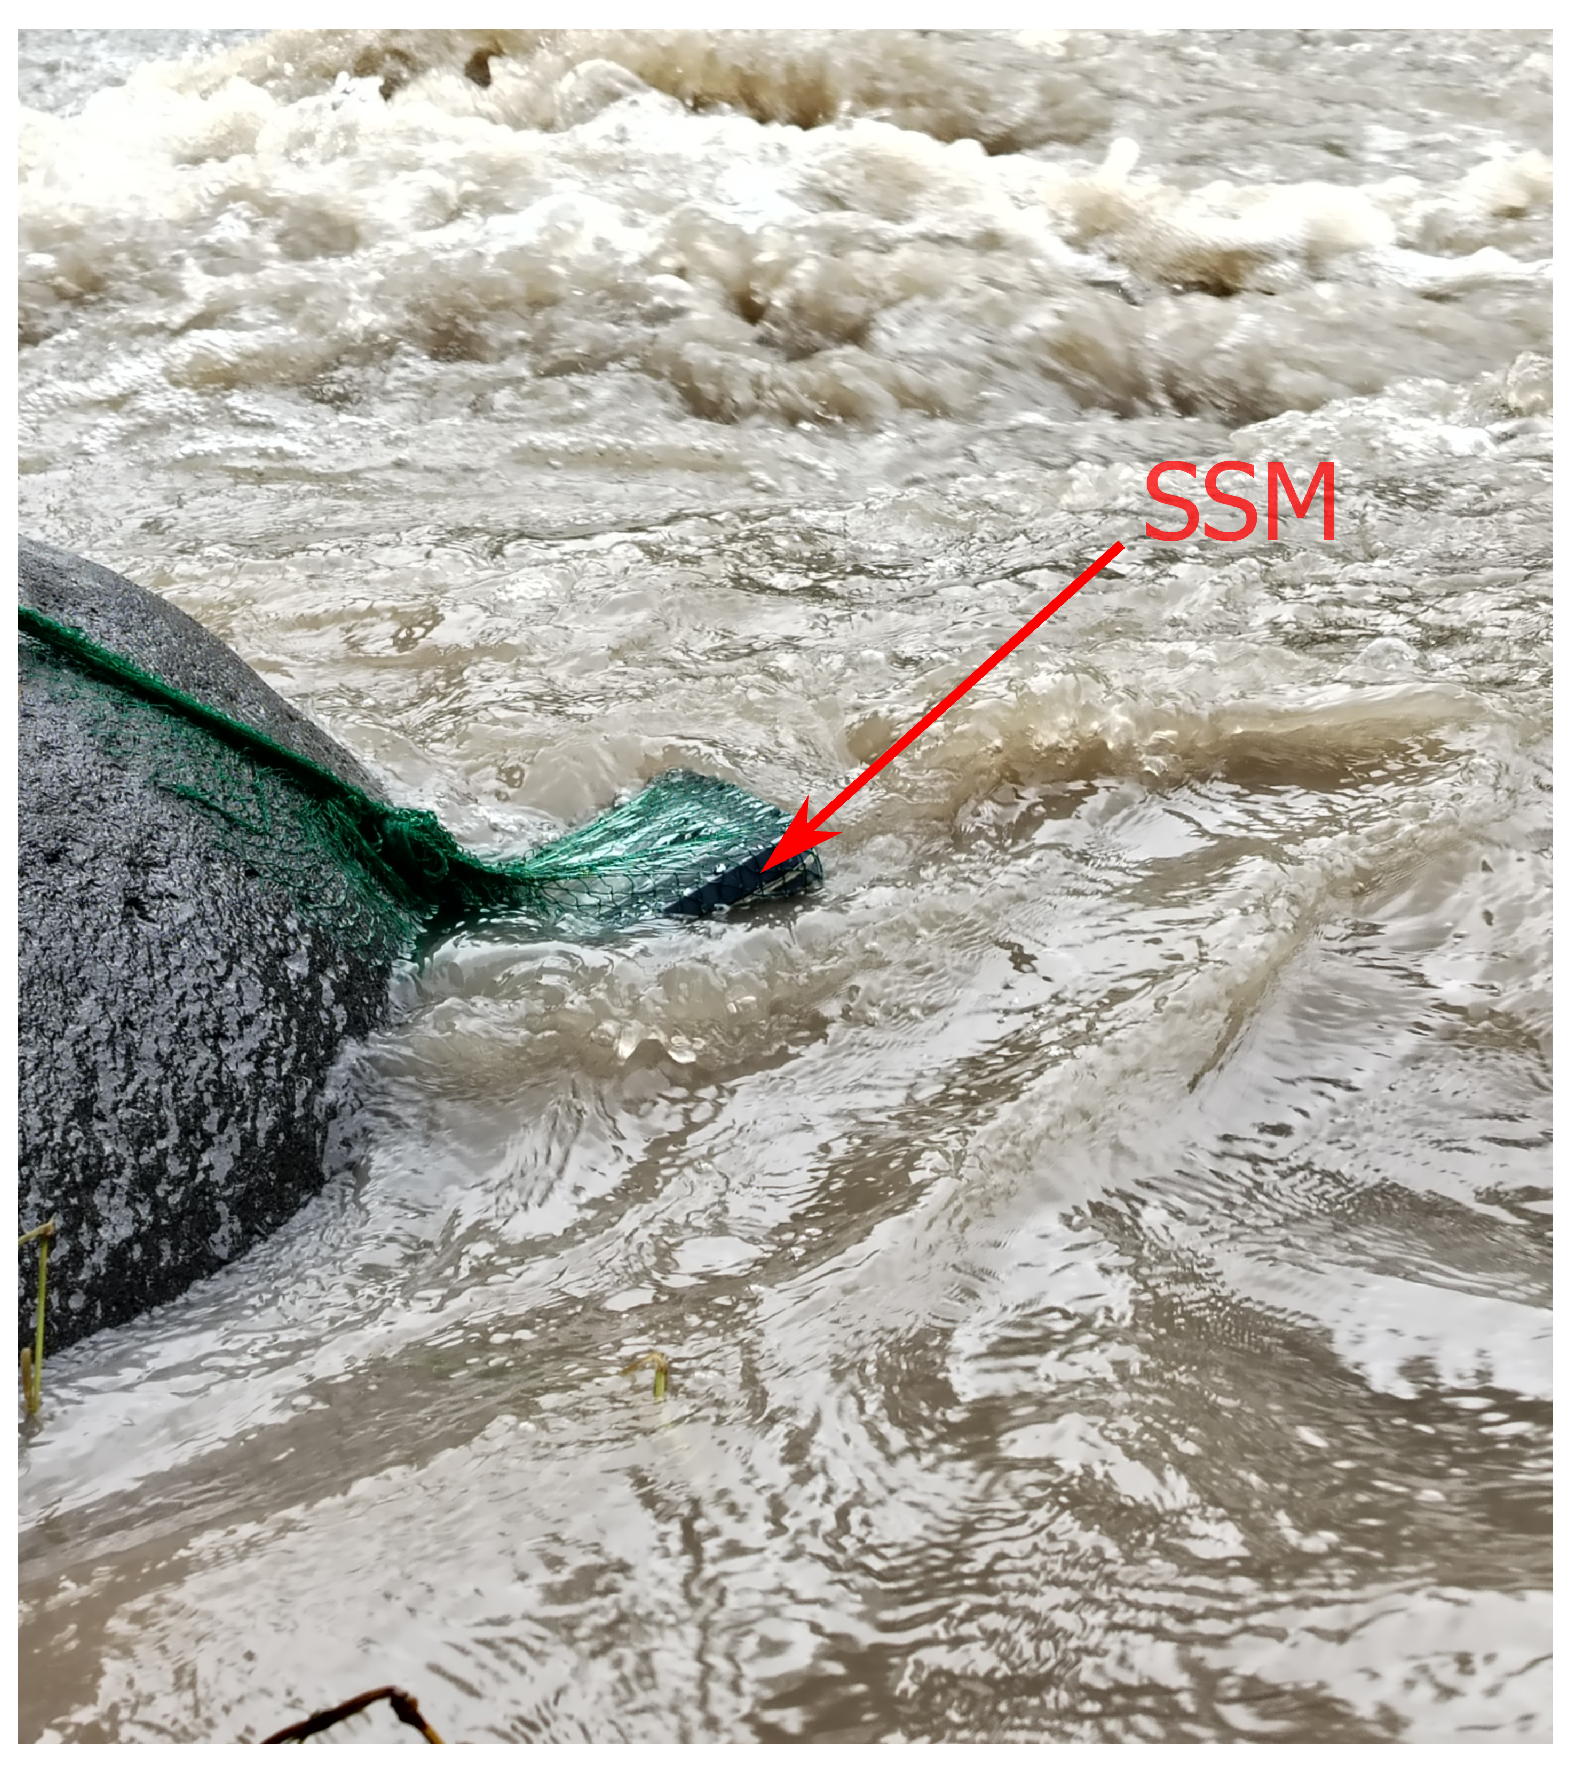
Figure 7 highlights the vigorous river flow during the rainy season, so a small fishing net was used to secure it and ensure the river current did not sweep the module away (
Figure 8).
Before enclosing the module, it must be turned on, and it is essential to verify that all connections are secure. Upon completion, it is closed and submerged in the river. The second operating mode was selected, with a 1 s gap between velocity and acceleration messages, with sensor measurements transmitted after every 10 messages. It is important to note that this time can be changed normally; for simplicity, this time was chosen.
5.2. RSSI and Communication Performance
During the setup testing, the points indicated in
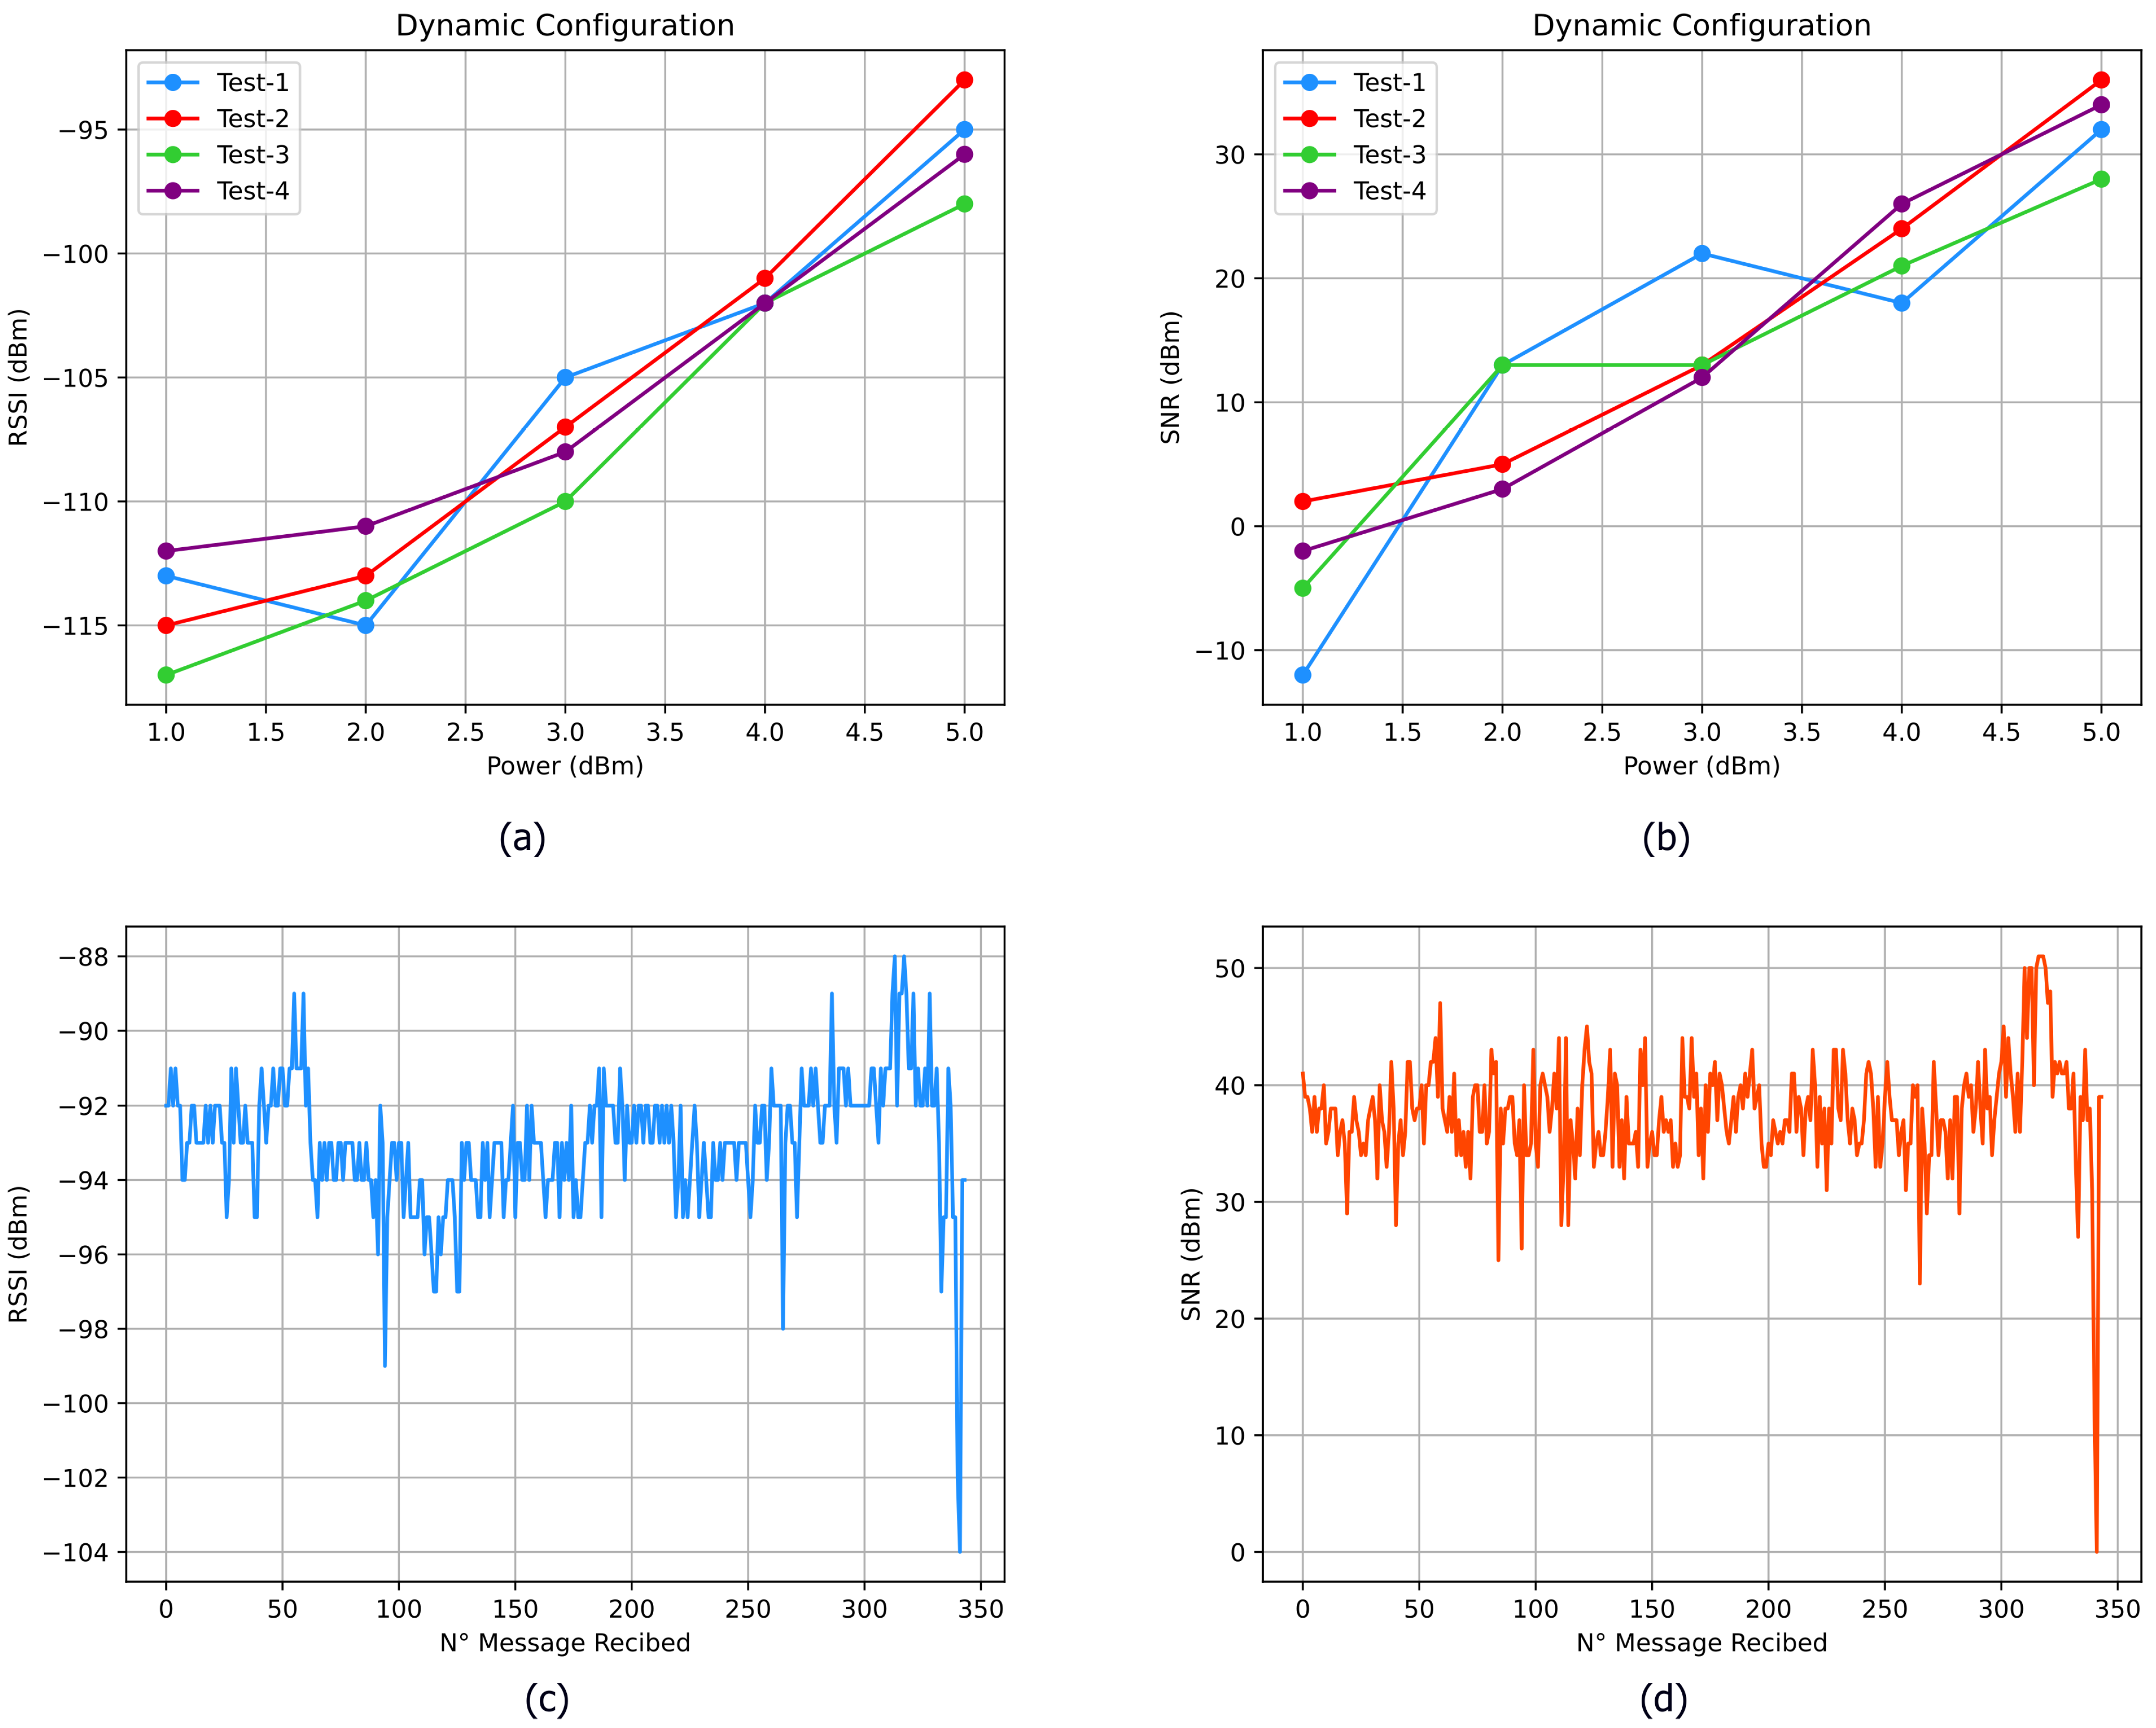
Figure 7 were taken, with the LRR positioned on the bridge. Four tests of the algorithm were performed, and as anticipated, the RSSI values improved with increasing power (
Figure 9). Similarly, the SNR values also have the same behavior. The placement of the repeater and the gateway facilitates the configuration since there is an absence of fixed obstacles that could interfere with the configuration.
To evaluate communication, it should be noted that Arequipa has a dry climate with 40% humidity, but humidity can rise to 59% during the rainy season [
30]. Tests were conducted on February mornings with no rain but low humidity.
Once the antenna power configuration was completed, the sensor module was turned on and messages flowed steadily, first passing through the repeater and finally reaching the gateway. The RSSI and SNR values remained within the range according to the previous configuration (
Figure 9). At the end of the tests, it was observed that there was a sudden decrease in the RSSI and SNR of −104 dB and 0, respectively. This could have been caused by interference or the presence of obstacles since these tests were performed in urban areas.
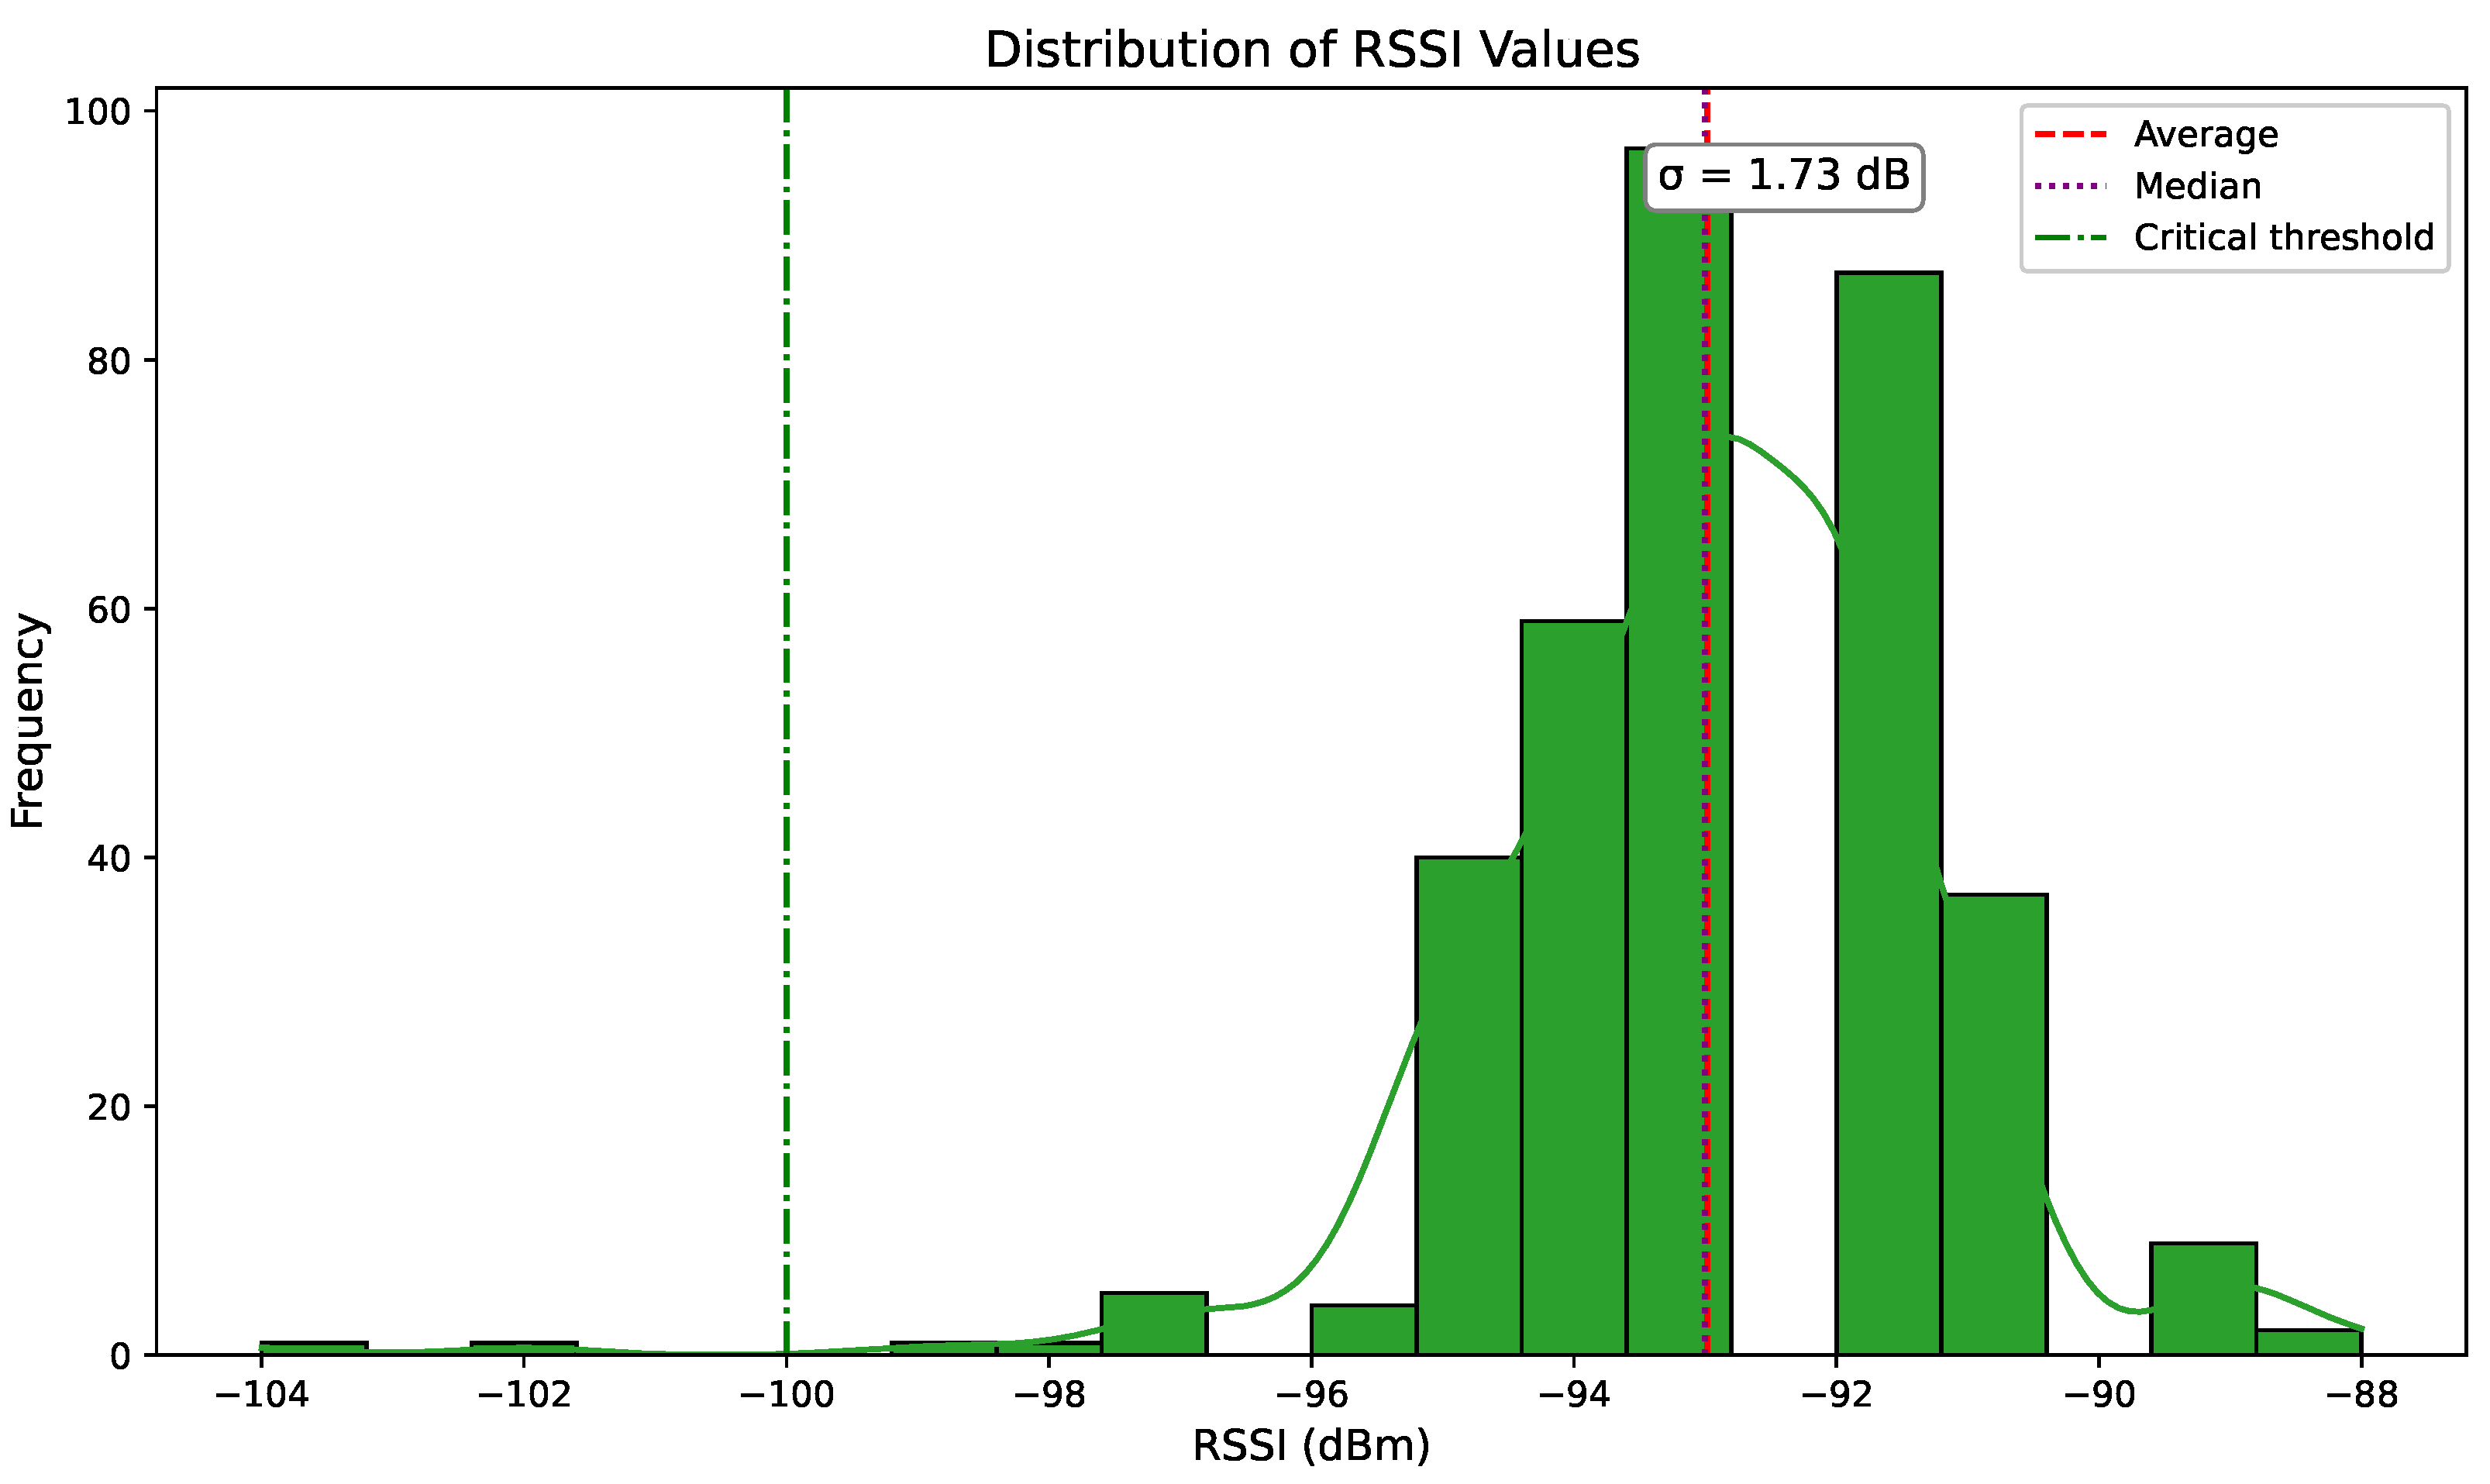
Of the 350 messages received, the RSI values showed a bell-shaped distribution in
Figure 10, indicating stability.
Additionally, the preconfigured SF and BW provide sufficient link margin to compensate for attenuation due to rainy weather, which typically introduces losses of less than 5 dB in sub-GHz bands.
5.3. Testing Every System
The real-time monitoring server has been initiated. The tests lasted approximately 10 min.
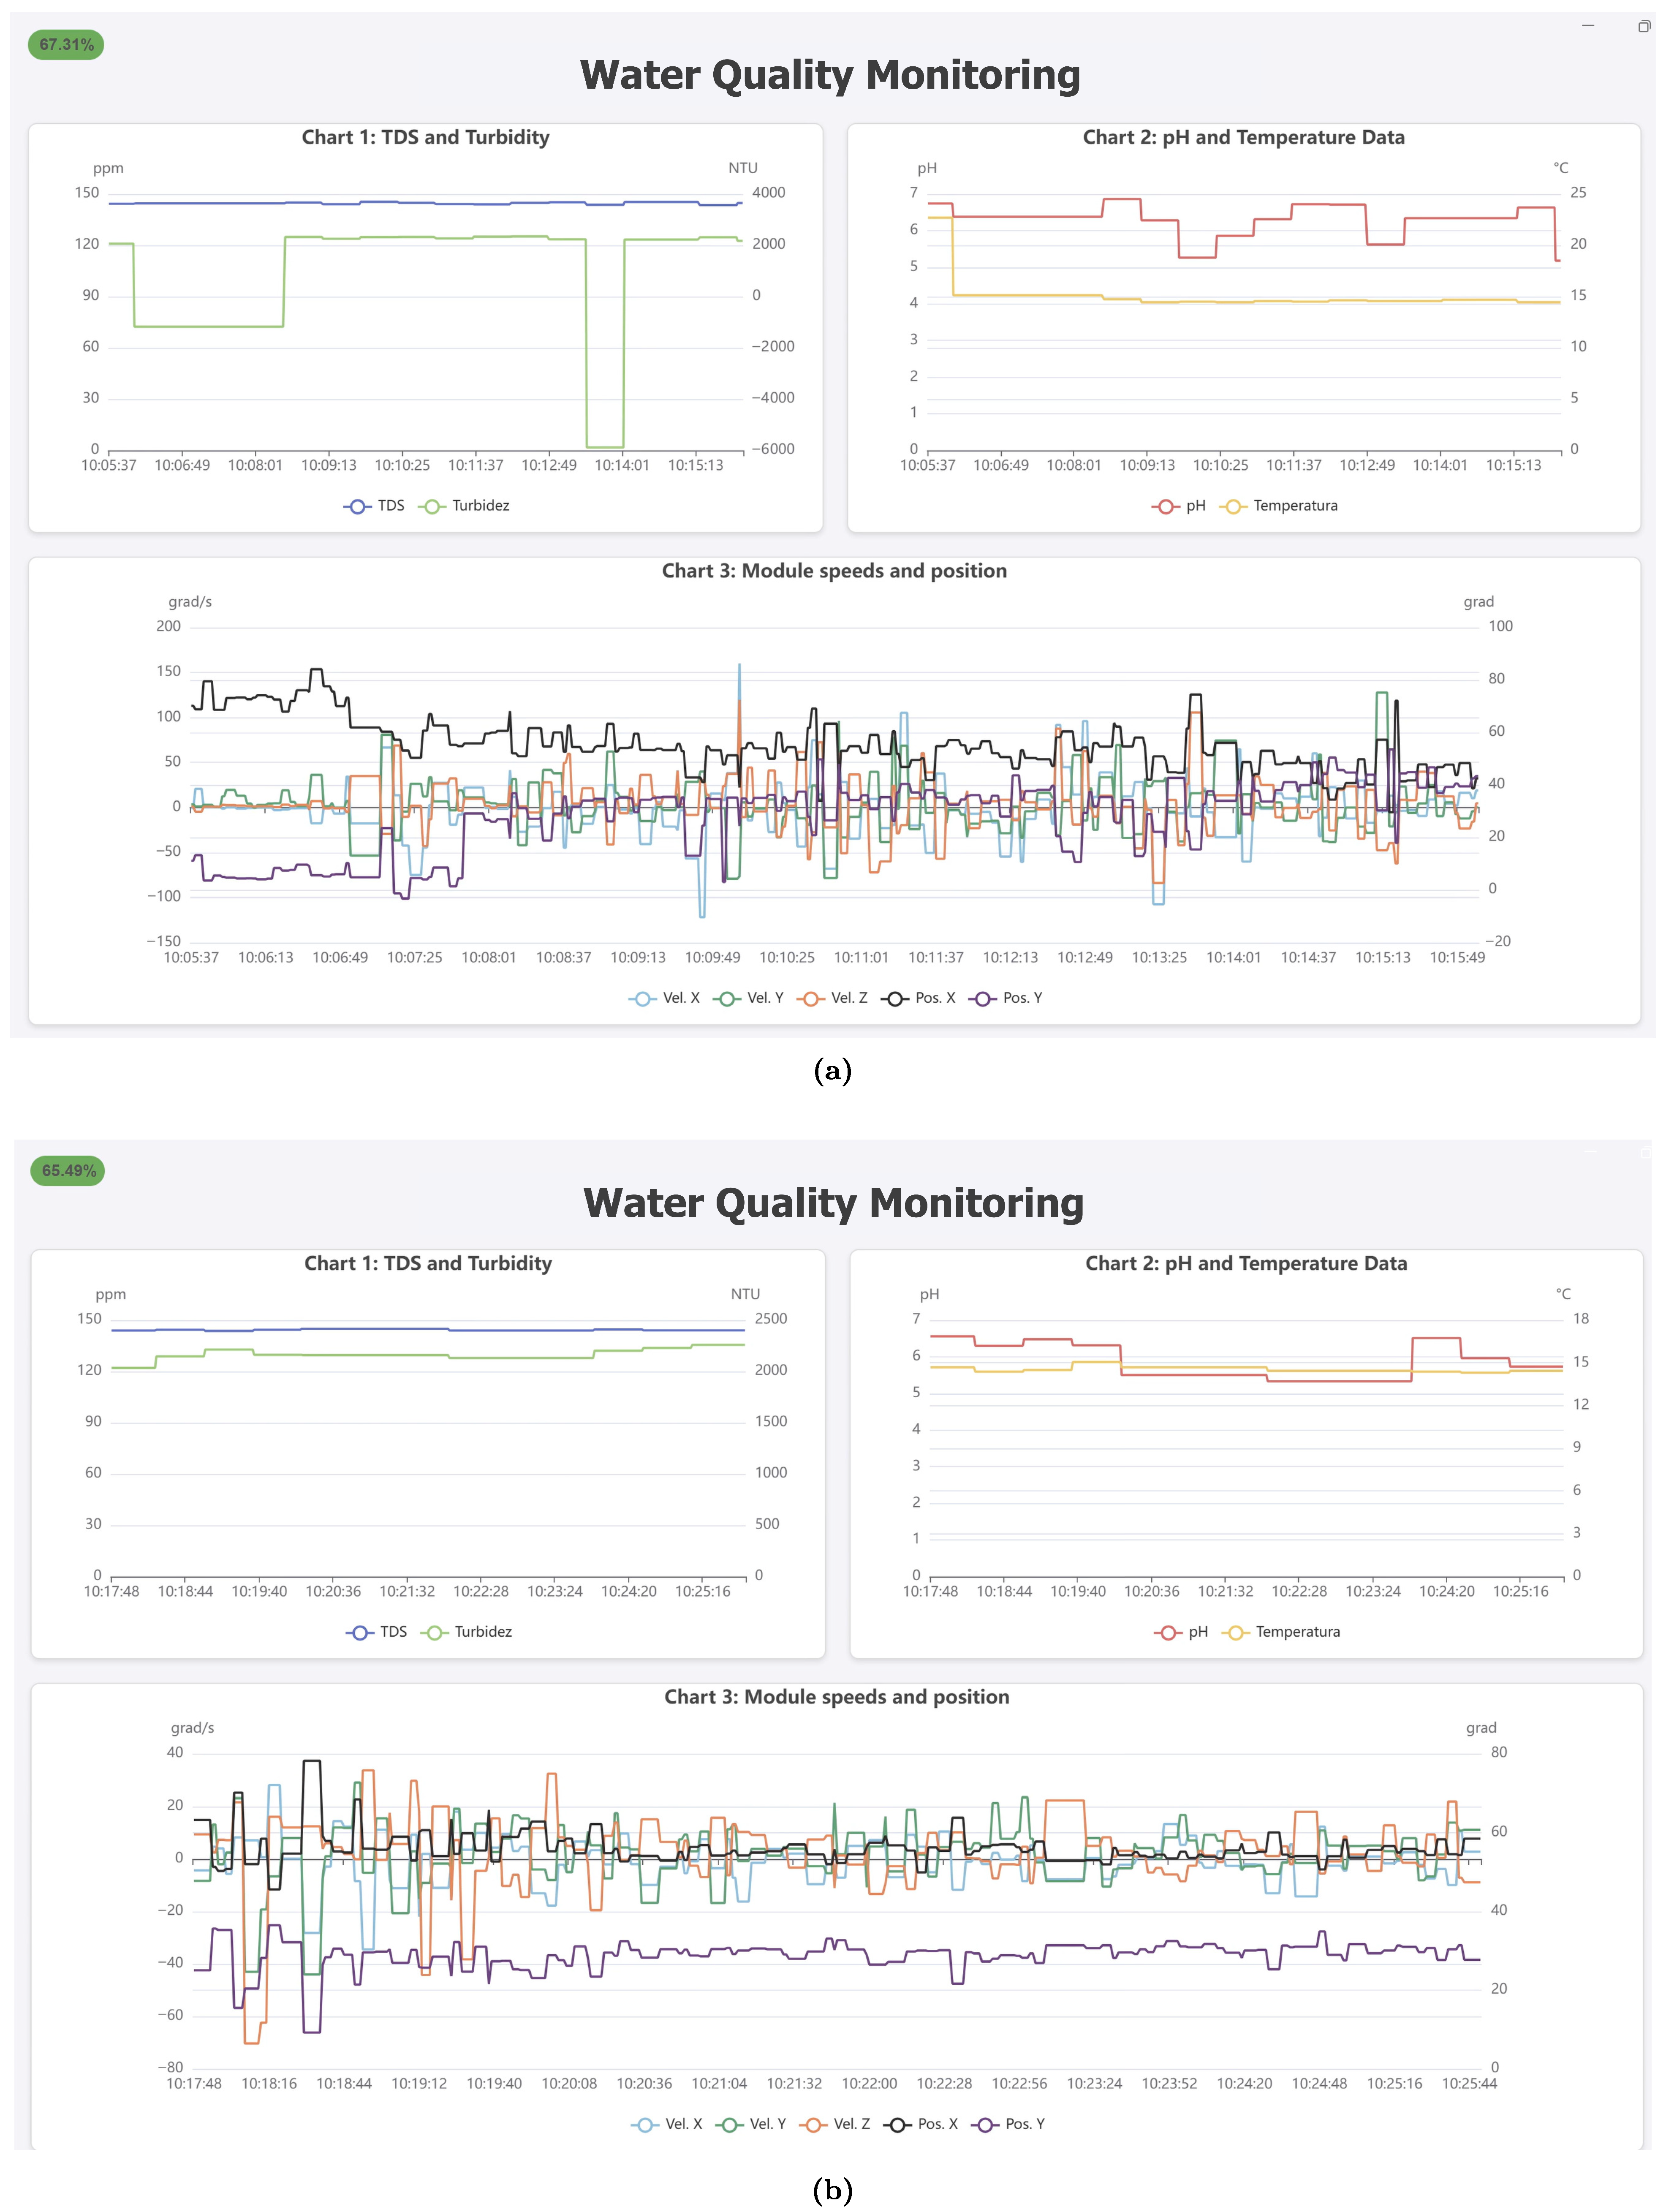
Figure 11 illustrates the performance of the sensor and gyroscope data. The data was collected at different positions, one exhibiting lower turbulence than the other.
The first velocity data was limited because the SSM was positioned shallowly in the river to view the indicator LEDs via a small window; it was thereafter fully submerged at a depth of roughly 10 cm from the water surface to assure its safety.
Subsequently, when moving to an area with less turbulence, the module’s X and Y positions are more clearly visible, with angles of 60° and 25°, respectively, demonstrating greater stability compared to the previous location. Additionally, these data are used to monitor the movement of the SSM and determine if the river current was able to drag the module. This data is also used to analyze the module’s position.
The assessed water quality metrics exhibited stability during the observation period.
Table 4 presents the average sensor readings, which align with the anticipated values for the rainy season. These measurements provide information on the river’s condition, indicating variations influenced by precipitation and runoff.
6. Conclusions
The developed prototype provides a flexible and scalable system for the real-time monitoring of water quality parameters in rivers, facilitating prompt intervention. The design employs 3D printing and standardized electronic components, facilitating straightforward and scalable deployment; still, the design can be fitted with a steel casing to increase its strength. Moreover, it integrates position and angular velocity sensors, facilitating system tracking in turbulent conditions; hence, it is suitable for various scenarios necessitating inclination measurements.
LoRa was chosen for its extensive range to facilitate efficient data transmission in inaccessible places, while MQTT was selected for information administration on a Django server with a database. A dynamic power adjustment algorithm utilizing RSSI was implemented, enhancing the repeater’s energy efficiency while maintaining communication stability.
In summary, tests on the Chili River in Arequipa, Peru, revealed that the TDS, turbidity, pH, and temperature sensors performed as expected during the rainy season, with no worrisome levels of pollution detected. Water conductivity remained stable thanks to the constant flow rate, while pH values, although within the normal range for freshwater, could reflect a slight influence of acid rain from urban pollution. Moreover, the dynamic power configuration findings indicated that this technology facilitates the scalable implementation of numerous sensor nodes and repeaters in both urban and rural settings. The technology enables the scalable implementation of several sensor nodes and repeaters in urban and rural environments.
Author Contributions
Conceptualization, K.J.B.Q., P.L.H.C. and J.L.H.Q.; Methodology, J.L.H.Q. and J.C.C.L.; Software, K.J.B.Q.; Validation, K.J.B.Q.; Investigation, P.L.H.C.; Resources, K.J.B.Q. and P.L.H.C.; Data curation, K.J.B.Q.; Writing—original draft, K.J.B.Q. and J.L.H.Q.; Writing—review & editing, K.J.B.Q., P.L.H.C., J.C.C.L. and J.P.J.A.; Visualization, J.L.H.Q.; Supervision, J.L.H.Q., J.C.C.L. and J.P.J.A.; Project administration, P.L.H.C. and J.L.H.Q. All authors have read and agreed to the published version of the manuscript.
Funding
This research was funded by Universidad Nacional de San Agustín de Arequipa through contract IBA-IB-69-2020-UNSA.
Institutional Review Board Statement
This study does not require approval by an ethics committee, as it did not involve experimentation with humans or animals.
Data Availability Statement
The datasets utilized and analyzed in the present study are accessible upon reasonable request to the corresponding author.
Acknowledgments
We would like to thank the Universidad Nacional de San Agustín de Arequipa for its support, which enabled the development of this research. Thanks to the funding and infrastructure provided, it was possible to use specialized equipment for electronic board manufacturing, 3D printing, and other resources available at its facilities, which proved essential for the execution of the project.
Conflicts of Interest
The funders had no role in the design of the study; in the collection, analyses, or interpretation of data; in the writing of the manuscript; or in the decision to publish the results.
References
- McGrane, S.J. Impacts of urbanisation on hydrological and water quality dynamics, and urban water management: A review. Hydrol. Sci. J. 2016, 61, 2295–2311. [Google Scholar] [CrossRef]
- Borgwardt, F.; Robinson, L.; Trauner, D.; Teixeira, H.; Nogueira, A.J.; Lillebø, A.I.; Piet, G.; Kuemmerlen, M.; O’Higgins, T.; McDonald, H.; et al. Exploring variability in environmental impact risk from human activities across aquatic ecosystems. Sci. Total Environ. 2019, 652, 1396–1408. [Google Scholar] [CrossRef] [PubMed]
- Vareda, J.P.; Valente, A.J.; Durães, L. Assessment of heavy metal pollution from anthropogenic activities and remediation strategies: A review. J. Environ. Manag. 2019, 246, 101–118. [Google Scholar] [CrossRef] [PubMed]
- Tolkou, A.K.; Toubanaki, D.K.; Kyzas, G.Z. Detection of arsenic, chromium, cadmium, lead, and mercury in fish: Effects on the sustainable and healthy development of aquatic life and human consumers. Sustainability 2023, 15, 16242. [Google Scholar] [CrossRef]
- Zhang, L.; Cheng, Y.; Zhou, Y.; Lu, W.; Li, J. Effect of different types of anthropogenic pollution on the bacterial community of urban rivers. Water Environ. Res. 2021, 93, 1322–1332. [Google Scholar] [CrossRef] [PubMed]
- Rymes, M.N.; Rasmussen, R.; Garcia-Chevesich, P.A.; Burgert, K.; Long, J.; McBride, E.; Martínez, G.; Martínez, K.; Tejada-Purizaca, T.R.; Murray, K.E.; et al. Surface water quality database for five watersheds in the Arequipa region of Southern Peru. Data Brief 2024, 56, 110770. [Google Scholar] [CrossRef] [PubMed]
- Chen, Z.; Li, R.; Mao, D. Truth Discovery Technology for Mobile Crowd Sensing in Water Quality Monitoring. Wirel. Commun. Mob. Comput. 2023, 2023, 4900238. [Google Scholar] [CrossRef]
- Chowdury, M.S.U.; Emran, T.B.; Ghosh, S.; Pathak, A.; Alam, M.M.; Absar, N.; Andersson, K.; Hossain, M.S. IoT Based Real-time River Water Quality Monitoring System. Procedia Comput. Sci. 2019, 155, 161–168. [Google Scholar] [CrossRef]
- Pasika, S.; Gandla, S. Smart Water Quality Monitoring System with Cost-Effective Using IoT. Heliyon 2020, 6, e04096. [Google Scholar] [CrossRef] [PubMed]
- Jo, W.; Hoashi, Y.; Paredes Aguilar, L.L.; Postigo-Malaga, M.; Garcia-Bravo, J.M.; Min, B.C. A low-cost and small USV platform for water quality monitoring. HardwareX 2019, 6, e00076. [Google Scholar] [CrossRef]
- Trevathan, J.; Schmidtke, S. Open-source Internet of Things remote aquatic environmental sensing. HardwareX 2022, 12, e00336. [Google Scholar] [CrossRef] [PubMed]
- Pires, L.M.; Gomes, J. River Water Quality Monitoring Using LoRa-Based IoT. Designs 2024, 8, 127. [Google Scholar] [CrossRef]
- Neumann, K.C.; La, D.; Yoo, H.; Burkepile, D.E. Programmable Autonomous Water Samplers (PAWS): An inexpensive, adaptable and robust submersible system for time-integrated water sampling in freshwater and marine ecosystems. HardwareX 2023, 13, e00392. [Google Scholar] [CrossRef] [PubMed]
- Krklješ, D.B.; Kitić, G.V.; Petes, C.M.; Birgermajer, S.S.; Stanojev, J.D.; Bajac, B.M.; Panić, M.N.; Radonić, V.M.; Brčeski, I.D.; Štravs, R.M.; et al. Multiparameter Water Quality Monitoring System for Continuous Monitoring of Fresh Waters. IEEE Sens. J. 2024, 24, 11246–11260. [Google Scholar] [CrossRef]
- Gao, P.; Zheng, B.; Liang, J.; Ren, C. Development of an Underwater Robot for Sediment Soil Sampling. In Proceedings of the 3rd International Conference on Mechatronics and Industrial Informatics, Zhuhai, China, 30–31 October 2015; Atlantis Press: Sichuan, China, 2015; pp. 6–11. [Google Scholar] [CrossRef][Green Version]
- Bae, J.H.; Park, J.H.; Lee, S.; Min, B.C. Tri-SedimentBot: An underwater sediment sampling robot. In Proceedings of the 2016 IEEE International Conference on Automation Science and Engineering (CASE), Fort Worth, TX, USA, 21–25 August 2016; pp. 1360–1365. [Google Scholar] [CrossRef]
- Sakagami, N.; Sasaki, S.; Kawabata, M.; Yokoi, K.; Matsuda, S.; Mitsui, A.; Sano, K.; Tago, K.; Kawamura, S. Development of a human-portable underwater robot for soil core sampling. In Proceedings of the 2013 MTS/IEEE OCEANS, Bergen, Norway, 23–27 September 2013; pp. 1–6. [Google Scholar] [CrossRef]
- Bor, M.; Roedig, U. LoRa Transmission Parameter Selection. In Proceedings of the 2017 13th International Conference on Distributed Computing in Sensor Systems (DCOSS), Ottawa, ON, Canada, 5–7 June 2017; pp. 27–34. [Google Scholar] [CrossRef]
- Tu, L.T.; Bradai, A.; Pousset, Y.; Aravanis, A.I. Energy Efficiency Analysis of LoRa Networks. IEEE Wirel. Commun. Lett. 2021, 10, 1881–1885. [Google Scholar] [CrossRef]
- Tehrani, Y.H.; Amini, A.; Atarodi, S.M. A Tree-Structured LoRa Network for Energy Efficiency. IEEE Internet Things J. 2021, 8, 6002–6011. [Google Scholar] [CrossRef]
- Chilamkurti, N.; Zeadally, S.; Vasilakos, A.; Sharma, V. Cross-Layer Support for Energy Efficient Routing in Wireless Sensor Networks. J. Sens. 2009, 2009, 134165. [Google Scholar] [CrossRef]
- Almuhaya, M.A.M.; Jabbar, W.A.; Sulaiman, N.; Abdulmalek, S. A Survey on LoRaWAN Technology: Recent Trends, Opportunities, Simulation Tools and Future Directions. Electronics 2022, 11, 164. [Google Scholar] [CrossRef]
- Syed Taha, S.N.; Abu Talip, M.S.; Mohamad, M.; Azizul Hasan, Z.H.; Tengku Mohmed Noor Izam, T.F. Evaluation of LoRa Network Performance for Water Quality Monitoring Systems. Appl. Sci. 2024, 14, 7136. [Google Scholar] [CrossRef]
- DFRobot. Gravity: Analog TDS Sensor/Meter for Arduino SKU: SEN0244. Wiki de DFRobot, 2023. Available online: https://wiki.dfrobot.com/Gravity__Analog_TDS_Sensor___Meter_For_Arduino_SKU__SEN0244 (accessed on 20 July 2024).
- Hifisac. PH-4502C: Sensor de pH con Sonda en Módulo para Arduino. Hifisac Online Store, 2023. Available online: https://hifisac.com/shop/ph-4502c-ph-4502c-sensor-de-ph-con-sonda-en-modulo-para-arduino-ph-7bnc-3499#attr= (accessed on 20 July 2024).
- DFRobot. Turbidity sensor SKU: SEN0189. Wiki de DFRobot, 2023. Available online: https://wiki.dfrobot.com/Turbidity_sensor_SKU__SEN0189 (accessed on 20 July 2024).
- Ferreira, A.E.; Ortiz, F.M.; Costa, L.H.M.; Foubert, B.; Amadou, I.; Mitton, N. A study of the LoRa signal propagation in forest, urban, and suburban environments. Ann. Telecommun. 2020, 75, 333–351. [Google Scholar] [CrossRef]
- Mishra, B.; Mishra, B.; Kertesz, A. Stress-Testing MQTT Brokers: A Comparative Analysis of Performance Measurements. Energies 2021, 14, 5817. [Google Scholar] [CrossRef]
- Kashyap, M.; Dev, A.K.; Sharma, V. Implementation and analysis of EMQX broker for MQTT protocol in the Internet of Things. e-Prime-Adv. Electr. Eng. Electron. Energy 2024, 10, 100846. [Google Scholar] [CrossRef]
- Weather and Climate. Average Monthly Humidity in Arequipa, Peru. Online Climate Data from Weather and Climate. Available online: https://weather-and-climate.com/average-monthly-Humidity-perc,Arequipa,Peru (accessed on 8 July 2025).
Figure 1.
Water quality measurement network topology. (a) The network implemented with LoRa and MQTT. The SSM, LRR, and Gateway use LoRa for data transmission, and the Gateway uses MQTT for publishing, allowing the server to read and interact with web clients. (b) The tree topology for projects involving a larger number of SSMs and LRRs.
Figure 2.
SSM with its parts where (a) show the design out side, (b) the desing in side with the location of sensor transmitters, (c) the prototype implementation and (d) the detail of the actual transmitters inside.
Figure 2.
SSM with its parts where (a) show the design out side, (b) the desing in side with the location of sensor transmitters, (c) the prototype implementation and (d) the detail of the actual transmitters inside.
Figure 3.
LRR design where (a) the parts such as 1: LoRa Antenna, 2: Indicators, 3: Button, 4: RPP, 5: Battery, 6: Handle are detailed, and with a cross-section to see its interior. (b) shows a panoramic view of the design.
Figure 3.
LRR design where (a) the parts such as 1: LoRa Antenna, 2: Indicators, 3: Button, 4: RPP, 5: Battery, 6: Handle are detailed, and with a cross-section to see its interior. (b) shows a panoramic view of the design.
Figure 5.
Flowchart of the SSM program, where ’X’is the number of iterations to send messages from the sensors.
Figure 5.
Flowchart of the SSM program, where ’X’is the number of iterations to send messages from the sensors.
Figure 6.
Dynamic Power Configuration where is the RSSI of the Gateway message and is the RSSI of the Repeater message. (a) Scenario where the repeater finishes its power configuration first. (b) Scenario where the gateway finishes its power configuration first.
Figure 6.
Dynamic Power Configuration where is the RSSI of the Gateway message and is the RSSI of the Repeater message. (a) Scenario where the repeater finishes its power configuration first. (b) Scenario where the gateway finishes its power configuration first.
Figure 7.
Location of the Chili River, where field tests were conducted. (a) Distance between the gateway and the repeater. (b) River flow during the rainy season.
Figure 7.
Location of the Chili River, where field tests were conducted. (a) Distance between the gateway and the repeater. (b) River flow during the rainy season.
Figure 8.
SSM tests on the Chili River.
Figure 8.
SSM tests on the Chili River.
Figure 9.
Results of RSSI and SNR levels of dynamic configuration based on RSSI exchange. (a) In The average RSSI values of the gateway messages. (b) The average SNR values of the gateway messages. (c) The RSSI values of the monitoring messages. (d) The SNR values of the monitoring messages.
Figure 9.
Results of RSSI and SNR levels of dynamic configuration based on RSSI exchange. (a) In The average RSSI values of the gateway messages. (b) The average SNR values of the gateway messages. (c) The RSSI values of the monitoring messages. (d) The SNR values of the monitoring messages.
Figure 10.
Histogram and distribution of RSSI values of the 350 messages.
Figure 10.
Histogram and distribution of RSSI values of the 350 messages.
Figure 11.
Web interface for complete system evaluations. (a) initial test with elevated turbulence and (b) subsequent test with reduced turbulence.
Figure 11.
Web interface for complete system evaluations. (a) initial test with elevated turbulence and (b) subsequent test with reduced turbulence.
Table 1.
Components of the entire system.
Table 1.
Components of the entire system.
| Node | Components | Number | Cost per Unit ($) | Total Cost ($) |
|---|
| SSM | Raspberry pi pico | 1 | 10 | 10 |
| Antena LoRa RYLR896 | 1 | 15 | 15 |
| Gyroscope (MPU6050) | 1 | 2 | 2 |
| Turbidity sensor (TS-300B) | 1 | 5 | 5 |
| TDS meter | 1 | 10 | 10 |
| Temperture sensor (ds18b20) | 1 | 2.5 | 2.5 |
| pH meter (pH-4502c) | 1 | 8 | 8 |
| Battery of 3.7 V | 2 | 5.5 | 11 |
| Electronic components | 1 | 2 | 2 |
| 3D printing | 1 | 9 | 9 |
| Epoxi paint | 1/16 L | 18 | 18 |
| LRR | Raspberry pi pico | 1 | 10 | 10 |
| Antena LoRa RYLR896 | 1 | 15 | 15 |
| Battery of 3.7 V | 1 | 3.5 | 3.5 |
| Electronic components | 1 | 2 | 2 |
| 3D printing | 1 | 2.5 | 2.5 |
| Gateway | Antena LoRa RYLR896 | 1 | 15 | 15 |
| Raspberry pi 4B with case | 1 | 120 | 120 |
| Electronic components | 1 | 2 | 2 |
Table 3.
LoRa antenna parameters.
Table 3.
LoRa antenna parameters.
| SF | BW | PL | CR | DE | H | Preamble |
|---|
| 10 | 125 kHz | 21 bytes | 1 | 1 | 0 | 7 |
Table 4.
Summarizes the average values of key water quality parameters, including pH, Total Dissolved Solids (TDS), turbidity, and temperature, recorded during the rainy season.
Table 4.
Summarizes the average values of key water quality parameters, including pH, Total Dissolved Solids (TDS), turbidity, and temperature, recorded during the rainy season.
| pH | TDS | Turbidity | Temperature |
|---|
| 6.5 | 150 | 2000 | 14 |
| Disclaimer/Publisher’s Note: The statements, opinions and data contained in all publications are solely those of the individual author(s) and contributor(s) and not of MDPI and/or the editor(s). MDPI and/or the editor(s) disclaim responsibility for any injury to people or property resulting from any ideas, methods, instructions or products referred to in the content. |
© 2025 by the authors. Licensee MDPI, Basel, Switzerland. This article is an open access article distributed under the terms and conditions of the Creative Commons Attribution (CC BY) license (https://creativecommons.org/licenses/by/4.0/).


