1. Introduction
With growing concern over the impact of climate change, many countries have set carbon net-zero goals for their electric grids and industrial sectors. To realize this transition, a major focus has been placed on maturing the technologies and supply chains required to replace carbon-based energy sources with renewables such as solar and wind. Offshore wind, though still costly when compared to some other renewable solutions, is a promising source of clean electricity thanks to the consistently high wind resource, especially over deep-water sites. Most of the U.S. offshore wind resource potential, in fact, lies over waters with depths greater than 60 m, necessitating the use of floating offshore wind turbines (FOWTs) [
1]. The U.S. has set the goal of installing 15 GW of offshore wind, while reducing FOWT costs by 70% [
2]. Developing low-cost FOWTs poses many challenges, both economic and technical.
As of 2021, the National Renewable Energy Laboratory (NREL) estimated the Levelized Cost of Energy (LCOE) of FOWTs as 58% higher than that of fixed-bottom turbines [
3]. Currently, FOWTs are more expensive than fixed-bottom turbines largely because of the added cost due to the high complexity of the floating substructure combined with the mooring lines and anchoring system required to tether the turbine. Since these underwater components alone account for 27% of the project LCOE [
3], cost-saving opportunities include reducing the mass of the substructure, improving mooring and anchors, and reducing platform motion response, thus inducing lower fatigue and peak loads on the entire FOWT [
4]. Due to practical constraints, the expected floating platform archetypes in the near-term offshore markets are the tension-leg platform (TLP) and semi-submersible. Semi-submersibles gain stability via their large water plane areas (second moment of inertia), but this often results in a greater response to wave loading and costs due to a heavier structure. The focus for the rest of this study is on semi-submersibles, specifically as they are more likely to be deployed at a large scale because of their ease of installation compared to TLPs and spars [
5].
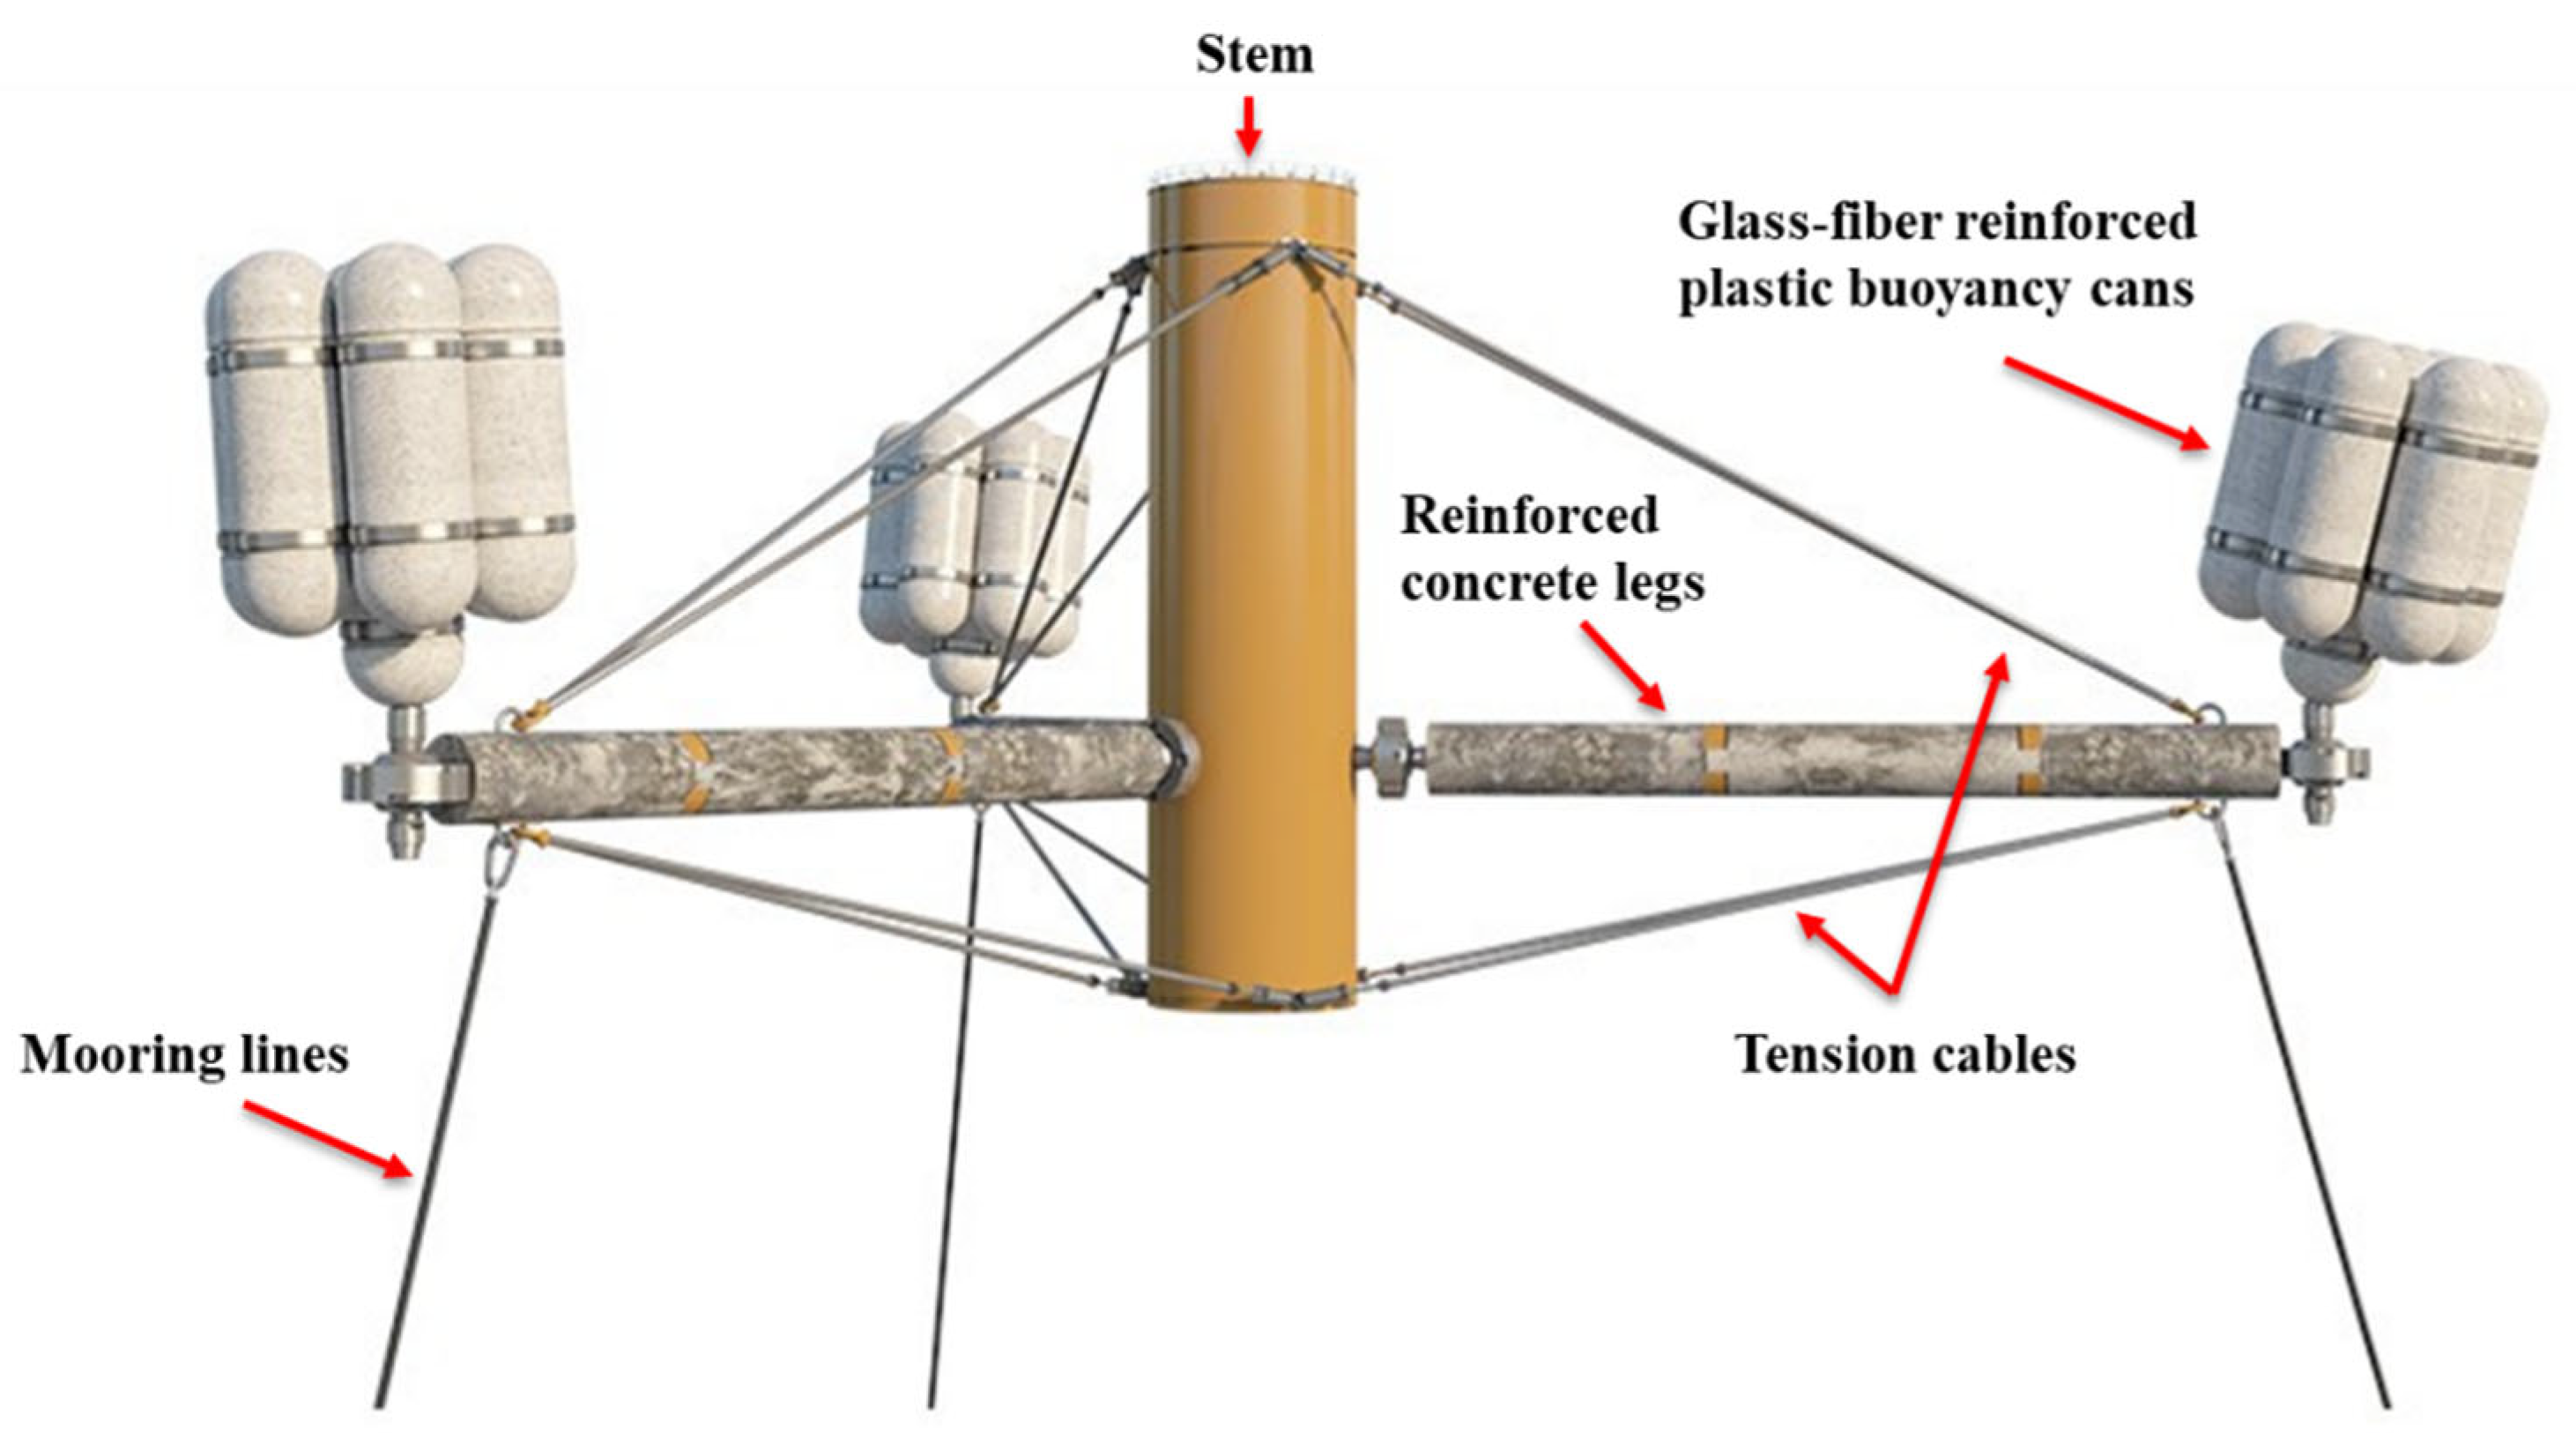
This study introduces an innovative semi-submersible platform, SpiderFLOAT (SF), as well as focusing on its optimization [
6]. SF is shown in
Figure 1 and does not use a typical fixed-frame steel structure as in [
7] but low-cost materials and flexible components. In particular, the legs are made of reinforced concrete, and their angles from the stem can be adjusted using ad hoc connections. In addition, the buoyancy units are made of fiberglass cans bound together and connected to the legs with flexible joints. This flexibility can help reduce wave loads while the component modularity can ease manufacturing, transport, and installation. In this study, the buoyancy units, herein referred to as cans, are rigidly connected to the legs to reduce the complexity of the design and the number of constraints needed.
Several studies have examined the broad optimization of FOWT substructures. In one study, Hall et al. (2013) used a genetic algorithm (GA) approach to generate a pareto front using the root mean squared (RMS) of the nacelle acceleration and the substructure cost to identify optimal substructure topologies [
8]. The optimization included constraints on the substructure cost, a static and dynamic platform maximum pitch angle of 10°, and on the potential of “slackness” in taut mooring lines that could lead to snap loads. The “slackness” potential was quantified as the difference between the steady-state line tension and three times the RMS line tension, which must be greater than zero. Their study revealed that a substructure design with three slender outer columns and an inner column with a greater diameter at similar drafts is the most cost-effective layout for semi-submersibles and that the substructure cost is further reduced with increased column spacing, but not with rotor-nacelle-assembly (RNA) acceleration.
Karimi et al. (2017), building on the work performed by Hall et al. (2013), implemented a global design optimization approach using a multi-objective GA that included objective functions for platform and mooring system costs and fore-aft nacelle acceleration [
9]. The study determined that for semi-submersibles with three outer cylindrical columns, the substructure cost decreases as the draft of the system decreases, as the radius of the inner and outer columns increases, and as the anchor radius increases.
Ferri et al. (2022) used a GA optimization procedure to optimize a 10-MW semi-submersible FOWT [
10]. The study optimized an upscaled DeepCwind 5-MW platform for the DTU 10-MW reference turbine [
11]. Several optimizations were conducted with minimization of the system response of interest (surge, pitch, and heave) response amplitude operator (RAO) amplitude used as the objective function. Their study found that to reduce the pitch peak of the platform, the outer column diameter and platform radius are maximized, resulting in a heavier platform and slack mooring system, which significantly increases the surge motion due to the coupling between platform surge and pitch.
Ultimately, most optimizations of energy systems use LCOE as the objective function. However, LCOE is dependent on external properties driven by market and site characteristics [
12]. Garcia Sans (2020) introduces a new metric space (M1, M2) for the evaluation of wind energy systems [
12]. M1 is independent of site characteristics, while M2 is independent of the volatility of material costs. Equivalent mass, used to determine M2, is the converted mass of steel of a wind turbine component, including material, manufacturing, and installation contributions. Using a reference price for steel, the capital expenditure (CapEx) of a turbine can be determined. For this study, the equivalent mass of the substructure, mooring, and anchoring system is used as the objective function. A detailed breakdown of the equivalent mass methodology and how it is used in this study is included in
Section 2.2. An optimization by Ramsay et al. (2022) incorporating the equivalent mass methodology and concrete for the optimization of a 15-MW semi-submersible substructure found the equivalent steel mass for the platform to be 15% of the total mass [
13].
Unlike previous studies that primarily focused on the broad optimization of semi-submersible substructures using GAs and frequency-domain methods, the present study takes a more comprehensive and nuanced approach. Whereas earlier research has identified general trends in decision variables, they often fell short of fully characterizing the sensitivity of platform motions and mass to individual platform and mooring system components. Moreover, the exclusive reliance on steel for the substructure material in prior work left a significant gap in understanding the potential benefits of alternative materials. To the best of the authors’ knowledge, this is the first study to rigorously investigate the influence of individual substructure, mooring, and anchoring (SMA) components on the global performance and mass of a semi-submersible substructure under extreme (turbine idling) conditions using concrete and fiberglass instead of steel. By employing the equivalent mass methodology with a detailed, time-domain analysis framework using OpenFAST, this research provides unprecedented insights into the optimization of semi-submersibles for FOWTs, setting a new benchmark in the field. The objectives of this optimization are to both reduce SMA equivalent mass while meeting the set design constraints and better understand individual component influences on the dynamics of the FOWT under extreme environmental conditions.
2. Methods
2.1. Substructure Geometry and Coordinate System
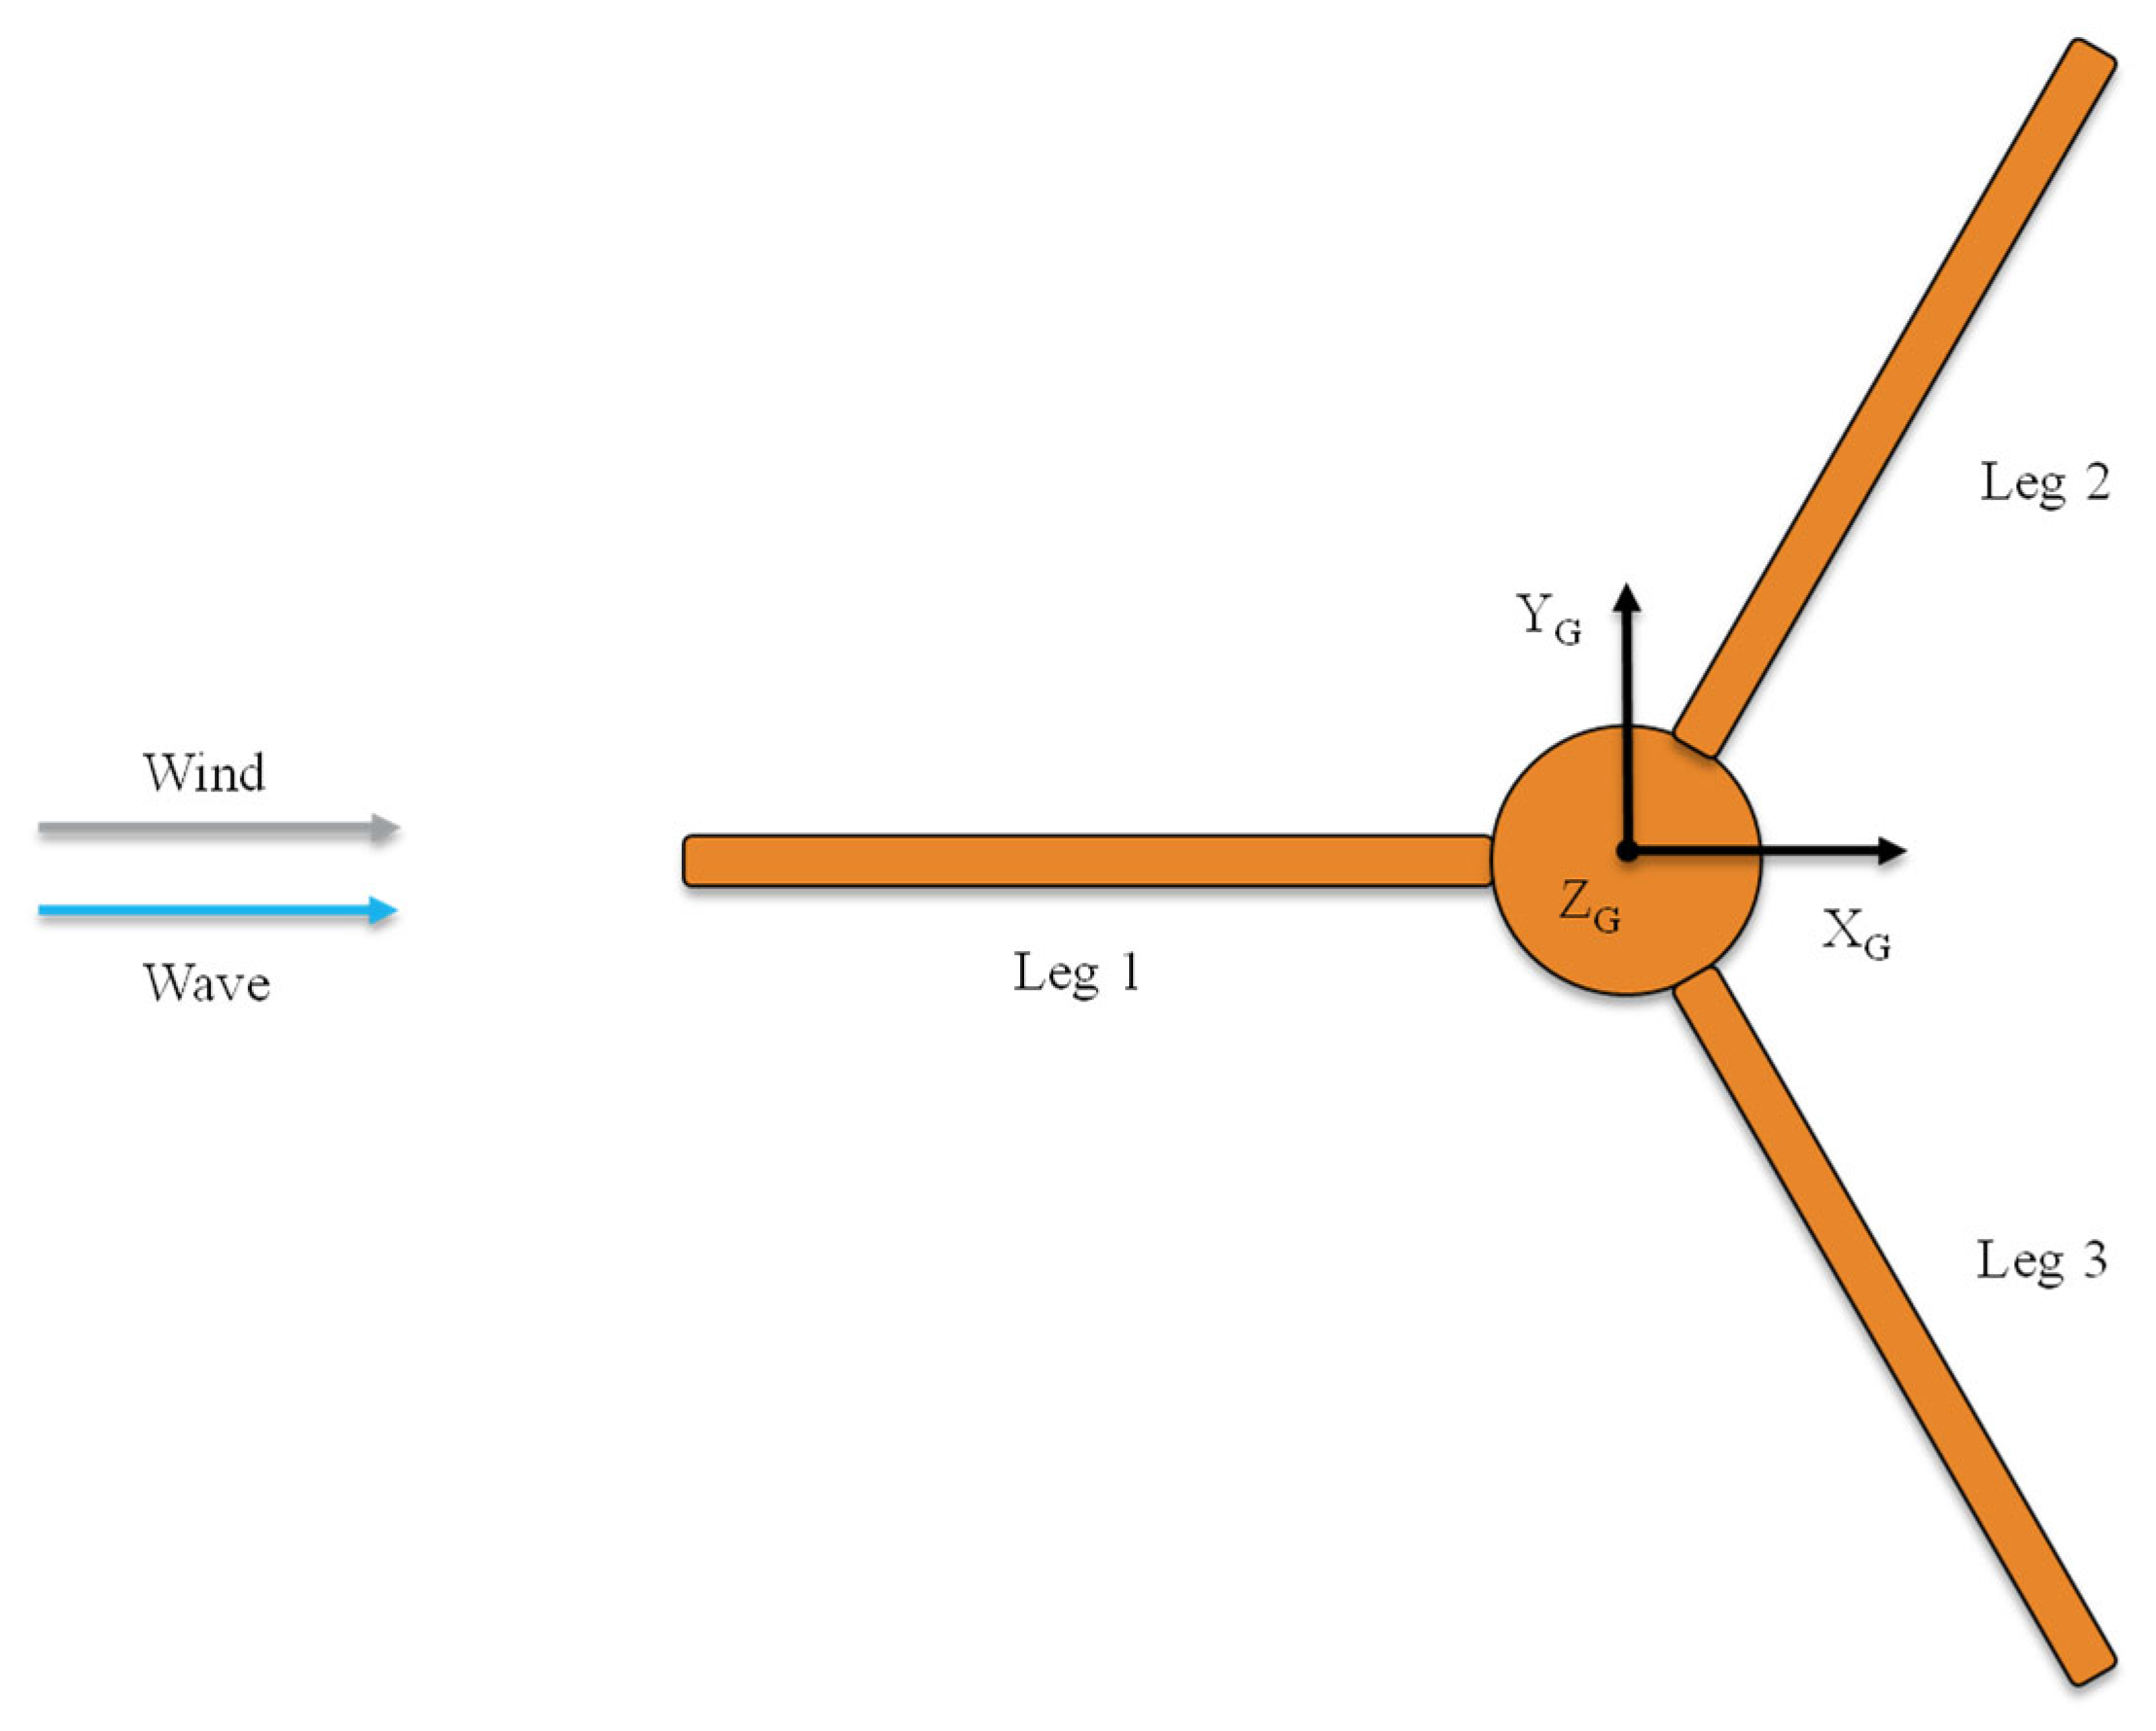
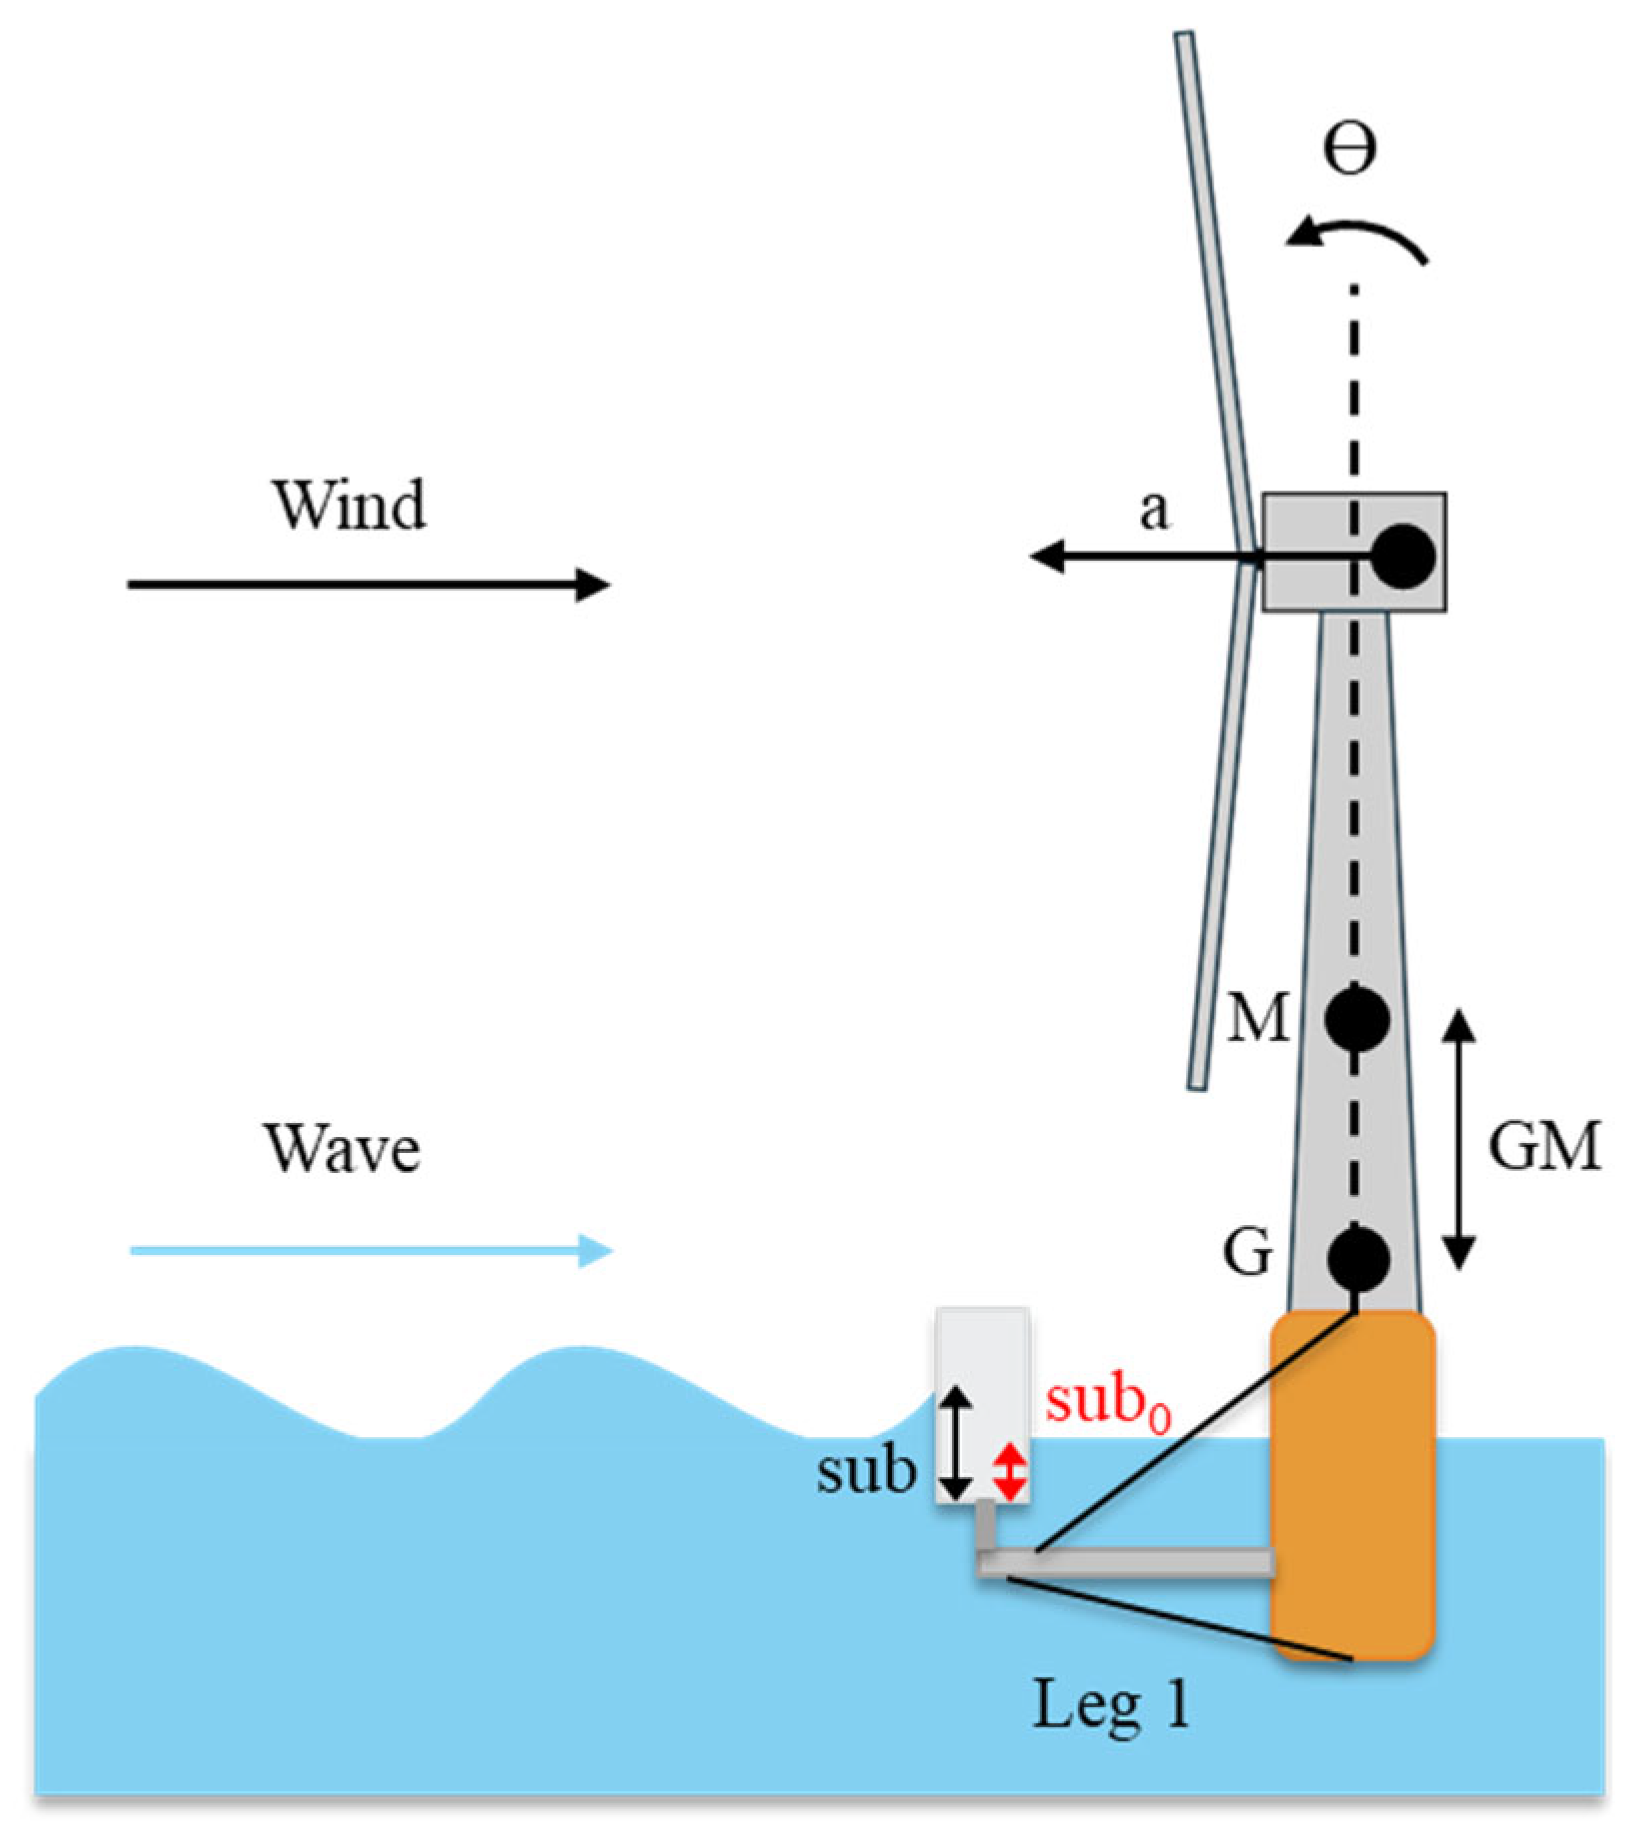
The substructure was optimized for the DLC 6.1a ‘parked’ load case (i.e., 50-yr extreme event wind and waves, with idling turbine) [
14], herein referred to as ‘extreme parked case’, with aligned wind and wave directions along the upwind leg (as shown in
Figure 2). The DLC 6.1a load case was chosen for this study due to being the design driving case. The right-hand global coordinate system is defined such that the global X-direction aligns with the wind direction and the global Z-direction points upward towards the nacelle, as shown in
Figure 2. The origin of the global system is the center of the stem at the still water line (SWL).
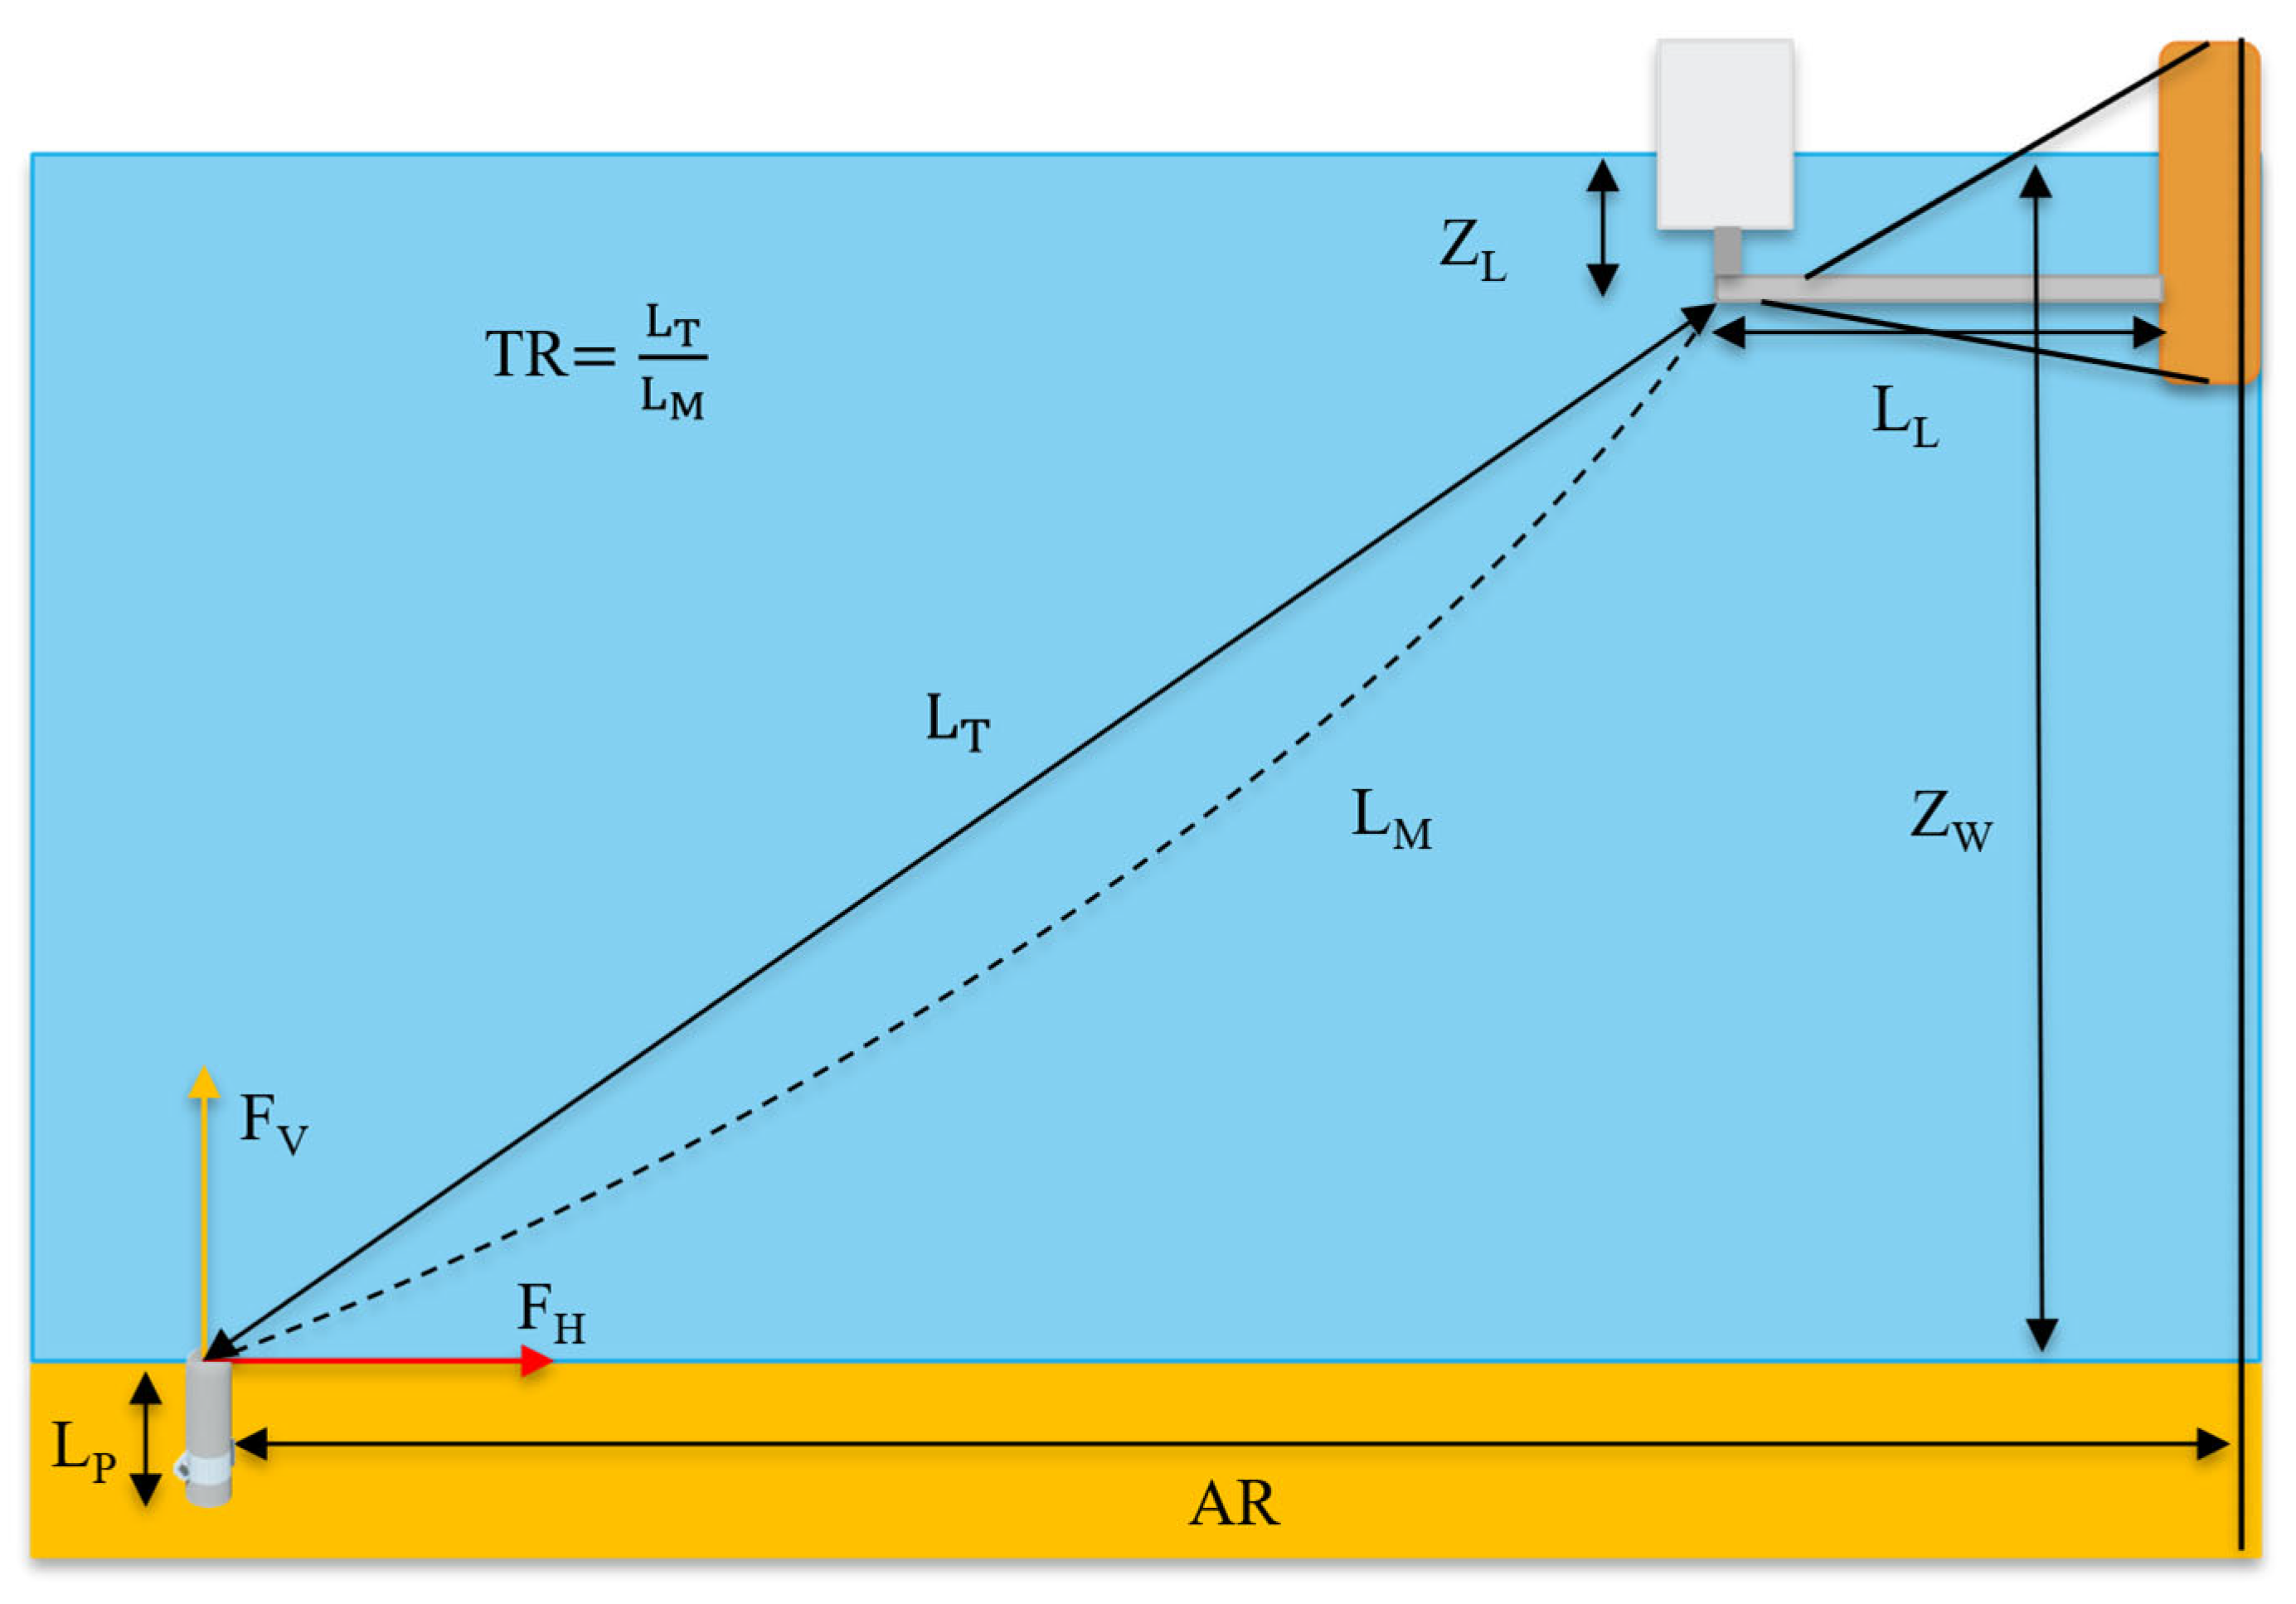
A general representation of the SMA configuration used in this study is detailed in
Figure 3. The concrete legs of the substructure are supported by top and bottom cable pairs, providing the required tension to keep the legs under compression under all expected loading levels. The buoyancy unit is rigidly attached to the leg tip. Whereas the depicted buoyancy unit-leg connection is simplified for the OpenFAST model [
15], it consists of seven individual glass-fiber-reinforced cans bundled together. Although the can-leg joint is fixed, the leg-stem joint has some flexibility, allowing for small rotations of the legs in the vertical and horizontal planes. The mooring line is attached at one end to the leg tip and a concrete suction anchor at the other end. For this study, a semi-taut mooring configuration is used with the tautness ratio defined in Equation (1) as the ratio of the completely taut distance between the leg tip and anchor point (L
T) to the unstretched mooring line length (L
M):
For example, a taut mooring line will have TR = 1 and LT = LM, meaning there is neither slack nor stretching in the line at static equilibrium (ignoring self-weight effects). If at static equilibrium the line is stretched, then TR > 1; if there is slack, then TR < 1. TRs greater than 1 at static equilibrium were avoided in this study, as the introduction of pretension in the mooring system would increase the mooring and anchor loading, and fatigue would be a larger concern, as is the case for TLP mooring and anchoring systems. The anchor radius (AR) is the horizontal projection of the distance vector from the origin of the reference frame to the anchor point. FV and FH are the vertical and horizontal anchor loads from the mooring line tension, and LP is the penetration length of the anchor.
2.2. Equivalent Mass Methodology
The cost model used for this study is the equivalent mass methodology [
8] with updated factors as described in [
16]. For a FOWT component of index j, the equivalent steel mass M
j,eq, herein referred to as equivalent mass, is determined using the actual component mass and a combination of material, fabrication, and installation factors as described in the following equations:
In Equation (2) f
m is the material factor, f
f is the fabrication factor, f
i is the installation factor, and M
j is the j-th component mass. In this form, the material factors are the price-per-kg of material normalized by the price-per-kg of steel (P
steel), so the material cost for a component is m
jf
m,jP
steel. The fabrication and installation factors are the fabrication and installation costs relative to the material costs. Including these factors when comparing FOWT designs (instead of just considering total material costs) allows for a more realistic and comprehensive evaluation of turbine designs across sites and points in time. These non-dimensional factors are unique depending on the component material, design, and installation requirements, and they are listed in
Table 1 for the SMA components, based on recent cost estimations [
8,
16]. Using this approach, the sum of the component equivalent masses is the SMA equivalent mass (
) of Equation (3), which is proportional to the total CapEx for the system as noted in Equation (4). Assuming a fixed turbine design with a set annual energy production for a given site (as is the case here), minimizing the SMA equivalent mass is equivalent to minimizing the LCOE of the system.
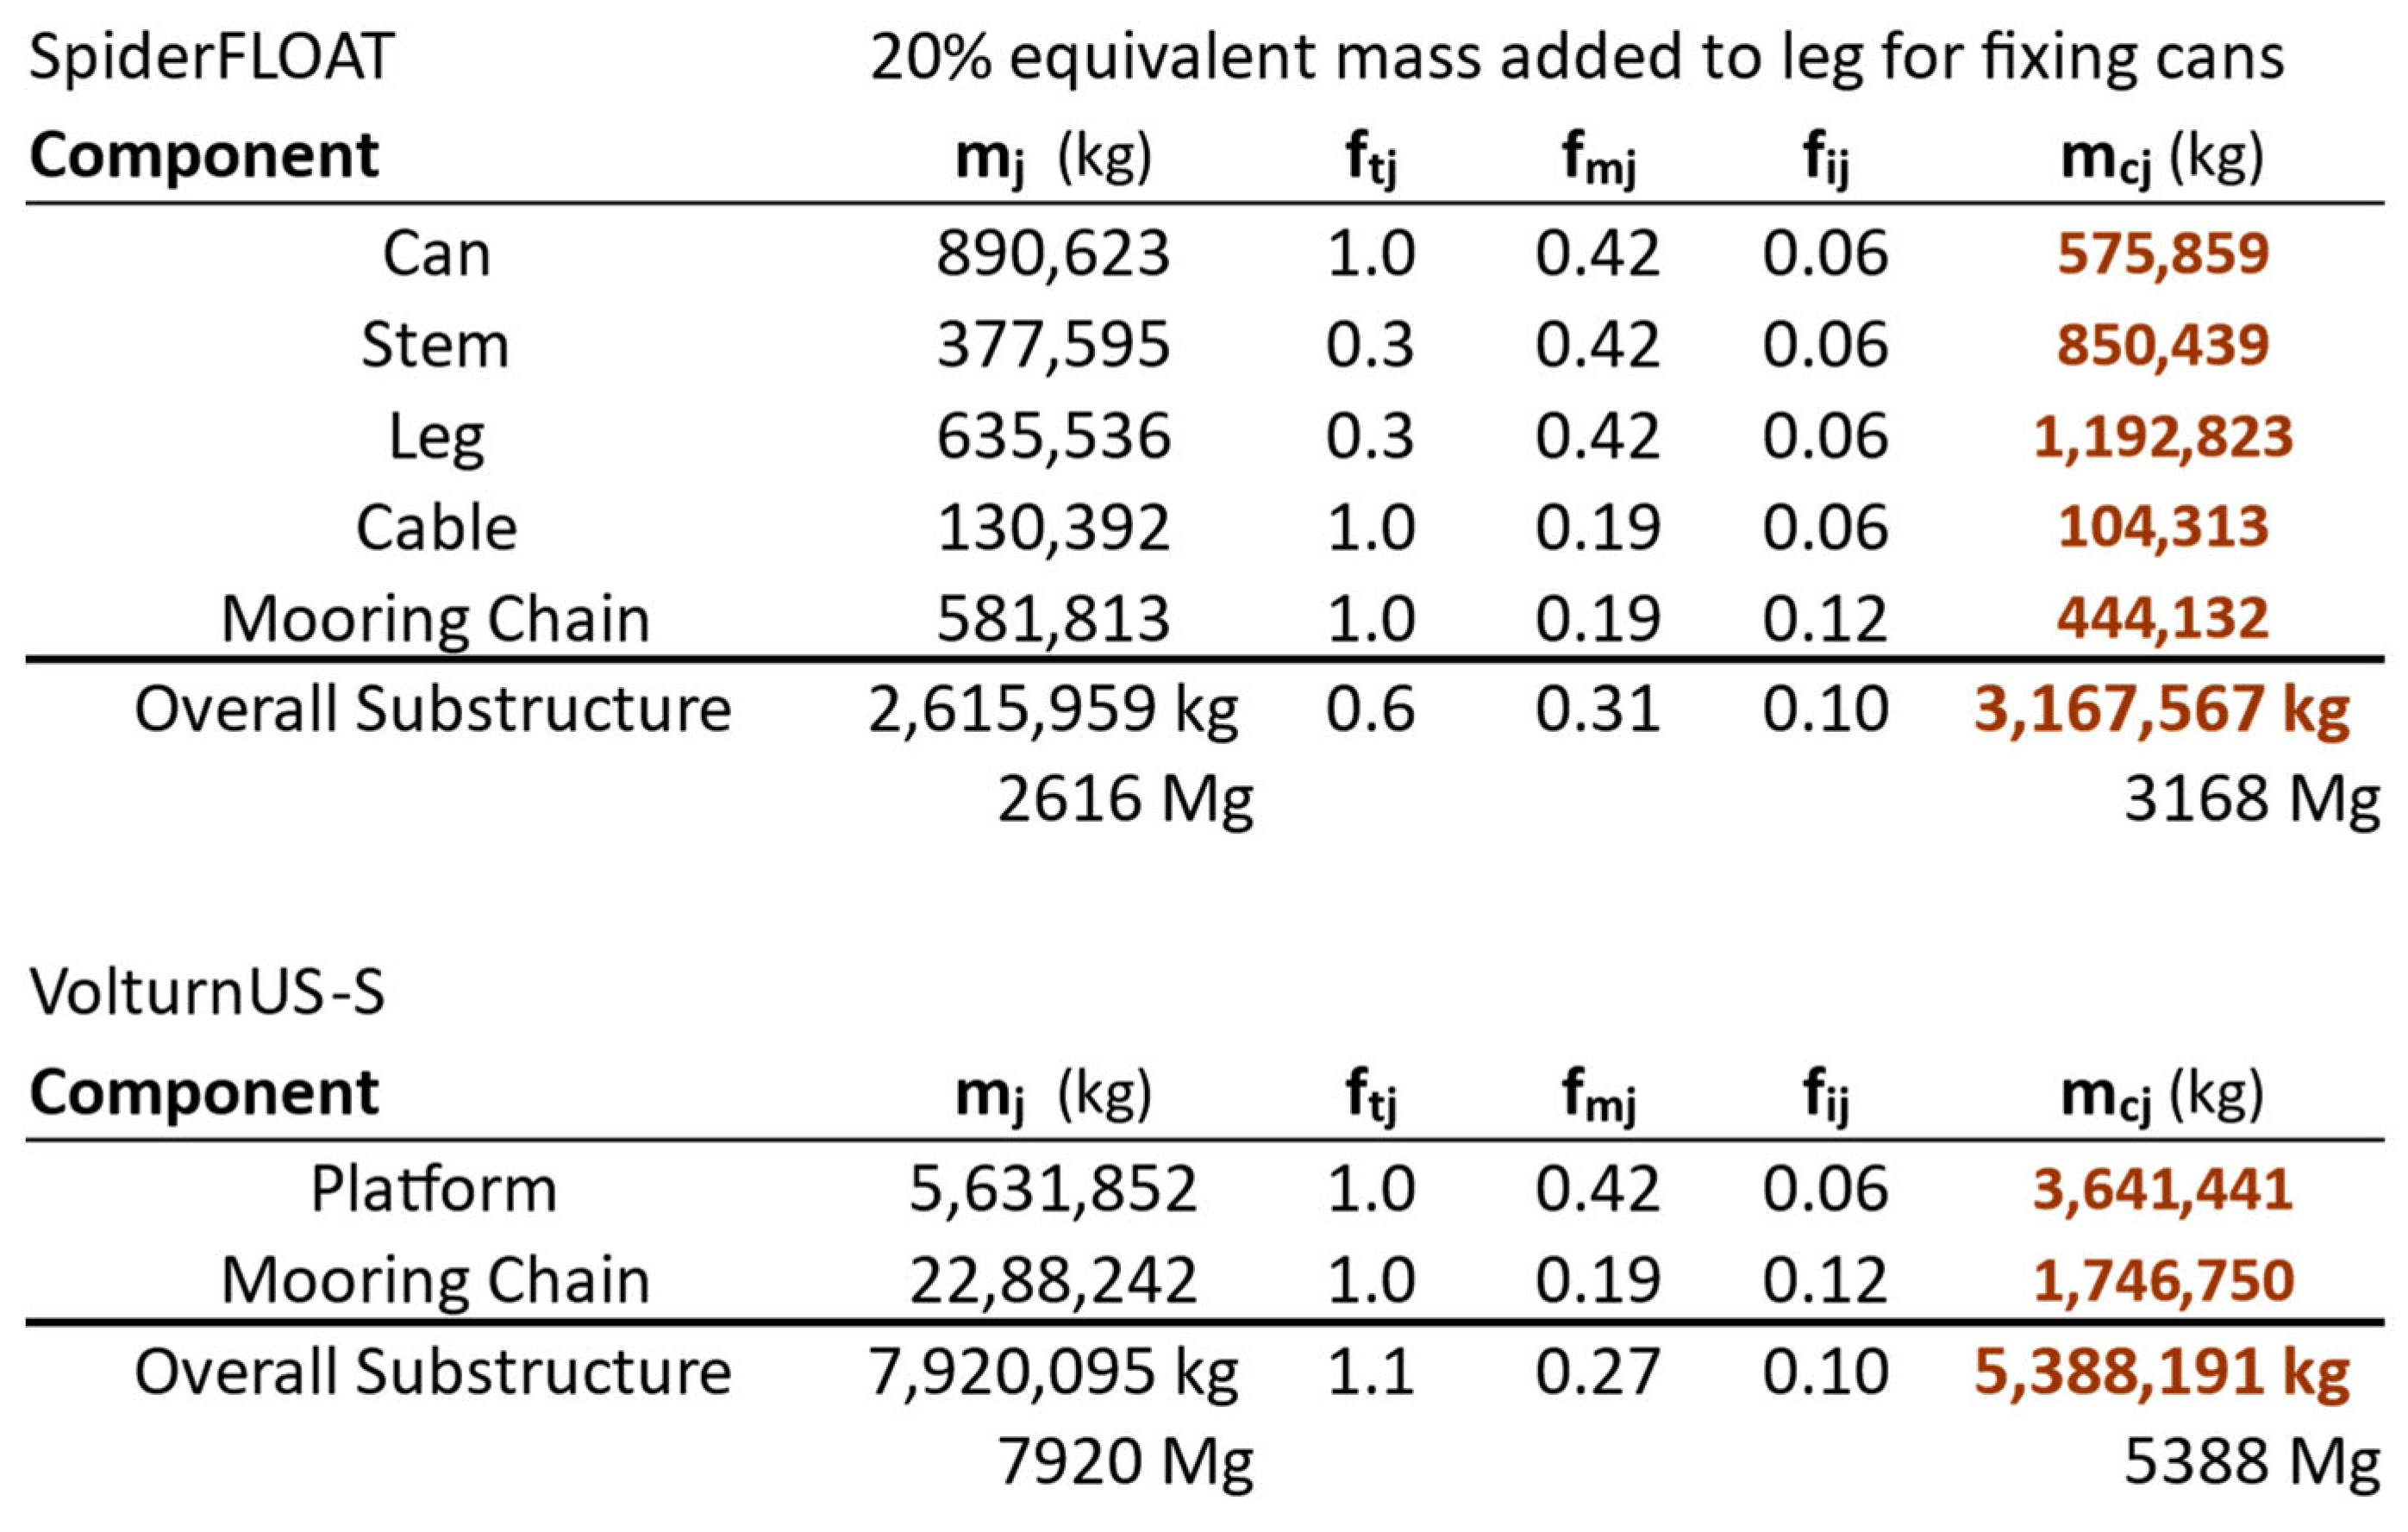
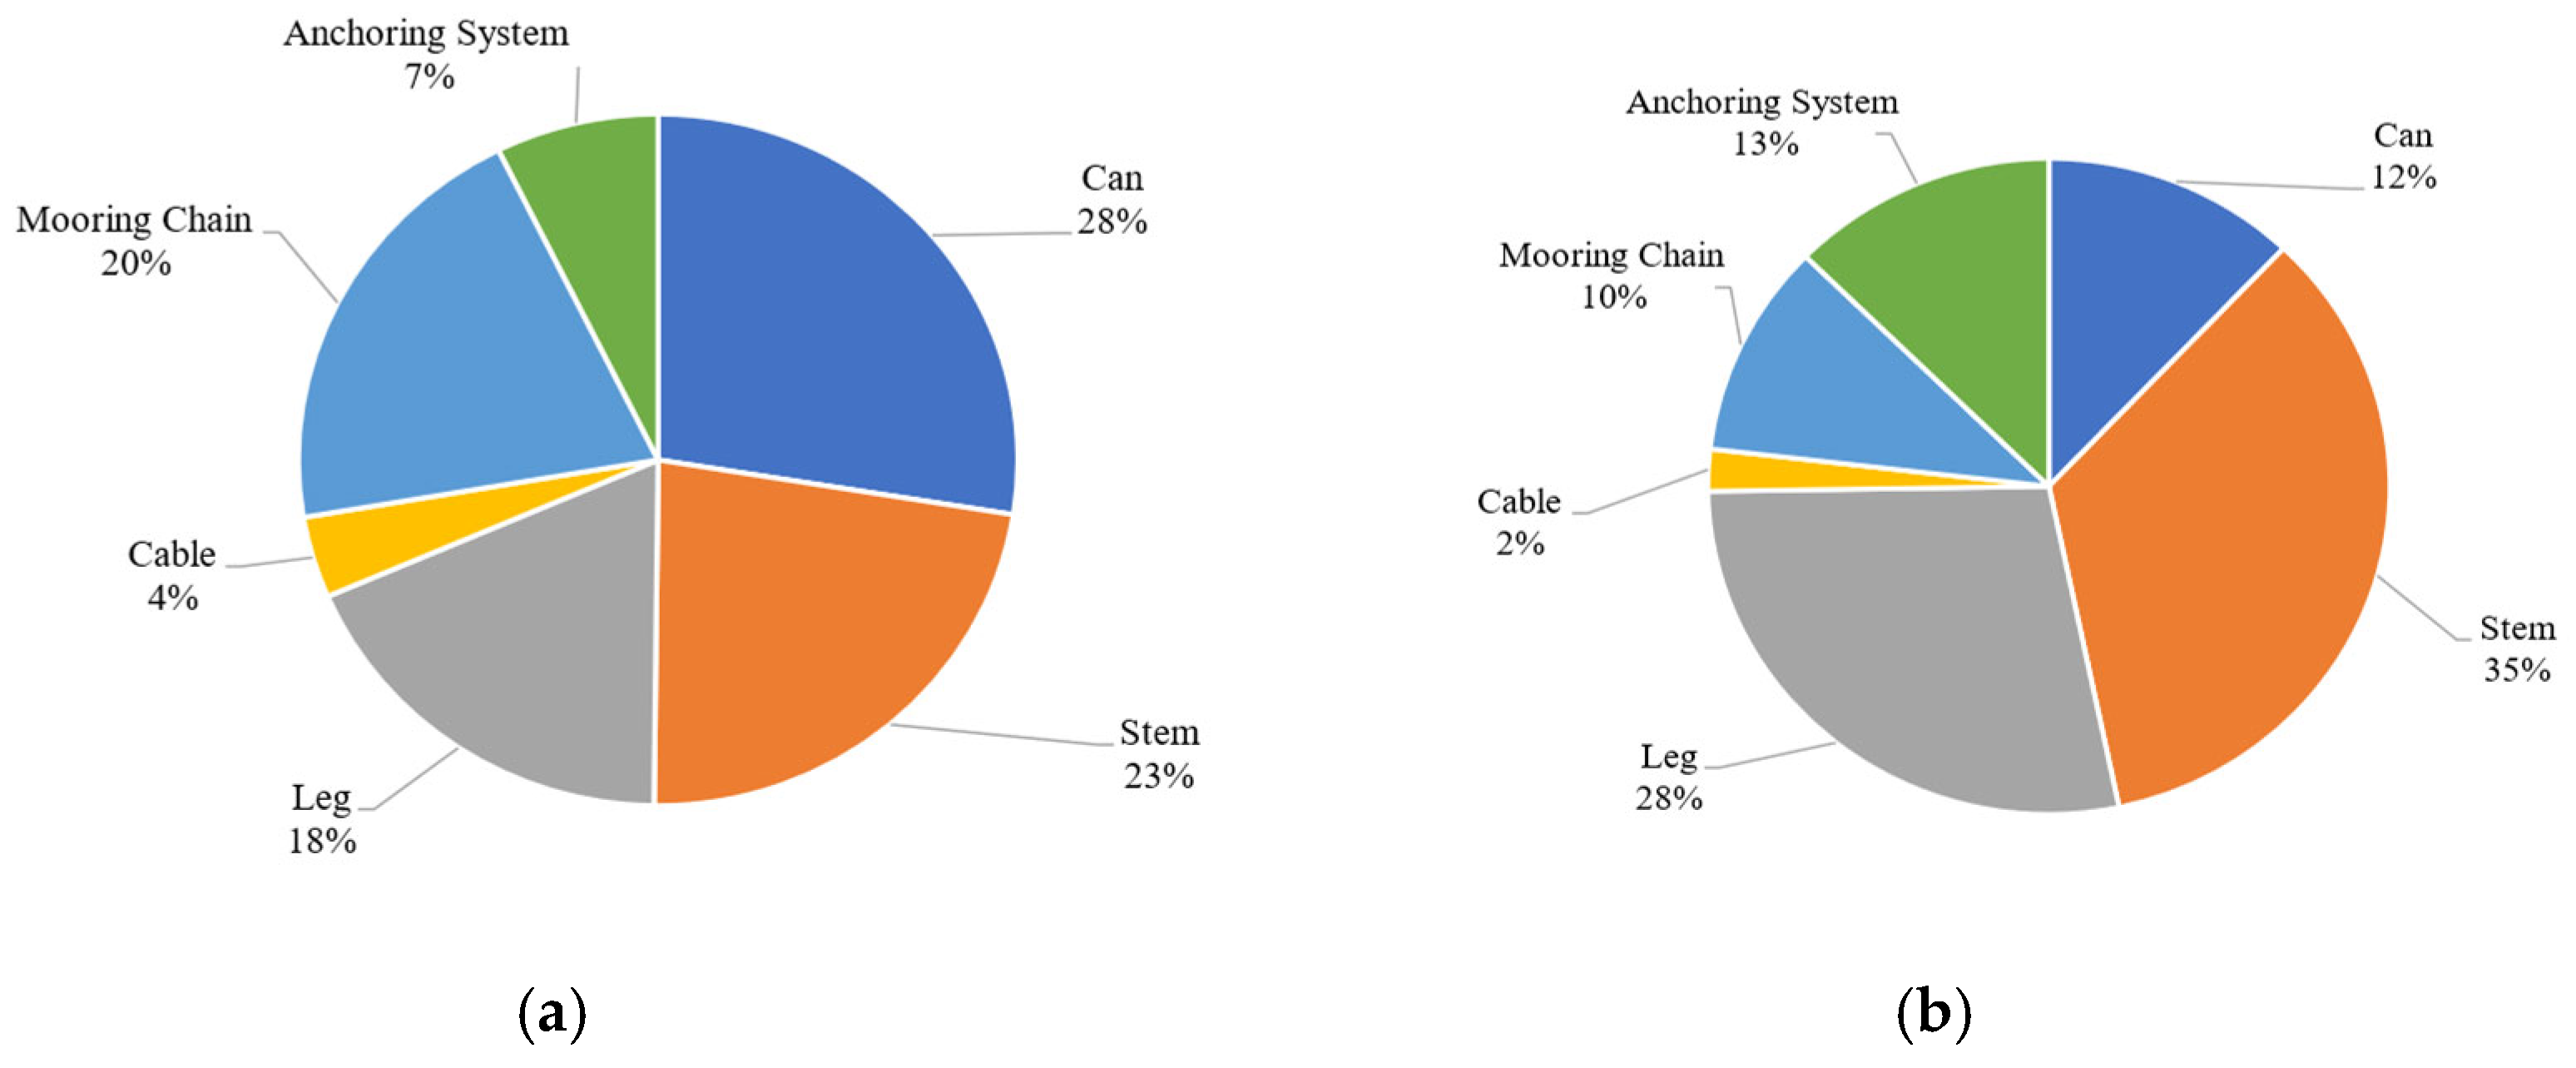
Most current semi-submersible designs rely on steel for the construction of the substructure. A basic substructure comparison of the reference 15-MW steel semi-submersible, VolturnUS-S [
7], and the baseline SF substructure configurations is included below as an example of the value in using equivalent mass as the objective function for FOWT substructure optimization and in substructure comparison.
Using
Table 1 material factors, the semi-submersible substructure configurations of the baseline 10-MW SF turbine and the 15-MW VolturnUS-S reference turbine [
7] are compared in
Table 2. The baseline 10-MW SF substructure was based on prior work performed by the USFLOWT team as part of the Advanced Research Projects Agency-Energy (ARPA-e) Aerodynamic Turbines Lighter and Afloat with Nautical Technologies and Integrated Servo-control (ATLANTIS) Program [
17]. For this comparison, the anchors were not included as no anchor specifications for the VolturnUS-S were available. It should be noted that the OpenFAST model of the SF substructure did not include a bracing design to fix the can bundles, so 20% of the leg equivalent mass was added to M
SMA,eq as an approximation to account for the equivalent mass of the bracing. A breakdown of this analysis is detailed in
Figure A1 in
Appendix A. Since these two turbines had different power ratings, the substructure mass and SMA equivalent mass were both normalized by the turbine power rating for a more direct comparison. Using this scaling, the SF substructure has a lower but similar mass-per-rated-power. However, the equivalent mass of the steel substructure of the VolturnUS-S is roughly twice that of the SF, indicating the baseline SF configuration nearly halves the substructure cost on a per-rated-power basis. This comparison illustrates the cost benefit of replacing steel with alternative materials such as concrete and fiberglass in FOWTs and the value in using equivalent mass as a metric to compare floating substructures.
2.3. Anchor Model
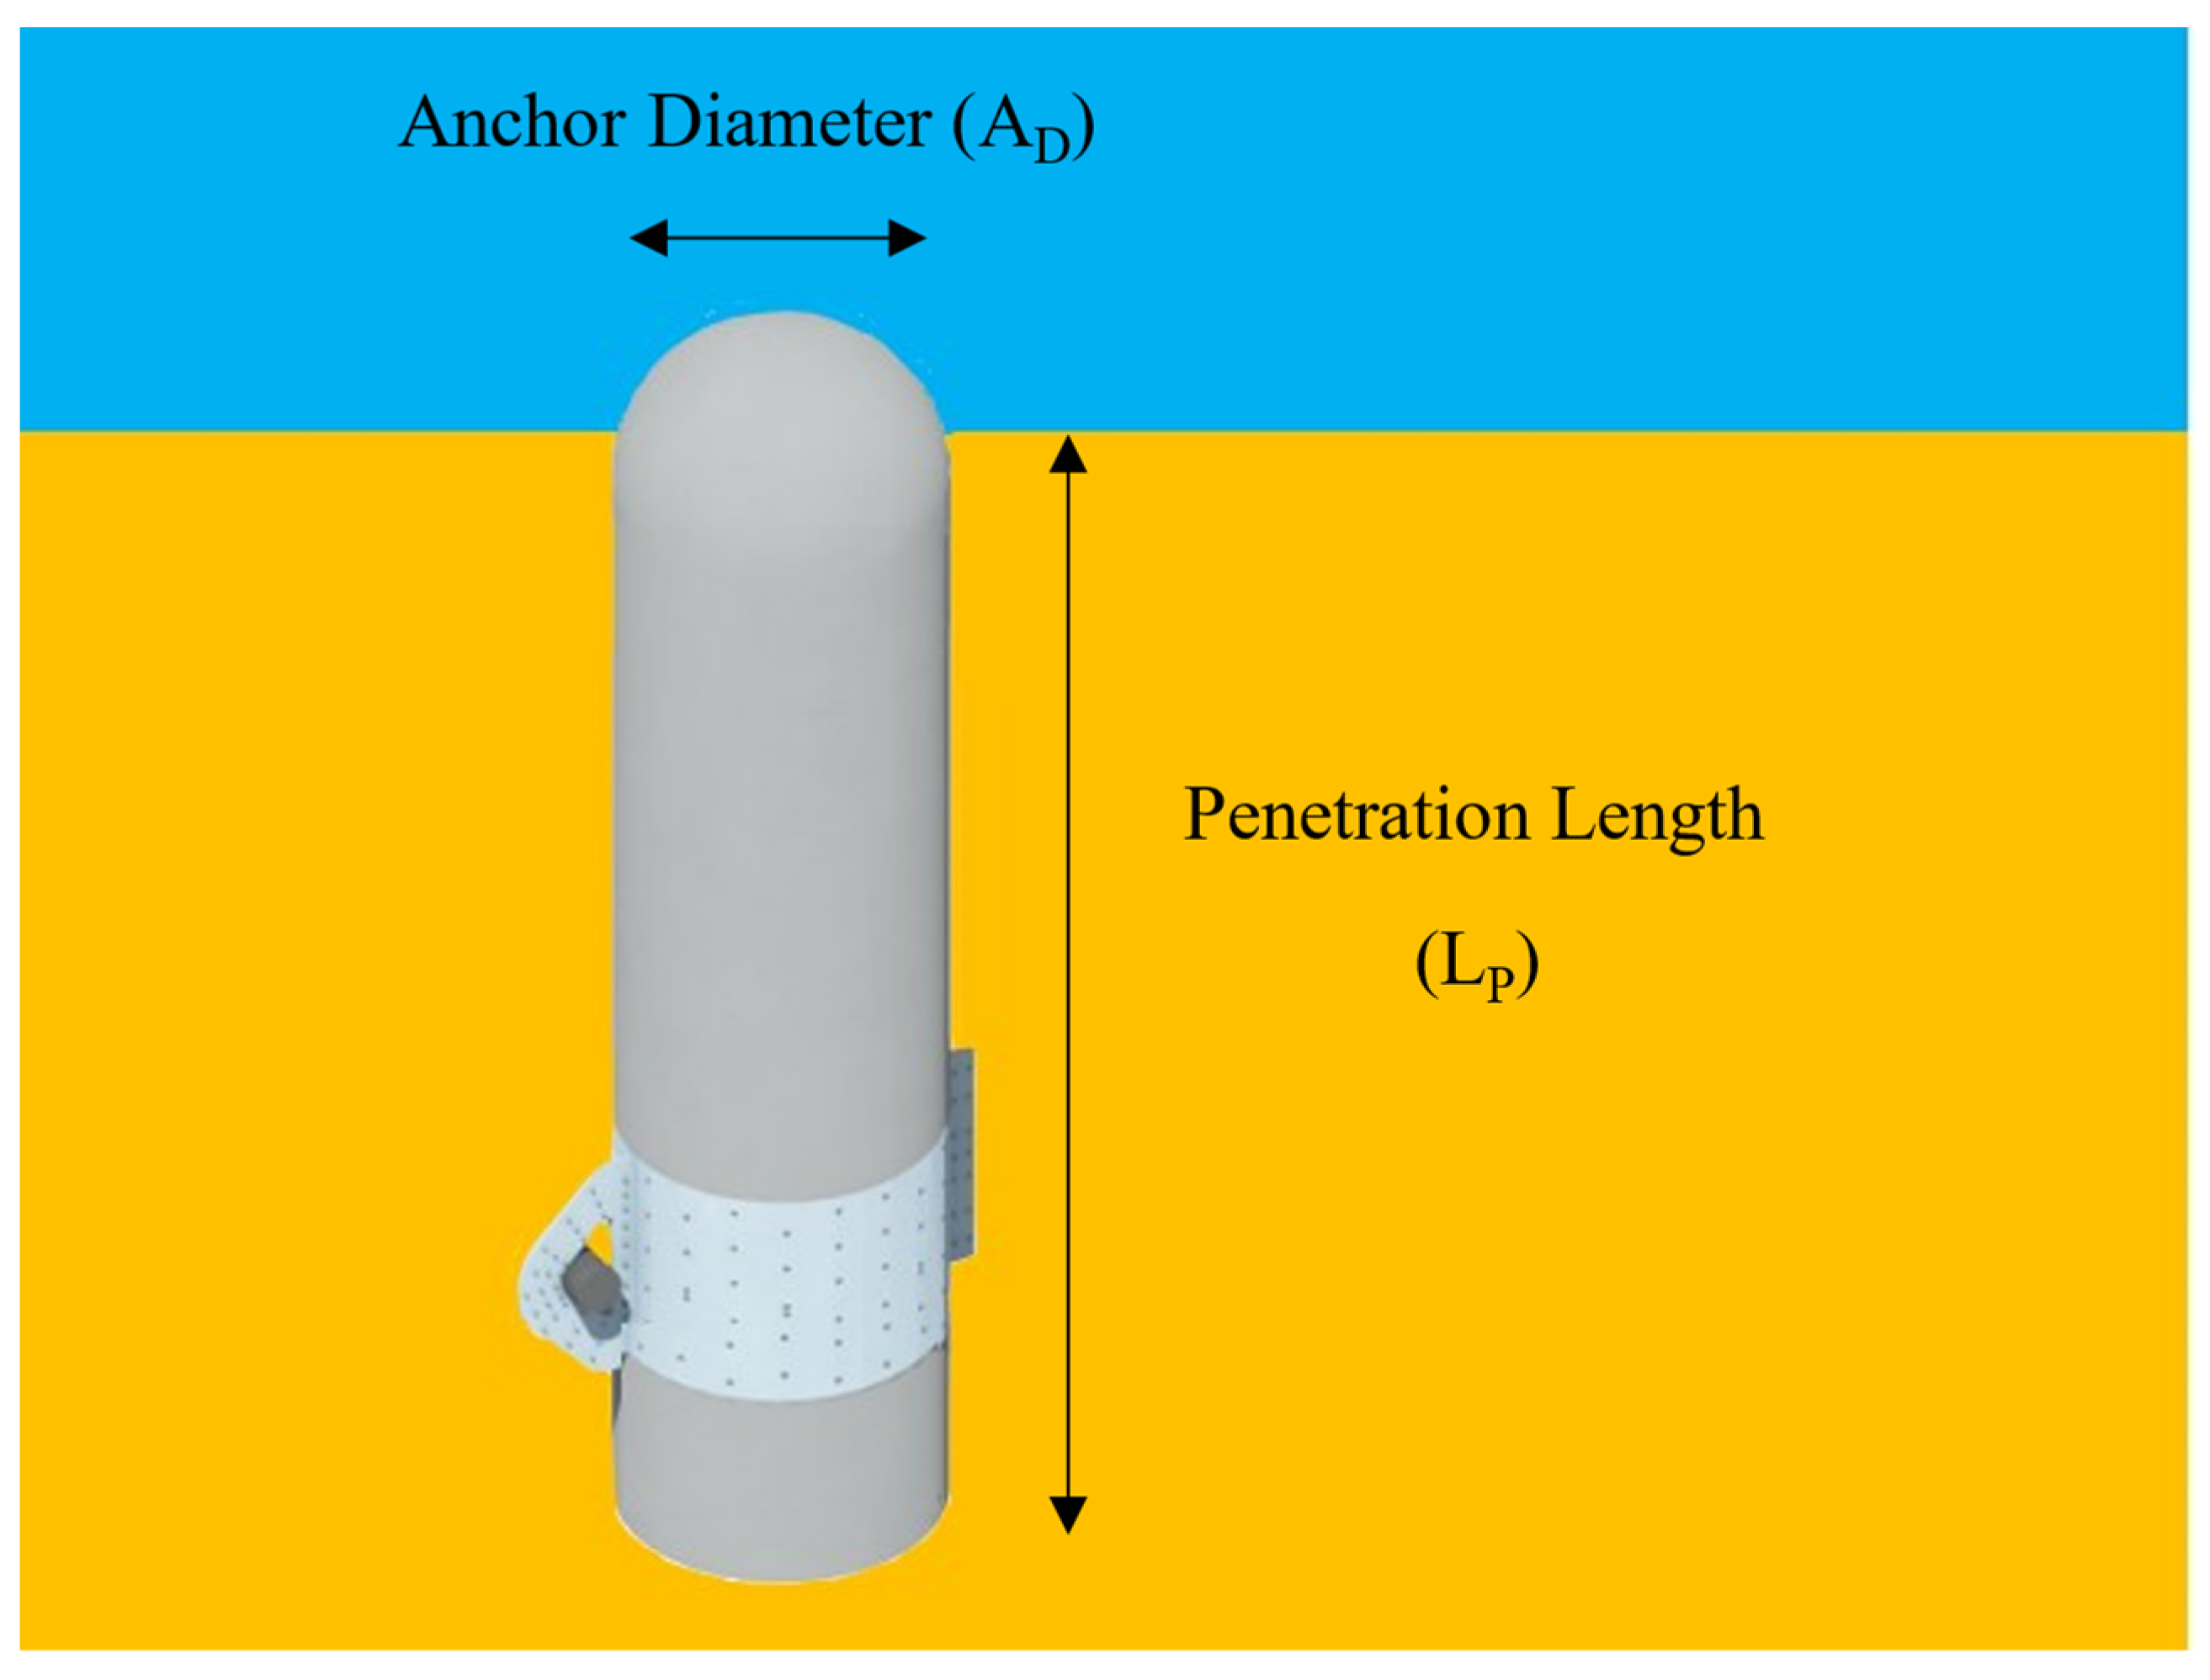
A slip-formed concrete suction anchor was modeled in this study. Concrete was chosen to reduce the overall anchor cost. The baseline anchor model is derived from a recent concrete suction anchor design study [
18]. A rendering of the anchor is provided in
Figure 4, illustrating a 19 m penetration length (L
P) and a 4 m anchor diameter (A
D). The anchor specifications were not used in the OpenFAST model, as only the loads at the anchor points were calculated and post-processed to determine the required anchor mass to withstand the seen anchor loading. This anchor sizing method is described in greater detail in
Section 2.6.
2.4. Turbine Specifications
The SF substructure and foundation are designed around the DTU 10-MW reference turbine. As noted in the introduction, the primary objective of this study is to reduce the contribution of a semi-submersible substructure to the overall system cost by optimizing SMA equivalent mass. No changes were made to the turbine or tower except for the tower being shortened by 12 m to accommodate the freeboard distance of the stem. The hub height of the turbine remains unchanged. Relevant turbine characteristics to this study are provided in
Table 3. More details on the DTU 10-MW turbine can be found in [
13].
2.5. Wind and Wave Conditions
A site just offshore of Monhegan Island was selected as the reference site, with the metocean conditions [
13], representing typical conditions along the northeastern coast of the United States, where FOWTs are likely to be installed. The extreme parked case shown in
Table 4 was chosen for this study because it rendered high substructure motion and loads that tend to drive substructure design. The effects of wind and wave misalignment were not considered in this study. The turbulent wind field was generated using the IEC Kaimal turbulence model for a 50-year extreme mean wind speed at the hub height and the irregular wave field with the JONSWAP spectrum model using the relevant parameters listed in
Table 4.
2.6. OpenFAST Methodology
OpenFAST, a multi-physics, multi-fidelity tool for non-linear aero-hydro-servo-elastic simulation of the coupled dynamic response of wind turbines in the time domain, was used to optimize the SF substructure in this study [
15]. For all cases, a 3600 s period (after removing the first 100 s to eliminate any start-up transients) was simulated in accordance with IEC standards for DLC 6.1a [
14]. Due to the extensive computational time required to run each case, only one seed was simulated. The metocean conditions were held constant, and the only variations between simulated cases were to individual SMA components.
Component equivalent masses were calculated using the component geometries as defined in OpenFAST. The baseline can wall thickness was determined using a diameter-to-wall-thickness ratio of 158 for similarly sized, commercially available, and highly robust fiberglass cans used for underground storage of petroleum [
19].
There are two design variables for the cans: length and draft. For changes in can length, the bottom of the can is fixed to maintain a constant draft, and the top of the can is adjusted to set the desired length, resulting in a modified can freeboard height. When modifying the can draft, the diameter of the can is adjusted to maintain the same submerged volume at static equilibrium below the SWL. The can diameter-to-wall-thickness ratio is unchanged, resulting in a different can mass when the can draft is modified. Because the can’s submerged volume remains constant, the cable layout did not change for all simulated can geometries, though the cable pre-tension and outer diameter were adjusted to account for the difference in can mass. Any mass difference is accounted for by adding or removing water ballast in the stem. The baseline can consists of a 19 m length, a 5.3 m outer diameter, and a 7 m draft.
The baseline configuration stem, leg, and cable specifications were determined using the SOFT4S structural optimization model [
6]. For sizing the leg and stem, a constant slenderness ratio (i.e., length over radius of gyration of the cross-section) for each component based on the baseline length and cross-section geometry was maintained as an attempt to ensure the structural integrity of the leg and stem. The 0.75 m leg and 0.375 m stem wall thicknesses were held constant. Changes in the leg and stem lengths resulted in the resizing and pre-tensioning of the cables, with the assumed constraint of level legs when out of water (assembly phase). The anchor location was slightly adjusted to maintain the tautness ratio, accommodating geometric changes to the leg and stem. Both the leg and stem initial lengths were set at 30 m.
The mass of the anchoring system was determined through post-processing of the output anchor loads. The maximum vertical and horizontal loads at the anchor node were used to appropriately size the anchor and determine the anchor equivalent mass.
Based on the results of [
18], the baseline anchor’s technical specifications, including the anchor dimensions, mass, and vertical and horizontal capacities, were determined. For a given water depth, anchor diameter, soil shear strength, and the horizontal and vertical anchor holding capacities of a baseline anchor were determined. The study found that both the vertical and horizontal anchor holding capacities scale roughly with the square of the anchor diameter (Equation (5)) [
18]. Since the cross-section of the anchor is circular, the anchor holding capacity also scales with the square of the anchor mass (Equation (6)).
Therefore, a scaling factor, depicted in Equation (7), was determined as the square root of the ratio of the maximum anchor horizontal force (
) to the baseline anchor horizontal holding capacity (
). This scaling factor is defined as the horizontal holding capacity factor (S
H) for horizontal loading of the anchor, and, similarly, a vertical holding capacity factor (S
V) is defined for vertical loading of the anchor.
Determination of the anchor equivalent mass is depicted in Equation (8), where M
A,b is the baseline anchor mass. The greater of the two scaling factors is used to size the anchor. For example, if S
H = 1 and S
V < 1, then no scaling is needed since the horizontal loads are driving the anchor size and are consistent with the baseline anchor specifications. However, in the case S
H = S
V, this indicates that the anchor mass is driven equally by the horizontal and vertical loads (i.e., M
A = M
A,bS
H = M
A,bS
V). In the case S
H > S
V > 1, this indicates that the anchor mass is driven by the horizontal loads (i.e., M
A,bS
H > M
A,bS
V) and that the baseline anchor must be scaled up from the baseline to handle the horizontal anchor loads.
2.7. Optimization Scheme
A detailed time-domain analysis framework using OpenFAST and employing the equivalent mass methodology was utilized to evaluate the objectives mentioned at the end of
Section 1. Since only the extreme parked case was used in this study, the selected constraints focused primarily on the dynamic stability of the FOWT. The decision variables, along with the respective constraints imposed on them, are shown in
Figure 5 and listed in
Table 5. The submergence constraint k is defined in detail in Equation (9), which is determined using sub and sub
0 as depicted in
Figure 5.
The decision variables chosen were the maximum pitch (ϴ
max) and roll (ϕ
max) of the platform, the minimum can submergence (k
min), the metacentric height (GM), and the maximum horizontal RNA acceleration (a
max). The metacentric height serves as a measure of the static stability of the system. GM is used to filter out statically unstable substructure configurations due to geometric changes in components. While there is currently no set standard for evaluating FOWTs, a few studies [
9,
10] have used a maximum pitch angle constraint of 10° (ϴ
max < 10°) [
9]. They also imposed constraints on a
max of 2.5 m/s
2 and on GM being greater than zero. DNV suggests a maximum tilt angle of 15° and 0.6 g maximum acceleration at tower top are acceptable for DLC 6.1 [
20]; however, to be consistent with the existing literature, the more restrictive values of similar studies were used to constrain the maximum platform pitch and horizontal RNA acceleration. A GM constraint of 10 m was chosen for this study for a minimum pitch and roll hydrostatic stiffness. The ϴ
max constraint of the system was chosen based on the baseline design having a ϴ
max value of approximately 8.5° and wanting to determine a system configuration that was more dynamically stable in pitch than the baseline configuration. The ϕ
max constraint was relaxed compared to the pitch counterpart, given that the highest loads are driven primarily by the pitch response under the simulated cases. The a
max constraint was chosen based on [
9] and is a proxy for the substructure loading.
The final constraint is k
min, which ensures that no can in the buoyancy unit (bundle of 7 cans) is completely submerged at any point during the simulation. This constraint is based on recent standards for semi-submersible buoyancy columns [
21]. This constraint is represented mathematically in Equation (9), where sub is the percentage of the can submerged below the SWL, and k is a measure of the change in can length above the SWL relative to the static equilibrium position. As such, if k > 0 for all times, then all cans satisfy the submergence constraint, which can be expressed as k
min > 0. For example, a can with 30% of its length submerged at static equilibrium (i.e., sub
0 = 30) and 65% of its length submerged at some time step (i.e., sub = 65) would have a k value of 0.5 for that time step, denoting only half of the can length above the SWL at static equilibrium remains unsubmerged at that time step.
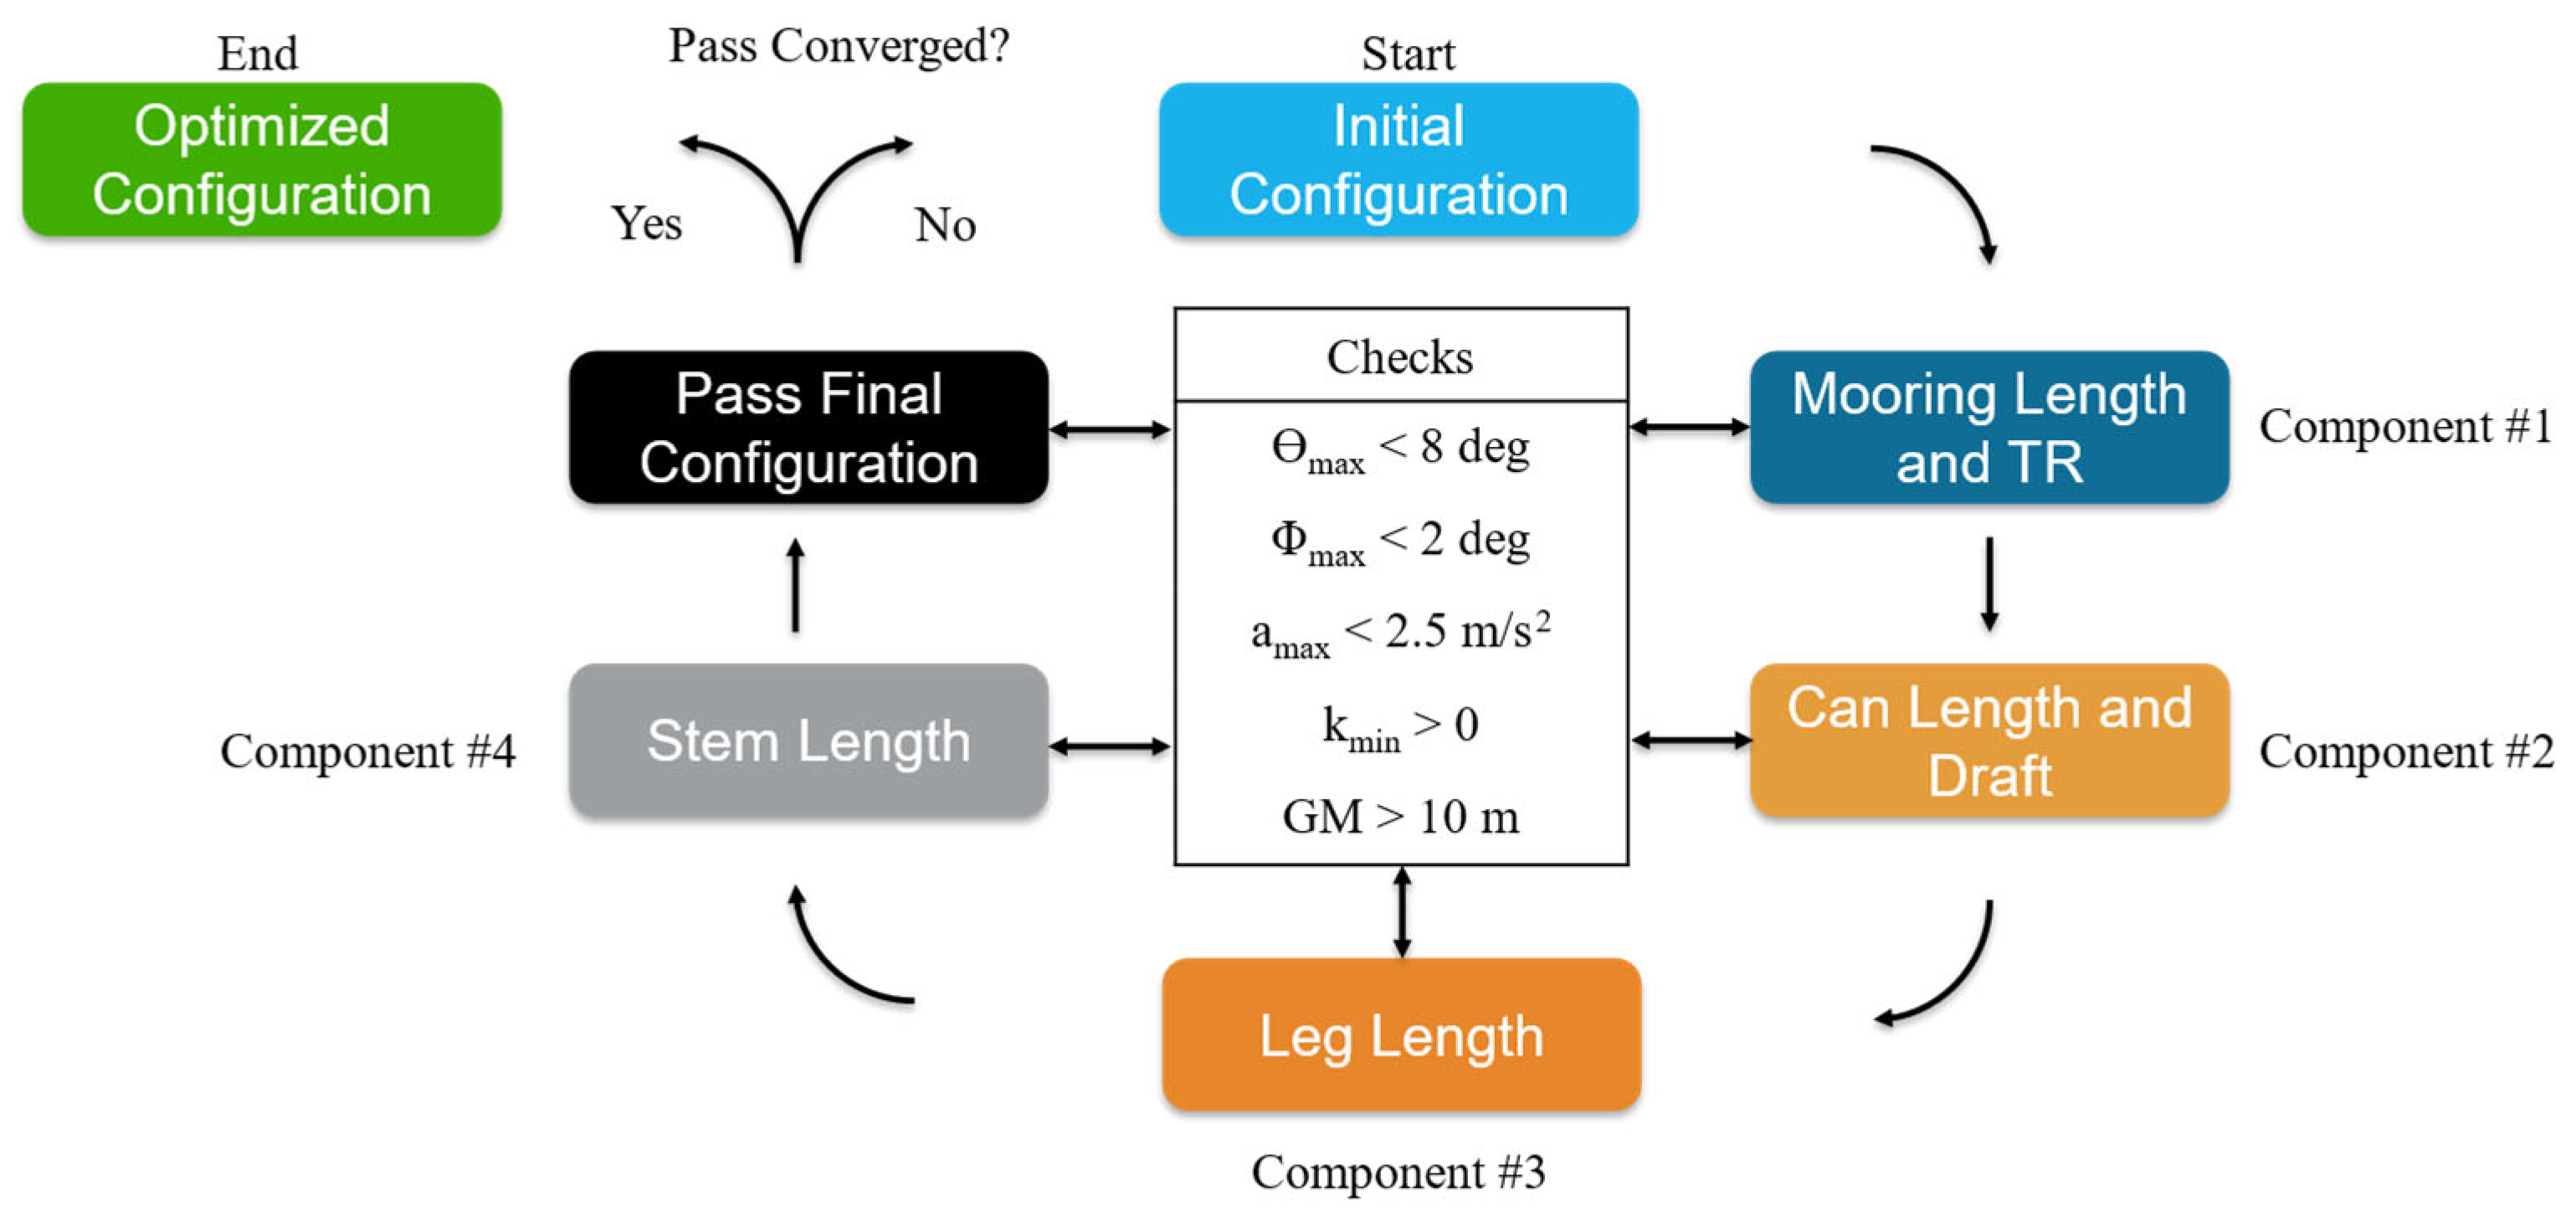
The objective function that was minimized in this optimization scheme is SMA equivalent mass, which was calculated using the component factors provided in
Table 1. The scheme explores the sensitivity of SMA equivalent mass to components by varying design variables associated with individual components. The order of this optimization cycle is shown in
Figure 6. For a single pass, the global optimization scheme starts with an initial configuration, which corresponds to the baseline design in the case of the first pass, and iterates through the sizing of the individual components to capture the influences of each component on the system dynamic response. The five different and local optimization sets occur by considering first the components that have the greatest impact on the objective function [
16]. For example, SMA equivalent mass was found to be significantly influenced broadly by changes in the length and tautness ratio of the mooring lines (Component #1), while changes in the stem length (Component #4) had the smallest cumulative effect on SMA equivalent mass in prior simulations of SF. Using this approach of multiple local optimizations within a single pass also allowed for an exploration of the system’s sensitivity to individual components and their design variables.
Once a component has been resized, it is fixed for the rest of that pass. Once every component has been appropriately resized, the final configuration for that pass is compared with that of the initial configuration to check for convergence between the passes. When the difference in configurations between successive passes becomes small (e.g., the SMA equivalent mass changes are less than 5% relative to prior component iterations while all constraints are met), it is assumed that the optimal configuration has been found. If the final configuration of a pass has not converged, then that configuration becomes the initial configuration for a new pass, and the process is continued until convergence occurs.
3. Results
3.1. First Pass of Mooring Line Length and Tautness Ratio
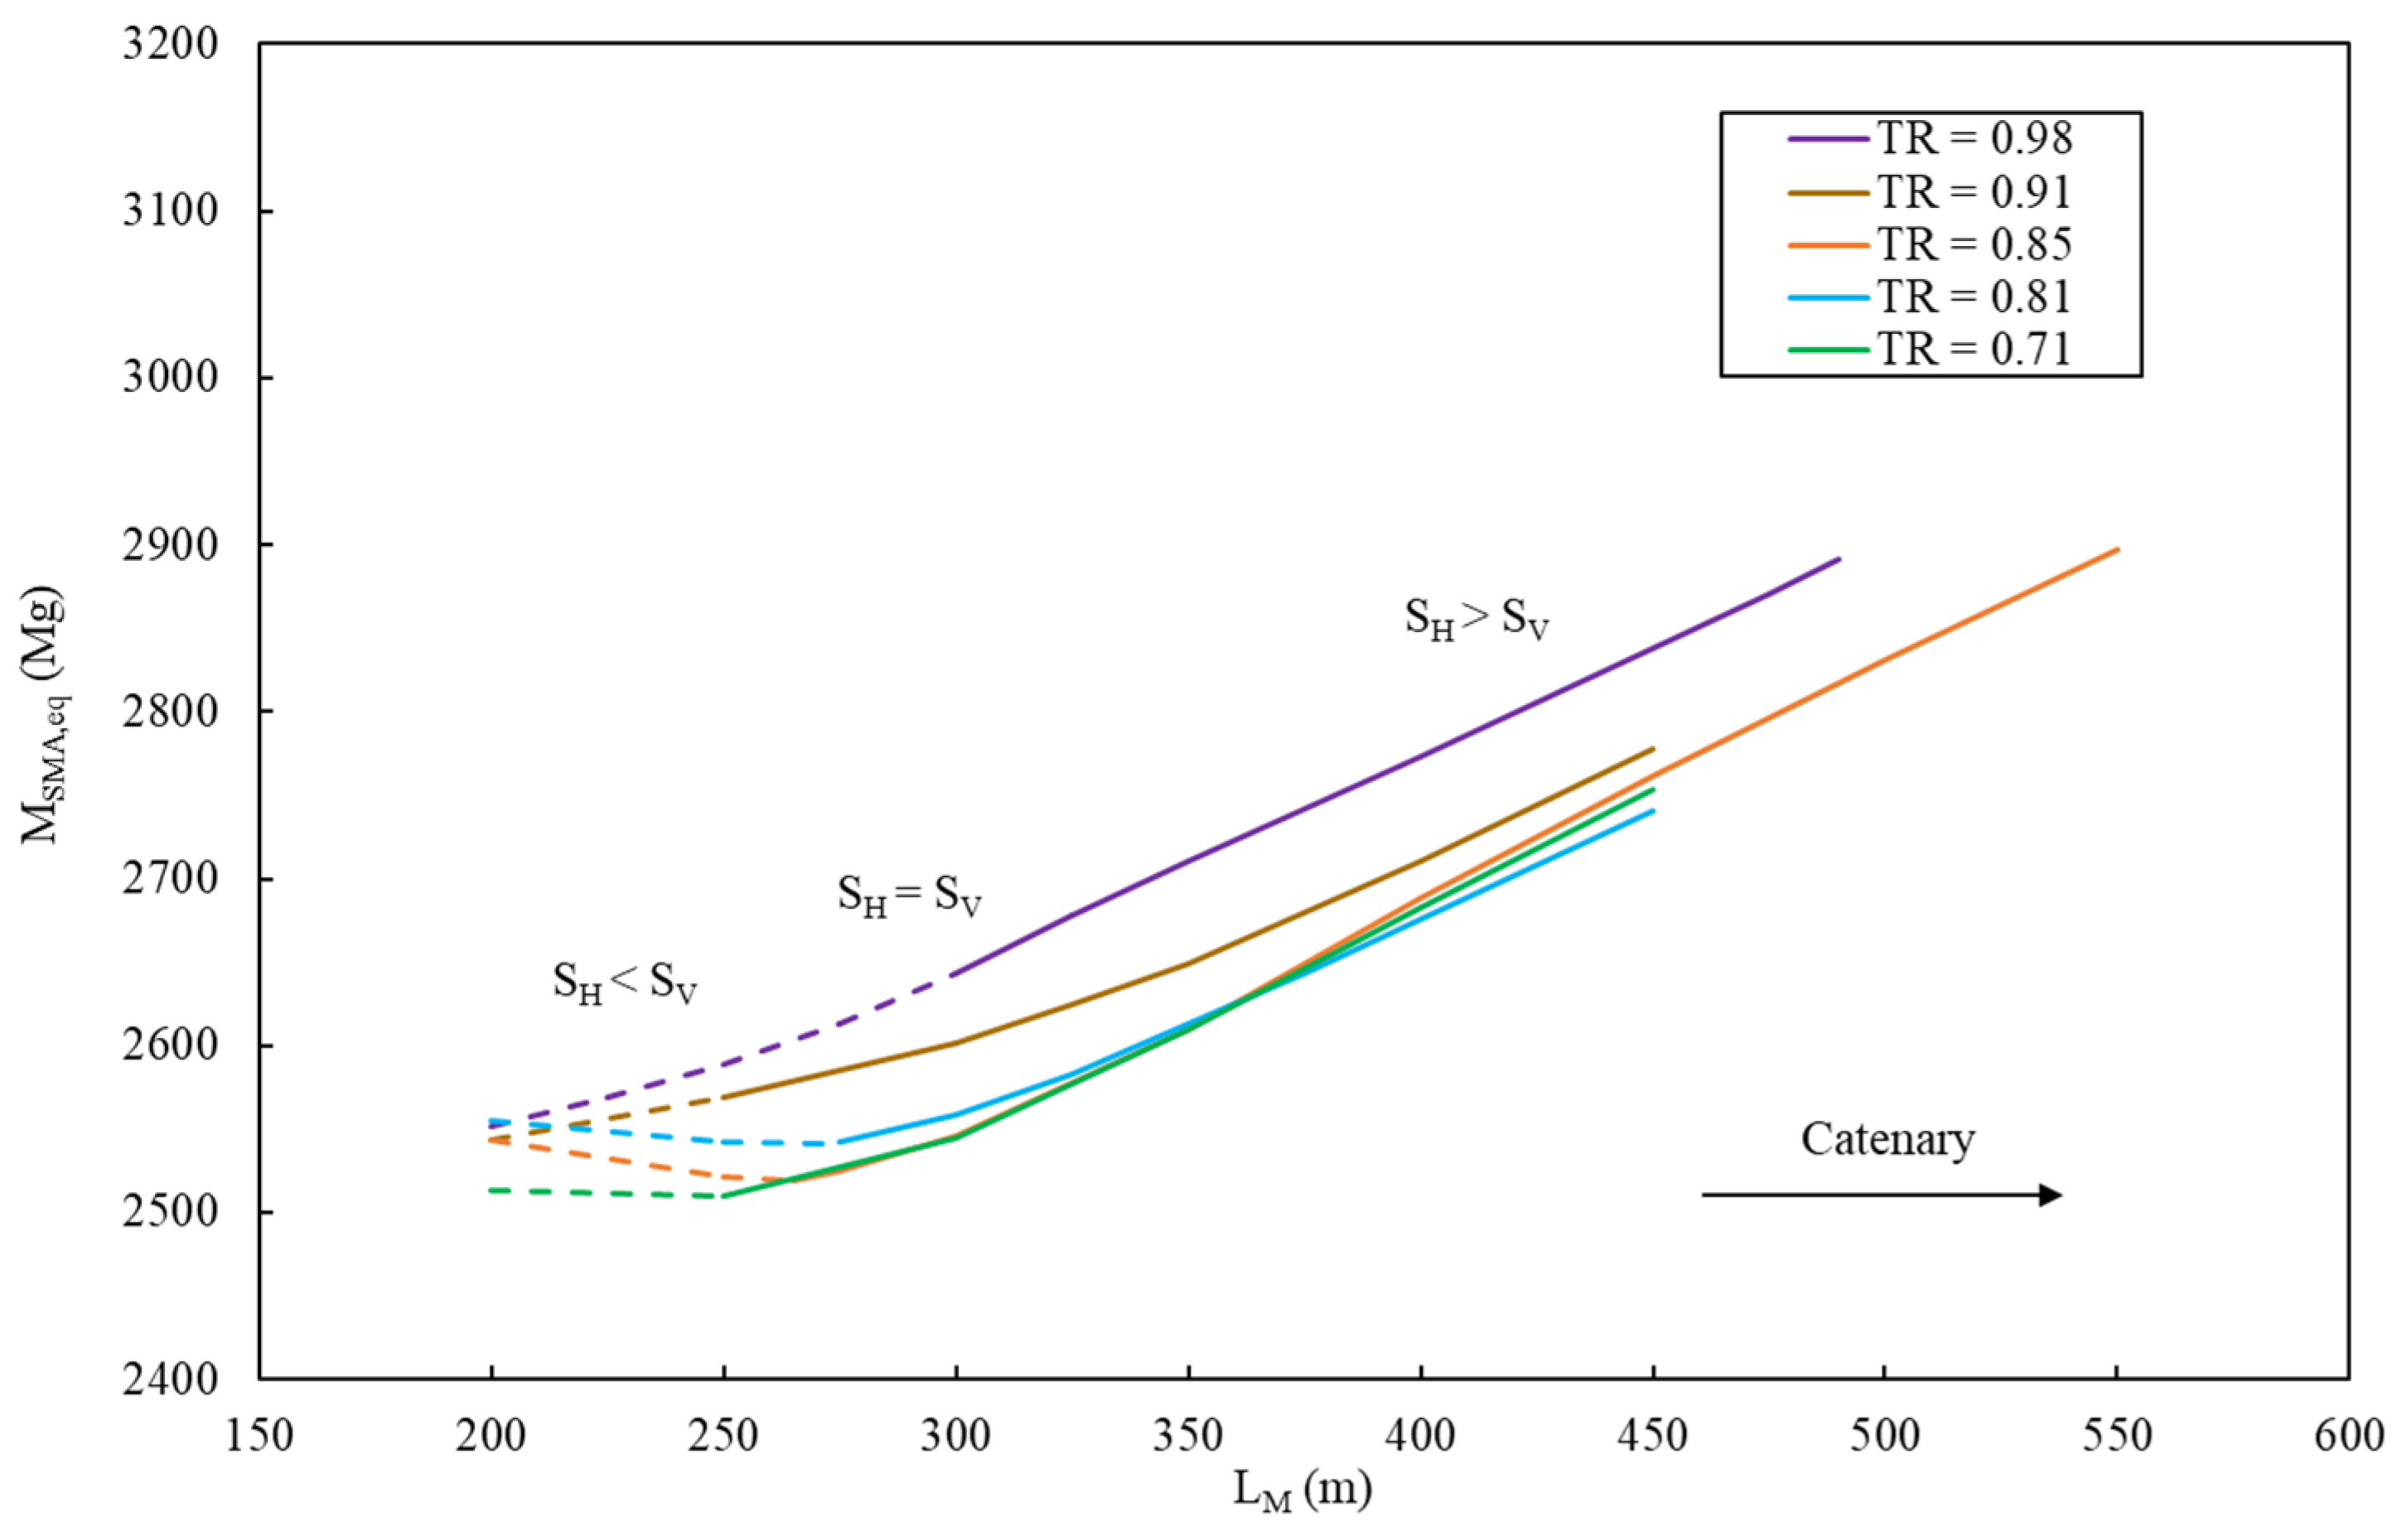
The first component set investigated was the mooring lines with two design variables: length (L
M) and tautness ratio (TR). These two variables were found to especially impact mooring and anchor mass and thus have a strong impact on SMA equivalent mass (and thus on LCOE). For a given TR, the change in L
M is equivalent to changing the anchor radius. The influence of L
M on M
SMA,eq for a set of TRs is shown in
Figure 7.
Generally, M
SMA,eq increases with L
M across all TRs. However, there are two distinct regions with varying degrees of linearity that become more apparent as TR is lowered. For each respective TR in
Figure 7, the solid line portions indicate the mooring lengths for which the anchor equivalent mass required to meet the horizontal load capacity of the anchor exceeds that of the vertical load capacity (S
H > S
V). In contrast, the dashed region indicates the opposite. As the mooring system is drawn tauter in static equilibrium, which represents a higher TR, the mooring system has a higher restoring stiffness. This higher restoring stiffness results in greater anchor loading as TR increases because the substructure surges less and pitches more, resulting in higher mooring line tension. This can be seen in
Figure 7 as M
SMA,eq generally increases with TR due to the higher anchor mass required to handle the larger anchor loading. Longer lines add more mass and have smaller angles between the mooring line and seabed, resulting in the anchor carrying a larger portion of the load in the horizontal direction compared to shorter lines. This explains the transition of the dashed to the solid regions across all TRs.
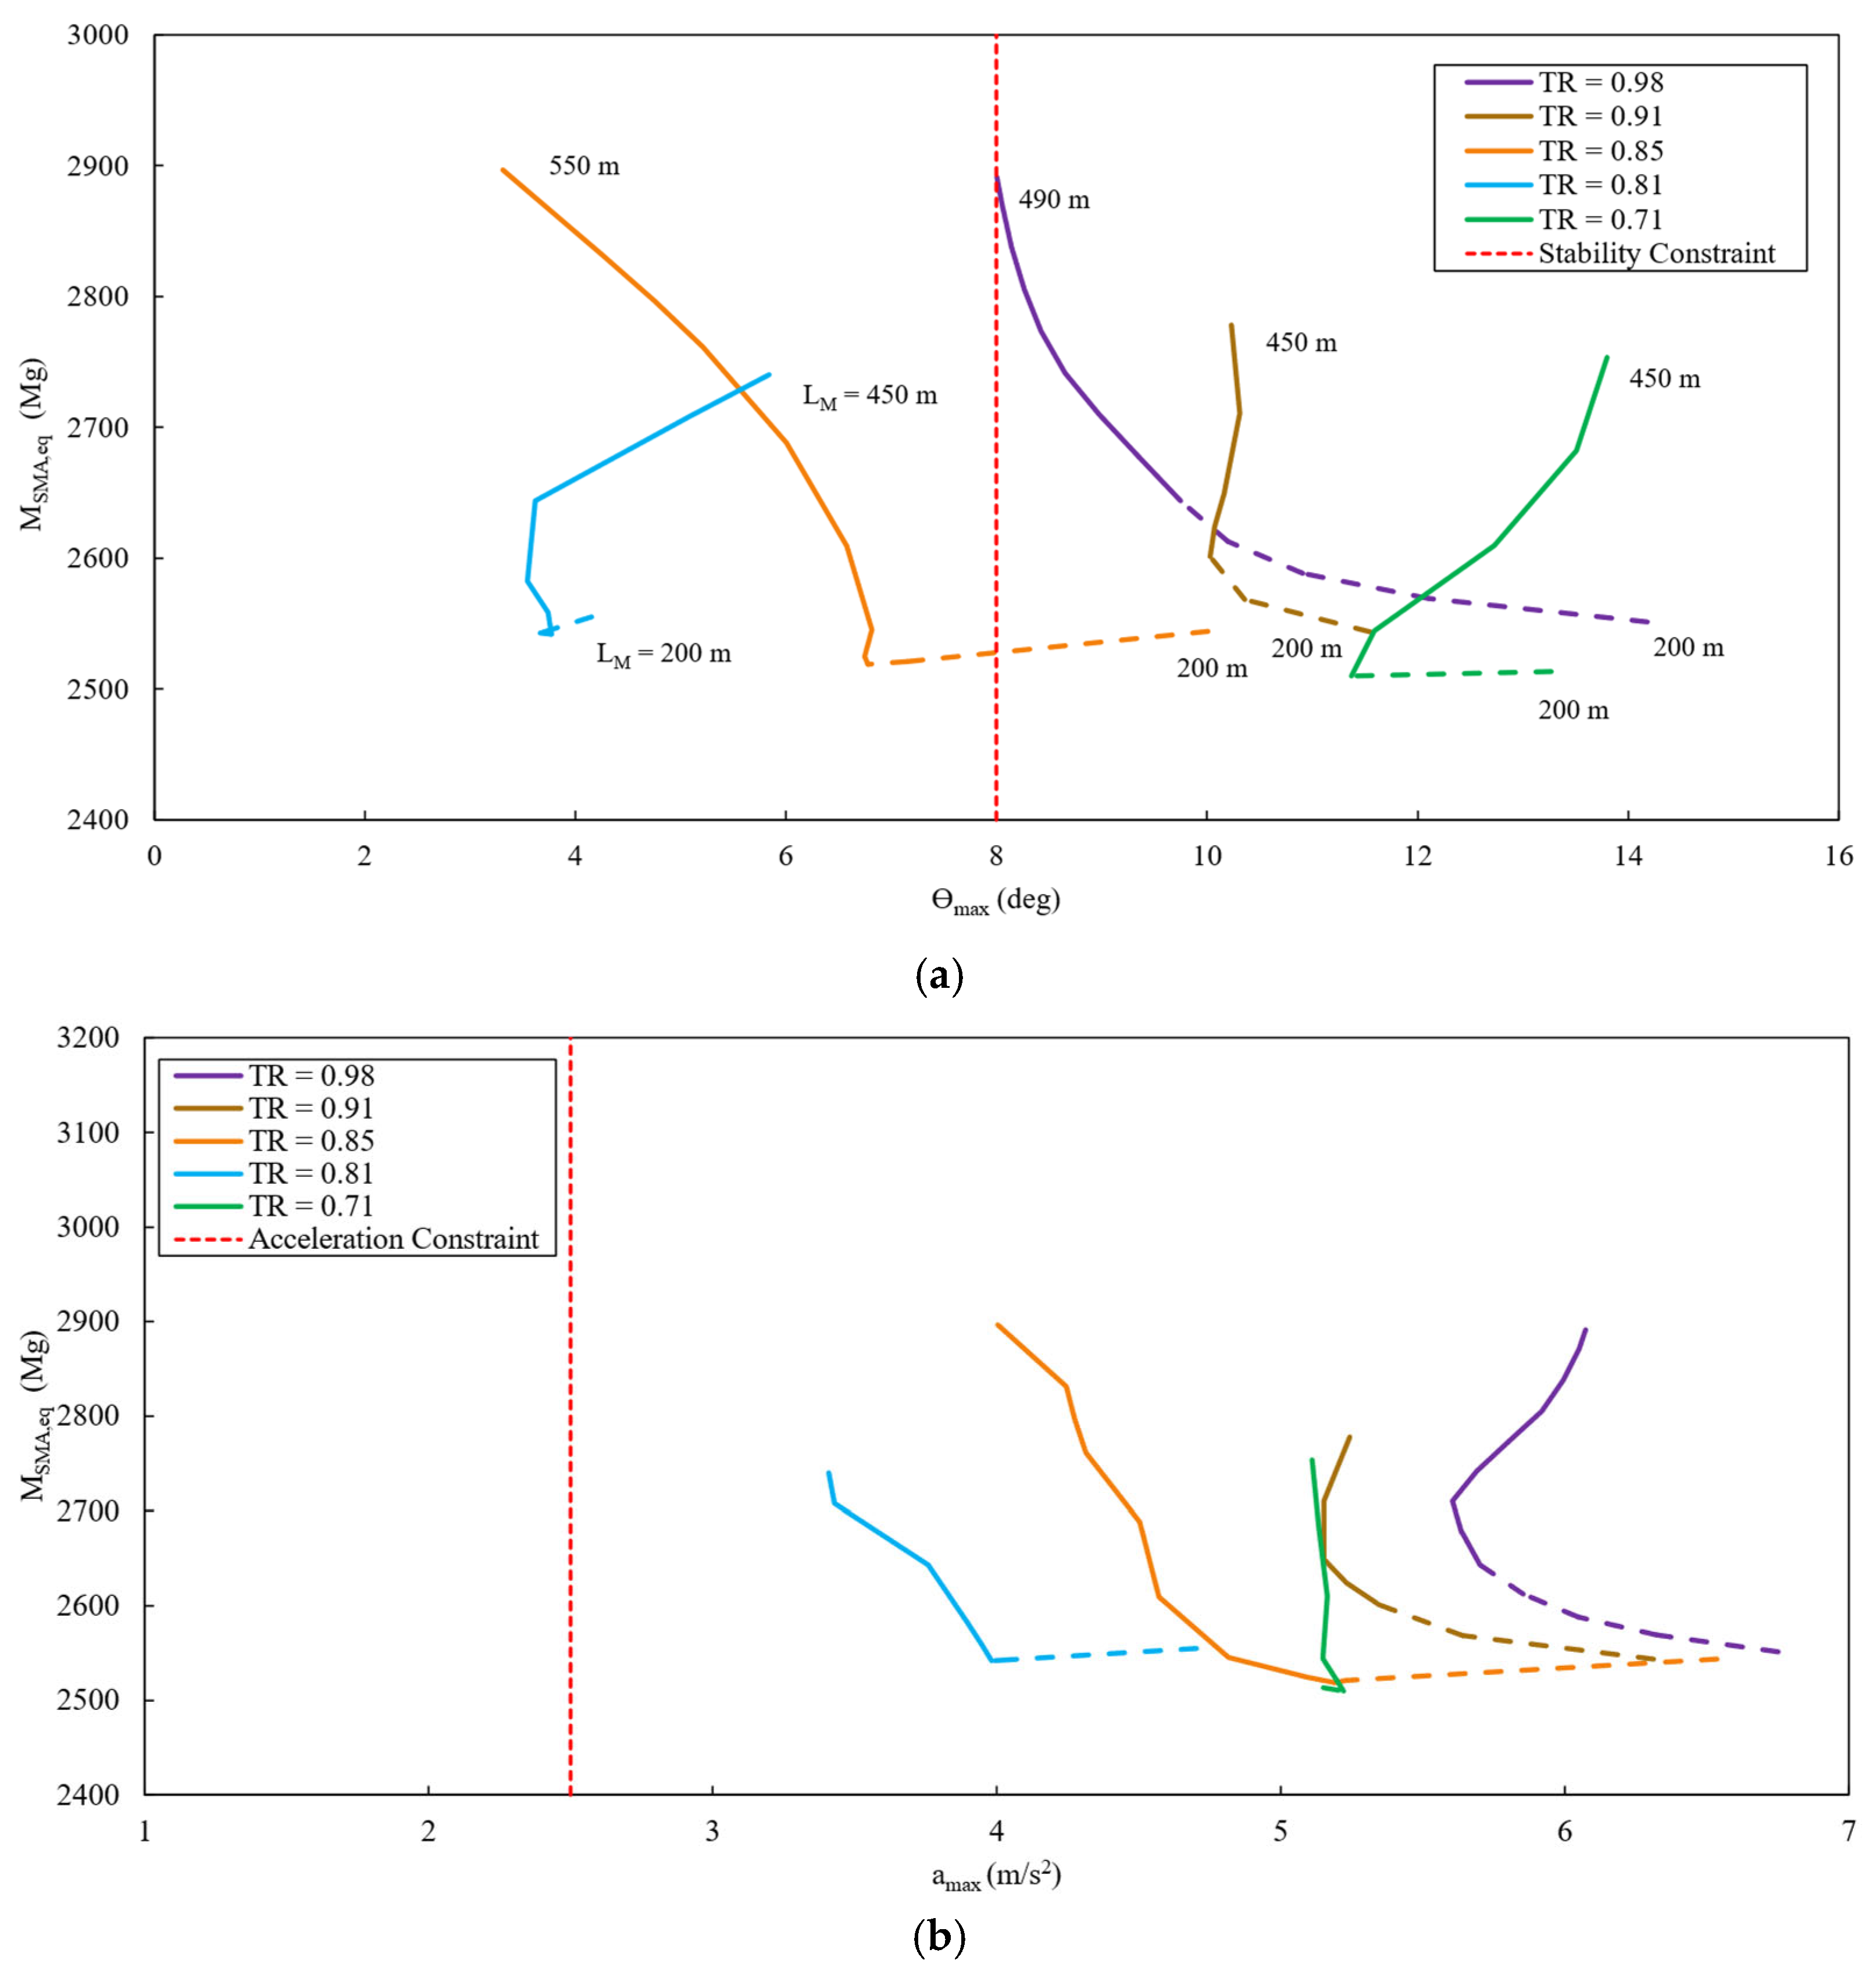
The influence of L
M and TR on ϴ
max and a
max is shown in
Figure 8a and
Figure 8b, respectively. For a fixed TR (one color of lines), the distinct minimal values for SMA equivalent mass and the optimal L
M for minimizing M
SMA,eq occurs when S
H = S
V (where the solid and dashed lines meet). However, in some cases, these optimal mooring line lengths do not coincide with the minimum platform pitch and never coincide with the minimum horizontal RNA acceleration. For instance, longer lines help reduce ϴ
max and a
max for TR = 0.85, though they result in a much higher M
SMA,eq. It is also seen that ϴ
max and a
max are non-linearly dependent on TR.
For the platform pitch with TR = 0.81 (solid blue line of
Figure 8a), L
M longer than the optimal value yields a complex cutback, which is a result of the vertical load on the anchor becoming zero, meaning the mooring system is catenary. However, this is not common across all TRs.
In terms of the ϴ
max constraint (vertical dotted line in
Figure 8a), the TR = 0.81 optimal mooring line length gives a pitch angle of less than 4°, which readily meets the constraint of 8°. For the a
max constraint (vertical dotted line in
Figure 8b), the optimal length for TR = 0.81 significantly exceeds the acceptable acceleration but is lower than any acceleration seen for the other TRs evaluated. Therefore, additional dynamic stability is needed and would require further optimization beyond the mooring system alone. Based on the results of
Figure 8, a tautness ratio of 0.81 at the optimal 275 m mooring line length was chosen for further parametric optimization (since this mooring and anchoring configuration provides the lowest SMA equivalent mass while also reducing the platform pitch and horizontal RNA acceleration peaks).
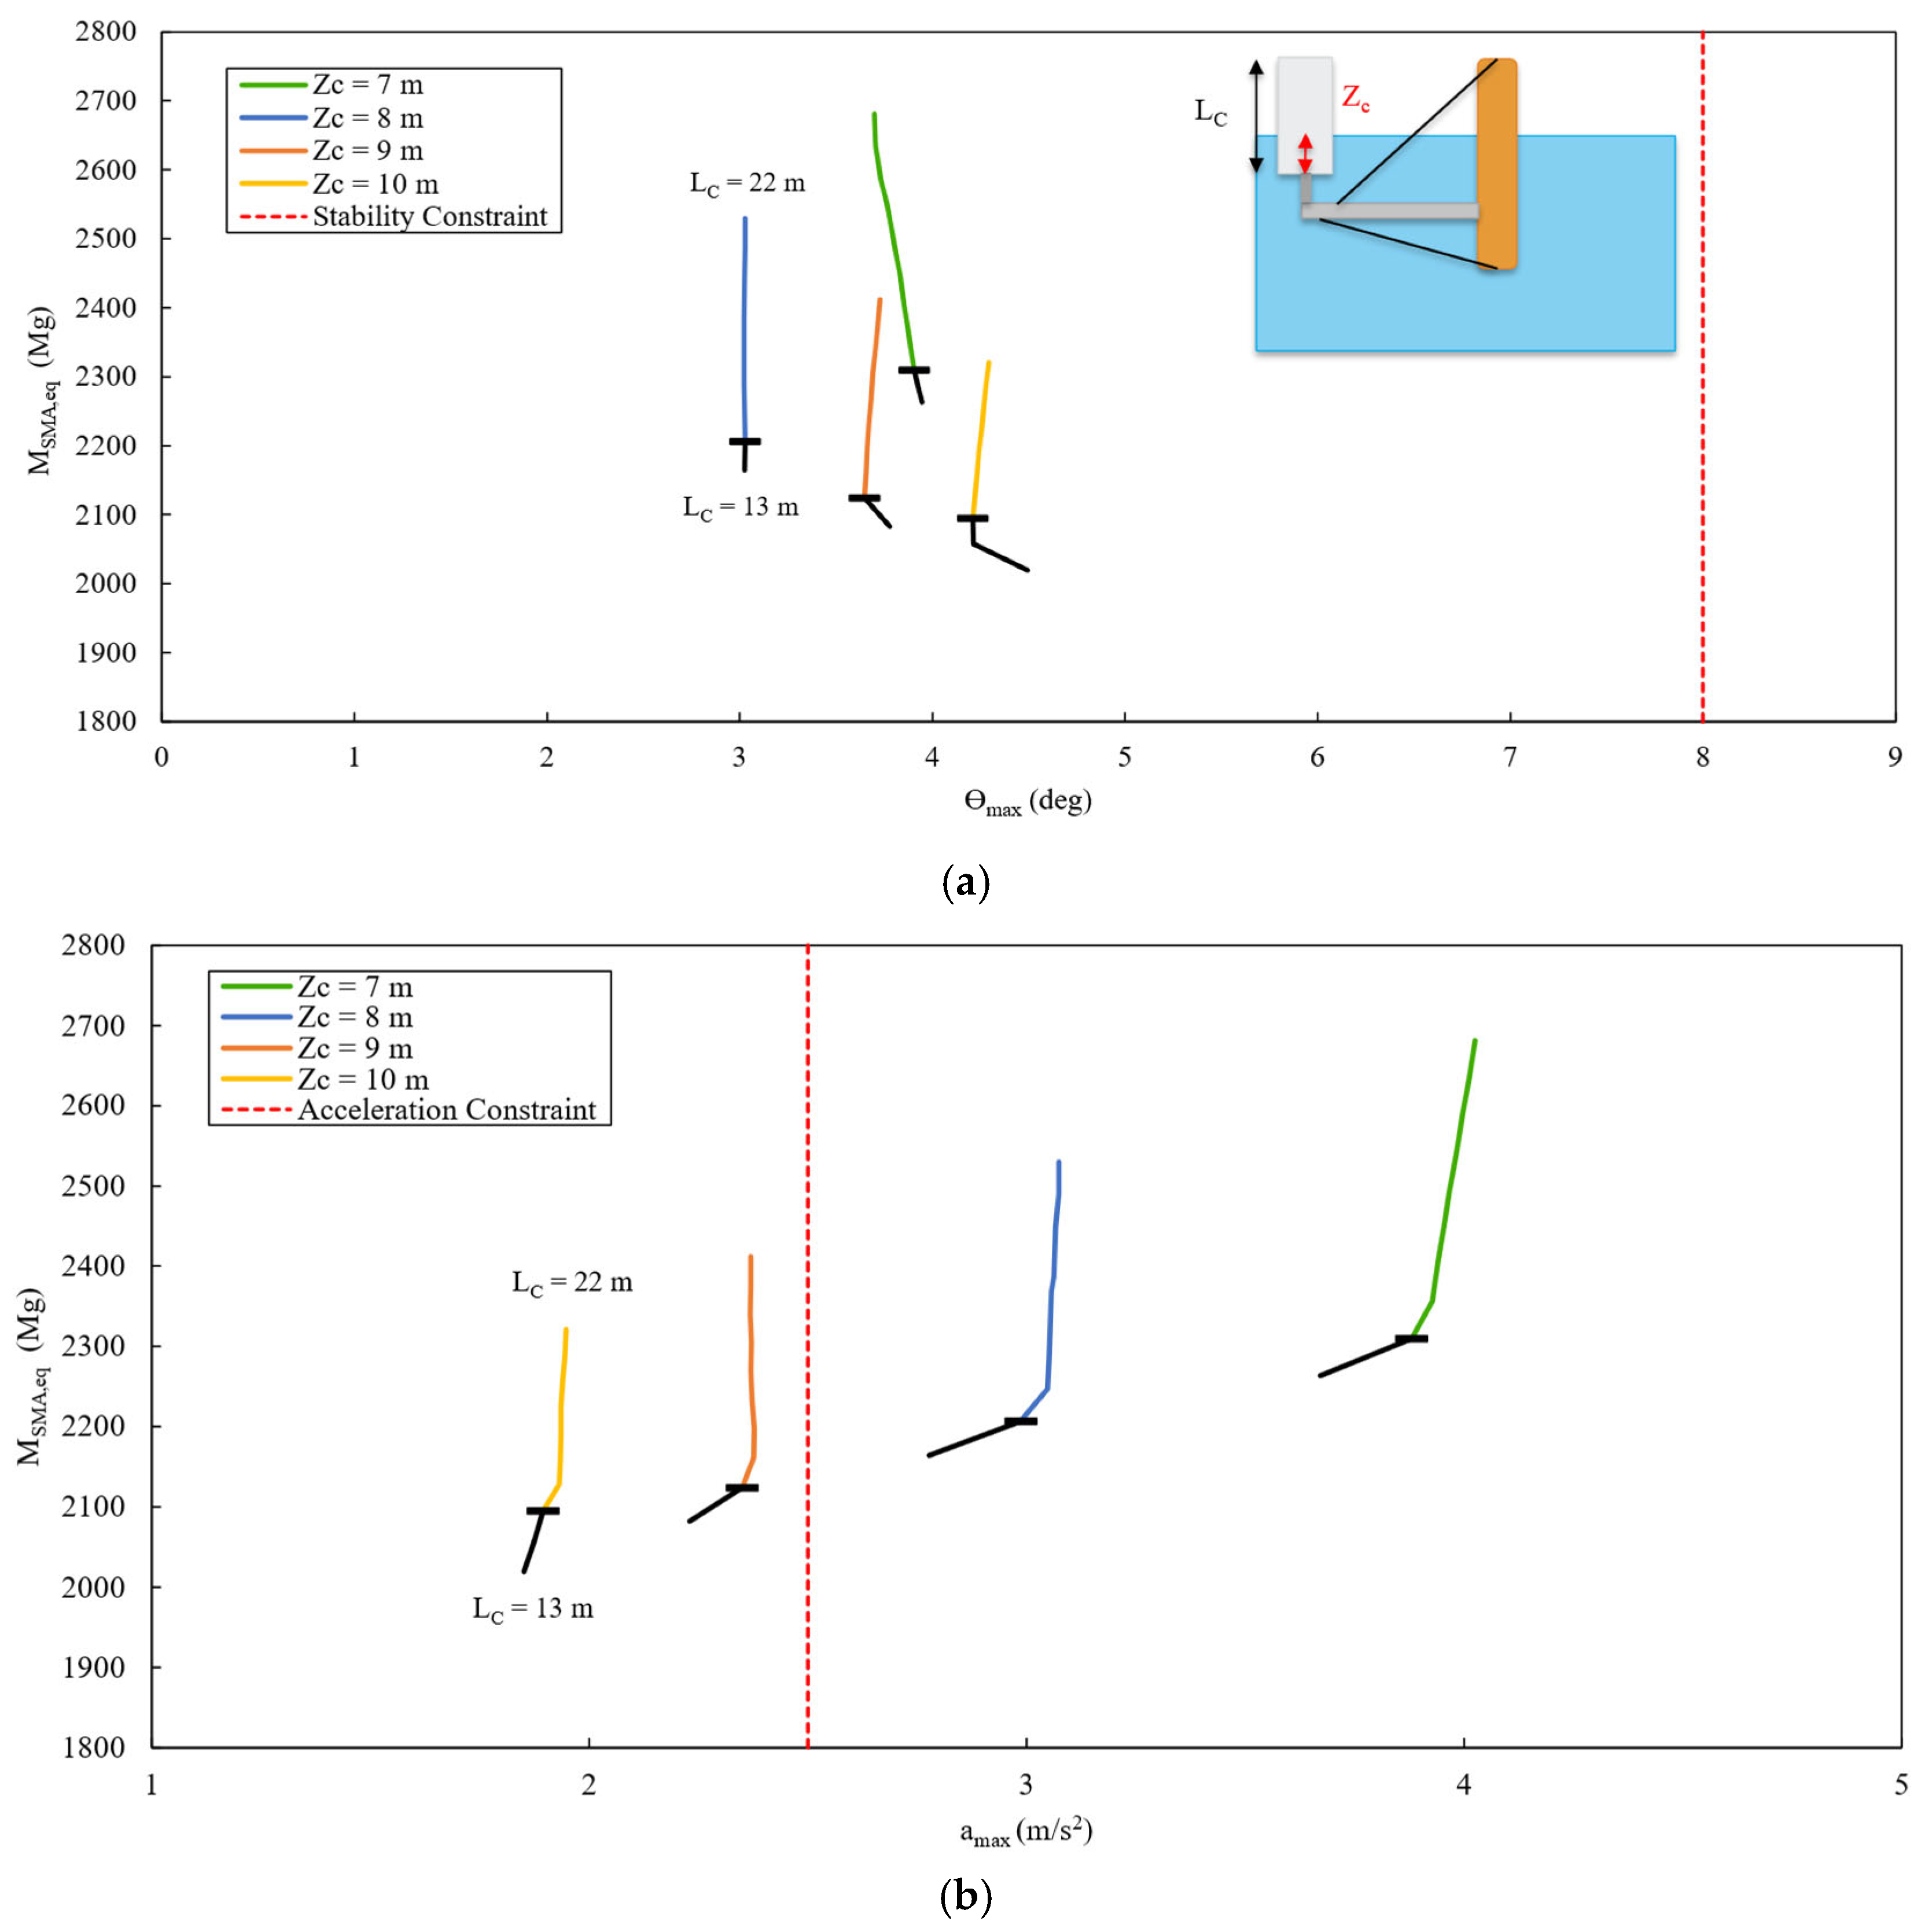
3.2. First Pass of the Can Draft and Length
The second component to undergo investigation was the buoyancy unit (or cans, which were optimized in terms of a can bundle) with two design variables: length (L
C) and draft (Z
C). The influence of L
C and Z
C on ϴ
max and a
max is shown in
Figure 9a and
Figure 9b, respectively. The k
min values for all simulated cases involving the cans in the first pass can be found in
Table A1 of
Appendix A.
The black portions of
Figure 9 depict L
C values that do not meet the k
min constraint (i.e., there was an instance of at least one can being completely submerged below the water line). L
C has a minor influence on both ϴ
max and a
max while meeting the k
min constraint. L
C significantly impacts M
SMA,eq despite only a moderate change to the buoyancy unit mass due to both the number of cans and fiberglass being more expensive than steel. Additionally, there appears to be an optimal Z
C near 8 m that reduces ϴ
max, but not a
max, though there is a discrepancy with the 7 m can draft that suggests non-linear effects of Z
C on ϴ
max.
The cause of this non-linearity is not clear. With the can draft increasing, the cans are made slimmer and lighter to maintain the same initial displaced volume and diameter-to-thickness ratio. The static equilibrium centers of gravity and buoyancy are also shifted downward as the can draft increases, and the can centers of gravity and buoyancy move closer together as the can draft increases. The can’s pitch inertia reduces as the can draft increases due to lower mass. The substructure is less stable with increased can draft because of the associated reduced waterplane area (second area moment).
The same trend does not appear for amax as the acceleration decreases with increased can draft. This decrease in acceleration can be explained by a decrease in stiffness, leading to a decrease in the pitch frequency. It should be noted that when compared with changes to the mooring system, there are multiple can configurations that meet the amax constraint, illustrating that changes to both the mooring system and cans are required to meet all design constraints. Concluding this evaluation, a 16 m can length and 10 m can draft were selected as the optimal values for the cans, rendering the lowest SMA equivalent mass while meeting all constraints.
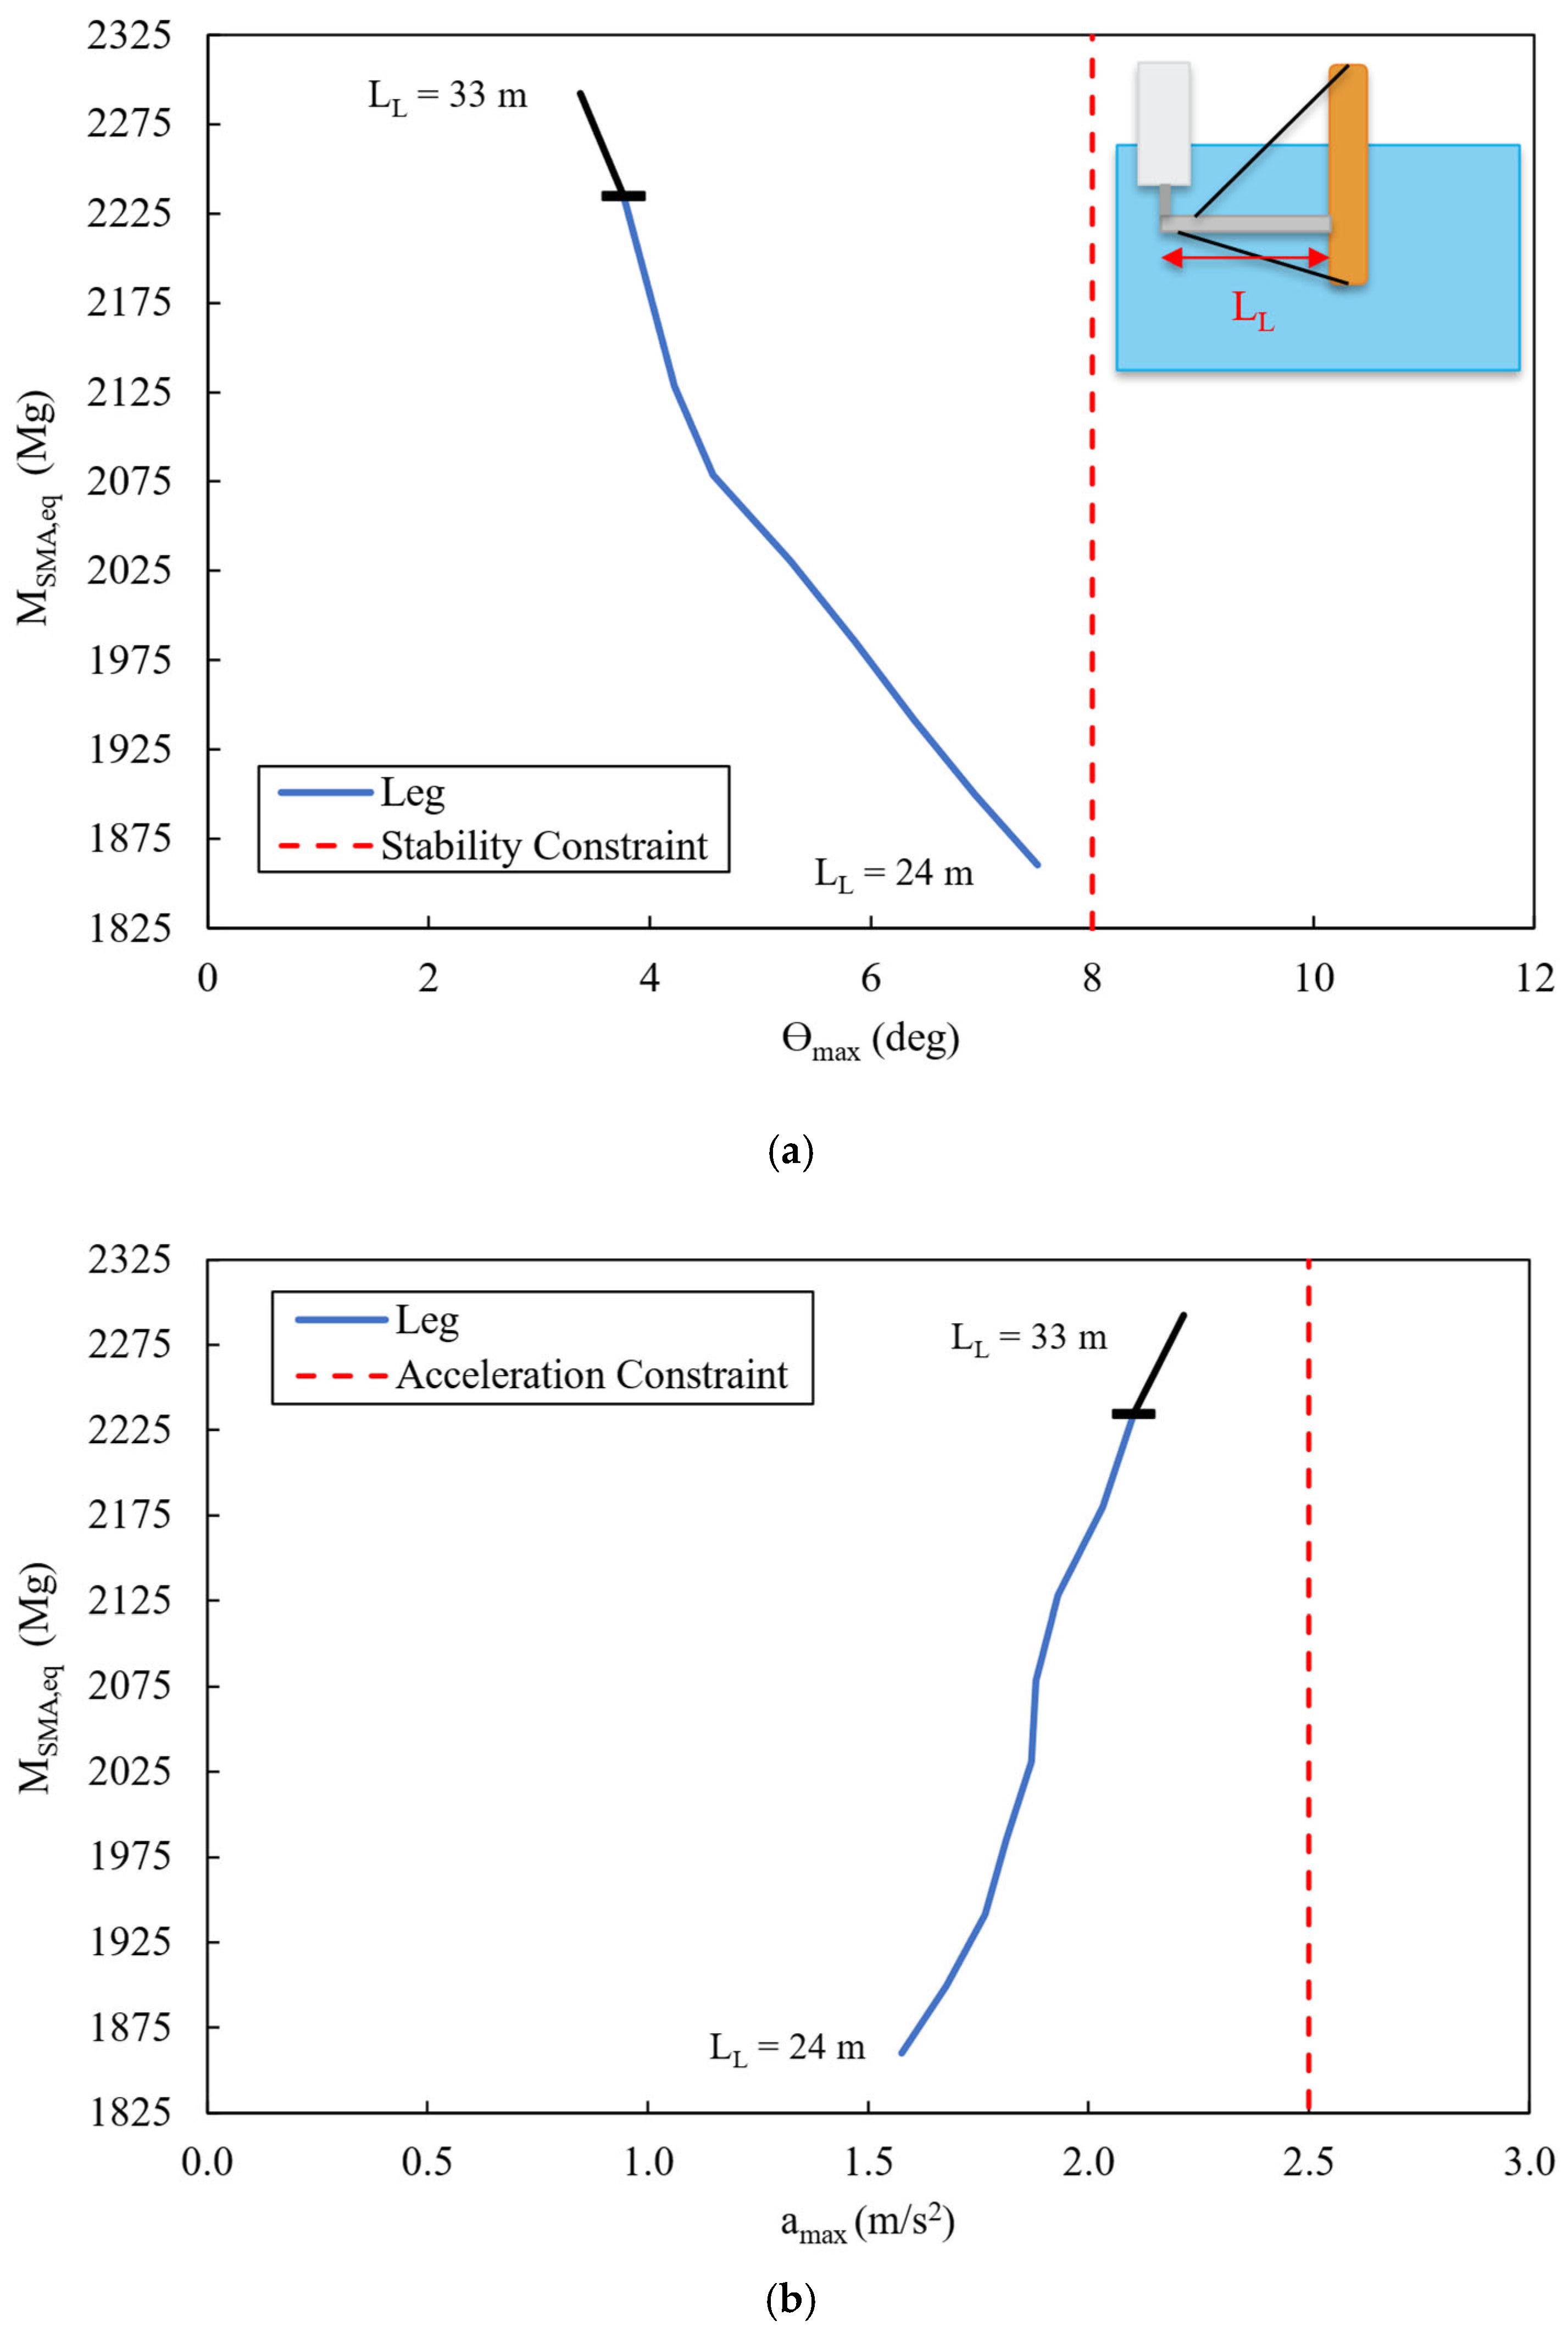
3.3. First Pass of Leg Length
The third component investigated was the leg with one design variable: length (L
L). The influence of L
L on ϴ
max and a
max is shown in
Figure 10a and
Figure 10b, respectively.
Like the cans, the black portions of
Figure 10 represent L
L that do not meet the k
min constraint. As L
L decreases from 32 m to 24 m, M
SMA,eq decreases, and the k
min constraint is met. If L
L is reduced below 24 m, the system becomes dynamically unstable (the simulation could not complete the full runtime) because of an insufficient restoring moment. As L
L decreases, ϴ
max increases (
Figure 10a) because the second area moment of the water plane area has been reduced, resulting in a reduction in the pitch stiffness of the substructure, which also leads to a reduction in a
max below the imposed constraint. For the next component optimization, a 24 m leg length was chosen as it provided the lowest M
SMA,eq while meeting all system constraints.
3.4. First Pass of Stem Length
The fourth component investigated was the stem with one design variable: length (L
S). The influence of L
S on ϴ
max and a
max is shown in
Figure 11a and
Figure 11b, respectively.
As LS decreases, the system draft and stem outer diameter both decrease, and ϴmax increases, but both MSMA,eq and amax decrease. Note that the freeboard height, stem slenderness ratio, and stem wall thickness are held constant, so the stem draft and outer diameter decrease for shorter stem lengths. Changes to MSMA,eq are directly related to changes in LS and, in turn, the stem concrete mass. The increase in ϴmax and decrease in amax with a reduction in LS can again be explained by the reduction in pitch hydrostatic stiffness following the change in GM (G and B both rise, but G is above B, and the second area moment of the water-plane area reduces, thus the GM reduces). A 29 m stem length was selected as optimal because it is the length that minimizes SMA equivalent mass while meeting all system constraints.
3.5. Second Pass of Optimization Results
To determine whether further reductions in SMA equivalent mass were possible, the mooring line and can were revisited with a second pass. Further investigation and optimization of these two components showed that small reductions in both ϴ
max and M
SMA,eq could be realized, and the convergence criterion was reached. The values of ϴ
max and a
max from the second pass mooring system optimization can be seen in
Figure A2 of
Appendix A.
LM and LC were reduced to 265 m and 15 m, respectively. The shortened can length is the main contributor to the additional MSMA,eq reduction. The second pass resizing of the mooring and buoyancy can shows only a small change in MSMA,eq, and it is assumed that further changes to the leg and stem would be negligible. As a result, the optimal parked substructure configuration is therefore achieved.
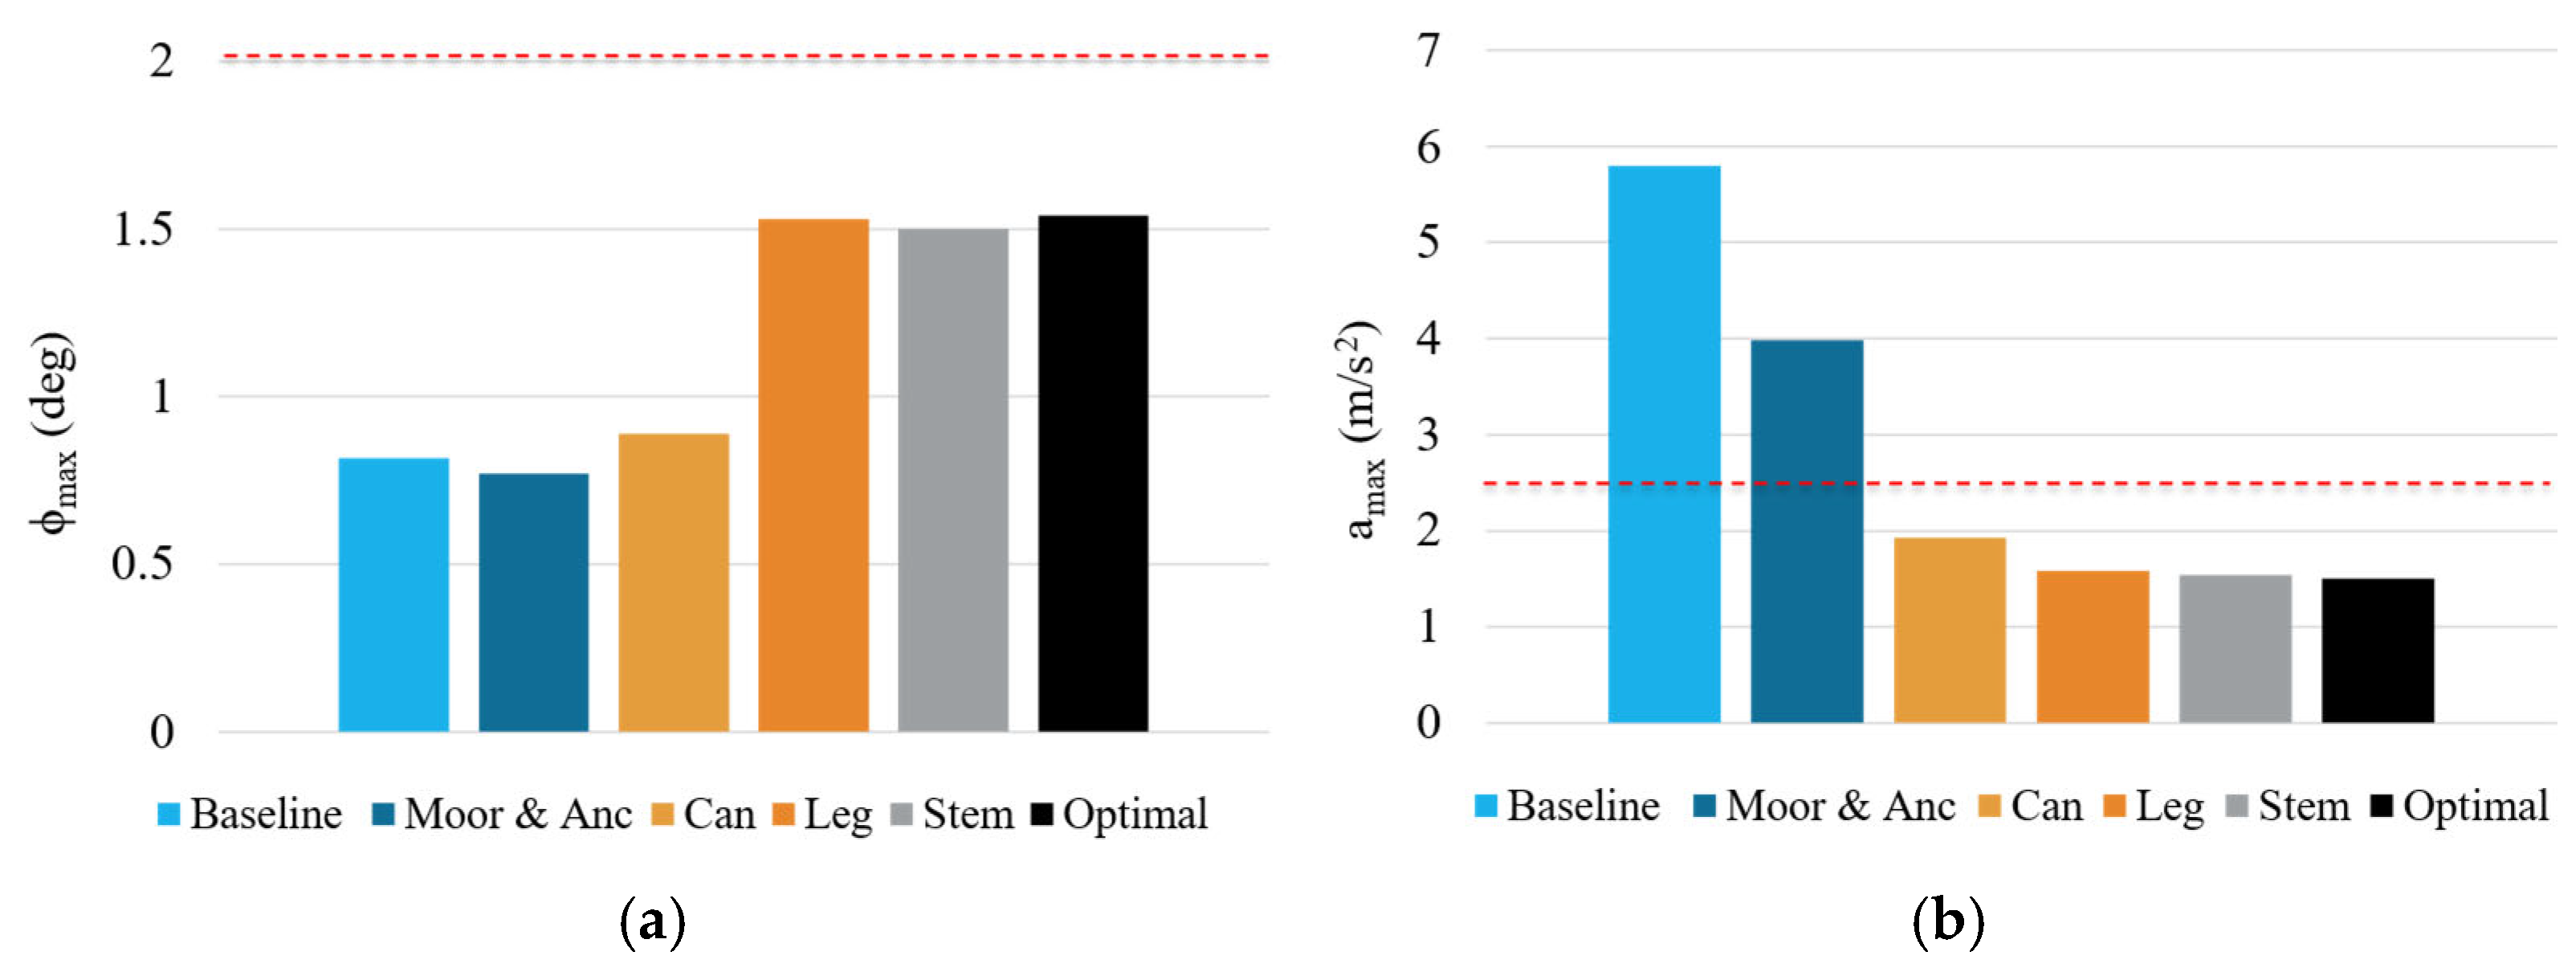
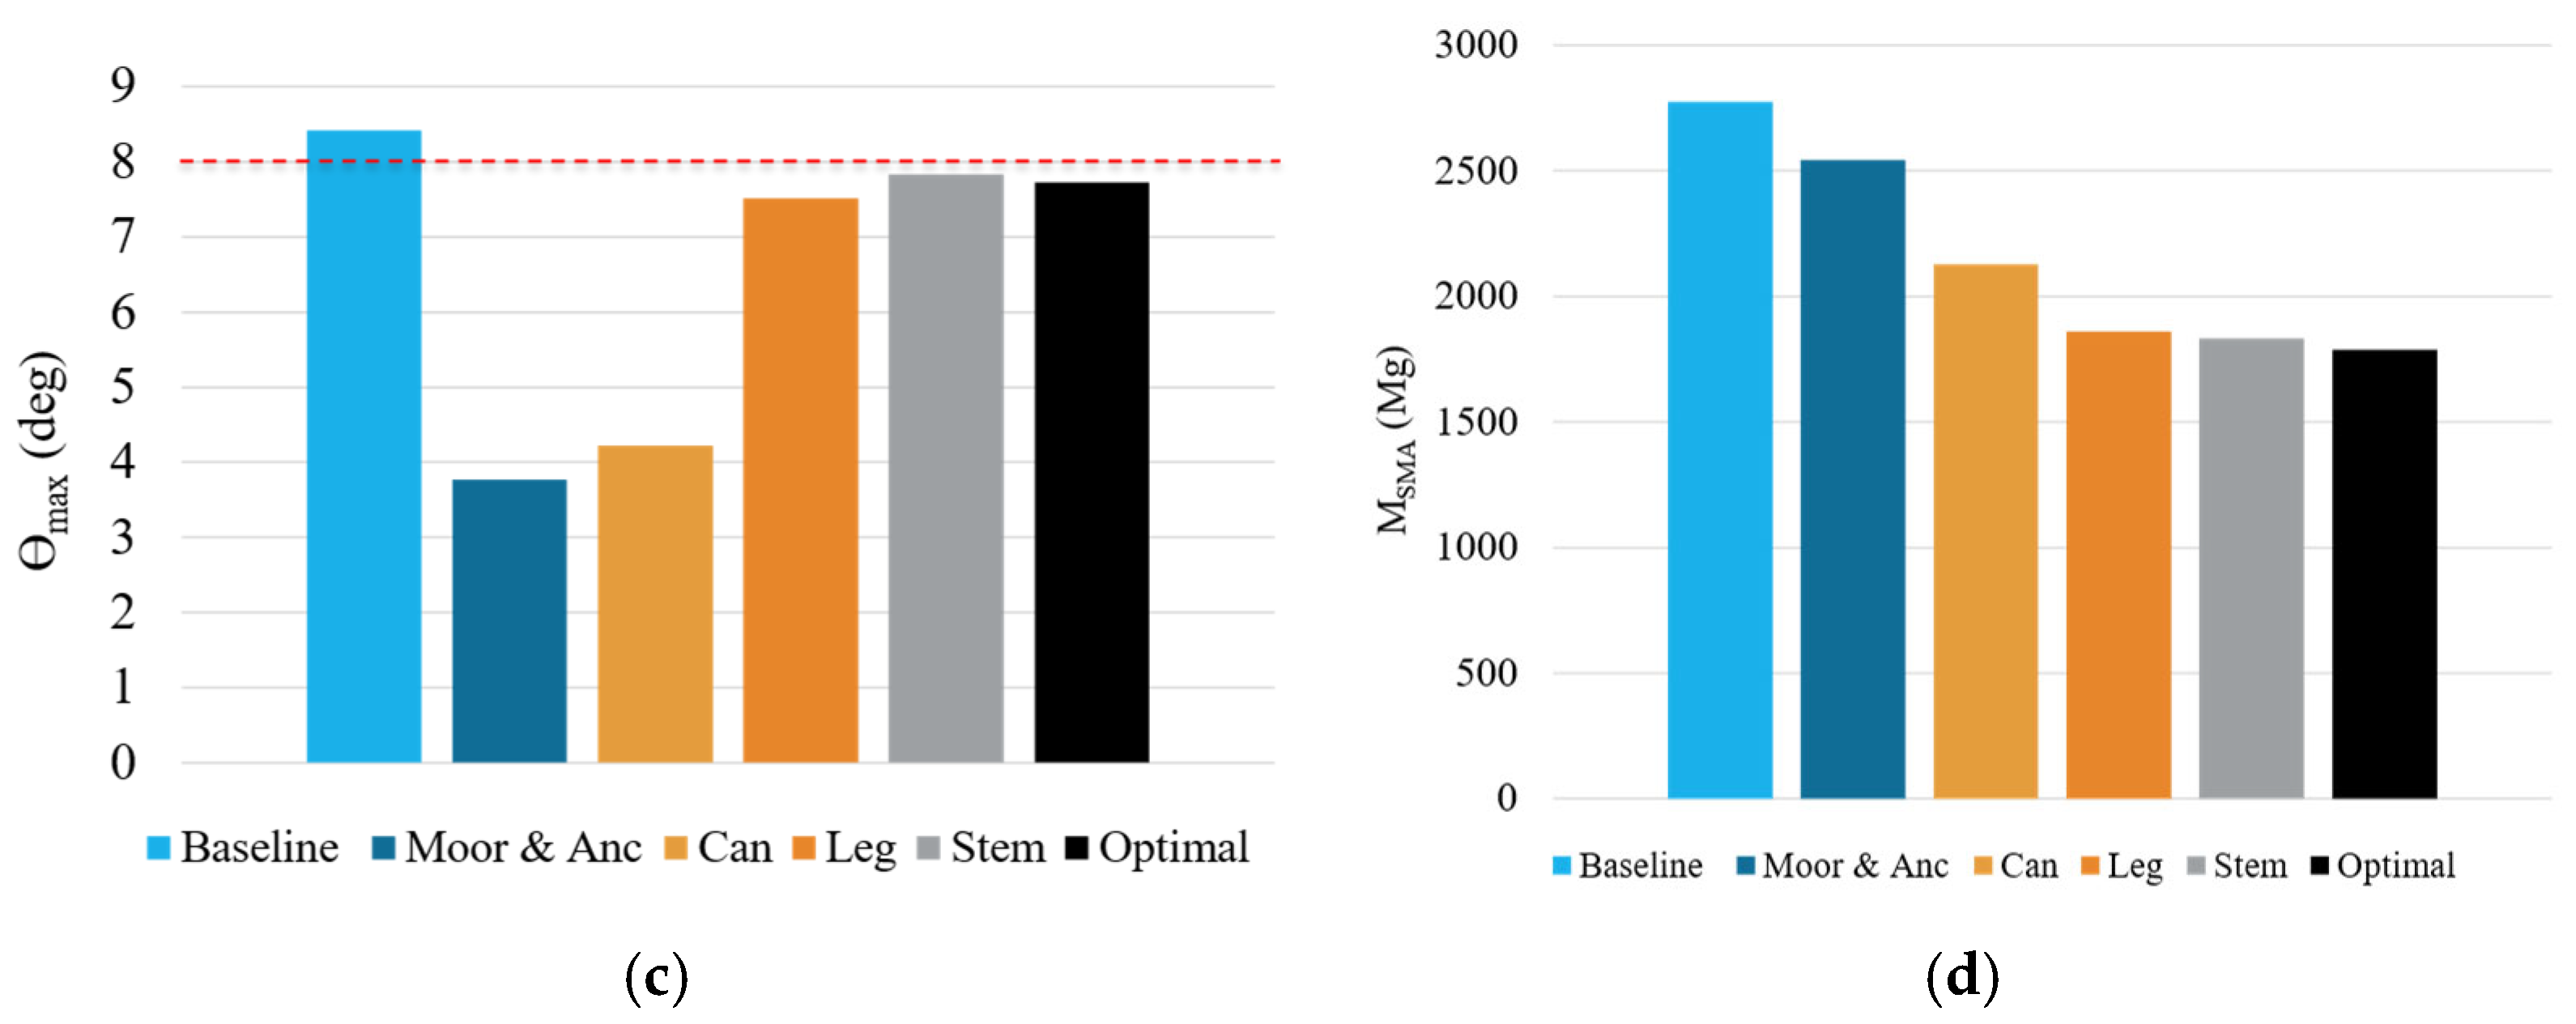
The optimal values at each component step for M
SMA,eq, ϴ
max, ϕ
max, and a
max, along with respective constraints, are shown in
Figure 12. On the other hand, the key component design variables and constraint differences between the baseline and optimal parked substructure configuration are listed in
Table 6. Comparison between the equivalent and actual component mass distributions of the optimal parked substructure configuration can be found in
Figure A3 of
Appendix A.
The results in
Figure 12d show that reductions in M
SMA,eq (~36%), between the baseline and optimal parked substructure configurations were realized mostly through optimizing the mooring, cans, and legs during the first pass. ϴ
max of
Figure 12b benefited significantly from the mooring optimization to provide sufficient design margin, utilized to optimize the can and leg design variables, and reduce M
SMA,eq. The horizontal RNA acceleration, as shown in
Figure 12c, initially violated the a
max constraint for the baseline configuration but was improved significantly with mooring, can, and leg resizing. ϕ
max shown in
Figure 12a shows that the roll motion almost doubled, though the magnitude is still relatively low at 1.6° when compared with the pitch motion. In general, the stem length optimization and second pass sizing of components had a minor impact on SMA equivalent mass and the peak platform dynamics, as these values started to converge after the optimal leg length was resized and fixed in the first pass.
The cumulative changes in SMA equivalent mass for each component between the baseline and optimal parked configurations are shown in
Figure 13. Excluding the stem, all components showed significant reductions in SMA equivalent mass, most of which was accounted for in the first pass. Although not a focus of this study, significant reductions in the tower base loads, leg bending moment present at the location of the cable hinge and midspan along the leg, and the tension in the cables were seen for the optimal configuration. These load reductions are summarized in [
22] and may allow thinner walls for the leg and stem, as well as smaller cable diameters, which would result in additional reductions in SMA equivalent mass beyond what is reported in this study.
It should be noted that the optimal extreme parked configuration also has high surge motion (~60 m), which is important to reduce. Considering surge as a constraint, it is likely that the optimal tautness ratio would be near the baseline value of 0.98, which is the only analyzed tautness ratio below a conservative surge constraint of 15% of the water depth [
23], or 22.5 m. A full optimization of the substructure with the necessary surge constraint should be completed for verification. Furthermore, the optimization did not consider the can bracing nor operational conditions. Moreover, the inclusion of fatigue and ultimate loading for evaluating component structural integrity should be included for a full design. Therefore, additional structural optimization encompassing more representative design load cases is recommended for a full system design. For such future work, it is helpful to document the final sensitivities of the various component design variables on M
SMA,eq, ϴ
max, and a
max as summarized in
Table 7.
These sensitivities are obtained based on the average per-meter changes in length between the baseline and the determined optimal first-pass component values. The tautness ratio was not included in the sensitivity analysis due to the non-linear behavior seen for each respective tautness ratio in both peak platform pitch and horizontal RNA acceleration. The results show that M
SMA,eq is most sensitive to changes in can draft, can length, and leg length. Similarly, ϴ
max is sensitive to changes in leg length, stem length, and can draft; while a
max is sensitive to changes in can draft, leg length, and stem length. However, when evaluating the difference in M
SMA,eq between the baseline and second pass configurations, resizing the cans, mooring system, and legs are the largest contributors to the seen reduction (as can be seen in
Figure 13). In a similar fashion, ϴ
max is influenced most by resizing the mooring system and legs, while a
max is influenced most by resizing the cans and mooring system (as can be seen in
Figure 12).
In general, the results indicate that an optimization scheme as shown in
Figure 6 is reasonable, but that the can bracing could be added as an additional component and maximum surge added as an additional constraint. Moreover, the component order could be changed to ensure that the components with design variables that have a higher per-meter influence on SMA equivalent mass and the constraints (e.g., as indicted in
Table 7) are considered first.
4. Conclusions and Recommendations
In this study, an optimization scheme for the SpiderFLOAT substructure was demonstrated using the equivalent mass cost metric under extreme environmental conditions (no wind-wave misalignment was considered). The results indicate that optimally sizing individual components, and doing so iteratively, not only reduces the substructure’s equivalent mass but also provides valuable insights into the influence of each component on the substructure’s peak dynamic response. Key findings include the following:
An optimal point for the mooring line length occurs where the equivalent mass required to meet the vertical load capacity of the anchor equals that of the horizontal load capacity;
A non-linear influence of can draft on peak platform pitch, but not peak horizontal RNA acceleration;
Per-meter sensitivities of the SMA equivalent mass, peak platform pitch, and peak horizontal RNA acceleration to component design variables, excluding tautness ratio, were determined;
Among the components analyzed, the cans, specifically the can draft, have the most significant influence on both the system cost and peak nacelle acceleration. The mooring system and legs have a strong influence on the peak platform pitch;
The SMA equivalent mass was reduced by 36% relative to the baseline, with most of these gains achieved after only a single iteration of resizing the components.
While the reduction in SMA equivalent mass for the optimal substructure configuration is substantial, it came with the penalty of a large platform surge. This suggests that the SMA equivalent mass reductions seen would likely shrink to address the large surge motion by increasing the mooring system stiffness, though reductions in system loading through reduced accelerations could result in potential reductions in SMA equivalent mass that are unaccounted for. Seen reductions in the platform draft and footprint are also beneficial for assembling the substructure at the port and for operations near the quay.
Further verification of the anchor sizing and cost model is necessary, as the results of this study depend on the incorporated model assumptions. With the inclusion of a surge constraint, the SpiderFLOAT substructure should also be evaluated in operational DLCs, as an optimal configuration under extreme environmental conditions may not be optimal during power generation. Additional areas of cost reduction include adding flexibility in the buoyancy unit-leg connection to reduce the transfer of wave loads to the substructure and the incorporation of active ballasting and cable actuation capabilities. Furthermore, analysis of the loading and fatigue of the can structure and its connection in view of the influence of can sizing and that of draft on substructure peak dynamics and cost should be further investigated to ensure the capability of the SpiderFLOAT design.


