Article

Evaluating Seismic Isolation Design: Simplified Linear Methods vs. Nonlinear Time-History Analysis

by
Elias Yaacoub
1,2,
Roberto Nascimbene
2,3,*,
Marco Furinghetti
1,3 and
Alberto Pavese
1,3
1
Faculty of Engineering, University of Pavia, 27100 Pavia, Italy
2
STS Department, IUSS—Scuola Universitaria Superiore Pavia, 27100 Pavia, Italy
3
EUCENTRE—European Centre for Training and Research in Earthquake Engineering Pavia, 27100 Pavia, Italy
*
Author to whom correspondence should be addressed.
Designs 2025, 9(2), 34; https://doi.org/10.3390/designs9020034
Submission received: 20 January 2025 / Revised: 24 February 2025 / Accepted: 3 March 2025 / Published: 17 March 2025

Abstract

:
Seismic isolation is a vital strategy for improving the earthquake resilience of structures, utilizing flexible components such as lead–rubber bearings (LRBs) and curved surface sliders (CSSs) to attenuate ground motion effects. This paper presents a comprehensive comparative analysis of seismic isolation design methodologies prescribed in the U.S. code (ASCE 7-22) and the European code (EC8). The focus is on the equivalent lateral force method, also known as the simplified linear method, renowned for its simplicity and efficiency in seismic design applications. A six-story steel building serves as a case study to examine the discrepancies between the two codes. The structure was modeled and subjected to nonlinear time-history analysis (NTHA) using 20 ground motion records, selected and scaled to match a conditional mean spectrum (CMS). Key performance indicators—including displacement at the isolation level, base shear forces, story shear forces, and story drifts—were compared to assess the reliability and effectiveness of each code’s design approach. The findings reveal notable differences between ASCE 7-22 and EC8, particularly in seismic hazard characterization and the calculation of design displacements. ASCE 7-22 generally adopts a more conservative stance, especially for CSSs, resulting in overestimations of design displacements and lateral seismic forces. In contrast, EC8’s simplified method aligns more closely with observed performance for LRBs. However, when applied to CSSs, simplified methods prove less reliable, underscoring the need for more precise analytical techniques.

1. Introduction

Seismic isolation strategies have evolved significantly over the years as a highly effective means of protecting the structural integrity of buildings and infrastructure during earthquakes [1]. The success of seismic isolation was convincingly demonstrated by the impressive performance of isolated structures during major seismic events such as the 1994 Northridge and 1995 Hyogoken-Nanbu earthquakes. These real-world examples reinforced the reliability of seismic isolation systems and validated the analytical models used to predict their behavior. As a result, their adoption has been increasingly encouraged in both new construction and retrofitting projects. Seismic isolation systems typically incorporate flexible components, such as rubber bearings, sliding, or rolling mechanisms, strategically placed between the primary mass of a structure and the source of ground motion. These components are often combined with energy-dissipating devices, such as dampers, to not only elongate the structure’s natural periods but also increase its damping capacity. This prevents resonance with the shorter-period components of ground motions, which are often the most destructive during an earthquake. Furthermore, recent developments have expanded the application of seismic isolation to more flexible structures, offering a promising method to significantly reduce acceleration and displacement responses. This advancement allows designers to minimize the size of structural members, reduce potential damage, and improve the post-earthquake functionality of buildings, particularly those housing essential services or sensitive equipment. The primary benefits of implementing seismic isolation in structures, whether newly constructed or retrofitted, can be summarized as follows:
  • Increased Flexibility and Period Elongation: Seismic isolation introduces additional flexibility to the structural system, which results in an elongated fundamental period. By shifting the building’s natural period away from the dominant frequencies typically associated with seismic events, this approach leads to a substantial reduction in the design forces for structures with shorter natural periods. Conversely, the impact on longer-period structures tends to be less significant. This added flexibility is particularly beneficial for nonstructural components [2], such as delicate equipment and mechanical systems, that are highly sensitive to seismic accelerations and could otherwise suffer damage during an earthquake.
  • Localized Inelastic Deformation: While the increased flexibility introduced by seismic isolation systems can result in larger system displacements, inelastic deformations are generally confined to the isolation system itself. This localized deformation allows for an elastic design approach for the remainder of the structure, ensuring that critical structural components remain undamaged even during strong seismic events. As a result, this strategy significantly improves the overall resilience of the building and reduces repair costs after an earthquake.
  • Energy Dissipation and Enhanced Damping: In addition to flexibility, seismic isolation systems play a crucial role in dissipating seismic energy, which is key to reducing the forces acting on the structure. Some systems inherently provide damping through the viscous or hysteretic properties of their materials. Hybrid isolation systems, which separate the functions of flexibility and damping, capitalize on the large movements at the isolation interface to integrate additional damping devices. By increasing the damping of the system, these devices further reduce seismic forces and help minimize the maximum displacement demands on the isolation bearings, thereby enhancing the performance and safety of the structure during an earthquake.
The market offers a wide variety of isolation devices, each designed to meet the three key requirements for an effective seismic isolator: vertical stiffness, lateral flexibility, and energy dissipation capacity. The selection of the optimal device for a particular project depends not only on factors such as availability and cost but also on the specific technical requirements dictated by the structure’s location, design, and function. In this study, we focus on two of the most commonly used isolation systems, lead–rubber bearings (LRBs) and curved surface sliders (CSSs), and evaluate their capabilities in meeting these critical requirements.
LRBs are composite devices that combine the flexibility of rubber with the damping properties of a lead core [3]. These bearings are specifically designed to provide both horizontal flexibility and effective energy dissipation, which makes them particularly effective in reducing the seismic forces transmitted to the structure. The vertical stiffness of these devices is achieved through alternating layers of rubber and steel plates, which provide the necessary support to carry vertical loads without significant deformation. Lateral flexibility, on the other hand, is provided by the rubber layers, which accommodate horizontal displacements during seismic events, allowing the structure to move freely without transferring excessive forces to the building.
Friction-based isolation systems, such as CSSs, operate on the principle of controlled sliding. In this approach, the building is allowed to slide on a curved surface, with the weight of the structure transferred to the foundations while dissipating energy through friction. A simple flat sliding surface, however, is generally not suitable because it fails to control lateral sliding effectively, potentially leading to large and uncontrollable movements during an earthquake [4]. In some cases, flat sliders with low friction coefficients are used alongside additional energy dissipation devices to transfer gravity loads with minimal lateral resistance or damping. The force–displacement response of a CSS bearing is characterized by rigidity until the static friction threshold is exceeded, after which post-slip stiffness is determined by the supported weight and the radius of the curvature of the bearing.
This study explores the design requirements for seismically isolated structures, highlighting the differences between the U.S. code (ASCE 7-22) [5] and the European code (Eurocode 8) [6]. It also summarizes and compares the simplified design procedures for seismic isolation as prescribed by both codes and evaluates their effectiveness using nonlinear time-history analysis (NTHA). The case study focuses on a six-story steel building, modeled with both LRBs and CSSs, under each code’s provisions. Key performance metrics—such as displacement at the isolation level, base shear, story shear forces, and story drifts—are analyzed and compared. Ultimately, this study aims to contribute to the ongoing efforts to refine seismic isolation design strategies and provide valuable guidance for engineers and policymakers working in earthquake-prone areas.

2. Case Study Building and Modeling Assumptions

The selected structure for this research is a six-story steel building with a well-documented history in structural studies. Initially analyzed by Tsai and Popov in [7], it was subsequently modified by Hall in [8] and later utilized by Filiatrault et al. in [9]. The six-story steel building was selected for this study due to its well-documented structural properties and its relevance as a representative mid-rise seismically isolated structure. Its moderate height and moment-resisting frame configuration align with common applications of base isolation, particularly in critical infrastructure buildings where seismic resilience is paramount. Additionally, its prior use in seismic research ensures compatibility with both ASCE 7-22 and EC8 frameworks, making it an ideal candidate for evaluating the differences between these design methodologies. For the purposes of this study, minor adjustments were made to the building’s design to ensure compliance with the specific constraints imposed by the simplified method of analysis stipulated in the relevant building codes. The building features a rectangular floor plan (Figure 1a) and is braced in both principal directions using moment-resisting frames, providing robust lateral stability. The design adheres to the provisions of the 1994 Uniform Building Code (UBC) [10] for structures located in Seismic Zone 4, constructed on soil type S2. Seismic Zone 4 represents the highest seismic hazard classification, covering areas prone to severe earthquakes (e.g., California). Soil Type S2 corresponds to stiff soil conditions with moderate seismic amplification, similar to EC8 Class C. The design parameters used in this study include a peak ground acceleration (PGA) of 0.4 g, a seismic coefficient of 0.44, and a response modification factor of 8.5, ensuring that the structure is designed to withstand high-intensity seismic loading conditions. Key dimensions, floor heights, and section details are presented in Figure 1b,c. The design gravity loads applied to the structure are as follows: a roof dead load of 3.8 kPa, a floor dead load of 4.5 kPa, a roof live load of 1.0 kPa, a floor live load of 3.8 kPa, and an exterior cladding weight of 1.7 kPa. The retrofit strategy includes the installation of seismic isolators at the building’s base, as illustrated in Figure 2. The structure is assumed to rest on a large foundation mat with link frames connecting the base columns. The isolators are strategically positioned between the link frames and the top surface of the foundation mat to achieve optimal seismic performance. The structure is supported by a rigid reinforced concrete mat foundation (1.5 m thick), which provides a uniform and stable support surface for the isolation system. Since base-isolated structures experience significantly reduced force transmission to the foundation, the soil–structure interaction (SSI) is assumed negligible, consistent with prior research and seismic code assumptions. The large thickness and high stiffness of the mat foundation ensure that boundary conditions below the isolators remain fully fixed, preventing differential settlements or tilting effects that could influence isolator behavior.
This study adopts California as the hypothetical construction site for the building, with coordinates latitude 39.23 and longitude −123.584 and an elevation of 659.943 m. This location was chosen for several compelling reasons:
  • California is classified as Seismic Zone 4 under the UBC framework [10], aligning with the seismic design requirements established during the building’s original development.
  • According to both American [5] and European [6] seismic design codes, the site is not considered near-fault, a classification further corroborated by disaggregation analysis.
  • Comprehensive seismic data for this site are readily available from USGS (2024) [11], including critical parameters such as peak ground acceleration (PGA), spectral acceleration, and disaggregation data for various return periods. Specific data include seismic hazard values corresponding to a 2% probability of exceedance in 50 years (2475-year return period) and a 10% probability of exceedance in 50 years (475-year return period).
Structural modeling and analysis were conducted using SeismoStruct ver. 2024 [12,13,14], following the framework outlined by Christopoulos and Filatrault [3]. The model represents the bare steel frames, excluding any composite action from the slab. A bilinear stress–strain relationship with kinematic strain hardening is used to characterize the material behavior. The inelastic force-based plastic hinge element (infrmFBPH) was employed, with 150 section fibers specified to accurately capture the cross-sectional response. The hinges’ plastic resistance is based on an expected yield strength of 290 MPa. Rigid-end offsets were included at the member joints to account for the actual physical dimensions of the elements. Gravity loads applied to the frame during seismic events comprise the roof and floor dead loads, exterior wall weights, and 20% of the floor live loads. P-Δ effects were incorporated into the analyses to capture second-order effects. A Rayleigh damping ratio of 3%, calibrated using the first two elastic vibration modes, was assigned to the model. Rayleigh damping was assigned at 3%, calibrated to the first two modes, as these modes dominate the response of the six-story base-isolated structure. While higher-mode damping effects are expected to have minimal influence due to the rigid-body behavior of the superstructure, they could become more significant in taller buildings where modal participation factors are higher [15,16]. For such cases, alternative damping models may be necessary to ensure accurate representation of dynamic behavior. The dynamic time-history analyses employed a time-step increment of 0.005 s to ensure numerical accuracy. The modeling of the isolation system reflects the spatial arrangement of isolator units, ensuring accurate representation of horizontal translations, overturning effects, and vertical axis rotations. Experimental studies have highlighted the significance of biaxial interactions on the force–displacement behavior of isolators, necessitating consideration of in-plane force coupling in the X and Y directions. However, the torsional moment contribution from individual isolators is considered negligible based on the findings by Nagarajaiah, Reinhorn, and Constantinou [17] and is excluded from the analysis. The assumption of negligible torsional moments is justified by the symmetric configuration of the six-story building and the uniform properties of the isolation system, which minimize rotational effects. Since base isolators primarily allow translational motion, the system’s response is predominantly biaxial rather than torsional. However, in irregular structures with significant mass eccentricities or isolator stiffness variations, torsional effects should be explicitly analyzed to ensure accurate response predictions.
Both ASCE 7-22 [5] and EC8 [6] emphasize that the properties of the isolation system used in analysis should represent the most unfavorable values expected over the structure’s service life. This requirement applies universally, irrespective of whether the analysis approach involves simplified linear methods, modal linear analysis, or nonlinear time-history simulations.

3. Design Procedure

The design forces acting on the superstructure are calculated by evaluating the forces transmitted through the isolators when the system reaches its design displacement. This design displacement is a critical parameter derived from the demand imposed on the structure during seismic events and the mechanical properties of the isolation system. These key properties include the effective stiffness and effective damping of the isolation system, both of which are intrinsic to the physical and mechanical characteristics of the isolator units. The design process aims to establish a logical and practical starting point by employing realistic initial values for the isolators’ properties. This approach ensures that the preliminary design aligns with the anticipated behavior of the isolators under seismic loads, providing a foundation for iterative refinement as the analysis progresses. By incorporating these initial parameters, the design ensures a balanced response of the superstructure, minimizing seismic forces while adhering to performance requirements.
Section 3.1.1 and Section 3.2.1 introduce the simplified methodology employed to estimate the preliminary properties of the isolators. This procedure serves as the basis for initiating the design process, offering a systematic approach to determining effective stiffness and damping values that meet the desired performance criteria and requirements as indicated by ASCE7-22 [5] (Section 3.1.2 and Section 3.2.2) and EC8 [6] (Section 3.1.3 and Section 3.2.3).

3.1. Lead–Rubber Isolators

3.1.1. Preliminary Design

Static analysis of the building in Figure 1 shows that the pre-design requirements for isolators are the following:
  • Axial capacity of at least 3785.8 KN under zero lateral displacement (considering 100% DL + 100% LL).
  • Axial capacity of at least 2560 KN at design displacement (applying 100% DL + 20% LL).
As a result of the detailed analysis conducted on the building in Figure 1, the characteristics of the isolation device, selected for its suitability in meeting the structural and performance requirements, are summarized in Table 1.

3.1.2. ASCE7-22 Requirements for Seismic Isolation Design

The fixed-base period of the building, representing the natural vibration period without seismic isolation, is calculated using the expression T f = 0.0488 ( 20 ) 0.75 = 0.462 s. This calculation provides a baseline for comparing the dynamic behavior of the building with and without isolation. The LRB devices, which are installed beneath all the columns, possess the properties detailed in Table 1. These properties are essential for evaluating the isolators’ ability to mitigate seismic forces and accommodate the expected displacements.
In compliance with ASCE 7-22 provisions, the equivalent lateral force (ELF) method leverages the fact that, in a seismically isolated structure, the majority of displacements are concentrated at the isolation level. As a result, the superstructure behaves nearly as a rigid body, simplifying the design process. This methodology focuses on a single mode of vibration, enabling the calculation of design forces acting on the superstructure based on the forces transmitted through the isolators at the design displacement. By following the procedural steps illustrated in Figure 3, derived from the guidelines set forth in ASCE 7-22 [5], and iteratively applying the equations governing this methodology, the necessary design parameters were derived. These calculations form the foundation for optimizing the seismic performance of the structure and ensuring compliance with code requirements.
The isolation system is required to be designed to accommodate the maximum displacement ( D M ) anticipated during seismic events. This maximum displacement is determined by evaluating the system’s behavior using both upper-bound and lower-bound mechanical properties of the isolators, ensuring that the design captures the most critical conditions for horizontal response. This approach accounts for potential variability in isolator performance over the structure’s lifetime and ensures the system’s reliability under the most demanding seismic scenarios [5]:
D M = g S M 1 T M 4 π 2 B M = 471.6   mm
where g represents the acceleration due to gravity [mm/s2]; S M 1 is the spectral acceleration parameter corresponding to the maximum considered earthquake response (MCER) for a 5% damped system in a 1 s period; and B M = 1.23 is a numerical coefficient related to the effective damping ( β M ) of the isolation system, calculated using Equation (4), at the maximum displacement ( D M ). Additionally, T M denotes the effective period of the seismically isolated structure at the displacement D M in the specific horizontal direction under analysis:
T M = 2 π W g k M = 2.574   s
where W represents the effective seismic weight of the structure situated above the isolation interface, while k M denotes the effective stiffness of the isolation system [kN/mm] at the maximum displacement:
k M = F M + + F M 2 D M = 1.1   kN / mm
where the term F M + represents the summation of the absolute values of the forces exerted by all isolator units when subjected to a positive displacement equal to D M ; similarly, F M denotes the summation of the absolute values of the forces exerted by all isolator units when subjected to a negative displacement.
The effective damping of the isolation system at the maximum displacement D M is the following:
β M = E M 2 π k M D M 2 = 11 %
where E M is the total energy dissipated in the isolation system during a full cycle of response at the displacement D M .
Since both the effective stiffness ( k M ) and the effective damping ( β M ) of the isolation system are functions of the maximum displacement ( D M ), the calculation of the effective period ( T M ) and the damping coefficient ( B M ) becomes an iterative process. This iterative approach is illustrated in Figure 3, where successive approximations refine these parameters until convergence is achieved. Following this, ASCE 7-22 mandates that designers calculate the total maximum displacement ( D T M ) of the isolation system [5]:
D T M = D M 1 + y P T 2 12 e b 2 + d 2
The total maximum displacement, D T M , must account for additional displacements caused by both actual and accidental torsion. These torsional effects arise from the spatial distribution of the isolation system’s lateral stiffness and the most unfavorable positioning of the eccentric mass within the structure. ASCE 7-22 [5] further specifies that the value of D T M shall not be taken as less than 1.15 times the maximum displacement ( D M ), ensuring a conservative estimate that accommodates potential torsional amplifications and enhances the reliability of the isolation system under seismic loading. In Equation (5), y represents the distance, measured perpendicular to the direction of seismic loading under consideration, between the center of rigidity of the isolation system and the element of interest; the term e refers to the total eccentricity, which includes both the actual eccentricity and the accidental eccentricity. The actual eccentricity is the distance in plan between the center of mass of the structure above the isolation interface and the center of rigidity of the isolation system. The accidental eccentricity is conservatively taken as 5% of the longest plan dimension of the structure, measured perpendicular to the direction of the seismic force under consideration. The parameter b denotes the shortest plan dimension of the structure, measured perpendicular to d , where d represents the longest plan dimension of the structure. Lastly, P T is defined as the ratio of the effective translational period of the isolation system to its effective torsional period. This ratio is a critical factor in assessing the dynamic behavior of the isolation system, particularly with respect to its torsional response under seismic excitation.
Finally, the minimum design force V b acting beneath the isolation plane and the lateral seismic force V s to be distributed along the height of the superstructure above the base level are presented in the corresponding table (Table 2) and in the following equations:
V b = K M D M = 10,292   k N
V s = V b R = 5146   kN
The interstory drift ratio (IDR—in Table 3) should be based on elastic analysis of the fixed-base structure under design seismic force multiplied by R .

3.1.3. EC8 Requirements for Seismic Isolation Design

Considering the building described in Section 2, which is situated in California on a site classified as Class CD according to ASCE [5] (with a shear wave velocity V s 30 = 3 60 m/s), this classification aligns with Class C as per EC8 [6]. The reference peak ground acceleration ( a g r ) on Type A ground for this site, corresponding to a 475-year return period (representing a 10% probability of exceedance in 50 years), is 0.32 g. This baseline value provides a starting point for seismic hazard characterization consistent with both ASCE [5] and EC8 [6] frameworks. To ensure a meaningful comparison between the design methodologies outlined in ASCE 7-22 [5] and EC8 [6], it is crucial to adopt a consistent reference point for seismic input. In this study, we extend the reference to align with a 2475-year return period, representing a 2% probability of exceedance in 50 years. This return period is consistent with the MCER in ASCE 7-22 [5] and provides a more conservative basis for evaluating the performance of the isolation system under extreme seismic events. By adopting this unified approach, this study facilitates a direct and reliable comparison of the design parameters and outcomes derived from the two codes. Consequently, the design ground acceleration on Type A ground is calculated as follows:
a g = a g r P L P L R 1 3 = 0.32 2 % 10 % 1 3 = 0.547   g
The fixed-base period of the building, representing the natural vibration period without seismic isolation, is calculated using the expression T f = 0.085 ( 20 ) 0.75 = 0.8 s. The parameters describing response spectrum for Type C ground are S = 1.15, T B = 0.2 s,   T C = 0.6 s, and T D = 2 s.
The simplified approach presented in EC8 [6] closely aligns with the methodology described in ASCE 7-22 [5] (and described in Figure 3), as both standards explicitly integrate displacement-based design principles into their frameworks. According to EC8 [6], the isolation system must be designed to withstand the design displacement ( d d c ), which represents the maximum expected displacement under design-level seismic conditions:
d d c = M S e T eff ,   ξ eff K eff = 338.82   mm
where M is the mass of the superstructure; S e T eff ,   ξ eff is the spectral acceleration; T eff = 2.49   s is the effective period of the isolation system; K eff is the effective horizontal stiffness of the isolation system when the design displacement d d c takes place; ξ eff = 14.2 % is the equivalent viscous damping (effective damping) of the isolation system. EC8 does not provide detailed guidance on calculating K eff and ξ eff . Instead, practitioners often rely on the methods described in Equations (3) and (4). Since EC8 does not provide explicit equations for calculating effective stiffness and damping, this study adopts the formulations from ASCE 7-22 to ensure consistency in evaluating isolation system behavior across both standards. While this approach introduces some potential conservatism from ASCE provisions, it enables a more structured comparison of displacement and force demands without introducing arbitrary assumptions.
Finally, the minimum design force f b acting beneath the isolation plane and the minimum seismic force f s to be distributed along the height of the superstructure above the base level are presented in the corresponding table (Table 4) and in the following equations:
f b = M S e T eff ,   ξ eff = 7902   k N
f s = f b q = 1.5 = 5268   kN
The IDR, in Table 5, should be based on elastic analysis of the fixed-base structure under design seismic force multiplied by q .

3.2. Friction Pendulum Isolators

3.2.1. Preliminary Design

Figure 4 illustrates the relationship between the dynamic friction coefficient μ and the vertical load applied to the isolator, specifically focusing on the ratio of the vertical load N S d to the maximum vertical load N E d . The vertical load N S d is typically assumed to be constant and represents the quasi-permanent load, which is the average load experienced by the isolator during an earthquake. In contrast, N E d corresponds to the maximum vertical load under ultimate limit state (ULS) load combinations, which include the effects of seismic action. This ratio is a critical parameter for understanding how variations in vertical load influence the isolator’s frictional behavior during dynamic conditions. For the present study, the devices under consideration can be equipped with two sliding materials, with distinct frictional properties: the former is characterized by a low friction coefficient, which is able to limit the base shear of the system with a significant displacement demand; the latter represents an intermediate case, which leads to a balance between the reduction in the building response and the limitation of the isolation displacement demand. In both cases, the friction coefficient is considered as a function of the applied vertical load. Such frictional properties are essential for evaluating the isolator’s performance under varying vertical loads and seismic demands, ensuring that the device operates within the expected parameters to achieve optimal isolation efficiency. Graphical results are provided as friction coefficient values, as a function of the vertical load ratio NSd/NEd, normalized with respect to the low friction coefficient at the design vertical load ( μ L d ).
The physical dimensions and mechanical properties of the device, chosen for its suitability in addressing the design requirements of the structure, are comprehensively detailed in Table 6.

3.2.2. ASCE7-22 Requirements for Seismic Isolation Design

By employing the same methodology illustrated in Figure 3 and utilizing the equations outlined in Section 3.1.2, we systematically derive key parameters for the CSS isolation system. These parameters include the maximum displacement ( D M = 487.7 mm), the effective period ( T M = 2.694 s), the effective stiffness ( k M = 1.0 kN/mm), and the effective damping ratio ( β M = 11.46 %). Most importantly, this iterative process enables us to determine the total maximum displacement ( D T M = 557.3 mm), which accounts for additional effects such as torsion and spatial variability in stiffness. Finally, the minimum design force V b acting beneath the isolation plane and the lateral seismic force V s to be distributed along the height of the superstructure above the base level are presented in the corresponding table (Table 7) and in the following equations:
V b = K M D M = 9713   k N
V s = V b R = 4856   kN
The IDR, in Table 8, should be based on elastic analysis of fixed-base structure under design seismic force multiplied by R .

3.2.3. EC8 Requirements for Seismic Isolation Design

By employing the same methodology illustrated in Figure 3 and utilizing the equations presented in Section 3.1.3, we systematically derive the key parameters governing the performance of the CSS isolation system within the framework of EC8 [6] requirements. Specifically, the analysis yields the design displacement ( d d c = 325.66 mm), which represents the maximum expected horizontal movement of the isolator under seismic action. Furthermore, we determine the effective period of the isolated structure ( T eff = 2.58   s ), which reflects the elongation of the structural vibration period introduced by the isolation system. Lastly, the analysis provides the effective damping ratio ( ξ eff = 15.7 % ), a critical parameter that accounts for the energy dissipation capacity of the CSS system during seismic excitation.
Finally, the minimum design force f b acting beneath the isolation plane, as well as the minimum seismic force f s to be distributed along the height of the superstructure above the base level, are presented in the corresponding Table 9 and in the following equations:
f b = M S e T eff ,   ξ eff = 7067   k N
f s = f b q = 1.5 = 4711   kN
The IDR, in Table 10, should be based on elastic analysis of the fixed-base structure under design seismic force multiplied by q .

4. Comparison of Design Assumptions and Procedures

In Section 3.1 and Section 3.2, the specific requirements for the equivalent lateral force (ELF) method, also referred to as the simplified linear analysis method, for seismically isolated structures were presented. These sections provided a comprehensive overview of the equations, parameters, and procedural steps required for the design of isolated systems in accordance with both ASCE 7-22 [5] and EC8 [6]. Additionally, a practical application of the methodology was demonstrated for each code, focusing on two distinct scenarios: one involving a structure isolated using LRB and the other utilizing a CSS.
The comparative analysis of the two design codes reveals that ASCE 7-22 [5] consistently produces higher design values for both LRB and CSS isolation systems. This trend is reflected in several critical design parameters, including longer effective periods, larger design displacements, and higher minimum design forces acting beneath the isolation plane (Figure 5). Figure 5a–d represent the IDR profile, and this comparison shows the IDR for each story level in the x and y directions, demonstrating how the different methodologies estimate structural deformation under seismic loading. Figure 5e–f depict the shear comparison. This plot presents the total shear forces derived from each method, illustrating the variations in force demands imposed by different seismic design approaches.
Although both ASCE 7-22 [5] and EC8 [6] adopt similar displacement-based design concepts and procedures, the key difference arises from the displacement spectra defined by each code. Specifically, the corner period—the point where the displacement spectrum flattens—is reached significantly earlier in EC8 [6], occurring at approximately 2 s in this study. In contrast, the corner period defined by ASCE 7-22 [5] occurs much later, at 8 s. This discrepancy becomes particularly relevant for structures with effective periods exceeding 2 s, where the displacement demands calculated using ASCE 7-22 [5] become notably larger. On the other hand, EC8 [6] offers slightly higher effective damping values, which can play a crucial role in reducing both displacement demands and seismic forces under specific conditions. The combination of higher damping and earlier corner periods may lead to more favorable results for certain isolation systems, particularly in scenarios where reducing forces and displacements is critical for performance optimization.

5. Nonlinear Time-History Analysis

SeismoStruct 2024 [12,13,14] was employed for the structural modeling and analysis of the building. The model exclusively includes the bare steel frames, meaning the contribution of the slab as a composite beam is intentionally omitted to focus on the steel frame behavior [18,19,20,21,22]. To represent the material behavior, a bilinear stress–strain model with kinematic strain hardening is adopted, ensuring accurate simulation of inelastic responses under seismic loads. The structural elements are modeled using an inelastic force-based plastic hinge frame element type (infrmFBPH) [23,24], with each section represented by 150 fibers to provide a detailed cross-sectional response. These plastic hinges exhibit bilinear hysteretic behavior, characterized by a curvature strain-hardening ratio of 0.02, and their length is specified as 1/6 of the respective member’s span, ensuring a realistic representation of plasticity. The plastic resistance at the hinges is derived from an expected yield strength of 290 MPa, reflecting material properties typical of ductile steel. Additionally, rigid-end offsets are included at the ends of frame members to account for the actual physical dimensions and stiffness of joints. The dynamic behavior of the structure is further refined by incorporating Rayleigh damping at a 3% critical damping ratio, calibrated using the first two elastic vibration modes. The time-step increment for the time-history dynamic analysis is set at 0.005 s, ensuring precise temporal resolution for capturing seismic responses. The failure criterion applied to all steel beams and columns is defined by a plastic hinge rotation limit of 0.03 radians, consistent with the AISC design provisions [25] introduced following the 1994 Northridge earthquake [26,27]. This limit reflects the ductility demands expected in moment-resisting steel frames under severe seismic loading. To address the potential for brittle failure at welded beam-to-column connections, the model incorporates flexural strength degradation at the ends of beams and columns. This degradation simulates the reduction in strength to 1% of the yield moment upon reaching the ultimate curvature, accurately capturing the behavior of connections as they transition from ductile to brittle failure modes. This approach provides a comprehensive framework for evaluating the seismic performance of the structure, considering both global and local failure mechanisms.
Experimental investigations have consistently highlighted the substantial influence of biaxial effects on the force–displacement behavior of isolators. These biaxial effects arise from the simultaneous application of forces in two perpendicular directions, a scenario commonly encountered during seismic events when structures are subjected to complex, multi-directional ground motions. Accurate modeling of these interactions is essential for capturing the realistic behavior of isolators under such conditions. In this study, the interaction between in-plane forces acting along the X and Y directions is explicitly considered to ensure that the isolators’ responses under biaxial loading are properly characterized.
For modeling LRBs, a biaxial hysteretic model has been employed. This model incorporates coupled plasticity properties for the two shear deformation modes, while linear stiffness properties are assumed for the remaining four deformation modes. The plasticity model is based on the hysteretic behavior proposed in [28], which extends the Wen model [29] for uniaxial behavior. This approach has been widely recommended for base-isolation analysis, as documented in [30]. The SeismoStruct 2024 software [12,13,14] implements this model under the name “Isolator1_Elastomeric Isolator Element”, a 3D zero-length element specifically designed to replicate the described behavior. This element is capable of accurately simulating the nonlinear, coupled response of LRBs under biaxial loading, ensuring that both shear and axial deformation characteristics are faithfully reproduced.
For CSSs, the friction model established in [31] has been adopted. This model describes the friction coefficient as a velocity-dependent parameter governed by an exponential analytical law, which captures the complex behavior of CSS isolators under dynamic loading conditions. SeismoStruct 2024 [12,13,14] provides this model through the “Isolator2_Friction Pendulum Isolator” element, which, like the LRB element, is a 3D zero-length element. This element incorporates coupled plasticity properties for the two shear directions (axes 2 and 3 in the local coordinate system) while maintaining linear elastic behavior for the other four deformation types. The model is designed to accurately simulate the dynamic behavior of CSS isolators, including the interaction between shear forces and the isolator’s frictional response.

5.1. Selection of Ground Motion Records

The conditional mean spectrum (CMS) is classically an appropriate target response spectrum and a valuable tool for selecting ground motions for dynamic analysis [32,33,34,35]. This approach ensures that the selected ground motions match the expected spectral shape at a given target period, providing a realistic representation of seismic demands. Baker in [36] presented a step-by-step procedure for computing the ground motion selection process to match CMS:
  • Step 1: Specify the Target Spectrum: The CMS is used as the target RotD50 spectrum (50th percentile). First, identify the target spectral acceleration ( S a ) at a period of interest T * . From previous calculations, the effective period of the isolated structure is found to be T ASCE = 2.57 s and T EC 8 = 2.5 s using lead–rubber bearings and T ASCE = 2.7 s and T EC 8   = 2.6 s using curved surface sliders. Approximately, we assume T * = 2.5 s. The corresponding spectral acceleration (2% probability of exceedance in 50 years) is S a (2.5) = 0.4 g. Figure 6 represents the conditional spectrum associated with magnitude = 7.93, distance = 39.9 km, ε = 1.5, V s 30 = 365 m/s, a California strike-slip rupture, and S a (2.5) = 0.4 g.
  • Step 2: Statistically Simulate Spectra: Monte Carlo simulation is used to probabilistically generate multiple response spectra from a distribution parameterized by the target means and variances of CMS (Figure 7).
  • Step 3: Specify Ground Motion Database: Here, we will consider the NGA-West2 database [37] of recorded ground motions and screen for suitable ground motions. Given that the target spectrum is associated with a magnitude 7.93, distance 39.9 km event, we restricted the selection to ground motions within 50 km of an earthquake with a magnitude between 6 and 9. With these criteria, the NGA West2 database has 1225 ground motions satisfying the initial screening. Scaling of ground motions was allowed but limited to a maximum of four. The selected motions were matched within a period range of 0.1 T * to 2 T * (0.25 to 5 s).
  • Step 4: From the database, an initial set of 20 ground motions was selected to match the simulated spectra. These motions were chosen based on their compatibility with the CMS, ensuring an appropriate distribution of spectral accelerations over the target period range.
  • Step 5: To ensure statistical accuracy, a maximum error tolerance of 10% was specified for the mean and standard deviation of spectral accelerations across the selected ground motions. This tolerance guarantees that the selected motions closely align with the target CMS.
  • Step 6: An optimization process was performed to further refine the selection of ground motions. Prior to optimization, the maximum errors in the mean and standard deviation of spectral accelerations were 11% and 33%, respectively. After optimization, these errors were significantly reduced to 6.5% and 9.4%, demonstrating the effectiveness of the optimization in achieving closer alignment with the CMS.
  • Step 7: The final set of selected ground motions was outputted, with their response spectra illustrated in Figure 6. The characteristics of these selected records, including their magnitude, distance, and scaling factors, are summarized in Table 11. These motions form the basis for dynamic analysis, ensuring that the selected inputs accurately represent the seismic demands expected at the site.

5.2. Analysis Results and Comparisons

Using the SeismoStruct 2024 software [
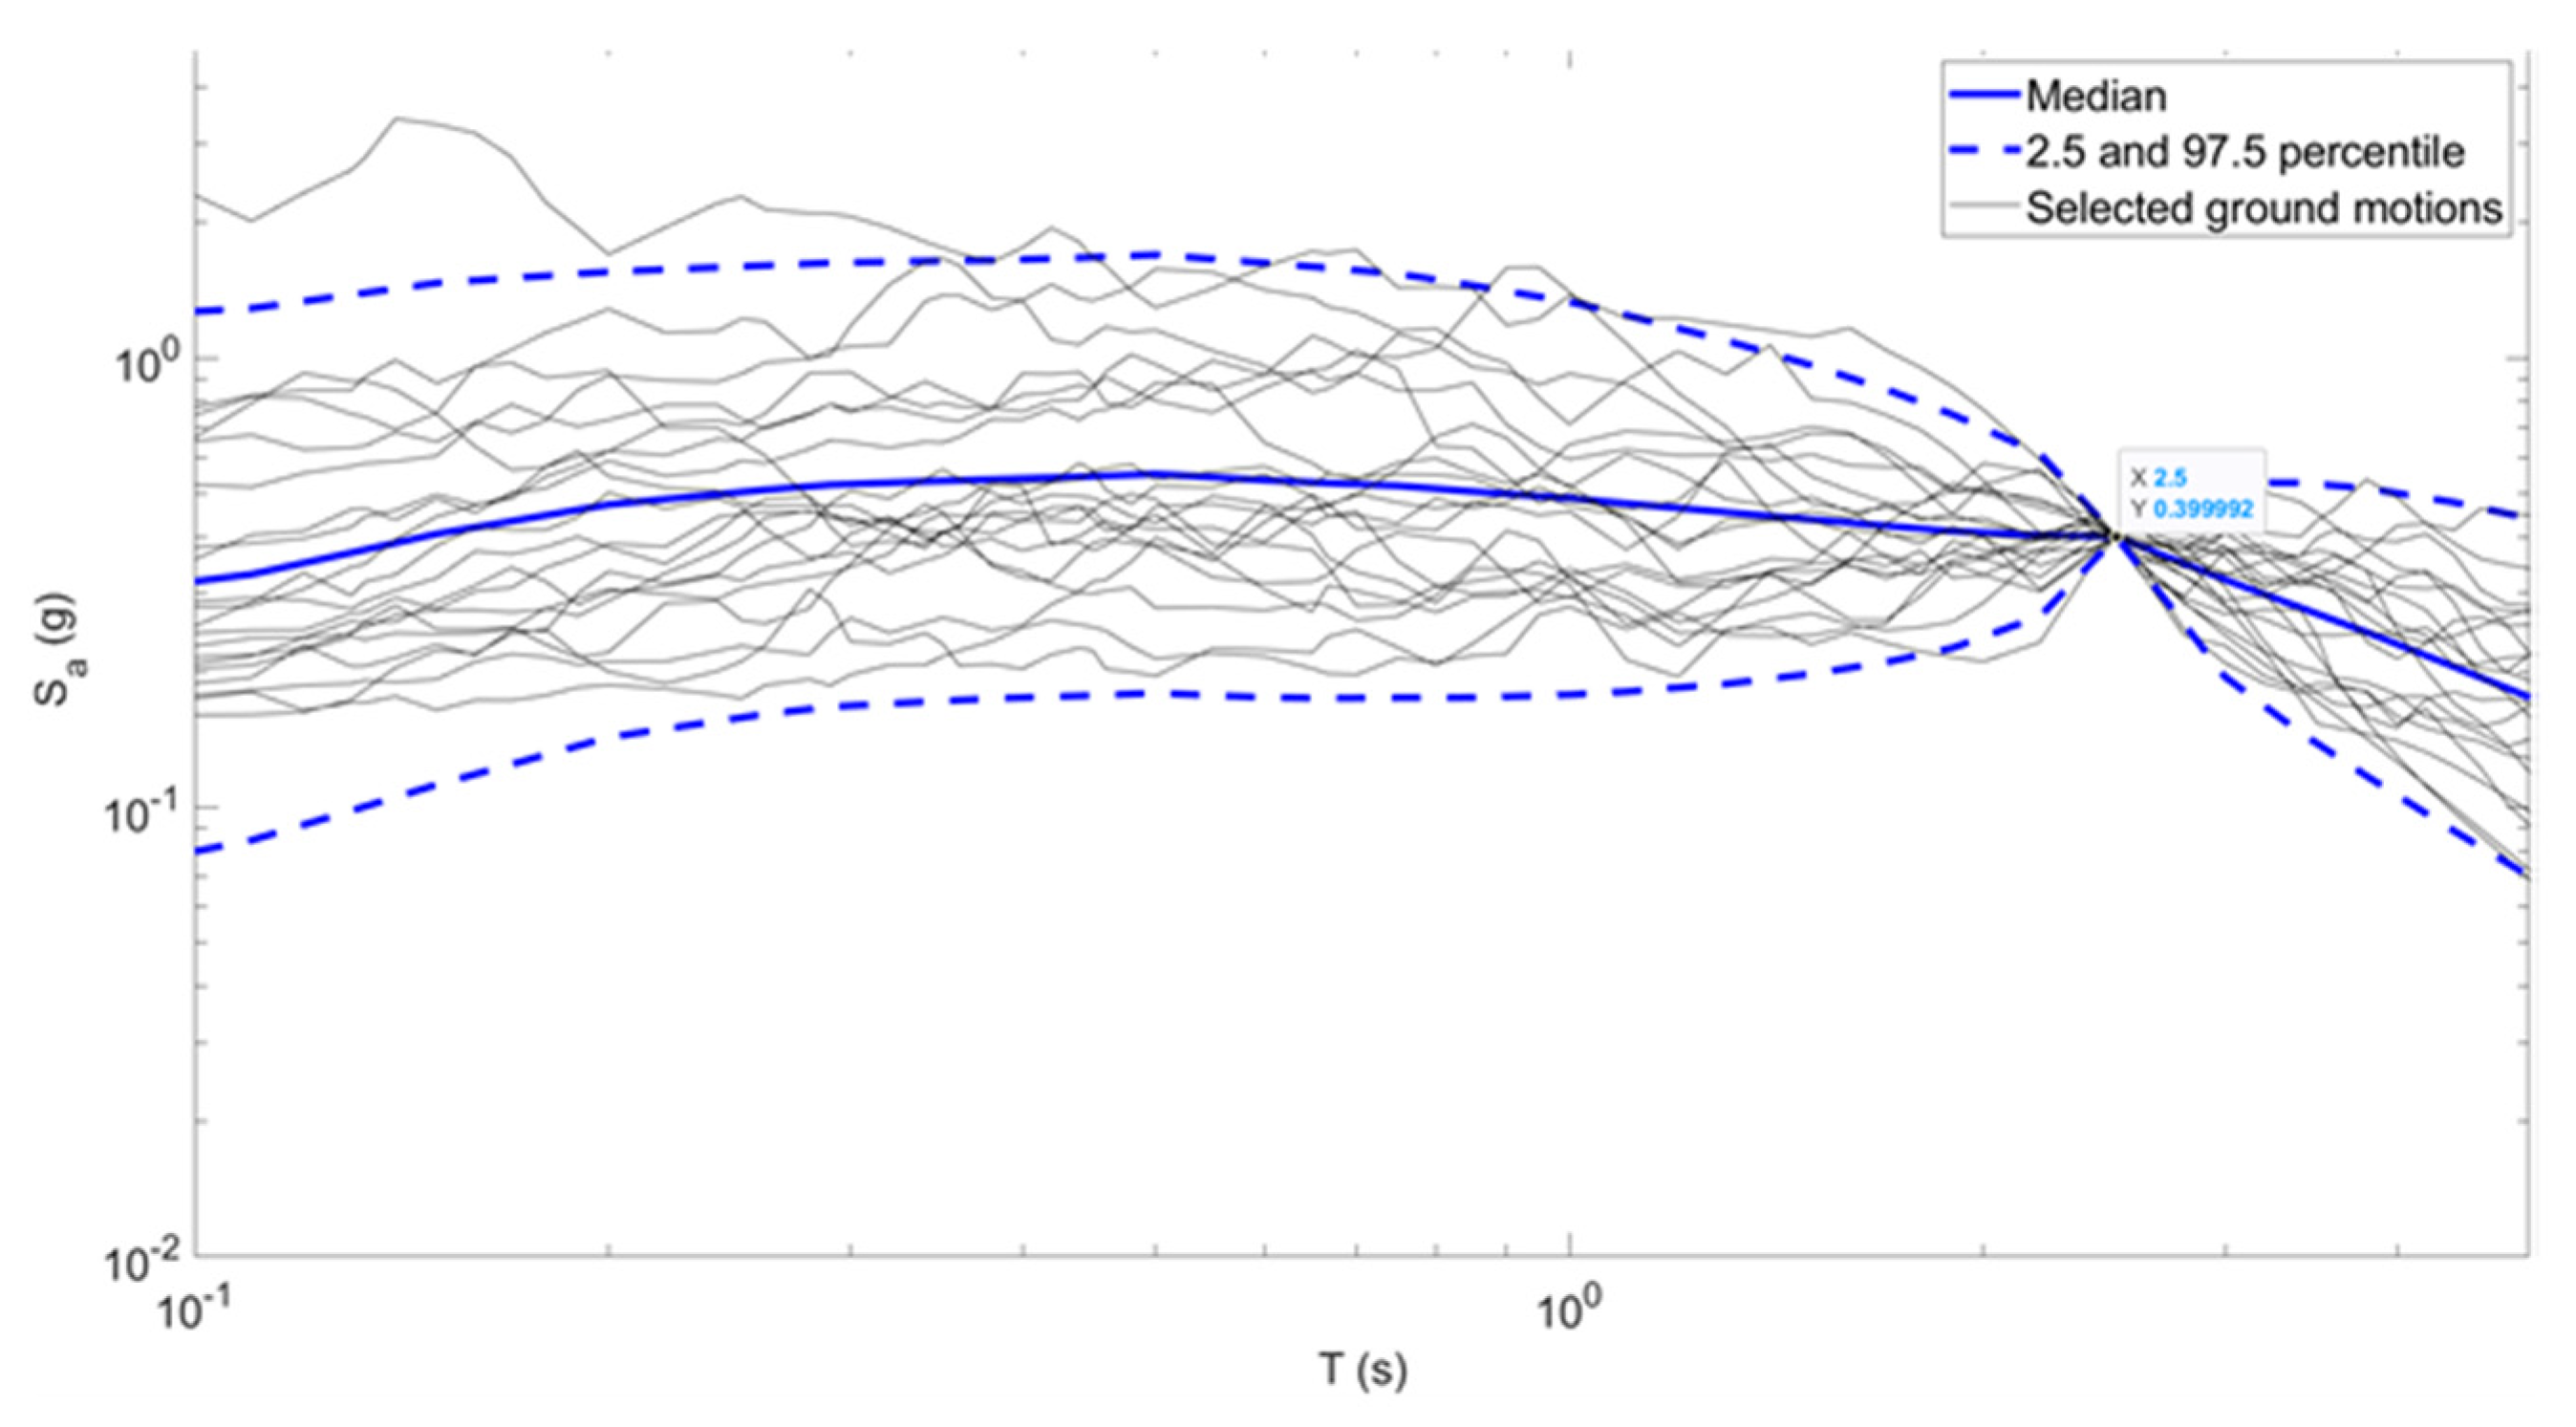
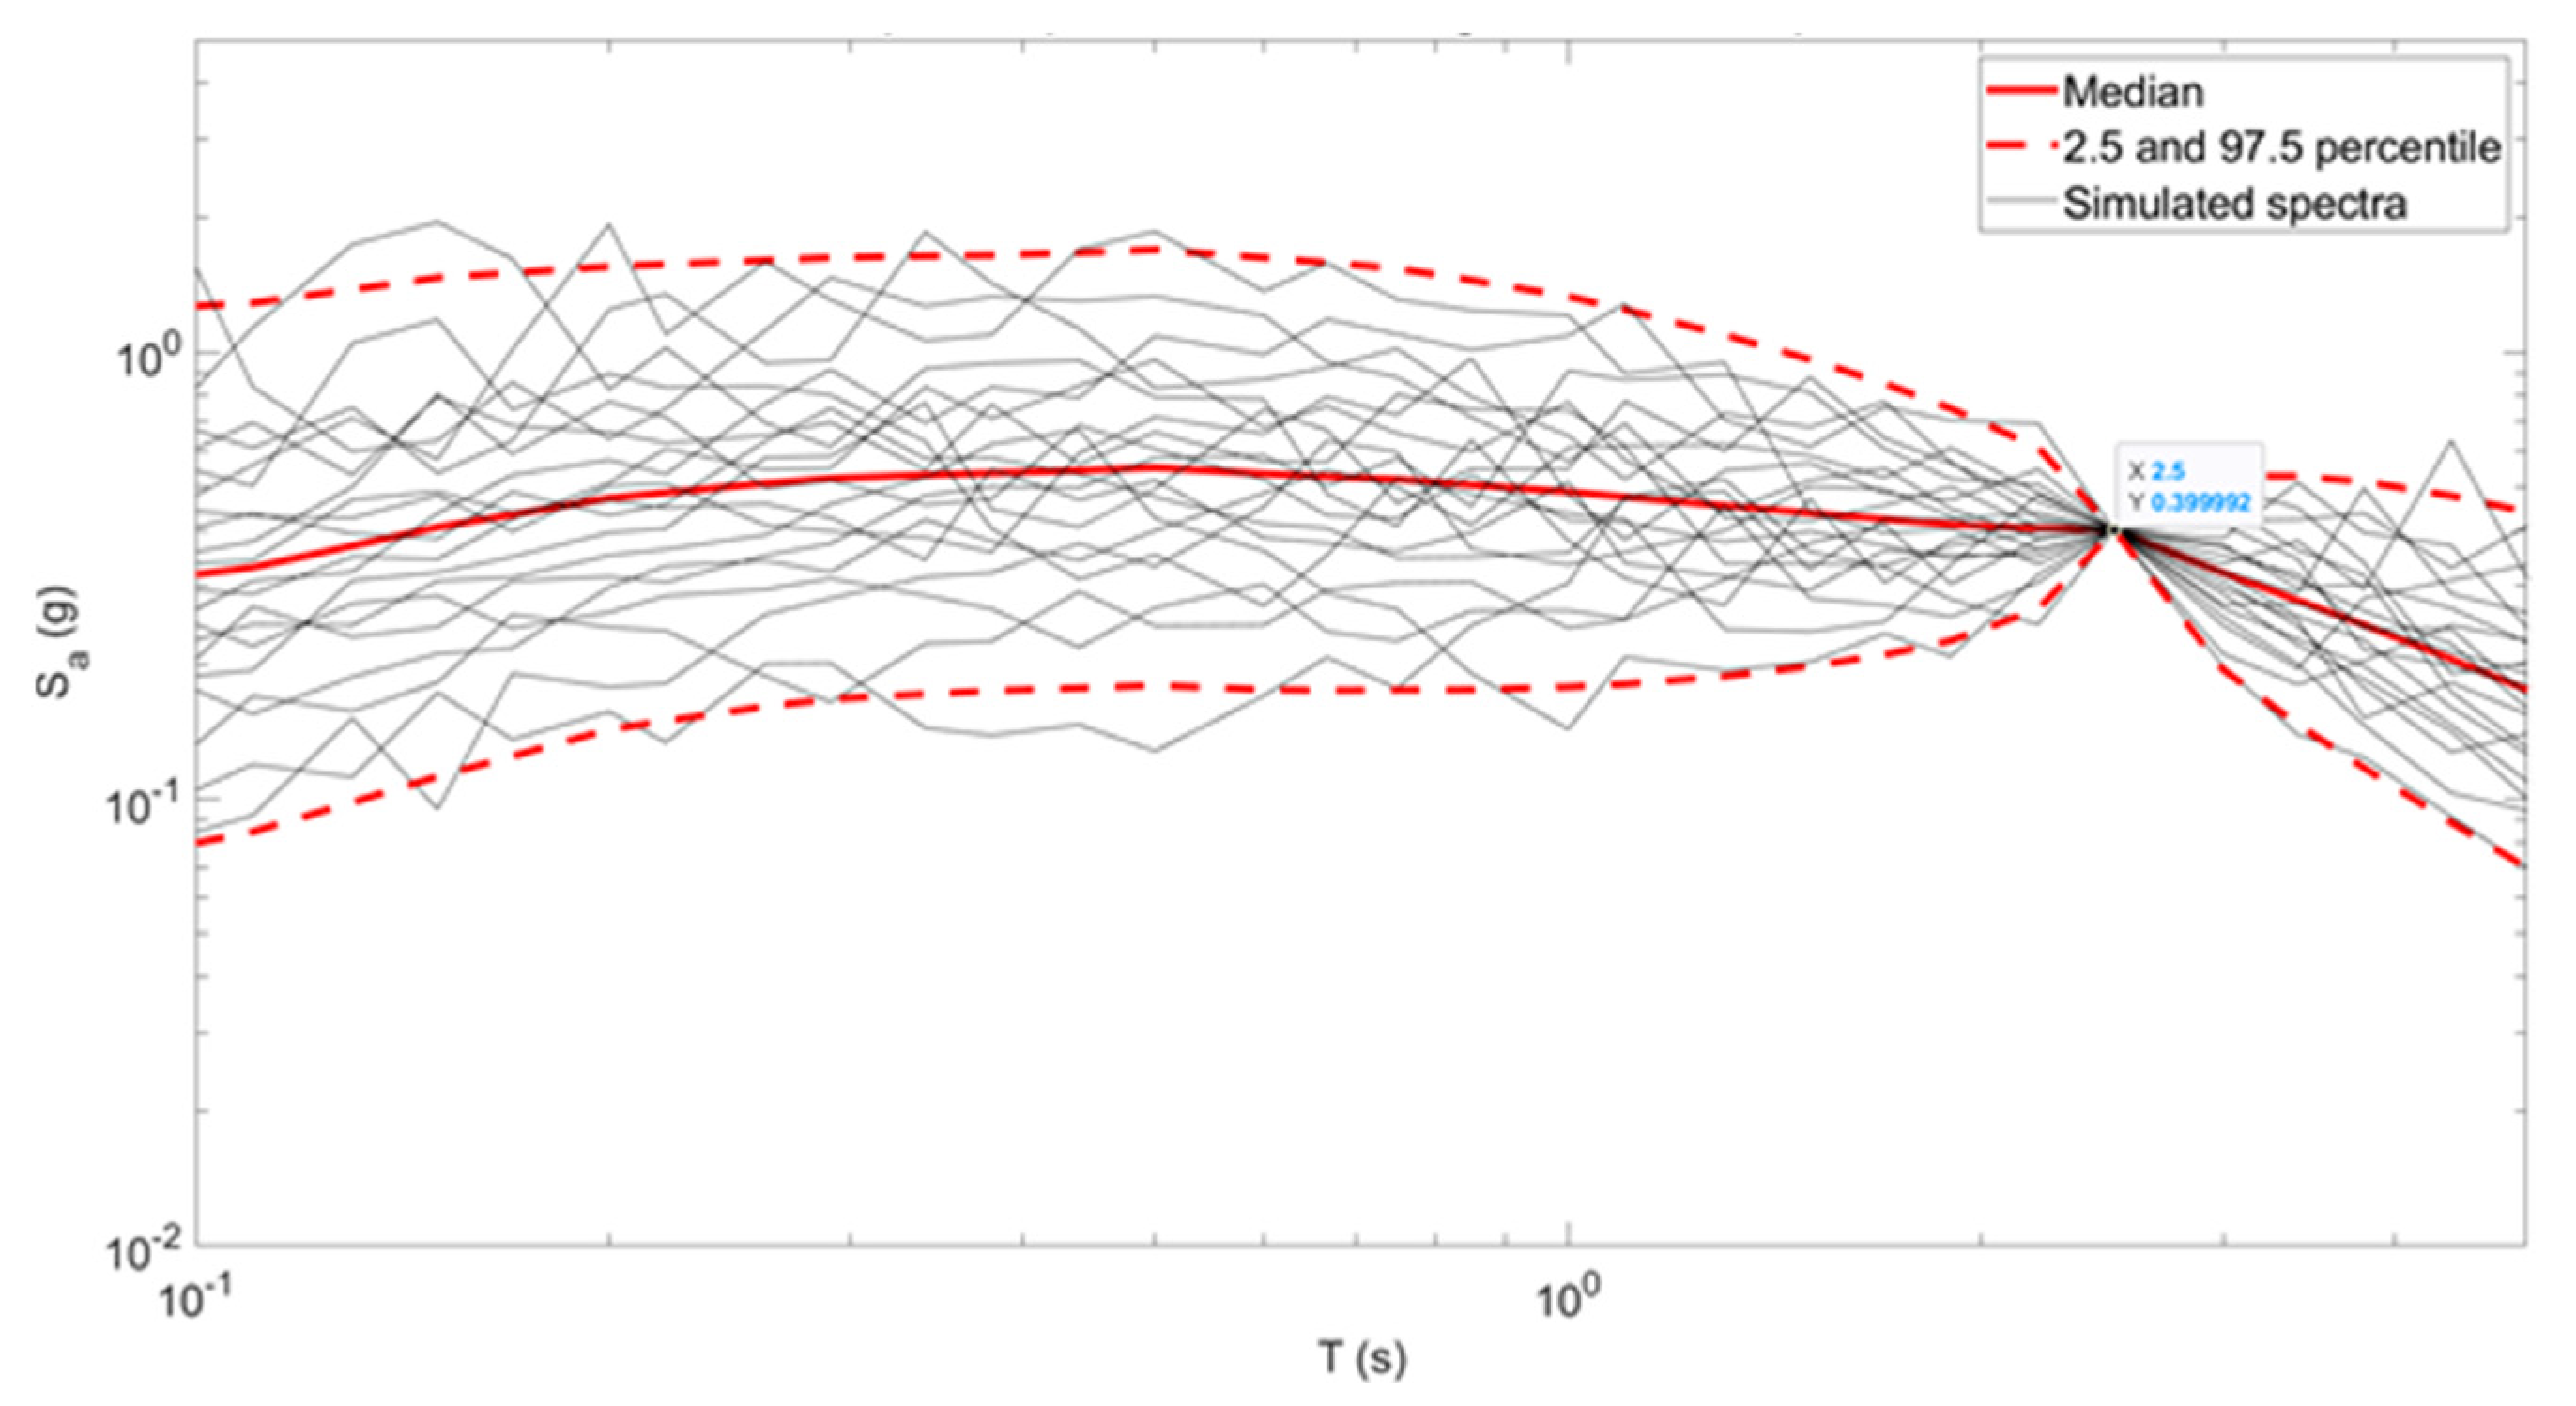
12,13,14], a comprehensive set of 40 nonlinear time-history analyses was performed—20 for the structures isolated with LRBs and 20 for those using CSSs. These analyses utilized the models and ground motion records previously described, ensuring consistency with the selected parameters and input conditions. For each analysis, the maximum displacement of the center of rigidity was extracted along both the X and Y directions. The maximum displacements were then averaged across the 20 analyses for both the LRB and CSS isolation systems, providing insight into the relative performance of each system. The resulting average displacements are summarized in Table 12, highlighting the effectiveness of each isolator type in controlling seismic displacements.
To evaluate the lateral forces acting on each floor and determine the base shear, the nodal accelerations at every floor were extracted for every time step of the analysis. The lateral force at each node was calculated by multiplying the nodal acceleration by the corresponding mass. These nodal forces were summed for each floor to determine the total lateral force at each time step. From these data, the maximum lateral forces experienced by each floor during the analyses were identified, and the average maximum lateral forces were computed across all 20 ground motions for both LRB and CSS systems. The results are presented in Table 13, which provides a detailed comparison of the lateral force distribution across the height of the structure.
For the IDR, the displacement of the center of rigidity at each floor was extracted in both the X and Y directions for every time step. The IDR for each floor was calculated at every time step as the ratio of the relative displacement between adjacent floors to the story height. For each ground motion record, the maximum IDR was identified for every floor. Subsequently, the average maximum IDR was computed across all 20 ground motions for both LRB and CSS isolation systems. These results are summarized in Table 14, providing a clear comparison of the deformation behavior of the two isolator types.
This rigorous analysis framework allows for a detailed evaluation of the seismic performance of the isolated structures, comparing key metrics such as displacement, lateral force, base shear, and interstory drift ratio. The selection of displacement, lateral force, base shear, and interstory drift ratio as primary evaluation metrics is justified by their direct impact on the design and performance assessment of seismically isolated structures. These metrics comprehensively capture both the isolator behavior (displacement and base shear) and the superstructure response (lateral force and IDR). By comparing these parameters across ASCE 7-22, EC8, and NTHA, this study provides a holistic evaluation of the reliability, accuracy, and conservatism of the simplified linear methods relative to a more advanced nonlinear approach. The results serve as a basis for assessing the relative effectiveness of the LRB and CSS systems in reducing seismic demands and enhancing structural resilience.
Table 15 and Table 16 compare the predictions of the American code (ASCE 7-22), the European code (EC8), and NTHA for buildings using LRBs and CSSs, respectively. The comparison focuses on two primary parameters: the maximum displacement at the center of rigidity of the isolation system and the actual lateral seismic force above the base level, calculated without reductions from R -factors or q -factors. The percentage differences reported in Table 15 and Table 16 are relative to the nonlinear time history analysis (NTHA) results, serving as a reference for comparison. These differences were calculated as the ratio of the deviation from NTHA to the NTHA value itself, ensuring a clear assessment of whether ASCE 7-22 and EC8 overestimate or underestimate key seismic response parameters.
For buildings equipped with lead–rubber bearings, the American code (ASCE 7-22) significantly overestimates the maximum displacement when compared to NTHA results, with deviations reaching up to 58% in the Y -direction and 52% in the X -direction. In contrast, the European code (EC8) provides displacement estimates that are closer to the actual values, differing by only 14% in the Y -direction and 9% in the X -direction. Similarly, the lateral seismic forces predicted by ASCE 7-22 are considerably higher than those derived from NTHA, with differences of up to 89% in the Y -direction and 45% in the X -direction. The European code, while still overestimating the forces, performs better, with differences of 45% in the Y -direction and 11% in the X -direction.
These findings indicate that the European code aligns more closely with the actual behavior of the structure as determined by NTHA, particularly for both displacements and lateral forces. However, it still demonstrates some degree of conservatism. In contrast, the American code exhibits a much higher level of conservatism, particularly for displacement and force estimates, which may lead to over-designed and unnecessarily costly structures.
For structures employing CSSs, as shown in Table 16, both the American code (ASCE 7-22) and the European code (EC8) overestimate the maximum displacement by a considerable margin, with ASCE demonstrating much higher deviations. Specifically, ASCE overestimates the displacement by 241% in the X -direction and 210% in the Y -direction, while EC8 overestimates by 128% in the X -direction and 107% in the Y -direction. Similarly, for lateral seismic forces, ASCE continues to show significant overestimation, with deviations of 53% in the X -direction and 70% in the Y -direction. In contrast, EC8 presents more moderate overestimations for lateral forces, with deviations of 12% in the X -direction and 24% in the Y -direction. These findings highlight that, although both codes adopt conservative approaches, ASCE consistently yields higher and more conservative values, particularly for displacement estimates, which may lead to excessively robust and costly designs. EC8, while still conservative, provides results that are comparatively closer to actual performance as derived from NTHA.
These findings emphasize the practicality of applying the simplified method outlined in EC8 for LRB systems, as its predictions align more closely with actual performance. Alternatively, ASCE 7-22, while yielding more conservative results, prioritizes safety and can also be utilized effectively for LRB systems. However, for CSSs, the simplified method is less suitable due to the significant discrepancies it produces when compared to actual performance. In such cases, more precise methodologies, such as NTHA, should be employed for the final design to ensure accuracy and reliability. This conclusion is consistent with provisions in the European code, specifically Section 10.9.2. (1) of EC8. The code explicitly allows the use of equivalent linear models for isolation systems incorporating laminated elastomeric bearings, where the behavior can be adequately captured through linear assumptions. However, for elasto-plastic devices, such as friction-based systems, EC8 mandates the application of a bilinear hysteretic model to accurately represent the nonlinear behavior of these isolators. As a result, simplified linear analysis methods are not applicable for such systems, reinforcing the necessity of nonlinear time-history analysis to achieve a reliable and accurate design.
Table 17 and 
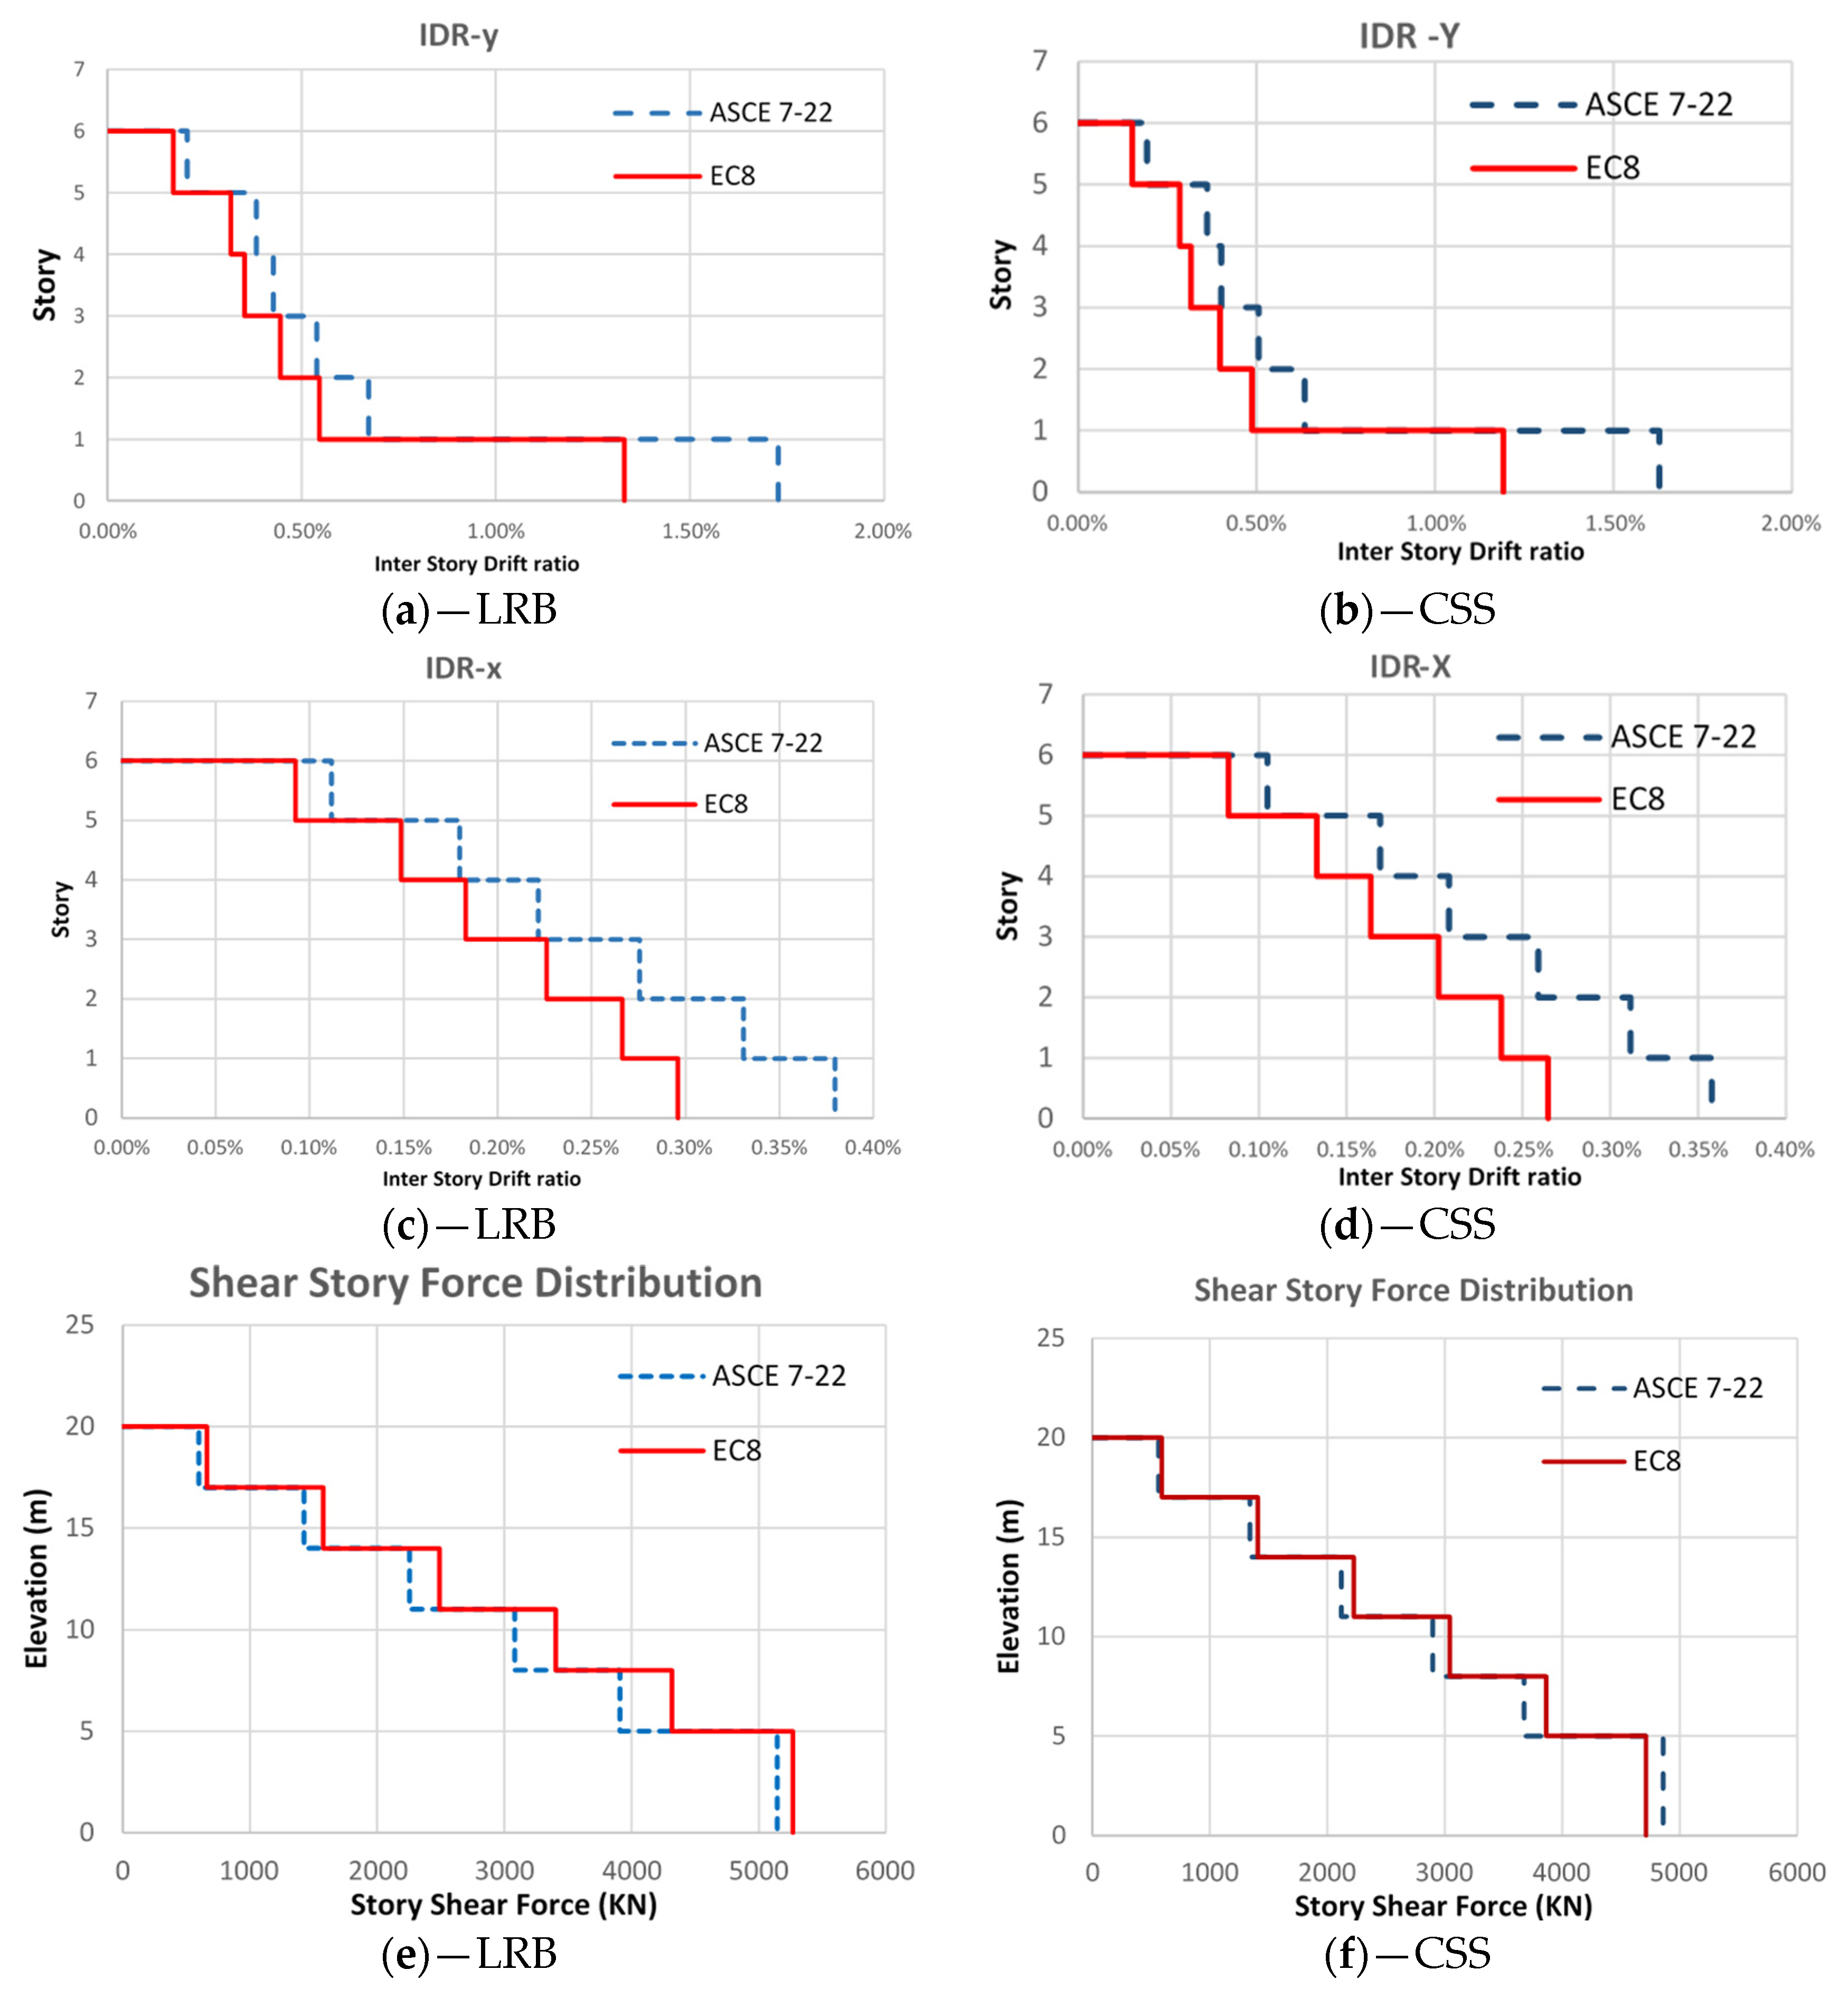
Table 18 present a comparative analysis of the story shear forces calculated using three methods, EC8, ASCE 7-22, and NTHA, for structures employing LRBs and CSSs, respectively. For the LRB system, EC8 exhibits relative differences compared to NTHA. In the X -direction, which represents the stiffer direction of the structure, the differences range from −4% to 22%, indicating a relatively close match with NTHA in many cases. In the Y -direction, which is less stiff, EC8 results show increases of up to 59% compared to NTHA. On the other hand, ASCE 7-22 consistently predicts higher story shear forces than NTHA, with increases reaching up to 95% in the X -direction and as high as 160% in the Y -direction. These findings highlight the more conservative nature of ASCE, especially in the less stiff direction. For CSSs, EC8 also shows differences from NTHA. In the X -direction, the differences range from −14% to 27%, while in the Y -direction, the values vary from −4% to 37%, demonstrating a wider variability compared to the LRB case. ASCE 7-22 again yields higher values, with the most significant increase being 135%, reflecting its consistently conservative approach for shear force predictions across both directions.
These results underscore the variability in performance predictions among the methods. While EC8 aligns more closely with NTHA in many cases, ASCE 7-22 consistently provides more conservative estimates, particularly for shear forces, which may lead to over-design in some scenarios.
Regarding the IDR, as presented in Table 19 and Table 20, both ASCE 7-22 and EC8 consistently overestimate the IDR across all stories for structures equipped with LRBs. However, EC8 provides results that are closer to the NTHA values compared to ASCE. Notably, for the first story, both standards underestimate the IDR, with EC8 showing a deviation of up to −31% and ASCE underestimating by −11%. This indicates that while EC8 generally aligns better with NTHA, it significantly underestimates first-story deformations for LRB systems. For structures with CSSs, EC8 also underestimates the IDR for the first story, demonstrating a recurring limitation of both codes in accurately predicting first-story drift for isolator types. These findings suggest that while both standards adopt conservative approaches for upper-story IDRs, they may require additional considerations or adjustments to better capture the behavior of the first story, particularly for CSS systems.

6. Conclusions

This study outlines the design requirements for seismically isolated structures, emphasizing the distinctions between the U.S. code (ASCE 7-22) and the European code (EC8). It provides a detailed comparison of the simplified design procedures for seismic isolation as prescribed by both codes and evaluates their effectiveness through NTHA. A case study was conducted on a six-story steel building, which was analyzed under the provisions of each code using two types of isolation systems: LRBs and CSSs. The building was subjected to 20 recorded ground motions selected and scaled to match a CMS. Key performance metrics, including displacement at the isolation level, story shear forces, and interstory drift ratios, were compared. The main findings of the study are summarized below:
  • Seismic Hazard Definitions: ASCE 7-22 and EC8 differ significantly in their definitions of seismic hazard for the design of isolated structures. ASCE 7-22 considers a 2475-year return period for earthquakes (2% probability of exceedance in 50 years), whereas EC8 uses a 245-year return period (10% probability of exceedance in 50 years) as the basis for design. This fundamental difference leads to varying levels of conservatism between the two codes.
  • Displacement-Based Design: Both codes use displacement-based design principles in their ELF or simplified linear analysis methods. This approach assumes that the superstructure behaves nearly as a rigid body, concentrating deformations at the isolation level.
  • Displacement Spectra Differences: A key difference between ASCE and EC8 lies in their displacement spectra [38,39,40]. EC8 defines an earlier corner period (e.g., 2 s in this study), resulting in lower design displacements for effective periods exceeding 2 s. In contrast, ASCE 7-22 uses a later corner period (e.g., 8 s), leading to higher displacements and force estimates.
  • Requirements for Simplified Methods: Both codes specify conditions under which the simplified method is permissible. These include considerations for the effective stiffness and damping, the structural regularity, and the restoring force provided by the isolation system. However, EC8 imposes more stringent requirements for these criteria, reflecting its greater emphasis on isolator performance and structural regularity.
  • Bounding Analysis and Device Testing: both codes mandate a bounding analysis to account for variability in isolator properties and require extensive testing of the isolation devices to ensure reliability under seismic conditions.
  • Amplification Factor in EC8: EC8 introduces an amplification factor (γx) to enhance the reliability of the isolators. This factor, however, does not influence the design displacement (ddc) or the lateral seismic forces of the structure. The misconception that this factor equates EC8’s requirements to a 2475-year return period earthquake, as in ASCE, is incorrect.
  • Conservatism of Simplified Methods: Both codes’ simplified methods provide conservative estimates compared to NTHA, particularly for the design displacement of the isolation system. While conservatism enhances safety, excessive conservatism can lead to over-designed and cost-prohibitive structures.
  • Performance for LRBs: For LRB systems, both codes produce results that align well with NTHA. The design displacement (ddc) and lateral seismic forces (Vs) calculated using EC8 show close agreement with NTHA results, making the simplified method reliable for LRB systems.
  • Performance for CSSs: Discrepancies arise for CSS systems, where EC8’s design displacement deviates by up to 128% from NTHA results. ASCE 7-22, however, significantly overestimates design displacement and forces, with deviations of up to 241% compared to NTHA. The underestimation of first-story IDR for CSS isolators in ASCE 7-22 and EC8 likely results from a combination of equivalent linearization assumptions and isolator modeling limitations. Standard methods neglect higher-mode contributions, velocity-dependent friction effects, and bidirectional coupling, leading to lower drift predictions than those observed in nonlinear time-history analysis. To better capture first-story drift behavior, refined nonlinear modeling and site-specific analysis may be necessary, particularly for structures with flexible superstructures or significant torsional effects.
  • Reliability and Precision: EC8’s simplified method is generally more reliable for LRB systems, producing results closer to observed performance. In contrast, ASCE 7-22, though more conservative, may be preferable where safety is prioritized. For CSS systems, however, reliance on simplified methods is less advisable, and more precise analytical techniques should be used in the final design stages.
This study highlights that while ASCE 7-22 and EC8 provide solid frameworks for the design of seismically isolated structures, their inherent conservatism should be carefully evaluated. Designers must balance safety and cost-efficiency, especially when the simplified methods produce overly conservative results. For LRB systems, EC8 appears to offer a more practical and reliable design approach. Conversely, for CSS systems, reliance on more detailed analyses, such as NTHA, is essential to ensure both performance and cost-effectiveness.

Author Contributions

Conceptualization, E.Y. and M.F.; methodology, E.Y.; software, E.Y.; validation, E.Y.; resources, M.F. and R.N.; writing—original draft preparation, R.N.; writing—review and editing, R.N. and A.P.; supervision, A.P. All authors have read and agreed to the published version of the manuscript.

Funding

This research received no external funding.

Data Availability Statement

Data are contained within the article.

Conflicts of Interest

The authors declare no conflicts of interest.

References

  1. Feng, D.; Liu, W.; Masuda, K.; Wang, S.; Huan, S. A comparative study of seismic isolation codes worldwide, part 1 Design Spectrum. In Proceedings of the First European Conference on Earthquake Engineering and Seismology, Geneva, Switzerland, 3–8 September 2006. [Google Scholar]
  2. Merino, R.J.; Perrone, D.; Nascimbene, R.; Filiatrault, A. Performance-based seismic classification of acceleration-sensitive non-structural elements. Earthq. Eng. Struct. Dyn. 2023, 52, 4222–4244. [Google Scholar] [CrossRef]
  3. Christopoulos, C.; Filatrault, A. Principles of Passive Supplemental Damping and Seismic Isolation, 1st ed.; IUSS Press: Pavia, Italy, 2006. [Google Scholar]
  4. Grant, D. Seismic isolation and supplemental damping. In Seismic Design of Buildings, 2nd ed.; CRC Press: London, UK, 2016. [Google Scholar]
  5. ASCE 7-22; Minimum Design Loads and Associated Criteria for Buildings and Other Structures (ASCE/SEI 7-22). American Society of Civil Engineers: Reston, VA, USA, 2022.
  6. EN 1998-1; Eurocode 8: Design of Structures for Earthquake Resistance—Part 1: General Rules, Seismic Actions and Rules for Buildings. European Committee for Standardization: Brussels, Belgium, 2004.
  7. Tsai, K.-C.; Popov, E.P. Steel Beam-Column Joints in Seismic Moment Resisting Frames; Earthquake Engineering Research Center, University of California: Berkeley, CA, USA, 1988. [Google Scholar]
  8. Hall, J. Seismic response of steel frame buildings to near-source ground motions. Earthq. Eng. Struct. Dyn. 1998, 27, 1445–1464. [Google Scholar] [CrossRef]
  9. Filiatrault, A.; Tremblay, R.; Wanitkorkul, A. Performance evaluation of passive damping systems for the seismic retrofit of steel moment-resisting frames subjected to near-field ground motions. Earthq. Spectra 2001, 17, 427–456. [Google Scholar] [CrossRef]
  10. International Conference of Building Officials. Uniform Building Code (UBC); International Conference of Building Officials: Lansing, MI, USA, 1994. [Google Scholar]
  11. USGS Earthquake Hazard Toolbox. Available online: https://earthquake.usgs.gov (accessed on 20 December 2024).
  12. SeismoStruct2024. A Computer Program for Static and Dynamic Nonlinear Analysis of Framed Structures. Available online: https://seismosoft.com/ (accessed on 20 December 2024).
  13. Nascimbene, R. Numerical model of a reinforced concrete building: Earthquake analysis and experimental validation. Period. Polytech. Civ. Eng. 2015, 59, 521–530. [Google Scholar] [CrossRef]
  14. Almeida, J.P.; Correia, A.A.; Pinho, R. Force-based higher-order beam element with flexural-shear-torsional interaction in 3D frames. Part II: Applications. Eng. Struct. 2015, 89, 218–235. [Google Scholar] [CrossRef]
  15. Mazzotta, V.; Brunesi, E.; Nascimbene, R. Numerical modeling and seismic analysis of tall steel buildings with braced frame systems. Period. Polytech. Civ. Eng. 2017, 61, 196–208. [Google Scholar] [CrossRef]
  16. Fan, H.; Li, Q.S.; Tuan, A.Y.; Xu, L. Seismic analysis of the world’s tallest building. J. Constr. Steel Res. 2009, 65, 1206–1215. [Google Scholar] [CrossRef]
  17. Nagarajaiah, S.; Reinhorn, A.M.; Constantinou, M.C. Nonlinear Dynamic Analysis of Three-Dimensional Base Isolated Structures (3D-Basis); National Center for Earthquake Engineering Research: Buffalo, NY, USA, 1989. [Google Scholar]
  18. Song, B.I.; Giriunas, K.A.; Sezen, H. Progressive collapse testing and analysis of a steel frame building. J. Constr. Steel Res. 2014, 94, 76–83. [Google Scholar] [CrossRef]
  19. Rodrigues, D.; Brunesi, E.; Nascimbene, R. Fragility and sensitivity analysis of steel frames with bolted-angle connections under progressive collapse. Eng. Struct. 2021, 228, 111508. [Google Scholar] [CrossRef]
  20. Yang, B.; Tan, K.H. Experimental tests of different types of bolted steel beam-column joints under a central-column-removal scenario. Eng. Struct. 2013, 54, 112–130. [Google Scholar] [CrossRef]
  21. Gonzalez, A.; Spacone, E.; Nascimbene, R. Performance-based seismic design framework for RC floor diaphragms in dual systems. Procedia Eng. 2017, 199, 3546–3551. [Google Scholar] [CrossRef]
  22. Sarkis, A.; Sullivan, T.; Brunesi, E.; Nascimbene, R. Investigating the Effect of Bending on the Seismic Performance of Hollow-Core Flooring. Int. J. Concr. Struct. M. 2023, 17, 18. [Google Scholar] [CrossRef]
  23. Spacone, E.; Filippou, F.C.; Taucer, F.F. Fibre beam–column model for non-linear analysis of R/C frames: Part I. Formulation. Earthq. Eng. Struct. Dyn. 1996, 25, 711–725. [Google Scholar] [CrossRef]
  24. Pavese, A.; Lanese, I.; Nascimbene, R. Seismic Vulnerability Assessment of an Infilled Reinforced Concrete Frame Structure Designed for Gravity Loads. J. Earthq. Eng. 2017, 21, 267–289. [Google Scholar] [CrossRef]
  25. American Institute of Steel Construction (AISC). Available online: https://www.aisc.org (accessed on 23 December 2024).
  26. Hough, S.; Graves, R.W.; Cochran, E.S.; Yoon, C.E.; Blair, L.; Haefner, S.; Wald, D.J.; Quitoriano, V. The 17 January 1994 Northridge, California, Earthquake: A Retrospective Analysis. Seism. Rec. 2024, 4, 151–160. [Google Scholar] [CrossRef]
  27. Richards, P.W. Finite Element Evaluation of New Retrofit Schemes for Pre-Northridge Connections. Lect. Notes Civ. Eng. 2024, 520, 552–563. [Google Scholar]
  28. Park, Y.J.; Wen, Y.K.; Ang, H.S. Random vibration of hysteretic systems under bi-directional ground motions. Earthq. Eng. Struct Dyn. 1986, 14, 543–557. [Google Scholar] [CrossRef]
  29. Wen, Y.K. Method for Random Vibration of Hysteretic Systems. J. Eng. Mech. ASCE Div. 1967, 102, 249–263. [Google Scholar] [CrossRef]
  30. Nagarajaiah, S.; Reinhorn, A.M.; Constantinou, M.C. 3D-BASIS—Nonlinear Dynamic Analysis of Three-Dimensional Base Isolated Structures: Part II.; National Center for Earthquake Engineering Research: Buffalo, NY, USA, 1991. [Google Scholar]
  31. Constantinou, M.C.; Tsopelas, P.; Kasalanati, A.; Wolff, E.D. Property Modification Factors for Seismic Isolation Bearings; National Center for Earthquake Engineering Research: Buffalo, NY, USA, 1999. [Google Scholar]
  32. Baker, J.W. CS_Selection. Available online: https://github.com/bakerjw/CS_Selection (accessed on 23 December 2024).
  33. Baker, J.W.; Cornell, C.A. Correlation of response spectral values for multicomponent ground motions. BSSA 2006, 96, 215–227. [Google Scholar] [CrossRef]
  34. Baker, J.W.; Lee, C. An Improved Algorithm for Selecting Ground Motions to Match a Conditional Spectrum. J. Earthq. Eng. 2018, 22, 708–723. [Google Scholar] [CrossRef]
  35. Baker, J.W.; Jayaram, N. Correlation of Spectral Acceleration Values from NGA Ground Motion Models. Earthq. Spectra 2008, 24, 299–317. [Google Scholar] [CrossRef]
  36. Baker, J.W. Conditional Mean Spectrum: Tool for ground motion selection. J. Struct. Eng. 2011, 137, 322–331. [Google Scholar] [CrossRef]
  37. NGA-West2 Database. Available online: https://ngawest2.berkeley.edu (accessed on 23 December 2024).
  38. Merino Vela, R.J.; Brunesi, E.; Nascimbene, R. Derivation of floor acceleration spectra for an industrial liquid tank supporting structure with braced frame systems. Eng. Struct. 2018, 171, 105–122. [Google Scholar] [CrossRef]
  39. Ibrahim, A.; El-Araby, I.; Saleh, A.; Shaaban, M. Comparison between the Egyptian and international codes based on seismic response of mid- to high-rise moment resisting framed buildings. Struct. Eng. Mech. 2023, 87, 347–361. [Google Scholar]
  40. Assi, R.; Mazloom, S.; Abouda, A. Effect of nonlinearity on seismic response of nonstructural components in a code-conforming RC shear wall building. Can. J. Civ. Eng. 2024, 52, 89–104. [Google Scholar] [CrossRef]
Figure 1. Plan view of the building (a); frame elevation in the long (b) and short (c) direction of the building.
Designs 09 00034 g001aDesigns 09 00034 g001b
Figure 2. Schematic representation of the case building with isolator system at the base.
Designs 09 00034 g002
Figure 3. Flowchart of the iterative procedure implemented for the evaluation of the American requirements for seismic isolation design.
Designs 09 00034 g003
Figure 4. Graphical representation of the variation in friction coefficient with the vertical load.
Designs 09 00034 g004
Figure 5. Comparative analysis of the two design codes: (a,c,e) are related to LRBs, and (b,d,f) are related to CSSs; (ad) represent the comparison in terms of IDR while (e,f) refer to story shear force.
Designs 09 00034 g005
Figure 6. The conditional spectrum is associated with the rupture parameters, while the response spectra are derived from NGA-West2 ground motions selected to match this target spectrum.
Designs 09 00034 g006
Figure 7. Statistically simulated spectra generated using Monte Carlo simulation, which probabilistically produces multiple response spectra based on a distribution parameterized by the target means and variances of the CMS.
Designs 09 00034 g007
Table 1. LRB product: main properties and geometrical dimension characteristics.
Outer Diameter ( D 0 ) [mm]800
Effective plan area ( A r ) [mm2]491,345
Total rubber thickness ( H ) [mm]2
Compressive stiffness ( K v ) [kN/mm]2960
Lead plug diameter ( D i ) [mm]120
Lead area ( A p ) [mm2]11,309
Rubber code G0.4 with shear modulus ( G ) [N/mm2]0.385
Nominal long-term column load [kN]5180
Initial stiffness ( K 1 ) [kN/mm]11.7
Post-yield stiffness ( K 2 ) [kN/mm]0.9
Characteristic strength ( Q ) [kN]90.1
Shear stiffness of laminated rubber ( K r ) [N/mm]945.8
Additional shear stiffness by lead plug ( K p ) [N/mm]32.97
Table 2. Lateral seismic force, V s , distributed across the height of the structure above the base level.
Level w i [kN] h [m] w i h k F i [kN]
63522.08437665.811598.77
54868.213310,595.66827.62
44868.213310,595.66827.62
34868.213310,595.66827.62
24868.213310,595.66827.62
15067.159515,833.311236.72
28062.092065,881.745145.95
Table 3. Interstory drift ratio (IDR) based on elastic analysis of fixed-base structure under design seismic force multiplied by R .
Level h [m] F [kN] D x [mm] D y [mm]IDRxIDRy
63598.852.59186.080.11%0.21%
53827.649.23179.910.18%0.39%
43827.643.84168.360.22%0.43%
33827.637.19155.510.28%0.54%
23827.628.92139.270.33%0.69%
151236.718.99118.520.38%2.37%
Table 4. Lateral seismic force, f s , distributed across the height of the structure above the base level.
Level w i [kN] h [m] F i [kN]
63522.0843661.17
54868.2133913.87
44868.2133913.87
34868.2133913.87
24868.2133913.87
15067.1595951.22
28,062.09205267.8
Table 5. IDR based on elastic analysis of fixed-base structure under design seismic force multiplied by q .
Level h [m] F [kN] D x [mm] D y [mm]IDRxIDRy
63598.852.59186.080.11%0.21%
53827.649.23179.910.18%0.39%
43827.643.84168.360.22%0.43%
33827.637.19155.510.28%0.54%
23827.628.92139.270.33%0.69%
151236.718.99118.520.38%2.37%
Table 6. Friction pendulum product: main properties and geometrical dimension characteristics.
Diameter ( D ) [mm]650
Height ( H ) [mm]126
Maximum vertical load at ULS load combinations ( N E d ) [kN]4000
Total displacement [mm]500
Friction coefficient ( μ ) [%]4.87
Initial stiffness ( K 1 ) [kN/mm]689.42
Post-yield stiffness ( K 2 ) [kN/mm]0.817
Characteristic strength ( F 0   or   Q ) [kN]87.56
Table 7. Lateral seismic force, V s , distributed across the height of the structure above the base level.
Level w i [kN] h [m] w i h k F i [kN]
63522.08437945.66562.79
54868.213310,982.5777.89
44868.213310,982.5777.89
34868.213310,982.5777.89
24868.213310,982.5777.89
15067.159516,687.21181.96
28062.092068,562.74856.3
Table 8. IDR based on elastic analysis of fixed-base structure under design seismic force multiplied by R .
Level h [m] F [kN] D x [mm] D y [mm]IDRxIDRy
63598.852.59186.080.11%0.21%
53827.649.23179.910.18%0.39%
43827.643.84168.360.22%0.43%
33827.637.19155.510.28%0.54%
23827.628.92139.270.33%0.69%
151236.718.99118.520.38%2.37%
Table 9. Lateral seismic force, f s , distributed across the height of the structure above the base level.
Level w i [kN] h [m] F i [kN]
63522.0843591.32
54868.2133817.33
44868.2133817.33
34868.2133817.33
24868.2133817.33
15067.1595850.73
28,062.09204711.3
Table 10. IDR based on elastic analysis of fixed-base structure under design seismic force multiplied by q .
Level h [m] F [kN] D x [mm] D y [mm]IDRxIDRy
63598.852.59186.080.11%0.21%
53827.649.23179.910.18%0.39%
43827.643.84168.360.22%0.43%
33827.637.19155.510.28%0.54%
23827.628.92139.270.33%0.69%
151236.718.99118.520.38%2.37%
Table 11. Final set of selected ground motions.
IDSequence NumberEarthquake Scale
Factor
YearStation Name M Mechanism
11204Chi-Chi_ Taiwan3.061999CHY0397.62Reverse Oblique
21227Chi-Chi_ Taiwan2.911999CHY0747.62Reverse Oblique
31238Chi-Chi_ Taiwan2.321999CHY0927.62Reverse Oblique
41504Chi-Chi_ Taiwan1.181999TCU0677.62Reverse Oblique
51533Chi-Chi_ Taiwan1.621999TCU1067.62Reverse Oblique
61534Chi-Chi_ Taiwan1.341999TCU1077.62Reverse Oblique
71536Chi-Chi_ Taiwan0.921999TCU1107.62Reverse Oblique
81538Chi-Chi_ Taiwan2.121999TCU1127.62Reverse Oblique
91540Chi-Chi_ Taiwan1.821999TCU1157.62Reverse Oblique
101542Chi-Chi_ Taiwan1.641999TCU1177.62Reverse Oblique
111547Chi-Chi_ Taiwan1.621999TCU1237.62Reverse Oblique
121550Chi-Chi_ Taiwan2.651999TCU1367.62Reverse Oblique
131552Chi-Chi_ Taiwan2.741999TCU1407.62Reverse Oblique
142459Chi-Chi_ Taiwan-033.631999CHY0266.2Reverse
153843Chi-Chi_ Taiwan-032.851999CHY0026.2Reverse
164483L’Aquila_ Italy3.332009L’Aquila—Parking6.3Normal
174875Chuetsu-oki_ Japan0.342007Kariwa6.8Reverse
185810Iwate_ Japan1.992008Machimukai Town6.9Reverse
196889Darfield_ New Zealand0.962010Christchurch Hospital7Strike slip
206969Darfield_ New Zealand1.962010Styx Mill Transfer Station7Strike slip
Table 12. Results of NTHA displacement and base shear force for each isolator type.
QuantityLRBCSS
NTHA-XNTHA-YNTHA-XNTHA-Y
Max displacement at the center of rigidity of the isolation system [mm]310.7298.0142.9157.3
Base shear [kN]7087.75432.76329.55717.1
α 0.1970.150.1760.16
Table 13. Results of NTHA story shear forces [kN] for each isolator type.
LevelLRBCSS
NTHA-XNTHA-YNTHA-XNTHA-Y
61037.0864.21027.3928.1
51293.7990.41191.81056.8
41199.5877.31080.2903.9
31127.8863.01030.5893.6
21159.6888.1991.7930.3
11270.1949.71008.01004.4
7087.75432.76329.55717.1
Table 14. Results of NTHA interstory drift ratio for each isolator type.
StoryLRBCSS
NTHA-XNTHA-YNTHA-XNTHA-Y
60.10%0.15%0.10%0.17%
50.15%0.26%0.15%0.29%
40.18%0.26%0.16%0.28%
30.21%0.31%0.19%0.32%
20.25%0.36%0.21%0.36%
10.43%1.76%0.31%1.54%
Table 15. LRB: comparison between ASCE7-22, EC8, and NTHA.
QuantityDirection NTHAASCE7-22EC8
NTHA-XNTHA-Y x y x y
D M / d d c [mm] 1310.7298.0471.652%58%338.89%14%
V s  27087.75432.710,291.945%89%7901.811%45%
α  30.1970.150.2945%89%0.2211%45%
1 Ratio between the maximum displacement at the center of rigidity of the isolation system in the direction under consideration and the design displacement. 2 The total unreduced lateral seismic design force above the base level. 3 Base shear coefficient.
Table 16. CSS: comparison between ASCE7-22, EC8, and NTHA.
QuantityDirection NTHAASCE7-22EC8
NTHA-XNTHA-Y x y x y
D M / d d c [mm]142.9157.3487.7241%210%325.7128%107%
V s [kN]6329.55717.19712.653%70%7067.012%24%
α 0.1760.160.2753%70%0.19712%24%
Table 17. LRB: story shear forces.
LevelNTHA [kN]ASCE7-22 [kN]EC8 [kN]
NTHA-XNTHA-Y x y x y
61037.0864.21197.515%39%991.8−4%15%
51293.7990.41655.228%67%1370.86%38%
41199.5877.31655.238%89%1370.814%56%
31127.8863.01655.247%92%1370.822%59%
21159.6888.11655.243%86%1370.818%54%
11270.1949.72473.495%160%1426.812%50%
7087.75432.710,291.9 7901.8
Table 18. CSS: story shear forces.
LevelNTHA [kN]ASCE7-22 [kN]EC8 [kN]
NTHA-XNTHA-Y x y x y
61027.3928.11125.610%21%887.0−14%−4%
51191.81056.81555.831%47%1226.03%16%
41080.2903.91555.844%72%1226.013%36%
31030.5893.61555.851%74%1226.019%37%
2991.7930.31555.857%67%1226.024%32%
11008.01004.42363.9135%135%1276.127%27%
6329.55717.19712.6 7067.04
Table 19. LRB: interstory drift ratio.
LevelNTHAASCE7-22EC8
NTHA-XNTHA-Y X x Y y X x Y y
60.10%0.15%0.11%15%0.21%39%0.09%−5%0.17%15%
50.15%0.26%0.18%20%0.38%47%0.15%0%0.32%22%
40.18%0.26%0.22%26%0.43%63%0.18%4%0.35%35%
30.21%0.31%0.28%30%0.54%74%0.23%7%0.45%44%
20.25%0.36%0.33%31%0.67%87%0.27%6%0.55%52%
10.43%1.76%0.38%−11%1.73%−2%0.30%−31%1.33%−24%
Table 20. CSS: interstory drift ratio.
LevelNTHAASCE7-22EC8
NTHA-XNTHA-Y X x Y y X x Y y
60.10%0.17%0.11%6%0.19%15%0.08%−17%0.15%−9%
50.15%0.29%0.17%15%0.36%24%0.13%−9%0.28%−2%
40.16%0.28%0.21%27%0.40%43%0.16%−1%0.32%12%
30.19%0.32%0.26%37%0.51%59%0.20%7%0.40%25%
20.21%0.36%0.31%45%0.64%78%0.24%11%0.49%37%
10.31%1.54%0.36%14%1.63%6%0.26%−15%1.19%−22%
Disclaimer/Publisher’s Note: The statements, opinions and data contained in all publications are solely those of the individual author(s) and contributor(s) and not of MDPI and/or the editor(s). MDPI and/or the editor(s) disclaim responsibility for any injury to people or property resulting from any ideas, methods, instructions or products referred to in the content.

