Article

LSTM Networks for Home Energy Efficiency

by
Zurisaddai Severiche-Maury
1,
Wilson Arrubla-Hoyos
2,
Raul Ramirez-Velarde
3,
Dora Cama-Pinto
4,5,*,
Juan Antonio Holgado-Terriza
6,
Miguel Damas-Hermoso
5 and
Alejandro Cama-Pinto
7,*
1
Department of Electronic Engineering, Universidad de Sucre, Sincelejo 700001, Colombia
2
Faculty of Engineering, National Open and Distance University, Sincelejo 700002, Colombia
3
School of Engineering and Sciences, Monterrey Institute of Technology and Higher Education, Monterrey 64849, Mexico
4
Faculty of Industrial Engineering, Universidad Nacional Mayor de San Marcos, Lima 15081, Peru
5
Department of Computer Engineering, Automatics and Robotics, University of Granada, 18071 Granada, Spain
6
Software Engineering Department, University of Granada, 18071 Granada, Spain
7
Faculty of Engineering, Universidad de la Costa, Calle 58 # 55-66, Barranquilla 080002, Colombia
*
Authors to whom correspondence should be addressed.
Designs 2024, 8(4), 78; https://doi.org/10.3390/designs8040078
Submission received: 29 June 2024 / Revised: 3 August 2024 / Accepted: 5 August 2024 / Published: 9 August 2024
(This article belongs to the Special Issue Smart Home Design, 2nd Edition)

Abstract

:
This study aims to develop and evaluate an LSTM neural network for predicting household energy consumption. To conduct the experiment, a testbed was created consisting of five common appliances, namely, a TV, air conditioner, fan, computer, and lamp, each connected to individual smart meters within a Home Energy Management System (HEMS). Additionally, a meter was installed on the distribution board to measure total consumption. Real-time data were collected at 15-min intervals for 30 days in a residence that represented urban energy consumption in Sincelejo, Sucre, inhabited by four people. This setup enabled the capture of detailed and specific energy consumption data, facilitating data analysis and validating the system before large-scale implementation. Using the detailed power consumption information of these devices, an LSTM model was trained to identify temporal connections in power usage. Proper data preparation, including normalisation and feature selection, was essential for the success of the model. The results showed that the LSTM model was effective in predicting energy consumption, achieving a mean squared error (MSE) of 0.0169. This study emphasises the importance of continued research on preferred predictive models and identifies areas for future research, such as the integration of additional contextual data and the development of practical applications for residential energy management. Additionally, it demonstrates the potential of LSTM models in smart-home energy management and serves as a solid foundation for future research in this field.

1. Introduction

The International Energy Agency (EIA) and Colombia’s Mining and Energy Planning Unit (UPME) have projected increases in energy consumption both nationally and internationally [1,2]. This growing demand for electricity poses significant environmental challenges, especially in terms of CO2 emissions and sustainability. Construction, as a leading global sector, has had a considerable impact on these challenges. This industry is in the midst of a significant digital transformation, integrating advanced technologies that facilitate energy optimisation [3]. Over the years, global efforts have been implemented to address these issues, from the creation of the International Energy Agency in 1974 to the adoption of the Kyoto Protocol in 1997 and the Paris Agreement in 2015 [4,5]. Globally, the building sector consumes about 36% of final energy and contributes 39% of CO2 emissions. The building stock is expected to grow by 60% by 2050 [6]. With the growing concern for sustainable buildings, it is essential to incorporate new systems and strategies in the early design phase of building projects. Building information modelling (BIM) and sustainability protocols have common goals: quality, efficiency, and sustainability [7]. In addition, smart building construction couples sustainability with efficiency, integrating artificial intelligence and IoT technologies to optimise operations and performance [8]. In this context, smart microgrids have emerged as a solution to integrate advanced digital management technologies to optimise energy production, distribution, and consumption. The integration of these sustainable buildings offers a solution that helps reduce dependence on fossil fuels and minimises environmental impacts. These microgrids, managed by Energy Management Systems (EMS), enable efficient energy production, distribution, and consumption. In addition, they optimise the use of renewable energy sources, implement demand response, and reduce costs and carbon emissions [9,10,11,12,13,14]. In recent years, the application of artificial intelligence (AI) techniques to optimise energy consumption through an EMS has become a promising approach [15]. AI, which is fundamental in energy management, is applied in various areas, such as demand forecasting and energy use optimisation [16,17,18,19]. This technology has great potential to improve EMS efficiency by optimising energy consumption and reducing peak demand [15,17]. AI, through consumption pattern analysis and system coordination, is positioned as a key tool to promote energy efficiency in multiple contexts, offering significant improvements in energy management [16,18].
In the domestic context, home energy management systems (HEMS) use AI technologies to reduce energy consumption and improve performance, making them an effective solution to increase energy efficiency in homes [20].
The development of accurate predictive models for estimating household energy consumption has become an area of growing interest, as efficient energy use is critical for both reducing costs and mitigating the environmental impact associated with energy consumption. Integrating AI techniques in energy management proposes a dynamic and personalised approach that is capable of adapting and responding to individual needs and consumption habits using advanced tools to analyse complex data and make optimal decisions in an automated manner [21,22,23].
In this paper, a deep learning-based approach, specifically using LSTM neural networks, is presented to predict power consumption in a domestic environment. Long Short-Term Memory (LSTM) networks are preferred in HEMS because of their ability to model complex temporal dependencies and maintain long-term memory efficiently. This specialised network (RNN) architecture is ideal for problems in which data are structured in time series, such as home energy consumption prediction, as it can handle long sequences of data and capture long-term dependencies in the information. Its architectural flexibility allows it to adapt to the specific characteristics of the problem at hand, which is ideal in applications such as HEMS, where past actions significantly affect future power management decisions. Furthermore, according to a review conducted in [24], several authors agree that LSTM outperforms the other short-term forecasting methods. The proposed model uses power data collected from several common household electrical devices, such as fans, computers, air conditioners, lamps, and TVs. Through the application of artificial intelligence techniques, the aim was to build a system capable of providing accurate and reliable predictions of energy consumption.
The overall objective of this study is to develop and evaluate an LSTM neural network model for predicting home energy consumption, with a focus on energy efficiency and smart management. To achieve this goal, the following specific objectives are proposed: first, to train an LSTM model using power data from various home-use devices to capture temporal relationships in energy consumption; second, to perform careful data preparation, including normalisation and selection of relevant features, to ensure the success of the model; and finally, to evaluate the performance of the LSTM model in predicting energy consumption and highlight its effectiveness using metrics such as Mean Squared Error (MSE). These objectives guide the development of this study and its contribution to smart home energy management, providing a solid foundation for future research in this field. The remainder of this paper is organised as follows: Section 2 explains the basic concepts; Section 3 shows the related task; Section 4 discusses the methodology; Section 5 presents the results; Section 6 suggests conclusions; and Section 7 suggests future work.

2. Basic Concepts

2.1. Home Energy Management Systems (HEMS)

HEMS are technology platforms designed to monitor, control, and optimise energy consumption in homes in a smart and efficient manner. By integrating metering devices, sensors, and management software, HEMS allows users to monitor and control the energy use of devices and systems within the home, such as heating, lighting, and appliances, with the goal of reducing costs, minimising environmental impacts, and improving home comfort. By providing detailed information and control tools, HEMS enables users to make informed decisions and adopt sustainable consumption habits [25]. Figure 1 shows an example of the functional structure of a HEMS system; this figure is based on the one developed by [26] and shows the structure of a HEMS with the five devices of the test bench. Each device is connected to an individual smart meter, which measures and controls the consumption of each device; in turn, these are connected to a meter in the distribution box that measures the total consumption of the five devices. The consumption data is sent to the AI module along with renewable energy availability, current energy tariff, and user preferences to predict and then control the consumption of each of the five devices. The yellow arrows indicate the data that enters the AI module to make predictions, the yellow arrows indicate the data used to make control decisions, and the red arrows indicate the orders that leave the AI module to be executed.

2.2. Deep Learning (DL)

Artificial intelligence (AI) is a broad field that includes various techniques for machines to perform tasks that normally require human intelligence. Deep learning is a subarea of machine learning (ML), which in turn is a branch of AI. Deep learning is a machine-learning technique that relies on artificial neural networks with multiple layers (depth) to learn data representations in a hierarchical manner. DL uses a cascade of layers of nonlinear computational modules, in which the input of each subsequent layer is based on the output of the previous layer to identify and convert attributes [27,28,29]. It uses optimisation algorithms to adjust the parameters of these networks so that they can automatically learn to perform specific tasks, such as classification and pattern recognition [30].

2.3. LSTM (Long Short-Term Memory)

LSTM (Long Short-Term Memory) is a type of neural network used in the field of deep learning to model data sequences and learn long-term dependencies. LSTMs are designed for the use of memory units that can retain information for extended periods of time. These memory units contain input, output, and forgetting gates that control the flow of information within the network, allowing them to learn and remember complex patterns in the data sequences. This enables them to store data for longer periods and make more accurate predictions [31]. LSTMs are commonly used in natural language processing, machine translation, text generation, time-series analysis, and other applications where sequence modelling is critical.

3. Related Tasks

In the context of energy consumption, optimisation is presented as a fundamental pillar in the search for efficient solutions to problems involving high energy consumption. As pointed out in [32], the central objective is to determine the best possible solution. In this sense, AI is positioned as a fundamental component in which the creation of specific algorithms using specific programming languages is essential. Considering these premises, it is useful to explore AI algorithms used in the analysis of data from smart grids as well as in the optimisation of decision-making processes in the energy context. This analysis will allow for a better understanding of how AI can contribute to improving efficiency and management in this area.
Research on the use of AI algorithms in the energy sector is extensive and diverse. Ref. [33] highlighted the effectiveness of various algorithms, including machine-learning methods, metaheuristic algorithms, and deep-learning algorithms. Ref. [34] discussed the application of optimisation techniques to microgrids, highlighting the need for more accurate algorithms. Ref. [35] explores the use of AI to improve energy efficiency in South Africa, highlighting ANN and SVM and suggesting a DRL for home energy management. Ref. [36] reviewed energy consumption prediction models, focusing on machine and deep learning algorithms, proposing a combination of algorithms, and further research on environmental and building factors. Ref. [37] explores the application of AI in energy system scheduling, highlighting the relevance of algorithms such as differential evolution and artificial neural networks to improve the efficiency and reliability of energy systems. Table 1 summarises the authors and the algorithms used in each study.
The articles discussed in Table 1 examine the use of AI algorithms in energy management, including supervised and deep machine-learning techniques. They concluded that AI improves the efficiency of energy management and highlighted the need for more accurate forecasting models and hybrid techniques to address challenges in this field. Overall, they highlight the critical role of AI in optimising energy management. Table 2 summarises the works of several authors in the field of HEMS. These researchers explored different approaches, from the use of artificial intelligence to optimisation algorithms, with the goal of improving energy efficiency and providing innovative solutions for managing household energy consumption. Table 2 provides an overview of each author’s contributions and their respective works in this emerging field.
In the analysis of the reviewed articles, the prominent use of deep neural networks, particularly recurrent networks, to address the prediction of energy consumption in the home stands out. Authors such as [39,43] employed artificial neural networks with backpropagation to predict and regulate the use of electrical equipment based on environmental and behavioural data. In addition, ref. [38] explored the potential of deep reinforcement learning (DRL) techniques to further optimise HEMS by learning from user behaviour and energy consumption patterns. This trend towards the use of deep recurrent neural networks underscores their effectiveness in predicting and managing energy consumption in residential environments, pointing to a key research area for future work in the field of artificial intelligence applied to home energy management; the use of LSTM networks for consumption prediction is highlighted by the good results they yield. Ref. [46] proposed an intelligent microgrid architecture for HEMS using LSTM networks to improve forecasting accuracy and optimise energy consumption. On the other hand, ref. [21] addressed the analysis and prediction of energy consumption in residential and commercial buildings using deep-learning models, specifically LSTM and GRU networks. They highlighted the ability of these models to generate stable energy demand patterns and improve energy efficiency. In addition, ref. [47] focused on the development of LSTM-based forecasting models for HEMS, highlighting the ability of these models to improve forecasting accuracy and generate stable energy demand patterns. Finally, refs. [48,49] proposed energy dispatch strategies for microgrids using predictive algorithms based on LSTM neural networks and mixed integer optimisation, achieving superior integration of renewable energy sources and more efficient energy management. These models have demonstrated the ability to capture and analyse complex patterns in energy consumption data, enabling more accurate predictions and more efficient management of available energy resources. In addition to providing greater forecasting accuracy, the use of LSTM networks in HEMS has enabled a more effective optimisation of energy consumption, ensuring an optimal balance between user comfort and energy efficiency. Table 3 shows a comparison of the advantages and disadvantages of LSTM versus other algorithms.
Although the LSTM model is essential for capturing temporal relationships in energy consumption data, it is not the only model that can be used for this task. Other deep learning models, such as standard recurrent neural networks (RNN), convolutional neural networks (CNN), and attention models (Transformers), can also be applied to predict household energy consumption; however, according to the literature review, the LSTM model is considered superior for predicting energy consumption in HEMS due to its ability to capture long-term and complex dependencies in the time series. Unlike traditional models such as ARIMA and SARIMA, which are effective for stationary and clearly patterned data but less efficient in handling nonlinear dependencies and abrupt changes, LSTM can learn and retain long-term patterns due to its specialised memory architecture. Although GRU models also provide good results and are faster to train, LSTM has demonstrated higher accuracy in predicting complex time series due to its more robust design. LSTM’s ability to handle long and complex sequences makes it the preferred choice for HEMS applications. These results support the continuation of research and development in this field, as they offer a transformative perspective for sustainable energy management in homes.

4. Materials and Methods

A set of data was obtained to perform the experimentation. For this purpose, a test bench was created that included five typical household appliances: a TV, air conditioner, fan, computer, and lamp [61]. These five applications have been selected because they represent a significant part of the daily household energy consumption since they tend to be in frequent use and, therefore, have a constant consumption that is relevant for the prediction and management of energy in the home. In addition, these applications have greater availability and consistency of consumption data over time considering that accurate and continuous data collection is fundamental to training deep learning models such as LSTM. Unlike other devices, such as, washing machines, dryers, and hairdryers that may be more sporadic and less predictable in use, they are not used with the same daily frequency and may have more random usage patterns. Each of these five appliances on the test bench is connected to individual smart meters, allowing the detailed tracking of their energy consumption to form an HEMS. In addition, a meter was installed in the distribution box to measure the total consumption generated by the appliances connected to the testbed. The dataset used to feed the model was real-time data collected by HEMS. This dataset includes a detailed record of the power consumption of each appliance connected to the testbed. These data were collected at regular fifteen-minute intervals, capturing daily patterns for 30 days.
The measurement devices were strategically installed at a selected residence within the study area, as shown in Figure 1. This residence was chosen for its representativeness of typical energy consumption conditions in an urban area of the municipality of Sincelejo, in the department of Sucre, and it is inhabited by four people (three adults and one child). Figure 2 provides an accurate visualisation of the locations of these devices on a Google Map map. The arrangement of devices in a single residence allows for a detailed and specific capture of energy consumption in that household, which facilitates a thorough analysis of consumption patterns. The decision to test the Home Energy Management System (HEMS) in a single home with a test bed of five appliances is based on the need to conduct an initial pilot test in a controlled environment to evaluate the feasibility and effectiveness of the system before scaling up to a larger number of homes. This allows the minimisation of costs and resources, debugging and tuning the system, collecting specific energy consumption data, validating results, and establishing the credibility of the HEMS before its large-scale implementation, thus optimising its performance and ensuring a successful transition to future large-scale environments. The selected home was located in the centre of a residential area approximately 5 km in diameter, ensuring that the data collected reflected a representative range of consumption conditions within the community.
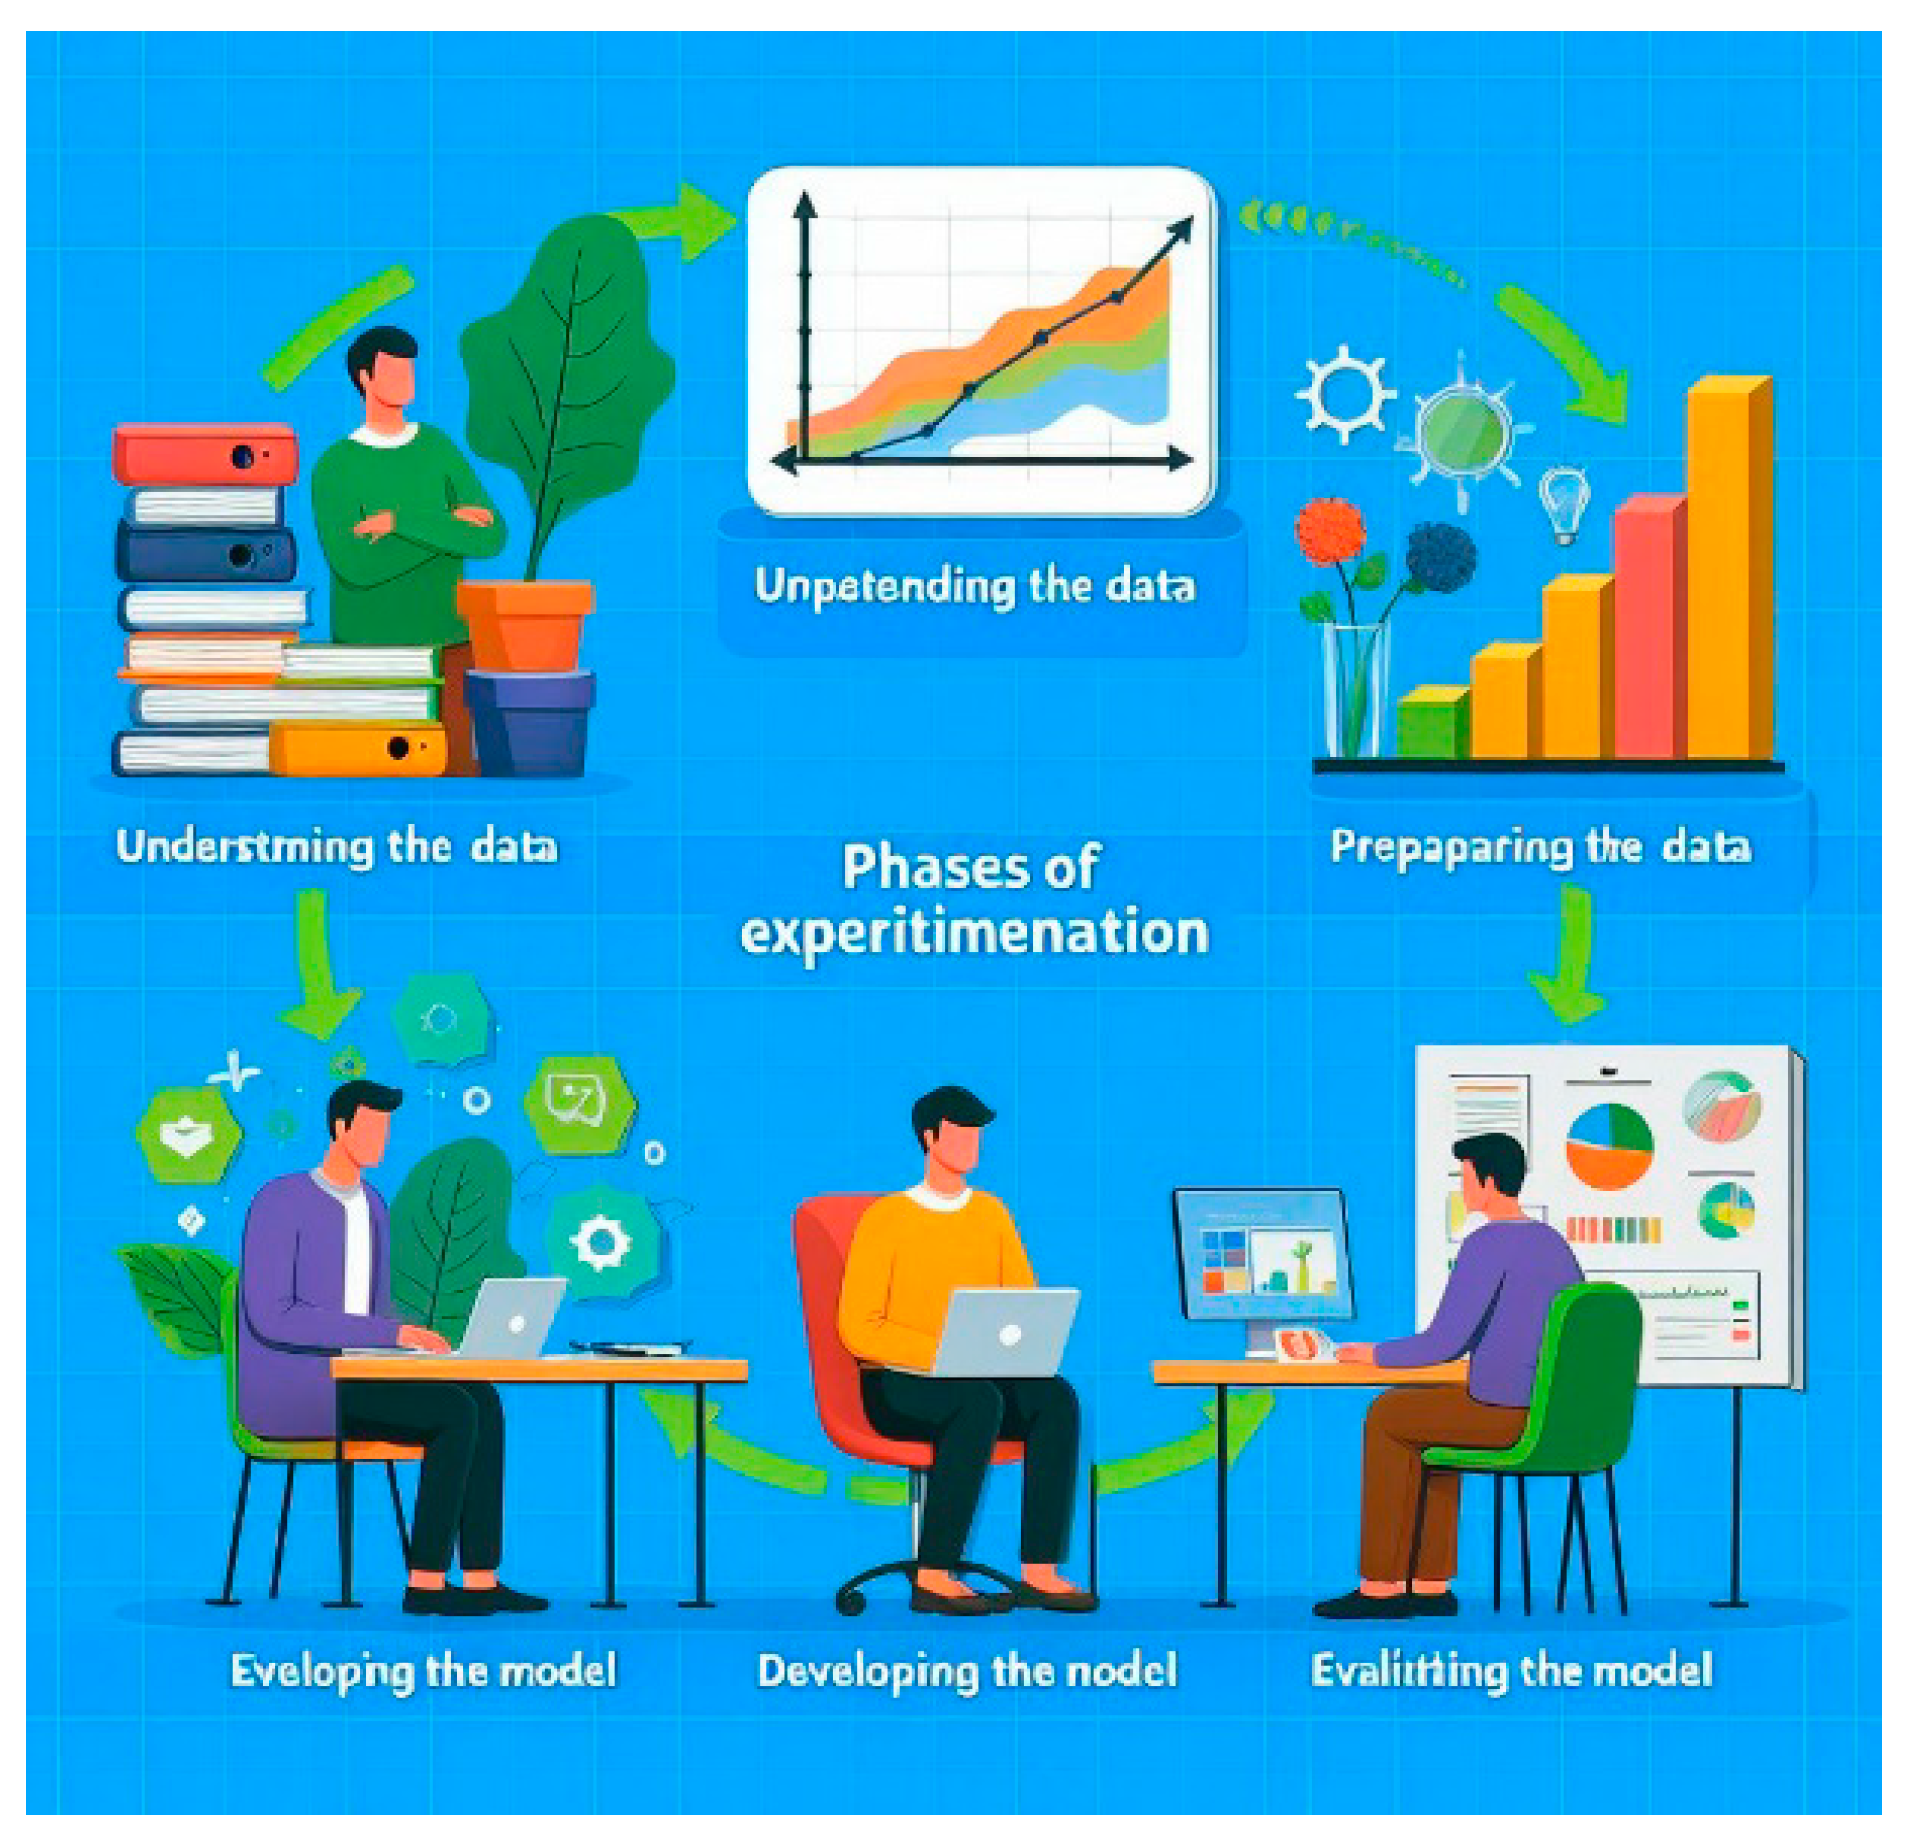
The experimental development followed the stages shown in Figure 3, which originated from the CRISP-DM approach [62], which is commonly used in data-mining projects. This process consists of five steps, the main contribution of which is the development of the model.

4.1. Understanding the Data

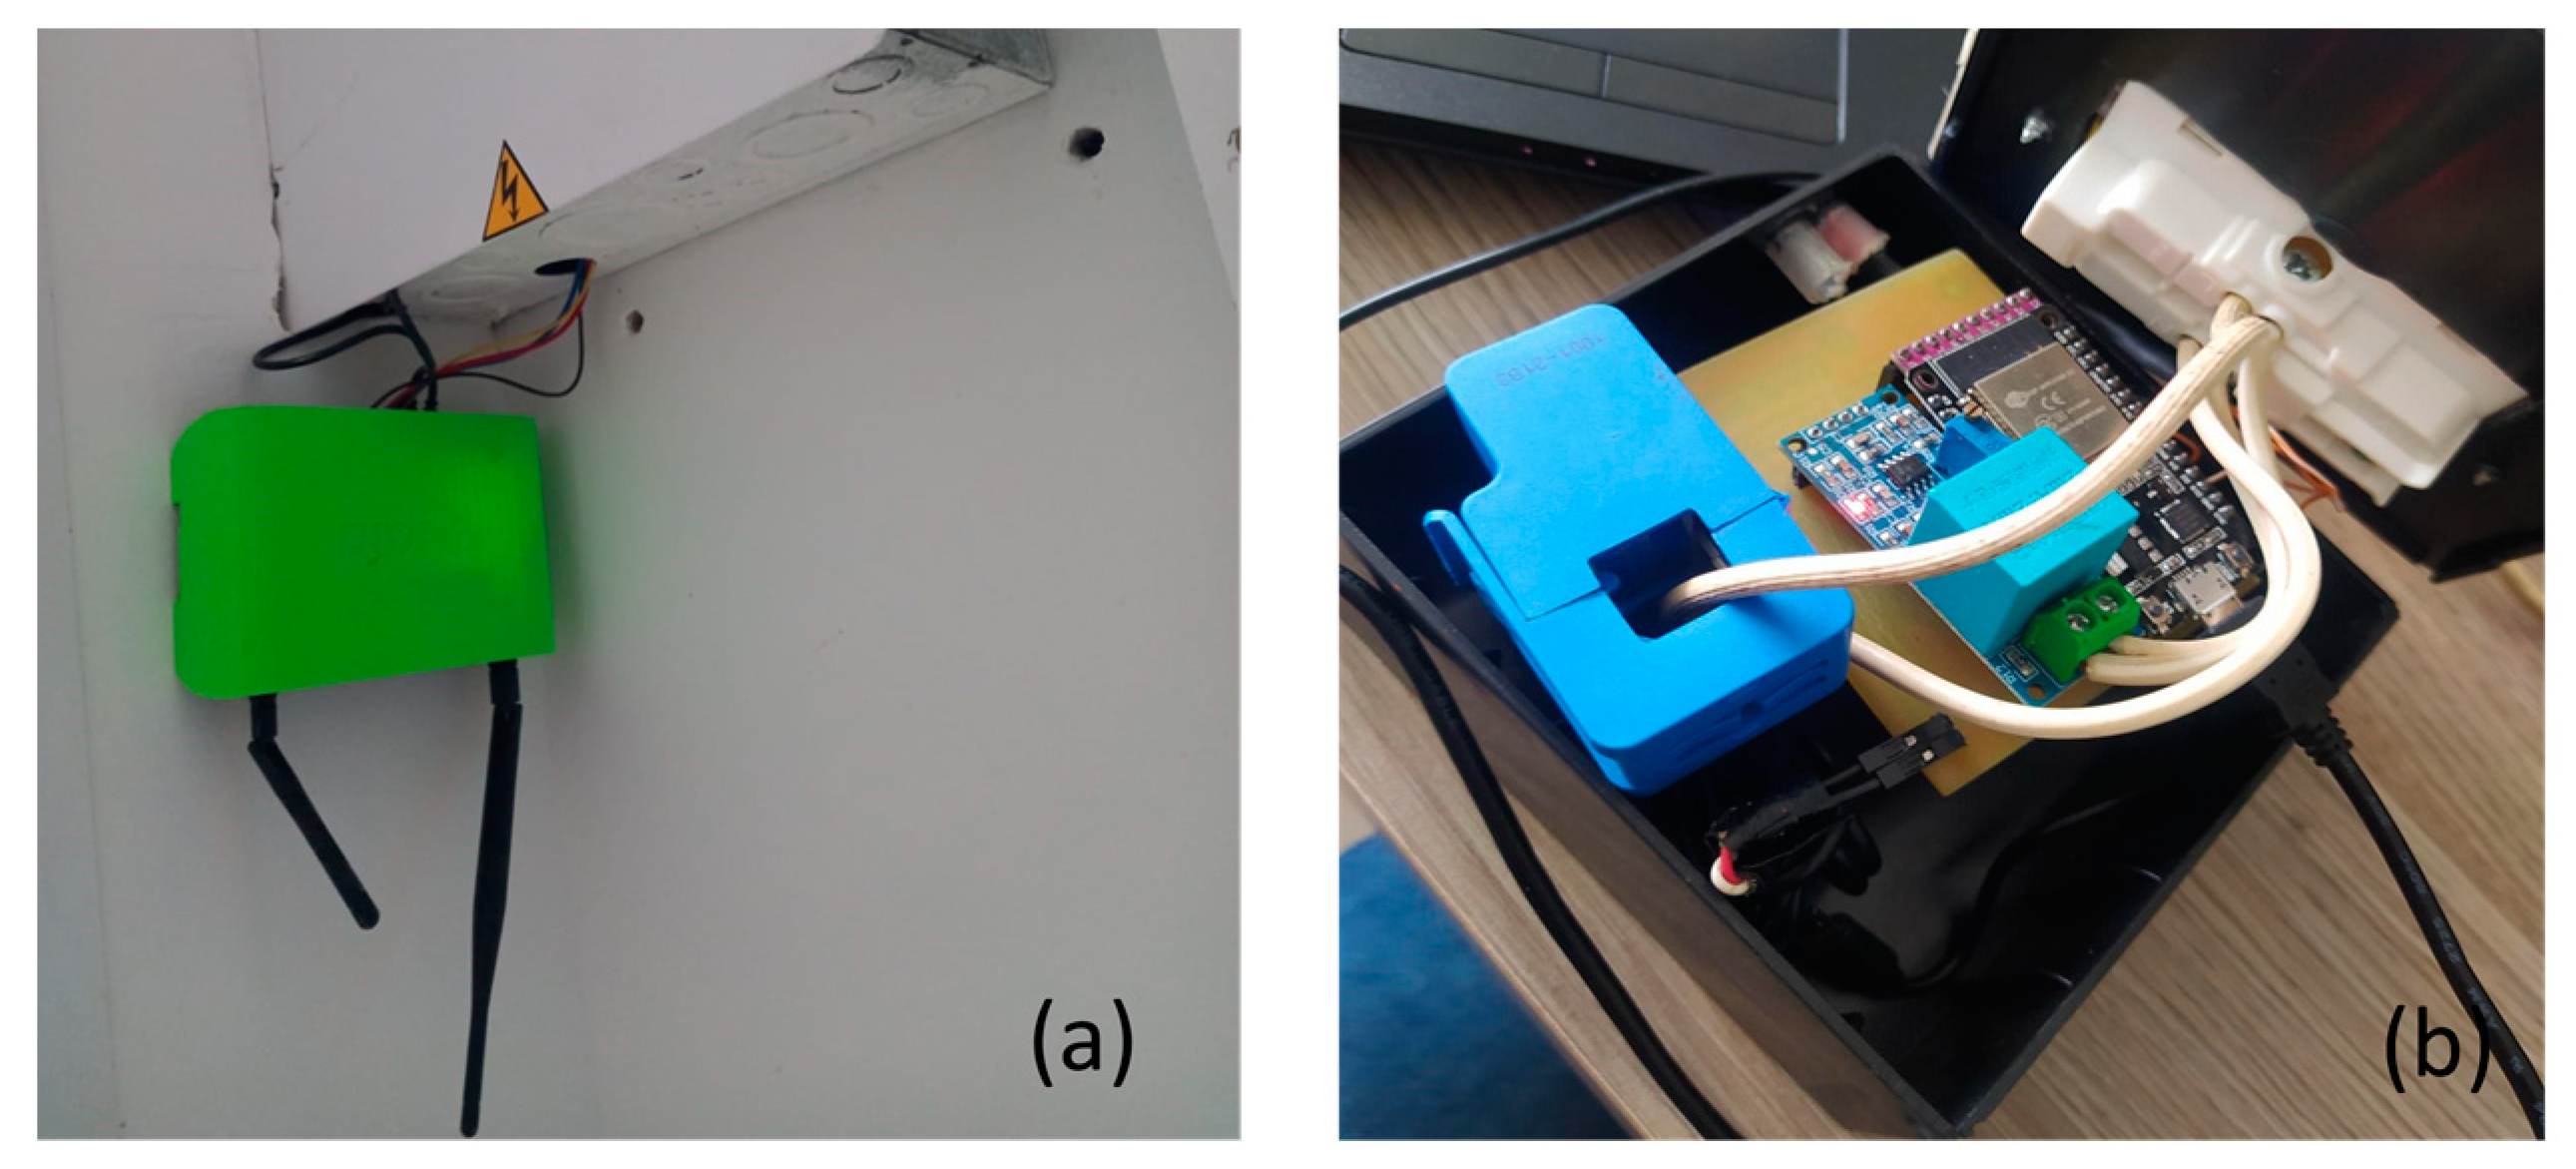
The data used to feed the model were collected through a HEMS consisting of a network of meters; one meter to measure total consumption, and five disaggregated meters; one for each device in the test bed. The structure of this meter network can be seen in Figure 1. Figure 4 shows photos of the meters used.
The dataset consists of a time series of energy consumption records from five household devices (TV, air conditioner, fan, computer, and lamp), collected over 30 days, and recorded at 15-min intervals. It is classified as a time-series database because each record is associated with a point in time and follows a chronological order, which allows the analysis and modelling of consumption patterns over time.
Additionally, this dataset comprises seven numeric variables distributed in seven columns: timestamp, which indicates the time at which the data were recorded and is in date and time format, with 15-min intervals between each record. Fan, PC, AC, Lamp, and TV represent the energy consumption of specific devices in the home, such as a fan, computer, air conditioner, lamp, and TV, respectively, and the values are expressed in fractions of the energy consumption. Table 4 lists the average daily energy consumption values for each device. The Total Power shows the total energy consumption of the household in each time interval, which corresponds to the consumption of all devices. Each row represents a record of energy consumption at a specific time, providing a time series of data that can be used for analysis and modelling in the context of HEMS, or for other purposes related to energy efficiency and home management. This dataset has a set of 2.882 data taken from 30 December 2023 to 29 January 2024.

4.2. Data Preparation

The process begins with data exploration to understand its structure and peculiarities, including the identification of outliers or null values. Table 5 presents a sample of the original data set.
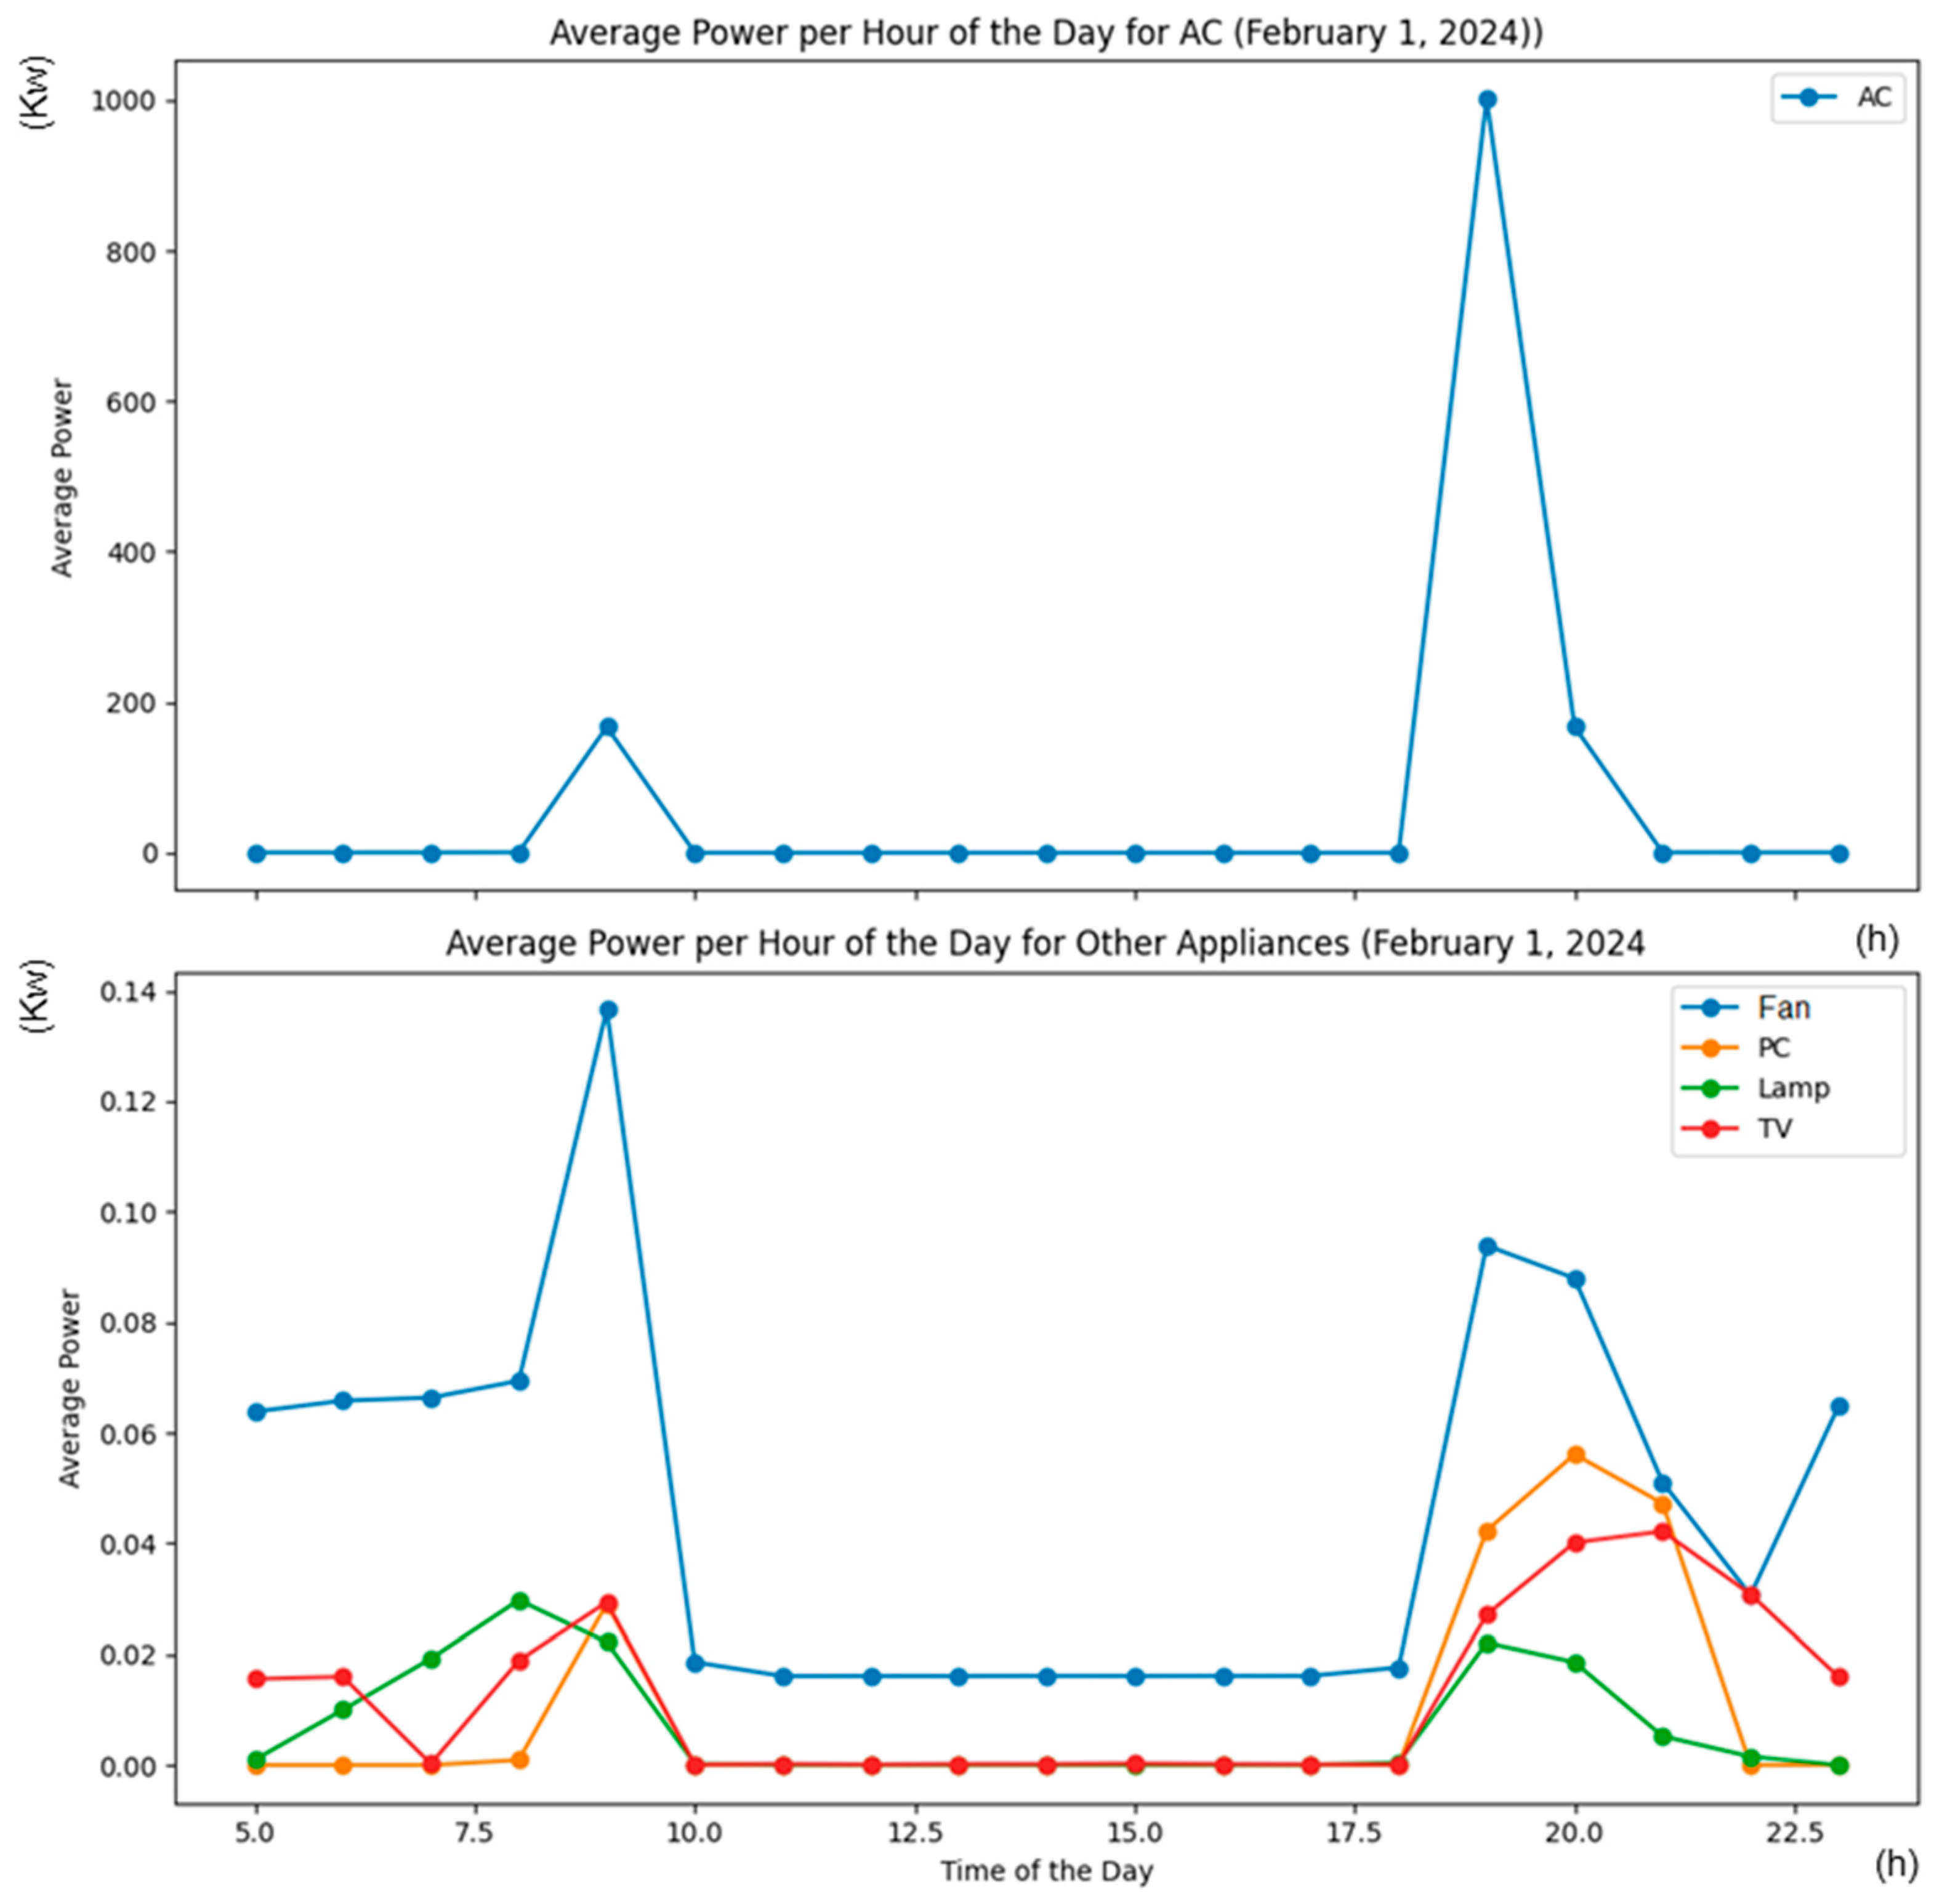
The data were then normalised using the MinMaxScaler class from the scikit-learn library, ensuring that it was within the range [0, 1]. Then, we select the relevant features that cover the power consumption of various household devices, such as fans, computers, air conditioners, lamps, televisions, and the total power consumed. Finally, the size of the time window used to generate the input and output sequences for the LSTM model was defined. The graph in Figure 5 shows the average power per device on a specific day; in this case, 1 February 2024. In the graphs, the x-axis represents the hours of the day, and the y-axis represents the average consumption in KW. The air conditioning was placed on a different y-axis because of its high consumption; when it was graphed together with the other appliances, only the air-conditioning graph could be seen.

4.3. Model Development

Machine learning methods were employed using MinMaxScaler libraries from sklearn.preprocessing, plot_model from Tensorflow. keras. utils, Sequential, LSTM, and Dense from Tensorflow. keras. models, train_test_split from sklearn. model_selectio, Matplotlib, Numpy, and Pandas in the Google Colaboratory environment using Python programming language.
Prior to model creation, the normalised data were split into training and test sets in a ratio of 70% for training and 30% for testing using the train_test_split function of the scikit-learn library. Subsequently, we defined the LSTM model using the TensorFlow and Keras libraries, structuring the model with an LSTM layer followed by a dense layer for each device in the dataset. The model was then compiled using the Adam optimiser and the mean square error (MSE) loss function. Finally, model training was performed on the training data over a specified number of epochs using a defined batch size and validation split of the training set.

4.4. Model Evaluation

We evaluated the performance of the trained model on the test set by making predictions and calculating the MSE between the predictions and actual values. In addition, the loss during training was visualised to understand the learning of the model over epochs. Finally, a scatter plot was generated that compared the actual values with the model predictions, providing a visual perspective of its performance.

4.5. Deployment

The deployment phase involved applying the trained model to new data to make predictions. This involves loading the previously trained LSTM model with the load_model function of TensorFlow and Keras, as well as importing future data, representative of the energy consumption of various household devices, from an Excel file using the Pandas library. Future data are then prepared for processing, including time format conversion, selection of relevant columns, data normalisation using a MinMax scaler, and creation of input and output sequences for the LSTM model. The loaded model was then used to make predictions on future data by applying the model’s prediction functions and reversing the normalisation of the predictions to obtain the original values. These predictions were added to the future dataset for further analysis and visualisation. Finally, the results include predictions combined with future data. This deployment stage is essential to implementing the trained model in a production environment and using it to make predictions based on real-world data.
This methodology provides a systematic approach for the development and evaluation of an LSTM model to predict energy consumption in a domestic environment.

4.6. LSTM Model Architecture

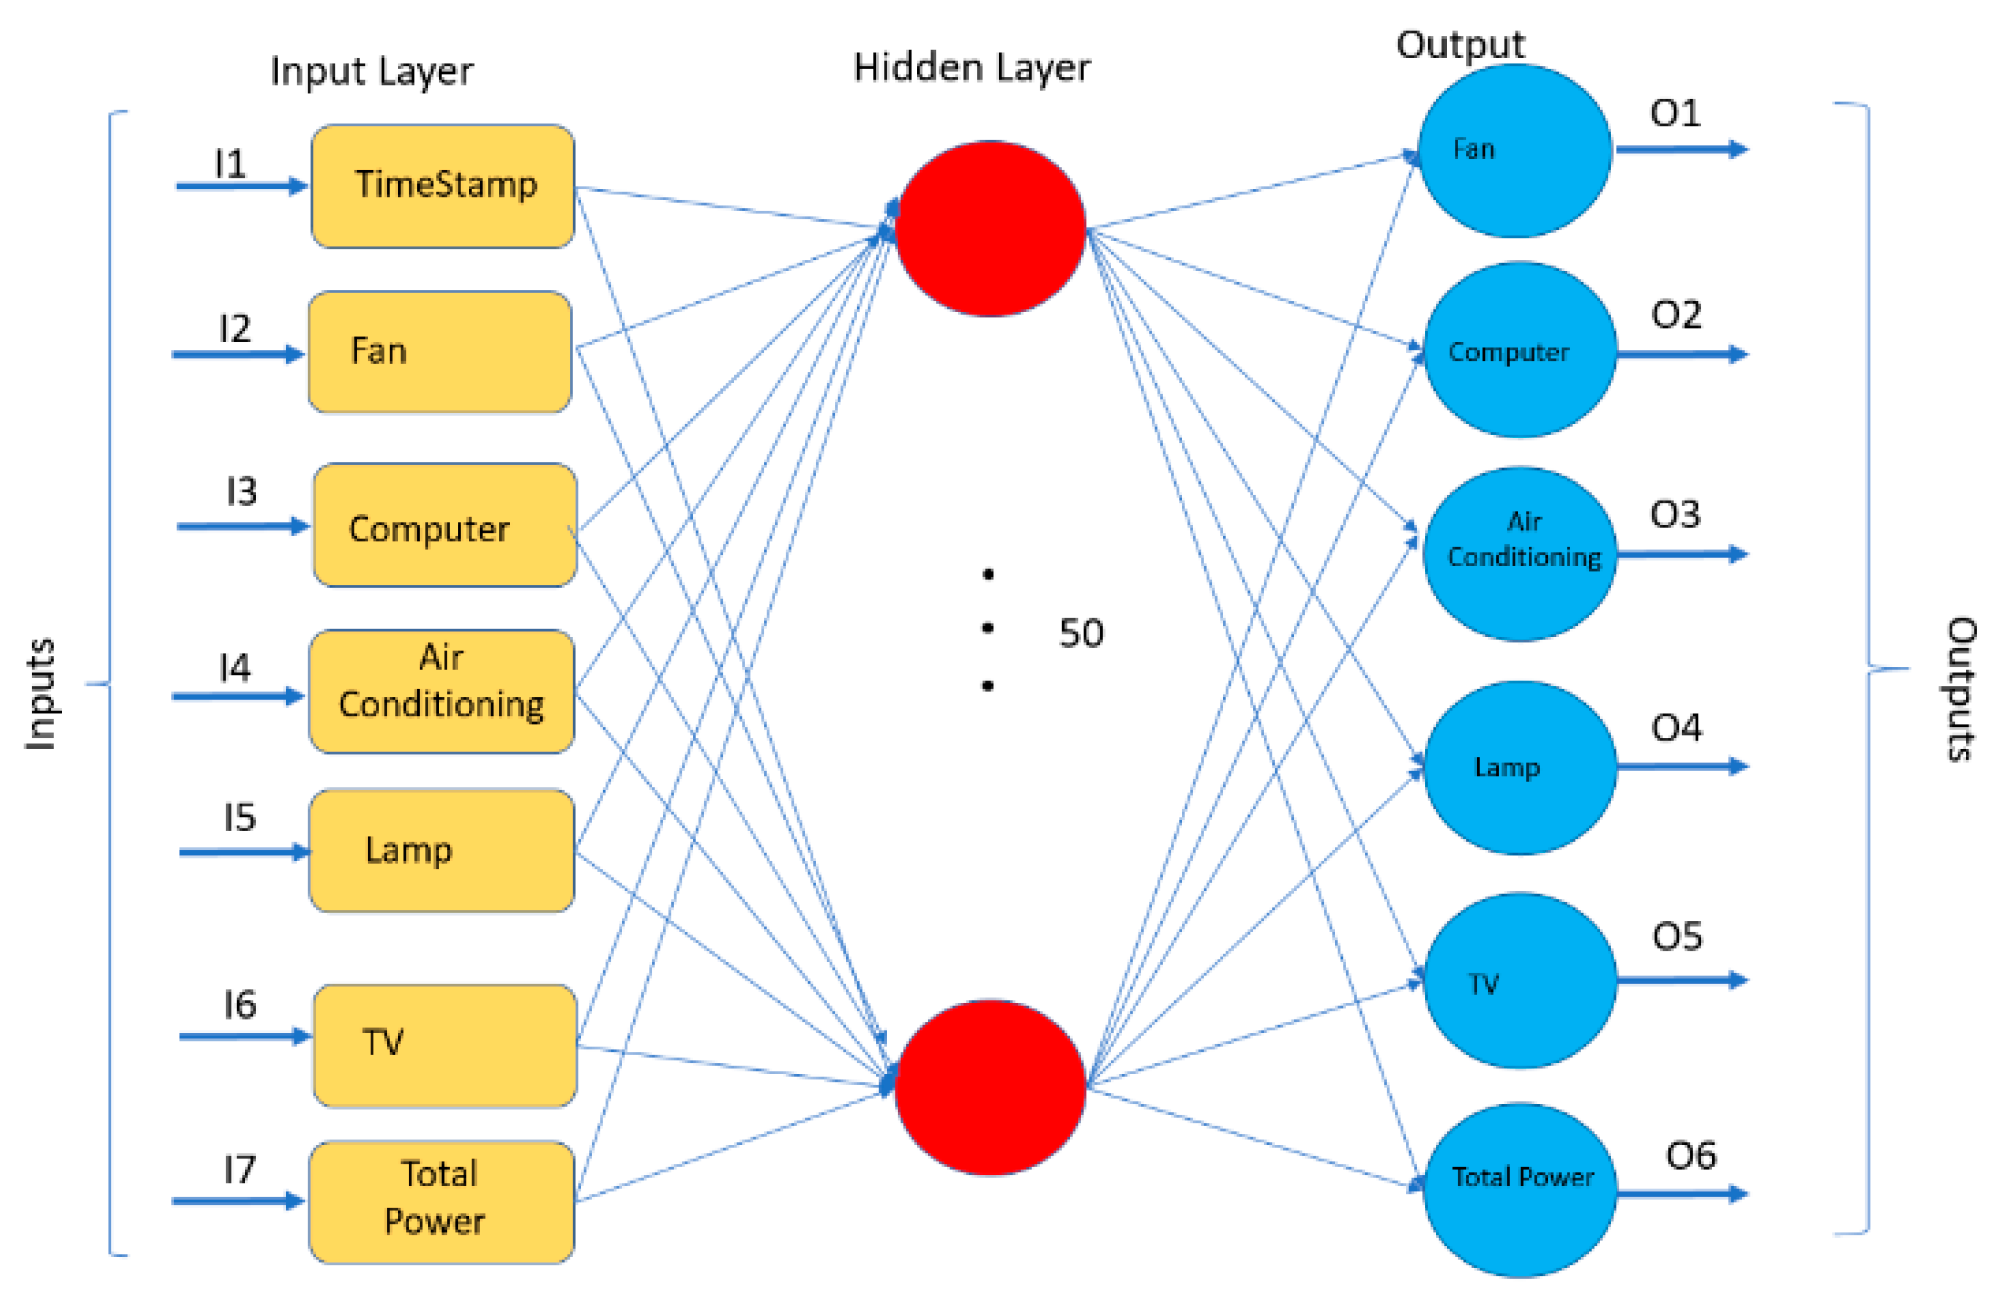
The architecture of the LSTM (Long Short-Term Memory) model used to predict energy consumption in the home is composed of several layers that allow for capturing and processing the temporal information of the input data. The architecture of this model consists of a hidden LSTM layer and dense output layer, as shown in Figure 6. The arrows indicate the inputs and outputs at each layer.
The structure of the model architecture is described in detail below:

4.6.1. Tickets

Input refers to the characteristics or variables used to make predictions. These inputs are the data fed to the model at each time step or instance so that they can learn and make predictions. In this specific case of the LSTM model for predicting energy consumption in a household, the inputs are the power measurements in KWh of different electrical devices (fan, computer, air conditioner, lamp, and TV) and the total power recorded at time intervals. These measurements were used to predict future energy consumption. Each input represents the value of a feature at a specific time step within a time window, and the LSTM model learns to use this historical information to make accurate predictions regarding future energy consumption.

4.6.2. LSTM Layer (Hidden)

The LSTM layer, an essential component of the model, was responsible for capturing the temporal dependencies in the sequence data. This layer is composed of a series of LSTM cells, each with internal feedback connections that allow them to remember the relevant input sequence information over time. The LSTM units in this layer sequentially process the time windows of the input data, generating internal representations that capture the temporal patterns in energy consumption. In the developed model, the LSTM layer consisted of 50 LSTM neurones. Each unit has its own internal memory and is capable of learning and remembering long-term patterns in sequential data.

4.6.3. Dense Output Layer

After the LSTM layer, a dense layer is added that uses the outputs of the LSTM units as inputs and produces the final predictions for each household device in the dataset. Each device had a unit in this dense layer, which enabled the model to generate specific predictions for each device. That is, in this case, this layer has six units (fan, computer, air conditioner, lamp, television, and total power).
It is essential to include a description of the activation functions and hyperparameter configurations in this section. Activation functions are essential elements in neural networks that control the manner in which information flows through different layers. The LSTM layer uses the default hyperbolic tangent activation function (tanh) for the long-term and short-term memory units; this function is used to regulate the flow of information in the long-term and short-term memory units, ensuring training stability and capturing relevant information over time. In contrast, in the dense layer, the default linear activation function is used, which performs a linear transformation of the input data without introducing additional nonlinear transformations. This is useful in regression problems, in which one seeks to predict numerical values directly. Regarding the hyperparameter settings, the model architecture involves the appropriate selection of parameters such as the number of LSTM units, learning rate of the optimiser, and batch size during training.
The LSTM model architecture provides a flexible and powerful structure for modelling temporal patterns in energy-consumption data, allowing the model to effectively capture complex temporal relationships and make accurate predictions.

4.7. Model Development

The development of the LSTM model for predicting home energy consumption involves a series of steps, from the initial model building to training and evaluation. It starts with the construction of a sequential model using the TensorFlow and Keras libraries in Python, which is composed of an LSTM layer followed by a dense layer that provides predictions for each household device in the dataset. Then, the model was compiled using the Adam optimiser, and the mean square error (MSE) loss function was used to measure the discrepancy between the model predictions and the actual energy consumption values, and other model parameters were configured.
Subsequently, the model was trained using the normalised training data. During training, the weights of the neural connections were adjusted to minimise the loss function. During each epoch, the model weights are updated using the error backpropagation algorithm.
Once the training was completed, the model performance was evaluated using the test set by making predictions on the test data and calculating the MSE between the model predictions and actual values. In addition to MSE, the loss during training was visualised to understand how the model learnt over epochs. Finally, additional adjustments can be made to the model, such as modification of the network architecture, optimisation of hyperparameters, or inclusion of regularisation techniques, in pursuit of improving the model performance by careful iteration throughout these stages.

5. Results and Discussion

After completing the process of developing and evaluating the LSTM model for predicting household energy consumption, the following results were obtained: In terms of model performance, it was observed that the LSTM showed good performance in predicting energy consumption, as indicated by the low loss in the test set and the MSE obtained. In the model evaluation process for the test set, 20 evaluation iterations were completed, and each iteration took approximately 1 s, with a processing speed of approximately 3 ms per step. The main result was the MSE on the test set, with a value of 0.0169. This MSE value indicates that, on average, the model predictions deviate by approximately 0.0169 KW2 from the actual values in the test set. The lower this value, the better the model performance, as it indicates a smaller discrepancy between the model predictions and the actual values. In this case, an MSE of 0.0169 suggests that the model makes fairly accurate predictions of household energy consumption from the time-series data provided.
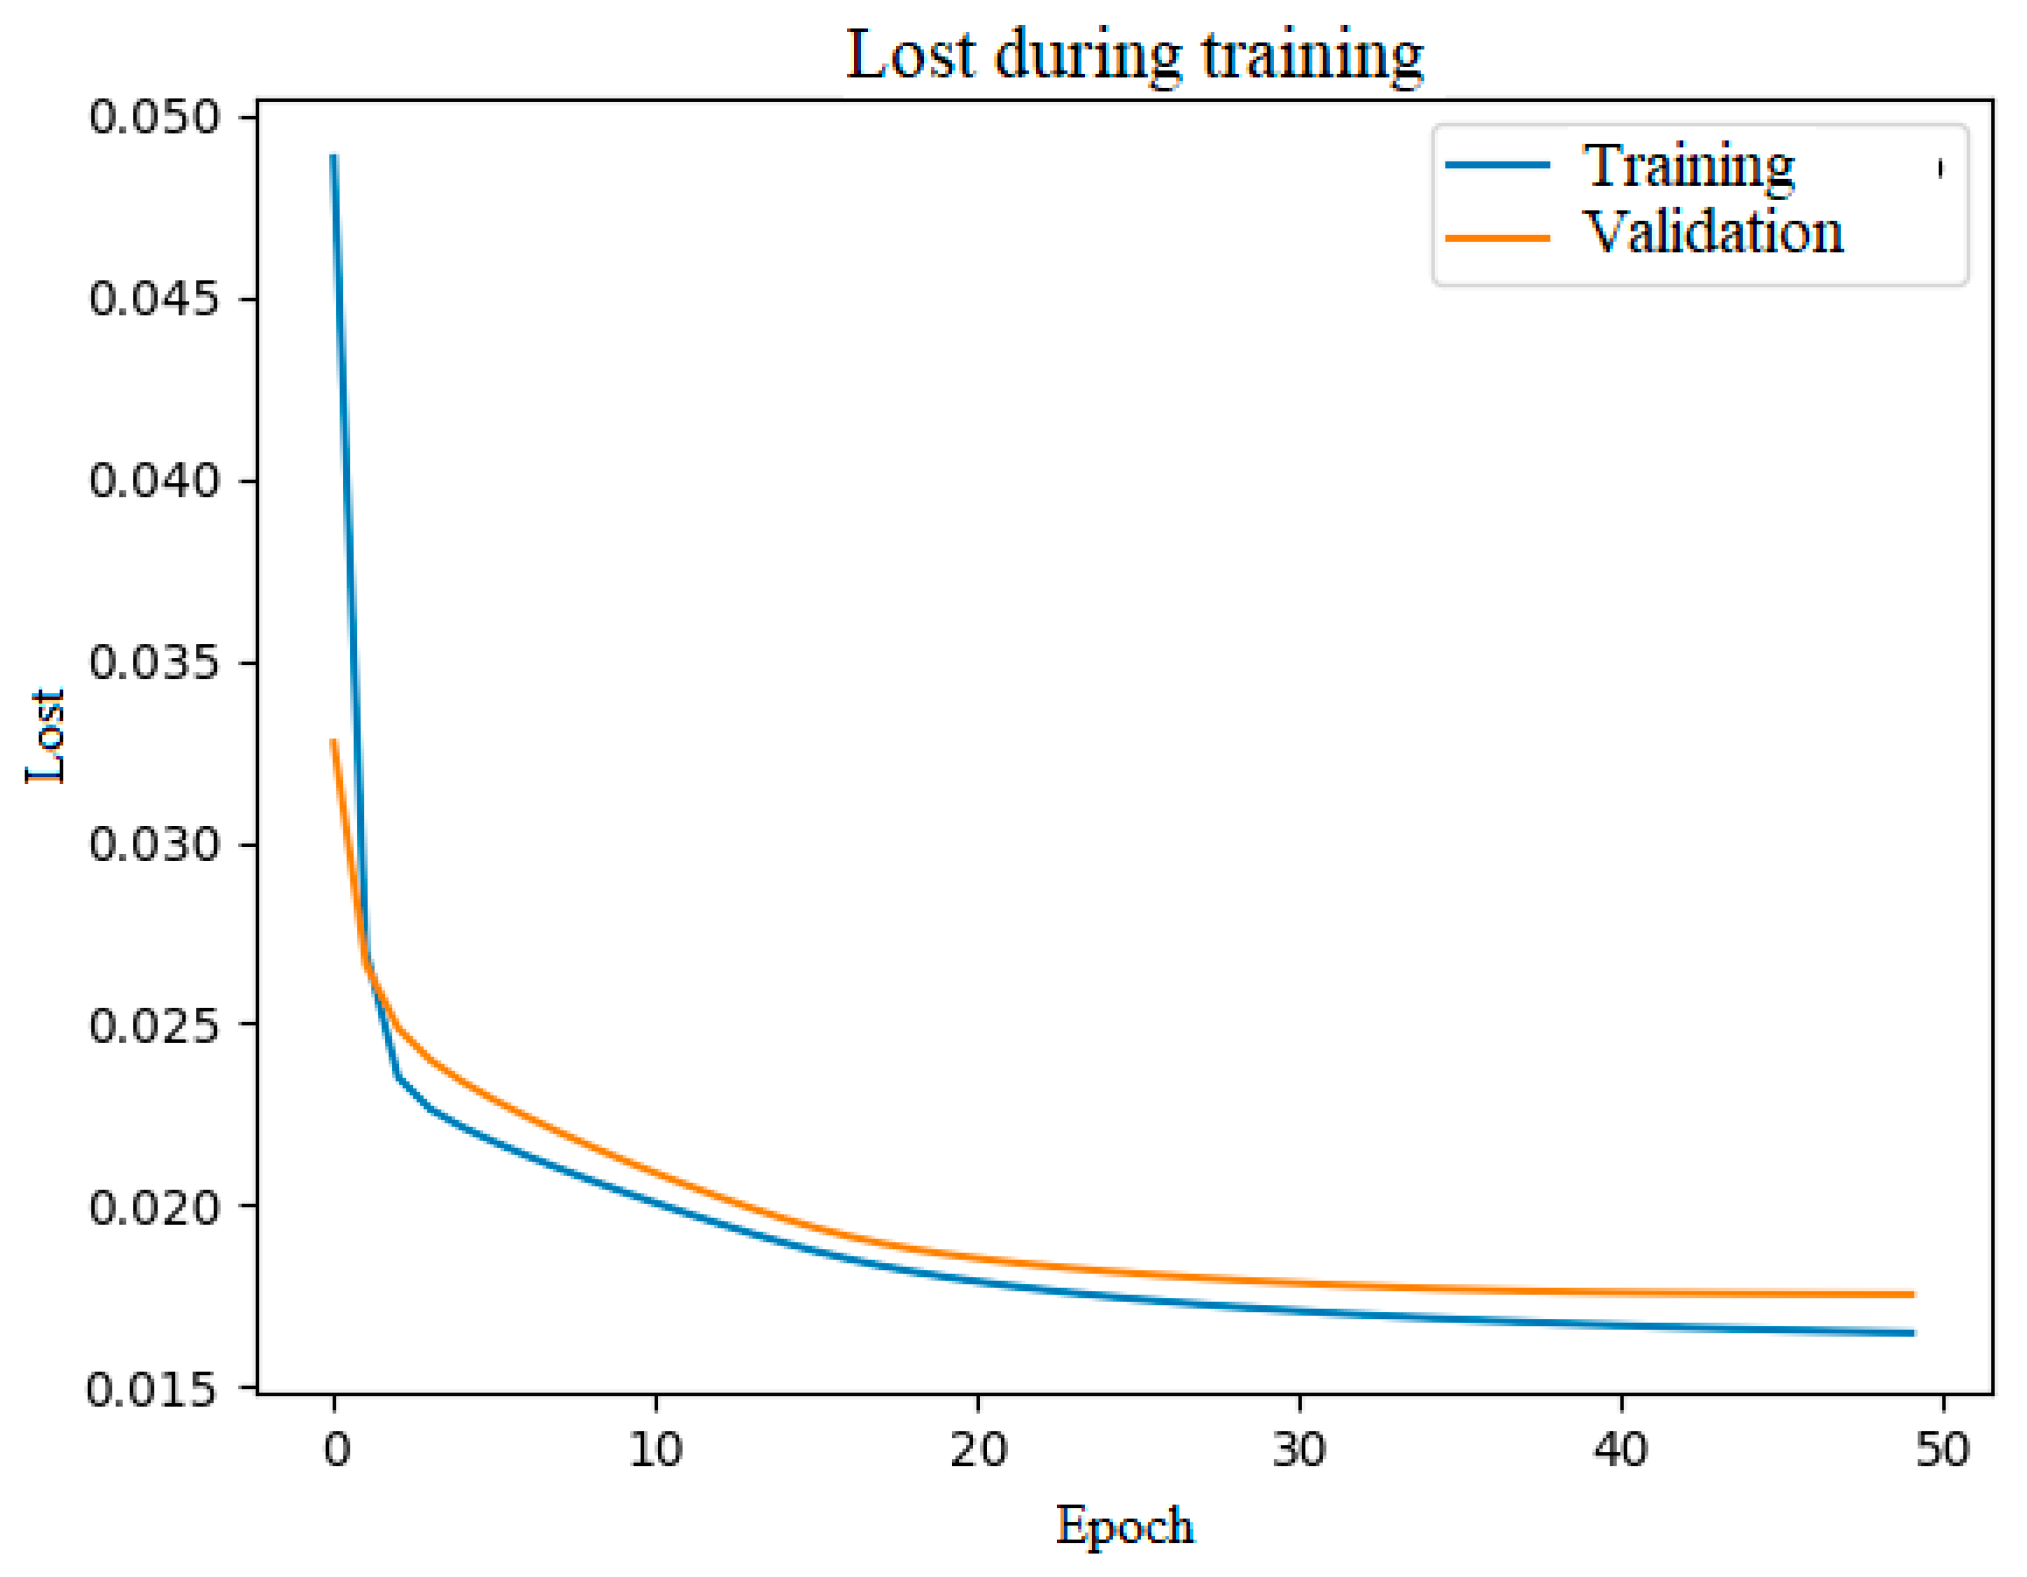
Figure 7 shows the “Graph of Loss during Training”. This graph shows how the loss (in this case, the MSE) of the model changed over time (epochs) during the training process. The loss was plotted on the y-axis (vertical), with units of mean square error (MSE), and the number of epochs was plotted on the X-axis (horizontal), with units of number of epochs (1, 2, 3, …, n). In the graph, the blue line reflects the loss in the training set, and the orange line indicates the loss in the validation set. This provides information about how the model is learning during training and whether overfitting occurs (when the loss in the training set continues to decrease, whereas the loss in the validation set begins to increase). In the case of this model, the loss decreases in both the training set and the validation set as the training progresses, indicating that the model learns correctly and generalises well to unseen data.
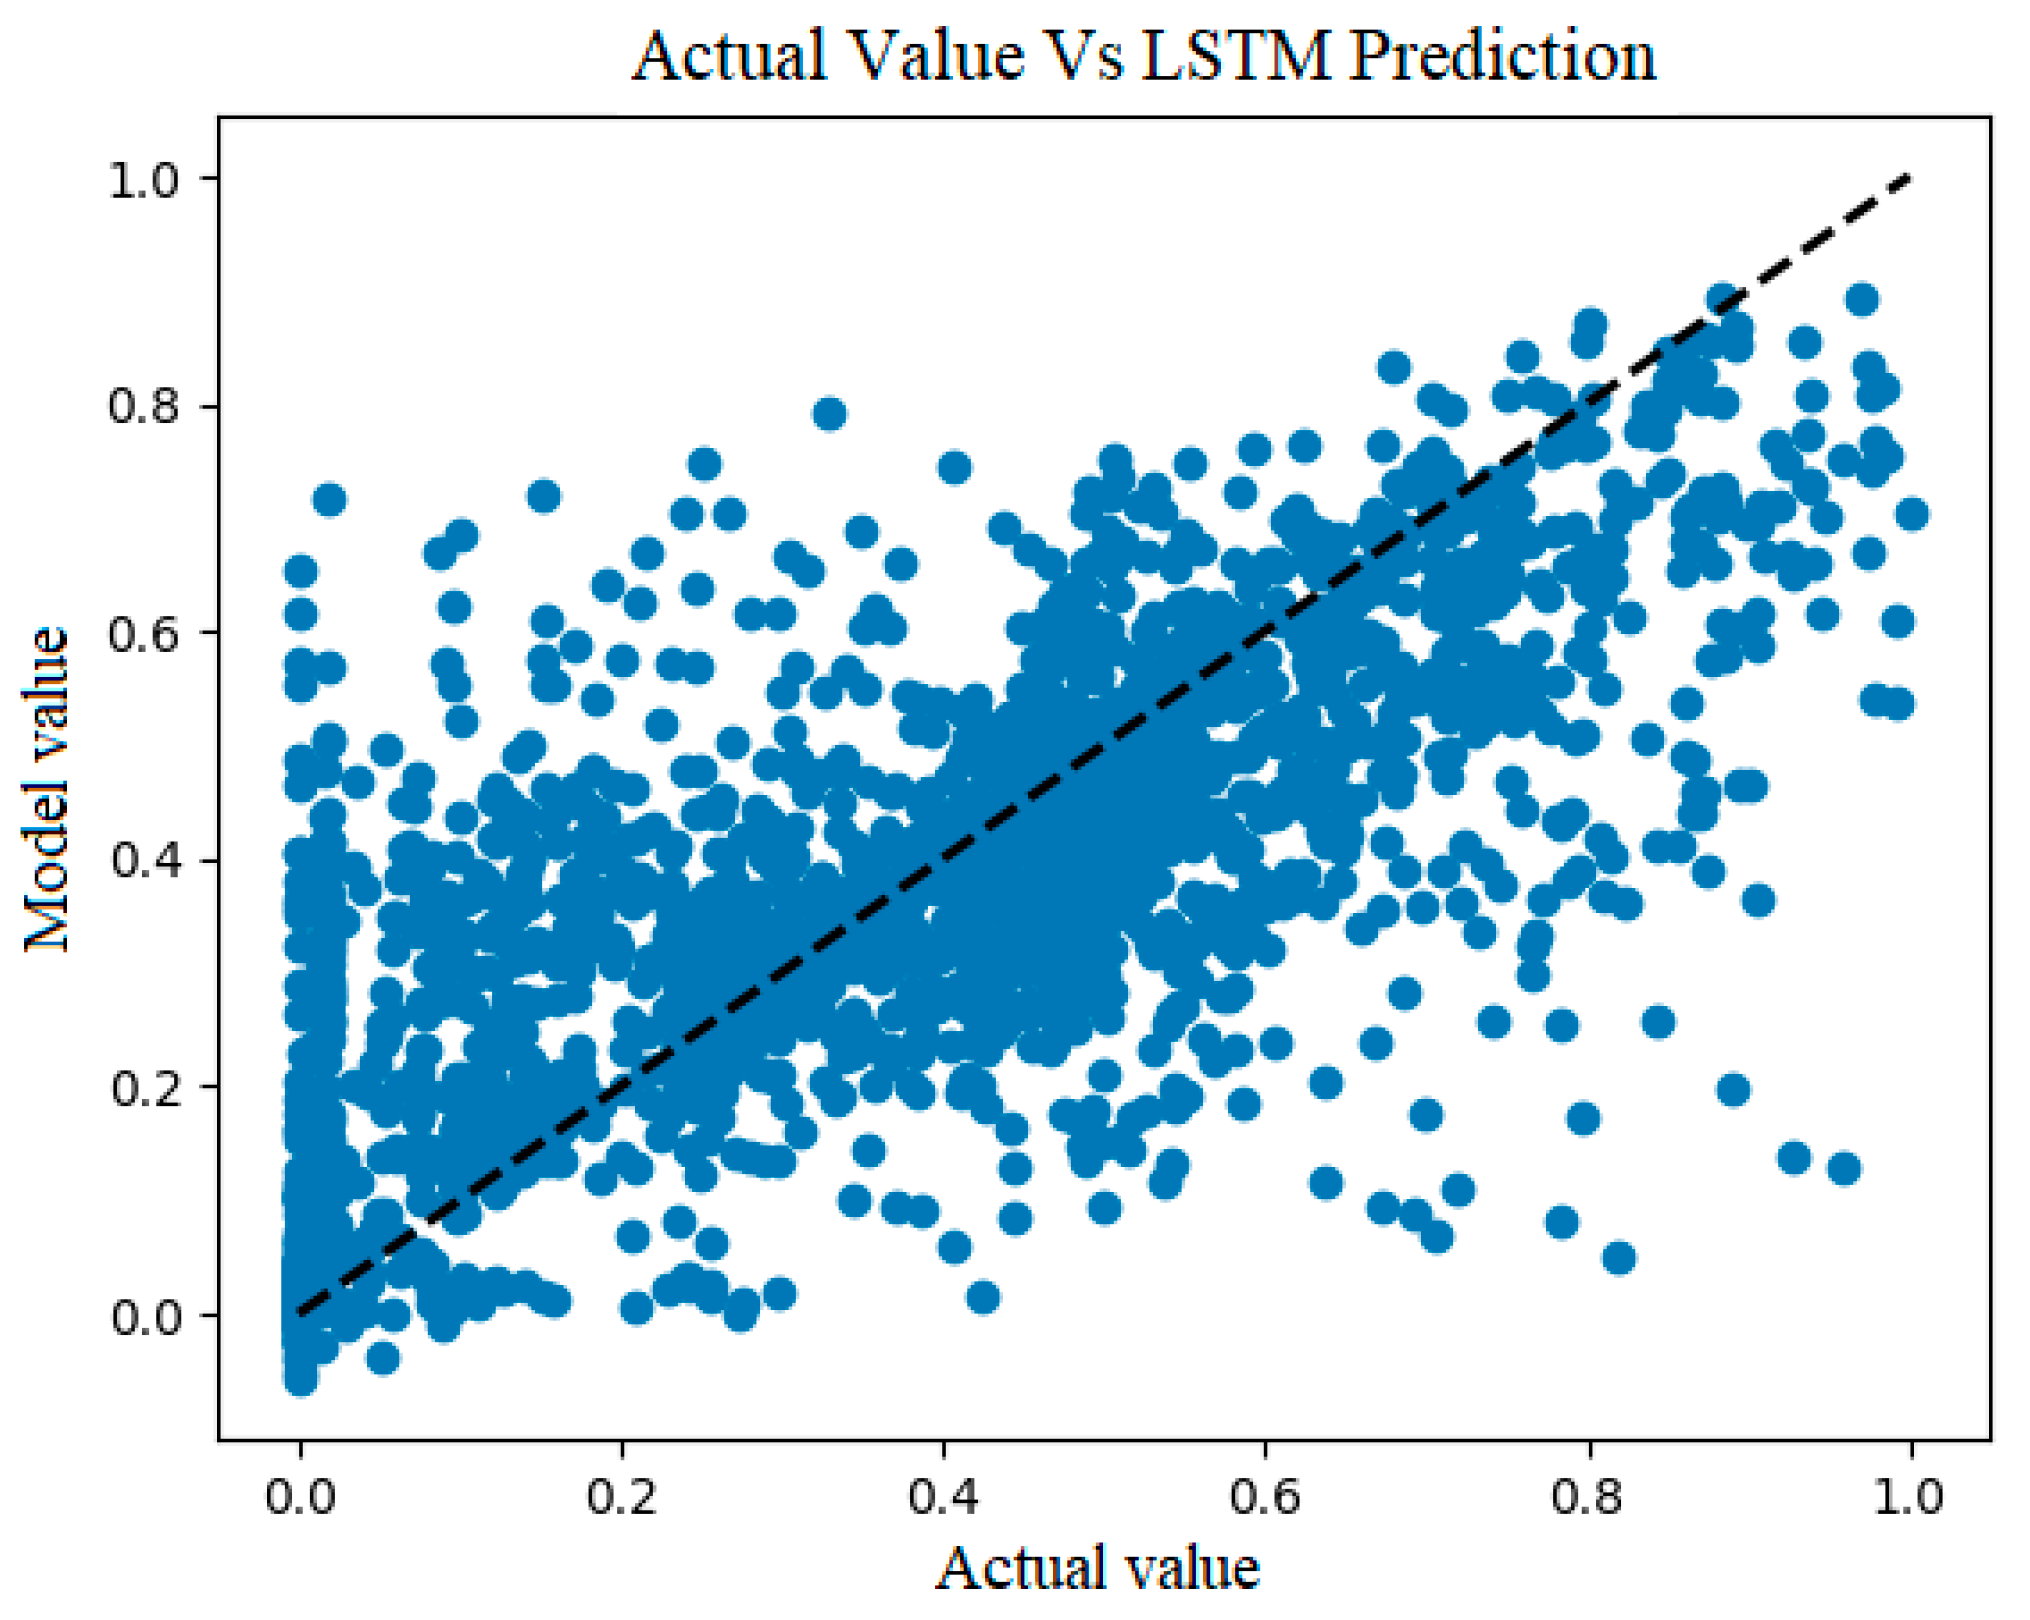
Figure 8 shows the scatter plot for this model, comparing the actual values (X-axis) with the model predictions (Y-axis) for the test set. Each point on the plot represents an instance of data in the test set. Actual values were plotted on the x-axis (horizontal), with units of observed values, and model predictions were plotted on the y-axis (vertical), with units of predicted values. The points in the plot are evenly distributed around a diagonal line (the line where the predicted values are equal to the actual values), indicating good agreement between the model predictions and the actual values.
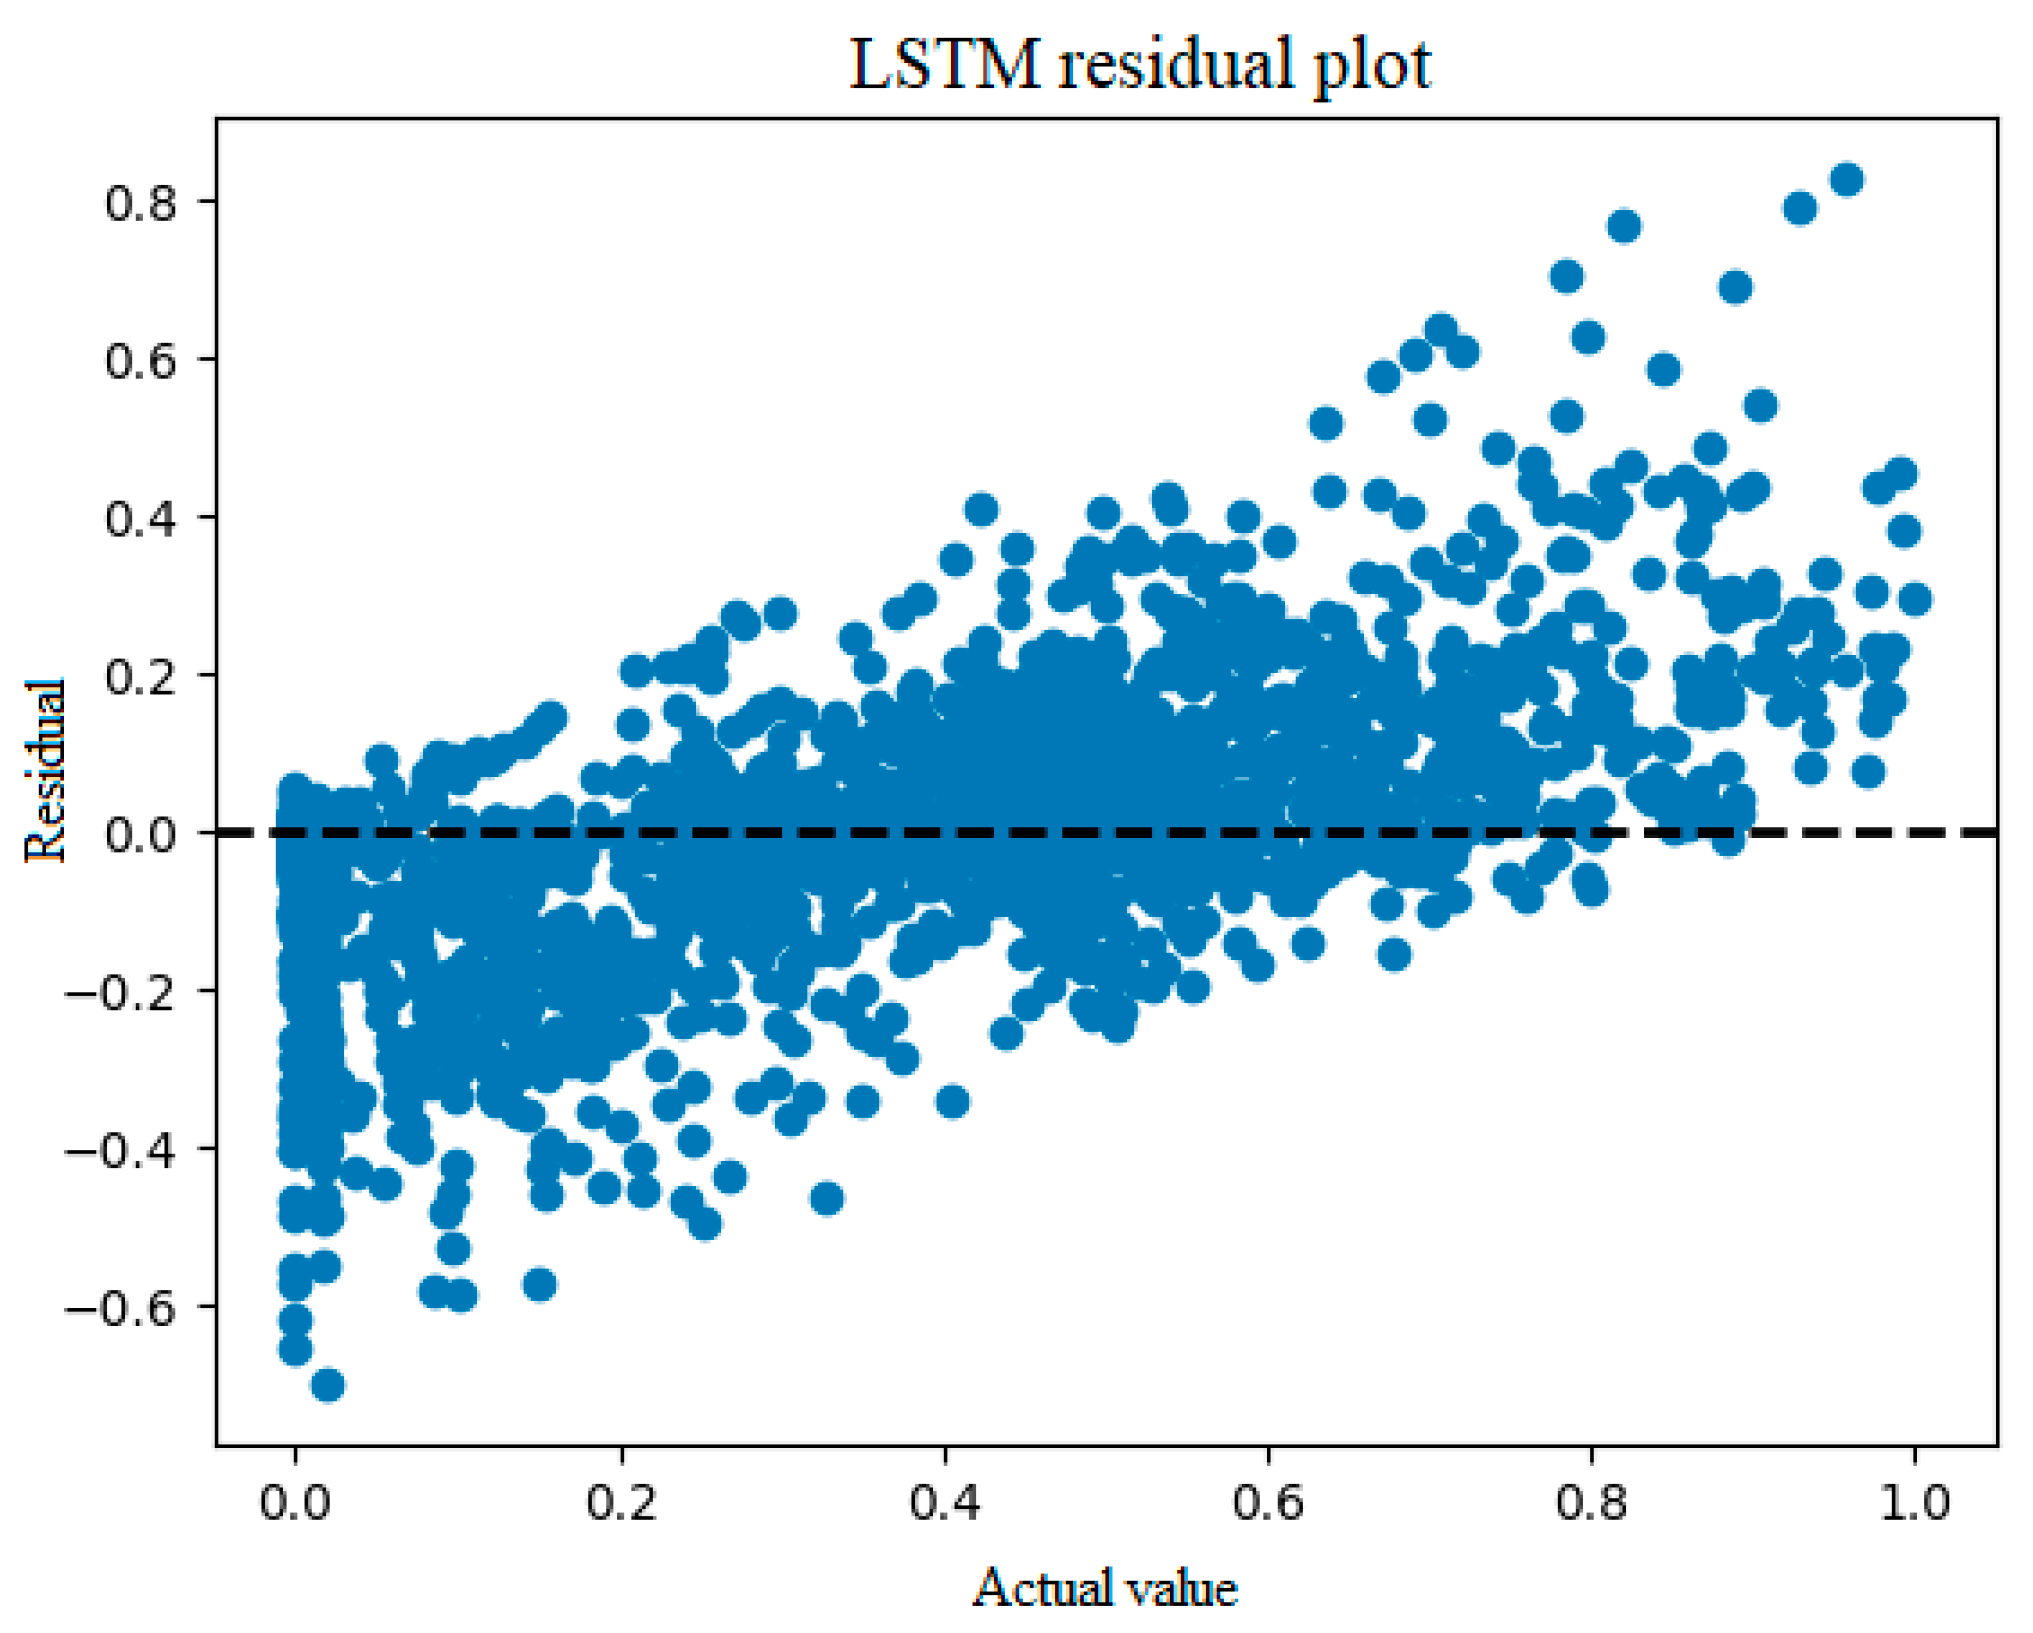
Figure 9 presents the residual plot generated using this model, showing the relationship between the actual values and the model residuals. The residuals are the differences between the actual values and model predictions. In the graph, actual values are plotted on the X-axis (horizontal), with units of observed values, and residuals are plotted on the y-axis (vertical), with units of differences between actual and predicted values. In this model, the residuals were randomly distributed around the horizontal line at y = 0 (the black dashed line in the graph). This indicates that there are no discernible patterns in the model errors, and that the residuals have a normal distribution around zero, suggesting that the model correctly captures the variability in the data. This indicates that the model consistently and accurately predicts over the full range of true values.
A comparison of actual values with model predictions using scatter plots and residual analysis provided a deeper understanding of the model’s performance and revealed areas for improvement. The model was validated by assessing its generalisation ability using separate training and test sets, which provided a measure of its ability to make accurate predictions of unobserved data during training.
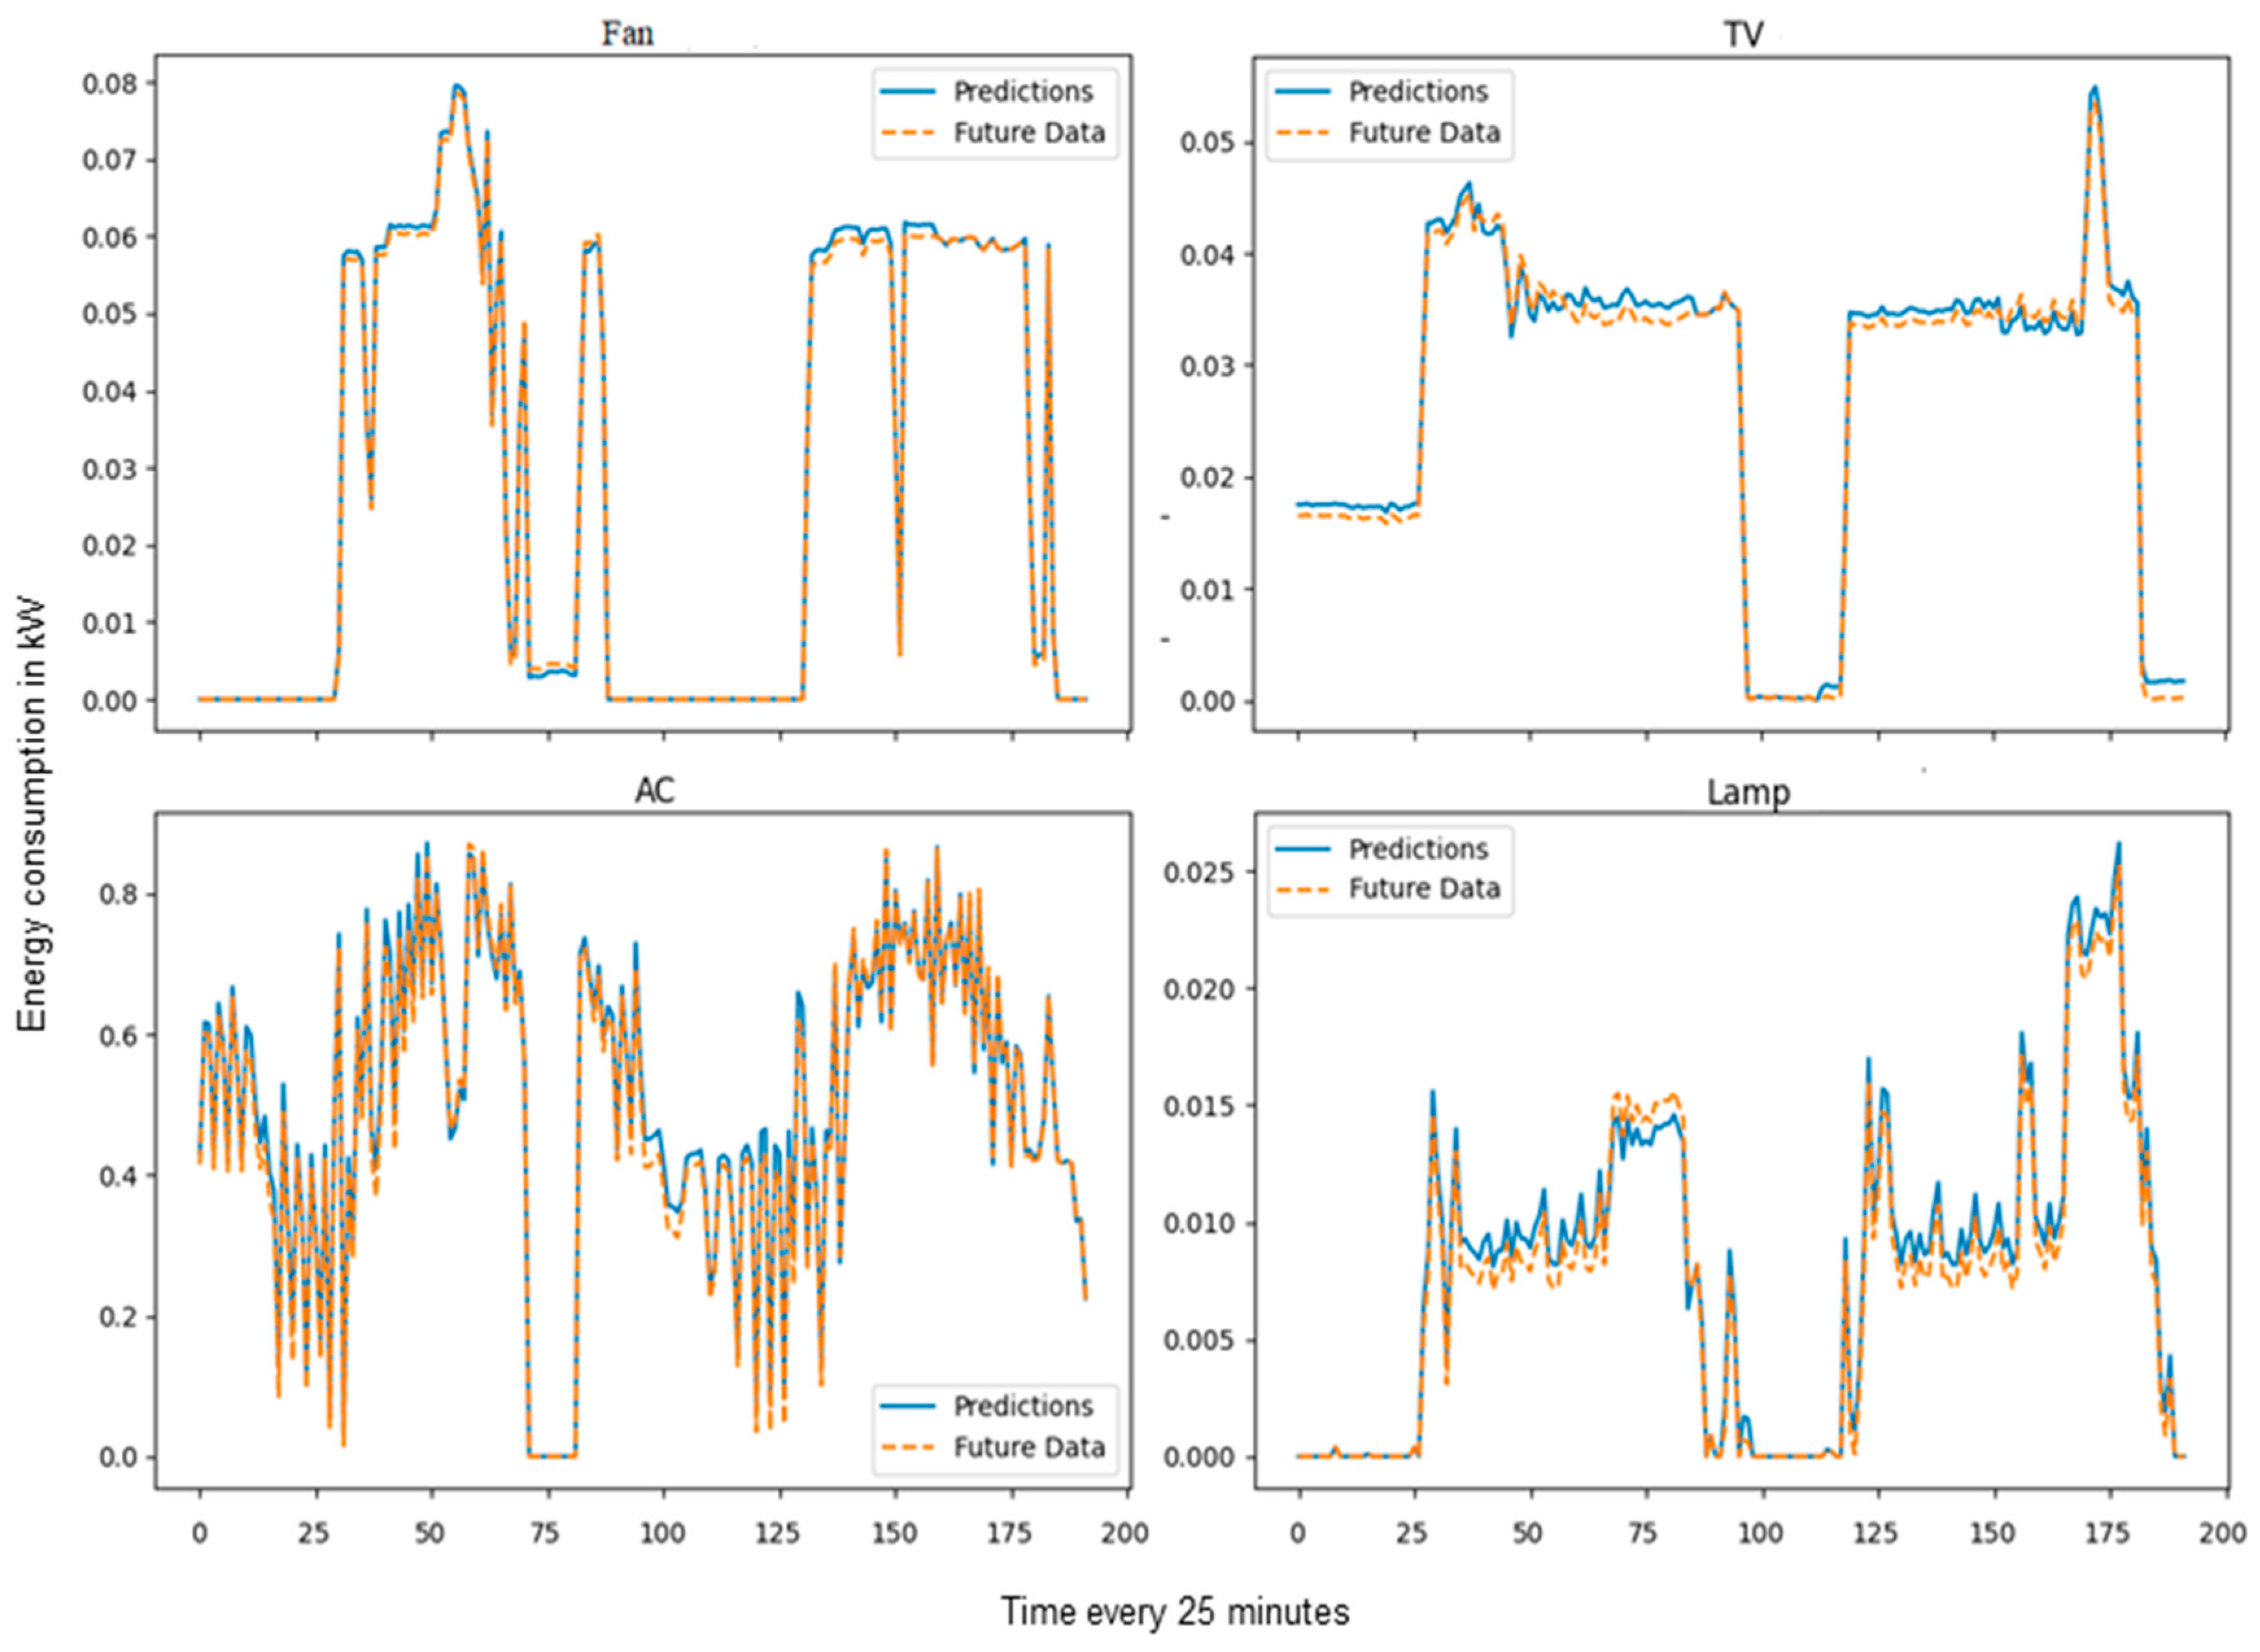
It is possible to say that the results of the LSTM model represent a significant advance towards improving household energy management [63,64,65], by providing accurate and reliable predictive tools that can contribute to optimising energy use and promoting sustainable practices. A comparison has been made of two days of predictions, versus two days of actual data for the same date. The graph in Figure 10 shows this comparison for each of the five devices; the x-axis represents the time every 25 min and the y-axis represents the energy consumption in KW. As you can see, the values are very close, which shows that the model is efficient when making predictions. It is important to note that the randomly selected days coincided with Saturday and Sunday, days when the PC is not normally used; therefore, the PC graph did not generate consumption for these days, neither in the predictions nor in the future data, because its consumption was zero KW. For this reason, it was decided to exclude this graph from Figure 10.
This approach considers all the devices simultaneously when training the LSTM model. Each appliance has its own output layer in the model, allowing it to learn the complex relationships between different devices to make accurate predictions of the energy consumption of the home as a whole. Furthermore, it is notable that this new study can contribute to the analysis of energy efficiency in homes, allowing them to predict their future efficiency and thus identify possible measures to implement. This perspective is fundamental in the context of energy efficiency, as it provides insights that can guide concrete actions to improve consumption and reduce environmental impact. Furthermore, the findings of this study can serve as a starting point for future research in the field of energy efficiency, opening the door to new development and optimisation opportunities in this area.

6. Conclusions

In this study, an LSTM model was developed and evaluated to predict home energy consumption using power data from various home-use devices. This paper presents an approach that uses LSTM neural networks to predict home energy consumption, demonstrating its effectiveness in capturing temporal relationships in power consumption data. The architecture of the LSTM model provides a flexible and scalable structure that can be adapted to different datasets and input conditions, suggesting its applicability and extension to other time-series prediction scenarios. The evaluation results showed a remarkable correspondence between the model predictions and actual data, further supporting the effectiveness of the proposed approach. Despite these achievements, there are opportunities to further improve the model and explore new research directions, such as exploring alternative model architectures, integrating additional contextual data, and developing practical applications for smart-home energy management. Unexpected events, such as temporary absences or changes in consumption patterns, can significantly influence the accuracy of predictions. To address this concern, a comprehensive analysis of the LSTM model’s ability to adapt to sudden changes in input data and to appropriately generalise to scenarios not seen during training, such as temporary absences or changes in household dynamics, was conducted. This could involve exploring regularisation techniques, data augmentation, or incorporating additional contextual information to improve the ability of the model to capture variations in energy consumption behaviour. In addition, it should be noted that the LSTM model is designed to capture the typical behaviour of a home, and atypical events such as the absence of occupants can be considered anomalous data that require special handling.

7. Future Work

In future work, the integration of additional contextual data, such as weather data, user behaviour information, or economic data, can be considered to improve the predictive capability of the model and better capture external factors influencing energy consumption. In addition, a systematic search for hyperparameters can be performed to optimise the model configuration and improve its performance in terms of accuracy and generalisation to different contexts and conditions. In addition to the metrics used for MSE and prediction accuracy, other evaluation metrics, such as the coefficient of determination (R²), can be considered to assess the model’s performance in a more comprehensive manner.
Other areas of exploration include the development of more advanced regularisation techniques to avoid over-fitting and the creation of intuitive user interfaces and practical applications that allow end users to interact with energy consumption prediction models in real time. In addition, further validation of the trained model in real-world environments can be performed to evaluate its performance and effectiveness under real-world usage conditions, considering factors such as seasonal variability, user behaviour, and fluctuations in power supply. In this context, it is important to mention that the adoption of digital methodologies, such as Building Information Modelling (BIM), can optimise energy use and reduce carbon emissions, providing a comprehensive solution for energy efficiency in the building industry [66,67].
In the future, consideration should also be given to improving the robustness and generalisation of LSTM models in the face of unexpected changes in consumption patterns to ensure their reliability and usefulness in practical home energy management applications, for which BIM could be a solution, because this technology has the potential to optimise energy use in various energy-intensive operations while aiming to reduce carbon emissions and maintain energy efficiency, thus providing a comprehensive solution for energy efficiency in the building manufacturing industry [67,68]. The use of the BIM methodology, implemented with IoT devices and artificial intelligence algorithms, allows the creation of a digital twin that replicates the real building and contains all the necessary information to control the construction process, from concept to maintenance [69]. Digital management achieved through BIM allows the construction industry to improve all phases, from better resource planning to improved collaboration between various disciplines, helping to keep the project on time and on budget [68].

Author Contributions

Conceptualization, Z.S.-M. and W.A.-H.; Methodology, Z.S.-M., A.C.-P., W.A.-H., D.C.-P., A.C.-P., J.A.H.-T., M.D.-H. and R.R.-V.; Validation, W.A.-H., M.D.-H., A.C.-P., J.A.H.-T. and R.R.-V.; Formal Analysis, D.C.-P., A.C.-P., J.A.H.-T., M.D.-H. and Z.S.-M.; Investigation, Z.S.-M., W.A.-H., D.C.-P. and A.C.-P., Data Curation, Z.S.-M. and R.R.-V.; Writing—original draft preparation, D.C.-P., A.C.-P., J.A.H.-T., M.D.-H. and Z.S.-M.; Writing—review and editing, W.A.-H., D.C.-P., A.C.-P., J.A.H.-T., M.D.-H. and Z.S.-M.; Visualization, D.C.-P., A.C.-P., J.A.H.-T., M.D.-H. and Z.S.-M.; Supervision, Z.S.-M., D.C.-P., A.C.-P., J.A.H.-T., M.D.-H. and W.A.-H.; Project Administration, D.C.-P., A.C.-P., J.A.H.-T., M.D.-H. and Z.S.-M.; resources, D.C.-P., A.C.-P., J.A.H.-T. and M.D.-H. All authors have read and agreed to the published version of the manuscript.

Funding

This research received no external funding.

Data Availability Statement

The data used in this study have been published in the Mendeley database and are available at the following link: https://data.mendeley.com/datasets/99j9t7f8kj/1. (accessed on 30 May 2024).

Acknowledgments

This work was carried out with the support of Manglar LivingLab, a research laboratory of the University of Sucre.

Conflicts of Interest

The authors declare no conflict of interest.

References

  1. International Energy Agency. About the IEA. Available online: https://www.iea.org/about (accessed on 12 February 2024).
  2. UPME. Projection of Demand for Electric Energy, Natural Gas, and Liquid Fuels (2022–2036). Available online: https://www1.upme.gov.co/DemandayEficiencia/Documents/Informe_proyeccion_demanda_energeticos.pdf (accessed on 12 February 2024).
  3. Musarat, M.A.; Sadiq, A.; Alaloul, W.S.; Abdul Wahab, M.M. A Systematic Review on Enhancement in Quality of Life through Digitalization in the Construction Industry. Sustainability 2023, 15, 202. [Google Scholar] [CrossRef]
  4. United Nations Framework Convention on Climate Change. Kyoto Protocol. Available online: https://unfccc.int/kyoto_protocol (accessed on 15 February 2024).
  5. United Nations Framework Convention on Climate Change. Acuerdo de París. Available online: https://unfccc.int/process-and-meetings/the-paris-agreement/the-paris-agreement (accessed on 15 February 2024).
  6. Meana-Fernández, A.; Suárez-López, M.J.; Blanco, E.; Prieto, J.-I.; García, D. Experimental heating and cooling curves of the ground for temporary energy storage applications. J. Energy Storage 2024, 94, 112419. [Google Scholar] [CrossRef]
  7. Naji, A.J.; Abu Mahadi, M.I.; Humaish, W.H.; Markovich, A.S. Sustainable buildings design strategies in the building sector. E3S Web Conf. 2024, 533, 04003. [Google Scholar] [CrossRef]
  8. Alhassan, M.; Alhassan, M.; Alkhawaldeh, A.; Alkhawaldeh, A.; Betoush, N.; Betoush, N.; Sawalha, A.; Sawalha, A.; Amaireh, L.; Amaireh, L.; et al. Harmonizing smart technologies with building resilience and sustainable built environment systems. Results Eng. 2024, 22, 102158. [Google Scholar] [CrossRef]
  9. Hernandez, L.; Morin, P.; Abouzeid, M. Sustainable Buildings: Integration with Smart Microgrids. Renew. Sustain. Energy Rev. 2021, 136, 110442. [Google Scholar]
  10. Wang, X.; Wang, Q.; Zhang, X. Building-integrated Microgrids: A Review. Energy Build. 2020, 216, 109934. [Google Scholar]
  11. Mengelkamp, E.; Gärttner, J.; Weinhardt, C. Intelligent Energy Systems: Integrating Smart Buildings with Microgrids. J. Clean. Prod. 2021, 279, 123673. [Google Scholar]
  12. Zheng, Z.; Wang, Z.; Sun, W. Energy Management System in Microgrids: A Review. J. Power Sources 2020, 450, 227693. [Google Scholar]
  13. Liu, Y.; Wang, Y.; Golnaraghi, F. A Review on Energy Management Systems for Microgrids. Renew. Sustain. Energy Rev. 2021, 135, 110026. [Google Scholar]
  14. Zhou, K.; Wang, R.; Zhou, B. Optimization of Energy Management Systems for Microgrids: A Comprehensive Review. Appl. Energy 2020, 260, 114258. [Google Scholar] [CrossRef]
  15. Zhang, H.; Liu, X.; Li, Y. Energy Management Systems for Microgrids Using Artificial Intelligence: A Review. Energy Convers. Manag. 2021, 224, 113307. [Google Scholar]
  16. Zhong, H.; Xie, L.; Xia, Q. Short-term Load Forecasting Based on Deep Learning: A Review. Energy 2020, 198, 117262. [Google Scholar]
  17. Bao, Y.; Li, X.; Xiao, F.; Zhou, Y. Optimized Energy Management for Industrial Microgrids Based on Energy Internet and Machine Learning: A Case Study. Energies 2021, 14, 901. [Google Scholar]
  18. Li, Y.; Zhang, H.; Cui, W. Wind Power Prediction Based on Deep Learning: A Review. Renew. Energy 2021, 166, 418–431. [Google Scholar]
  19. Mashlakov, A.; Kuronen, T.; Lensu, L.; Kaarna, A.; Honkapuro, S. Assessing the performance of deep learning models for multivariate probabilistic energy forecasting. Appl. Energy 2021, 285, 116405. [Google Scholar] [CrossRef]
  20. Balakrishnan, R.; Geetha, V. Review on home energy management system. Mater. Today Proc. 2021, 47, 144–150. [Google Scholar] [CrossRef]
  21. Matich, D.J. Neural Networks: Basic Concepts and Applications. Ph.D. Thesis, Universidad Tecnológica Nacional—Facultad Regional Rosario, Buenos Aires, Argentina, March 2001. [Google Scholar]
  22. Palomeque Reyes, A.L. Predicting and Optimizing Customer Energy Consumption Using Data Analytics and Modeling Algorithms. Master’s Thesis, University of Cantabria, Santander, Spain, 2023. Available online: https://hdl.handle.net/10902/29759 (accessed on 21 February 2024).
  23. Guevara Gómez, M. Power Quality Event Classification Using Deep Convolutional Neural Networks in the Framework of Industry 4.0. Master’s Thesis, Universidad Tecnológica de Pereira, Álamos Pereira, Colombia, 2023. [Google Scholar]
  24. Shakir, M.; Biletskiy, Y. Long Short-term Memory Forecasting In Home Energy Management System. In Proceedings of the 11th IEEE 2020 International Symposium on Power Electronics for Distributed Generation Systems (PEDG), Dubrovnik, Croatia, 28 September–1 October 2020; pp. 542–546. [Google Scholar] [CrossRef]
  25. Maury, Z.D.L.C.S.; Hoyos, W.D.J.A. Savings at home by modifying the energy consumption pattern using gamification, predictive models and Energy Management Systems. In Proceedings of the 2021 International Conference on Electrical, Computer and Energy Technologies (ICECET), Cape Town, South Africa, 9–10 December 2021; pp. 1–7. [Google Scholar] [CrossRef]
  26. Seveiche-Maury, Z.; Arrubla-Hoyos, W. Proposal of a Decision-Making Model for Home Energy Saving through Artificial Intelligence applied to a HEMS. In Proceedings of the IEEE Colombian Caribbean Conference (C3) 2023, Barranquilla, Colombia, 22–25 November 2023; pp. 1–6. [Google Scholar] [CrossRef]
  27. Serrano, W. Neural Networks in Big Data and Web Search. Data 2019, 4, 7. [Google Scholar] [CrossRef]
  28. Ojeda-Beltrán, A.; Solano-Barliza, A.; Arrubla-Hoyos, W.; Ortega, D.D.; Cama-Pinto, D.; Holgado-Terriza, J.A.; Damas, M.; Toscano-Vanegas, G.; Cama-Pinto, A. Characterisation of Youth Entrepreneurship in Medellín-Colombia Using Machine Learning. Sustainability 2023, 15, 10297. [Google Scholar] [CrossRef]
  29. Cama-Pinto, D.; Damas, M.; Holgado-Terriza, J.A.; Arrabal-Campos, F.M.; Martínez-Lao, J.A.; Cama-Pinto, A.; Manzano-Agugliaro, F. A Deep Learning Model of Radio Wave Propagation for Precision Agriculture and Sensor System in Greenhouses. Agronomy 2023, 13, 244. [Google Scholar] [CrossRef]
  30. Barrios-Ulloa, A.; Cama-Pinto, A.; De-la-Hoz-Franco, E.; Ramírez-Velarde, R.; Cama-Pinto, D. Modeling of Path Loss for Radio Wave Propagation in Wireless Sensor Networks in Cassava Crops Using Machine Learning. Agriculture 2023, 13, 2046. [Google Scholar] [CrossRef]
  31. Forootan, M.M.; Larki, I.; Zahedi, R.; Ahmadi, A. Machine Learning and Deep Learning in Energy Systems: A Review. Sustainability 2022, 14, 4832. [Google Scholar] [CrossRef]
  32. Ponce, J.C.; Torres, A.; Silva, A.; Casali, A. Artificial Intelligence. In Latin American Open Textbook Initiative (LATIn), 1st ed.; Academic Press: Madrid, Spain, 2014; Volume 1. [Google Scholar] [CrossRef]
  33. Szczepaniuk, H.; Szczepaniuk, E.K. Applications of Artificial Intelligence Algorithms in the Energy Sector. Energies 2022, 16, 347. [Google Scholar] [CrossRef]
  34. Thirunavukkarasu, G.S.; Seyedmahmoudian, M.; Jamei, E.; Horan, B.; Mekhilef, S.; Stojcevski, A. Role of optimization techniques in microgrid energy management systems-A review. Energy Strategy Rev. 2022, 43, 100899. [Google Scholar] [CrossRef]
  35. Mashapu, L.D.; Eboule, P.S.P.; Pretorius, J.-H.C. The need for artificial intelligence for energy efficiency management: A review. In Proceedings of the 8th International Conference on Energy Efficiency and Agricultural Engineering (EE&AE) 2022, Ruse, Bulgaria, 30 June–2 July 2022; pp. 1–6. [Google Scholar] [CrossRef]
  36. Brito, T.C.; Brito, M.A. Forecasting energy consumption: Artificial intelligence methods. In Proceedings of the 17th Iberian Conference on Information Systems and Technologies (CISTI) 2022, Madrid, Spain, 22–25 June 2022; pp. 1–4. [Google Scholar] [CrossRef]
  37. Liu, L.; Chen, S. The application of artificial intelligence technology in energy internet. In Proceedings of the 2nd 2018 IEEE Conference on Internet of Energy and Power System Integration (EI2), Beijing, China, 20–22 October 2018; pp. 1–5. [Google Scholar] [CrossRef]
  38. Nutakki, M.; Mandava, S. Review on optimization techniques and role of artificial intelligence in home energy management systems. Eng. Appl. Artif. Intell. 2023, 119, 105721. [Google Scholar] [CrossRef]
  39. Al-Ani, O.; Das, S. Reinforcement Learning: Theory and Applications in HEMS. Energies 2022, 15, 6392. [Google Scholar] [CrossRef]
  40. Souza, A.T.; Canha, L.N.; Milbradt, R.G.; Lemos, C.L.; Michels, C.; Santana, T.A.S. A smart home system using artificial intelligence and integration with energy storage and microgeneration. In Proceedings of the 2020 IEEE Power & Energy Society Innovative Smart Grid Technologies Conference (ISGT), Washington, DC, USA, 17–20 February 2020; pp. 1–5. [Google Scholar] [CrossRef]
  41. Akhinov, I.A.; Cahyono, M.R.A. Development of an artificial intelligence based smart home system with variable learning rate to manage home energy consumption. In Proceedings of the 2021 International Conference on Artificial Intelligence and Mechatronics Systems (AIMS), Bandung, Indonesia, 28–30 April 2021; pp. 1–6. [Google Scholar] [CrossRef]
  42. El Makroum, R.; Khallaayoun, A.; Lghoul, R.; Mehta, K.; Zörner, W. Home Energy Management System Based on Genetic Algorithm for Load Scheduling: A Case Study Based on Real Life Consumption Data. Energies 2023, 16, 2698. [Google Scholar] [CrossRef]
  43. Ulloa-Vásquez, F.; García-Santander, L.; Carrizo, D.; Heredia-Figueroa, V. Intelligent Electrical Pattern Recognition of Appliances Consumption for Home Energy Management using High Resolution Measurement. IEEE Lat. Am. Trans. 2022, 20, 326–334. [Google Scholar] [CrossRef]
  44. Zhang, Y.; Srivastava, A.K.; Cook, D. Machine learning algorithm for activity-aware demand response considering energy saving and comfort requirements. IET Smart Grid 2020, 3, 730–737. [Google Scholar] [CrossRef]
  45. Chen, X.; Ning, D. FastInformer-HEMS: A Lightweight Optimization Algorithm for Home Energy Management Systems. Energies 2023, 16, 3897. [Google Scholar] [CrossRef]
  46. Shakir, M.; Biletskiy, Y. Smart Microgrid Architecture For Home Energy Management System. In Proceedings of the 2021 IEEE Energy Conversion Congress and Exposition (ECCE), Vancouver, BC, Canada, 10–14 October 2021; pp. 808–813. [Google Scholar] [CrossRef]
  47. Mohapatra, S.K.; Mishra, S.; Tripathy, H.K. Energy Consumption Prediction in Electrical Appliances of Commercial Buildings Using LSTM-GRU Model. In Proceedings of the 2022 International Conference on Advancements in Smart, Secure and Intelligent Computing (ASSIC), Bhubaneswar, India, 19–20 November 2022; pp. 1–5. [Google Scholar] [CrossRef]
  48. Durán, F.; Pavón, W.; Minchala, L.I. Forecast-based energy management for optimal power dispatch in a microgrid. Energies 2024, 17, 486. [Google Scholar] [CrossRef]
  49. Zhou, Y.; Ren, B.; Xue, X.; Chen, L. Building Energy Consumption Forecasting based on K-Shape clustering and CNN-LSTM. In Proceedings of the 4th International Conference on Power and Energy Technology (ICPET), Beijing, China, 28–31 July 2022; pp. 1147–1152. [Google Scholar] [CrossRef]
  50. Wang, Y.; Jiang, W.; Wang, C.; Song, Q.; Zhang, T.; Dong, Q.; Li, X. An electricity load forecasting model based on multilayer dilated LSTM network and attention mechanism. Front. Energy Res. 2023, 11, 1116465. [Google Scholar] [CrossRef]
  51. Mahjoub, S.; Chrifi-Alaoui, L.; Marhic, B.; Delahoche, L. Predicting energy consumption using LSTM, multi-layer GRU and drop-GRU neural networks. Sensors 2022, 22, 4062. [Google Scholar] [CrossRef]
  52. Dai, Y.; Zhou, Q.; Leng, M.; Yang, X.; Wang, Y. Improving the Bi-LSTM model with XGBoost and attention mechanism: A combined approach for short-term power load prediction. Appl. Soft Comput. 2022, 130, 109632. [Google Scholar] [CrossRef]
  53. Khan, Z.A.; Ullah, A.; Haq, I.U.; Hamdy, M.; Mauro, G.M.; Muhammad, K.; Hijji, M.; Baik, S.W. Efficient short-term electricity load forecasting for effective energy management. Sustain. Energy Technol. Assess. 2022, 53, 102337. [Google Scholar] [CrossRef]
  54. da Silva, D.G.; de Moura Meneses, A.A. Comparing Long Short-Term Memory (LSTM) and bidirectional LSTM deep neural networks for power consumption prediction. Energy Rep. 2023, 10, 3315–3334. [Google Scholar] [CrossRef]
  55. Dorado Rueda, F.; Durán Suárez, J.; del Real Torres, A. Short-term load forecasting using encoder-decoder wavenet: Application to the french grid. Energies 2021, 14, 2524. [Google Scholar] [CrossRef]
  56. Kim, Y.; Son, H.-G.; Kim, S. Short term electricity load forecasting for institutional buildings. Energy Rep. 2019, 5, 1270–1280. [Google Scholar] [CrossRef]
  57. Chodakowska, E.; Nazarko, J.; Nazarko, Ł. Arima models in electrical load forecasting and their robustness to noise. Energies 2021, 14, 7952. [Google Scholar] [CrossRef]
  58. Yin, C.; Liu, K.; Zhang, Q.; Hu, K.; Yang, Z.; Yang, L.; Zhao, N. SARIMA-Based Medium-and Long-Term Load Forecasting. Strateg. Plan. Energy Environ. 2023, 42, 283–306. [Google Scholar] [CrossRef]
  59. Sharma, D.K.; Jain, V.; Dhingra, B.; Gupta, K.D.; Ghosh, U.; Al-Numay, W. A novel Hypertuned Prophet based power saving approach for IoT enabled smart homes. Trans. Emerg. Telecommun. Technol. 2023, 34, e4597. [Google Scholar] [CrossRef]
  60. Wang, Y.; Zhong, M.; Han, J.; Hu, H.; Yan, Q. Load forecasting method of integrated energy system based on CNN-BiLSTM with attention mechanism. In Proceedings of the 2021 3rd International Conference on Smart Power & Internet Energy Systems (SPIES), Shanghai, China, 25–28 September 2021; pp. 409–413. [Google Scholar]
  61. Arrubla Hoyos, W.d.J.; Severiche-Maury, Z.; Ramirez-Velarde, R. Home Energy Management System Dataset. Mendeley Data 2024, V1. [Google Scholar] [CrossRef]
  62. Chapman, P.; Clinton, J.; Kerber, R.; Khabaza, T.; Reinartz, T.; Shearer, C.; Wirth, R. CRISP-DM 1.0: Step-by-step Data Mining Guide. 2000. Available online: https://www.semanticscholar.org/paper/CRISP-DM-1.0%3A-Step-by-step-data-mining-guide-Chapman/54bad20bbc7938991bf34f86dde0babfbd2d5a72 (accessed on 15 February 2024).
  63. De la Barrera Castillo, J.C. Energy-Saving Methodologies Applied to HVAC Systems Using Artificial Intelligence: A State-of-the-Art Review. Master’s Thesis, Institución Universitaria, Medellín, Colombia, 2023. Available online: http://hdl.handle.net/20.500.12622/6023 (accessed on 12 April 2024).
  64. Guasp Alburquerque, L. Application of Machine Learning Techniques for Disaggregating Energy Consumption in Smart Homes. Master’s Thesis, Universitat Oberta de Catalunya, Barcelona, Spain, 31 May 2021. Available online: http://hdl.handle.net/10609/131927 (accessed on 12 April 2024).
  65. Mendoza Pittí, L.A. Development of Advanced Services for Intelligent Decision-Making in Key Dimensions of the Digital Society. Master’s Thesis, Universidad de Alcalá, Madrid, Spain, 2023. Available online: http://hdl.handle.net/10017/56892 (accessed on 12 April 2024).
  66. Rinchen, S.; Banihashemi, S.; Alkilani, S. Driving Digital Transformation in Construction: Strategic Insights into Building Information Modelling Adoption in Developing Countries. Proj. Leadersh. Soc. 2024, 5, 100138. [Google Scholar] [CrossRef]
  67. Zhou, D.; Pei, B.; Li, X.; Jiang, D.; Wen, L. Innovative BIM technology application in the construction management of highway. Sci. Rep. 2024, 14, 15298. [Google Scholar] [CrossRef] [PubMed]
  68. Piras, G.; Muzi, F.; Tiburcio, V.A. Digital Management Methodology for Building Production Optimization through Digital Twin and Artificial Intelligence Integration. Buildings 2024, 14, 2110. [Google Scholar] [CrossRef]
  69. Muzi, F.; Marzo, R.; Nardi, F. Digital information management in the built environment: Data-driven approaches for building process optimization. In International Conference on Technological Imagination in the Green and Digital Transition; Springer International Publishing: Cham, Switzerland, 2022. [Google Scholar]
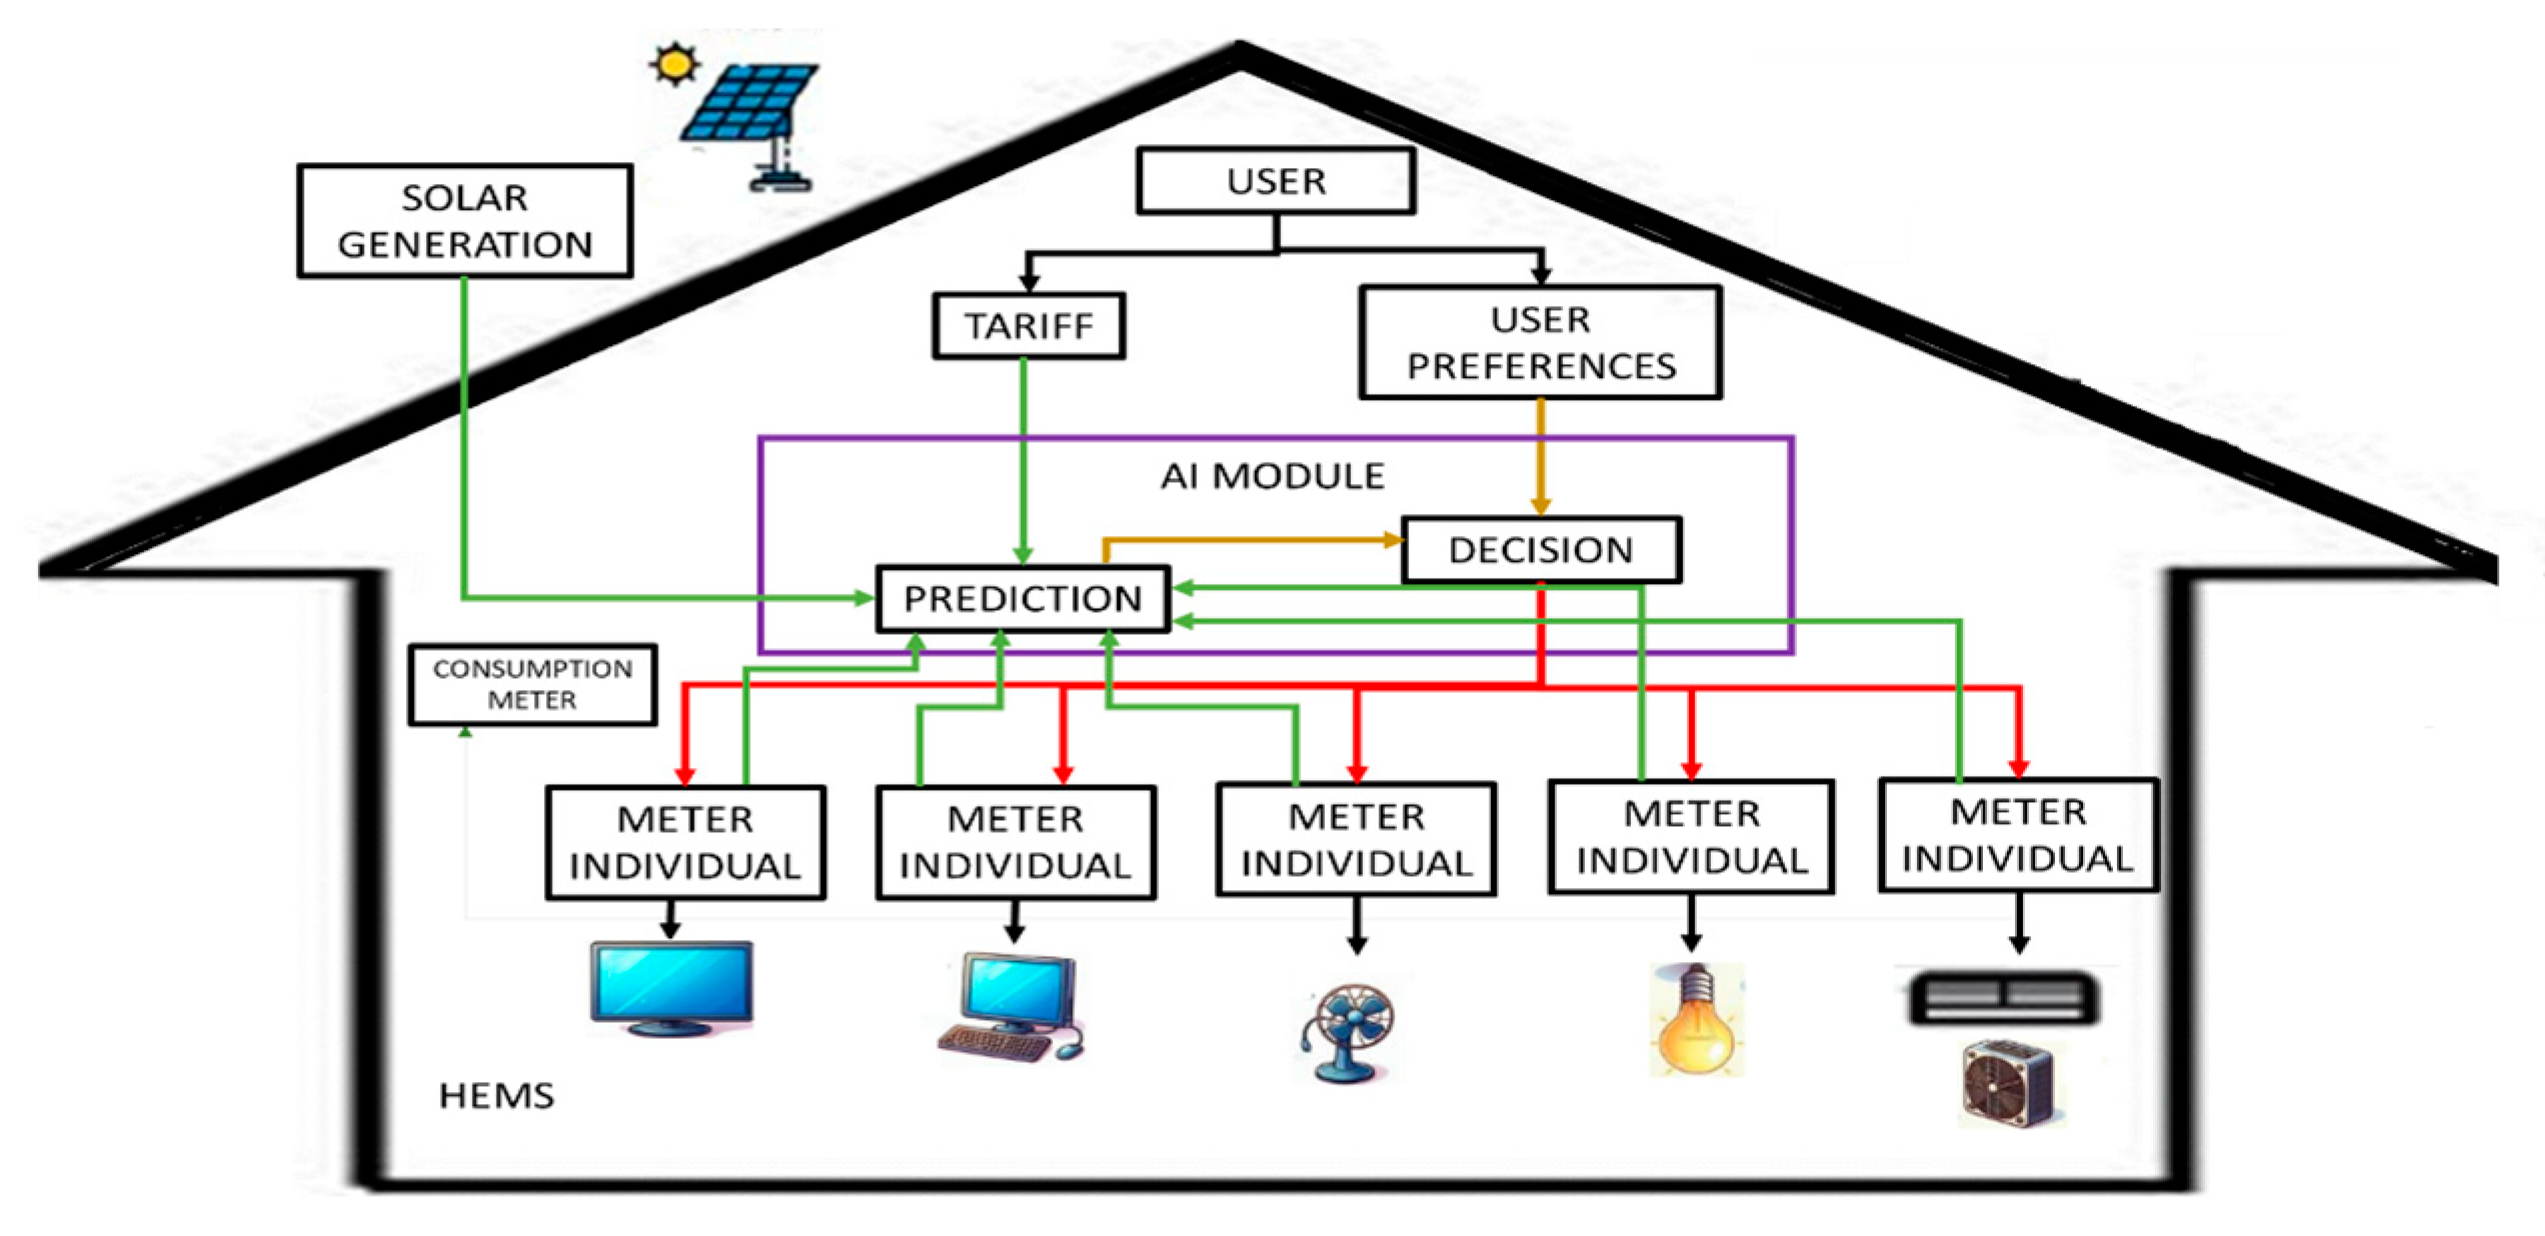
Figure 1. Functional Structure of HEMS System [23].
Designs 08 00078 g001
Figure 2. Location of selected dwellings for the energy consumption study.
Designs 08 00078 g002
Figure 3. Phases of experimental development.
Designs 08 00078 g003
Figure 4. Network meters. (a) Meter connected to the circuit to measure the total consumption of the five devices; (b) individual consumption meter connected to each of the five devices of the test bench.
Designs 08 00078 g004
Figure 5. Average power per day for each device.
Designs 08 00078 g005
Figure 6. Architecture of the LSTM Model.
Designs 08 00078 g006
Figure 7. Graph of Loss during Training.
Designs 08 00078 g007
Figure 8. Scatter plot.
Designs 08 00078 g008
Figure 9. Residue graph.
Designs 08 00078 g009
Figure 10. Energy Consumption Predictions vs. Future Data.
Designs 08 00078 g010
Table 1. Use of AI Algorithms in the Energy Sector.
AuthorJob DescriptionAnalyzed Algorithms
[33]Use of AI algorithms in the energy sector. Improvement of energy generation, distribution, and commercialization processes.Linear regression, K-nn, DT, extreme gradient rise, MLP, ENN, LSTM, PSO, GA, CNN, DNN, RNN, DBN, GAN, DRL, Q-learning, SOM
[34]Optimization techniques in microgrids. Importance of accurate algorithms.DE, CRO, TLBO, PSO, DE, CRO, TLBO, PSO
[35]Using AI to improve energy efficiency in South Africa. Highlights ANN and SVM. Suggests DRL for energy management in homes.ANN, SVM, DRL
[36]Energy consumption prediction models. Focus on deep and machine learning algorithms.RNN, ANN, DNN, DNN, SVM
[37]Application of AI in energy systems programming. It highlights the relevance of algorithms such as differential evolution and neural networks.Differential evolution, ANN, RBF, BP
Table 2. Contributions of AI Applications in HEMS.
AuthorsJob Description
[38]They analyze the applications of AI-based consumption optimization techniques for HEMS and their advantages over traditional techniques.
[39]They provide an overview of reinforcement learning (RL) and its application in HEMS, highlighting the use of deep neural network (DNN) models in RL.
[40]They present a smart home system that uses artificial intelligence and the Internet of Things to manage lighting loads and HVAC systems.
[41]They present a smart home system based on artificial intelligence with variable learning rates to manage energy consumption in homes.
[42]They propose a home energy management system based on a genetic algorithm for load scheduling, optimizing energy use in homes.
[43]It proposes a model for recognizing energy consumption patterns in household appliances using an IoT platform and machine learning techniques.
[44]It proposes a machine learning algorithm for activity-aware demand response in residential buildings, considering energy savings and comfort requirements.
[45]It proposes a lightweight optimization algorithm called FastInformer-HEMS for HEMS with a PV storage unit.
Table 3. Comparison LSTM versus other algorithms.
AuthorModelDescriptionAdvantagesDisadvantages
[50]LSTMRecurrent neural networks specialized in capturing long-term dependencies.Handles long sequences well, captures complex temporal dependencies.Handles long sequences well, captures complex temporal dependencies.
[51,52]Bi-LSTMLSTM variant that processes the sequence in both directions (forward and backward) to capture more complete dependencies.Capture future and past context dependencies, better accuracy in complex sequences.Increased training time and computational complexity.
[53]Stacked LSTMVariant of LSTM with multiple stacked layers, allowing the capture of more complex and abstract features of the data.Improved modeling capability for complex time series.Increased complexity and training time.
[54]GRUSimilar to LSTM but with a simpler architecture and fewer parameters.Faster to train than LSTM, similar ability to capture temporal dependencies.It may not be as accurate as LSTM in some cases.
[55]Bi-GRUGRU variant that processes the sequence in both directions.Captures future and past context dependencies, improves accuracy.Increased computational complexity and training time.
[56]Stacked GRUGRU variant with multiple stacked layers, enhancing the ability to capture complex data features.Improved modeling capabilities for complex time series.Increased complexity and training time.
[56,57]ARIMATime series model using autoregression and integration to handle non-stationarity.Good for stationary data and time series with clear patterns.It does not handle well time series with complex dependencies or abrupt changes.
[58]SARIMAARIMA extension that incorporates seasonality in the time series.Handles data with seasonality well, improves predictions in time series with clear seasonal patterns.Complexity in the identification and adjustment of seasonal parameters.
[59]ProphetModel developed by Facebook for time series forecasting that handles seasonality and vacations automatically.Easy to use, good results on data with multiple seasonalities and vacation effects.Less customizable for specific cases compared to ARIMA/SARIMA.
[52,60]XGBoostBoosting algorithm that combines several decision trees to improve accuracy.Very accurate, handles data with non-linear and complex characteristics well.Requires careful tuning of hyperparameters, can be computationally expensive.
Table 4. Average power per day per appliance.
ApplianceAverage Power (W)
Television0.63414
Air Conditioning8.433
Computer0.035638
Lamp0.1753
Fan1,073,838
Table 5. Sample of the original dataset.
TimeStampVentiladorPCACLamparaTVPotencia Total
12/29/2023 17:30:000.02150.00.00000.00480.00020.0265
12/29/2023 17:45:000.02760.00.00000.00940.00040.0374
12/29/2023 18:00:000.03280.00.00000.01440.00020.0474
12/29/2023 18:15:000.10050.00.50480.01260.00020.6181
12/29/2023 18:30:000.12150.00.78560.01280.00020.9201
Disclaimer/Publisher’s Note: The statements, opinions and data contained in all publications are solely those of the individual author(s) and contributor(s) and not of MDPI and/or the editor(s). MDPI and/or the editor(s) disclaim responsibility for any injury to people or property resulting from any ideas, methods, instructions or products referred to in the content.